Embed Size (px)
Citation preview
Medical System Network 4350 Tokyo Stock Exchange First Section
1We encourage readers to review our complete legal statements on “Disclaimer” page.
Important disclosuresand disclaimers appearat the back of thisdocument.
1-Jul-13
Company Research and Analysis Report FISCO Ltd. http://www.fisco.co.jp
FISCO Ltd. AnalystYuzuru Sato
■Aiming for record-high profits in FY3/14 by expanding the number of pharmacies supplied
Medical System Network has two main businesses. The one is dispensingpharmacy business and the other is “ pharmaceutical network business ”which provides an efficient pharmaceutical ordering system for small andmedium-sized pharmacies, both its own and independent pharmacies. Thissystem allows pharmacies to outsource operations with pharmaceuticalwholesalers such as ordering, price negotiation, and payment. Thepharmaceutical network business has been growing, and the company offersthis system to more than 1,000 pharmacies. At the same time, the pharmacybusiness is expanding, in part, through mergers and acquisitions. Thus, thecompany targets consolidated sales of \300bn in 10 years the fiscal year toMarch 2024, i.e., FY3/24.
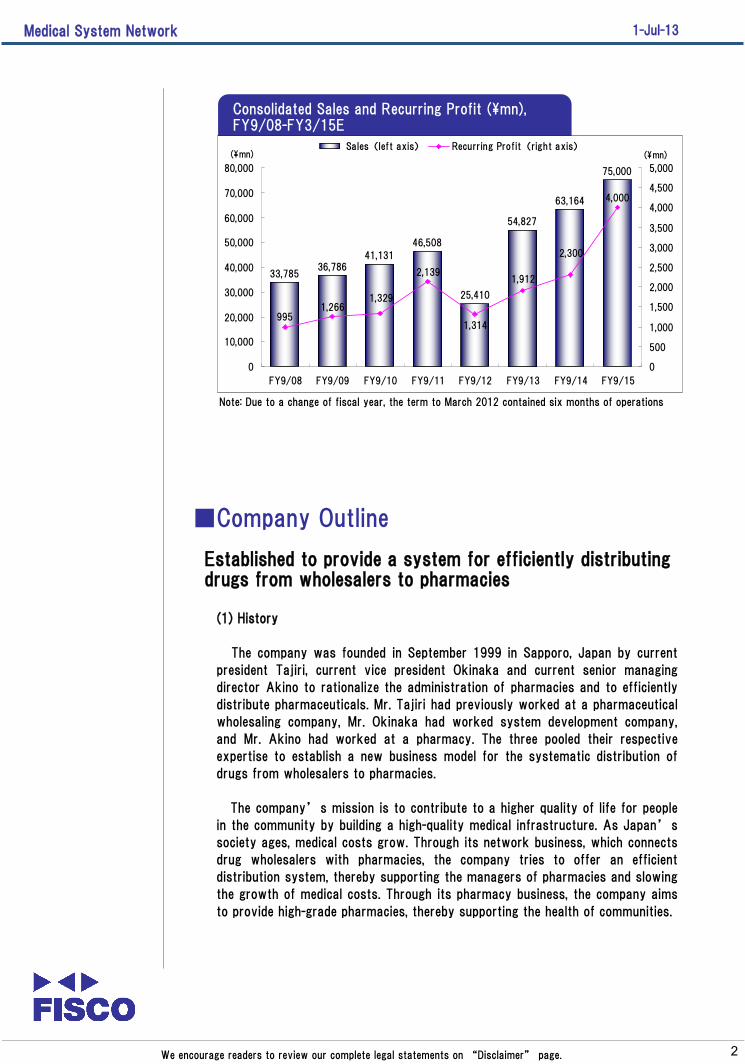
In FY3/13, the company’s consolidated sales grew by 11.9% year-on-year(y-o-y) to \54,827mn, due to an increase in the number of member pharmaciesin the network business and to greater sales by the company’s pharmacies,reflecting the opening of new pharmacies and mergers and acquisitions.However, consolidated operating profit dropped by 16.2% y-o-y to \2,046mn,because sales and profits generated by the company ’ s pharmacies inoperation for more than a year declined and the company incurred costs tointegrate acquired pharmacies. FY3/12 included only six months because thecompany changed its fiscal year to end in March that term, having previouslyended in September. However, the rates of change in FY3/13 results citedabove and hereafter are relative to results in the year through March 2012.
For FY3/14, the company forecasts a 15.2% y-o-y rise in consolidated salesto \63,164mn and an 18.8% upturn in consolidated operating profit to\2,432mn. It plans to expand the number of member pharmacies by 217,making the total 1,250, and it foresees a sales recovery by its pharmacies inoperation for more than a year and contributions by acquired pharmacies. Italso plans to reduce indirect costs by consolidating its pharmacy subsidiaries.
There are about 54,000 pharmacy companies in Japan, of which, about40,000 are small or medium-sized. Small and medium-sized pharmacies canimprove their profitability by procuring their supplies through the networksystem of Medical System Network, and no other company in Japan offers asimilar service. Thus, the company ’ s network business has substantialgrowth potential. In the pharmacy business, the company plans to continue itsstrategy of dominating the Greater Tokyo, Aichi Prefecture, and Kyoto-Osaka-Kobe areas, partly through M&A. Through this strategy, it intends to increaseits sales and profits steadily over the medium-to-long term.
■Check Points
・Company’s business model is a system for distributing drugs from
wholesalers to pharmacies efficiently
・Sales grew by double digits y-o-y in FY3/13 because the company
opened and acquired new pharmacies
・Through aggressive M&A, the company plans to generate sales of
\300bn in 10 years
Medical System Network
2
1-Jul-13
We encourage readers to review our complete legal statements on “Disclaimer” page.
Consolidated Sales and Recurring Profit (\mn),FY9/08-FY3/15E
Note: Due to a change of fiscal year, the term to March 2012 contained six months of operations
33,78536,786
41,131
46,508
25,410
54,827
63,164
75,000
4,000
2,300
1,912
1,314
2,139
1,3291,266
995
0
10,000
20,000
30,000
40,000
50,000
60,000
70,000
80,000
FY9/08 FY9/09 FY9/10 FY9/11 FY9/12 FY9/13 FY9/14 FY9/15
(\mn)
0
500
1,000
1,500
2,000
2,500
3,000
3,500
4,000
4,500
5,000
(\mn) Sales(left axis) Recurring Profit(right axis)
■Company Outline
(1) History
The company was founded in September 1999 in Sapporo, Japan by current
president Tajiri, current vice president Okinaka and current senior managing
director Akino to rationalize the administration of pharmacies and to efficiently
distribute pharmaceuticals. Mr. Tajiri had previously worked at a pharmaceutical
wholesaling company, Mr. Okinaka had worked system development company,
and Mr. Akino had worked at a pharmacy. The three pooled their respective
expertise to establish a new business model for the systematic distribution of
drugs from wholesalers to pharmacies.
The company’s mission is to contribute to a higher quality of life for people
in the community by building a high-quality medical infrastructure. As Japan’s
society ages, medical costs grow. Through its network business, which connects
drug wholesalers with pharmacies, the company tries to offer an efficient
distribution system, thereby supporting the managers of pharmacies and slowing
the growth of medical costs. Through its pharmacy business, the company aims
to provide high-grade pharmacies, thereby supporting the health of communities.
Established to provide a system for efficiently distributingdrugs from wholesalers to pharmacies
Medical System Network
3
1-Jul-13
We encourage readers to review our complete legal statements on “Disclaimer” page.
■Company OutlineBefore the diffusion of the Internet, Japanese pharmacies placed orders for
drugs and medical supplies with wholesalers and paid for them by telephone orfacsimile machine. This was a cumbersome and costly process. Medical SystemNetwork developed a system enabling it to act as an agent for all steps ofordering and paying for these supplies, including inventory control and pricenegotiation, for a network of pharmacies. In its first year, the company handledonly about \3bn of orders, but by March 2002, the company was large enoughto register its shares on the JASDAQ Japan market (today the shares are listedon the First Section of the Tokyo Stock Exchange). In December 2002, thecompany bought Pharmaholdings, which runs the pharmacy business, and NihonLeben, which leases property and operates medical facilities, and made bothwholly owned subsidiaries. As the company gained public recognition, itsbusiness growth accelerated, and by FY3/13, it handled about \94.8bn of ordersfor pharmaceuticals and other medical supplies.
In 2003, Medical System Network entered a strategic business agreement withMitsui & Co. (8031) in the field of pharmaceuticals. In February 2005, itestablished subsidiary MM Net to develop the network business on Japan ’ smain island of Honshu, and in October 2005, the company embarked on mergersand acquisitions on a significant scale, boosting its consolidated sales to \30bnannually. In 2007, Medical System Network bought Hokkaido Hiclips (now calledSMO Medisys) and embarked on the business of supporting clinical trials atmedical institutions. In following years, the company expanded its pharmacybusiness through aggressive M&A, and by the end of FY3/13, this businessoperated 269 pharmacies.
In May 2013, Medical System Network dissolved its equity and businessalliance with Mitsui & Co., took full ownership of subsidiary MM Net Corp., andconcluded a business agreement with FamilyMart (8028), a leading Japaneseoperator of convenience stores. The company is now considering the addition ofconvenience stores to its pharmacies. In July 2013, the company took a 51%stake in H&M Co., a joint venture established with Hanshin Pharmacy Co. for thecooperative purchase and distribution of pharmaceuticals.
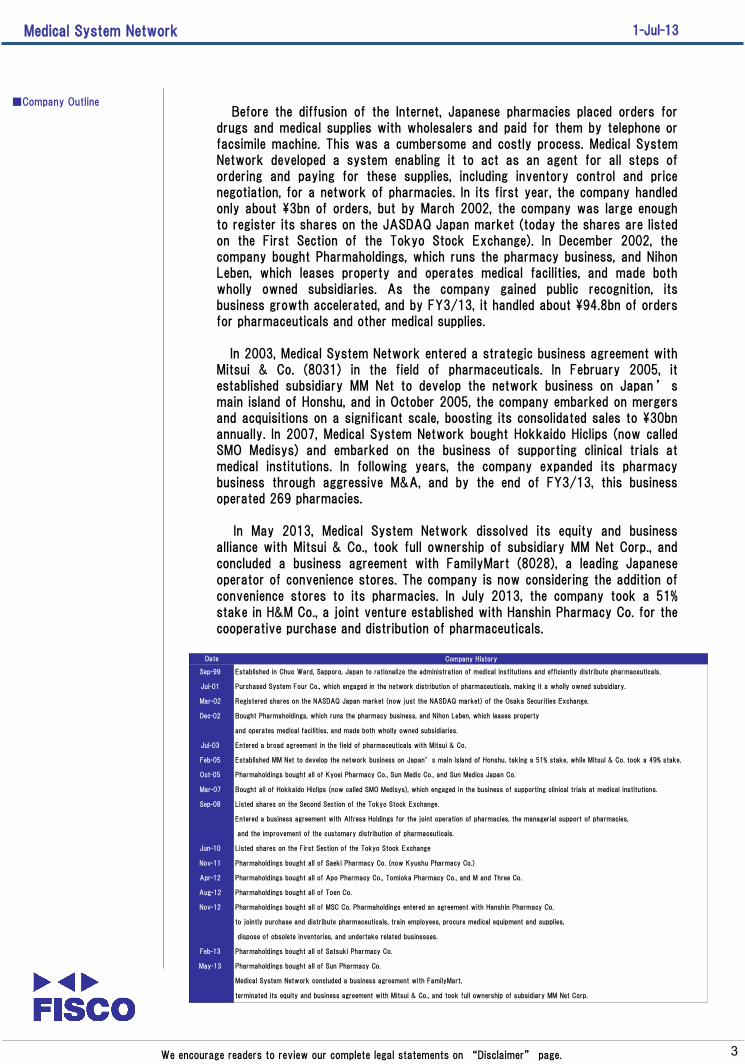
Company History
Sep-99 Established in Chuo Ward, Sapporo, Japan to rationalize the administration of medical institutions and efficiently distribute pharmaceuticals.
Jul-01 Purchased System Four Co., which engaged in the network distribution of pharmaceuticals, making it a wholly owned subsidiary.
Mar-02 Registered shares on the NASDAQ Japan market (now just the NASDAQ market) of the Osaka Securities Exchange.
Dec-02 Bought Pharmaholdings, which runs the pharmacy business, and Nihon Leben, which leases property
and operates medical facilities, and made both wholly owned subsidiaries.
Jul-03 Entered a broad agreement in the field of pharmaceuticals with Mitsui & Co.
Feb-05 Established MM Net to develop the network business on Japan’s main island of Honshu, taking a 51% stake, while Mitsui & Co. took a 49% stake.
Oct-05 Pharmaholdings bought all of Kyoei Pharmacy Co., Sun Medic Co., and Sun Medics Japan Co.
Mar-07 Bought all of Hokkaido Hiclips (now called SMO Medisys), which engaged in the business of supporting clinical trials at medical institutions.
Sep-08 Listed shares on the Second Section of the Tokyo Stock Exchange.
Entered a business agreement with Alfresa Holdings for the joint operation of pharmacies, the managerial support of pharmacies,
and the improvement of the customary distribution of pharmaceuticals.
Jun-10 Listed shares on the First Section of the Tokyo Stock Exchange
Nov-11 Pharmaholdings bought all of Saeki Pharmacy Co. (now Kyushu Pharmacy Co.)
Apr-12 Pharmaholdings bought all of Apo Pharmacy Co., Tomioka Pharmacy Co., and M and Three Co.
Aug-12 Pharmaholdings bought all of Toen Co.
Nov-12 Pharmaholdings bought all of MSC Co. Pharmaholdings entered an agreement with Hanshin Pharmacy Co.
to jointly purchase and distribute pharmaceuticals, train employees, procure medical equipment and supplies,
dispose of obsolete inventories, and undertake related businesses.
Feb-13 Pharmaholdings bought all of Satsuki Pharmacy Co.
May-13 Pharmaholdings bought all of Sun Pharmacy Co.
Medical System Network concluded a business agreement with FamilyMart,
terminated its equity and business agreement with Mitsui & Co., and took full ownership of subsidiary MM Net Corp.
Date
Medical System Network
4
1-Jul-13
We encourage readers to review our complete legal statements on “Disclaimer” page.
■Company Outline
(2) Businesses
Medical System Network has two main businesses, dispensing pharmacy
business and pharmaceutical network business. It also leases property and
operates medical facilities related to its two main businesses, and in its other
business segments, it supports clinical trials at medical institutions. The network
business is conducted by Medical System Network and subsidiaries System Four
and MM Net, while the other businesses are conducted by subsidiaries (see table
below).
Main businesses are dispensing pharmacy business andpharmaceutical network business
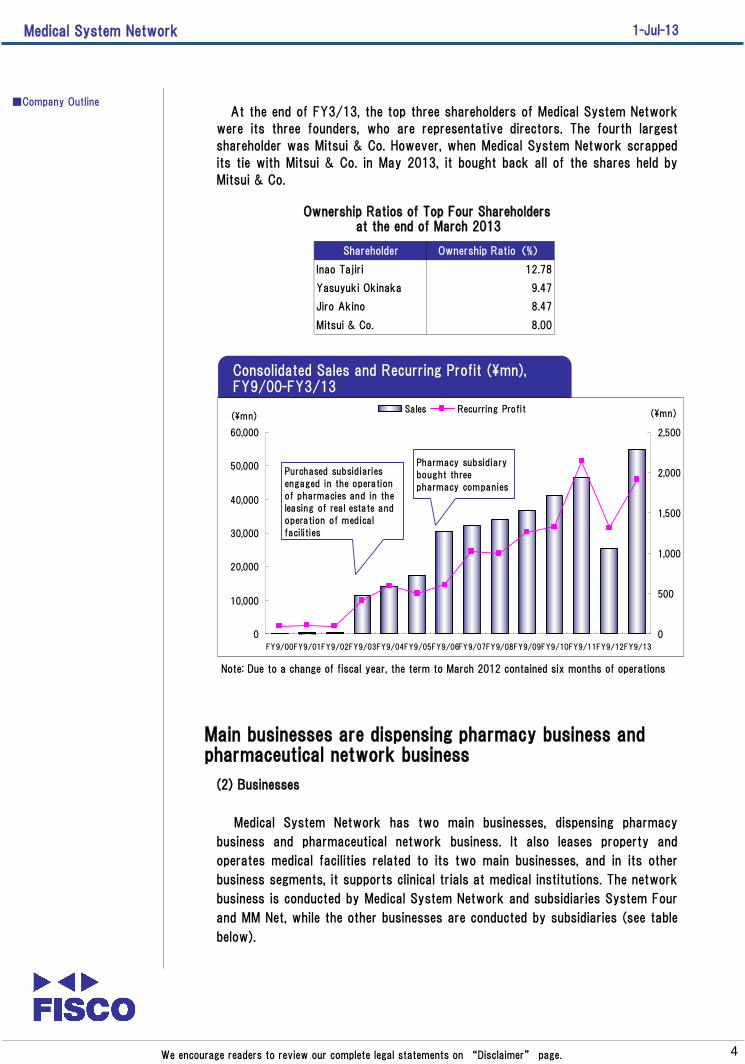
Shareholder Ownership Ratio(%)
Inao Tajiri 12.78
Yasuyuki Okinaka 9.47
Jiro Akino 8.47
Mitsui & Co. 8.00
Ownership Ratios of Top Four Shareholdersat the end of March 2013
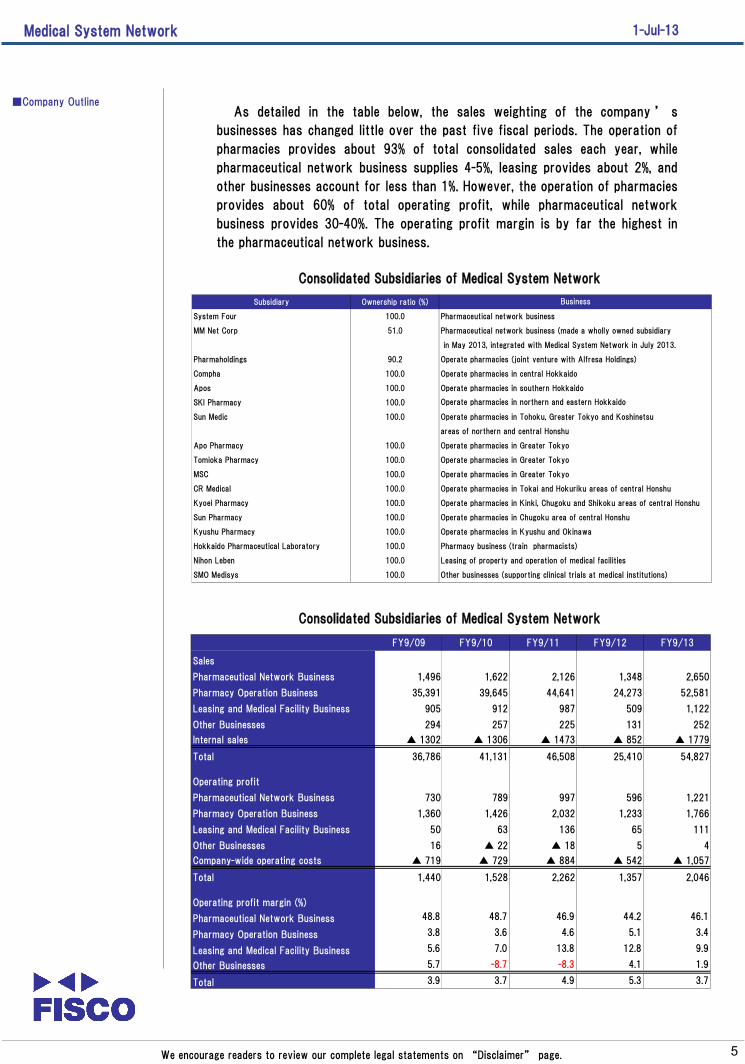
Consolidated Sales and Recurring Profit (\mn),FY9/00-FY3/13
Note: Due to a change of fiscal year, the term to March 2012 contained six months of operations
0
10,000
20,000
30,000
40,000
50,000
60,000
FY9/00FY9/01FY9/02FY9/03FY9/04FY9/05FY9/06FY9/07FY9/08FY9/09FY9/10FY9/11FY9/12FY9/13
(\mn)
0
500
1,000
1,500
2,000
2,500
(\mn)Sales Recurring Profit
Pharmacy subsidiary
bought three
pharmacy companies
Purchased subsidiaries
engaged in the operation
of pharmacies and in the
leasing of real estate and
operation of medical
facilities
At the end of FY3/13, the top three shareholders of Medical System Network
were its three founders, who are representative directors. The fourth largest
shareholder was Mitsui & Co. However, when Medical System Network scrapped
its tie with Mitsui & Co. in May 2013, it bought back all of the shares held by
Mitsui & Co.
Medical System Network
5
1-Jul-13
We encourage readers to review our complete legal statements on “Disclaimer” page.
■Company Outline
Consolidated Subsidiaries of Medical System Network
Consolidated Subsidiaries of Medical System Network
As detailed in the table below, the sales weighting of the company ’ s
businesses has changed little over the past five fiscal periods. The operation of
pharmacies provides about 93% of total consolidated sales each year, while
pharmaceutical network business supplies 4-5%, leasing provides about 2%, and
other businesses account for less than 1%. However, the operation of pharmacies
provides about 60% of total operating profit, while pharmaceutical network
business provides 30-40%. The operating profit margin is by far the highest in
the pharmaceutical network business.
Subsidiary Ownership ratio (%)
System Four 100.0 Pharmaceutical network business
MM Net Corp 51.0 Pharmaceutical network business (made a wholly owned subsidiary
in May 2013, integrated with Medical System Network in July 2013.
Pharmaholdings 90.2 Operate pharmacies (joint venture with Alfresa Holdings)
Compha 100.0 Operate pharmacies in central Hokkaido
Apos 100.0 Operate pharmacies in southern Hokkaido
SKI Pharmacy 100.0
Sun Medic 100.0 Operate pharmacies in Tohoku, Greater Tokyo and Koshinetsu
areas of northern and central Honshu
Apo Pharmacy 100.0 Operate pharmacies in Greater Tokyo
Tomioka Pharmacy 100.0 Operate pharmacies in Greater Tokyo
MSC 100.0 Operate pharmacies in Greater Tokyo
CR Medical 100.0 Operate pharmacies in Tokai and Hokuriku areas of central Honshu
Kyoei Pharmacy 100.0 Operate pharmacies in Kinki, Chugoku and Shikoku areas of central Honshu
Sun Pharmacy 100.0 Operate pharmacies in Chugoku area of central Honshu
Kyushu Pharmacy 100.0 Operate pharmacies in Kyushu and Okinawa
Hokkaido Pharmaceutical Laboratory 100.0 Pharmacy business (train pharmacists)
Nihon Leben 100.0 Leasing of property and operation of medical facilities
SMO Medisys 100.0 Other businesses (supporting clinical trials at medical institutions)
Business
Operate pharmacies in northern and eastern Hokkaido
FY9/09 FY9/10 FY9/11 FY9/12 FY9/13
Sales
Pharmaceutical Network Business 1,496 1,622 2,126 1,348 2,650
Pharmacy Operation Business 35,391 39,645 44,641 24,273 52,581
Leasing and Medical Facility Business 905 912 987 509 1,122
Other Businesses 294 257 225 131 252
Internal sales ▲ 1302 ▲ 1306 ▲ 1473 ▲ 852 ▲ 1779
Total 36,786 41,131 46,508 25,410 54,827
Operating profit
Pharmaceutical Network Business 730 789 997 596 1,221
Pharmacy Operation Business 1,360 1,426 2,032 1,233 1,766
Leasing and Medical Facility Business 50 63 136 65 111
Other Businesses 16 ▲ 22 ▲ 18 5 4
Company-wide operating costs ▲ 719 ▲ 729 ▲ 884 ▲ 542 ▲ 1,057
Total 1,440 1,528 2,262 1,357 2,046
Operating profit margin (%)
Pharmaceutical Network Business 48.8 48.7 46.9 44.2 46.1
Pharmacy Operation Business 3.8 3.6 4.6 5.1 3.4
Leasing and Medical Facility Business 5.6 7.0 13.8 12.8 9.9
Other Businesses 5.7 -8.7 -8.3 4.1 1.9
Total 3.9 3.7 4.9 5.3 3.7
Medical System Network
6
1-Jul-13
We encourage readers to review our complete legal statements on “Disclaimer” page.
■Company Outline
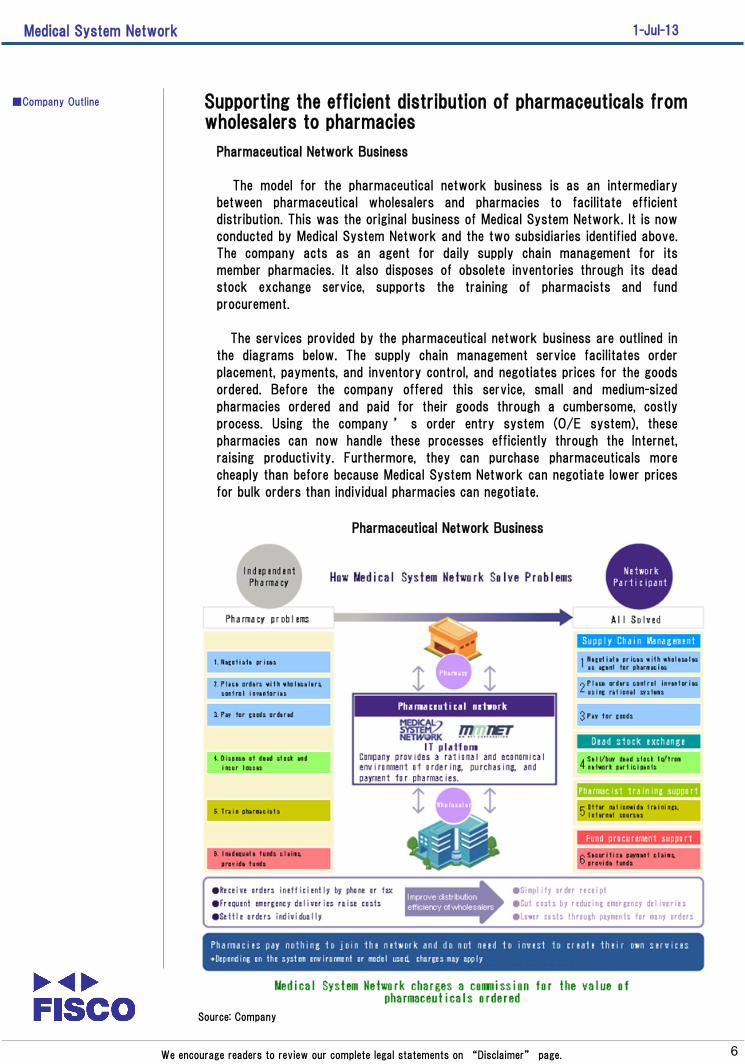
Pharmaceutical Network Business
The model for the pharmaceutical network business is as an intermediary
between pharmaceutical wholesalers and pharmacies to facilitate efficient
distribution. This was the original business of Medical System Network. It is now
conducted by Medical System Network and the two subsidiaries identified above.
The company acts as an agent for daily supply chain management for its
member pharmacies. It also disposes of obsolete inventories through its dead
stock exchange service, supports the training of pharmacists and fund
procurement.
The services provided by the pharmaceutical network business are outlined in
the diagrams below. The supply chain management service facilitates order
placement, payments, and inventory control, and negotiates prices for the goods
ordered. Before the company offered this service, small and medium-sized
pharmacies ordered and paid for their goods through a cumbersome, costly
process. Using the company ’ s order entry system (O/E system), these
pharmacies can now handle these processes efficiently through the Internet,
raising productivity. Furthermore, they can purchase pharmaceuticals more
cheaply than before because Medical System Network can negotiate lower prices
for bulk orders than individual pharmacies can negotiate.
Supporting the efficient distribution of pharmaceuticals fromwholesalers to pharmacies
Pharmaceutical Network Business
Source: Company

Medical System Network
7
1-Jul-13
We encourage readers to review our complete legal statements on “Disclaimer” page.
■Company OutlineThe dead stock exchange service allows customer pharmacies to both rid
themselves of unsold goods and acquire some needed goods cheaply by buyingand selling from each other. Using this service, the pharmacies can lower theirlosses from disposing of unsold inventories.
The pharmacist training support service provides nationwide concentratedtraining sessions 30-40 times per month to raise the skills of pharmacists. Italso provides e-learning lessons. The fund procurement support servicesecuritizes the payment claims of pharmacies and provides funds to thepharmacies a month or more faster than the usual payment process does.Normally, this process takes about two months, but the fund procurementsupport service pays pharmacies in a month or less from the date of dispensingpharmaceuticals.
The pharmaceutical network business also develops, sells and maintains thePharmacy Ace pharmaceutical order receipt computer system, the company’spharmaceutical order entry system, and peripheral equipment for both systems.It also sells equipment, fixtures and fittings used to prepare and dispensepharmaceuticals.
Most of the customers for the pharmaceutical network business of MedicalSystem Network are pharmacy companies with 20 or fewer pharmacies orproprietor pharmacies.
At the end of FY3/13, the pharmaceutical network business had 1,033companies, institutions or pharmacies in its customer network, including 24hospitals or medical institutions, as detailed in the table below. Thus, thecompany has achieved its goal since founding of offering this business to 1,000customers. The company had customers in 43 prefectures and administrativeareas of Japan, with almost half in Hokkaido and the Greater Tokyo (Kanto) and
Koshinetsu areas of Honshu. The Kinki area (Greater Osaka) had the next
largest number of customers, followed by the Tokai and Hokuriku areas.
Most of the sales generated by the pharmaceutical network business come
from the sale of systems to network customers and from commissions on
orders placed through the company’s order entry system.
FY9/10 FY9/11 FY9/12 FY9/13
External customers 393 526 631 764
Group pharmacies 204 214 223 269
Total 597 740 854 1,033
Geographical breakdown
Hokkaido 188 180 197 212
Tohoku 28 31 63 80
Kanto – Koshinetsu 194 202 214 270
Tokai – Hokuriku 28 79 96 138
Kinki 85 150 150 178
Chugoku – Shikoku 48 55 70 77
Kyushu – Okinawa 26 43 64 78
Total 597 740 854 1,033
Number of Customers in the Network for the Pharmaceutical NetworkBusiness at the end of FY9/10-FY3/13

Medical System Network
8
1-Jul-13
We encourage readers to review our complete legal statements on “Disclaimer” page.
Pharmacy Operation Business
The company’s Nanohana pharmacies were operated by 12 subsidiaries of
subsidiary Pharmaholdings as of the end of FY3/13. These pharmacies are
trying to change from a simple chain of pharmaceutical dispensaries into
pharmacies that offer a range of services to improve the health of local
inhabitants. Hokkaido Pharmaceutical Laboratory, another subsidiary of Medical
System Network, educates and trains pharmacists and other pharmacy workers,
both for group pharmacies and for independent pharmacies. The pharmacy
operation business has been increasing the number of pharmacies it operates,
partly through M&A. At the end of 3/13, this business operated 269 pharmacies.
Increasing the number of pharmacies in operation, in part,through M&A
■Company Outline
Number of Pharmacies Operated by the PharmacyOperation Business at the end of FY9/04-FY3/13
78
99
153161 164
172
204214
223
269
0
50
100
150
200
250
300
FY9/04 FY9/05 FY9/06 FY9/07 FY9/08 FY9/09 FY9/10 FY9/11 FY9/12 FY9/13
(stores)
Leasing and Medical Facility
Medical System Network subsidiary Nihon Leben primarily develops land sites
on which to build group pharmacies and leases and insures buildings for medical
services. It also offers consulting service about medical practice and operates
medical malls where many medical specialties are offered on a single floor of a
building, medical buildings where many clinics gathers in one building, and homes
for the elderly which offer various health services.
Other Businesses
Medical System Network subsidiary SMO Medisys signs contracts with medical
institutions conducting clinical trials to support these trials.
Providing leasing and medical facility business in itssubsidiary
Medical System Network
9
1-Jul-13
We encourage readers to review our complete legal statements on “Disclaimer” page.
■Business Trends
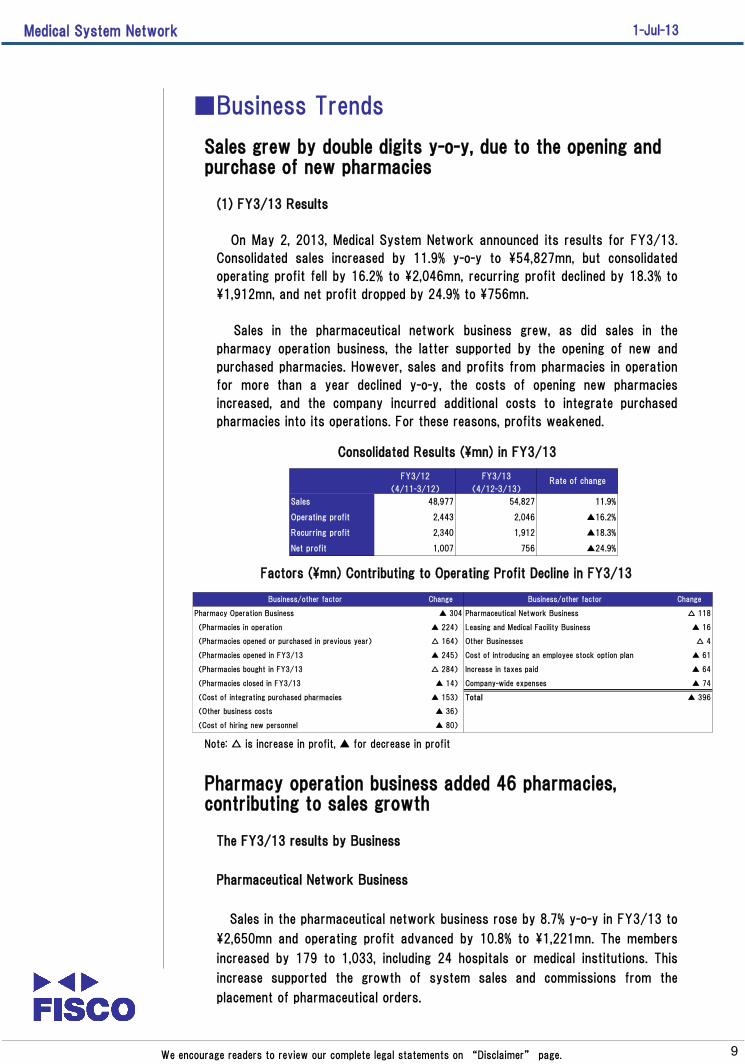
(1) FY3/13 Results
On May 2, 2013, Medical System Network announced its results for FY3/13.
Consolidated sales increased by 11.9% y-o-y to \54,827mn, but consolidated
operating profit fell by 16.2% to \2,046mn, recurring profit declined by 18.3% to
\1,912mn, and net profit dropped by 24.9% to \756mn.
Sales in the pharmaceutical network business grew, as did sales in the
pharmacy operation business, the latter supported by the opening of new and
purchased pharmacies. However, sales and profits from pharmacies in operation
for more than a year declined y-o-y, the costs of opening new pharmacies
increased, and the company incurred additional costs to integrate purchased
pharmacies into its operations. For these reasons, profits weakened.
Sales grew by double digits y-o-y, due to the opening andpurchase of new pharmacies
FY3/12 FY3/13
(4/11-3/12) (4/12-3/13)
Sales 48,977 54,827 11.9%
Operating profit 2,443 2,046 ▲16.2%
Recurring profit 2,340 1,912 ▲18.3%
Net profit 1,007 756 ▲24.9%
Rate of change
Consolidated Results (\mn) in FY3/13
Factors (\mn) Contributing to Operating Profit Decline in FY3/13
Note: △ is increase in profit, ▲ for decrease in profit
The FY3/13 results by Business
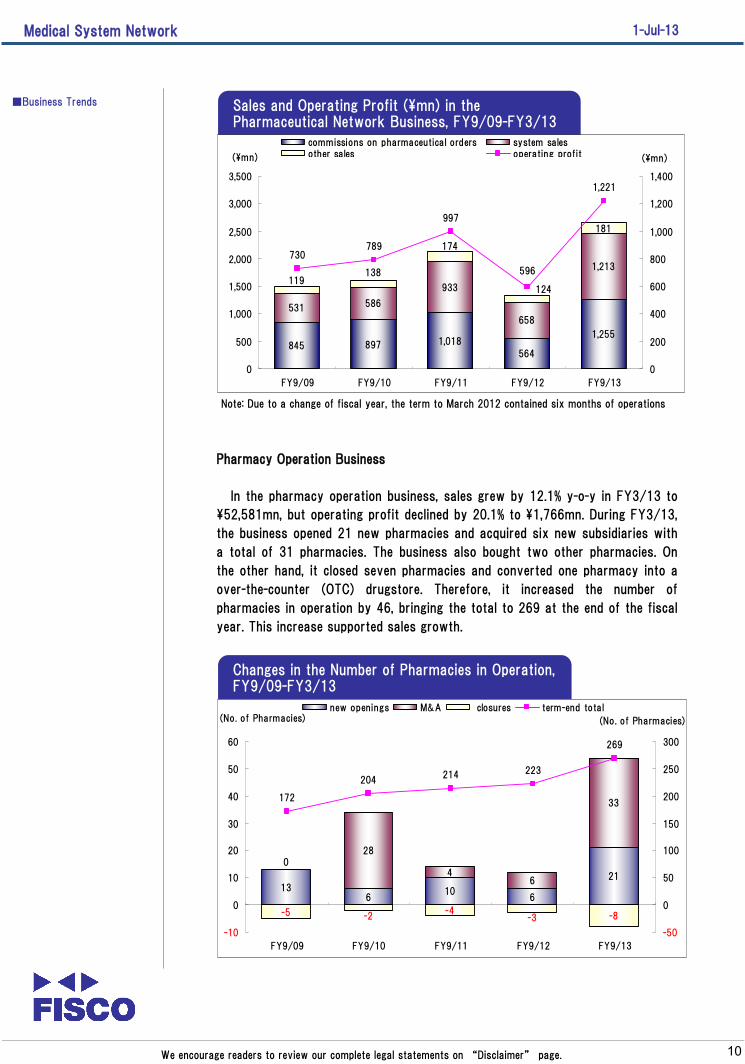
Pharmaceutical Network Business
Sales in the pharmaceutical network business rose by 8.7% y-o-y in FY3/13 to
\2,650mn and operating profit advanced by 10.8% to \1,221mn. The members
increased by 179 to 1,033, including 24 hospitals or medical institutions. This
increase supported the growth of system sales and commissions from the
placement of pharmaceutical orders.
Pharmacy operation business added 46 pharmacies,contributing to sales growth
Business/other factor Change Business/other factor Change
Pharmacy Operation Business ▲ 304 Pharmaceutical Network Business △ 118
(Pharmacies in operation ▲ 224) Leasing and Medical Facility Business ▲ 16
(Pharmacies opened or purchased in previous year) △ 164) Other Businesses △ 4
(Pharmacies opened in FY3/13 ▲ 245) Cost of introducing an employee stock option plan ▲ 61
(Pharmacies bought in FY3/13 △ 284) Increase in taxes paid ▲ 64
(Pharmacies closed in FY3/13 ▲ 14) Company-wide expenses ▲ 74
(Cost of integrating purchased pharmacies ▲ 153) Total ▲ 396
(Other business costs ▲ 36)
(Cost of hiring new personnel ▲ 80)
Medical System Network
10
1-Jul-13
We encourage readers to review our complete legal statements on “Disclaimer” page.
■Business Trends Sales and Operating Profit (\mn) in thePharmaceutical Network Business, FY9/09-FY3/13
845 897 1,018
564
1,255
531 586
933
658
1,213
119138
174
124
181
730
1,221
997
789
596
0
500
1,000
1,500
2,000
2,500
3,000
3,500
FY9/09 FY9/10 FY9/11 FY9/12 FY9/13
(\mn)
0
200
400
600
800
1,000
1,200
1,400
(\mn)
commissions on pharmaceutical orders system salesother sales operating profit
Note: Due to a change of fiscal year, the term to March 2012 contained six months of operations
Pharmacy Operation Business
In the pharmacy operation business, sales grew by 12.1% y-o-y in FY3/13 to
\52,581mn, but operating profit declined by 20.1% to \1,766mn. During FY3/13,
the business opened 21 new pharmacies and acquired six new subsidiaries with
a total of 31 pharmacies. The business also bought two other pharmacies. On
the other hand, it closed seven pharmacies and converted one pharmacy into a
over-the-counter (OTC) drugstore. Therefore, it increased the number of
pharmacies in operation by 46, bringing the total to 269 at the end of the fiscal
year. This increase supported sales growth.
Changes in the Number of Pharmacies in Operation,FY9/09-FY3/13
136
106
21
28
46
33
-8
0
-2-5 -4-3
172
204214 223
269
-10
0
10
20
30
40
50
60
FY9/09 FY9/10 FY9/11 FY9/12 FY9/13
(No. of Pharmacies)
-50
0
50
100
150
200
250
300
(No. of Pharmacies)
new openings M&A closures term-end total

Medical System Network
11
1-Jul-13
We encourage readers to review our complete legal statements on “Disclaimer” page.
As noted previously, profits in the pharmacy operation business fell for
several reasons. Sales and profits from pharmacies in operation for more than a
year decreased because official drug prices, i.e., prices paid by health insurance
companies, were lowered in April 2012 and because the number of prescriptions
filled declined, reducing sales per pharmacy. Furthermore, the cost of opening
new pharmacies increased, as did the cost of integrating acquired pharmacies
and personnel costs.
The table below shows a breakdown of the sales generated in 4/11-3/12 and
in FY3/13 by pharmacies in operation for more than a year. The number of
prescriptions filled by these pharmacies declined by 1.7% y-o-y in FY3/13,
probably because the hospital doctors staffing changed and the number of
patients making bulk purchases of inexpensive generic drugs increased.
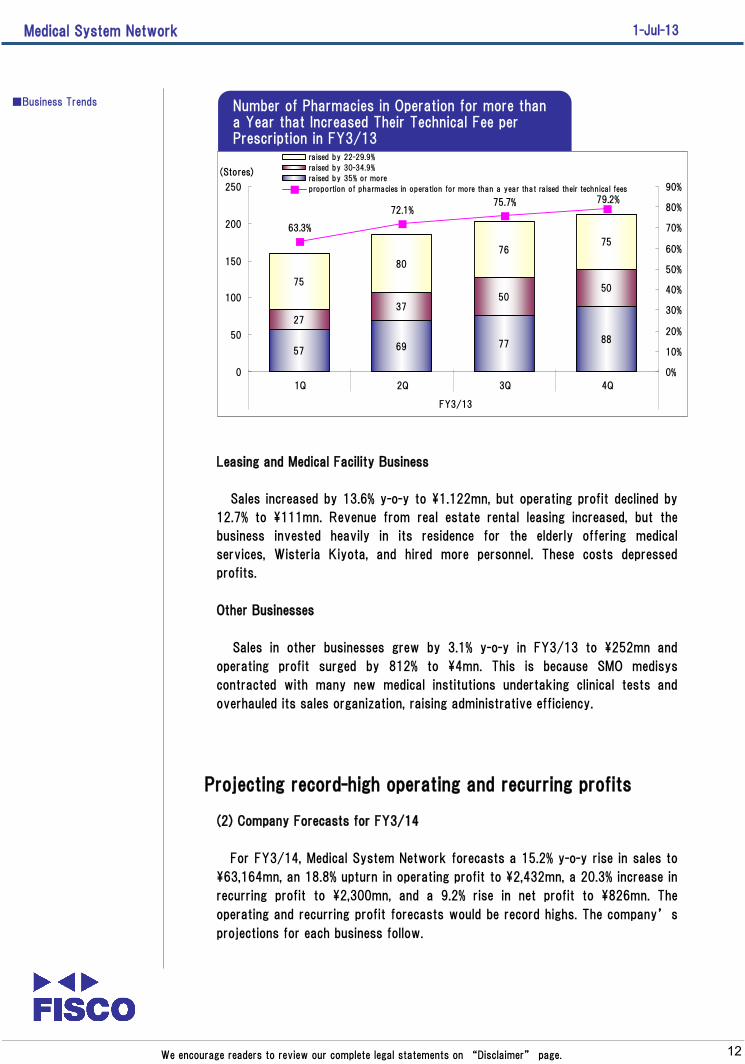
The technical fee (pharmacist fee) per prescription paid by pharmacies in
operation for more than a year rose by 1.6% y-o-y in FY3/13, reflecting an
increase in the weighting of generic drugs in the number of prescriptions filled to
27.7%. To control the increase in medical costs in Japan, the Ministry of Health,
Labor and Welfare is promoting the greater use of generic drugs. To encourage
pharmacists to dispense more generic drugs, the ministry allows an increase in
the technical fee per prescription when the weighting of generic drug
prescriptions exceeds a certain level. As the weighting of generic drug
prescriptions rose, an increasing number and proportion of pharmacies raised
their technical fees. Although this weighing rose at Medical System Network’s
pharmacies in operation for more than a year in FY3/13, it was slightly lower
than the 28% average weighting for pharmacies in Japan. The average price of
pharmaceuticals declined by several percentage points in FY3/13 due to the cuts
in official prices, but because patients bought larger quantities of
pharmaceuticals per prescription in FY3/13, the average prescription price at
Medical System Network ’ s pharmacies in operation for more than a year
decreased by few points y-o-y.
■Business Trends
Pharmacies in Operation FY3/12 FY3/13 Change
No. of prescriptions filled (thousand) 4,580,450 4,503,702 ▲ 1.7
Average prescription price (\) 9,421 9,453 0.3
Technical fee per prescription (\) 2,177 2,212 1.6
Pharmaceutical revenue per prescription (\) 7,244 7,240 ▲ 0.0
Pharmaceutical sales (\mn) 43,153 42,572 ▲ 1.3
Breakdown of Sales Generated in 4/11-3/12 and in FY3/13 byPharmacies in Operation for More than a Year
Medical System Network
12
1-Jul-13
We encourage readers to review our complete legal statements on “Disclaimer” page.
■Business Trends Number of Pharmacies in Operation for more thana Year that Increased Their Technical Fee perPrescription in FY3/13
57 69 77 88
27
3750
5075
80
7675
63.3%
72.1%75.7% 79.2%
0
50
100
150
200
250
1Q 2Q 3Q 4Q
FY3/13
(Stores)
0%
10%
20%
30%
40%
50%
60%
70%
80%
90%
raised by 22-29.9%
raised by 30-34.9%
raised by 35% or more
proportion of pharmacies in operation for more than a year that raised their technical fees
Leasing and Medical Facility Business
Sales increased by 13.6% y-o-y to \1.122mn, but operating profit declined by
12.7% to \111mn. Revenue from real estate rental leasing increased, but the
business invested heavily in its residence for the elderly offering medical
services, Wisteria Kiyota, and hired more personnel. These costs depressed
profits.
Other Businesses
Sales in other businesses grew by 3.1% y-o-y in FY3/13 to \252mn and
operating profit surged by 812% to \4mn. This is because SMO medisys
contracted with many new medical institutions undertaking clinical tests and
overhauled its sales organization, raising administrative efficiency.
(2) Company Forecasts for FY3/14
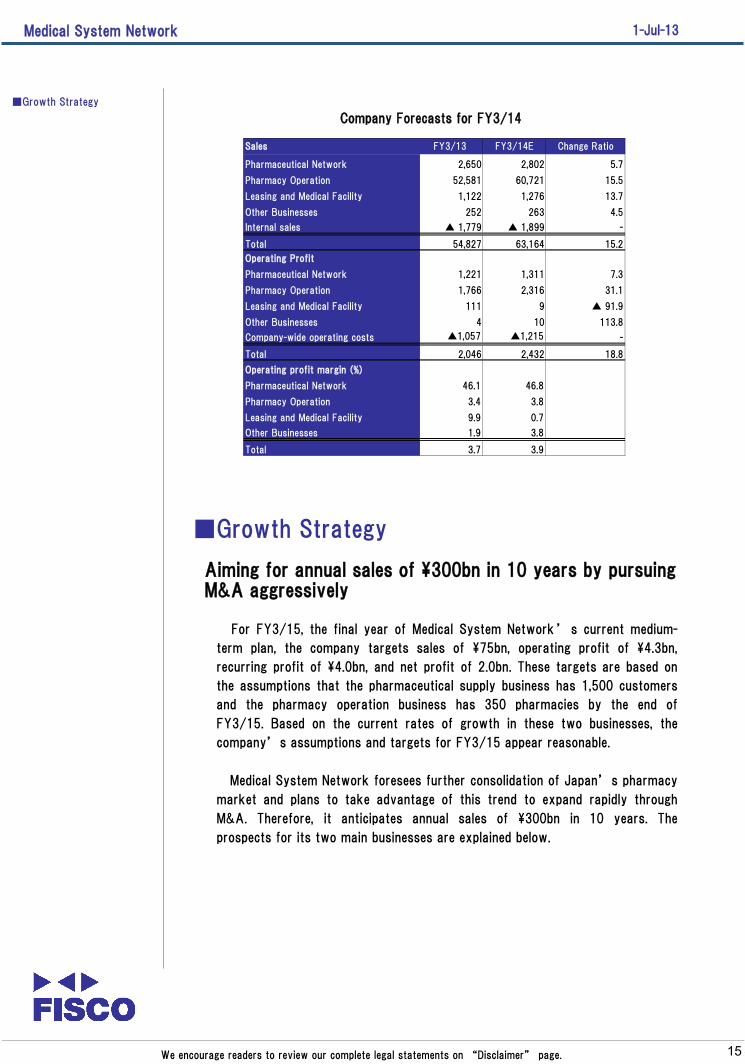
For FY3/14, Medical System Network forecasts a 15.2% y-o-y rise in sales to
\63,164mn, an 18.8% upturn in operating profit to \2,432mn, a 20.3% increase in
recurring profit to \2,300mn, and a 9.2% rise in net profit to \826mn. The
operating and recurring profit forecasts would be record highs. The company’s
projections for each business follow.
Projecting record-high operating and recurring profits
Medical System Network
13
1-Jul-13
We encourage readers to review our complete legal statements on “Disclaimer” page.
■Business Trends
Pharmaceutical Network Business
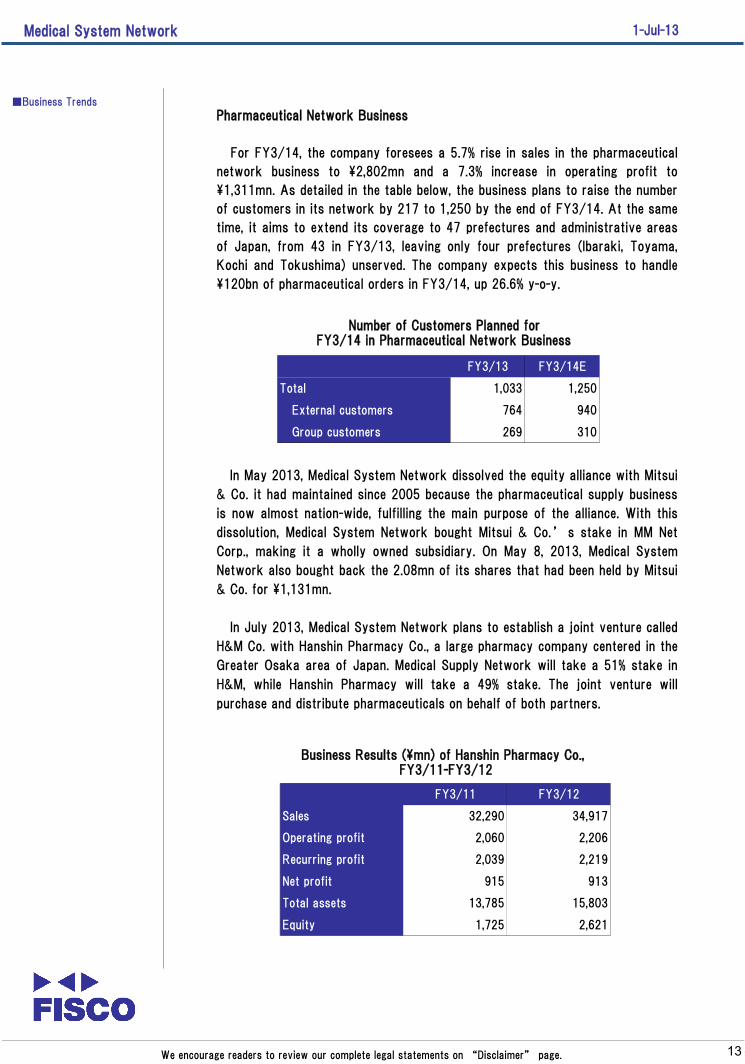
For FY3/14, the company foresees a 5.7% rise in sales in the pharmaceutical
network business to \2,802mn and a 7.3% increase in operating profit to
\1,311mn. As detailed in the table below, the business plans to raise the number
of customers in its network by 217 to 1,250 by the end of FY3/14. At the same
time, it aims to extend its coverage to 47 prefectures and administrative areas
of Japan, from 43 in FY3/13, leaving only four prefectures (Ibaraki, Toyama,
Kochi and Tokushima) unserved. The company expects this business to handle
\120bn of pharmaceutical orders in FY3/14, up 26.6% y-o-y.
FY3/13 FY3/14E
Total 1,033 1,250
External customers 764 940
Group customers 269 310
Number of Customers Planned forFY3/14 in Pharmaceutical Network Business
In May 2013, Medical System Network dissolved the equity alliance with Mitsui
& Co. it had maintained since 2005 because the pharmaceutical supply business
is now almost nation-wide, fulfilling the main purpose of the alliance. With this
dissolution, Medical System Network bought Mitsui & Co.’s stake in MM Net
Corp., making it a wholly owned subsidiary. On May 8, 2013, Medical System
Network also bought back the 2.08mn of its shares that had been held by Mitsui
& Co. for \1,131mn.
In July 2013, Medical System Network plans to establish a joint venture called
H&M Co. with Hanshin Pharmacy Co., a large pharmacy company centered in the
Greater Osaka area of Japan. Medical Supply Network will take a 51% stake in
H&M, while Hanshin Pharmacy will take a 49% stake. The joint venture will
purchase and distribute pharmaceuticals on behalf of both partners.
FY3/11 FY3/12
Sales 32,290 34,917
Operating profit 2,060 2,206
Recurring profit 2,039 2,219
Net profit 915 913
Total assets 13,785 15,803
Equity 1,725 2,621
Business Results (\mn) of Hanshin Pharmacy Co.,FY3/11-FY3/12

Medical System Network
14
1-Jul-13
We encourage readers to review our complete legal statements on “Disclaimer” page.
■Business TrendsPharmacy Operation Business
For FY3/14, the company foresees a 15.5% rise in sales in the pharmacy
operation business to \60,721mn and a 31.1% increase in operating profit to
\2,316mn. By opening and acquiring new pharmacies, the business aims to add
41 pharmacies in FY3/14, bringing the total to 310. Most of these new
pharmacies will be added in Greater Tokyo, Aichi Prefecture, and the Kyoto-
Osaka-Kobe area, where the company is concentrating its pharmacies in a
strategy to dominate the respective markets. To regain sales and profit growth
at pharmacies in operation for more than a year, the business will try to
improve customer satisfaction by introducing a floor concierge system and
raising the generic drug weighting in sales volume to 30% or more per pharmacy,
on average.
Medical System Network is also merging its pharmacy subsidiaries to lower its
indirect costs. On April 1, 2013, it merged two subsidiaries serving Hokkaido,
Compha and M and Three, making Compha the surviving entity. In July 2013, it
plans to merge the main operations of four subsidiaries serving the Greater
Tokyo area, Tomioka Pharmacy Co., Satsuki Pharmacy Co., MSC Co., and Apo
Pharmacy Co., into Sun Medic Co.
To raise the efficiency of its information system management, Medical System
Network plans to restrict the types of receipt computers used in its pharmacies
to two. To date, many types of such computer have been used in its pharmacies.
Leasing and Medical Facility and Other Businesses
For FY3/14, the company foresees a 13.7% rise in sales in the leasing and
medical facility business to \1,276mn but a 91.7% decrease in operating profit to
\9mn. Accompanying the full-scale operation of the Wisteria Kiyota residence
for the elderly with medical services, the depreciation cost for this facility alone
will increase by \96mn.
The company foresees no major changes in FY3/14 for its other businesses
and projects a 4.5% rise in business sales to \263mn and a 113.8% rise in
operating profit to \10mn.
Medical System Network
15
1-Jul-13
We encourage readers to review our complete legal statements on “Disclaimer” page.
Company Forecasts for FY3/14
■Growth Strategy
For FY3/15, the final year of Medical System Network’s current medium-
term plan, the company targets sales of \75bn, operating profit of \4.3bn,
recurring profit of \4.0bn, and net profit of 2.0bn. These targets are based on
the assumptions that the pharmaceutical supply business has 1,500 customers
and the pharmacy operation business has 350 pharmacies by the end of
FY3/15. Based on the current rates of growth in these two businesses, the
company’s assumptions and targets for FY3/15 appear reasonable.
Medical System Network foresees further consolidation of Japan’s pharmacy
market and plans to take advantage of this trend to expand rapidly through
M&A. Therefore, it anticipates annual sales of \300bn in 10 years. The
prospects for its two main businesses are explained below.
Aiming for annual sales of \300bn in 10 years by pursuingM&A aggressively
■Growth Strategy
Sales FY3/13 FY3/14E Change Ratio
Pharmaceutical Network 2,650 2,802 5.7
Pharmacy Operation 52,581 60,721 15.5
Leasing and Medical Facility 1,122 1,276 13.7
Other Businesses 252 263 4.5
Internal sales ▲ 1,779 ▲ 1,899 -
Total 54,827 63,164 15.2
Operating Profit
Pharmaceutical Network 1,221 1,311 7.3
Pharmacy Operation 1,766 2,316 31.1
Leasing and Medical Facility 111 9 ▲ 91.9
Other Businesses 4 10 113.8
Company-wide operating costs ▲1,057 ▲1,215 -
Total 2,046 2,432 18.8
Operating profit margin (%)
Pharmaceutical Network 46.1 46.8
Pharmacy Operation 3.4 3.8
Leasing and Medical Facility 9.9 0.7
Other Businesses 1.9 3.8
Total 3.7 3.9
Medical System Network
16
1-Jul-13
We encourage readers to review our complete legal statements on “Disclaimer” page.
■Growth Strategy
Pharmaceutical Network Business
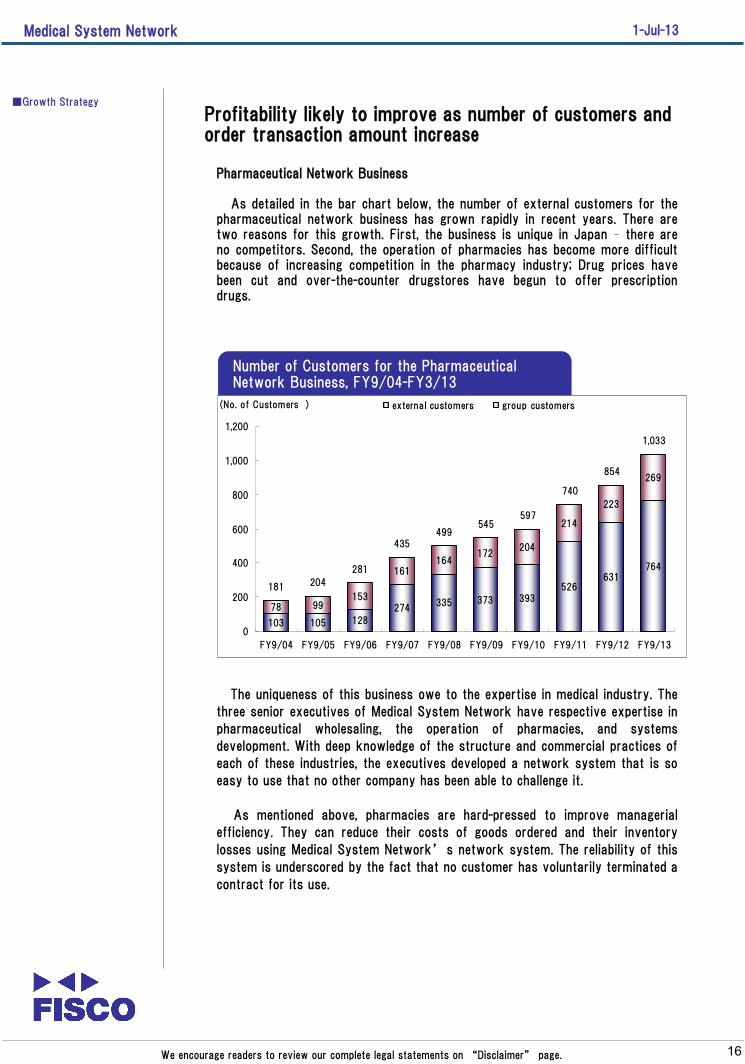
As detailed in the bar chart below, the number of external customers for thepharmaceutical network business has grown rapidly in recent years. There aretwo reasons for this growth. First, the business is unique in Japan – there areno competitors. Second, the operation of pharmacies has become more difficultbecause of increasing competition in the pharmacy industry; Drug prices havebeen cut and over-the-counter drugstores have begun to offer prescriptiondrugs.
Profitability likely to improve as number of customers andorder transaction amount increase
Number of Customers for the PharmaceuticalNetwork Business, FY9/04-FY3/13
103 105 128
274335 373 393
526631
764
78 99153
161164
172204
214
223
269
181 204
281
435499
545597
740
854
1,033
0
200
400
600
800
1,000
1,200
FY9/04 FY9/05 FY9/06 FY9/07 FY9/08 FY9/09 FY9/10 FY9/11 FY9/12 FY9/13
(No. of Customers ) external customers group customers
The uniqueness of this business owe to the expertise in medical industry. The
three senior executives of Medical System Network have respective expertise in
pharmaceutical wholesaling, the operation of pharmacies, and systems
development. With deep knowledge of the structure and commercial practices of
each of these industries, the executives developed a network system that is so
easy to use that no other company has been able to challenge it.
As mentioned above, pharmacies are hard-pressed to improve managerial
efficiency. They can reduce their costs of goods ordered and their inventory
losses using Medical System Network’s network system. The reliability of this
system is underscored by the fact that no customer has voluntarily terminated a
contract for its use.
Medical System Network
17
1-Jul-13
We encourage readers to review our complete legal statements on “Disclaimer” page.
■Growth StrategyThere are about 54,000 pharmacy companies in Japan. Of these, about 90%
are operating 20 or fewer pharmacies each. Many of these smaller pharmacy
companies cannot afford to build their own supply chain management systems
and would therefore benefit from using Medical System Network ’ s network
system. With slightly more than 1,000 customers, the pharmaceutical network
business possesses great growth potential. The network system’s reputation
for reliability is growing, contributing to the growth of the number of customers.
In addition, the pharmaceutical network business maintains an operating profit
margin of more than 40% because its network system requires almost no
support or renovation, so it provides a high marginal profit ratio. Therefore, as
long as the business’s commission rate on orders does not fall and its costs
do not rise significantly, its profitability is likely to increase as its number of
customers and order transaction amount continue to expand.
Pharmacy Operation Business
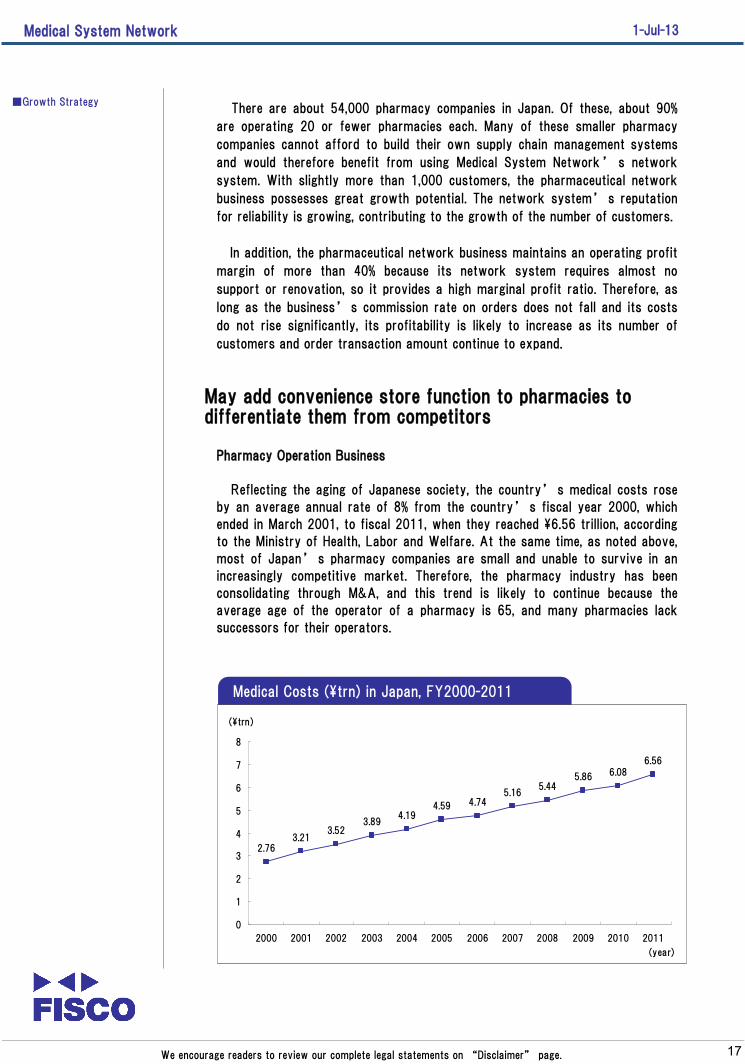
Reflecting the aging of Japanese society, the country’s medical costs rose
by an average annual rate of 8% from the country’s fiscal year 2000, which
ended in March 2001, to fiscal 2011, when they reached \6.56 trillion, according
to the Ministry of Health, Labor and Welfare. At the same time, as noted above,
most of Japan’s pharmacy companies are small and unable to survive in an
increasingly competitive market. Therefore, the pharmacy industry has been
consolidating through M&A, and this trend is likely to continue because the
average age of the operator of a pharmacy is 65, and many pharmacies lack
successors for their operators.
May add convenience store function to pharmacies todifferentiate them from competitors
Medical Costs (\trn) in Japan, FY2000-2011
2.763.21
3.523.89
4.194.59 4.74
5.165.44
5.86 6.086.56
0
1
2
3
4
5
6
7
8
2000 2001 2002 2003 2004 2005 2006 2007 2008 2009 2010 2011
(\trn)
(year)

Medical System Network
18
1-Jul-13
We encourage readers to review our complete legal statements on “Disclaimer” page.
■Growth StrategyDespite the trend of consolidation in Japan ’ s pharmacy industry, the
industry remains Japan’s least concentrated industry. The industry leader, Ain
Pharmaciez Inc., holds just over 2% of the market, and the top 10 companies in
the industry hold an aggregate share of just over 10%. Thus, a pharmacy
company that grows by aggressively merging or acquiring other pharmacy
companies could emerge as the industry leader.
In May 2013, Medical System Network announced that it would cooperate with
FamilyMart Inc. in developing pharmacies incorporating convenience store items.
Through this action, Medical System Network’s pharmacies would attempt to
differentiate themselves from competitors in an increasingly competitive market.
The company’s pharmacies have an average floor space of about 30 tsubo (99
square meters). About 10-20 tsubo (33-66 square meters) of this floor space
could be used to sell convenience store items. The company is now trying to
determine what goods and services could be profitably offered in this space. If
this business combination proves viable, Medical System Network and
FamilyMart may market it to the more than 40,000 small and medium-sized
pharmacies in Japan in the future.
■Measures of Business Performance
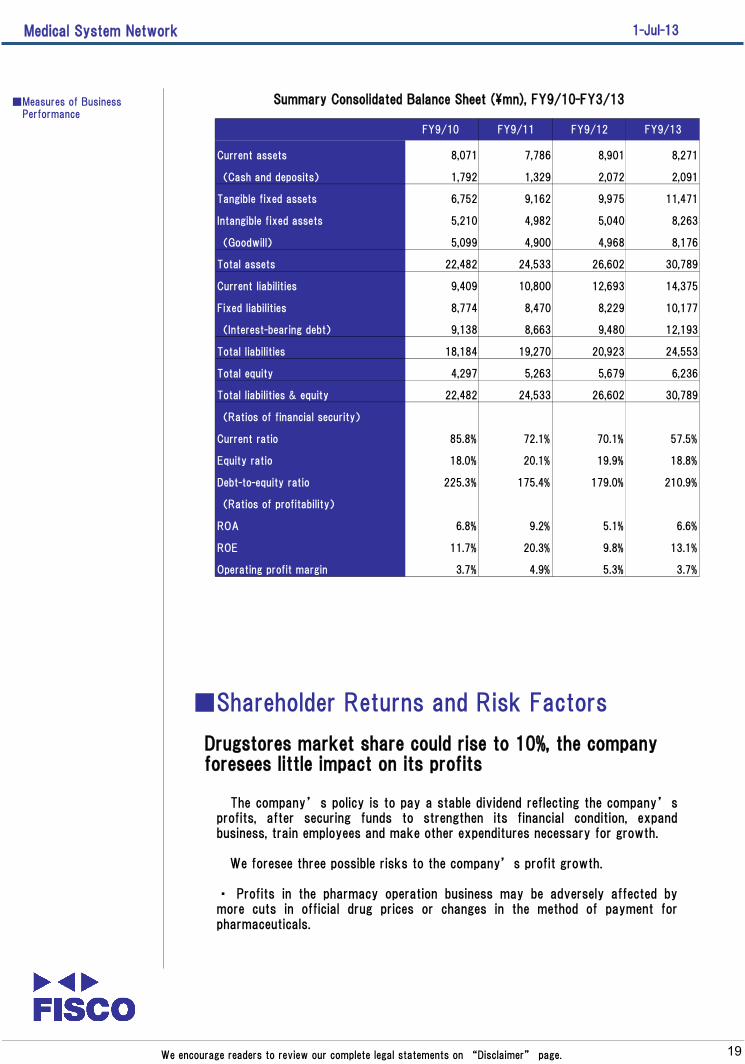
Important measures of business performance are shown at the bottom of the
following summary balance sheet for Medical System Network. The company’s
equity ratio is just under 20%, and its debt-to-equity ratio exceeds 200%, so it is
somewhat highly dependent on debt. This dependence reflects the company’s
use of borrowings to partially fund its aggressive M&A. The company’s ROE
remains above 10%, and its operating profit margin is stable at about 4%. These
ratios are supported by the high profitability of the pharmaceutical network
business and by the company’s financial leverage, which is reasonable, given
the very low interest rates in Japan.
The company is likely to maintain its current financial strategy, as it intends
to continue to expand its pharmacy operation business through aggressive M&A.
Taking advantage of low interest rates to boost profitgrowth through financial leverage
Medical System Network
19
1-Jul-13
We encourage readers to review our complete legal statements on “Disclaimer” page.
■Measures of Business Performance
FY9/10 FY9/11 FY9/12 FY9/13
Current assets 8,071 7,786 8,901 8,271
(Cash and deposits) 1,792 1,329 2,072 2,091
Tangible fixed assets 6,752 9,162 9,975 11,471
Intangible fixed assets 5,210 4,982 5,040 8,263
(Goodwill) 5,099 4,900 4,968 8,176
Total assets 22,482 24,533 26,602 30,789
Current liabilities 9,409 10,800 12,693 14,375
Fixed liabilities 8,774 8,470 8,229 10,177
(Interest-bearing debt) 9,138 8,663 9,480 12,193
Total liabilities 18,184 19,270 20,923 24,553
Total equity 4,297 5,263 5,679 6,236
Total liabilities & equity 22,482 24,533 26,602 30,789
(Ratios of financial security)
Current ratio 85.8% 72.1% 70.1% 57.5%
Equity ratio 18.0% 20.1% 19.9% 18.8%
Debt-to-equity ratio 225.3% 175.4% 179.0% 210.9%
(Ratios of profitability)
ROA 6.8% 9.2% 5.1% 6.6%
ROE 11.7% 20.3% 9.8% 13.1%
Operating profit margin 3.7% 4.9% 5.3% 3.7%
Summary Consolidated Balance Sheet (\mn), FY9/10-FY3/13
■Shareholder Returns and Risk Factors
The company’s policy is to pay a stable dividend reflecting the company’sprofits, after securing funds to strengthen its financial condition, expandbusiness, train employees and make other expenditures necessary for growth.
We foresee three possible risks to the company’s profit growth.
・ Profits in the pharmacy operation business may be adversely affected bymore cuts in official drug prices or changes in the method of payment forpharmaceuticals.
Drugstores market share could rise to 10%, the companyforesees little impact on its profits
Medical System Network
20
1-Jul-13
We encourage readers to review our complete legal statements on “Disclaimer” page.
■Shareholder Returns and Risk Factors ・ When Japan introduced a 3% consumption tax, it timed the introduction to
coincide with cuts in official drug prices, so the net impact on the profits of
pharmacies was modest. When the consumption tax was raised to 5%, the raise
was again timed to minimize the impact. Japan plans to raise this tax in coming
years. If these raises are again timed to coincide with cuts in official drug prices,
their impact should be modest. However, if the tax is raised at a different time,
the company’s profits may be adversely affected.
・ More over-the-counter drugstores in Japan are incorporating prescription
drug pharmacies. Currently, such drugstores account for about 2% of Japan’s
pharmacy market, and Medical System Network estimates that this ratio could
rise to 10% in 10 years. Even if the ratio were to reach 10%, the company
foresees little impact on its profits. However, if this ratio were to rise faster
than the company projects, the company’s profits could be adversely affected.
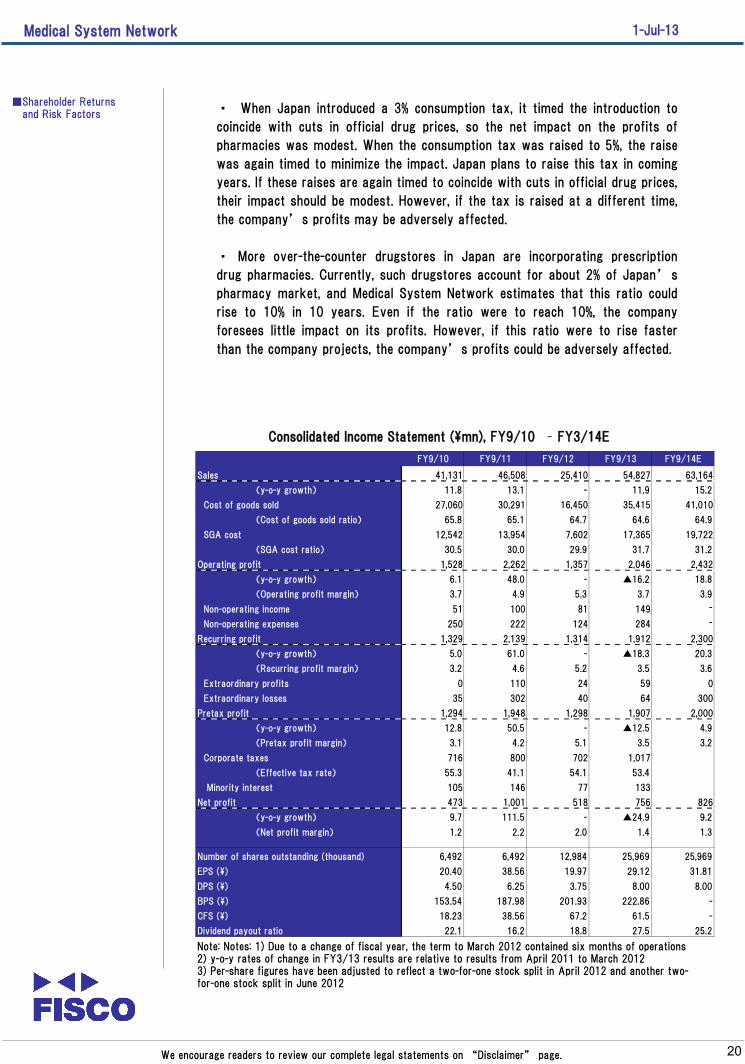
Consolidated Income Statement (\mn), FY9/10 – FY3/14E
FY9/10 FY9/11 FY9/12 FY9/13 FY9/14E
Sales 41,131 46,508 25,410 54,827 63,164
(y-o-y growth) 11.8 13.1 - 11.9 15.2
Cost of goods sold 27,060 30,291 16,450 35,415 41,010
(Cost of goods sold ratio) 65.8 65.1 64.7 64.6 64.9
SGA cost 12,542 13,954 7,602 17,365 19,722
(SGA cost ratio) 30.5 30.0 29.9 31.7 31.2
Operating profit 1,528 2,262 1,357 2,046 2,432
(y-o-y growth) 6.1 48.0 - ▲16.2 18.8
(Operating profit margin) 3.7 4.9 5.3 3.7 3.9
Non-operating income 51 100 81 149 -
Non-operating expenses 250 222 124 284 -
Recurring profit 1,329 2,139 1,314 1,912 2,300
(y-o-y growth) 5.0 61.0 - ▲18.3 20.3
(Recurring profit margin) 3.2 4.6 5.2 3.5 3.6
Extraordinary profits 0 110 24 59 0
Extraordinary losses 35 302 40 64 300
Pretax profit 1,294 1,948 1,298 1,907 2,000
(y-o-y growth) 12.8 50.5 - ▲12.5 4.9
(Pretax profit margin) 3.1 4.2 5.1 3.5 3.2
Corporate taxes 716 800 702 1,017
(Effective tax rate) 55.3 41.1 54.1 53.4
Minority interest 105 146 77 133
Net profit 473 1,001 518 756 826
(y-o-y growth) 9.7 111.5 - ▲24.9 9.2
(Net profit margin) 1.2 2.2 2.0 1.4 1.3
Number of shares outstanding (thousand) 6,492 6,492 12,984 25,969 25,969
EPS (\) 20.40 38.56 19.97 29.12 31.81
DPS (\) 4.50 6.25 3.75 8.00 8.00
BPS (\) 153.54 187.98 201.93 222.86 -
CFS (\) 18.23 38.56 67.2 61.5 -
Dividend payout ratio 22.1 16.2 18.8 27.5 25.2
Note: Notes: 1) Due to a change of fiscal year, the term to March 2012 contained six months of operations2) y-o-y rates of change in FY3/13 results are relative to results from April 2011 to March 20123) Per-share figures have been adjusted to reflect a two-for-one stock split in April 2012 and another two-for-one stock split in June 2012
Disclaimer
FISCO Ltd. (the terms “ FISCO ” , “ we ” , mean FISCO Ltd.) has legal
agreements with the Tokyo Stock Exchange, the Osaka Securities Exchange, and
Nikkei Inc. as to the usage of stock price and index information. The trademark
and value of the “JASDAQ INDEX” are the intellectual properties of the Osaka
Securities Exchange, and therefore all rights to them belong to the Osaka
Securities Exchange.
This report is based on information that we believe to be reliable, but we do not
confirm or guarantee its accuracy, timeliness, or completeness, or the value of the
securities issued by companies cited in this report. Regardless of purpose,
investors should decide how to use this report and take full responsibility for such
use. We shall not be liable for any result of its use. We provide this report solely
for the purpose of information, not to induce investment or any other action.
This report was prepared at the request of its subject company using
information provided by the company in interviews, but the entire content of the
report, including suppositions and conclusions, is the result of our analysis. The
content of this report is based on information that was current at the time the
report was produced, but this information and the content of this report are
subject to change without prior notice.
All intellectual property rights to this report, including copyrights to its text and
data, are held exclusively by FISCO. Any alteration or processing of the report or
duplications of the report, without the express written consent of FISCO, is
strictly prohibited. Any transmission, reproduction, distribution or transfer of the
report or its duplications is also strictly prohibited.
The final selection of investments and determination of appropriate prices for
investment transactions are decisions for the recipients of this report.