Embed Size (px)
Citation preview
�F�E�B�R�U�A�R�Y��2�0�1�3
�M�E�D�I�G�A�P�:���S�p�o�t�l�i�g�h�t��o�n��E�n�r�o�l�l�m�e�n�t�,��P�r�e�m�i�u�m�s�,��a�n�d��R�e�c�e�n�t��T�r�e�n�d�s
�M�e�d�i�c�a�r�e��P�o�l�i�c�y�K �A �I �S �E �R � �F �A �M �I �L �Y � �F �O �U �N �D �A �T �I �O �N

�M�e�d�i�c�a�r�e��P�o�l�i�c�y�K �A �I �S �E �R � �F �A �M �I �L �Y � �F �O �U �N �D �A �T �I �O �N
�F�E�B�R�U�A�R�Y��2�0�1�3
�M�E�D�I�G�A�P�:���S�p�o�t�l�i�g�h�t��o�n��E�n�r�o�l�l�m�e�n�t�,��P�r�e�m�i�u�m�s�,��a�n�d��R�e�c�e�n�t��T�r�e�n�d�s
�P�r�e�p�a�r�e�d��b�y�:
�J�e�n�n�i�f�e�r��T�.��H�u�a�n�g�G�r�e�t�c�h�e�n��A�.��J�a�c�o�b�s�o�n�T�r�i�c�i�a��N�e�u�m�a�n�T�h�e��H�e�n�r�y��J�.��K�a�i�s�e�r��F�a�m�i�l�y��F�o�u�n�d�a�t�i�o�n
�a�n�d
�K�a�t�h�e�r�i�n�e��A�.��D�e�s�m�o�n�d�T�h�o�m�a�s��R�i�c�e�T�h�e��U�n�i�v�e�r�s�i�t�y��o�f��C�a�l�i�f�o�r�n�i�a�,��L�o�s��A�n�g�e�l�e�s


MEDIGAP: Spotlight on EnrollmEnt, prEmiumS, and rEcEnt trEndS 1
MEDIGAP: Spotlight on Enrollment, Premiums, and Recent Trends
EXECUTIVE SUMMARY
Medicare supplemental insurance, also known as “Medigap,” is an important source of supplemental coverage for nearly one in four people on Medicare. Traditional Medicare has cost-sharing requirements and significant gaps in coverage; Medigap helps make health care costs more predictable and stable for beneficiaries by covering some or all Medicare costs, including deductibles and cost-sharing.
This policy brief provides an overview of the Medigap market, national trends in enrollment and premiums, variations across plan types and states and by different beneficiary characteristics. It also compares the growth in Medigap premiums to the growth in other Medicare premiums. Lastly, the brief examines whether Medigap policyholders are enrolled in the lowest-cost plans available in their states.
Medigap enrollment
Nationally, Medigap enrollment stayed relatively steady in the last several years, declining slightly from 9.7 million policyholders in 2006 to 9.3 million in 2010.i
In 2010, nearly one in four Medicare beneficiaries (23%) had a Medigap policy; however, Medigap penetration varies by state, ranging from 2 percent of beneficiaries in Hawaii to 51 percent in North Dakota. In several states in the Plains and Midwest, nearly half of all Medicare beneficiaries had a Medigap policy.
Plans F and C were the most popular plans nationwide, accounting for 40 percent and 13 percent of all Medigap policies, respectively. These two plans cover both the Medicare Part A and Part B deductibles completely, and are commonly described as providing “first-dollar coverage.” The share of Medigap policyholders with plans that have first-dollar coverage also varies by state.
The number of Medigap policyholders decreased by 32 percent in Minnesota (about 78,000 fewer policyholders), while increasing by 31 percent in Arizona (about 39,000 more policyholders) between 2006 and 2010.
Medigap premiums
Across all plan types, the average Medigap premium was $178 per month in 2010. However, Medigap premiums vary by plan type and by state. For example, Plan F premiums averaged $172 per month nationwide, ranging from an average of $79 per month in Vermont to $220 per month in New York. Even within New York, Plan F premiums varied by company, ranging from an average of $72 per month to an average of $366 per month.
Between 2006 and 2010, average Medigap premiums have increased moderately, from $158 per month to $178 per month, with some variations by state. With an average annual growth rate of 3 percent per year during this period, average Medigap premiums have risen more slowly than Medicare Part B premiums, average Medicare Part D premiums, and Medicare per capita spending.
i These national figures do not include California, which was excluded because companies in that state are not required to report to
NAIC, leading to incomplete data on Medigap enrollment and premiums in California.
2 MEDIGAP: Spotlight on EnrollmEnt, prEmiumS, and rEcEnt trEndS
Variation in premiums by age, gender, and smoking status
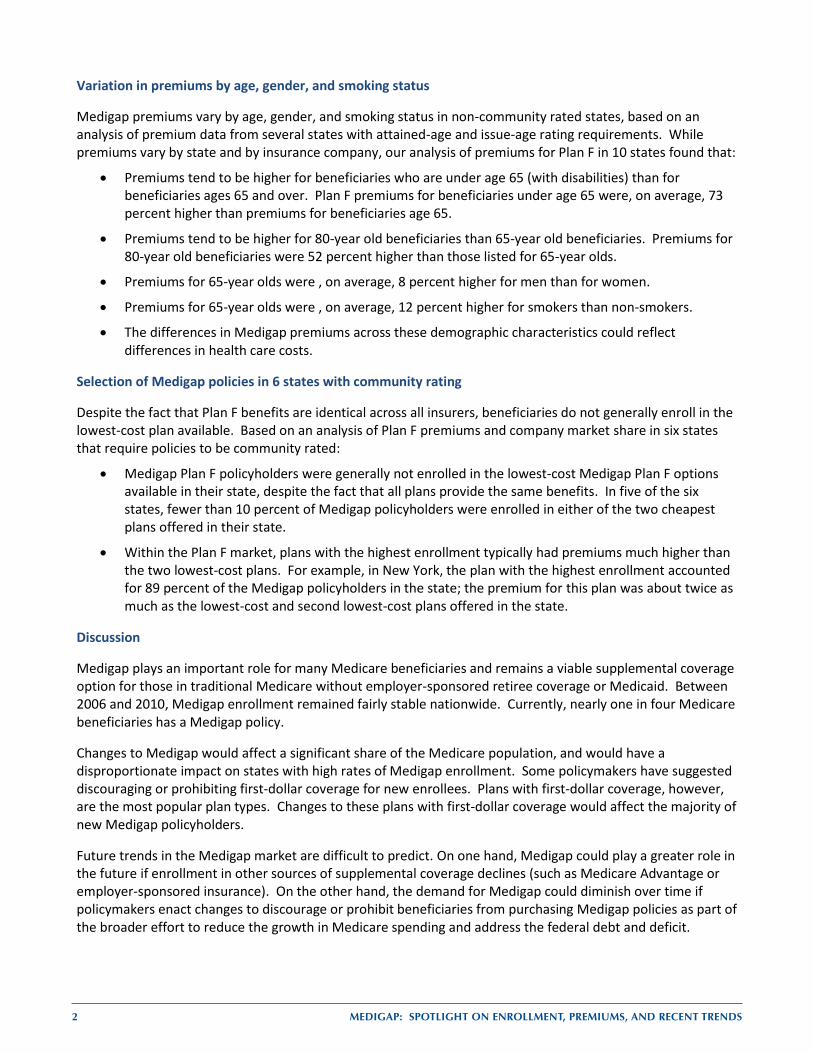
Medigap premiums vary by age, gender, and smoking status in non-community rated states, based on an analysis of premium data from several states with attained-age and issue-age rating requirements. While premiums vary by state and by insurance company, our analysis of premiums for Plan F in 10 states found that:
Premiums tend to be higher for beneficiaries who are under age 65 (with disabilities) than for beneficiaries ages 65 and over. Plan F premiums for beneficiaries under age 65 were, on average, 73 percent higher than premiums for beneficiaries age 65.
Premiums tend to be higher for 80-year old beneficiaries than 65-year old beneficiaries. Premiums for 80-year old beneficiaries were 52 percent higher than those listed for 65-year olds.
Premiums for 65-year olds were , on average, 8 percent higher for men than for women.
Premiums for 65-year olds were , on average, 12 percent higher for smokers than non-smokers.
The differences in Medigap premiums across these demographic characteristics could reflect differences in health care costs.
Selection of Medigap policies in 6 states with community rating
Despite the fact that Plan F benefits are identical across all insurers, beneficiaries do not generally enroll in the lowest-cost plan available. Based on an analysis of Plan F premiums and company market share in six states that require policies to be community rated:
Medigap Plan F policyholders were generally not enrolled in the lowest-cost Medigap Plan F options available in their state, despite the fact that all plans provide the same benefits. In five of the six states, fewer than 10 percent of Medigap policyholders were enrolled in either of the two cheapest plans offered in their state.
Within the Plan F market, plans with the highest enrollment typically had premiums much higher than the two lowest-cost plans. For example, in New York, the plan with the highest enrollment accounted for 89 percent of the Medigap policyholders in the state; the premium for this plan was about twice as much as the lowest-cost and second lowest-cost plans offered in the state.
Discussion
Medigap plays an important role for many Medicare beneficiaries and remains a viable supplemental coverage option for those in traditional Medicare without employer-sponsored retiree coverage or Medicaid. Between 2006 and 2010, Medigap enrollment remained fairly stable nationwide. Currently, nearly one in four Medicare beneficiaries has a Medigap policy.
Changes to Medigap would affect a significant share of the Medicare population, and would have a disproportionate impact on states with high rates of Medigap enrollment. Some policymakers have suggested discouraging or prohibiting first-dollar coverage for new enrollees. Plans with first-dollar coverage, however, are the most popular plan types. Changes to these plans with first-dollar coverage would affect the majority of new Medigap policyholders.
Future trends in the Medigap market are difficult to predict. On one hand, Medigap could play a greater role in the future if enrollment in other sources of supplemental coverage declines (such as Medicare Advantage or employer-sponsored insurance). On the other hand, the demand for Medigap could diminish over time if policymakers enact changes to discourage or prohibit beneficiaries from purchasing Medigap policies as part of the broader effort to reduce the growth in Medicare spending and address the federal debt and deficit.
MEDIGAP: Spotlight on EnrollmEnt, prEmiumS, and rEcEnt trEndS 3
MEDIGAP: Spotlight on Enrollment, Premiums, and Recent Trends
INTRODUCTION
Since the inception of Medicare, Medigap has been an important source of supplemental coverage for program beneficiaries. About one in four Medicare beneficiaries has a Medigap policy. Beneficiaries purchase Medigap policies because they seek and value coverage that helps to make health care costs more predictable, as Medigap pays some or all of Medicare’s deductibles and cost-sharing requirements. Beneficiaries also value the way in which Medigap, in conjunction with Medicare, helps to minimize the paperwork burden associated with medical bills.
Medigap is expected to continue to play a role as a supplement to traditional Medicare in the future, although the exact nature of its future role is difficult to predict. On the one hand, the share of beneficiaries with Medigap may increase over the next several years as other sources of supplemental coverage erode. For example, the share of large employers offering benefits to Medicare-eligible retirees has declined and is projected to continue to decline, which may cause the demand for Medigap to rise.1 Similarly, a growing share of the Medicare population may turn to the Medigap market for supplemental coverage as an alternative to Medicare Advantage plans, particularly if enrollment in Medicare Advantage plans declines in response to reductions in payments enacted in the Patient Protection and Affordable Care Act (ACA) of 2010, which has been predicted by the Congressional Budget Office (CBO) and the Department of Health and Human Services’ Office of the Actuary (OACT).2
On the other hand, many have proposed taxing Medigap plans as part of broader efforts to reduce the federal debt and deficit. If these proposals continue to be part of the debt reduction agenda, Medicare beneficiaries may be discouraged from purchasing Medigap policies. For the first time in many years, policymakers have shown an increased interest in proposals to reform the Medigap market as part of broader efforts to reduce the national debt generally, and Medicare spending more specifically. Several leading debt reduction proposals would prohibit or discourage Medigap plans from offering first-dollar coverage.3,4,5 Proponents of these reforms note that first-dollar coverage results in higher utilization of medical services and higher Medicare spending. For example, the National Commission on Fiscal Responsibility Reform proposed unifying the Part A and Part B deductibles and restricting Medigap coverage of Medicare cost sharing. In 2008, CBO examined a similar proposal in its Health Care Budget Options,6 and estimated savings of $3.2 billion in its first year, and $73 billion over the ten-year period between 2010 and 2019.7 The Obama administration, in its fiscal year 2013 budget proposal, took a slightly different approach by recommending a surcharge on Part B premiums for new Medicare beneficiaries who purchase near first-dollar coverage, beginning in 2017, and estimated it would save $2.5 billion over 6 years. This is similar to an approach outlined by the Medicare Payment Advisory Commission (MedPAC) in June 2012. MedPAC recommended imposing an additional charge on supplemental policies that fill in Medicare’s cost sharing, including Medigap and employer plans.8
The National Association of Insurance Commissioners (NAIC) reviewed Medigap Plans C and F, as required by the ACA, to determine whether Plans C and F should be modified to include nominal cost sharing (rather than cover both the A and B deductibles). In a letter to Secretary Sebelius, the NAIC recommended that “no changes should be made to Plans C and F at this time,” and said the NAIC did not agree “with the assertion being made by some parties that Medigap is the driver of unnecessary medical care by Medicare beneficiaries.”9
Previous studies, including those released by America’s Health Insurance Plans (AHIP) and the Assistant Secretary for Planning and Evaluation (ASPE), have provided information about the Medigap market. The AHIP 2012 report describes the distribution of Medigap policies by plan type in each state, the distribution of policies by the number of states they cover, and the popularity of new policies in 2011.10 The ASPE 2011 report analyzes trends in Medigap enrollment, penetration, plan type, and premiums from 2007 to 2010.11
4 MEDIGAP: Spotlight on EnrollmEnt, prEmiumS, and rEcEnt trEndS
EXHIBIT 1EXHIBIT 1
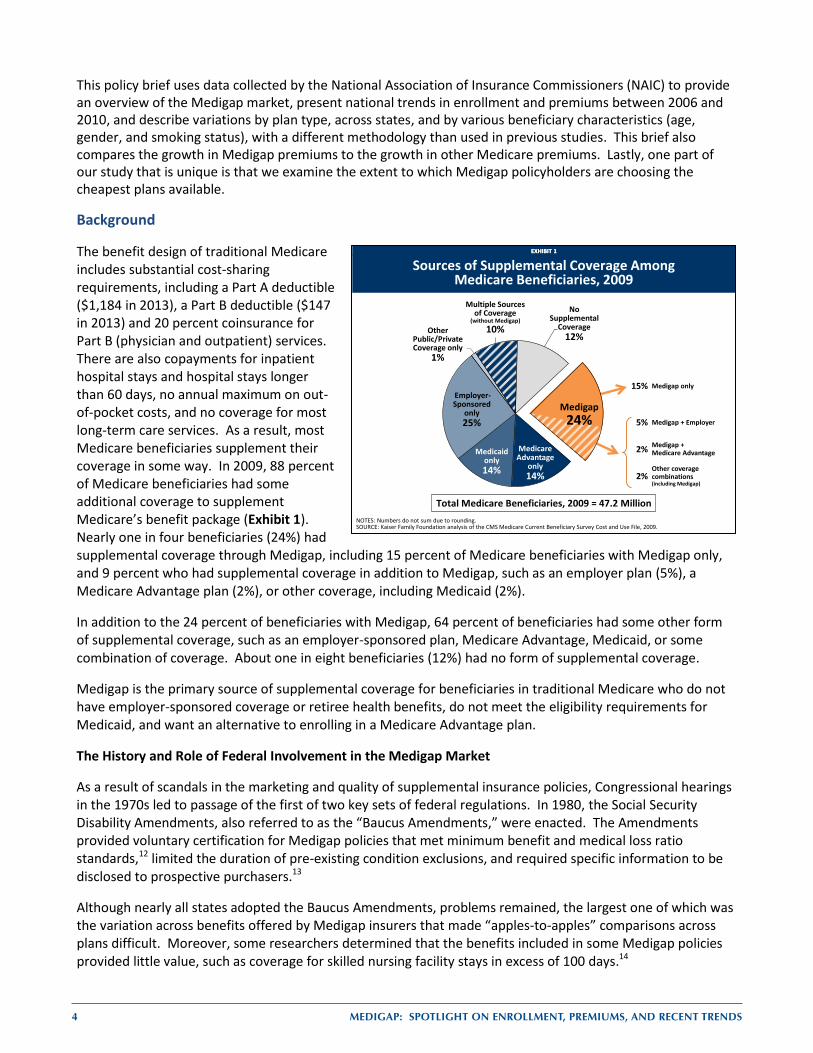
Sources of Supplemental Coverage Among Medicare Beneficiaries, 2009
NOTES: Numbers do not sum due to rounding.SOURCE: Kaiser Family Foundation analysis of the CMS Medicare Current Beneficiary Survey Cost and Use File, 2009.
Other Public/Private Coverage only
1%
15% Medigap only
5% Medigap + Employer
2% Medigap + Medicare Advantage
2%Other coverage combinations (including Medigap)
Total Medicare Beneficiaries, 2009 = 47.2 Million
Medicare Advantage
only14%
Medicaid only14%
Employer-Sponsored
only 25%
Multiple
No Supplemental
Coverage12%
Medigap24%
Multiple Sources of Coverage
(without Medigap)10%
This policy brief uses data collected by the National Association of Insurance Commissioners (NAIC) to provide an overview of the Medigap market, present national trends in enrollment and premiums between 2006 and 2010, and describe variations by plan type, across states, and by various beneficiary characteristics (age, gender, and smoking status), with a different methodology than used in previous studies. This brief also compares the growth in Medigap premiums to the growth in other Medicare premiums. Lastly, one part of our study that is unique is that we examine the extent to which Medigap policyholders are choosing the cheapest plans available.
Background
The benefit design of traditional Medicare includes substantial cost-sharing requirements, including a Part A deductible ($1,184 in 2013), a Part B deductible ($147 in 2013) and 20 percent coinsurance for Part B (physician and outpatient) services. There are also copayments for inpatient hospital stays and hospital stays longer than 60 days, no annual maximum on out-of-pocket costs, and no coverage for most long-term care services. As a result, most Medicare beneficiaries supplement their coverage in some way. In 2009, 88 percent of Medicare beneficiaries had some additional coverage to supplement Medicare’s benefit package (Exhibit 1). Nearly one in four beneficiaries (24%) had supplemental coverage through Medigap, including 15 percent of Medicare beneficiaries with Medigap only, and 9 percent who had supplemental coverage in addition to Medigap, such as an employer plan (5%), a Medicare Advantage plan (2%), or other coverage, including Medicaid (2%).
In addition to the 24 percent of beneficiaries with Medigap, 64 percent of beneficiaries had some other form of supplemental coverage, such as an employer-sponsored plan, Medicare Advantage, Medicaid, or some combination of coverage. About one in eight beneficiaries (12%) had no form of supplemental coverage.
Medigap is the primary source of supplemental coverage for beneficiaries in traditional Medicare who do not have employer-sponsored coverage or retiree health benefits, do not meet the eligibility requirements for Medicaid, and want an alternative to enrolling in a Medicare Advantage plan.
The History and Role of Federal Involvement in the Medigap Market
As a result of scandals in the marketing and quality of supplemental insurance policies, Congressional hearings in the 1970s led to passage of the first of two key sets of federal regulations. In 1980, the Social Security Disability Amendments, also referred to as the “Baucus Amendments,” were enacted. The Amendments provided voluntary certification for Medigap policies that met minimum benefit and medical loss ratio standards,12 limited the duration of pre-existing condition exclusions, and required specific information to be disclosed to prospective purchasers.13
Although nearly all states adopted the Baucus Amendments, problems remained, the largest one of which was the variation across benefits offered by Medigap insurers that made “apples-to-apples” comparisons across plans difficult. Moreover, some researchers determined that the benefits included in some Medigap policies provided little value, such as coverage for skilled nursing facility stays in excess of 100 days.14
MEDIGAP: Spotlight on EnrollmEnt, prEmiumS, and rEcEnt trEndS 5
The Omnibus Budget Reconciliation Act of 1990 (OBRA-90) included the second key set of federal regulations for Medigap, which are still largely in effect today. The law directed the National Association of Insurance Commissioners (NAIC) to establish a standardized set of plans; Medigap policies had to conform exactly to particular lists of benefits. Unlike the voluntary Baucus Amendments, this standardization was mandatory for all but three states (Massachusetts, Minnesota, and Wisconsin) that already had some form of standardization in effect. The NAIC specified ten Medigap policies types, labeled A through J, which have been modified and modernized over time. Companies are not required to sell all plan types, but the ones they do sell must conform to the standardization rules. All companies that sell Medigap policies must sell plan type A, and may choose to sell other plan types as well.
In addition to directing the NAIC to create standardized plans, OBRA-90 included a number of other requirements:
Guaranteed plan renewability (with few exceptions); Medical loss ratio requirements of at least 65 percent for individual policies and 75 percent for group
policies; that is, insurance companies selling Medigap plans are required to spend at least 65 percent of their premium income from individual policies, or 75 percent of premium income from group policies, on health care claims and quality improvement, leaving the remaining share of premiums for administration, marketing, and profit. These requirements have remained unchanged since 1990;ii
Penalties on agents and insurers who knowingly sell duplicate coverage; Limits on agent commissions during the first year of coverage to discourage the “churning” of policies; Institution of a six-month open enrollment period after a beneficiary’s initial eligibility for Medicare,
for beneficiaries ages 65 and older; and Limits the exclusion period for pre-existing conditions to six months.15
In 1995, the Act to Amend the Omnibus Budget Reconciliation Act of 1990 authorized “SELECT” plans to be offered as a Medigap plan option; SELECT plans were initially introduced in OBRA-90 as a demonstration. SELECT plans have the same benefit structure as other Medigap plans; however, SELECT plans have preferred provider networks, and beneficiaries receiving care from providers outside of the plans’ networks may have additional cost-sharing.
Two years later, in 1997, the Balanced Budget Act (BBA) authorized high-deductible Medigap plans as options for Plan F and Plan J. These high-deductible plans offer the same benefits as Plans F and J but require the beneficiary to pay for Medicare-covered costs up to a deductible ($2,110 in 2013) before the Medigap plan begins to pay for covered benefits.
Two new plans, K and L, were added in 2005; each included patient cost-sharing for most services but also contained limits on annual out-of-pocket costs.
As a result of the expansion of Medicare benefits to cover prescription drugs beginning in 2006, plans H, I, and J, the three plan types that previously covered prescription drugs, were modified. Drug benefits were no longer included in Medigap Plans H, I, and J sold after January 1, 2006.
In 2010, two more new plans, M and N, were added. They included copayments rather than coinsurance, and two benefits were eliminated from all standardized plans due to changes in Medicare benefits made in the ACA (preventive benefits and at-home recovery).
Also in 2010, Plans E, H, I, and J were eliminated because their benefits had become redundant with those of other plans. These four plans were no longer sold after June 30, 2010; however, beneficiaries who owned these plans prior to June 2010 were allowed to renew their policies. ii For comparison, Medicare Advantage plans will be required to maintain a medical loss ratio (MLR) of at least 85 percent beginning in
2014, as a result of the ACA. The ACA also requires health plans in the large group market to maintain a MLR of 85 percent and plans in the individual and small group markets to maintain a MLR of 80 percent.
6 MEDIGAP: Spotlight on EnrollmEnt, prEmiumS, and rEcEnt trEndS
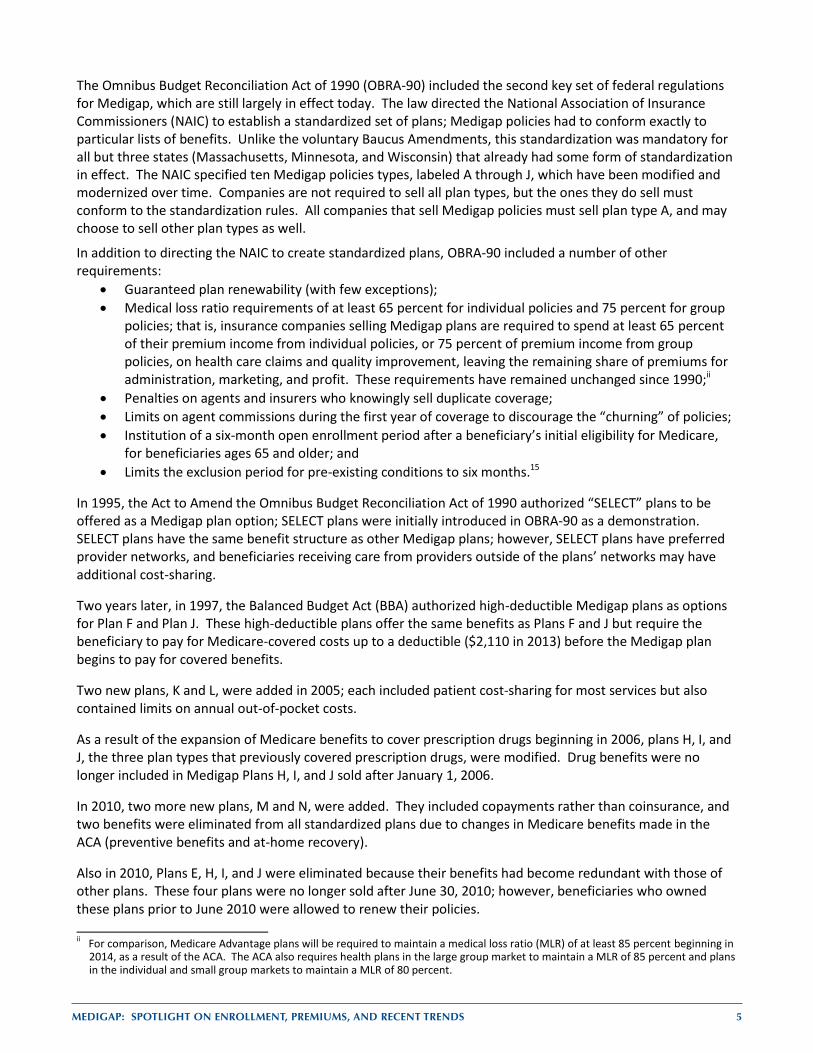
Exhibit 2 shows a list of plans and benefits, and includes all standardized plans offered from 1990 to 2013.
Consumer protections for Medicare beneficiaries aged 65 and older
Medicare beneficiaries ages 65 and over have a federally-required, one-time, 6-month open enrollment period, which begins with the first month of Medicare Part B coverage. During the open enrollment period and in certain other defined times, beneficiaries have guaranteed issue rights; this means that insurance companies selling Medigap policies cannot refuse to sell a Medigap policy to any applicant, regardless of age, gender, or health status. Also during the open enrollment period, insurance companies offering Medigap policies cannot use medical underwriting to change premiums due to past or present medical problems.
Consumer protections for beneficiaries under the age of 65
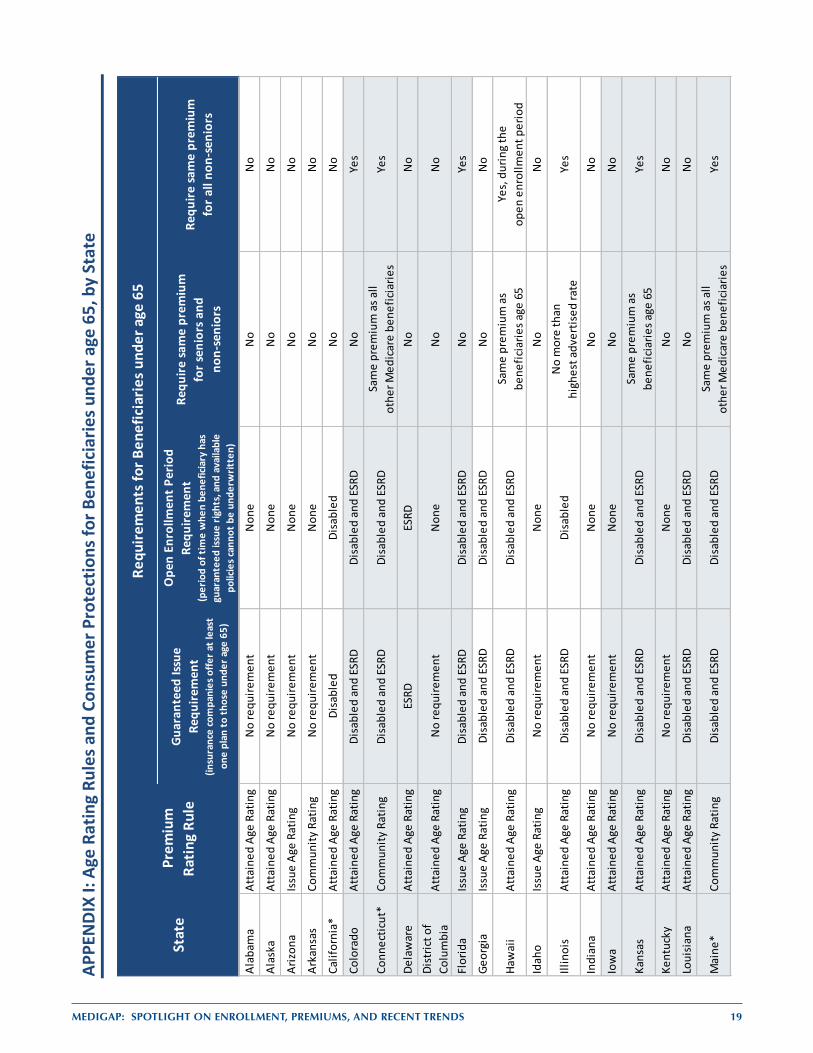
While guaranteed issue requirements for Medicare beneficiaries ages 65 and older are set by federal law, requirements vary by state for beneficiaries under the age of 65. Insurers are not required by federal law to sell any of their Medigap policies to beneficiaries under the age of 65. Across all 50 states and the District of Columbia, 30 states require insurance companies to offer at least one Medigap policy to beneficiaries under age 65 who are disabled or who have end-stage renal disease (ESRD) (Appendix I).
As noted, federal law requires insurance companies to provide a six-month open enrollment period for Medicare beneficiaries when they are age 65. However, there is no federal law requiring an open enrollment period for beneficiaries who qualify for Medicare before they turn age 65. Of the 30 states with guaranteed issue requirements, 28 states have laws that require open enrollment periods for beneficiaries under age 65. Among states with this requirement, the scope of the requirements can vary by state. For example, not all states offer open enrollment periods for both disabled and ESRD beneficiaries; some states only require certain plan types to be available during the open enrollment periods. A few states also have continuous open enrollment periods, or annual open enrollment periods.
EXHIBIT 2EXHIBIT 2
NOTES: Check marks indicate 100 percent benefit coverage. Amount in table is the plan’s coinsurance amount for each covered benefit after beneficiary pays deductibles or cost-sharing amounts, where applicable. The Affordable Care Act eliminated cost-sharing for preventive benefits rated A or B by the U.S. Preventive Services Task Force, effective 2011. 1After June 1, 2010, Medigap Plans E, H, I, and J are no longer available for purchase by new policyholders; existing policyholders may remain in these plans. 2Benefits for Plan G reflect the standard benefit after June 1, 2010 (Part B excess charges changed from 80% to 100%). 3Medigap Plans K and L available for purchase in 2005. 4Medigap Plans M and N available for purchase after June 1, 2010. *Plan N pays 100% of the Part B coinsurance except up to $20 copayment for office visits and up to $50 for emergency department visits. SOURCE: Centers for Medicare & Medicaid Services, 2011 Guide to Health Insurance, March 2011.
BENEFITSMEDIGAP POLICY
A B C D E1 F G2 H1 I1 J1 K3 L3 M4 N4
Medicare Part A Coinsurance and all costs after hospital benefits are exhausted
Medicare Part B Coinsurance or Copayment for other than preventive services 50% 75% *
Blood (first 3 pints) 50% 75%
Hospice Care Coinsurance or Copayment(added to Plans A, B, C, D, F, and G in June 2010) 50% 75%
Skilled Nursing Facility Care Coinsurance 50% 75%
Medicare Part A Deductible 50% 75% 50%
Medicare Part B Deductible
Medicare Part B Excess Charges
Foreign Travel Emergency (Up to Plan Limits)*
Out-of-Pocket Limit $4,620 $2,310
Standard Medigap Plan Benefits
MEDIGAP: Spotlight on EnrollmEnt, prEmiumS, and rEcEnt trEndS 7
Some states require insurance companies to offer policies to non-senior beneficiaries at the same premium as beneficiaries age 65; other states limit the extent to which insurance companies can charge higher premiums to non-seniors. Most states, however, do not have this requirement. Fourteen states restrict the degree to which beneficiaries under age 65 can be charged more than senior beneficiaries.
Similarly, 22 states require insurance companies to charge the same premium for all beneficiaries under the age of 65, regardless of how the beneficiary qualified for Medicare (through disability, amyotrophic lateral sclerosis [ALS], or ESRD). In these states, companies cannot use medical underwriting to change premiums based on disability or reason for eligibility, for beneficiaries under age 65.
For a list of states and their consumer protections for Medicare beneficiaries under the age of 65, see Appendix I.
Premium Rating Rating rules for Medigap policies are generally determined at the state level, rather than the federal level. There are three different “age rating” systems to price policies:
Community rating: insurers charge all policyholders within a plan type the same amount without regard to age or health status; insurers can raise premiums only if they do so for everyone enrolled in the plan type;
Issue age rating: premiums are based upon the age of the beneficiary when the policy is first purchased; and
Attained age rating: premiums may rise as a beneficiary ages.
Currently, eight states (Arkansas, Connecticut, Maine, Massachusetts, Minnesota, New York, Vermont, and Washington) require premiums to be community rated. Four states (Arizona, Florida, Georgia, and Idaho) require premiums to be issue age rated, although insurers in these states would be permitted to make policies community rated, if they preferred. Thirty-eight states and the District of Columbia allow attained age rating for premiums. Insurers in these states are permitted to use issue age or community rating for premiums, but generally do not do so. For a list of states by rating rules, see the Appendix I.
STUDY OVERVIEW
This brief provides information on the current state of the Medigap market, including variation in enrollment and premiums nationally and by state, using data collected by the NAIC. Specifically, the brief examines enrollment and premiums in 2010, and trends since 2006. Particular attention is paid to differences between plan types and across states.
The NAIC data are supplemented with data from websites of the various state insurance departments to examine how Plan F premiums vary by age, sex, and smoking status.
8 MEDIGAP: Spotlight on EnrollmEnt, prEmiumS, and rEcEnt trEndS
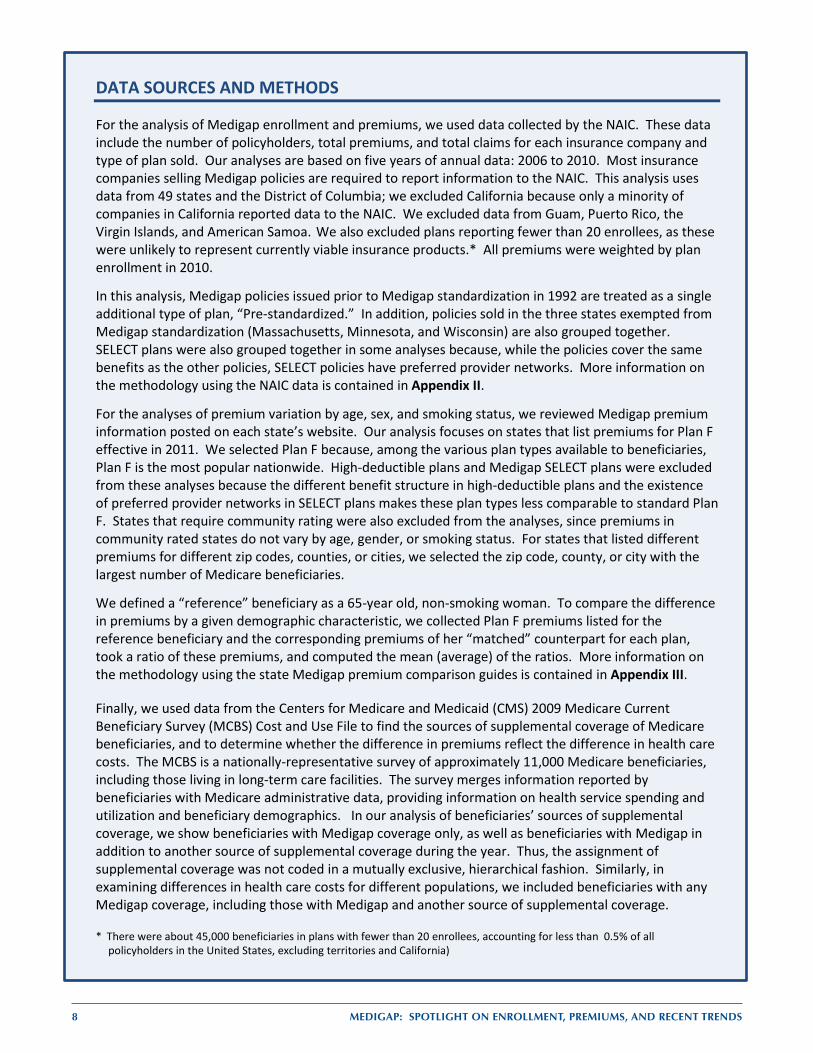
DATA SOURCES AND METHODS
For the analysis of Medigap enrollment and premiums, we used data collected by the NAIC. These data include the number of policyholders, total premiums, and total claims for each insurance company and type of plan sold. Our analyses are based on five years of annual data: 2006 to 2010. Most insurance companies selling Medigap policies are required to report information to the NAIC. This analysis uses data from 49 states and the District of Columbia; we excluded California because only a minority of companies in California reported data to the NAIC. We excluded data from Guam, Puerto Rico, the Virgin Islands, and American Samoa. We also excluded plans reporting fewer than 20 enrollees, as these were unlikely to represent currently viable insurance products.* All premiums were weighted by plan enrollment in 2010.
In this analysis, Medigap policies issued prior to Medigap standardization in 1992 are treated as a single additional type of plan, “Pre-standardized.” In addition, policies sold in the three states exempted from Medigap standardization (Massachusetts, Minnesota, and Wisconsin) are also grouped together. SELECT plans were also grouped together in some analyses because, while the policies cover the same benefits as the other policies, SELECT policies have preferred provider networks. More information on the methodology using the NAIC data is contained in Appendix II.
For the analyses of premium variation by age, sex, and smoking status, we reviewed Medigap premium information posted on each state’s website. Our analysis focuses on states that list premiums for Plan F effective in 2011. We selected Plan F because, among the various plan types available to beneficiaries, Plan F is the most popular nationwide. High-deductible plans and Medigap SELECT plans were excluded from these analyses because the different benefit structure in high-deductible plans and the existence of preferred provider networks in SELECT plans makes these plan types less comparable to standard Plan F. States that require community rating were also excluded from the analyses, since premiums in community rated states do not vary by age, gender, or smoking status. For states that listed different premiums for different zip codes, counties, or cities, we selected the zip code, county, or city with the largest number of Medicare beneficiaries.
We defined a “reference” beneficiary as a 65-year old, non-smoking woman. To compare the difference in premiums by a given demographic characteristic, we collected Plan F premiums listed for the reference beneficiary and the corresponding premiums of her “matched” counterpart for each plan, took a ratio of these premiums, and computed the mean (average) of the ratios. More information on the methodology using the state Medigap premium comparison guides is contained in Appendix III.
Finally, we used data from the Centers for Medicare and Medicaid (CMS) 2009 Medicare Current Beneficiary Survey (MCBS) Cost and Use File to find the sources of supplemental coverage of Medicare beneficiaries, and to determine whether the difference in premiums reflect the difference in health care costs. The MCBS is a nationally-representative survey of approximately 11,000 Medicare beneficiaries, including those living in long-term care facilities. The survey merges information reported by beneficiaries with Medicare administrative data, providing information on health service spending and utilization and beneficiary demographics. In our analysis of beneficiaries’ sources of supplemental coverage, we show beneficiaries with Medigap coverage only, as well as beneficiaries with Medigap in addition to another source of supplemental coverage during the year. Thus, the assignment of supplemental coverage was not coded in a mutually exclusive, hierarchical fashion. Similarly, in examining differences in health care costs for different populations, we included beneficiaries with any Medigap coverage, including those with Medigap and another source of supplemental coverage.
* There were about 45,000 beneficiaries in plans with fewer than 20 enrollees, accounting for less than 0.5% of all policyholders in the United States, excluding territories and California)
MEDIGAP: Spotlight on EnrollmEnt, prEmiumS, and rEcEnt trEndS 9
RESULTS
Medigap Enrollment
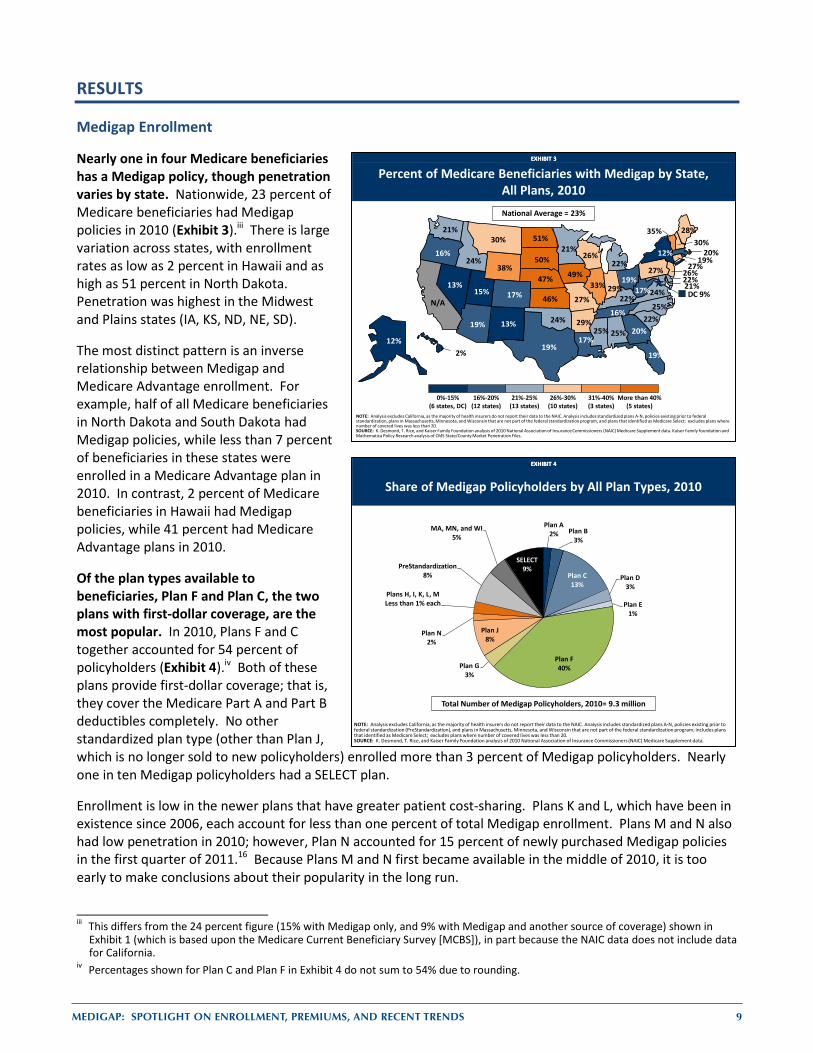
Nearly one in four Medicare beneficiaries has a Medigap policy, though penetration varies by state. Nationwide, 23 percent of Medicare beneficiaries had Medigap policies in 2010 (Exhibit 3).iii There is large variation across states, with enrollment rates as low as 2 percent in Hawaii and as high as 51 percent in North Dakota. Penetration was highest in the Midwest and Plains states (IA, KS, ND, NE, SD).
The most distinct pattern is an inverse relationship between Medigap and Medicare Advantage enrollment. For example, half of all Medicare beneficiaries in North Dakota and South Dakota had Medigap policies, while less than 7 percent of beneficiaries in these states were enrolled in a Medicare Advantage plan in 2010. In contrast, 2 percent of Medicare beneficiaries in Hawaii had Medigap policies, while 41 percent had Medicare Advantage plans in 2010.
Of the plan types available to beneficiaries, Plan F and Plan C, the two plans with first-dollar coverage, are the most popular. In 2010, Plans F and C together accounted for 54 percent of policyholders (Exhibit 4).iv Both of these plans provide first-dollar coverage; that is, they cover the Medicare Part A and Part B deductibles completely. No other standardized plan type (other than Plan J, which is no longer sold to new policyholders) enrolled more than 3 percent of Medigap policyholders. Nearly one in ten Medigap policyholders had a SELECT plan.
Enrollment is low in the newer plans that have greater patient cost-sharing. Plans K and L, which have been in existence since 2006, each account for less than one percent of total Medigap enrollment. Plans M and N also had low penetration in 2010; however, Plan N accounted for 15 percent of newly purchased Medigap policies in the first quarter of 2011.16 Because Plans M and N first became available in the middle of 2010, it is too early to make conclusions about their popularity in the long run.
iii This differs from the 24 percent figure (15% with Medigap only, and 9% with Medigap and another source of coverage) shown in
Exhibit 1 (which is based upon the Medicare Current Beneficiary Survey [MCBS]), in part because the NAIC data does not include data for California.
iv Percentages shown for Plan C and Plan F in Exhibit 4 do not sum to 54% due to rounding.
EXHIBIT 3EXHIBIT 3
Percent of Medicare Beneficiaries with Medigap by State, All Plans, 2010National Average = 23%
0%-15%(6 states, DC)
16%-20%(12 states)
21%-25%(13 states)
26%-30%(10 states)
31%-40%(3 states)
More than 40%(5 states)
NOTE: Analysis excludes California, as the majority of health insurers do not report their data to the NAIC. Analysis includes standardized plans A-N, policies existing prior to federal standardization, plans in Massachusetts, Minnesota, and Wisconsin that are not part of the federal standardization program, and plans that identified as Medicare Select; excludes plans where number of covered lives was less than 20.SOURCE: K. Desmond, T. Rice, and Kaiser Family Foundation analysis of 2010 National Association of Insurance Commissioners (NAIC) Medicare Supplement data. Kaiser Family foundation and Mathematica Policy Research analysis of CMS State/County Market Penetration Files.
25%12%
19% 29%
N/A17%
27%
22%
DC 9%
19%
20%
2%
24%
33% 29%
49%
46% 22%
17%
28%
21%
20%22%
21%
25%
27%
30%
47%13%
30%
26%
13%
12%
25%
51%
19%
24%
16%
27%19%
22%
50%
16%
19%
15%
35%
24%
21%
17%
26%38%
EXHIBIT 4EXHIBIT 4
Share of Medigap Policyholders by All Plan Types, 2010
Plan A2% Plan B
3%
Plan C13%
Plan D3%
Plan E1%
Plan F40%Plan G
3%
Plan J8%
Plan N2%
Plans H, I, K, L, MLess than 1% each
PreStandardization8%
MA, MN, and WI5%
SELECT9%
Total Number of Medigap Policyholders, 2010= 9.3 million
NOTE: Analysis excludes California, as the majority of health insurers do not report their data to the NAIC. Analysis includes standardized plans A-N, policies existing prior to federal standardization (PreStandardization), and plans in Massachusetts, Minnesota, and Wisconsin that are not part of the federal standardization program; includes plans that identified as Medicare Select; excludes plans where number of covered lives was less than 20.SOURCE: K. Desmond, T. Rice, and Kaiser Family Foundation analysis of 2010 National Association of Insurance Commissioners (NAIC) Medicare Supplement data.
10 MEDIGAP: Spotlight on EnrollmEnt, prEmiumS, and rEcEnt trEndS
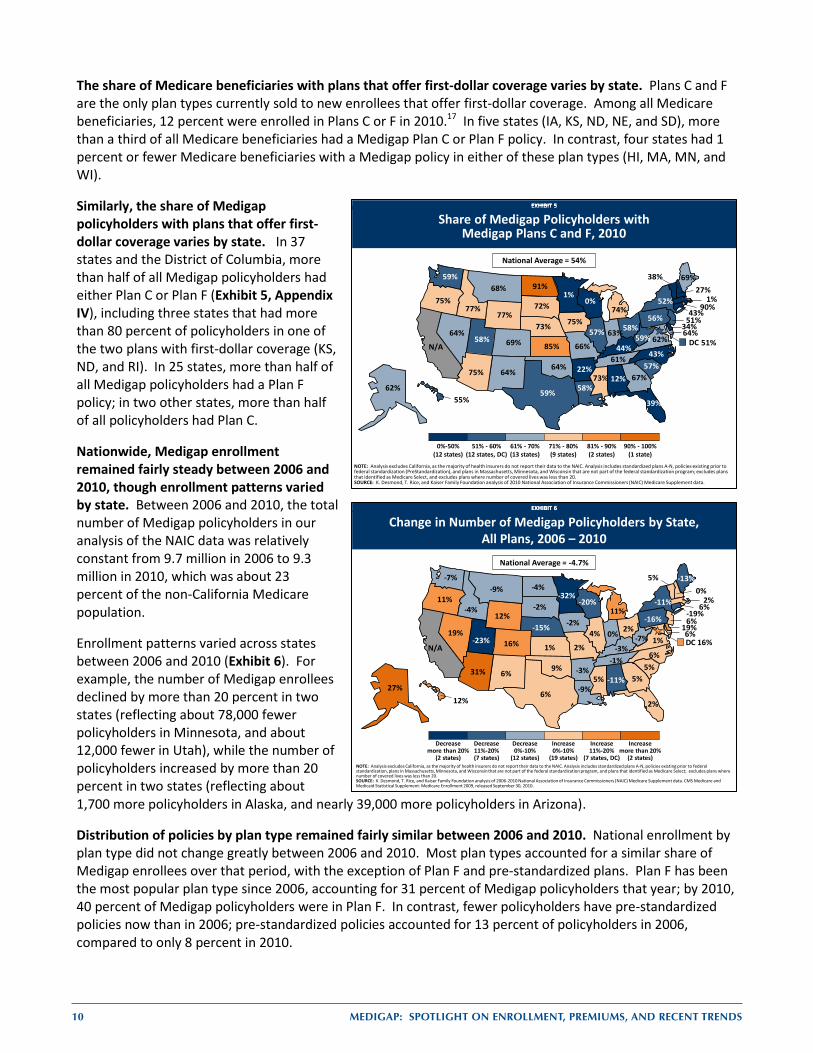
The share of Medicare beneficiaries with plans that offer first-dollar coverage varies by state. Plans C and F are the only plan types currently sold to new enrollees that offer first-dollar coverage. Among all Medicare beneficiaries, 12 percent were enrolled in Plans C or F in 2010.17 In five states (IA, KS, ND, NE, and SD), more than a third of all Medicare beneficiaries had a Medigap Plan C or Plan F policy. In contrast, four states had 1 percent or fewer Medicare beneficiaries with a Medigap policy in either of these plan types (HI, MA, MN, and WI).
Similarly, the share of Medigap policyholders with plans that offer first-dollar coverage varies by state. In 37 states and the District of Columbia, more than half of all Medigap policyholders had either Plan C or Plan F (Exhibit 5, Appendix IV), including three states that had more than 80 percent of policyholders in one of the two plans with first-dollar coverage (KS, ND, and RI). In 25 states, more than half of all Medigap policyholders had a Plan F policy; in two other states, more than half of all policyholders had Plan C.
Nationwide, Medigap enrollment remained fairly steady between 2006 and 2010, though enrollment patterns varied by state. Between 2006 and 2010, the total number of Medigap policyholders in our analysis of the NAIC data was relatively constant from 9.7 million in 2006 to 9.3 million in 2010, which was about 23 percent of the non-California Medicare population.
Enrollment patterns varied across states between 2006 and 2010 (Exhibit 6). For example, the number of Medigap enrollees declined by more than 20 percent in two states (reflecting about 78,000 fewer policyholders in Minnesota, and about 12,000 fewer in Utah), while the number of policyholders increased by more than 20 percent in two states (reflecting about 1,700 more policyholders in Alaska, and nearly 39,000 more policyholders in Arizona).
Distribution of policies by plan type remained fairly similar between 2006 and 2010. National enrollment by plan type did not change greatly between 2006 and 2010. Most plan types accounted for a similar share of Medigap enrollees over that period, with the exception of Plan F and pre-standardized plans. Plan F has been the most popular plan type since 2006, accounting for 31 percent of Medigap policyholders that year; by 2010, 40 percent of Medigap policyholders were in Plan F. In contrast, fewer policyholders have pre-standardized policies now than in 2006; pre-standardized policies accounted for 13 percent of policyholders in 2006, compared to only 8 percent in 2010.
EXHIBIT 6EXHIBIT 6
Change in Number of Medigap Policyholders by State, All Plans, 2006 – 2010
NOTE: Analysis excludes California, as the majority of health insurers do not report their data to the NAIC. Analysis includes standardized plans A-N, policies existing prior to federal standardization, plans in Massachusetts, Minnesota, and Wisconsin that are not part of the federal standardization program, and plans that identified as Medicare Select; excludes plans where number of covered lives was less than 20.SOURCE: K. Desmond, T. Rice, and Kaiser Family Foundation analysis of 2006-2010 National Association of Insurance Commissioners (NAIC) Medicare Supplement data. CMS Medicare and Medicaid Statistical Supplement: Medicare Enrollment 2009, released September 30, 2010.
National Average = -4.7%
Decrease more than 20%
(2 states)
Decrease11%-20%(7 states)
Decrease0%-10%
(12 states)
Increase 0%-10%
(19 states)
Increase11%-20%
(7 states, DC)
Increasemore than 20%
(2 states)
DC 16%
6%
-11%27%
31% -3%
N/A 16%
-19%
19%
2%
5%
12%
-4%
4% 0%-2%
1% -3%
-9%
-13%
6%
2%-32%
5%
2%
-9%
-15%19%
0%
6%
6%
-11%
6%
-4%
2%
9%
11%
-16%
5%
-2%
-1%
6%
-23%
5%
1%
-7%
-7%
12%
-20%-41%11%
EXHIBIT 5EXHIBIT 5
Share of Medigap Policyholders with Medigap Plans C and F, 2010
0%-50%(12 states)
51% - 60%(12 states, DC)
61% - 70%(13 states)
71% - 80%(9 states)
81% - 90%(2 states)
90% - 100%(1 state)
National Average = 54%
EXHIBIT 5
NOTE: Analysis excludes California, as the majority of health insurers do not report their data to the NAIC. Analysis includes standardized plans A-N, policies existing prior to federal standardization (PreStandardization), and plans in Massachusetts, Minnesota, and Wisconsin that are not part of the federal standardization program; excludes plans that identified as Medicare Select, and excludes plans where number of covered lives was less than 20.SOURCE: K. Desmond, T. Rice, and Kaiser Family Foundation analysis of 2010 National Association of Insurance Commissioners (NAIC) Medicare Supplement data.
51%DC
12%62%
75% 22%
N/A 69%
43%
34%
39%
67%
55%
77%
57% 63%75%
85% 44%
58%
69%
64%
1%1%
73%
66%
68%
73%64%
27%
51%
64%
52%
43%
91%
58%
64%
75%
56%90%
57%
72%
61%
59%
58%
38%
62%
59%
59%
77%
0%74%
MEDIGAP: Spotlight on EnrollmEnt, prEmiumS, and rEcEnt trEndS 11
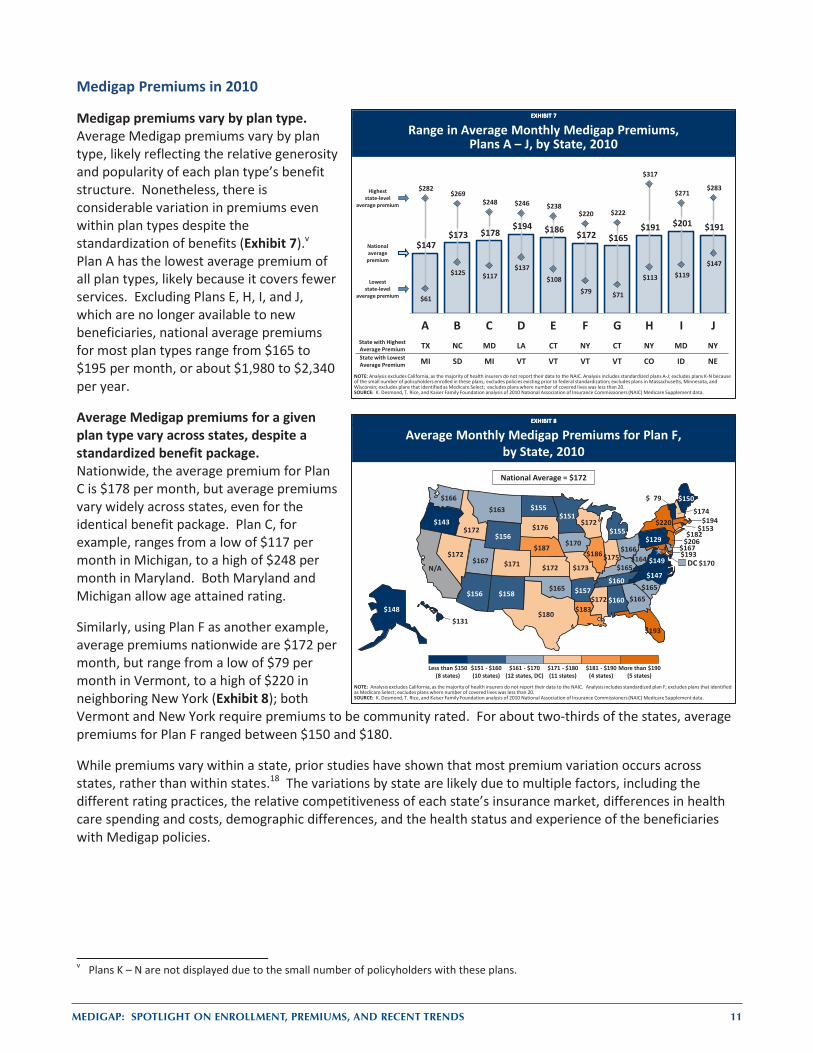
Medigap Premiums in 2010
Medigap premiums vary by plan type. Average Medigap premiums vary by plan type, likely reflecting the relative generosity and popularity of each plan type’s benefit structure. Nonetheless, there is considerable variation in premiums even within plan types despite the standardization of benefits (Exhibit 7).v Plan A has the lowest average premium of all plan types, likely because it covers fewer services. Excluding Plans E, H, I, and J, which are no longer available to new beneficiaries, national average premiums for most plan types range from $165 to $195 per month, or about $1,980 to $2,340 per year.
Average Medigap premiums for a given plan type vary across states, despite a standardized benefit package. Nationwide, the average premium for Plan C is $178 per month, but average premiums vary widely across states, even for the identical benefit package. Plan C, for example, ranges from a low of $117 per month in Michigan, to a high of $248 per month in Maryland. Both Maryland and Michigan allow age attained rating.
Similarly, using Plan F as another example, average premiums nationwide are $172 per month, but range from a low of $79 per month in Vermont, to a high of $220 in neighboring New York (Exhibit 8); both Vermont and New York require premiums to be community rated. For about two-thirds of the states, average premiums for Plan F ranged between $150 and $180.
While premiums vary within a state, prior studies have shown that most premium variation occurs across states, rather than within states.18 The variations by state are likely due to multiple factors, including the different rating practices, the relative competitiveness of each state’s insurance market, differences in health care spending and costs, demographic differences, and the health status and experience of the beneficiaries with Medigap policies.
v Plans K – N are not displayed due to the small number of policyholders with these plans.
EXHIBIT 7EXHIBIT 7
Range in Average Monthly Medigap Premiums,Plans A – J, by State, 2010
$147 $173 $178
$194 $186 $172 $165 $191 $201 $191
$61
$125 $117 $137
$108 $79 $71
$113 $119 $147
$282 $269
$248 $246 $238 $220 $222
$317
$271 $283
A B C D E F G H I JState with Highest Average Premium TX NC MD LA CT NY CT NY MD NYState with Lowest Average Premium MI SD MI VT VT VT VT CO ID NE
NOTE: Analysis excludes California, as the majority of health insurers do not report their data to the NAIC. Analysis includes standardized plans A-J; excludes plans K-N because of the small number of policyholders enrolled in these plans; excludes policies existing prior to federal standardization; excludes plans in Massachusetts, Minnesota, and Wisconsin; excludes plans that identified as Medicare Select; excludes plans where number of covered lives was less than 20.SOURCE: K. Desmond, T. Rice, and Kaiser Family Foundation analysis of 2010 National Association of Insurance Commissioners (NAIC) Medicare Supplement data.
Highest state-level
average premium
National average
premium
Loweststate-level
average premium
EXHIBIT 8EXHIBIT 8
Less than $150(8 states)
$151 - $160(10 states)
$161 - $170(12 states, DC)
$171 - $180(11 states)
$181 - $190(4 states)
More than $190(5 states)
National Average = $172
Average Monthly Medigap Premiums for Plan F, by State, 2010
170$ DC
160$ 148$
156$ 157$
N/A 171$
182$
167$
193$
165$
131$
172$
186$ 175$
170$
172$ 165$
183$
150$
193$
194$ 151$
172$
173$
163$
187$ 172$
174$
206$
158$
220$
147$
155$
166$
165$
143$
129$ 153$
165$
176$
160$
180$
167$
79$
149$
166$
164$
156$
172$ 155$
NOTE: Analysis excludes California, as the majority of health insurers do not report their data to the NAIC. Analysis includes standardized plan F; excludes plans that identified as Medicare Select; excludes plans where number of covered lives was less than 20.SOURCE: K. Desmond, T. Rice, and Kaiser Family Foundation analysis of 2010 National Association of Insurance Commissioners (NAIC) Medicare Supplement data.
12 MEDIGAP: Spotlight on EnrollmEnt, prEmiumS, and rEcEnt trEndS
Medigap Premium Trends, 2006 – 2010
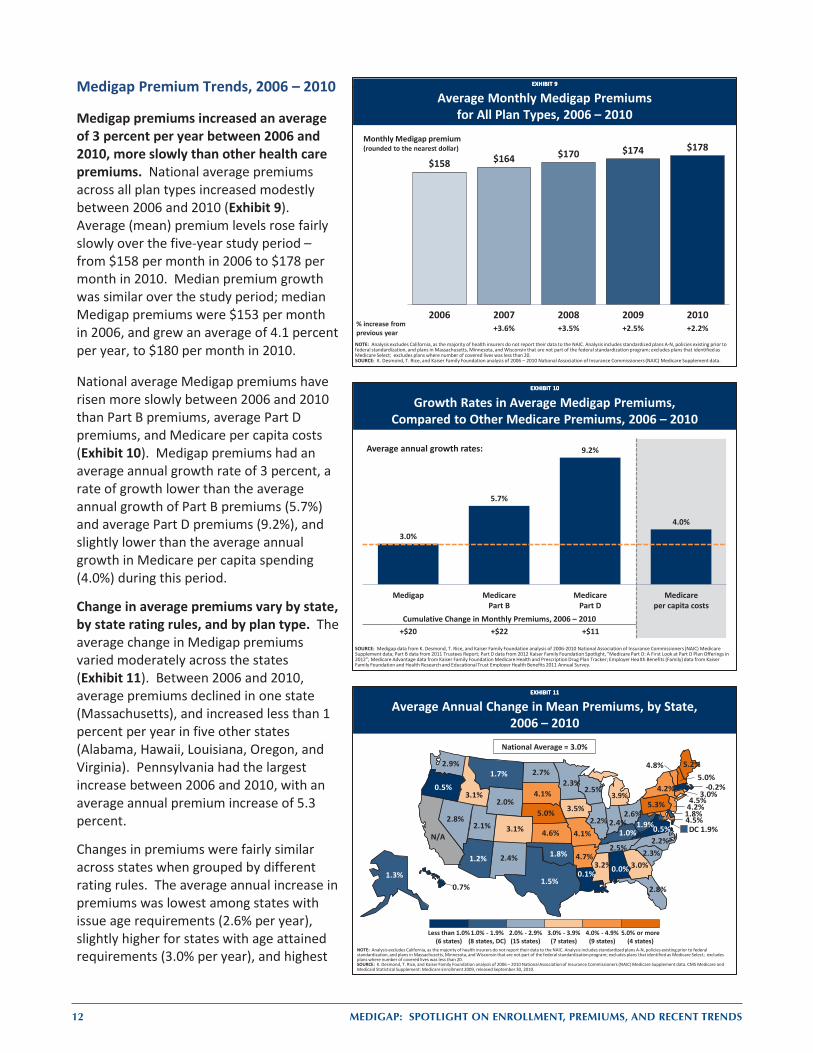
Medigap premiums increased an average of 3 percent per year between 2006 and 2010, more slowly than other health care premiums. National average premiums across all plan types increased modestly between 2006 and 2010 (Exhibit 9). Average (mean) premium levels rose fairly slowly over the five-year study period – from $158 per month in 2006 to $178 per month in 2010. Median premium growth was similar over the study period; median Medigap premiums were $153 per month in 2006, and grew an average of 4.1 percent per year, to $180 per month in 2010.
National average Medigap premiums have risen more slowly between 2006 and 2010 than Part B premiums, average Part D premiums, and Medicare per capita costs (Exhibit 10). Medigap premiums had an average annual growth rate of 3 percent, a rate of growth lower than the average annual growth of Part B premiums (5.7%) and average Part D premiums (9.2%), and slightly lower than the average annual growth in Medicare per capita spending (4.0%) during this period.
Change in average premiums vary by state, by state rating rules, and by plan type. The average change in Medigap premiums varied moderately across the states (Exhibit 11). Between 2006 and 2010, average premiums declined in one state (Massachusetts), and increased less than 1 percent per year in five other states (Alabama, Hawaii, Louisiana, Oregon, and Virginia). Pennsylvania had the largest increase between 2006 and 2010, with an average annual premium increase of 5.3 percent.
Changes in premiums were fairly similar across states when grouped by different rating rules. The average annual increase in premiums was lowest among states with issue age requirements (2.6% per year), slightly higher for states with age attained requirements (3.0% per year), and highest
EXHIBIT 9EXHIBIT 9
Average Monthly Medigap Premiums for All Plan Types, 2006 – 2010
$158 $164 $170 $174 $178
2006 2007 2008 2009 2010% increase from previous year +3.6% +3.5% +2.5% +2.2%
NOTE: Analysis excludes California, as the majority of health insurers do not report their data to the NAIC. Analysis includes standardized plans A-N, policies existing prior to federal standardization, and plans in Massachusetts, Minnesota, and Wisconsin that are not part of the federal standardization program; excludes plans that identified as Medicare Select; excludes plans where number of covered lives was less than 20.SOURCE: K. Desmond, T. Rice, and Kaiser Family Foundation analysis of 2006 – 2010 National Association of Insurance Commissioners (NAIC) Medicare Supplement data.
Monthly Medigap premium (rounded to the nearest dollar)
EXHIBIT 10EXHIBIT 10
Growth Rates in Average Medigap Premiums, Compared to Other Medicare Premiums, 2006 – 2010
SOURCE: Medigap data from K. Desmond, T. Rice, and Kaiser Family Foundation analysis of 2006-2010 National Association of Insurance Commissioners (NAIC) Medicare Supplement data; Part B data from 2011 Trustees Report; Part D data from 2012 Kaiser Family Foundation Spotlight, “Medicare Part D: A First Look at Part D Plan Offerings in 2012”; Medicare Advantage data from Kaiser Family Foundation Medicare Health and Prescription Drug Plan Tracker; Employer Health Benefits (Family) data from Kaiser Family Foundation and Health Research and Educational Trust Employer Health Benefits 2011 Annual Survey.
3.0%
5.7%
9.2%
4.0%
Medigap MedicarePart B
MedicarePart D
Medicareper capita costs
Average annual growth rates:
Cumulative Change in Monthly Premiums, 2006 – 2010+$20 +$22 +$11
EXHIBIT 11EXHIBIT 11
Average Annual Change in Mean Premiums, by State, 2006 – 2010
NOTE: Analysis excludes California, as the majority of health insurers do not report their data to the NAIC. Analysis includes standardized plans A-N, policies existing prior to federal standardization, and plans in Massachusetts, Minnesota, and Wisconsin that are not part of the federal standardization program; excludes plans that identified as Medicare Select; excludes plans where number of covered lives was less than 20.SOURCE: K. Desmond, T. Rice, and Kaiser Family Foundation analysis of 2006 – 2010 National Association of Insurance Commissioners (NAIC) Medicare Supplement data. CMS Medicare and Medicaid Statistical Supplement: Medicare Enrollment 2009, released September 30, 2010.
National Average = 3.0%
Less than 1.0%(6 states)
1.0% - 1.9%(8 states, DC)
2.0% - 2.9%(15 states)
3.0% - 3.9%(7 states)
4.0% - 4.9%(9 states)
5.0% or more(4 states)
0.0%1.3%
1.2% 4.7%
N/A3.1%
4.5%
1.8%
DC 1.9%
2.8%
3.0%
0.7%
3.1%
2.2% 2.4%
3.5%
4.6% 1.0%
0.1%
5.2%
4.5%
-0.2%-6.5%
2.3%
3.2%
4.1%
1.7%
5.0%2.8%
5.0%
4.2%
2.4%
4.2%
2.2%
2.7%
2.6%
1.8%
0.5%
5.3%3.0%
2.3%
4.1%
2.5%
1.5%
2.1%
4.8%
0.5%
2.9%
1.9%
2.5%2.0%
3.9%
MEDIGAP: Spotlight on EnrollmEnt, prEmiumS, and rEcEnt trEndS 13
EXHIBIT 12EXHIBIT 12
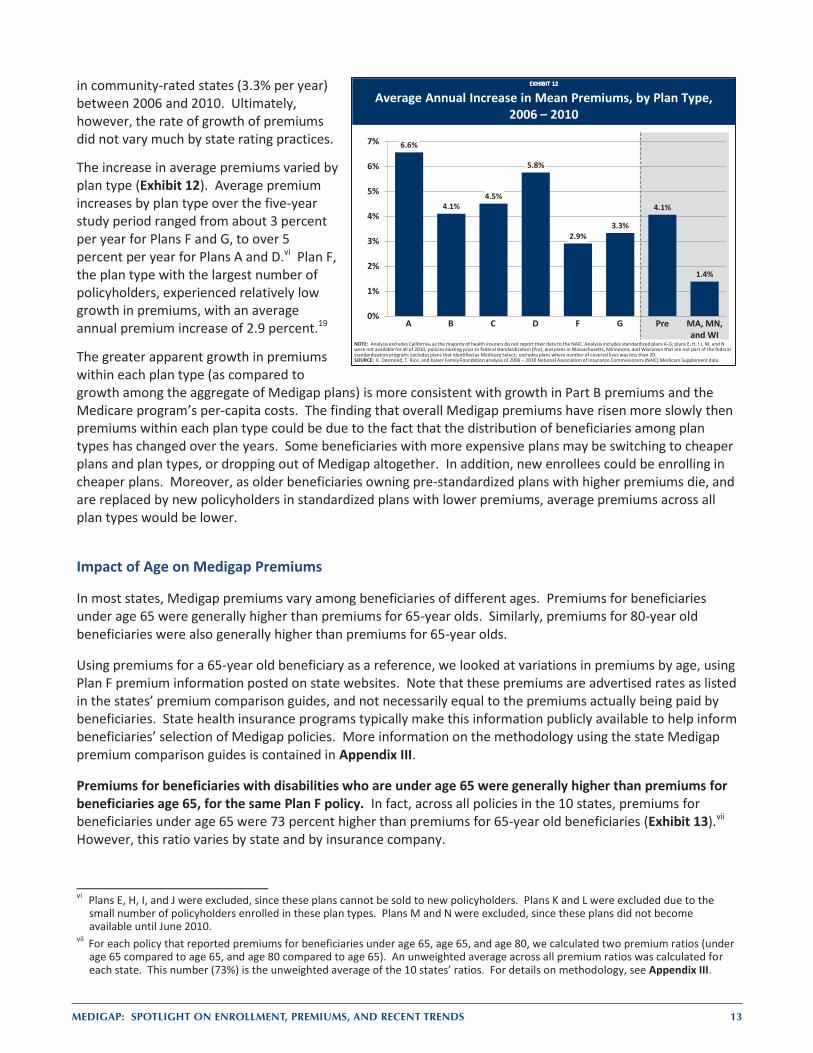
Average Annual Increase in Mean Premiums, by Plan Type, 2006 – 2010
6.6%
4.1%4.5%
5.8%
2.9%3.3%
4.1%
1.4%
0%
1%
2%
3%
4%
5%
6%
7%
NOTE: Analysis excludes California, as the majority of health insurers do not report their data to the NAIC. Analysis includes standardized plans A-G; plans E, H, I J, M, and N were not available for all of 2010, policies existing prior to federal standardization (Pre), and plans in Massachusetts, Minnesota, and Wisconsin that are not part of the federal standardization program; excludes plans that identified as Medicare Select; excludes plans where number of covered lives was less than 20.SOURCE: K. Desmond, T. Rice, and Kaiser Family Foundation analysis of 2006 – 2010 National Association of Insurance Commissioners (NAIC) Medicare Supplement data.
A B C D F G Pre MA, MN, and WI
in community-rated states (3.3% per year) between 2006 and 2010. Ultimately, however, the rate of growth of premiums did not vary much by state rating practices.
The increase in average premiums varied by plan type (Exhibit 12). Average premium increases by plan type over the five-year study period ranged from about 3 percent per year for Plans F and G, to over 5 percent per year for Plans A and D.vi Plan F, the plan type with the largest number of policyholders, experienced relatively low growth in premiums, with an average annual premium increase of 2.9 percent.19
The greater apparent growth in premiums within each plan type (as compared to growth among the aggregate of Medigap plans) is more consistent with growth in Part B premiums and the Medicare program’s per-capita costs. The finding that overall Medigap premiums have risen more slowly then premiums within each plan type could be due to the fact that the distribution of beneficiaries among plan types has changed over the years. Some beneficiaries with more expensive plans may be switching to cheaper plans and plan types, or dropping out of Medigap altogether. In addition, new enrollees could be enrolling in cheaper plans. Moreover, as older beneficiaries owning pre-standardized plans with higher premiums die, and are replaced by new policyholders in standardized plans with lower premiums, average premiums across all plan types would be lower.
Impact of Age on Medigap Premiums
In most states, Medigap premiums vary among beneficiaries of different ages. Premiums for beneficiaries under age 65 were generally higher than premiums for 65-year olds. Similarly, premiums for 80-year old beneficiaries were also generally higher than premiums for 65-year olds.
Using premiums for a 65-year old beneficiary as a reference, we looked at variations in premiums by age, using Plan F premium information posted on state websites. Note that these premiums are advertised rates as listed in the states’ premium comparison guides, and not necessarily equal to the premiums actually being paid by beneficiaries. State health insurance programs typically make this information publicly available to help inform beneficiaries’ selection of Medigap policies. More information on the methodology using the state Medigap premium comparison guides is contained in Appendix III.
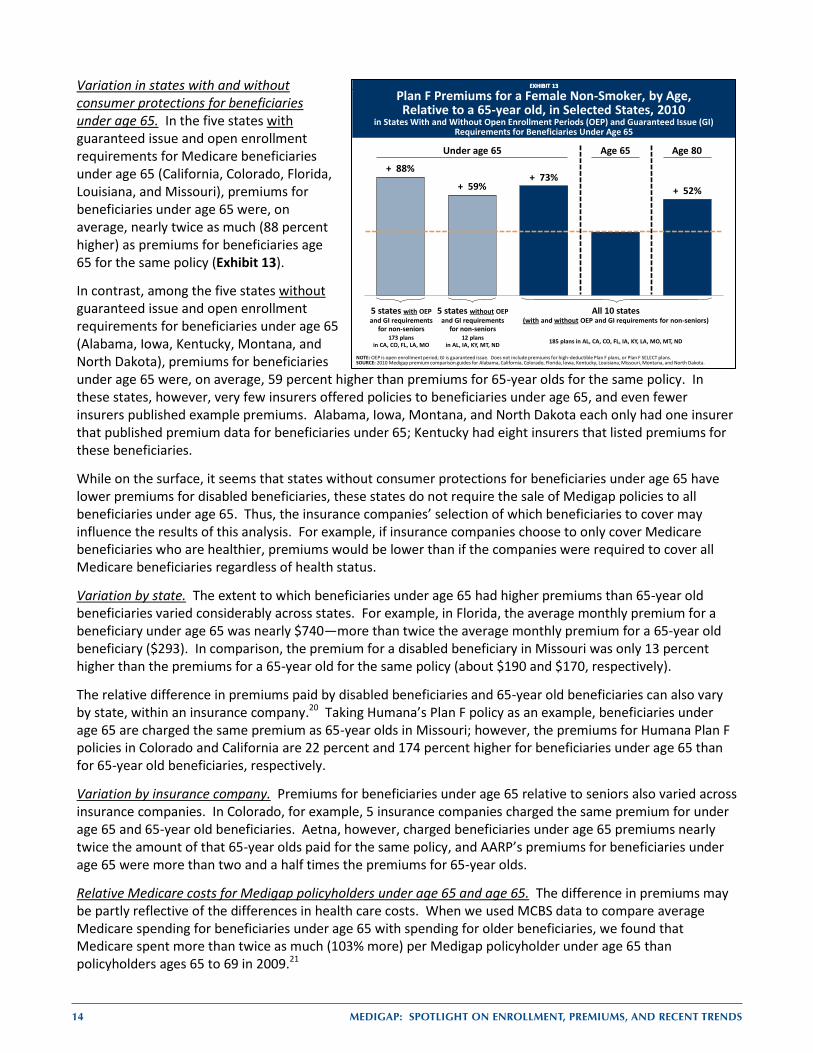
Premiums for beneficiaries with disabilities who are under age 65 were generally higher than premiums for beneficiaries age 65, for the same Plan F policy. In fact, across all policies in the 10 states, premiums for beneficiaries under age 65 were 73 percent higher than premiums for 65-year old beneficiaries (Exhibit 13).vii However, this ratio varies by state and by insurance company.
vi Plans E, H, I, and J were excluded, since these plans cannot be sold to new policyholders. Plans K and L were excluded due to the
small number of policyholders enrolled in these plan types. Plans M and N were excluded, since these plans did not become available until June 2010.
vii For each policy that reported premiums for beneficiaries under age 65, age 65, and age 80, we calculated two premium ratios (under age 65 compared to age 65, and age 80 compared to age 65). An unweighted average across all premium ratios was calculated for each state. This number (73%) is the unweighted average of the 10 states’ ratios. For details on methodology, see Appendix III.
14 MEDIGAP: Spotlight on EnrollmEnt, prEmiumS, and rEcEnt trEndS
EXHIBIT 13EXHIBIT 13
+ 88%
+ 59%+ 73%
+ 52%
Plan F Premiums for a Female Non-Smoker, by Age, Relative to a 65-year old, in Selected States, 2010
in States With and Without Open Enrollment Periods (OEP) and Guaranteed Issue (GI) Requirements for Beneficiaries Under Age 65
NOTE: OEP is open enrollment period; GI is guaranteed issue. Does not include premiums for high-deductible Plan F plans, or Plan F SELECT plans.SOURCE: 2010 Medigap premium comparison guides for Alabama, California, Colorado, Florida, Iowa, Kentucky, Louisiana, Missouri, Montana, and North Dakota.
5 states with OEP and GI requirements
for non-seniors
5 states without OEP and GI requirements
for non-seniors
All 10 states (with and without OEP and GI requirements for non-seniors)
173 plansin CA, CO, FL, LA, MO
12 plansin AL, IA, KY, MT, ND 185 plans in AL, CA, CO, FL, IA, KY, LA, MO, MT, ND
Under age 65 Age 65 Age 80
Variation in states with and without consumer protections for beneficiaries under age 65. In the five states with guaranteed issue and open enrollment requirements for Medicare beneficiaries under age 65 (California, Colorado, Florida, Louisiana, and Missouri), premiums for beneficiaries under age 65 were, on average, nearly twice as much (88 percent higher) as premiums for beneficiaries age 65 for the same policy (Exhibit 13).
In contrast, among the five states without guaranteed issue and open enrollment requirements for beneficiaries under age 65 (Alabama, Iowa, Kentucky, Montana, and North Dakota), premiums for beneficiaries under age 65 were, on average, 59 percent higher than premiums for 65-year olds for the same policy. In these states, however, very few insurers offered policies to beneficiaries under age 65, and even fewer insurers published example premiums. Alabama, Iowa, Montana, and North Dakota each only had one insurer that published premium data for beneficiaries under 65; Kentucky had eight insurers that listed premiums for these beneficiaries.
While on the surface, it seems that states without consumer protections for beneficiaries under age 65 have lower premiums for disabled beneficiaries, these states do not require the sale of Medigap policies to all beneficiaries under age 65. Thus, the insurance companies’ selection of which beneficiaries to cover may influence the results of this analysis. For example, if insurance companies choose to only cover Medicare beneficiaries who are healthier, premiums would be lower than if the companies were required to cover all Medicare beneficiaries regardless of health status.
Variation by state. The extent to which beneficiaries under age 65 had higher premiums than 65-year old beneficiaries varied considerably across states. For example, in Florida, the average monthly premium for a beneficiary under age 65 was nearly $740—more than twice the average monthly premium for a 65-year old beneficiary ($293). In comparison, the premium for a disabled beneficiary in Missouri was only 13 percent higher than the premiums for a 65-year old for the same policy (about $190 and $170, respectively).
The relative difference in premiums paid by disabled beneficiaries and 65-year old beneficiaries can also vary by state, within an insurance company.20 Taking Humana’s Plan F policy as an example, beneficiaries under age 65 are charged the same premium as 65-year olds in Missouri; however, the premiums for Humana Plan F policies in Colorado and California are 22 percent and 174 percent higher for beneficiaries under age 65 than for 65-year old beneficiaries, respectively.
Variation by insurance company. Premiums for beneficiaries under age 65 relative to seniors also varied across insurance companies. In Colorado, for example, 5 insurance companies charged the same premium for under age 65 and 65-year old beneficiaries. Aetna, however, charged beneficiaries under age 65 premiums nearly twice the amount of that 65-year olds paid for the same policy, and AARP’s premiums for beneficiaries under age 65 were more than two and a half times the premiums for 65-year olds.
Relative Medicare costs for Medigap policyholders under age 65 and age 65. The difference in premiums may be partly reflective of the differences in health care costs. When we used MCBS data to compare average Medicare spending for beneficiaries under age 65 with spending for older beneficiaries, we found that Medicare spent more than twice as much (103% more) per Medigap policyholder under age 65 than policyholders ages 65 to 69 in 2009.21
MEDIGAP: Spotlight on EnrollmEnt, prEmiumS, and rEcEnt trEndS 15
Premiums for older beneficiaries (age 80) were generally higher than those for beneficiaries age 65, for the same policy. Across the policies in the 10 states used in this analysis, premiums for 80-year olds averaged 52 percent higher than premiums for 65-year olds.
Variation by state. The extent to which 80-year old beneficiaries had higher premiums than 65-year olds varied by state. In Florida, the average monthly premium for an 80-year old beneficiary is $392, or about 34 percent higher than the average premium for a 65-year old ($293). In California, the average monthly premium for an 80-year old beneficiary was $279; while this premium is lower than the average premium for 80-year olds in Florida, it is nearly 60 percent higher than the average premium of $177 for 65-year olds in California.
The extent to which 80-year olds have higher premiums than 65-year olds can vary within an insurance company. Again, taking Humana’s Plan F policy as an example, 80-year olds in Florida pay 23 percent more than 65-year olds in their state, whereas 80-year olds in California pay 63 percent more than 65-year olds.
Variation by insurance company. Premiums for 80-year old beneficiaries relative to 65-year old beneficiaries also varied across insurance companies. Using Colorado as an example, 80-year olds may pay premiums from 24 percent to 109 percent higher than 65-year olds, for the same policy in 2011.
Relative Medicare costs for Medigap policyholders age 65 and age 80. The difference in premiums could likely reflect the differences in health care costs for this age group. We examined the costs for beneficiaries age 80 or older, and compared this to the average cost of beneficiaries ages 65 to 69. In this case, the premium ratio is the same as the ratio of average per capita Medicare spending for Medigap policyholders in these two age groups. That is, in 2009, Medicare spent 52 percent more per Medigap policyholder age 80 or older, compared to policyholders ages 65 to 69.21
Impact of Gender on Premiums
We examined plan F premiums listed for 65-year old females and males to examine the effect of gender on premiums. Among younger adults, health care premiums tend to be higher for women than men; however, Medigap premiums are typically lower for female policyholders than for male policyholders.
Premiums for male beneficiaries were generally higher than those for female beneficiaries for the same policy. Among the plans that were used in this analysis, premiums for men were generally somewhat higher than those for women, based on Plan F. For example, premiums for male beneficiaries in the five states used in this analysis were 8 percent higher than premiums for female beneficiaries for the same policy, on average. Some insurance companies charged men and women the same premiums, whereas other insurance companies charged men premiums up to 20 percent higher than premiums for women. Premiums for men relative to women ranged from 6 percent higher for men than women in Florida, to 10 percent higher for men than women in Louisiana.
This difference in Medigap premiums may reflect the difference in Medicare costs. Among beneficiaries with Medigap, Medicare spent 8 percent more per male policyholder, compared to female policyholders, based on the Kaiser Family Foundation analysis of the Medicare Current Beneficiary Survey (MCBS) 2009 Cost and Use File.
16 MEDIGAP: Spotlight on EnrollmEnt, prEmiumS, and rEcEnt trEndS
Impact of Smoking on Premiums
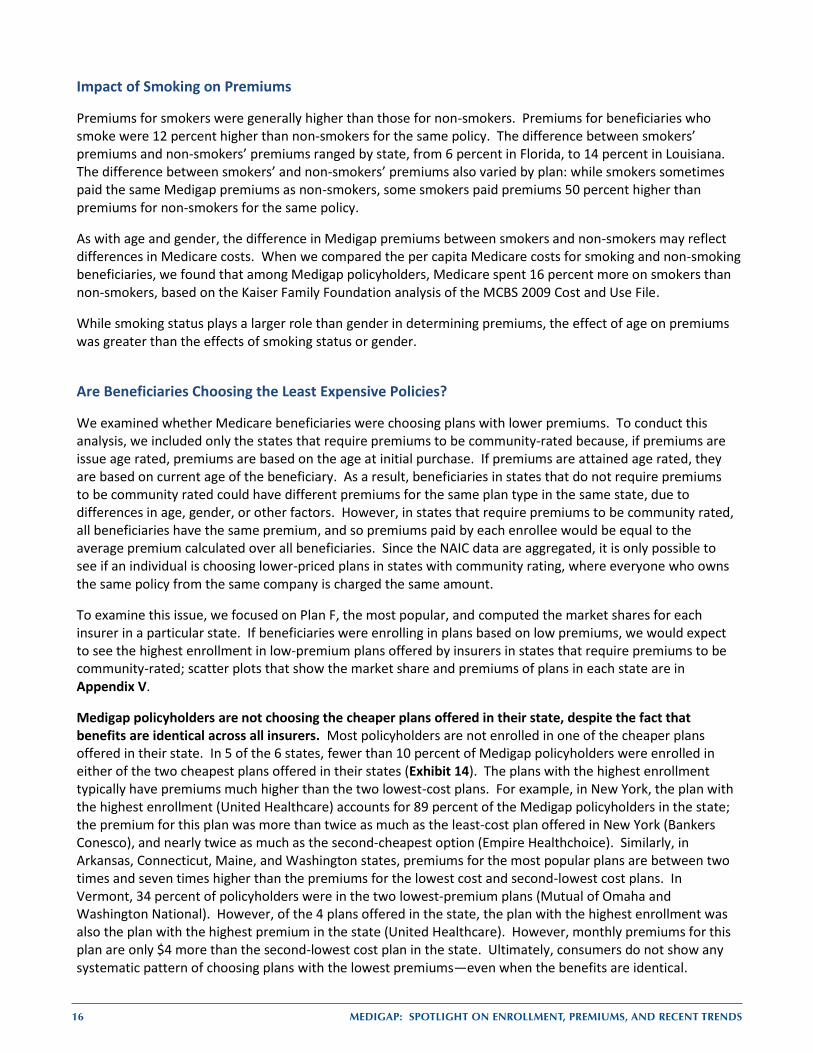
Premiums for smokers were generally higher than those for non-smokers. Premiums for beneficiaries who smoke were 12 percent higher than non-smokers for the same policy. The difference between smokers’ premiums and non-smokers’ premiums ranged by state, from 6 percent in Florida, to 14 percent in Louisiana. The difference between smokers’ and non-smokers’ premiums also varied by plan: while smokers sometimes paid the same Medigap premiums as non-smokers, some smokers paid premiums 50 percent higher than premiums for non-smokers for the same policy.
As with age and gender, the difference in Medigap premiums between smokers and non-smokers may reflect differences in Medicare costs. When we compared the per capita Medicare costs for smoking and non-smoking beneficiaries, we found that among Medigap policyholders, Medicare spent 16 percent more on smokers than non-smokers, based on the Kaiser Family Foundation analysis of the MCBS 2009 Cost and Use File.
While smoking status plays a larger role than gender in determining premiums, the effect of age on premiums was greater than the effects of smoking status or gender.
Are Beneficiaries Choosing the Least Expensive Policies?
We examined whether Medicare beneficiaries were choosing plans with lower premiums. To conduct this analysis, we included only the states that require premiums to be community-rated because, if premiums are issue age rated, premiums are based on the age at initial purchase. If premiums are attained age rated, they are based on current age of the beneficiary. As a result, beneficiaries in states that do not require premiums to be community rated could have different premiums for the same plan type in the same state, due to differences in age, gender, or other factors. However, in states that require premiums to be community rated, all beneficiaries have the same premium, and so premiums paid by each enrollee would be equal to the average premium calculated over all beneficiaries. Since the NAIC data are aggregated, it is only possible to see if an individual is choosing lower-priced plans in states with community rating, where everyone who owns the same policy from the same company is charged the same amount.
To examine this issue, we focused on Plan F, the most popular, and computed the market shares for each insurer in a particular state. If beneficiaries were enrolling in plans based on low premiums, we would expect to see the highest enrollment in low-premium plans offered by insurers in states that require premiums to be community-rated; scatter plots that show the market share and premiums of plans in each state are in Appendix V.
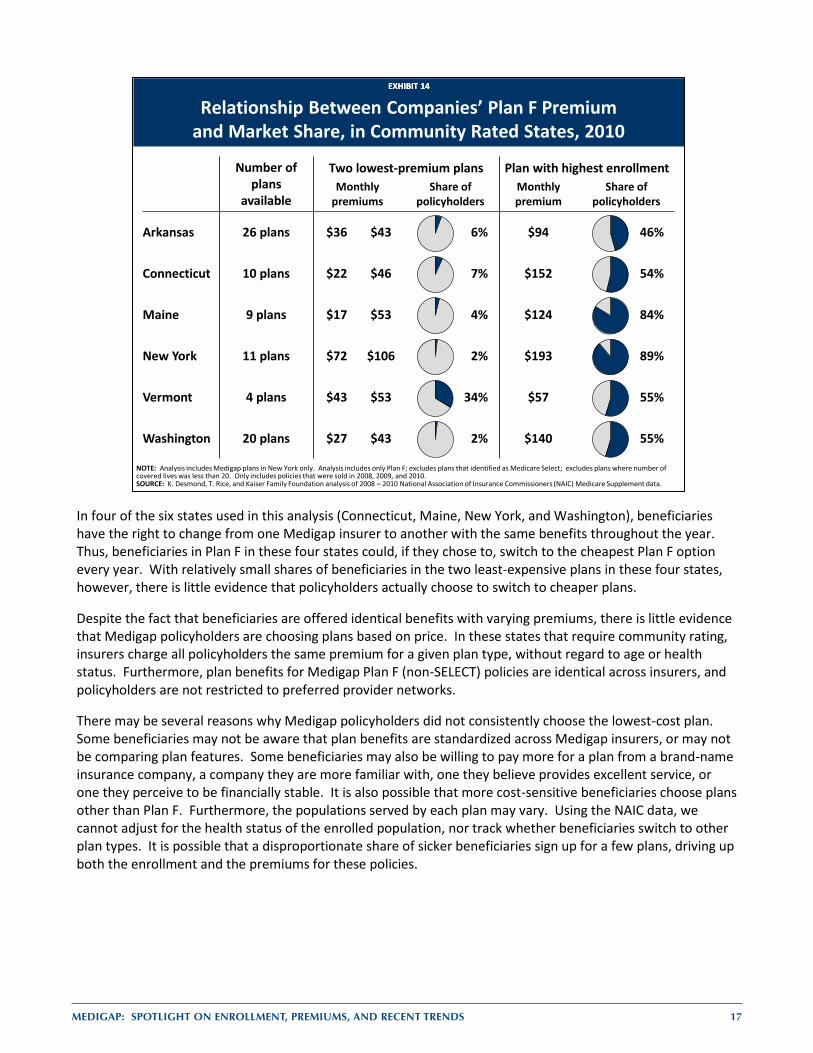
Medigap policyholders are not choosing the cheaper plans offered in their state, despite the fact that benefits are identical across all insurers. Most policyholders are not enrolled in one of the cheaper plans offered in their state. In 5 of the 6 states, fewer than 10 percent of Medigap policyholders were enrolled in either of the two cheapest plans offered in their states (Exhibit 14). The plans with the highest enrollment typically have premiums much higher than the two lowest-cost plans. For example, in New York, the plan with the highest enrollment (United Healthcare) accounts for 89 percent of the Medigap policyholders in the state; the premium for this plan was more than twice as much as the least-cost plan offered in New York (Bankers Conesco), and nearly twice as much as the second-cheapest option (Empire Healthchoice). Similarly, in Arkansas, Connecticut, Maine, and Washington states, premiums for the most popular plans are between two times and seven times higher than the premiums for the lowest cost and second-lowest cost plans. In Vermont, 34 percent of policyholders were in the two lowest-premium plans (Mutual of Omaha and Washington National). However, of the 4 plans offered in the state, the plan with the highest enrollment was also the plan with the highest premium in the state (United Healthcare). However, monthly premiums for this plan are only $4 more than the second-lowest cost plan in the state. Ultimately, consumers do not show any systematic pattern of choosing plans with the lowest premiums—even when the benefits are identical.
MEDIGAP: Spotlight on EnrollmEnt, prEmiumS, and rEcEnt trEndS 17
In four of the six states used in this analysis (Connecticut, Maine, New York, and Washington), beneficiaries have the right to change from one Medigap insurer to another with the same benefits throughout the year. Thus, beneficiaries in Plan F in these four states could, if they chose to, switch to the cheapest Plan F option every year. With relatively small shares of beneficiaries in the two least-expensive plans in these four states, however, there is little evidence that policyholders actually choose to switch to cheaper plans.
Despite the fact that beneficiaries are offered identical benefits with varying premiums, there is little evidence that Medigap policyholders are choosing plans based on price. In these states that require community rating, insurers charge all policyholders the same premium for a given plan type, without regard to age or health status. Furthermore, plan benefits for Medigap Plan F (non-SELECT) policies are identical across insurers, and policyholders are not restricted to preferred provider networks.
There may be several reasons why Medigap policyholders did not consistently choose the lowest-cost plan. Some beneficiaries may not be aware that plan benefits are standardized across Medigap insurers, or may not be comparing plan features. Some beneficiaries may also be willing to pay more for a plan from a brand-name insurance company, a company they are more familiar with, one they believe provides excellent service, or one they perceive to be financially stable. It is also possible that more cost-sensitive beneficiaries choose plans other than Plan F. Furthermore, the populations served by each plan may vary. Using the NAIC data, we cannot adjust for the health status of the enrolled population, nor track whether beneficiaries switch to other plan types. It is possible that a disproportionate share of sicker beneficiaries sign up for a few plans, driving up both the enrollment and the premiums for these policies.
EXHIBIT 14EXHIBIT 14
Relationship Between Companies’ Plan F Premium and Market Share, in Community Rated States, 2010
NOTE: Analysis includes Medigap plans in New York only. Analysis includes only Plan F; excludes plans that identified as Medicare Select; excludes plans where number of covered lives was less than 20. Only includes policies that were sold in 2008, 2009, and 2010.SOURCE: K. Desmond, T. Rice, and Kaiser Family Foundation analysis of 2008 – 2010 National Association of Insurance Commissioners (NAIC) Medicare Supplement data.
Number of plans
available
Two lowest-premium plans Plan with highest enrollmentMonthly
premiumsShare of
policyholdersMonthly premium
Share of policyholders
Arkansas 26 plans $36 $43 6% $94 46%
Connecticut 10 plans $22 $46 7% $152 54%
Maine 9 plans $17 $53 4% $124 84%
New York 11 plans $72 $106 2% $193 89%
Vermont 4 plans $43 $53 34% $57 55%
Washington 20 plans $27 $43 2% $140 55%
18 MEDIGAP: Spotlight on EnrollmEnt, prEmiumS, and rEcEnt trEndS
DISCUSSION
Medigap continues to play a key role in providing supplemental coverage for people on Medicare, particularly among those who do not have access to employer-sponsored retiree health benefits and do not qualify for Medicaid. Today, nearly one quarter of the Medicare population (24%) has a Medigap policy, with higher Medigap enrollment rates among beneficiaries living in rural states. The majority of Medigap policyholders (54%) are enrolled in plans that provide what is known as first-dollar coverage; these plans cover Part A and B deductibles along with other Medicare cost-sharing requirements. Plans with first-dollar coverage are relatively popular because they minimize enrollees’ financial exposure to out-of-pocket costs for Medicare-covered services, and shield beneficiaries from some of the hassles associated with handling health insurance bills.
In recent years, some policymakers have proposed to restrict or discourage Medigap coverage, as part of a broader effort to reduce the debt and deficit. Restrictions on Medigap coverage would be expected to increase cost-sharing obligations among beneficiaries which could discourage beneficiaries from seeking Medicare-covered services. Medicare savings would be achieved if beneficiaries forego services because of costs. Some have proposed a premium surcharge on supplemental policies, both Medigap and employer-sponsored retiree health coverage (e.g., MedPAC, 2012). Some would prohibit first-dollar Medigap coverage (e.g., Bowles-Simpson, 2010). Still others would impose a premium penalty on first-dollar Medigap coverage, but apply the surcharge prospectively to new enrollees rather than current policyholders (President’s Plan for Economic Growth and Deficit Reduction, 2011).
Proposals to restrict or discourage Medigap coverage could have cost implications for beneficiaries. For example, a surcharge on Medigap policyholders in 2010 would have raised premiums for as many as 9 million beneficiaries (unless they dropped their policies to avoid the surcharge). A premium surcharge on beneficiaries with first-dollar Medigap coverage in 2010 would have raised premiums for up to five million Medigap policyholders with Plans C or F. A premium surcharge applied prospectively would not affect current Medigap policyholders; presumably fewer beneficiaries would choose first-dollar coverage in the future. Restrictions on first-dollar Medigap coverage could also result in a reduction in Medigap premiums, if policies cover a smaller share of total claims. As a result, some beneficiaries could see lower total out-of-pocket costs (including premiums). However, a greater share of policyholders in relatively poor health or with one or more hospital admissions during the year could see costs rise. Furthermore, if cost-sharing were required for all Medigap plans, there is some evidence that utilization would decrease across several types of services (including necessary services and preventive services), leading to more costly care in the long term.22,23
Medigap enrollment has remained relatively stable between 2006 and 2010, despite the emergence of alternative sources of coverage, especially Medicare Advantage. During this period, Medigap premiums have grown slower than Medicare Part B premiums or total Medicare per capita costs, although aggregate data may mask Medigap premium changes for smaller subgroups.
Looking ahead, Medigap may continue to play an important role in supplementing Medicare, particularly if Medicare Advantage coverage erodes in response to payment reductions in the Affordable Care Act, and if employers continue to scale back on providing retiree health coverage. Further, if Medicare cost-sharing requirements are increased as part of deficit reduction efforts, the demand for Medigap may rise as beneficiaries seek additional financial protection against these costs. Conversely, the demand for Medigap could diminish over time if policymakers enact changes to discourage or prohibit beneficiaries from purchasing Medigap policies as part of the broader effort to reduce the growth in Medicare spending.
MEDIGAP: Spotlight on EnrollmEnt, prEmiumS, and rEcEnt trEndS 19
APPE
NDI
X I:
Age
Ratin
g Ru
les a
nd C
onsu
mer
Pro
tect
ions
for B
enef
icia
ries u
nder
age
65,
by
Stat
e
Guar
ante
ed Is
sue
Requ
irem
ent
(insu
ranc
e co
mpa
nies
offe
r at l
east
on
e pl
an to
thos
e un
der a
ge 6
5)
Ope
n En
rollm
ent P
erio
d Re
quire
men
t(p
erio
d of
tim
e w
hen
bene
ficia
ry h
as
guar
ante
ed is
sue
right
s, an
d av
aila
ble
polic
ies c
anno
t be
unde
rwrit
ten)
Requ
ire sa
me
prem
ium
fo
r sen
iors
and
no
n-se
nior
s
Requ
ire sa
me
prem
ium
fo
r all
non-
seni
ors
Alab
ama
Atta
ined
Age
Rat
ing
No
requ
irem
ent
Non
eN
oN
o
Alas
kaAt
tain
ed A
ge R
atin
gN
o re
quire
men
tN
one
No
No
Ariz
ona
Issu
e Ag
e Ra
ting
No
requ
irem
ent
Non
eN
oN
o
Arka
nsas
Com
mun
ity R
atin
gN
o re
quire
men
tN
one
No
No
Calif
orni
a*At
tain
ed A
ge R
atin
gDi
sabl
edDi
sabl
edN
oN
o
Colo
rado
Atta
ined
Age
Rat
ing
Disa
bled
and
ESR
DDi
sabl
ed a
nd E
SRD
No
Yes
Conn
ectic
ut*
Com
mun
ity R
atin
gDi
sabl
ed a
nd E
SRD
Disa
bled
and
ESR
DSa
me
prem
ium
as a
ll ot
her M
edic
are
bene
ficia
ries
Yes
Dela
war
eAt
tain
ed A
ge R
atin
gES
RDES
RDN
oN
oDi
stric
t of
Colu
mbi
aAt
tain
ed A
ge R
atin
gN
o re
quire
men
tN
one
No
No
Flor
ida
Issu
e Ag
e Ra
ting
Disa
bled
and
ESR
DDi
sabl
ed a
nd E
SRD
No
Yes
Geor
gia
Issu
e Ag
e Ra
ting
Disa
bled
and
ESR
DDi
sabl
ed a
nd E
SRD
No
No
Haw
aii
Atta
ined
Age
Rat
ing
Disa
bled
and
ESR
DDi
sabl
ed a
nd E
SRD
Sam
e pr
emiu
m a
s be
nefic
iarie
s age
65
Yes,
dur
ing
the
open
enr
ollm
ent p
erio
dId
aho
Issu
e Ag
e Ra
ting
No
requ
irem
ent
Non
eN
oN
o
Illin
ois
Atta
ined
Age
Rat
ing
Disa
bled
and
ESR
DDi
sabl
edN
o m
ore
than
high
est a
dver
tised
rate
Ye
s
Indi
ana
Atta
ined
Age
Rat
ing
No
requ
irem
ent
Non
eN
oN
o
Iow
aAt
tain
ed A
ge R
atin
gN
o re
quire
men
tN
one
No
No
Kans
asAt
tain
ed A
ge R
atin
gDi
sabl
ed a
nd E
SRD
Disa
bled
and
ESR
DSa
me
prem
ium
as
bene
ficia
ries a
ge 6
5Ye
s
Kent
ucky
Atta
ined
Age
Rat
ing
No
requ
irem
ent
Non
eN
oN
o
Loui
sian
aAt
tain
ed A
ge R
atin
gDi
sabl
ed a
nd E
SRD
Disa
bled
and
ESR
DN
oN
o
Mai
ne*
Com
mun
ity R
atin
gDi
sabl
ed a
nd E
SRD
Disa
bled
and
ESR
DSa
me
prem
ium
as a
ll ot
her M
edic
are
bene
ficia
ries
Yes
Stat
ePr
emiu
m
Ratin
g Ru
le
Requ
irem
ents
for B
enef
icia
ries u
nder
age
65
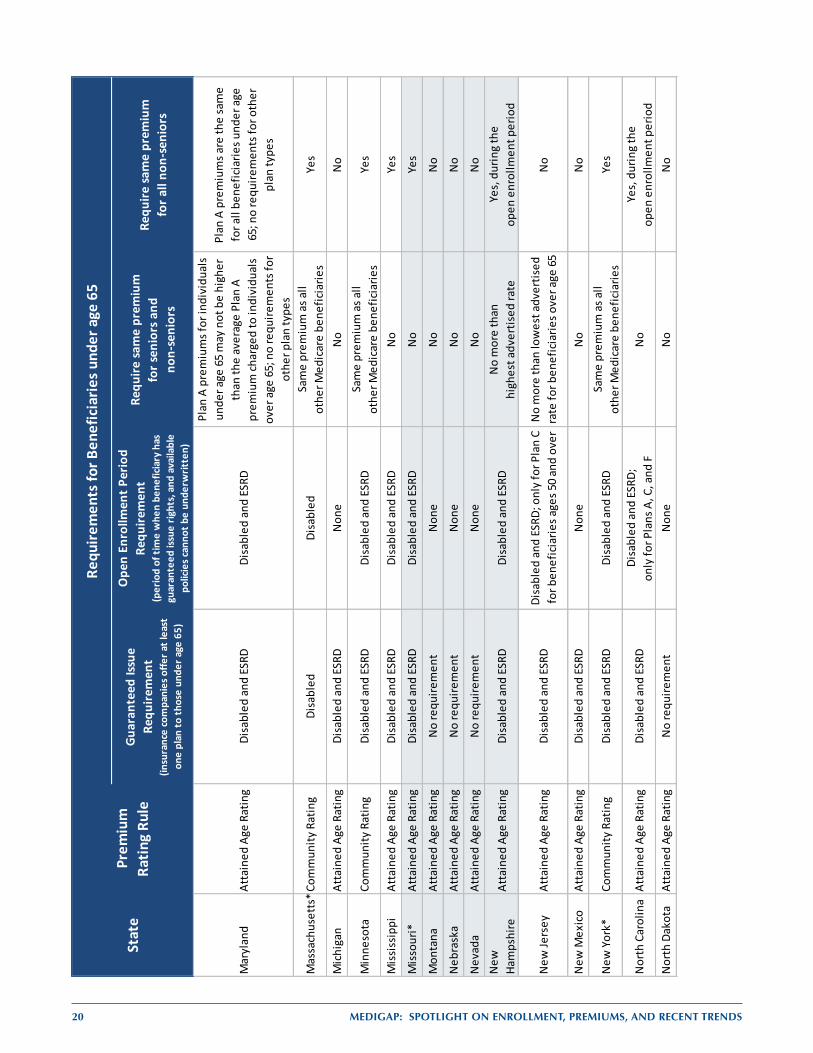
20 MEDIGAP: Spotlight on EnrollmEnt, prEmiumS, and rEcEnt trEndS
Guar
ante
ed Is
sue
Requ
irem
ent
(insu
ranc
e co
mpa
nies
offe
r at l
east
on
e pl
an to
thos
e un
der a
ge 6
5)
Ope
n En
rollm
ent P
erio
d Re
quire
men
t(p
erio
d of
tim
e w
hen
bene
ficia
ry h
as
guar
ante
ed is
sue
right
s, an
d av
aila
ble
polic
ies c
anno
t be
unde
rwrit
ten)
Requ
ire sa
me
prem
ium
fo
r sen
iors
and
no
n-se
nior
s
Requ
ire sa
me
prem
ium
fo
r all
non-
seni
ors
Mar
ylan
dAt
tain
ed A
ge R
atin
gDi
sabl
ed a
nd E
SRD
Disa
bled
and
ESR
D
Plan
A p
rem
ium
s for
indi
vidu
als
unde
r age
65
may
not
be
high
er
than
the
aver
age
Plan
A
prem
ium
char
ged
to in
divi
dual
s ov
er a
ge 6
5; n
o re
quire
men
ts fo
r ot
her p
lan
type
s
Plan
A p
rem
ium
s are
the
sam
e fo
r all
bene
ficia
ries u
nder
age
65
; no
requ
irem
ents
for o
ther
pl
an ty
pes
Mas
sach
uset
ts*C
omm
unity
Rat
ing
Disa
bled
Disa
bled
Sam
e pr
emiu
m a
s all
othe
r Med
icar
e be
nefic
iarie
sYe
s
Mic
higa
nAt
tain
ed A
ge R
atin
gDi
sabl
ed a
nd E
SRD
Non
eN
oN
o
Min
neso
taCo
mm
unity
Rat
ing
Disa
bled
and
ESR
DDi
sabl
ed a
nd E
SRD
Sam
e pr
emiu
m a
s all
othe
r Med
icar
e be
nefic
iarie
sYe
s
Mis
siss
ippi
Atta
ined
Age
Rat
ing
Disa
bled
and
ESR
DDi
sabl
ed a
nd E
SRD
No
Yes
Mis
sour
i*At
tain
ed A
ge R
atin
gDi
sabl
ed a
nd E
SRD
Disa
bled
and
ESR
DN
oYe
s
Mon
tana
Atta
ined
Age
Rat
ing
No
requ
irem
ent
Non
eN
oN
o
Neb
rask
aAt
tain
ed A
ge R
atin
gN
o re
quire
men
tN
one
No
No
Nev
ada
Atta
ined
Age
Rat
ing
No
requ
irem
ent
Non
eN
oN
oN
ew
Ham
pshi
reAt
tain
ed A
ge R
atin
gDi
sabl
ed a
nd E
SRD
Disa
bled
and
ESR
DN
o m
ore
than
high
est a
dver
tised
rate
Ye
s, d
urin
g th
e op
en e
nrol
lmen
t per
iod
New
Jers
eyAt
tain
ed A
ge R
atin
gDi
sabl
ed a
nd E
SRD
Disa
bled
and
ESR
D; o
nly
for P
lan
C fo
r ben
efic
iarie
s age
s 50
and
over
No
mor
e th
an lo
wes
t adv
ertis
ed
rate
for b
enef
icia
ries o
ver a
ge 6
5N
o
New
Mex
ico
Atta
ined
Age
Rat
ing
Disa
bled
and
ESR
DN
one
No
No
New
Yor
k*Co
mm
unity
Rat
ing
Disa
bled
and
ESR
DDi
sabl
ed a
nd E
SRD
Sam
e pr
emiu
m a
s all
othe
r Med
icar
e be
nefic
iarie
sYe
s
Nor
th C
arol
ina
Atta
ined
Age
Rat
ing
Disa
bled
and
ESR
DDi
sabl
ed a
nd E
SRD;
on
ly fo
r Pla
ns A
, C, a
nd F
No
Yes,
dur
ing
the
open
enr
ollm
ent p
erio
dN
orth
Dak
ota
Atta
ined
Age
Rat
ing
No
requ
irem
ent
Non
eN
oN
o
Stat
ePr
emiu
m
Ratin
g Ru
le
Requ
irem
ents
for B
enef
icia
ries u
nder
age
65
Guar
ante
ed Is
sue
Requ
irem
ent
(insu
ranc
e co
mpa
nies
offe
r at l
east
on
e pl
an to
thos
e un
der a
ge 6
5)
Ope
n En
rollm
ent P
erio
d Re
quire
men
t(p
erio
d of
tim
e w
hen
bene
ficia
ry h
as
guar
ante
ed is
sue
right
s, an
d av
aila
ble
polic
ies c
anno
t be
unde
rwrit
ten)
Requ
ire sa
me
prem
ium
fo
r sen
iors
and
no
n-se
nior
s
Requ
ire sa
me
prem
ium
fo
r all
non-
seni
ors
Ohi
oAt
tain
ed A
ge R
atin
gN
o re
quire
men
tN
one
No
No
Okl
ahom
aAt
tain
ed A
ge R
atin
gDi
sabl
ed a
nd E
SRD
Disa
bled
and
ESR
D;on
ly fo
r Pla
n A
No
No
Ore
gon
Atta
ined
Age
Rat
ing
Disa
bled
and
ESR
DDi
sabl
ed a
nd E
SRD
Sam
e pr
emiu
m a
s be
nefic
iarie
s age
65
Yes
Penn
sylv
ania
Atta
ined
Age
Rat
ing
Disa
bled
and
ESR
DDi
sabl
ed a
nd E
SRD
Sam
e pr
emiu
m a
s be
nefic
iarie
s age
65
Yes
Rhod
e Is
land
Atta
ined
Age
Rat
ing
No
requ
irem
ent
Non
eN
oN
o
Sout
h Ca
rolin
aAt
tain
ed A
ge R
atin
gN
o re
quire
men
tN
one
No
No
Sout
h Da
kota
Atta
ined
Age
Rat
ing
Disa
bled
and
ESR
DDi
sabl
ed a
nd E
SRD
Sam
e pr
emiu
m a
s be
nefic
iarie
s age
75
Yes
Tenn
esse
eAt
tain
ed A
ge R
atin
gDi
sabl
ed a
nd E
SRD
Disa
bled
and
ESR
DN
oN
o
Texa
sAt
tain
ed A
ge R
atin
gDi
sabl
ed a
nd E
SRD
Disa
bled
and
ESR
DN
oYe
s, d
urin
g th
e op
en e
nrol
lmen
t per
iod
Utah
Atta
ined
Age
Rat
ing
No
requ
irem
ent
Non
eN
oN
o
Verm
ont
Com
mun
ity R
atin
gDi
sabl
edDi
sabl
edN
oYe
s
Virg
inia
Atta
ined
Age
Rat
ing
No
requ
irem
ent
Non
eN
oN
o
Was
hing
ton*
Com
mun
ity R
atin
gN
o re
quire
men
tN
one
No
Yes
Wes
t Virg
inia
Atta
ined
Age
Rat
ing
No
requ
irem
ent
Non
eN
oN
o
Wis
cons
inAt
tain
ed A
ge R
atin
gDi
sabl
ed a
nd E
SRD
Disa
bled
and
ESR
DN
oYe
s
Wyo
min
gAt
tain
ed A
ge R
atin
gN
o re
quire
men
tN
one
No
No
* So
me
stat
es h
ave
addi
tiona
l ope
n en
rollm
ent r
equi
rem
ents
for M
edig
ap p
olic
yhol
ders
. Ca
lifor
nia
has a
n an
nual
ope
n en
rollm
ent p
erio
d w
ithin
30
days
aft
er b
irthd
ay e
ach
year
, if t
he b
enef
icia
ry is
a cu
rren
t Med
igap
pol
icyh
olde
r. C
onne
ctic
ut a
nd N
ew Y
ork
have
cont
inuo
us o
pen
enro
llmen
t thr
ough
out t
he y
ear.
Mai
ne h
as a
n an
nual
ope
n en
rollm
ent i
n Ju
ne fo
r Pla
n A
only
; ben
efic
iarie
s can
als
o ch
ange
to a
pla
n w
ith th
e sa
me
or le
sser
ben
efits
if th
ey h
ave
no g
aps i
n co
vera
ge o
f 90
days
or m
ore.
Mas
sach
uset
ts
has a
n an
nual
ope
n en
rollm
ent p
erio
d be
twee
n Fe
brua
ry 1
and
Mar
ch 3
1 ev
ery
year
. M
isso
uri h
as a
n an
nual
ope
n en
rollm
ent p
erio
d 30
day
s bef
ore
and
afte
r Med
igap
pu
rcha
se a
nniv
ersa
ry.
Was
hing
ton
allo
ws c
urre
nt M
edig
ap p
olic
yhol
ders
to ch
ange
to a
pla
n w
ith th
e sa
me
or le
sser
ben
efits
thro
ugho
ut th
e ye
ar.
Stat
ePr
emiu
m
Ratin
g Ru
le
Requ
irem
ents
for B
enef
icia
ries u
nder
age
65
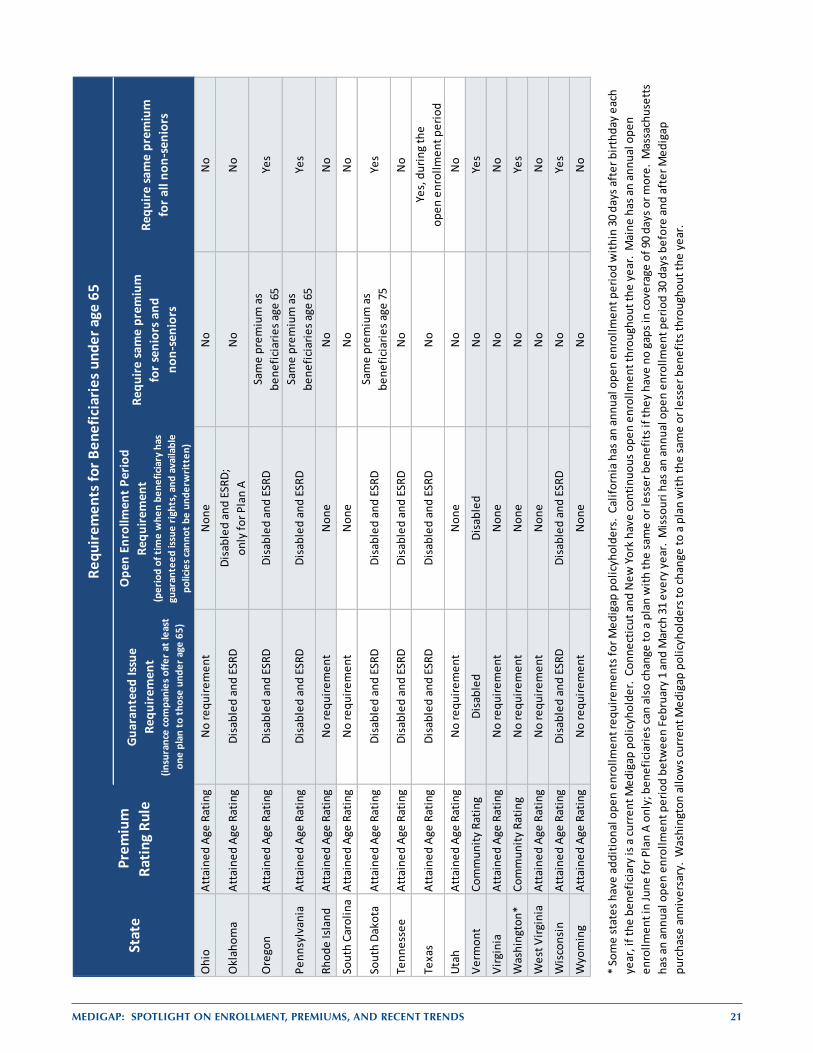
MEDIGAP: Spotlight on EnrollmEnt, prEmiumS, and rEcEnt trEndS 21
Guar
ante
ed Is
sue
Requ
irem
ent
(insu
ranc
e co
mpa
nies
offe
r at l
east
on
e pl
an to
thos
e un
der a
ge 6
5)
Ope
n En
rollm
ent P
erio
d Re
quire
men
t(p
erio
d of
tim
e w
hen
bene
ficia
ry h
as
guar
ante
ed is
sue
right
s, an
d av
aila
ble
polic
ies c
anno
t be
unde
rwrit
ten)
Requ
ire sa
me
prem
ium
fo
r sen
iors
and
no
n-se
nior
s
Requ
ire sa
me
prem
ium
fo
r all
non-
seni
ors
Ohi
oAt
tain
ed A
ge R
atin
gN
o re
quire
men
tN
one
No
No
Okl
ahom
aAt
tain
ed A
ge R
atin
gDi
sabl
ed a
nd E
SRD
Disa
bled
and
ESR
D;on
ly fo
r Pla
n A
No
No
Ore
gon
Atta
ined
Age
Rat
ing
Disa
bled
and
ESR
DDi
sabl
ed a
nd E
SRD
Sam
e pr
emiu
m a
s be
nefic
iarie
s age
65
Yes
Penn
sylv
ania
Atta
ined
Age
Rat
ing
Disa
bled
and
ESR
DDi
sabl
ed a
nd E
SRD
Sam
e pr
emiu
m a
s be
nefic
iarie
s age
65
Yes
Rhod
e Is
land
Atta
ined
Age
Rat
ing
No
requ
irem
ent
Non
eN
oN
o
Sout
h Ca
rolin
aAt
tain
ed A
ge R
atin
gN
o re
quire
men
tN
one
No
No
Sout
h Da
kota
Atta
ined
Age
Rat
ing
Disa
bled
and
ESR
DDi
sabl
ed a
nd E
SRD
Sam
e pr
emiu
m a
s be
nefic
iarie
s age
75
Yes
Tenn
esse
eAt
tain
ed A
ge R
atin
gDi
sabl
ed a
nd E
SRD
Disa
bled
and
ESR
DN
oN
o
Texa
sAt
tain
ed A
ge R
atin
gDi
sabl
ed a
nd E
SRD
Disa
bled
and
ESR
DN
oYe
s, d
urin
g th
e op
en e
nrol
lmen
t per
iod
Utah
Atta
ined
Age
Rat
ing
No
requ
irem
ent
Non
eN
oN
o
Verm
ont
Com
mun
ity R
atin
gDi
sabl
edDi
sabl
edN
oYe
s
Virg
inia
Atta
ined
Age
Rat
ing
No
requ
irem
ent
Non
eN
oN
o
Was
hing
ton*
Com
mun
ity R
atin
gN
o re
quire
men
tN
one
No
Yes
Wes
t Virg
inia
Atta
ined
Age
Rat
ing
No
requ
irem
ent
Non
eN
oN
o
Wis
cons
inAt
tain
ed A
ge R
atin
gDi
sabl
ed a
nd E
SRD
Disa
bled
and
ESR
DN
oYe
s
Wyo
min
gAt
tain
ed A
ge R
atin
gN
o re
quire
men
tN
one
No
No
* So
me
stat
es h
ave
addi
tiona
l ope
n en
rollm
ent r
equi
rem
ents
for M
edig
ap p
olic
yhol
ders
. Ca
lifor
nia
has a
n an
nual
ope
n en
rollm
ent p
erio
d w
ithin
30
days
aft
er b
irthd
ay e
ach
year
, if t
he b
enef
icia
ry is
a cu
rren
t Med
igap
pol
icyh
olde
r. C
onne
ctic
ut a
nd N
ew Y
ork
have
cont
inuo
us o
pen
enro
llmen
t thr
ough
out t
he y
ear.
Mai
ne h
as a
n an
nual
ope
n en
rollm
ent i
n Ju
ne fo
r Pla
n A
only
; ben
efic
iarie
s can
als
o ch
ange
to a
pla
n w
ith th
e sa
me
or le
sser
ben
efits
if th
ey h
ave
no g
aps i
n co
vera
ge o
f 90
days
or m
ore.
Mas
sach
uset
ts
has a
n an
nual
ope
n en
rollm
ent p
erio
d be
twee
n Fe
brua
ry 1
and
Mar
ch 3
1 ev
ery
year
. M
isso
uri h
as a
n an
nual
ope
n en
rollm
ent p
erio
d 30
day
s bef
ore
and
afte
r Med
igap
pu
rcha
se a
nniv
ersa
ry.
Was
hing
ton
allo
ws c
urre
nt M
edig
ap p
olic
yhol
ders
to ch
ange
to a
pla
n w
ith th
e sa
me
or le
sser
ben
efits
thro
ugho
ut th
e ye
ar.
Stat
ePr
emiu
m
Ratin
g Ru
le
Requ
irem
ents
for B
enef
icia
ries u
nder
age
65
22 MEDIGAP: Spotlight on EnrollmEnt, prEmiumS, and rEcEnt trEndS
APPENDIX II: Data Sources and Methodology – National Association of Insurance Commissioners
Analyses are based upon five years of annual data -- 2006 through 2010 -- from the Medicare Supplement reports collected by the National Association of Insurance Commissioners (NAIC). Insurance companies selling Medigap policies are required to report data to the NAIC, which aggregates and reports the information. These data include the number of policyholders (also called covered lives), total premiums, and total claims for each insurance company and type of plan sold.
For a given company/plan-type within a state (e.g., “Consolidated Healthcare,” Plan F in Florida), there may be multiple lines of data reported, reflecting the history of the business such as mergers and acquisitions, regular and Medicare SELECT policies, and individual and group policies. Data are also reported separately for policies issued in the last 3 years, and for policies issued in prior years. With the exception of SELECT policies, which are counted separately, we aggregated data for each company/plan-type. The NAIC data does not allow us to analyze variations in premiums within geographic areas smaller than the state.
States included. With the exception of plans in California, most insurance companies selling Medigap policies are required to report data to the NAIC; thus, we focused only on data from the 49 states and the District of Columbia.** California was excluded because only a minority of companies in California reported data to the NAIC. We also excluded data from Guam, Puerto Rico, the Virgin Islands, and American Samoa.
Plan types. Plan types A-J were well-established in 2006, and were offered through June 2010. After that, plan types E, H, I and J could no longer be sold. Plan types K and L were first sold in 2006 and plan types M and N were added in 2010.
Beneficiaries enrolled in policies issued prior to Medigap standardization in 1992 were allowed to keep these non-standardized plans. Although the benefit structure of such plans may vary, they are treated, for purposes of the current analyses, as if they were a single additional type of plan, “Pre-standardized.” It should be noted that holders of such policies are on average much older than those who own standardized policies.
Three states (Massachusetts, Minnesota and Wisconsin) were exempted from Medigap standardization because they had already established standardized plans. Policies sold in these states are also treated as a single additional type of plan, “MA, MN, and WI.” Although the nationally standardized plan types are not sold in these grandfathered states, there are policyholders owning such plans who originally purchased them elsewhere. These data (i.e., premiums, claims, and covered lives for standardized plans in MA, MN, and WI) were included in our estimates, with one exception: when identifying the states with the highest and lowest average premiums for each plan type, grandfathered states were not considered.
Finally, enrollment in SELECT plans is reported. However, we do not include SELECT policies when analyzing premiums. Although these policies cover the same benefits as the standardized policies, SELECT policies have preferred provider networks, and are not comparable to the non-SELECT market.
Methodology. Covered lives, premiums, and claims were aggregated across multiple reported lines, across year of issue, and across individual and group policies for each type of plan, within each company, within each state. Each resulting record is referred to as a state/company/plan-type.
To reflect the experience of insurance products that are currently viable, and to reduce the likelihood of extreme or anomalous values, we discarded state/company/plan-type records with aggregated premiums that were less than or equal to zero, or that had aggregated covered lives of less than twenty. A small number of aggregated claims that summed to less than zero were set to zero. ** In the NAIC data, there were nearly 286,000 Plan J policyholders with Health Alliance Plan of Michigan in 2006; this plan was not in
NAIC 2007 – 2010. Health Alliance Plan of Michigan confirmed that they have never offered Plan J. Data for company 95844, Health Alliance Plan of Michigan, were excluded from this analysis.
MEDIGAP: Spotlight on EnrollmEnt, prEmiumS, and rEcEnt trEndS 23
The summed values for state/company/plan-type were themselves summed to several levels of aggregation: plan types within state (state/plan-type); plan types across states (plan-type); states across plan types (state); and summed over all states, plans, and companies (US total).
At each level of aggregation, average monthly premiums were calculated as
( ) .
At the state and US total level, percent of Medicare beneficiaries covered by Medigap was calculated as
( 24) .
Descriptive statistics on numbers of policyholders and average premiums are presented at the national, state, and plan-type level, and by state rating methods (community rating, issue age rating, and attained age rating). Analyses are conducted examining the most current available data (2010) as well as trends over the five-year period 2006-2010, inclusive.
Because these averages and percents were calculated using summed values at each level of aggregation, they are effectively weighted by the relative market share of each company’s product. When calculating percentiles (e.g., medians), it was necessary to explicitly weight by number of covered lives.
Increases in average premiums were calculated as
(
) ,
where i indicates the level of aggregation (such as nation, state, or plan-type), year and/or rating method.
In a final set of analyses, we wished to examine whether beneficiaries were price-sensitive when choosing to purchase policies from the array of companies offering them. These analyses had to be limited to community-rated states, where average premiums reflect the price of policies on offer to beneficiaries (as opposed to issue-age or attained-age states, where the premiums are allowed to differ between individuals). We looked at Plan F only, and policies issued in the past 3 years only. For each company in a state, we calculated its 2010 premium and market share, or percent of Plan F policyholders in the state purchasing from that company. We plotted market share against premiums. If beneficiaries are price-sensitive, we would expect that as premiums go up, market share will go down.
One limitation of using the NAIC data is that the findings are based upon aggregates, summed over all policyholders, for a particular company and a particular plan type. These figures therefore do not reflect the premiums charged to a particular individual or the specific claims filed by an individual. Premiums collected and claims paid out in a given calendar year may not match temporally because there could be lags in claim payments or premium credits. A second limitation is that in situations where there are few policyholders for a particular plan type for an insurer in a state, exceptionally high or low claims experiences will skew the results. For this reason, we limit the analysis to cases where there are at least 20 covered lives for a particular plan type for an insurer within a state. This reduced the number of covered lives included in the analysis by 0.5 percent. A further limitation is that the NAIC data may contain errors or misreported values. With the exception of one company noted in the footnote above, no effort was made to identify or correct such errors. A final limitation is that California is not included in the study because most insurers report to a state agency that is not required to share data with the NAIC.
24 MEDIGAP: Spotlight on EnrollmEnt, prEmiumS, and rEcEnt trEndS
APPENDIX III: Data Sources and Methodology – State Medigap Premium Comparison Guides For the analysis of premium variation by age, sex, and smoking status, we reviewed Medigap premium information posted on each state’s website. Our analysis focuses on states that list premiums for Plan F effective in 2011. We selected Plan F because it has the highest number of policyholders, accounting for 44 percent of beneficiaries with Medigap in 2010. High-deductible plans and Medigap SELECT plans were excluded from this analysis, because the different benefit structure in high-deductible plans and the existence of preferred provider networks in SELECT plans makes these plan types less comparable to standard Plan F. States that require community rating were also excluded from the analyses, since premiums in community rated states do not vary by age, gender, or smoking status. For states that listed different premiums for different sub-state areas, we selected the zip code, county, or city with the largest number of Medicare beneficiaries.
We defined a “reference” beneficiary as a 65-year old, non-smoking woman. To compare the difference in premiums by a given demographic characteristic, we collected Plan F premiums listed for the reference beneficiary and the corresponding premiums of a counterpart who was matched on all characteristics except the characteristic of interest. We then took a ratio of these premiums, and computed the unweighted mean (average) of the ratios within each state. Every plan that reported premiums had the same weight as every other plan that reported premiums in the same state—that is, these averages are an average of what is offered in each state, not an average of the plans that are bought in each state. The ratio across states was calculated by computing the unweighted average of the states’ premium ratios; thus, in analyzing premium ratios across several states, every state included in the analysis was given the same weight.
For the analysis of premium variations by age, we used only plans that reported premiums for beneficiaries under age 65 (nonelderly), age 65, and age 80; plans that did not list premiums for all three ages were excluded from the analysis. As stated earlier, some states have guaranteed issue requirements that require insurance companies to offer at least one kind of Medigap policy to beneficiaries under age 65; some states also require insurance companies to offer policies to non-senior beneficiaries at the same premium as beneficiaries age 65. We excluded states that “benchmarked” premiums for non-senior beneficiaries to premiums charged to senior beneficiaries. We conducted two analyses of premiums by age: one using states that had guaranteed issue and open enrollment requirements for all beneficiaries under age 65 (including both disabled and ESRD beneficiaries), and the other using states that did not have guaranteed issue requirements or open enrollment requirements. States that reported premiums as a range were also excluded.
The following states met all of the criteria listed above, and had 2011 Plan F premiums available at the time of the analysis. Data from these states were used for the following analyses:
Variation by age, among states WITH guaranteed issue requirements for Medicare beneficiaries under age 65: California, Colorado, Florida, Louisiana, and Missouri; and
Variation by age, among states WITHOUT guaranteed issue requirements for Medicare beneficiaries under age 65: Alabama, Iowa, Kentucky, Montana, and North Dakota.
For the analysis of premium variation by gender and smoking status, we used the five states with plans that had 2011 Plan F premiums listed for male and female smokers and non-smokers in the county with the largest number of Medicare beneficiaries: Florida, Kansas, Louisiana, Maryland, and North Carolina.
Premiums are estimates or examples of rates offered at the time data were downloaded, and do not reflect actual rates for the full year. Several states, including New Hampshire and Missouri, note that rates listed in their Medigap premium comparison guide were effective as of a certain date, but may change during the year. Not all companies are required to report in all states; for example, Kentucky notes that premiums for PacificCare Life and Health Insurance Company, State Farm Mutual Automobile Insurance Company, and Sterling Life Insurance Company, among others, are not listed in the Kentucky Medigap premium comparison guide.
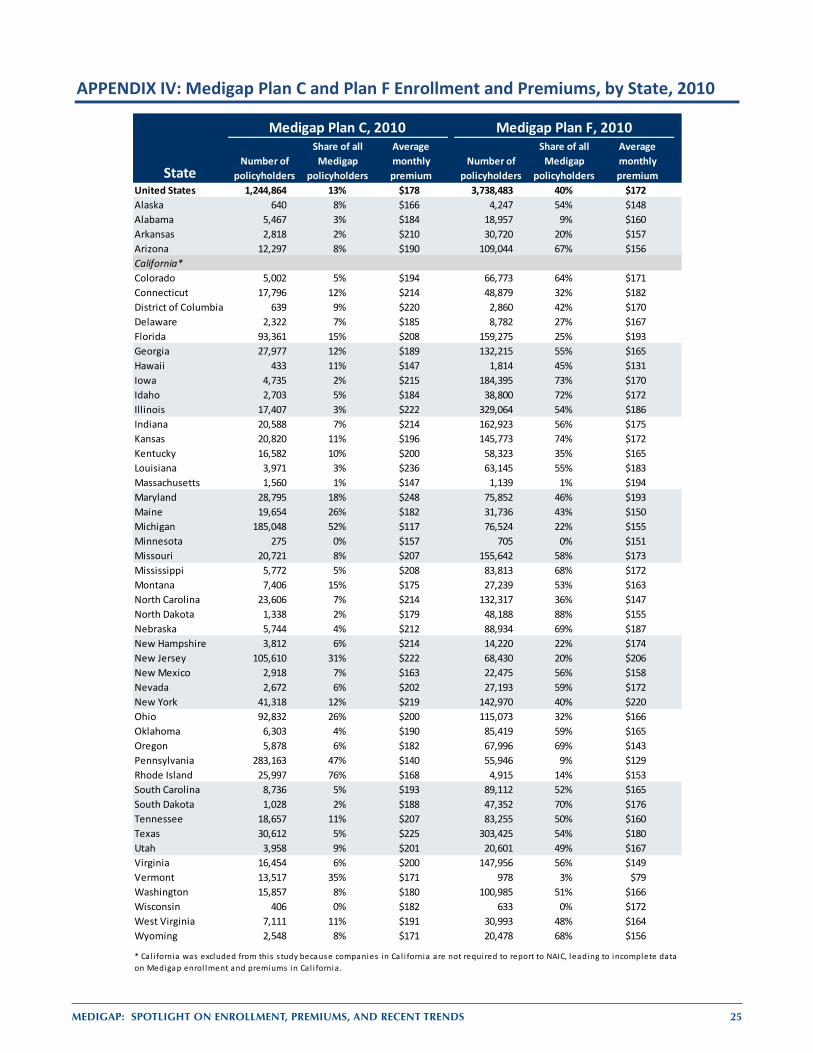
MEDIGAP: Spotlight on EnrollmEnt, prEmiumS, and rEcEnt trEndS 25
APPENDIX IV: Medigap Plan C and Plan F Enrollment and Premiums, by State, 2010
Number of policyholders
Share of all Medigap
policyholders
Average monthly premium
Number of policyholders
Share of all Medigap
policyholders
Average monthly premium
United States 1,244,864 13% $178 3,738,483 40% $172Alaska 640 8% $166 4,247 54% $148Alabama 5,467 3% $184 18,957 9% $160Arkansas 2,818 2% $210 30,720 20% $157Arizona 12,297 8% $190 109,044 67% $156California*Colorado 5,002 5% $194 66,773 64% $171Connecticut 17,796 12% $214 48,879 32% $182District of Columbia 639 9% $220 2,860 42% $170Delaware 2,322 7% $185 8,782 27% $167Florida 93,361 15% $208 159,275 25% $193Georgia 27,977 12% $189 132,215 55% $165Hawaii 433 11% $147 1,814 45% $131Iowa 4,735 2% $215 184,395 73% $170Idaho 2,703 5% $184 38,800 72% $172Illinois 17,407 3% $222 329,064 54% $186Indiana 20,588 7% $214 162,923 56% $175Kansas 20,820 11% $196 145,773 74% $172Kentucky 16,582 10% $200 58,323 35% $165Louisiana 3,971 3% $236 63,145 55% $183Massachusetts 1,560 1% $147 1,139 1% $194Maryland 28,795 18% $248 75,852 46% $193Maine 19,654 26% $182 31,736 43% $150Michigan 185,048 52% $117 76,524 22% $155Minnesota 275 0% $157 705 0% $151Missouri 20,721 8% $207 155,642 58% $173Mississippi 5,772 5% $208 83,813 68% $172Montana 7,406 15% $175 27,239 53% $163North Carolina 23,606 7% $214 132,317 36% $147North Dakota 1,338 2% $179 48,188 88% $155Nebraska 5,744 4% $212 88,934 69% $187New Hampshire 3,812 6% $214 14,220 22% $174New Jersey 105,610 31% $222 68,430 20% $206New Mexico 2,918 7% $163 22,475 56% $158Nevada 2,672 6% $202 27,193 59% $172New York 41,318 12% $219 142,970 40% $220Ohio 92,832 26% $200 115,073 32% $166Oklahoma 6,303 4% $190 85,419 59% $165Oregon 5,878 6% $182 67,996 69% $143Pennsylvania 283,163 47% $140 55,946 9% $129Rhode Island 25,997 76% $168 4,915 14% $153South Carolina 8,736 5% $193 89,112 52% $165South Dakota 1,028 2% $188 47,352 70% $176Tennessee 18,657 11% $207 83,255 50% $160Texas 30,612 5% $225 303,425 54% $180Utah 3,958 9% $201 20,601 49% $167Virginia 16,454 6% $200 147,956 56% $149Vermont 13,517 35% $171 978 3% $79Washington 15,857 8% $180 100,985 51% $166Wisconsin 406 0% $182 633 0% $172West Virginia 7,111 11% $191 30,993 48% $164Wyoming 2,548 8% $171 20,478 68% $156
* Cal i fornia was excluded from this s tudy because companies in Ca l i fornia are not required to report to NAIC, leading to incomplete data on Medigap enrol lment and premiums in Ca l i fornia .
Medigap Plan C, 2010 Medigap Plan F, 2010
State
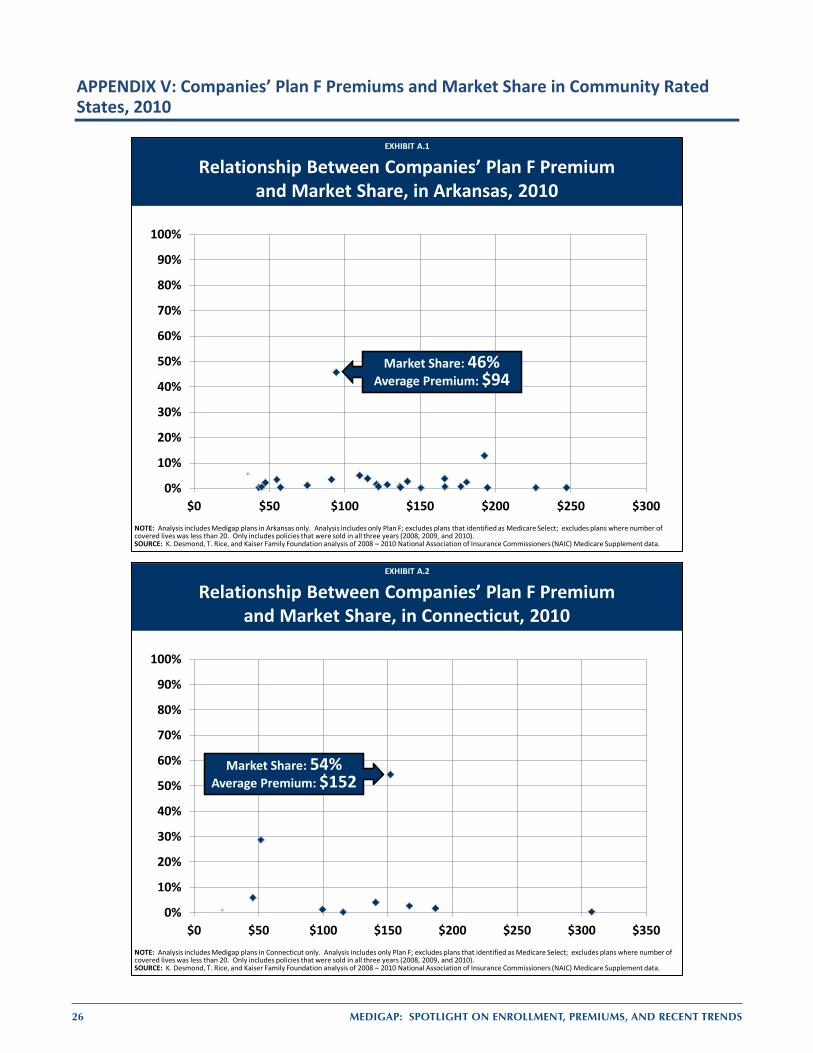
26 MEDIGAP: Spotlight on EnrollmEnt, prEmiumS, and rEcEnt trEndS
APPENDIX V: Companies’ Plan F Premiums and Market Share in Community Rated States, 2010
EXHIBIT 15EXHIBIT 15
Relationship Between Companies’ Plan F Premium and Market Share, in Arkansas, 2010
0%
10%
20%
30%
40%
50%
60%
70%
80%
90%
100%
$0 $50 $100 $150 $200 $250 $300
Market Share: 46%Average Premium: $94
NOTE: Analysis includes Medigap plans in Arkansas only. Analysis includes only Plan F; excludes plans that identified as Medicare Select; excludes plans where number of covered lives was less than 20. Only includes policies that were sold in all three years (2008, 2009, and 2010).SOURCE: K. Desmond, T. Rice, and Kaiser Family Foundation analysis of 2008 – 2010 National Association of Insurance Commissioners (NAIC) Medicare Supplement data.
EXHIBIT A.1
EXHIBIT 16EXHIBIT 16
Relationship Between Companies’ Plan F Premium and Market Share, in Connecticut, 2010
0%
10%
20%
30%
40%
50%
60%
70%
80%
90%
100%
$0 $50 $100 $150 $200 $250 $300 $350
Market Share: 54%Average Premium: $152
NOTE: Analysis includes Medigap plans in Connecticut only. Analysis includes only Plan F; excludes plans that identified as Medicare Select; excludes plans where number of covered lives was less than 20. Only includes policies that were sold in all three years (2008, 2009, and 2010).SOURCE: K. Desmond, T. Rice, and Kaiser Family Foundation analysis of 2008 – 2010 National Association of Insurance Commissioners (NAIC) Medicare Supplement data.
EXHIBIT A.2
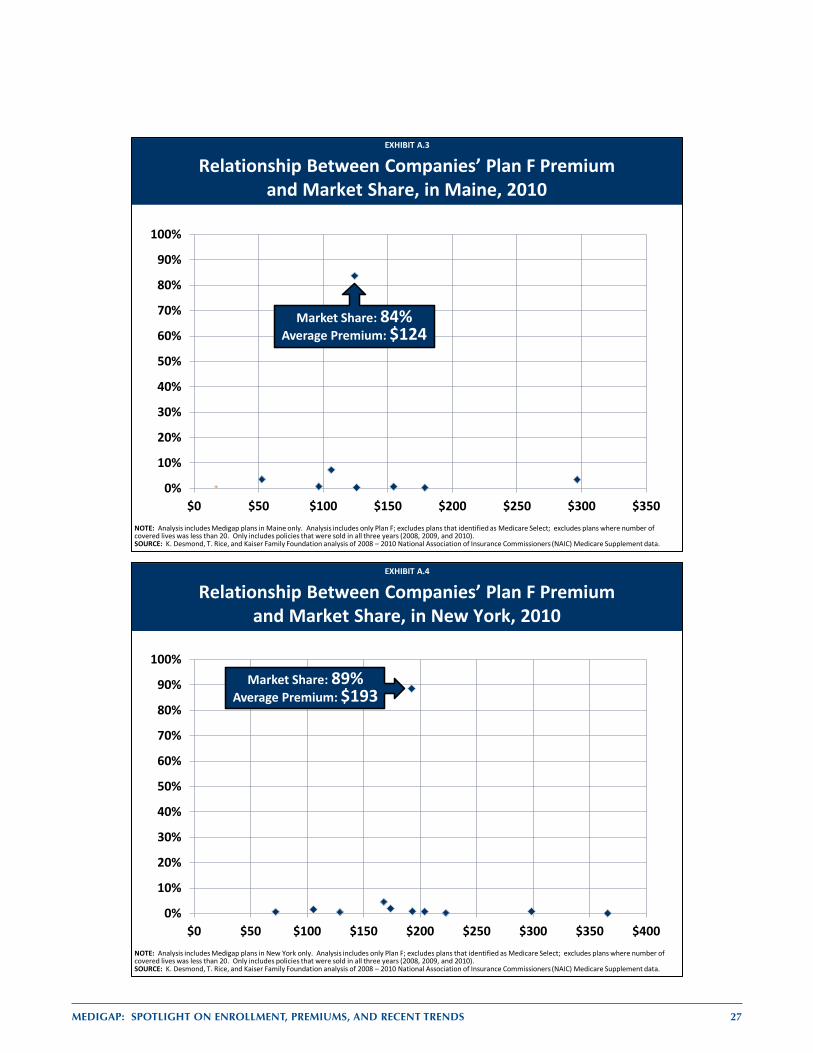
MEDIGAP: Spotlight on EnrollmEnt, prEmiumS, and rEcEnt trEndS 27
EXHIBIT 17EXHIBIT 17
Relationship Between Companies’ Plan F Premium and Market Share, in Maine, 2010
0%
10%
20%
30%
40%
50%
60%
70%
80%
90%
100%
$0 $50 $100 $150 $200 $250 $300 $350
Market Share: 84%Average Premium: $124
NOTE: Analysis includes Medigap plans in Maine only. Analysis includes only Plan F; excludes plans that identified as Medicare Select; excludes plans where number of covered lives was less than 20. Only includes policies that were sold in all three years (2008, 2009, and 2010).SOURCE: K. Desmond, T. Rice, and Kaiser Family Foundation analysis of 2008 – 2010 National Association of Insurance Commissioners (NAIC) Medicare Supplement data.
EXHIBIT A.3
EXHIBIT 18EXHIBIT 18
Relationship Between Companies’ Plan F Premium and Market Share, in New York, 2010
0%
10%
20%
30%
40%
50%
60%
70%
80%
90%
100%
$0 $50 $100 $150 $200 $250 $300 $350 $400
Market Share: 89%Average Premium: $193
NOTE: Analysis includes Medigap plans in New York only. Analysis includes only Plan F; excludes plans that identified as Medicare Select; excludes plans where number of covered lives was less than 20. Only includes policies that were sold in all three years (2008, 2009, and 2010).SOURCE: K. Desmond, T. Rice, and Kaiser Family Foundation analysis of 2008 – 2010 National Association of Insurance Commissioners (NAIC) Medicare Supplement data.
EXHIBIT A.4
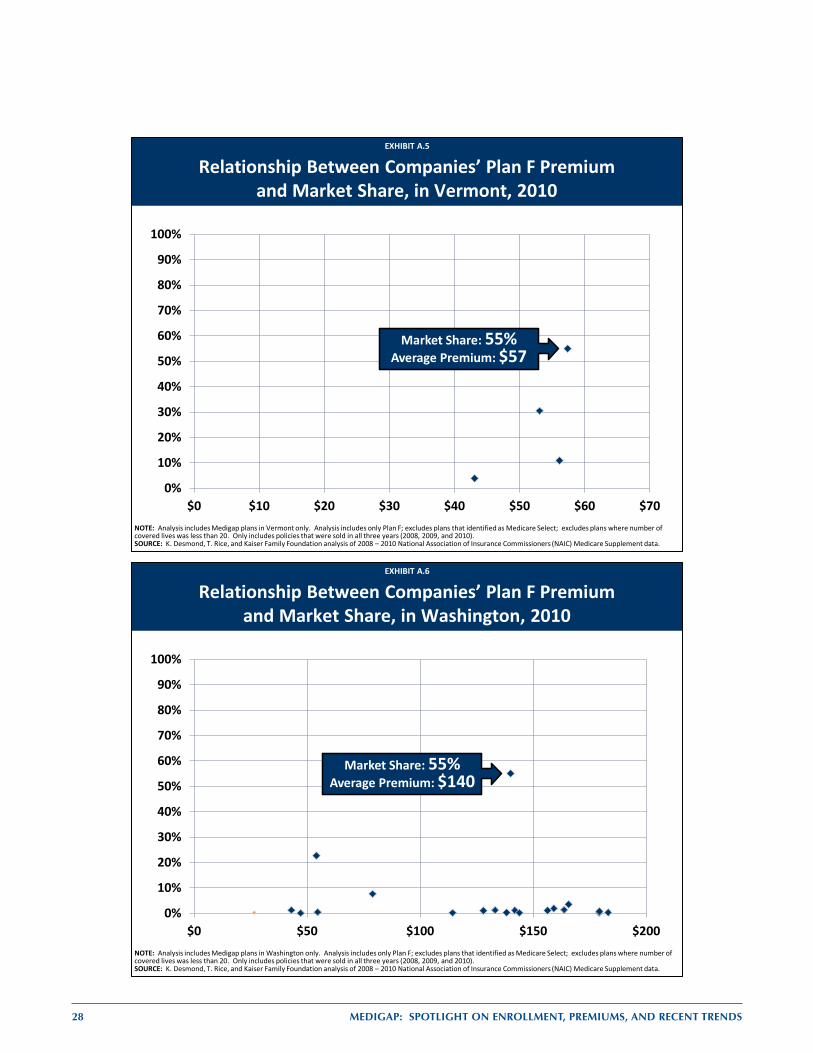
28 MEDIGAP: Spotlight on EnrollmEnt, prEmiumS, and rEcEnt trEndS
EXHIBIT 19EXHIBIT 19
Relationship Between Companies’ Plan F Premium and Market Share, in Vermont, 2010
0%
10%
20%
30%
40%
50%
60%
70%
80%
90%
100%
$0 $10 $20 $30 $40 $50 $60 $70
Market Share: 55%Average Premium: $57
NOTE: Analysis includes Medigap plans in Vermont only. Analysis includes only Plan F; excludes plans that identified as Medicare Select; excludes plans where number of covered lives was less than 20. Only includes policies that were sold in all three years (2008, 2009, and 2010).SOURCE: K. Desmond, T. Rice, and Kaiser Family Foundation analysis of 2008 – 2010 National Association of Insurance Commissioners (NAIC) Medicare Supplement data.
EXHIBIT A.5
EXHIBIT 20EXHIBIT 20
Relationship Between Companies’ Plan F Premium and Market Share, in Washington, 2010
0%
10%
20%
30%
40%
50%
60%
70%
80%
90%
100%
$0 $50 $100 $150 $200
Market Share: 55%Average Premium: $140
NOTE: Analysis includes Medigap plans in Washington only. Analysis includes only Plan F; excludes plans that identified as Medicare Select; excludes plans where number of covered lives was less than 20. Only includes policies that were sold in all three years (2008, 2009, and 2010).SOURCE: K. Desmond, T. Rice, and Kaiser Family Foundation analysis of 2008 – 2010 National Association of Insurance Commissioners (NAIC) Medicare Supplement data.
EXHIBIT A.6
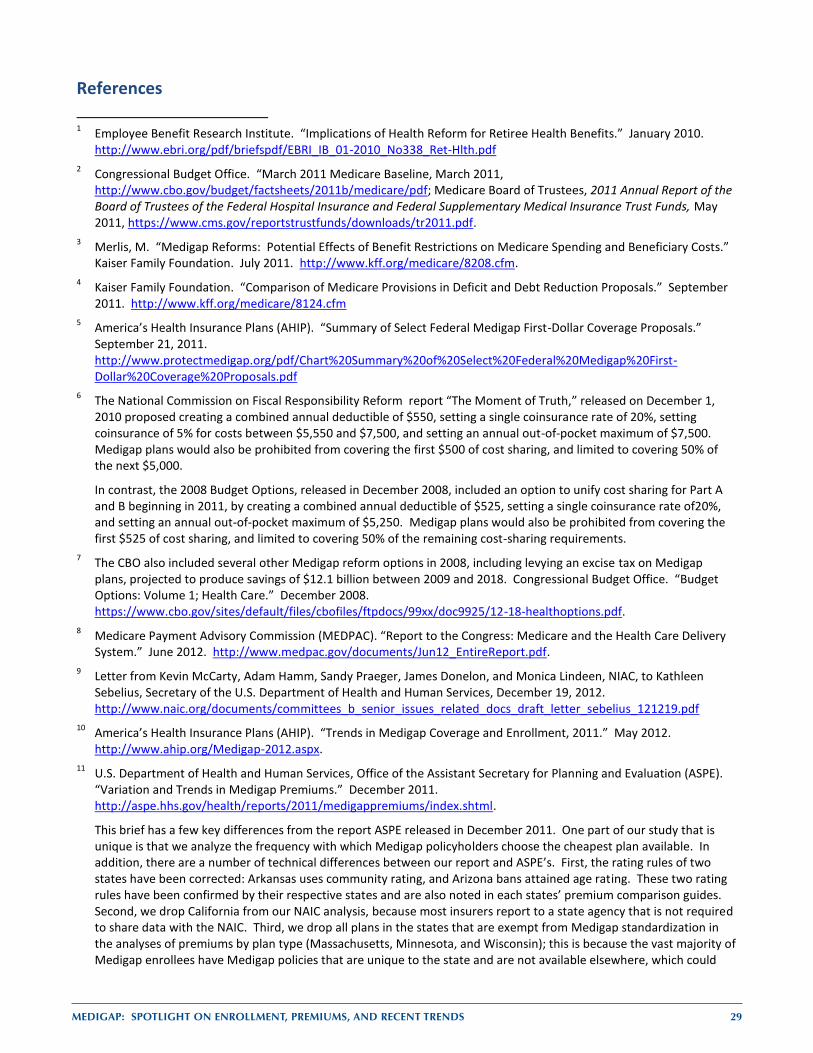
MEDIGAP: Spotlight on EnrollmEnt, prEmiumS, and rEcEnt trEndS 29
References
1 Employee Benefit Research Institute. “Implications of Health Reform for Retiree Health Benefits.” January 2010.
http://www.ebri.org/pdf/briefspdf/EBRI_IB_01-2010_No338_Ret-Hlth.pdf 2 Congressional Budget Office. “March 2011 Medicare Baseline, March 2011,
http://www.cbo.gov/budget/factsheets/2011b/medicare/pdf; Medicare Board of Trustees, 2011 Annual Report of the Board of Trustees of the Federal Hospital Insurance and Federal Supplementary Medical Insurance Trust Funds, May 2011, https://www.cms.gov/reportstrustfunds/downloads/tr2011.pdf.
3 Merlis, M. “Medigap Reforms: Potential Effects of Benefit Restrictions on Medicare Spending and Beneficiary Costs.” Kaiser Family Foundation. July 2011. http://www.kff.org/medicare/8208.cfm.
4 Kaiser Family Foundation. “Comparison of Medicare Provisions in Deficit and Debt Reduction Proposals.” September 2011. http://www.kff.org/medicare/8124.cfm
5 America’s Health Insurance Plans (AHIP). “Summary of Select Federal Medigap First-Dollar Coverage Proposals.” September 21, 2011. http://www.protectmedigap.org/pdf/Chart%20Summary%20of%20Select%20Federal%20Medigap%20First-Dollar%20Coverage%20Proposals.pdf
6 The National Commission on Fiscal Responsibility Reform report “The Moment of Truth,” released on December 1, 2010 proposed creating a combined annual deductible of $550, setting a single coinsurance rate of 20%, setting coinsurance of 5% for costs between $5,550 and $7,500, and setting an annual out-of-pocket maximum of $7,500. Medigap plans would also be prohibited from covering the first $500 of cost sharing, and limited to covering 50% of the next $5,000.
In contrast, the 2008 Budget Options, released in December 2008, included an option to unify cost sharing for Part A and B beginning in 2011, by creating a combined annual deductible of $525, setting a single coinsurance rate of20%, and setting an annual out-of-pocket maximum of $5,250. Medigap plans would also be prohibited from covering the first $525 of cost sharing, and limited to covering 50% of the remaining cost-sharing requirements.
7 The CBO also included several other Medigap reform options in 2008, including levying an excise tax on Medigap plans, projected to produce savings of $12.1 billion between 2009 and 2018. Congressional Budget Office. “Budget Options: Volume 1; Health Care.” December 2008. https://www.cbo.gov/sites/default/files/cbofiles/ftpdocs/99xx/doc9925/12-18-healthoptions.pdf.
8 Medicare Payment Advisory Commission (MEDPAC). “Report to the Congress: Medicare and the Health Care Delivery System.” June 2012. http://www.medpac.gov/documents/Jun12_EntireReport.pdf.
9 Letter from Kevin McCarty, Adam Hamm, Sandy Praeger, James Donelon, and Monica Lindeen, NIAC, to Kathleen Sebelius, Secretary of the U.S. Department of Health and Human Services, December 19, 2012. http://www.naic.org/documents/committees_b_senior_issues_related_docs_draft_letter_sebelius_121219.pdf
10 America’s Health Insurance Plans (AHIP). “Trends in Medigap Coverage and Enrollment, 2011.” May 2012. http://www.ahip.org/Medigap-2012.aspx.
11 U.S. Department of Health and Human Services, Office of the Assistant Secretary for Planning and Evaluation (ASPE). “Variation and Trends in Medigap Premiums.” December 2011. http://aspe.hhs.gov/health/reports/2011/medigappremiums/index.shtml.
This brief has a few key differences from the report ASPE released in December 2011. One part of our study that is unique is that we analyze the frequency with which Medigap policyholders choose the cheapest plan available. In addition, there are a number of technical differences between our report and ASPE’s. First, the rating rules of two states have been corrected: Arkansas uses community rating, and Arizona bans attained age rating. These two rating rules have been confirmed by their respective states and are also noted in each states’ premium comparison guides. Second, we drop California from our NAIC analysis, because most insurers report to a state agency that is not required to share data with the NAIC. Third, we drop all plans in the states that are exempt from Medigap standardization in the analyses of premiums by plan type (Massachusetts, Minnesota, and Wisconsin); this is because the vast majority of Medigap enrollees have Medigap policies that are unique to the state and are not available elsewhere, which could
30 MEDIGAP: Spotlight on EnrollmEnt, prEmiumS, and rEcEnt trEndS
significantly affect the pricing of the nationally-standardized plans in these three states. Fourth, we exclude SELECT plans from our analyses; where SELECT plans are included, they are treated as a separate plan type. This is because SELECT plans have preferred provider networks, and beneficiaries receiving care from outside the preferred provider networks may have additional cost-sharing. Finally, in cases where the Medicare Current Beneficiary Survey is used, we used the 2008 Cost and Use File (rather than the 2009 Access to Care File). The Access to Care files have not been reconciled and undercount new enrollees, people who die during the year, and people living in institutions. It is also unclear how ASPE codes the types of supplemental coverage; we include all Medicare beneficiaries with a Medigap policy at any point in the year as people with Medigap coverage.
12 The medical loss ratio is the percentage of premiums collected by an insurer that are returned to policy holders in the form of health benefits.
13 For a more detailed discussion of the regulatory history of Medigap, including the passage of the standardization requirements in 1990, see: Fox, P.D., T. Rice, and L. Alecxih. “Medigap Regulation: Lessons for Health Care Reform. Journal of Health Politics, Policy and Law 20(1), Spring 1995: 31-48.
14 Rice, T., M.L. Graham, and P.D. Fox. “The Impact of Policy Standardization on the Medigap Market.” Inquiry, 34(2), Summer 1997: 106-116.
15 Fox, P.D., T. Rice, and L. Alecxih. “Medigap Regulation: Lessons for Health Care Reform.” Journal of Health Politics, Policy and Law 20(1), Spring 1995: 31-48.
16 America’s Health Insurance Plans, Center for Policy and Research. “Trends in Medigap Coverage and Enrollment, 2010-2011.” July 2011.
17 Jacobson, G., T. Neuman, T. Rice, K. Desmond, J. Huang, “Medigap Reform: Setting the Context.” Kaiser Family Foundation. September 2011. http://www.kff.org/medicare/8235.cfm.
18 Naestas, N., M. Schroeder, and D. Goldman. “Price Variation in Markets with Homogeneous Goods: the Case of Medigap.” January 2009.
19 The percentage increase in premiums across plan types is lower than that for individual plan types. Although counterintuitive, this occurs because policyholders were switching from plan types with larger premium increases to cheaper options.
20 In 2009, 11 percent of insurance companies had policyholders in over 40 states and the District of Columbia; 14 percent of insurers had policyholders in at least half of the states. More information can be found at: America’s Health Insurance Plans, Center for Policy and Research. “Characteristics of Medigap Policies, December 2009.” September 2010. www.ahip.org/Medigap2009/
21 Kaiser Family Foundation analysis of CMS Medicare Current Beneficiary Survey Cost and Use File 2009. 22 Swartz, Katherine, “Cost-sharing: Effects on spending and outcomes.” December 2010. 23 Letter from the Coalition to Promote Choice for Seniors to the Joint Select Committee on Deficit Reduction, October 3,
2011. http://medigapchoice.com/wp-content/uploads/Letter_from_Coalition.pdf 24 Kaiser Family Foundation, statehealthfacts.org. “Total Number of Medicare Beneficiaries.” Data Source: Mathematica
Policy Research analysis of CMS State/County Market Penetration Files. http://www.statehealthfacts.org/comparetable.jsp?ind=290&cat=6&sub=74&yr=138&typ=1&sort=a.

�T�H�E �H�E�N�R�Y �J�. �K�A�I�S�E�R �F�A�M�I�LY F�O�U�N�D�A�T�I�O�N
�H�e�a�d�q�u�a�r�t�e�r�s�2�4�0�0 S�a�n�d �H�i�l�l �R�o�a�d�M�e�n�l�o �P�a�r�k�, �C�A �9�4�0�2�5�P�h�o�n�e �6�5�0�-�8�5�4�-�9�4�0�0 �Fax 650-854-480�0
�B�a�r�b�a�r�a��J�o�r�d�a�n��C�o�n�f�e�r�e�n�c�e��C�e�n�t�e�r�1�3�30 �G St�r�e�e�t, �N�W�W�a�s�h�i�n�g�t�o�n�, D�C �2�0�0�0�5�P�h�o�n�e �2�0�2�-�3�4�7�-�5�2�70 �F�ax �2�0�2�-�3�4�7�-�5�2�7�4
�w�w�w�.�k�f�f�.�o�r�g
�T�h�i�s �r�e�p�o�r�t �(�#�8�4�1�2�) is �a�v�a�i�l�a�b�l�e on the �K�a�iser �F�a�m�i�l�y �F�o�u�n�d�a�t�i�o�n�’�s w�e�b�s�i�t�e �a�t w�w�w�.�k�f�f�.�o�r�g�.
�T�h�e��K�a�i�s�e�r��F�a�m�i�l�y��F�o�u�n�d�a�t�i�o�n�,��a��l�e�a�d�e�r��i�n��h�e�a�l�t�h��p�o�l�i�c�y��a�n�a�l�y�s�i�s�,��h�e�a�l�t�h��j�o�u�r�n�a�l�i�s�m��a�n�d��c�o�m�m�u�n�i�c�a�t�i�o�n�,��i�s��d�e�d�i�c�a�t�e�d�to filling the need for trusted, independent information on the major health issues facing our nation and its people. �T�h�e��F�o�u�n�d�a�t�i�o�n��i�s��a��n�o�n�-�p�r�o�f�i�t��p�r�i�v�a�t�e��o�p�e�r�a�t�i�n�g��f�o�u�n�d�a�t�i�o�n�,��b�a�s�e�d��i�n��M�e�n�l�o��P�a�r�k�,��C�a�l�i�f�o�r�n�i�a�.


![spotlight [SHISU]](https://img.pdfslide.tips/doc/110x75/568bd65a1a28ab20349bc4a7/spotlight-shisu.jpg)
