Embed Size (px)
Citation preview
9th International Conference on Fracture Mechanics of Concrete and Concrete Structures
FraMCoS-9 V. Saouma, J. Bolander and E. Landis (Eds)
1
MESO-SCALE APPROACH TO INVESTIGATE THE BOND PERFORMANCE OF ANCHORAGE IN REINFORCED CONCRETE
DAISUKE HAYASHI
*AND KOHEI NAGAI
*Institute of Technology, Shimizu Corporation
Tokyo, Japan e-mail: [email protected]
†Institute of Industrial Science, The University of Tokyo
Tokyo, Japan e-mail: [email protected]
Key words: Meso-scale analysis, Deformed bar, Damage model, Zero-thickness interface element
Abstract: To investigate the bond performance of anchorage of reinforcement in structural element, a meso-scale approach which represents the detailed description of local geometry of reinforcements, is applied. In proposed model, concrete is represented by an isotropic damage model, and material interface is defined by the interface element and cohesive zone model. Two simulation cases of simple validation tests, namely pullout test and uniaxial tension test, were carried out to study the applicability of proposed models. The analysis result indicates the proposed model has to be improved especially in description of compression behavior. However, the uniaxial tension simulation which mainly governed by tension behavior could show the typical tension stiffening behavior.
1 INTRODUCTION
Nowadays, seismic design code in Japan is becoming more stringent. To satisfy the requirements, a large amount of reinforcement must be placed which results in increased reinforcement congestion. Such congestion is a particular problem in beam-column joints, where reinforcement bars from many different directions come together. To reduce the reinforcement congestion, several new mechanical devices have been invented recently for the reinforcement anchorage. For example, a headed reinforcing bar becomes popular in use instead of the conventional hooked bar. When these new devices are applied to reinforced concrete structures, anchorage performance should be investigated and it depends on the type of the structure, the loading condition and other factors. Moreover,
to investigate the anchorage performance, full-scale experiment is generally carried out. However, it takes time and inefficient, and may difficult to grasp the local responses of the testing object.
For this purpose, authors consider that meso-scale analysis, which can reveal details the local responses of concrete and reinforcement and their interactions, is appropriate. In previous research, discrete lattice approach was conducted to simulate the fracture process for concrete at meso-scale where concrete consists of mortar and aggregate [1-3]. Moreover, simulations were conducted with the same approach to investigate the anchorage performance of the reinforcement under various conditions and the failure mechanism [4-5]. This approach is beneficial to represent discrete crack directly
DOI 10.21012/FC9.123
Hayashi,D.,andNagai,K.
2
by separation between elements. Since cracks are forced to propagate along element boundaries, this approach is affected a strong mesh bias. However, it is difficult that mesh generation which contains the material interface of arbitrary shape while keeping high mesh quality.
In this study, damage mechanics approach which is without mesh-size dependency [6] is applied to simulate the failure behavior on anchorage of reinforcing bars. Furthermore, to represent interface-fracture between different materials, zero-thickness interface elements with cohesive zone model are introduced. Zero-thickness interface is widely used for modeling crack propagation [7-8] and material delamination failure [9-10]. Ultimately, the purpose of this research is to verify the applicability of this coupled model: damage mechanics model and cohesive zone model, in order to investigate the failure behavior on anchorage of reinforcing bars in a reinforced concrete member. In order to verify this applicability, two simulations are conducted. The first simulation models the pull-out of a reinforcing bar embedded in a concrete specimen. In this case, the results of this simulation are discussed in comparison with reported experimental results. The second simulation is a tension stiffening simulation.
2 NUMERICAL METHOD AND CONSTITUTIVE MODELS
2.1 Numerical method
In this study, simulations are carried out by damage mechanics approach, as proposed by Kurumatani et al. [6], which is coupled with cohesive zone model to represent the interface-fracture between two materials. A three dimensional reinforced concrete model is formed from a mesh of solid elements: concrete elements and steel elements. Each solid element is a 3D linear tetrahedral element and is adaptable to model any complex geometry. Moreover, the geometry of the reinforcement is modeled in an accurate manner to properly account for the interlocking between concrete and the
reinforcement. The solid elements are modeled with an average size of less than 5 mm.
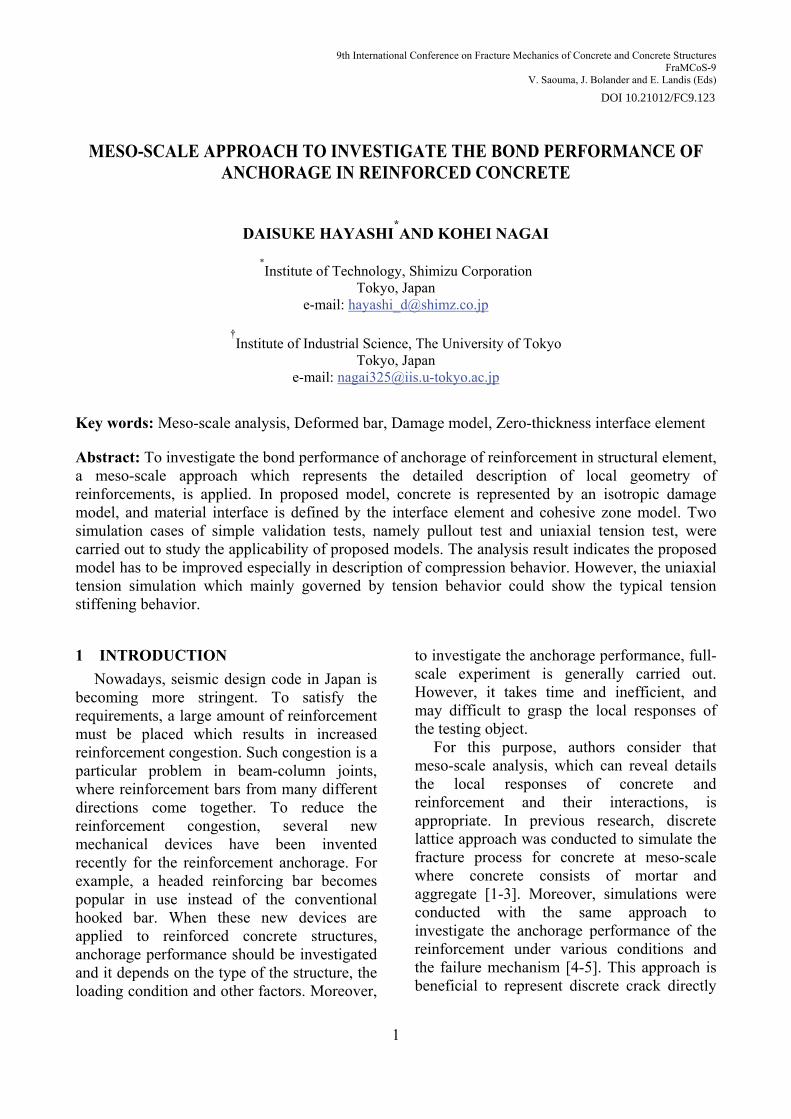
In order to simulate the separation between two materials: concrete and steel materials, interface elements are introduced (Figure 1). An interface element consists of two triangular surfaces laid together at the initial configuration (zero thickness). When deformation takes place, these surfaces are separated and, furthermore, the relative displacement between two element faces generates normal and shear traction which depends on the constitutive model of the cohesive zone model as discussed below.
2.2 Constitutive models
Two types of elements are used to represent the behavior of reinforced concrete in this study: concrete and steel elements. (1) Concrete
An isotropic damage model proposed by Kurumatani et al. [6] is used to describe the constitutive response of mortar and concrete. The stress-strain relationship reads
:)1( cD (1)
where σ is the Cauchy stress components, D is the damage variable, c is the elastic stiffness, and ε is the strain components.
The damage variable D is a function of a variable κ which is defined as equivalent strain.
)(0
000
01
)(exp1)(
e
G
hED
f
e
(2)
where κ0 is the damage initiation strain, E is the Young’s modulus, Gf is the fracture energy and he is characteristic element length. For
tn
tt1tt2
Bulk element 1
Bulk element 2
Interface element
Shared nodes
Figure 1: Interface element.
Hayashi, D., and Nagai, K.
3
tetrahedral element, he could be calculated as
31
)12( ee Vh (4)
where Ve is volume of the element. The damage evolution is determined by a
scalar measure of strain component. In this study, a modification of the Von Mises equivalent strain will be applied [11]:
22
2
11)1(
12
21
1
2
1
)21(2
1J
kI
k
kI
k
keq
(3)
with k denoting the ratio of tensile and compressive strength and ν poisson’s ratio and I1 and J’2 strain invariants defined by
kktrI 1
klkleeeeJ2
1:
2
12 (4)
where
tre3
1
(2) Steel Von Mises plastic model is applied for the
steel element. (3) Concrete-steel interface
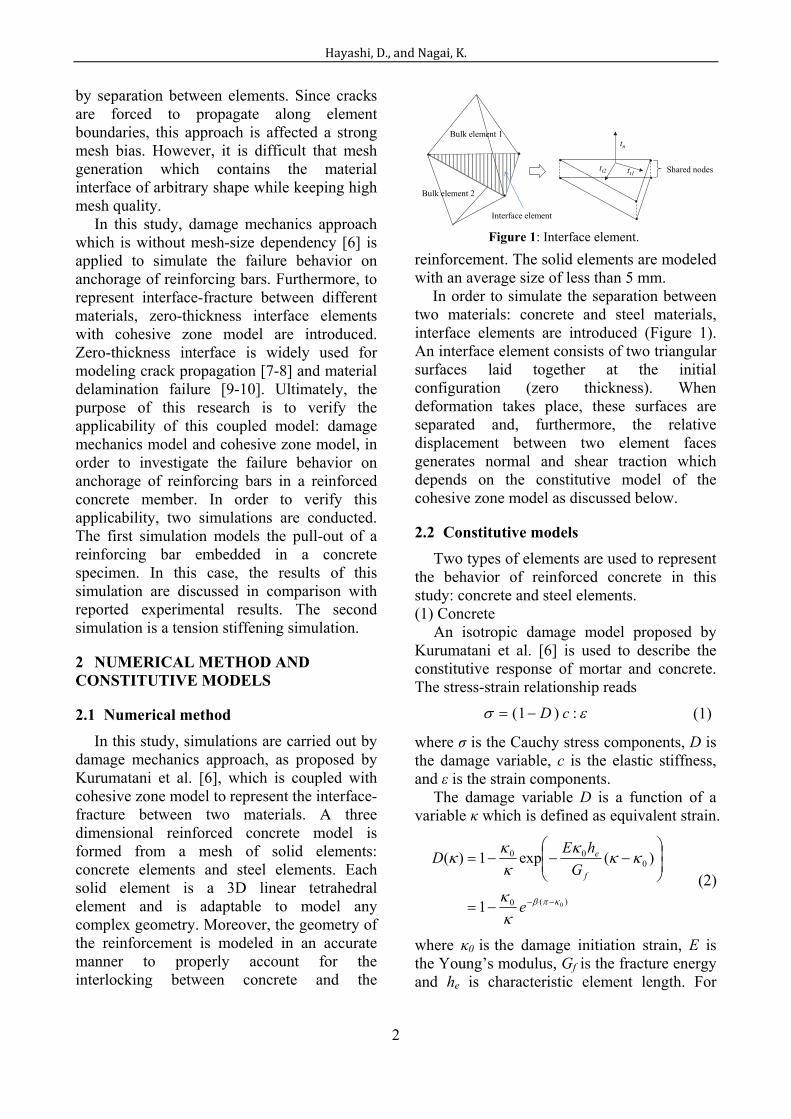
Concrete-steel interface is represented by the relative displacement between zero-thickness interface elements. Figure 2 shows the normal and shear traction-displacement relationships of an interface element. The normal traction is assumed to be elastic both in compression and tension. When the normal traction of an interface element exceeds the tensile strength (σn), the normal traction is assumed to decrease linearly to zero at the maximum crack width wmax. The shear traction is assumed to behave elastic-plastic manner,
with a yield strength τmax. Moreover, the shear traction is reduced according to the normal crack width to represent interface fracture as follows.
)0(
)0(
w
wt
tn
n
s
(5)
3 PULLOUT TEST
In order to validate the proposed model, the experiment conducted by Nagatomo et al. [12], who investigated the pull-out behavior of a reinforcing bar with single transverse rib embedded in a concrete specimen, is referred as a benchmark problem for this study.
3.1 Analysis case
The original experimental specimen is shown in Figure 3. One plain round bar of 22 mm diameter embedded at the center of the concrete specimen was pulled out from the specimen. The pullout bar has one transverse rib with 1.5 mm of height. To avoid splitting failure occurred parallel to the pullout bar, plain round bars are placed with 50 mm of clear space. These bars are 6 mm in diameter.
The simulation cases are listed in Table 1. Three numerical models with different embedded lengths, measured from the top surface of the specimen to the single rib of the reinforcement bar, are considered: L15, having 15 mm embedded length, L30, having 30 mm embedded length, and L60, having 60 mm embedded length. The pullout bar is bonded only at the single transverse rib, and un-bonded at other sections. Stirrups are assumed to be perfectly-bonded.
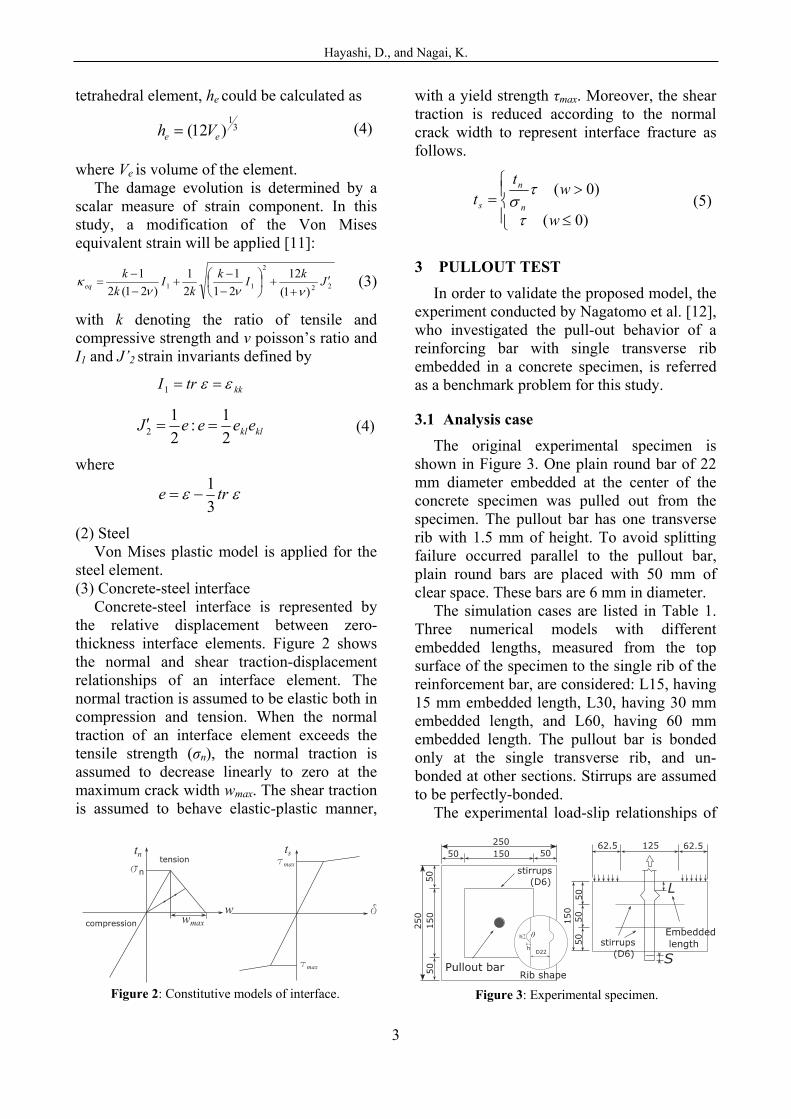
The experimental load-slip relationships of
Figure 3: Experimental specimen.Figure 2: Constitutive models of interface.
Hayashi,D.,andNagai,K.
4
the pullout bar are shown in Figure 4. From the test result, it was observed that the longer embedded lengths attained the higher maximum load. The observed failure mode in L15 and L30 is conical shape failure. Meanwhile, bond splitting failure was observed in L60.
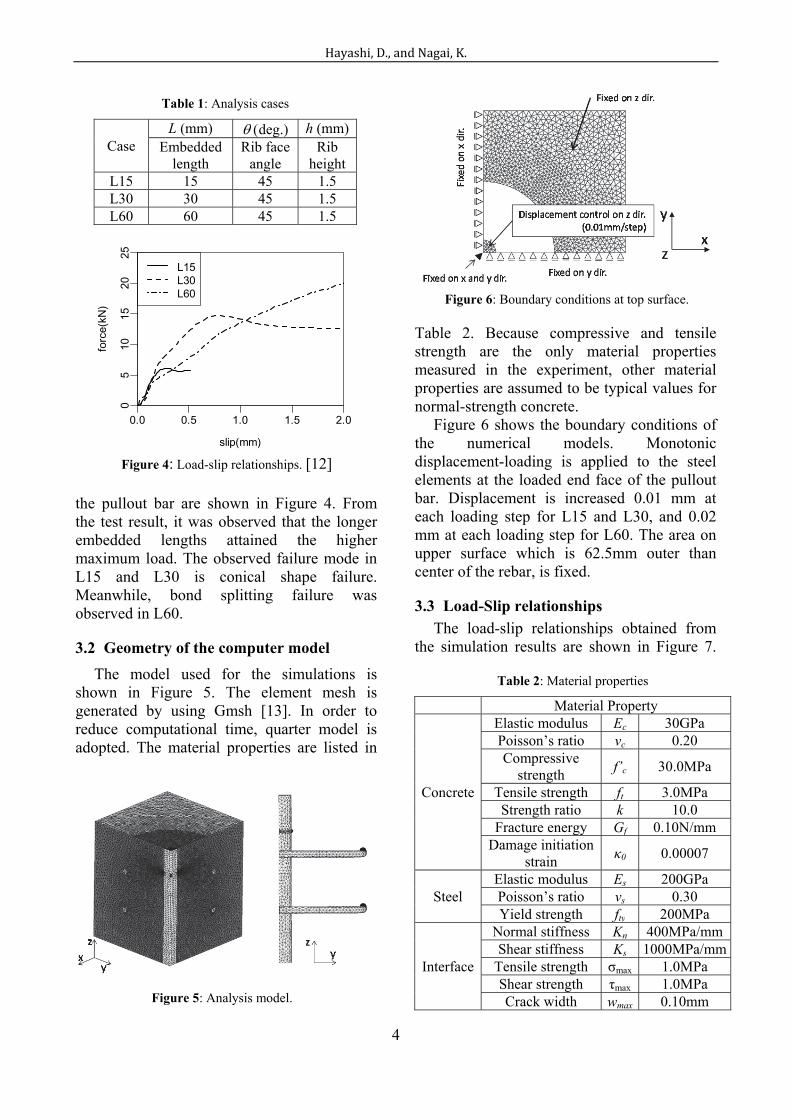
3.2 Geometry of the computer model
The model used for the simulations is shown in Figure 5. The element mesh is generated by using Gmsh [13]. In order to reduce computational time, quarter model is adopted. The material properties are listed in
Table 2. Because compressive and tensile strength are the only material properties measured in the experiment, other material properties are assumed to be typical values for normal-strength concrete.
Figure 6 shows the boundary conditions of the numerical models. Monotonic displacement-loading is applied to the steel elements at the loaded end face of the pullout bar. Displacement is increased 0.01 mm at each loading step for L15 and L30, and 0.02 mm at each loading step for L60. The area on upper surface which is 62.5mm outer than center of the rebar, is fixed.
3.3 Load-Slip relationships
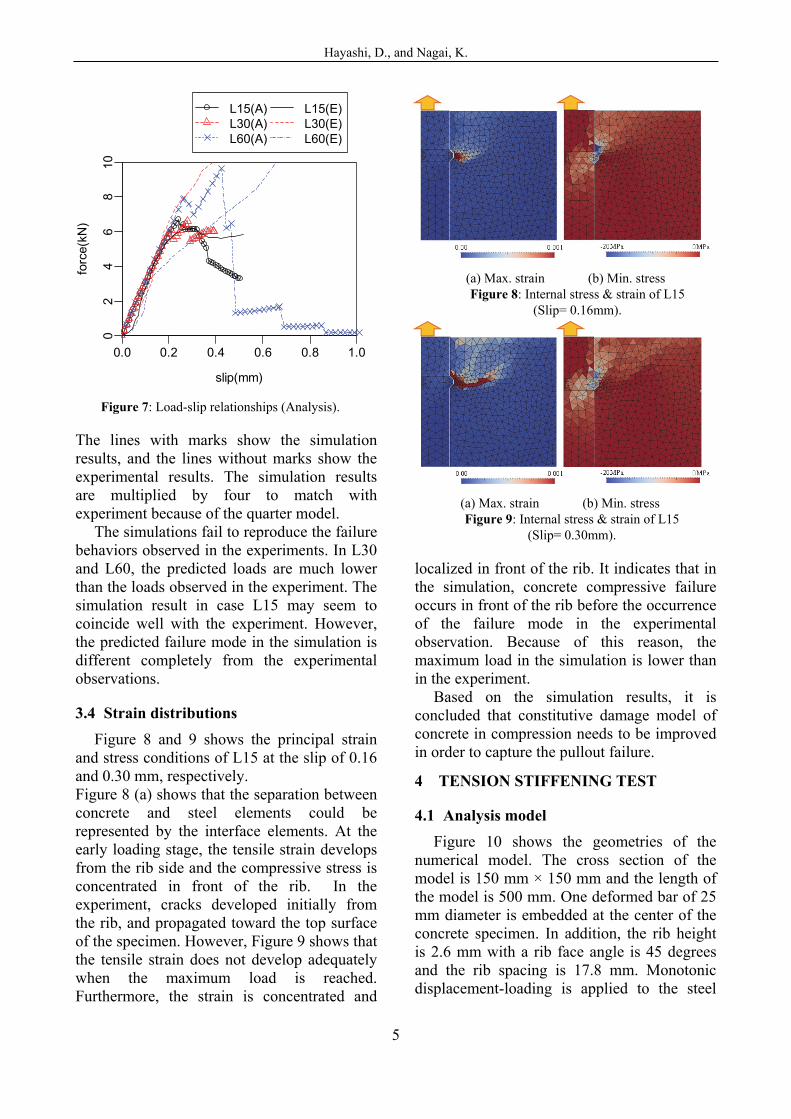
The load-slip relationships obtained from the simulation results are shown in Figure 7.
Table 1: Analysis cases
Case L (mm) deg. h (mm)
Embedded length
Rib face angle
Rib height
L15 15 45 1.5 L30 30 45 1.5 L60 60 45 1.5
0.0 0.5 1.0 1.5 2.0
05
1015
2025
slip(mm)
forc
e(kN
)
L15L30L60
Figure 4: Load-slip relationships. [12]
Figure 5: Analysis model.
Table 2: Material properties
Material Property
Concrete
Elastic modulus Ec 30GPa Poisson’s ratio νc 0.20 Compressive
strength f’c 30.0MPa
Tensile strength ft 3.0MPa Strength ratio k 10.0
Fracture energy Gf 0.10N/mm Damage initiation
strain κ0 0.00007
Steel Elastic modulus Es 200GPa Poisson’s ratio νs 0.30 Yield strength fty 200MPa
Interface
Normal stiffness Kn 400MPa/mmShear stiffness Ks 1000MPa/mm
Tensile strength σmax 1.0MPa Shear strength τmax 1.0MPa Crack width wmax 0.10mm
Figure 6: Boundary conditions at top surface.
Hayashi, D., and Nagai, K.
5
The lines with marks show the simulation results, and the lines without marks show the experimental results. The simulation results are multiplied by four to match with experiment because of the quarter model.
The simulations fail to reproduce the failure behaviors observed in the experiments. In L30 and L60, the predicted loads are much lower than the loads observed in the experiment. The simulation result in case L15 may seem to coincide well with the experiment. However, the predicted failure mode in the simulation is different completely from the experimental observations.
3.4 Strain distributions
Figure 8 and 9 shows the principal strain and stress conditions of L15 at the slip of 0.16 and 0.30 mm, respectively. Figure 8 (a) shows that the separation between concrete and steel elements could be represented by the interface elements. At the early loading stage, the tensile strain develops from the rib side and the compressive stress is concentrated in front of the rib. In the experiment, cracks developed initially from the rib, and propagated toward the top surface of the specimen. However, Figure 9 shows that the tensile strain does not develop adequately when the maximum load is reached. Furthermore, the strain is concentrated and
localized in front of the rib. It indicates that in the simulation, concrete compressive failure occurs in front of the rib before the occurrence of the failure mode in the experimental observation. Because of this reason, the maximum load in the simulation is lower than in the experiment.
Based on the simulation results, it is concluded that constitutive damage model of concrete in compression needs to be improved in order to capture the pullout failure.
4 TENSION STIFFENING TEST
4.1 Analysis model
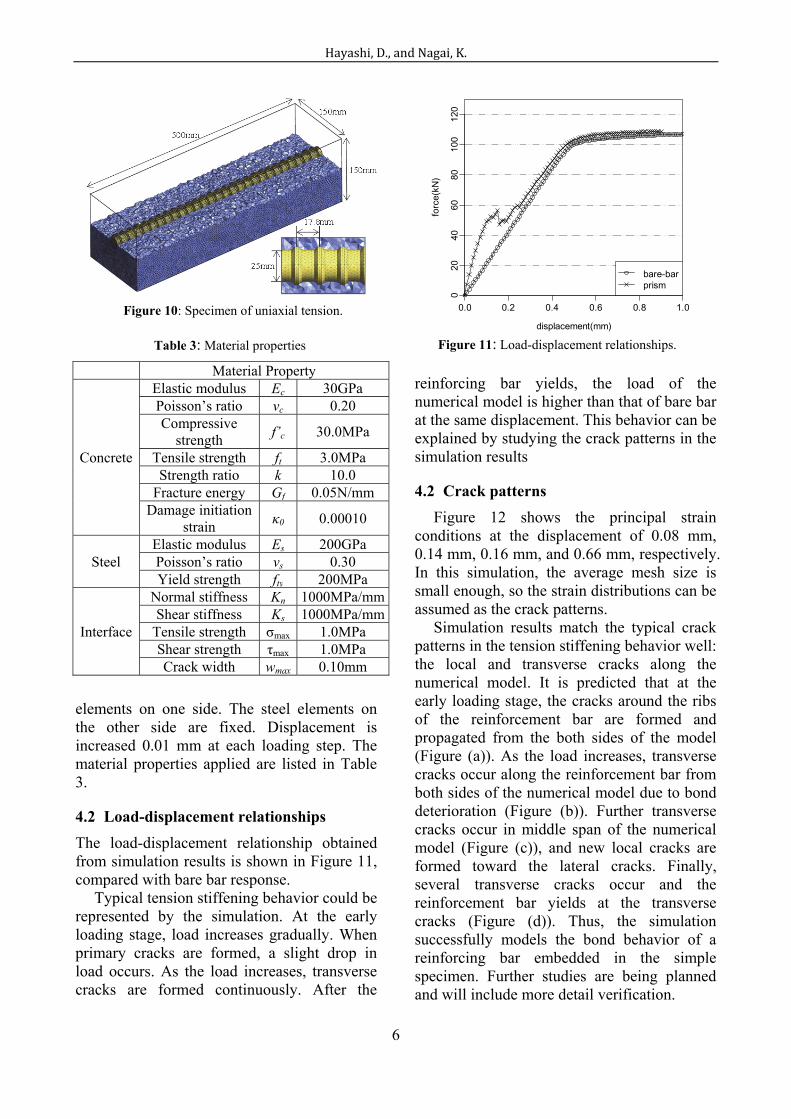
Figure 10 shows the geometries of the numerical model. The cross section of the model is 150 mm × 150 mm and the length of the model is 500 mm. One deformed bar of 25 mm diameter is embedded at the center of the concrete specimen. In addition, the rib height is 2.6 mm with a rib face angle is 45 degrees and the rib spacing is 17.8 mm. Monotonic displacement-loading is applied to the steel
0.0 0.2 0.4 0.6 0.8 1.0
02
46
810
slip(mm)
forc
e(kN
)
L15(A)L30(A)L60(A)
L15(E)L30(E)L60(E)
Figure 7: Load-slip relationships (Analysis).
(a) Max. strain (b) Min. stress Figure 8: Internal stress & strain of L15
(Slip= 0.16mm).
(a) Max. strain (b) Min. stress Figure 9: Internal stress & strain of L15
(Slip= 0.30mm).
Hayashi,D.,andNagai,K.
6
elements on one side. The steel elements on the other side are fixed. Displacement is increased 0.01 mm at each loading step. The material properties applied are listed in Table 3.
4.2 Load-displacement relationships
The load-displacement relationship obtained from simulation results is shown in Figure 11, compared with bare bar response.
Typical tension stiffening behavior could be represented by the simulation. At the early loading stage, load increases gradually. When primary cracks are formed, a slight drop in load occurs. As the load increases, transverse cracks are formed continuously. After the
reinforcing bar yields, the load of the numerical model is higher than that of bare bar at the same displacement. This behavior can be explained by studying the crack patterns in the simulation results
4.2 Crack patterns
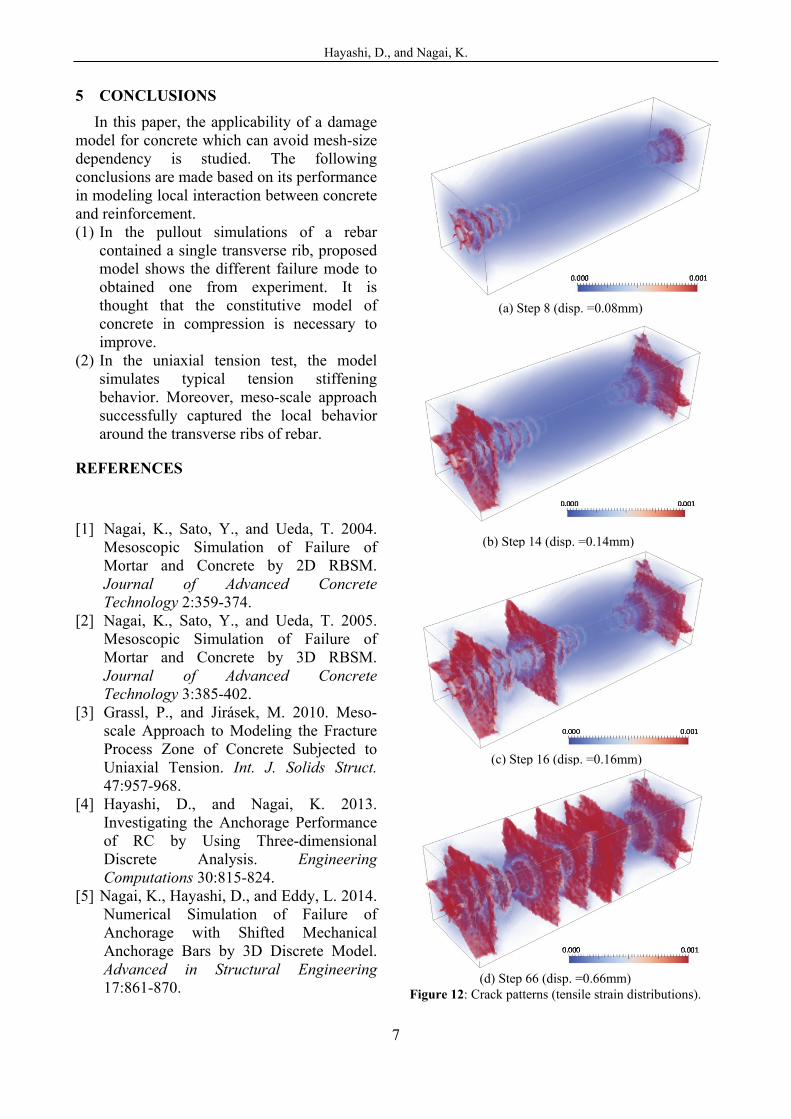
Figure 12 shows the principal strain conditions at the displacement of 0.08 mm, 0.14 mm, 0.16 mm, and 0.66 mm, respectively. In this simulation, the average mesh size is small enough, so the strain distributions can be assumed as the crack patterns.
Simulation results match the typical crack patterns in the tension stiffening behavior well: the local and transverse cracks along the numerical model. It is predicted that at the early loading stage, the cracks around the ribs of the reinforcement bar are formed and propagated from the both sides of the model (Figure (a)). As the load increases, transverse cracks occur along the reinforcement bar from both sides of the numerical model due to bond deterioration (Figure (b)). Further transverse cracks occur in middle span of the numerical model (Figure (c)), and new local cracks are formed toward the lateral cracks. Finally, several transverse cracks occur and the reinforcement bar yields at the transverse cracks (Figure (d)). Thus, the simulation successfully models the bond behavior of a reinforcing bar embedded in the simple specimen. Further studies are being planned and will include more detail verification.
Figure 10: Specimen of uniaxial tension.
Table 3: Material properties
Material Property
Concrete
Elastic modulus Ec 30GPa Poisson’s ratio νc 0.20 Compressive
strength f’c 30.0MPa
Tensile strength ft 3.0MPa Strength ratio k 10.0
Fracture energy Gf 0.05N/mm Damage initiation
strain κ0 0.00010
Steel Elastic modulus Es 200GPa Poisson’s ratio νs 0.30 Yield strength fty 200MPa
Interface
Normal stiffness Kn 1000MPa/mmShear stiffness Ks 1000MPa/mm
Tensile strength σmax 1.0MPa Shear strength τmax 1.0MPa Crack width wmax 0.10mm
0.0 0.2 0.4 0.6 0.8 1.0
020
4060
8010
012
0
displacement(mm)
forc
e(kN
)
bare-barprism
Figure 11: Load-displacement relationships.
Hayashi, D., and Nagai, K.
7
5 CONCLUSIONS
In this paper, the applicability of a damage model for concrete which can avoid mesh-size dependency is studied. The following conclusions are made based on its performance in modeling local interaction between concrete and reinforcement. (1) In the pullout simulations of a rebar
contained a single transverse rib, proposed model shows the different failure mode to obtained one from experiment. It is thought that the constitutive model of concrete in compression is necessary to improve.
(2) In the uniaxial tension test, the model simulates typical tension stiffening behavior. Moreover, meso-scale approach successfully captured the local behavior around the transverse ribs of rebar.
REFERENCES
[1] Nagai, K., Sato, Y., and Ueda, T. 2004. Mesoscopic Simulation of Failure of Mortar and Concrete by 2D RBSM. Journal of Advanced Concrete Technology 2:359-374.
[2] Nagai, K., Sato, Y., and Ueda, T. 2005. Mesoscopic Simulation of Failure of Mortar and Concrete by 3D RBSM. Journal of Advanced Concrete Technology 3:385-402.
[3] Grassl, P., and Jirásek, M. 2010. Meso-scale Approach to Modeling the Fracture Process Zone of Concrete Subjected to Uniaxial Tension. Int. J. Solids Struct. 47:957-968.
[4] Hayashi, D., and Nagai, K. 2013. Investigating the Anchorage Performance of RC by Using Three-dimensional Discrete Analysis. Engineering Computations 30:815-824.
[5] Nagai, K., Hayashi, D., and Eddy, L. 2014. Numerical Simulation of Failure of Anchorage with Shifted Mechanical Anchorage Bars by 3D Discrete Model. Advanced in Structural Engineering 17:861-870.
(a) Step 8 (disp. =0.08mm)
(b) Step 14 (disp. =0.14mm)
(c) Step 16 (disp. =0.16mm)
(d) Step 66 (disp. =0.66mm) Figure 12: Crack patterns (tensile strain distributions).
Hayashi,D.,andNagai,K.
8
[6] Kurumatani, M., Terada, K., Kato, J., Kyotani, T., and Kashiyama, K. 2013. An Isotropic Damage Model Based on Fracture Mechanics for Concrete and its Evaluation. Transactions of JSCE No.20130015. (in Japanse)
[7] Ortiz, M. and Pandolfi, A. 1999. Finite-Deformation Irreversible Cohesive Elements for Three-dimensional Crack-Propagation Analysis, Int. J. Numer. Meth. Engng. 44:1267-1282.
[8] López, C.M, Carol, I., and Aguado, A. 2007. Meso-structural Study of Concrete Fracture Using Interface Elements. I: Numerical Model and Tensile Behavior. Materials and Structures 41:583-599.
[9] Geubelle, P.H., and Baylor, J.S. 1998. Impact-induced Delamination of Composites: a 2D Simulation. Composites Part B 29B:589-602.
[10] Segurado, J., and LLorca, J. 2004. A New Three-dimensional Interface Finite Element to Simulate Fracture in Composites. Int. J. Solids Struct. 41:2977-2993.
[11] de Vree, J.H.P., Brekelmans, W.A.M., and van Gils, M.A.J. 1995. Comparison of Nonlocal Approaches in Continuum Damage Mechanics. Comupt. Struct. 55:581-588.
[12] Nagatomo, K., and Kaku, T. 1986. Study on Bond Characteristics of Deformed Bars with Only a Single Transverse Rib. Transcriptions of JSCE 372:177-186.
[13] Geuzaine, C., and Remacle, J.F. 2009. Gmsh: a Therr-dimensional Finete Element Generator with Built-in Pre- and Post-processing Facilities. Int. J. Numer. Meth. Engng.79:1309-1331.