Embed Size (px)
Citation preview
画像サイズ
W195 x H530 px
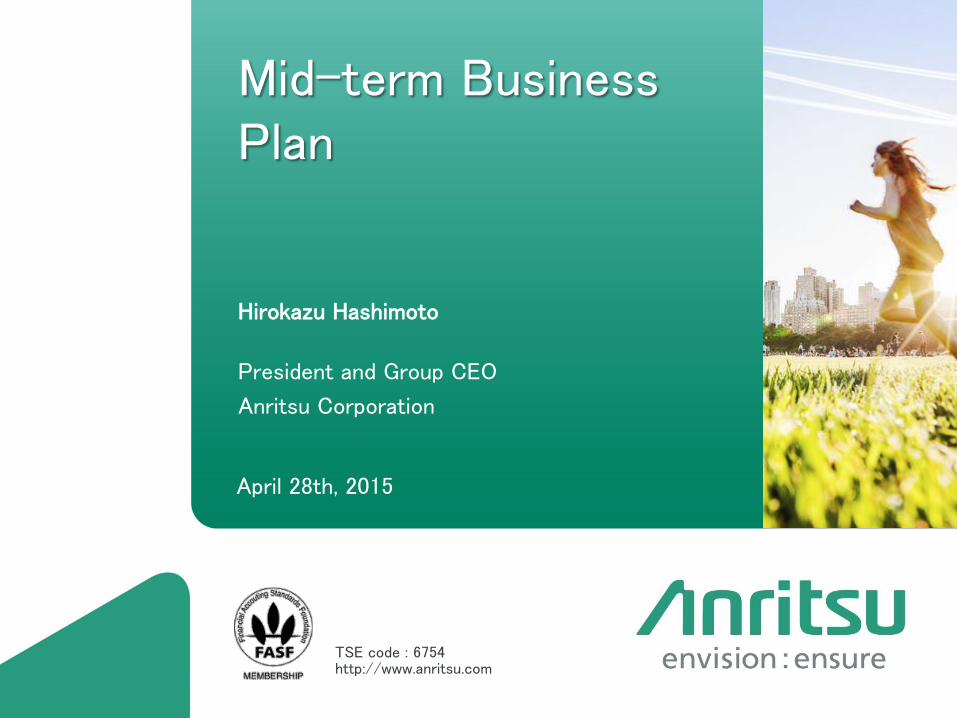
Mid-term Business Plan
Hirokazu Hashimoto
President and Group CEO
Anritsu Corporation
April 28th, 2015
TSE code : 6754 http://www.anritsu.com
2 Copyright© ANRITSU CORPORATION
GLP2017
All information contained in this release which pertains to the current plans, estimates, strategies and beliefs of Anritsu Corporation (hereafter "Anritsu") that is not historical fact shall be considered forward-looking statements of future business results or other forward-looking projections pertinent to the business of Anritsu. Implicit in reliance on these and all future projections is the unavoidable risk, caused by the existence of uncertainties about future events, that any and all suggested projections may not, come to pass. Forward-looking statements include but are not limited to those using words such as "believe", "expect", "plans", "strategy", "prospects", "forecast", "estimate", "project", "anticipate", "may" or "might" and words of similar meaning in connection with a discussion of future operations or financial performance. Actual business results are the outcome of a number of unknown variables and may substantially differ from the figures projected herein. Factors which may affect the actual business results include but are not limited to the economic situation in the geographic areas in which Anritsu conducts business, including but not limited to, Japan, Americas, Asia, and Europe, changes in actual demand for Anritsu products and services, increases or decreases in the competitive nature of markets in which Anritsu sells products or buys supplies, changing aptitudes at providing services, and exchange rates. You also should not place reliance on any obligation of Anritsu to update or revise any forward-looking statements, whether as a result of new information, future events or otherwise. Anritsu disclaims any such obligation.
Cautionary Statement
Copyright© ANRITSU CORPORATION 3
GLP2017
1. Review of the Mid-term Business Plan GLP2014
2. New Three-year Business Plan GLP2017 and the 2020VISION
3. Revenue and operating profit plan for GLP2017
4. Strategy and growth opportunities in the T&M business
5. Growth strategy in the Industrial Automation business
6. Financial strategy
7. Measures for strengthening governance
Agenda
4 Copyright© ANRITSU CORPORATION
GLP2017
Blank slide
5 Copyright© ANRITSU CORPORATION
GLP2017
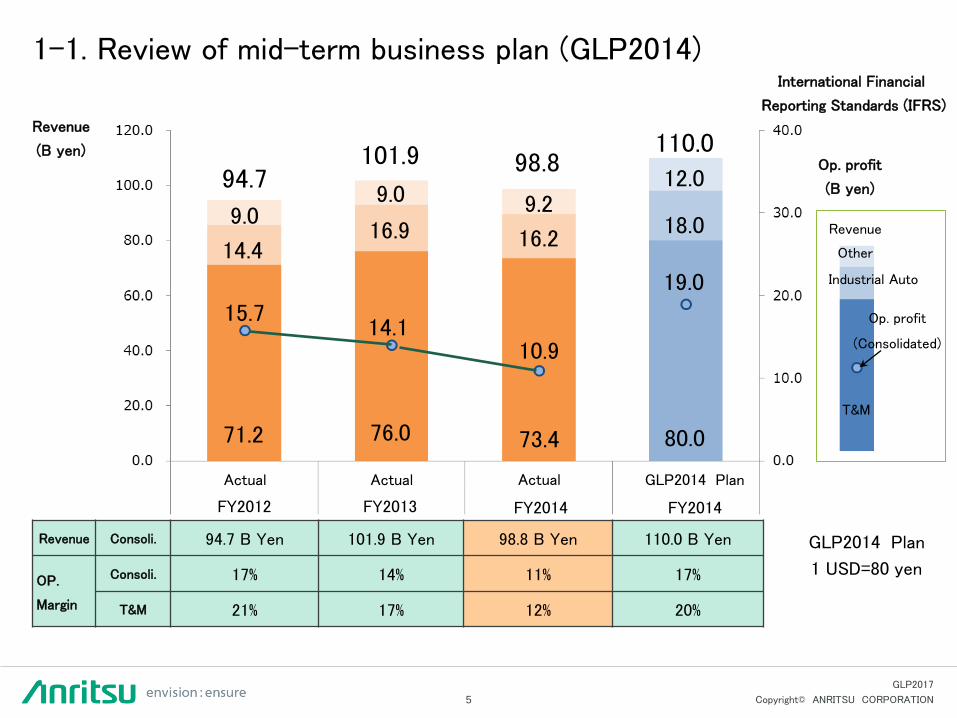
FY2012 FY2014 FY2014 FY2013
98.8
16.2
73.4
10.9
9.2
1-1. Review of mid-term business plan (GLP2014)
Revenue Consoli. 94.7 B Yen 101.9 B Yen 98.8 B Yen 110.0 B Yen
OP.
Margin
Consoli. 17% 14% 11% 17%
T&M 21% 17% 12% 20%
International Financial
Reporting Standards (IFRS)
Op. profit
(B yen)
T&M
Industrial Auto
Revenue
Other
Op. profit
(Consolidated)
1 USD=80 yen
Revenue
(B yen)
94.7
14.4
71.2
15.7
9.0
Actual Actual GLP2014 Plan Actual
101.9
16.9
76.0
14.1
9.0
110.0
19.0
18.0
80.0
12.0
GLP2014 Plan
6 Copyright© ANRITSU CORPORATION
GLP2017
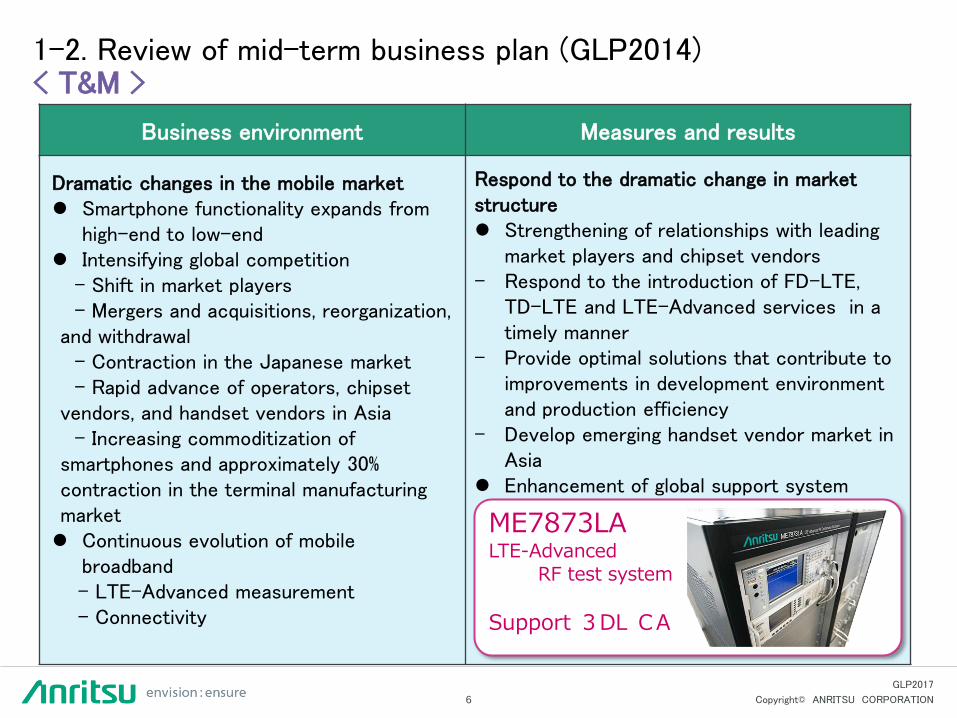
1-2. Review of mid-term business plan (GLP2014)
Business environment Measures and results
Dramatic changes in the mobile market Smartphone functionality expands from
high-end to low-end Intensifying global competition - Shift in market players - Mergers and acquisitions, reorganization, and withdrawal - Contraction in the Japanese market - Rapid advance of operators, chipset vendors, and handset vendors in Asia - Increasing commoditization of smartphones and approximately 30% contraction in the terminal manufacturing market Continuous evolution of mobile
broadband - LTE-Advanced measurement - Connectivity
Respond to the dramatic change in market structure Strengthening of relationships with leading
market players and chipset vendors - Respond to the introduction of FD-LTE,
TD-LTE and LTE-Advanced services in a timely manner
- Provide optimal solutions that contribute to improvements in development environment and production efficiency
- Develop emerging handset vendor market in Asia
Enhancement of global support system
< T&M >
ME7873LA LTE-Advanced RF test system
Support 3DL CA
7 Copyright© ANRITSU CORPORATION
GLP2017
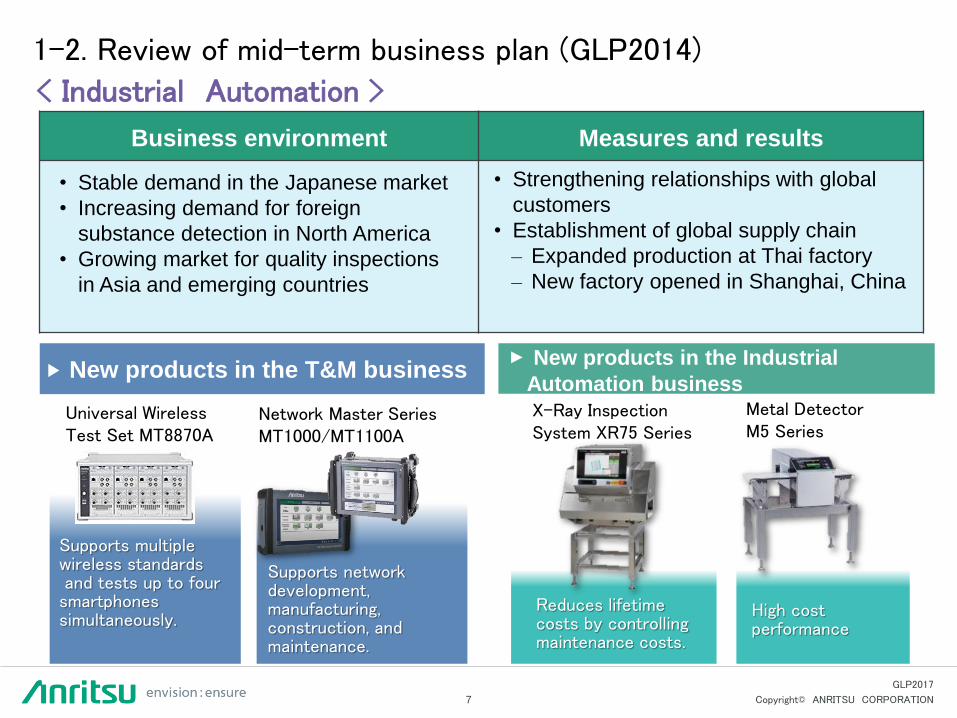
1-2. Review of mid-term business plan (GLP2014)
< Industrial Automation >
Business environment Measures and results
• Stable demand in the Japanese market
• Increasing demand for foreign
substance detection in North America
• Growing market for quality inspections
in Asia and emerging countries
• Strengthening relationships with global
customers
• Establishment of global supply chain
– Expanded production at Thai factory
– New factory opened in Shanghai, China
High cost performance
Metal Detector M5 Series
Reduces lifetime costs by controlling maintenance costs.
X-Ray Inspection System XR75 Series
New products in the Industrial
Automation business
Network Master Series MT1000/MT1100A
Supports network development, manufacturing, construction, and maintenance.
New products in the T&M business
Supports multiple wireless standards and tests up to four smartphones simultaneously.
Universal Wireless Test Set MT8870A
8 Copyright© ANRITSU CORPORATION
GLP2017
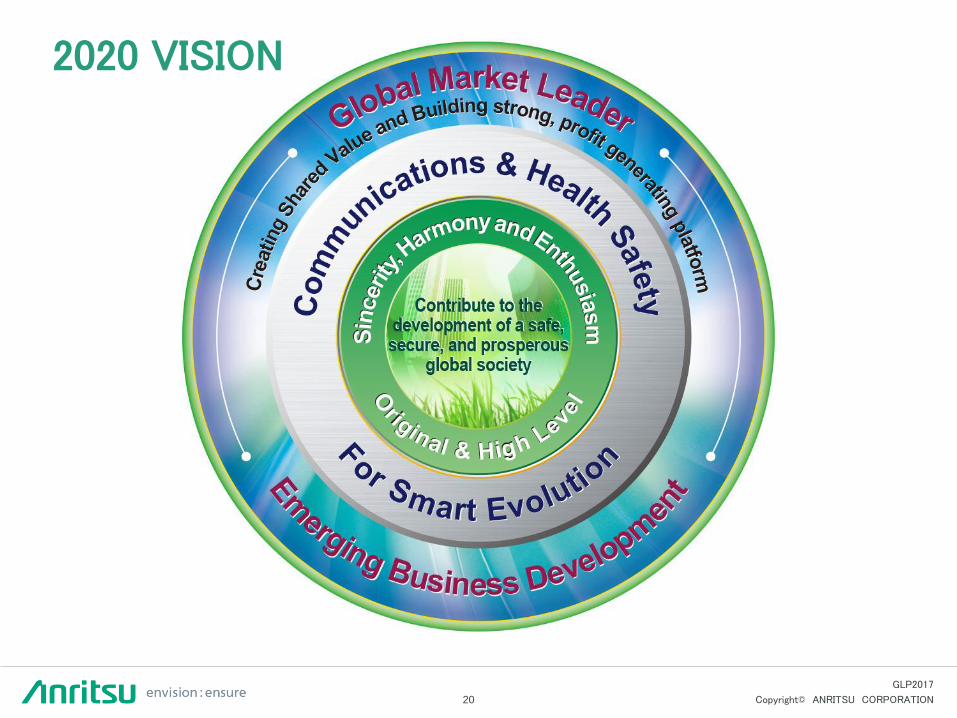
2020 VISION
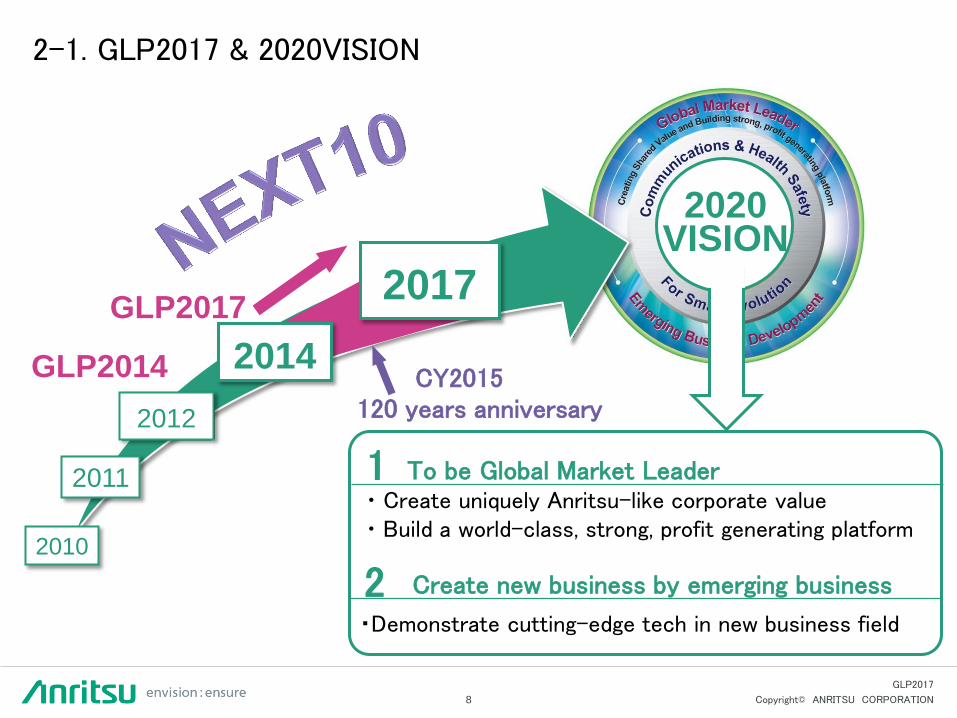
2-1. GLP2017 & 2020VISION
120 years anniversary
To be Global Market Leader ・Create uniquely Anritsu-like corporate value ・Build a world-class, strong, profit generating platform
Create new business by emerging business
・Demonstrate cutting-edge tech in new business field
2
2012
2011
GLP2017
2012
2014
2017
2010
GLP2014
1
CY2015
9 Copyright© ANRITSU CORPORATION
GLP2017
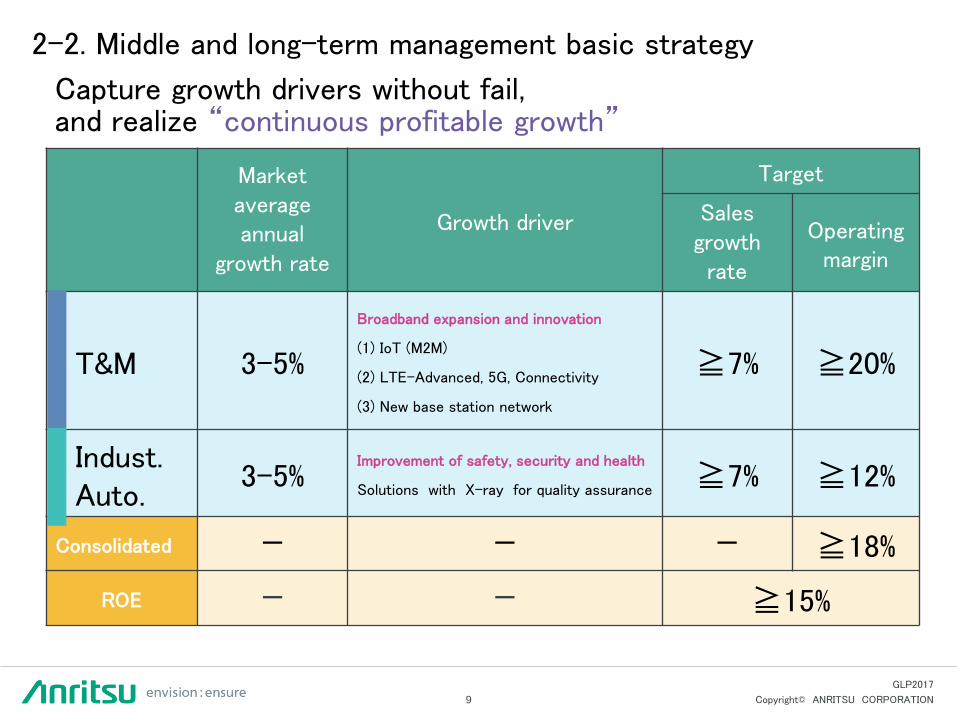
2-2. Middle and long-term management basic strategy
Market average annual
growth rate
Growth driver
Target
Sales growth rate
Operating margin
T&M 3-5%
Broadband expansion and innovation
(1) IoT (M2M)
(2) LTE-Advanced, 5G, Connectivity
(3) New base station network
≧7% ≧20%
Indust. Auto.
3-5% Improvement of safety, security and health
Solutions with X-ray for quality assurance ≧7% ≧12%
Consolidated - - - ≧18%
ROE - - ≧15%
Capture growth drivers without fail, and realize “continuous profitable growth”
10 Copyright© ANRITSU CORPORATION
GLP2017
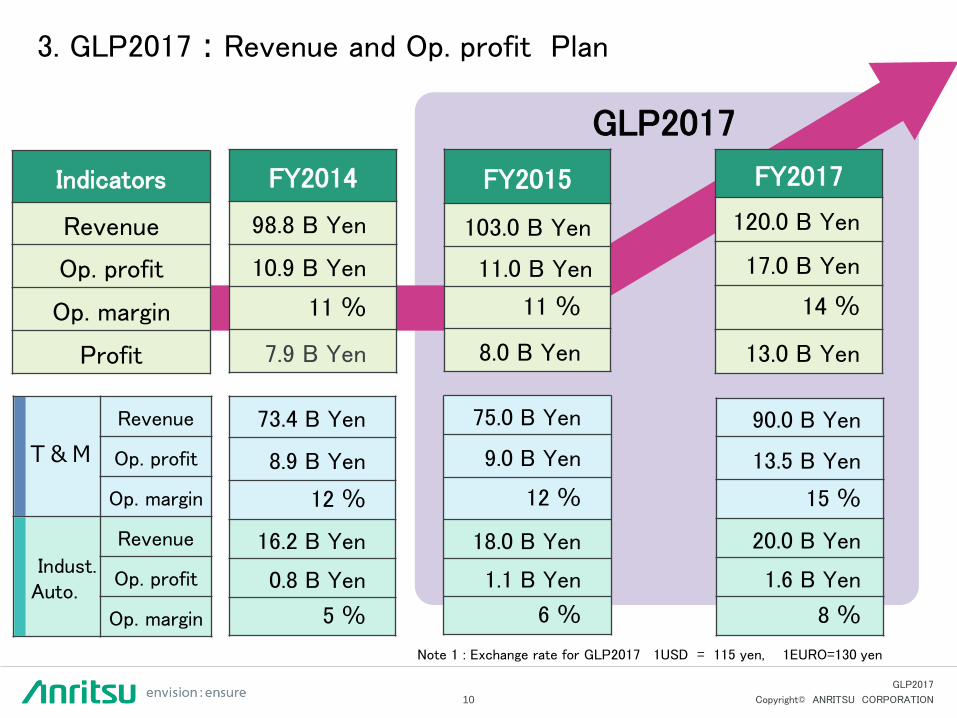
3. GLP2017:Revenue and Op. profit Plan
Indicators
Revenue
Op. profit
Op. margin
Profit
FY2014
98.8 B Yen
10.9 B Yen
11 %
7.9 B Yen
FY2015
103.0 B Yen
11.0 B Yen
11 %
8.0 B Yen
FY2017
120.0 B Yen
17.0 B Yen
14 %
13.0 B Yen
GLP2017
T & M
Revenue
Op. profit
Op. margin
Indust. Auto.
Revenue
Op. profit
Op. margin
73.4 B Yen
8.9 B Yen
12 %
16.2 B Yen
0.8 B Yen
5 %
75.0 B Yen
9.0 B Yen
12 %
18.0 B Yen
1.1 B Yen
6 %
90.0 B Yen
13.5 B Yen
15 %
20.0 B Yen
1.6 B Yen
8 %
Note 1 : Exchange rate for GLP2017 1USD = 115 yen, 1EURO=130 yen
11 Copyright© ANRITSU CORPORATION
GLP2017
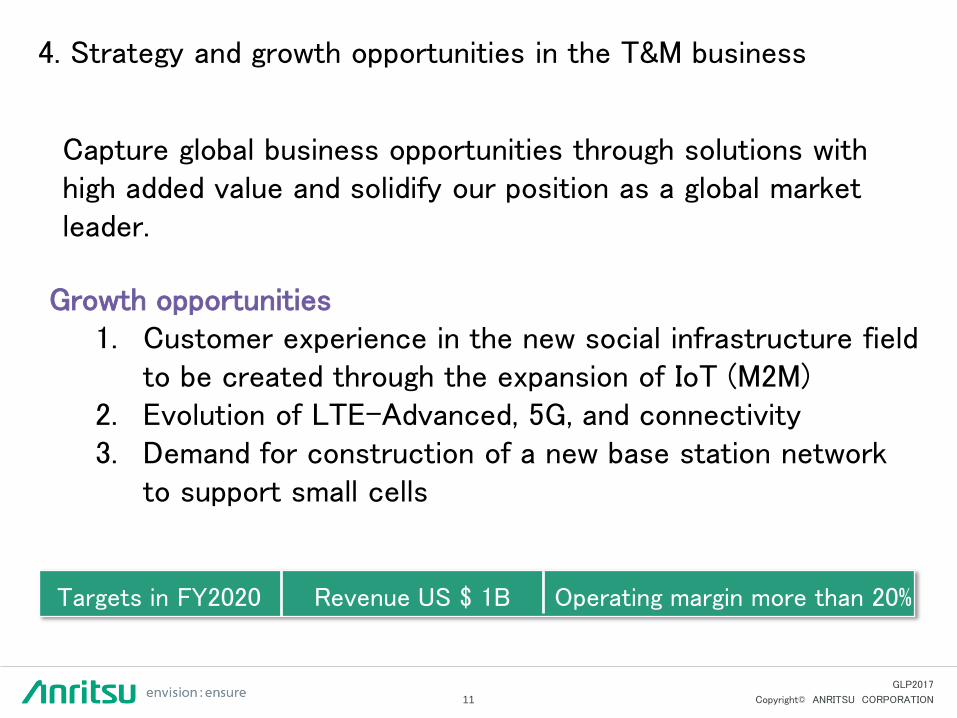
Capture global business opportunities through solutions with high added value and solidify our position as a global market leader.
4. Strategy and growth opportunities in the T&M business
Growth opportunities 1. Customer experience in the new social infrastructure field
to be created through the expansion of IoT (M2M) 2. Evolution of LTE-Advanced, 5G, and connectivity 3. Demand for construction of a new base station network
to support small cells
Targets in FY2020 Revenue US $ 1B Operating margin more than 20%
12 Copyright© ANRITSU CORPORATION
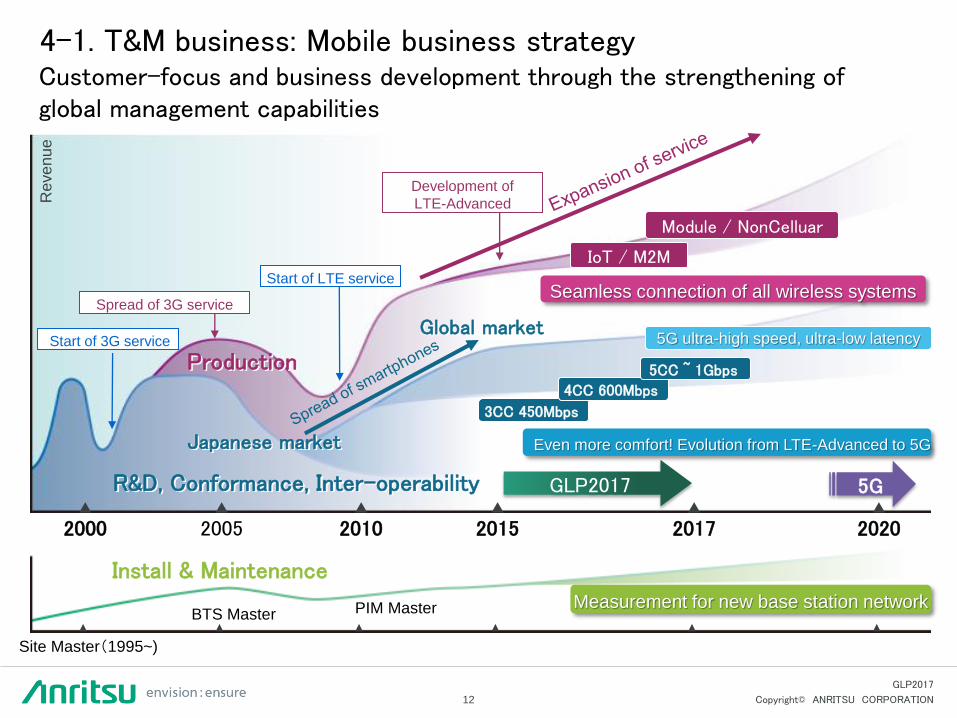
GLP2017
Japanese market
R&D, Conformance, Inter-operability
Global market
IoT / M2M
Production
3CC 450Mbps
Module / NonCelluar
Install & Maintenance
Site Master(1995~)
BTS Master PIM Master
GLP2017
2000 2005 2010 2015 2017 2020
4CC 600Mbps
5CC ~ 1Gbps
5G
4-1. T&M business: Mobile business strategy Customer-focus and business development through the strengthening of global management capabilities
Development of
LTE-Advanced
Seamless connection of all wireless systems
5G ultra-high speed, ultra-low latency
Even more comfort! Evolution from LTE-Advanced to 5G
Start of LTE service
Spread of 3G service
Start of 3G service
Measurement for new base station network
Reve
nu
e
13 Copyright© ANRITSU CORPORATION
GLP2017
0.0
2.0
4.0
6.0
8.0
10.0
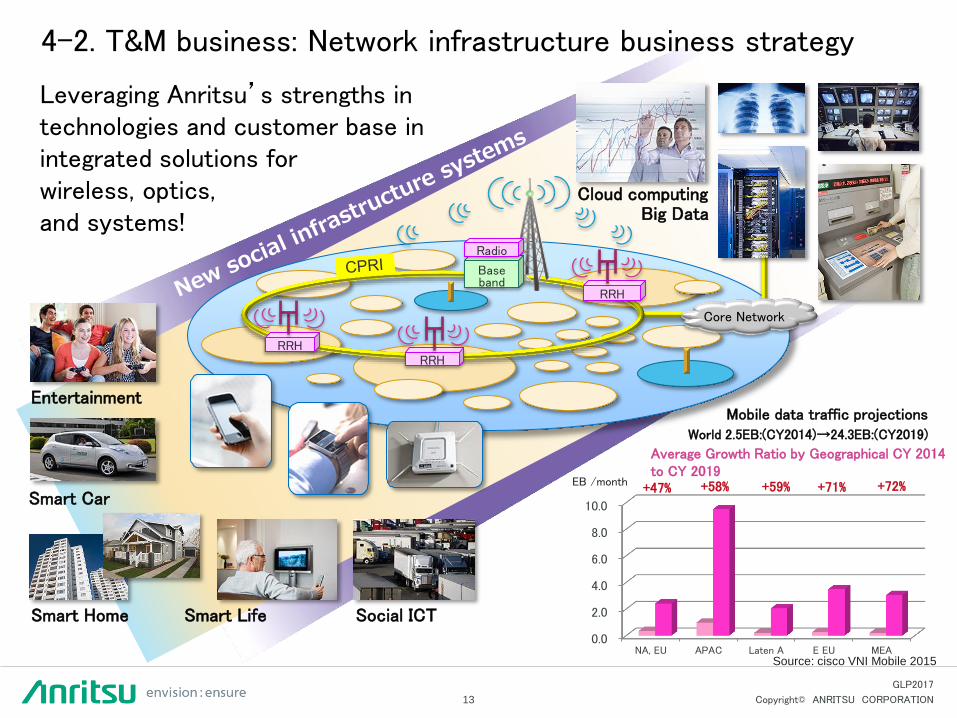
NA, EU APAC Laten A E EU MEA
Smart Car
Smart Home
Entertainment
Leveraging Anritsu’s strengths in technologies and customer base in integrated solutions for wireless, optics, and systems!
4-2. T&M business: Network infrastructure business strategy
Mobile data traffic projections World 2.5EB:(CY2014)→24.3EB:(CY2019)
+72% +71% +59% +58% +47% EB /month
Average Growth Ratio by Geographical CY 2014 to CY 2019
Smart Life Social ICT
RRH RRH
RRH
Base band
Radio
Core Network
Source: cisco VNI Mobile 2015
Cloud computing Big Data
14 Copyright© ANRITSU CORPORATION
GLP2017
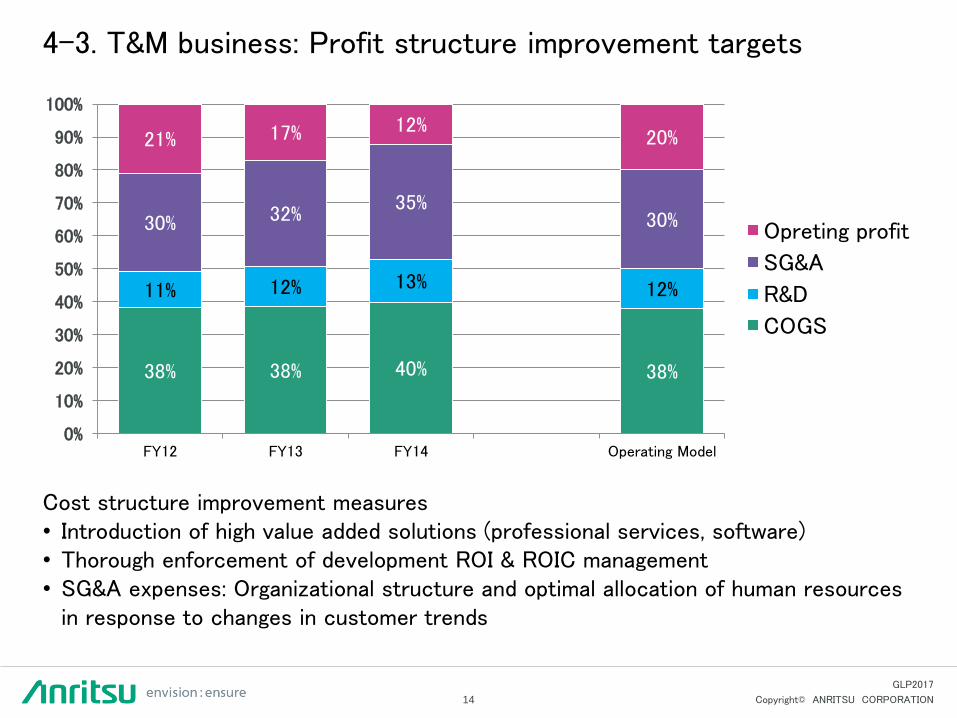
38% 38% 40% 38%
11% 12% 13% 12%
30% 32% 35%
30%
21% 17% 12% 20%
0%
10%
20%
30%
40%
50%
60%
70%
80%
90%
100%
FY12 FY13 FY14 Operating Model
Opreting profit
SG&A
R&D
COGS
4-3. T&M business: Profit structure improvement targets
Cost structure improvement measures • Introduction of high value added solutions (professional services, software) • Thorough enforcement of development ROI & ROIC management • SG&A expenses: Organizational structure and optimal allocation of human resources
in response to changes in customer trends
15 Copyright© ANRITSU CORPORATION
GLP2017
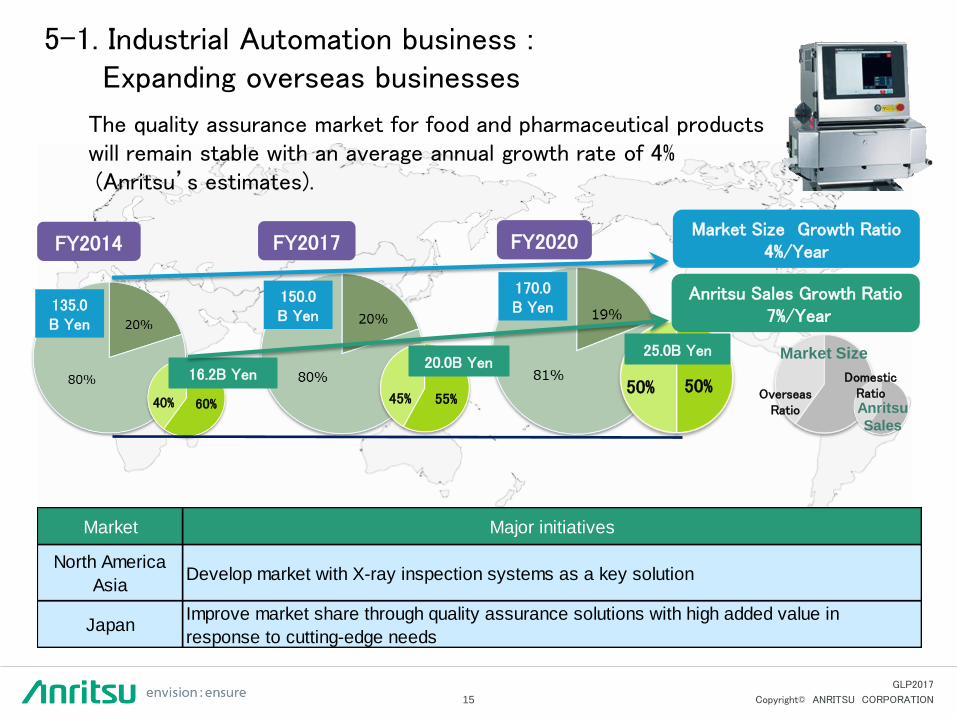
5-1. Industrial Automation business : Expanding overseas businesses
The quality assurance market for food and pharmaceutical products will remain stable with an average annual growth rate of 4% (Anritsu’s estimates).
FY2014 FY2017 FY2020
135.0 B Yen
150.0 B Yen
170.0 B Yen
16.2B Yen
25.0B Yen 20.0B Yen
40% 60% 50% 50%
45% 55%
Market Size Growth Ratio 4%/Year
Anritsu Sales Growth Ratio 7%/Year
Overseas Ratio
Market Size
Anritsu
Sales
Domestic Ratio
Market Major initiatives
North America
AsiaDevelop market with X-ray inspection systems as a key solution
JapanImprove market share through quality assurance solutions with high added value in
response to cutting-edge needs
16 Copyright© ANRITSU CORPORATION
GLP2017
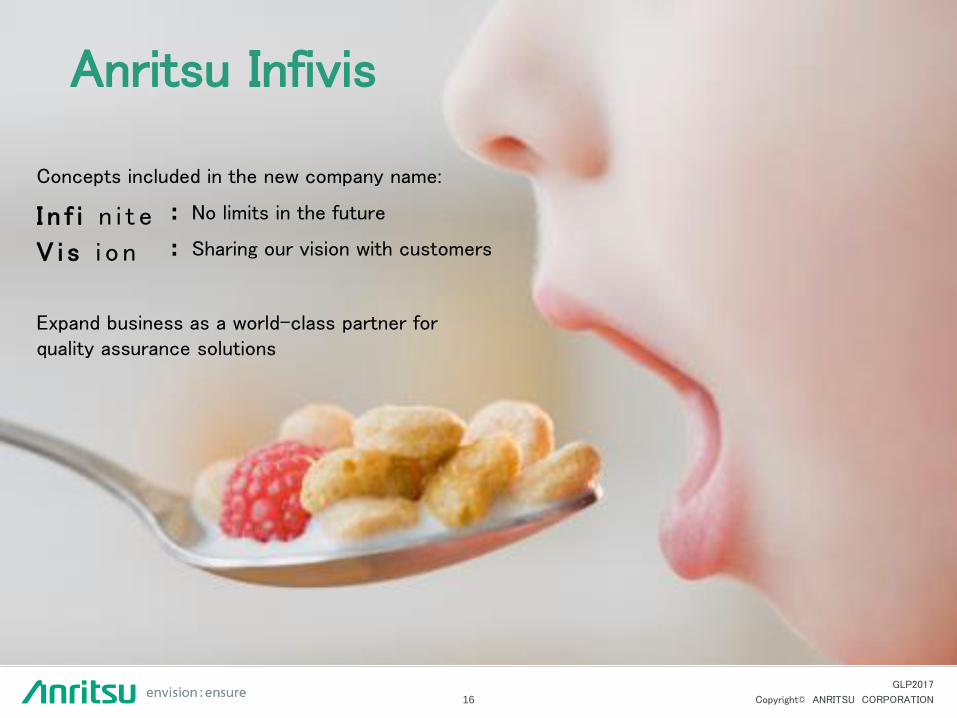
Anritsu Infivis
Expand business as a world-class partner for quality assurance solutions
I n f i n i t e
V i s i o n
: No limits in the future
: Sharing our vision with customers
Concepts included in the new company name:
17 Copyright© ANRITSU CORPORATION
GLP2017
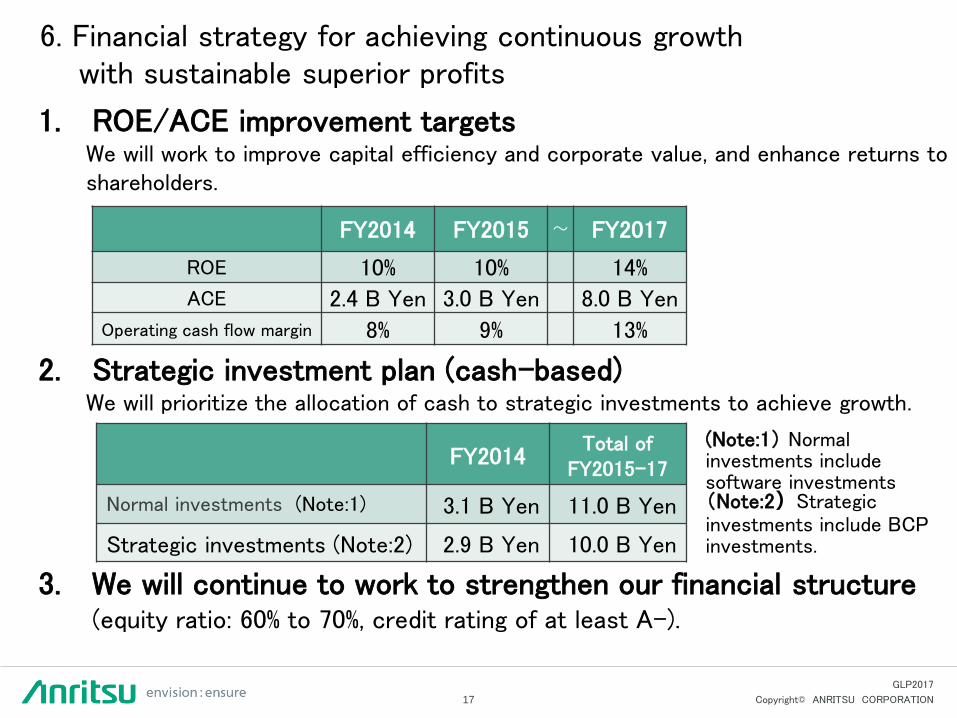
1. ROE/ACE improvement targets We will work to improve capital efficiency and corporate value, and enhance returns to shareholders.
2. Strategic investment plan (cash-based) We will prioritize the allocation of cash to strategic investments to achieve growth.
3. We will continue to work to strengthen our financial structure (equity ratio: 60% to 70%, credit rating of at least A-).
6. Financial strategy for achieving continuous growth with sustainable superior profits
FY2014 Total of
FY2015-17
Normal investments (Note:1) 3.1 B Yen 11.0 B Yen
Strategic investments (Note:2) 2.9 B Yen 10.0 B Yen
(Note:1) Normal investments include software investments (Note:2)Strategic investments include BCP investments.
FY2014 FY2015 ~ FY2017
ROE 10% 10% 14% ACE 2.4 B Yen 3.0 B Yen 8.0 B Yen
Operating cash flow margin 8% 9% 13%
18 Copyright© ANRITSU CORPORATION
GLP2017
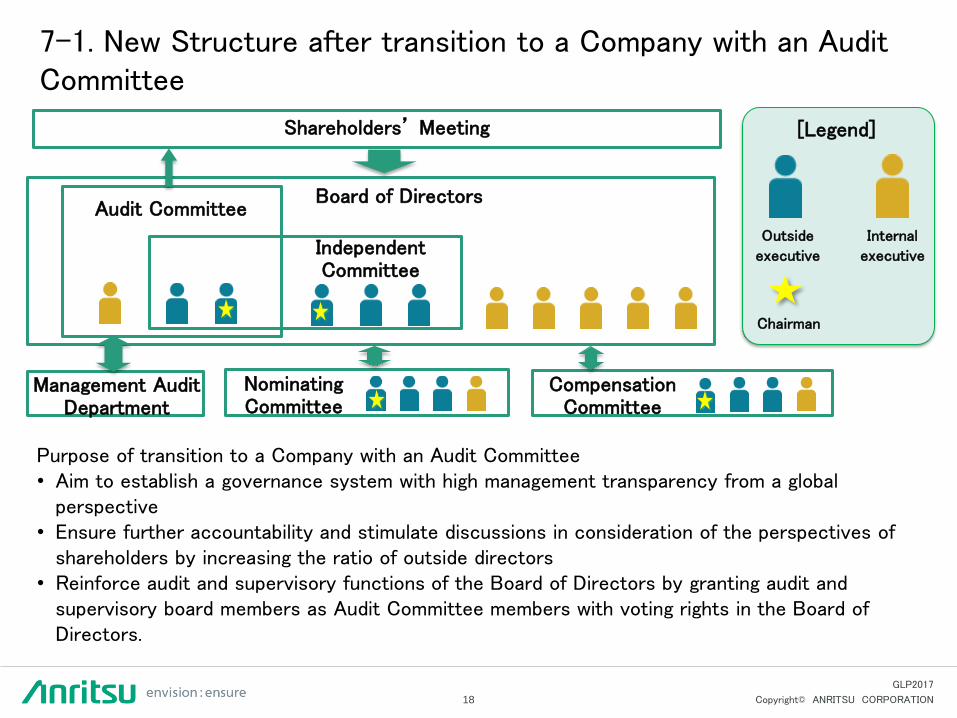
7-1. New Structure after transition to a Company with an Audit Committee Shareholders’ Meeting [Legend]
Audit Committee Board of Directors
Nominating Committee
Compensation Committee
Chairman
Outside
executive Independent Committee
Management Audit Department
Purpose of transition to a Company with an Audit Committee • Aim to establish a governance system with high management transparency from a global
perspective • Ensure further accountability and stimulate discussions in consideration of the perspectives of
shareholders by increasing the ratio of outside directors • Reinforce audit and supervisory functions of the Board of Directors by granting audit and
supervisory board members as Audit Committee members with voting rights in the Board of Directors.
Internal
executive
19 Copyright© ANRITSU CORPORATION
GLP2017
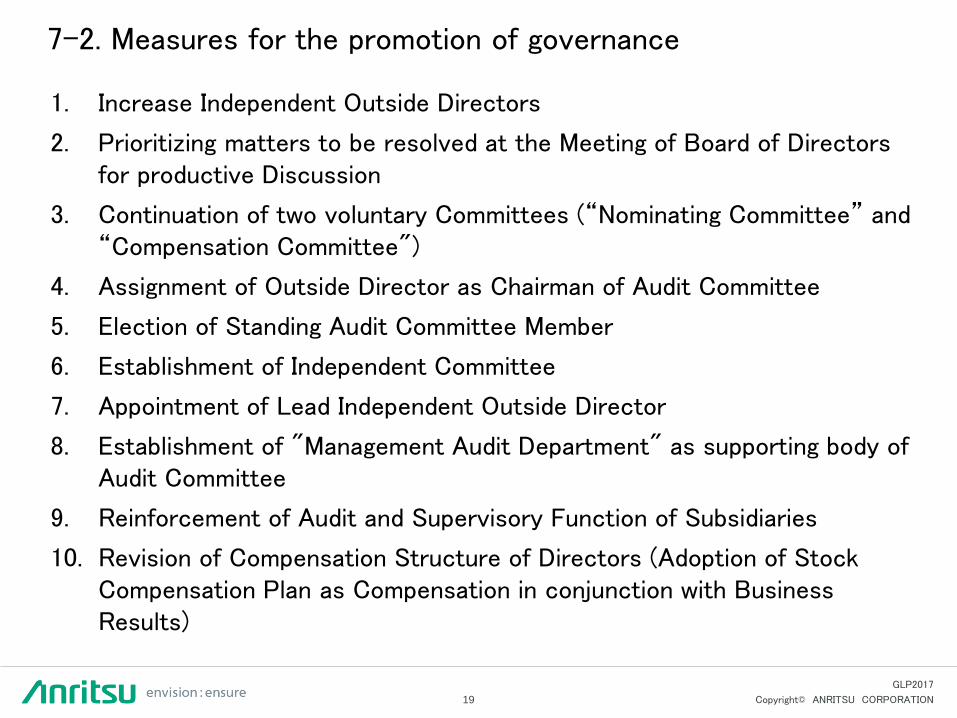
7-2. Measures for the promotion of governance
1. Increase Independent Outside Directors
2. Prioritizing matters to be resolved at the Meeting of Board of Directors for productive Discussion
3. Continuation of two voluntary Committees (“Nominating Committee” and “Compensation Committee")
4. Assignment of Outside Director as Chairman of Audit Committee
5. Election of Standing Audit Committee Member
6. Establishment of Independent Committee
7. Appointment of Lead Independent Outside Director
8. Establishment of "Management Audit Department" as supporting body of Audit Committee
9. Reinforcement of Audit and Supervisory Function of Subsidiaries
10. Revision of Compensation Structure of Directors (Adoption of Stock Compensation Plan as Compensation in conjunction with Business Results)
20 Copyright© ANRITSU CORPORATION
GLP2017
2020 VISION


![Mid term report [fly]](https://img.pdfslide.tips/doc/110x75/55c231f6bb61eb62288b45fd/mid-term-report-fly.jpg)