Embed Size (px)
Citation preview
MIKKO KONTULA IMPACT OF FURNACE DIMENSIONS ON RECOVERY BOILER PERFORMANCE AND COST Master’s Thesis Examiners: Professor Antti Oksanen M.Sc. Lauri Pakarinen
ii
TIIVISTELMÄ
TAMPEREEN TEKNILLINEN YLIOPISTO Ympäristö- ja energiatekniikan koulutusohjelma KONTULA, MIKKO : Tulipesän rakenteen vaikutus soodakattilan toimintaan ja hintaan Diplomityö, 79 sivua, 9 liitesivua Helmikuu 2012 Pääaine: Voimalaitos- ja polttotekniikka Tarkastajat: Professori Antti Oksanen DI Lauri Pakarinen Avainsanat: Soodakattila, soodakattilan suunnittelu, soodakattilan hinnoittelu Tässä työssä tutkittiin soodakattilan suunnittelua ja hinnoittelua. Työn tärkeimpänä tavoitteena oli selvittää erilaisten tulipesän verhoratkaisujen vaikutusta kattilan hintaan ja suorituskykyyn. Työssä tarkasteltiin kahta eri kokoista soodakattilaa, joissa molemmissa suunniteltiin 4 erilaista kattilaa, yksi ilman tulipesäverhoa ja kolme muuta eri kokoisilla tulipesäverhoilla. Kattilat suunniteltiin siten, että niiden toiminta-arvot pysyivät muuttumattomina, jolloin kattilat ovat vertailukelpoisia.
Tulipesäverho on tehokas lämmönsiirtopinta, jonka avulla kattilan tulipesää voidaan madaltaa merkittävästi. Tulipesän korkeudella on merkittävä vaikutus kattilan kustannuksiin. Matalalla tulipesällä voidaan saavuttaa huomattavia kustannussäästöjä mm. kattilarakennuksessa. Toisaalta matalan tulipesän seurauksena savukaasujen viipymäaika tulipesässä lyhenee, joka voi johtaa epätäydelliseen palamiseen ja mm. häkäpäästöjen lisääntymiseen.
Polton ilmakertoimella sekä polttoaineen tai palamattomien ja palamisilmasuihkujen sekoittumisella on suuri merkitys palamisen tehokkuuteen soodakattilassa. Tässä työssä lyhentynyt viipymäaika kompensoitiin suurentamalla ilmakerrointa, eli syöttämällä tulipesään enemmän palamisilmaa. Näin pyrittiin varmistamaan tehokas sekoittuminen ja savukaasujen loppuun palaminen.
Tarvittavan lisäilmamäärän selvittämiseksi tehtiin virtausmallinnuksia sekä analysoitiin toimivista kattiloista kerättyä mittausdataa. Tavoitteena oli selvittää käytetyn ilmakertoimen, eli savukaasujen loppuhapen, ja savukaasujen viipymäajan vaikutus CO päästöihin. Virtausmallinnuksesta ja mittausdatan analysoinnista saatujen tulosten perusteella kattilat voitiin suunnitella siten, että ne saavuttavat samat CO päästöt. Näin kattilat ovat vertailukelpoisia myös päästöarvojen osalta.
Suunnitelluille kattiloille laskettiin hinnat siten, että muuttuvat rakenneosat hinnoiteltiin. Hinnoittelu jaettiin lämmönsiirtopintoihin, korkeapaineputkistoon, teräsrakenteisiin, apulaitteisiin mukaan lukien sähköistys ja kattilarakennukseen. Muuttuville rakenneosille laskettiin materiaali-, valmistus- ja rakentamiskustannukset. Merkittävimmät hintaeroihin vaikuttavat osat olivat kattilarakennus ja lämmönsiirtopinnat.
iii
ABSTRACT TAMPERE UNIVERSITY OF TECHNOLOGY Master’s Degree Programme in Environmental and Energy Technology KONTULA, MIKKO : Impact of furnace dimensions on recovery boiler perform-ance and cost Master of Science Thesis, 79 pages, 9 Appendix pages February 2012 Major: Power Plant and Combustion Technology Examiners: Professor Antti Oksanen M.Sc. Lauri Pakarinen Keywords: Recovery boiler, boiler design criteria, boiler pricing criteria
In this work designing and pricing of the recovery boiler were studied. The main goal was to find out how furnace screen heat transfer surface affects the recovery boiler price and performance. Two different boiler sizes were stud-ied. Four different boilers were designed in both boiler sizes. One boiler was designed without furnace screen and three others with different size of furnace screens. The boilers were desinged so that they reached the same perform-ances and were comparable.
The furnace screen is an effective heat transfer surface and by adding the furnace screen the furnace can be designed lower. Furnace height has a significant effect on the total price of the boiler. On the other hand, the reduced furnace height yields shorter flue gas residence time, which can lead to incom-plete combustion resulting e.g. increased emissions.
Combustion air ratio and mixing of reactants with the air jets have a great effect on the combustion efficiency. In this study, the reduced residence time was compensated by the higher combustion air ratio by feeding more combus-tion air into the furnace. This way the effective mixing and the complete com-bustion were ensured.
In order to find out the required amount of combustion air for the com-plete combustion CFD simulations and field data analysis were made. The tar-get was to find out the effect of the combustion air ratio and the residence time on the CO emissions. According to these results boilers with the different heights could be designed so that they achieve also the same CO emissions.
The designed boilers were priced and compared. Only the changing boiler structures were taken into account in pricing, which was sorted out to heat transfer surfaces, high pressure pipes, steel structures, auxiliary equip-ment and civil/structural costs. The material, manufacturing and erection costs were studied. The heat transfer surfaces and boiler building had the most sig-nificant portions in the share of costs.
iv
PREFACE This study has been writen as a Thesis for the Master of Science Degree in Andritz Cor-poration in Kotka. I wish to thank my supervisor M.Sc. Lauri Pakarinen for his support and advice for my work. I also thank my professor Antti Oksanen for opportunity to carry out this thesis in laboratory of Energy and Process Engineering. I thank M.Sc. Miro Loschkin for introducting me into recovery boiler engineering and material selections. My thanks also go to B.Sc. Juha Walhman for his support with pric-ing and M.Sc. Kexin Hu and Ph.D. Pasi Miikkulainen their for support with CFD calcu-lations. I thank all Andrizt KR people on 7th floor in Eagle for the helpful attitude and pleasant coffee breaks. Kotka, March 2012 Mikko Kontula
v
TABLE OF CONTENTS
Abstract ............................................................................................................................iii List of symbols and abbreviations..................................................................................viii 1 Introduction...............................................................................................................1 2 Recovery boiler .........................................................................................................3
2.1 Main construction of modern recovery boiler.....................................................3 3 Material and energy balances of recovery boiler ......................................................5
3.1 Material balance................................................................................................5 3.1.1 Water and steam....................................................................................6 3.1.2 Fuel and Smelt ......................................................................................6 3.1.3 Combustion air and flue gas..................................................................7
3.2 Energy balance..................................................................................................8 3.2.1 Heat losses.............................................................................................9 3.2.2 Steam generation efficiency..................................................................9 3.2.3 High dry solids black liquor..................................................................9
4 Boiler pressure parts................................................................................................11 4.1 Furnace............................................................................................................11 4.2 Furnace screen.................................................................................................12 4.3 Superheaters ....................................................................................................13 4.4 Pre-boiler generating bank ..............................................................................14 4.5 Boiler generating bank ....................................................................................15 4.6 Economizers....................................................................................................16
5 Key sizing characteristics of recovery boiler ..........................................................17 5.1 Furnace............................................................................................................18
5.1.1 Furnace loading...................................................................................18 5.1.2 Furnace outlet temperature..................................................................19
5.2 Upper furnace section .....................................................................................20 6 Principles of heat transfer in recovery boiler ..........................................................21
6.1 Convection ......................................................................................................21 6.2 Radiation .........................................................................................................23 6.3 Overall heat transfer........................................................................................24
7 Chemical processes in furnace................................................................................26 7.1 Furnace gas phase ...........................................................................................27 7.2 Char beds.........................................................................................................27 7.3 Sodium ............................................................................................................28
7.3.1 Sodium reduction ................................................................................28 7.4 Sulfur...............................................................................................................29 7.5 Chloride...........................................................................................................30 7.6 Reactions involving carbon.............................................................................31
8 Recovery boiler emissions ......................................................................................32 8.1 Sulfur gas emissions........................................................................................32
vi
8.2 HCL emissions................................................................................................32 8.3 Carbon monoxide emissions ...........................................................................33 8.4 Nitrogen emissions..........................................................................................33
8.4.1 NOx reduction......................................................................................34 8.5 Particulates ......................................................................................................36
9 Field data analysis ...................................................................................................37 9.1 Data filtering criteria .......................................................................................38 9.2 Effect of residence time on the emissions.......................................................39 9.3 Flue gas oxygen content effect on the CO emissions .....................................41 9.4 Effect of flue gas oxygen and CO content on the NOx emissions...................43
10 CFD simulations .....................................................................................................46 10.1 Modeled cases .................................................................................................46 10.2 Flue gas inlet and combustion air....................................................................48 10.3 Simulation results............................................................................................48 10.4 Comparison of CFD results and field data......................................................50
11 Engineering .............................................................................................................52 11.1 Flue gas oxygen content..................................................................................53 11.2 Furnace............................................................................................................54 11.3 Superheaters ....................................................................................................55 11.4 Furnace screen.................................................................................................56 11.5 Pre-boiler generating bank ..............................................................................57 11.6 Boiler generating bank and economizers ........................................................57 11.7 Auxiliary equipment........................................................................................57 11.8 Engineered boilers...........................................................................................58 11.9 Preliminary layouts of engineered boilers.......................................................60
12 Pricing criteria.........................................................................................................63 12.1 Pressure parts ..................................................................................................63 12.2 High pressure piping .......................................................................................64 12.3 Boiler steel structures and plate works............................................................64 12.4 Auxiliary equipment and electrification..........................................................65 12.5 Boiler building ................................................................................................66
13 Effect of furnace design on costs ............................................................................67 13.1 Pressure parts ..................................................................................................69
13.1.1 High pressure piping .......................................................................70 13.2 Civil and structural costs.................................................................................71 13.3 Auxiliary equipment and electrification..........................................................72 13.4 Freight costs ....................................................................................................72 13.5 Operating costs................................................................................................73
14 Conclusions.............................................................................................................75 14.1 Effect of furnace dimensions and operational model on emissions................75 14.2 Impact of furnace dimensions on boiler costs.................................................76
References .......................................................................................................................78

vii
Appendix 1..............................................................................................................80 Appendix 3..............................................................................................................81
viii
LIST OF SYMBOLS AND ABBREVIATIONS ds dry solids d day Φ heat [MW] η efficiency BGB boiler generating bank pre-BGB pre boiler generating bank ECO economizer EPRS projected furnace wall area excl. floor [m2] HHRR heat input per furnace floor area [W/m2] HSL dry solid firing rate per furnace floor area [kgds/sm2] T temperature [K] FH free heat in furnace [MW] A area [m2] P perimeter [m] MCR maximum continuous rate q’’ heat flux per area [W/m2] h heat transfer coefficient [W/m2K] ∆T temperature difference [K] Nu Nusselt number k thermal conductivity [W/m] L characteristic length [m] C constant Re Reynolds number Pr Prandtl number v velocity [m/s] ρ density [kg/m3] ŋ viscosity [kg/sm] ε emissivity α absorptivity σ Stefan-Boltzmann constant [W/m2K4] λ overall heat transfer coefficient [W/m2K] SNCR selective non catalytic reduction τ residence time [s] h height [m]
V& volumetric flow [m3/s] ppm parts per million p pressure [bar] ∆p pressure difference [bar] wt wall thickness [mm]

ix
LIST OF SUBSCRIPS R radiation C convection s useful output NHV net heat value eff effective w wall dg dust gas g gas r radiation s surface i inside o outside TOT total fg flue gas avg average n normal des design m main
1
1 INTRODUCTION
Evolution of pulp mill capacities has followed the common trends of industrial produc-tion. At the same time recovery boiler capacities have increased, which has led to larger boiler dimensions. Increased heat transfer surface dimensions and material flows give new challenges to boiler engineering and operation. On the other hand, larger boilers offer greater cost saving opportunities. Therefore, it is important to research boiler engi-neer parameters effecting on boiler costs.
The fuel of recovery boiler is called black liquor, which is by-product of chemi-cal pulping. It contains almost the all inorganic cooking chemicals along with the lignin and other organic matter separated from the wood during pulping in digester. The initial concentration of weak black liquor is about 15 % dry solids in water. It is concentrated to firing conditions between 65 % and 85 % dry solid content in evaporating plant. Then it is burned in recovery boiler. The main functions of recovery boilers are to recover inorganic cooking chemicals used in the pulping process and to make use of the chemi-cals energy in the organic portion of the black liquor to generate steam for the electricity production and other process purposes of the pulp mill. The twin objectives of recover-ing both chemicals and energy make recovery boiler design more complicated than any other boiler application. [1], [2]
Recovery boiler is a natural circulation boiler and consists of preheating, vapor-izing and superheating surfaces. The heat from black liquor combustion is transferred to circulation water in the heat transfer surfaces by radiation and convection. Combustion process and significant part of total heat transfer is completed in furnace. Thus high capacity recovery boilers have to be engineered with large furnace to achieve complete combustion and desired furnace outlet temperature. On the other hand, large furnace causes heavy furnace material and boiler building costs.
Adding furnace screen heat surface effectively reduces furnace height. Furnace screen is an effective heat transfer surface which goes through the furnace just below the superheaters. In modern design the screen tubes enter into the furnace on the front wall and exit the furnace through the nose. The screen tubes block thermal radiation heat from lower furnace parts to superheaters, and thus decrease superheating. On the other hand, superheater material temperatures decrease due the reduced thermal radia-tion. This may reduce the expensive austenitic material need in superheater tubes. The low furnace reduces the total cost of the boiler but on the other hand the time for combustion is also reduced. Reduced combustion time can lead to incomplete combustion and cause carbon monoxide emissions. Also other things like mixing and amount of excess oxygen affect on the combustion efficiency.
2
The final combustion of unburned CO takes place in regions between tertiary air ports and nose level. The mixing of tertiary air jets and unburned flue gas has a great effect on the combustion efficiency. The effective mixing can be achieved with im-proved air feeding system and sufficient amount of combustion air. If the boiler is oper-ated with the high combustion air ratio, or the oxygen content in flue gas, the flue gas flow rate increases. This means higher flue gas heat loss and more expensive heat trans-fer surfaces. In this study, the effect of flue gas oxygen content and residence time on the combustion efficiency was studied. The study was carried out by analyzing the collected operation data from ten recovery boilers. Also simplified CFD simulations were made in order to find out how the tertiary air feeding model, flue gas residence time and amount of excess oxygen affect on CO combustion. Results from field data and CDF study were used in boiler engineering.
In total, four different boiler designs were engineered in two boiler size. The chosen boiler capacities were 4450 tsd/d and 8700 tds/d. One boiler was designed without fur-nace screen and three others with different furnace screen and boiler dimensions. The boilers were designed to achieve same operating performances in order to be compara-ble. The different boiler designs were priced to find out the furnace dimensions effect on total boiler costs.
3
2 RECOVERY BOILER
Recovery boiler is part of chemical recovery line in a pulp mill. Recovery boiler is the most expensive component of pulp mill, but it produces a large amount of energy which can cover the whole energy demand of the pulp mill. The main functions of modern recovery boiler can be divided in three points. The first point is to recycle and regener-ate spent chemicals in black liquor. The second one is to burn the organic material of the black liquor in order to generate high pressure steam. The third one is to burn the odorous gases and other burnable residues existing in pulp mill process. [1], [2]
Only half of the wood mass in the cooking process is used to pulp concentration. Rest of the mass which consist of organic and inorganic matter is called weak black liquor. Before burning weak liquor in recovery boiler it must be evaporated into concen-tration of 60-85 %. After the evaporation dry black liquor contains approximately 60 % organic and 40 % inorganic matter. In recovery boiler the organic matter of black liquor is burned to generate steam and inorganic chemicals are regenerated by the chemical process and recovered to use again. Black liquor has one of the lowest heating values on industrial fuels because of the large amount of its inorganic matter. [1], [2] Black liquor is fed into the boiler by using liquor sprayers which are located on the furnace walls. Black liquor is very viscous fluid and it has to be preheated approxi-mately to 115-145 ˚C before spraying into the furnace. For the optimal burning process the size of droplets has to be small enough to dry and partly pyrolyzed before dropping to char bed on furnace bottom. On the other hand, if droplets are too small they are car-ried off with flue gas. Inorganic compounds react in the char bed where char combus-tion continues and volatiles are released. At the same time the conditions in the char bed have to be reducing in order to make it possible for sodium and sulfur compounds to react and to achieve the desired end products. Therefore burning temperature and oxy-gen rate in char bed must be controlled. However, reduction and combustion are oppo-site reactions and it is difficult to achieve both at the same time. [1]
2.1 Main construction of modern recovery boiler
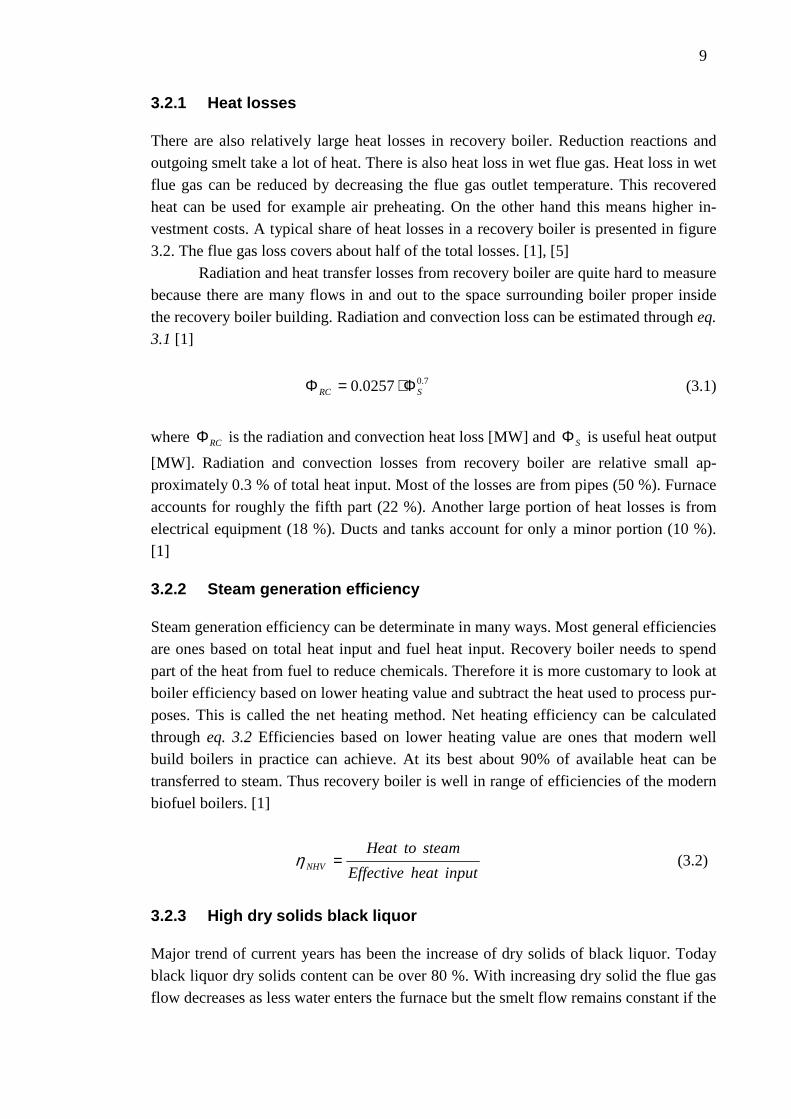
Recovery boiler consists of furnace and flue gas passage wherein heat-transfer surfaces are located after them in flue gas flow including possible furnace screen, super heater surfaces, so called pre-boiler bank, boiler generating bank and economizers. [1], [3] Recovery boiler is a natural circulation boiler. Natural circulation is based on the density differences. Water density in the downcomer tubes is bigger than water steam mixture has in heat surface tubes where water is evaporated to steam. These density
4
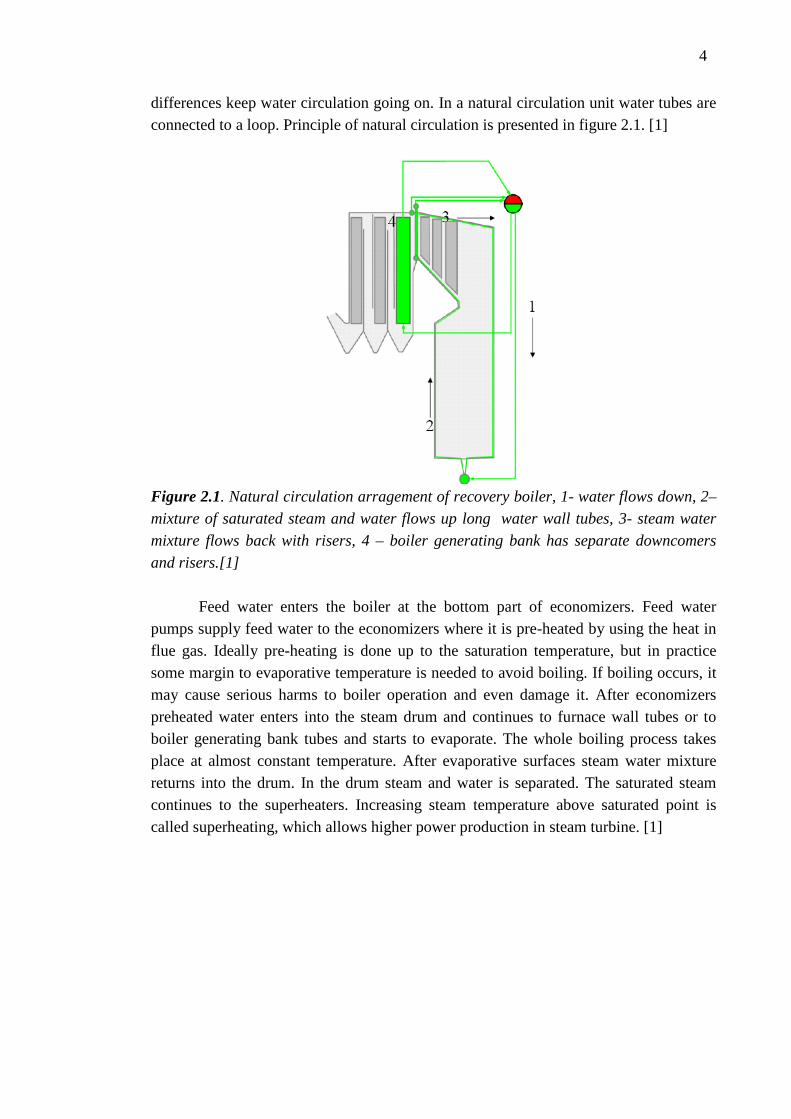
differences keep water circulation going on. In a natural circulation unit water tubes are connected to a loop. Principle of natural circulation is presented in figure 2.1. [1]
Figure 2.1. Natural circulation arragement of recovery boiler, 1- water flows down, 2–
mixture of saturated steam and water flows up long water wall tubes, 3- steam water
mixture flows back with risers, 4 – boiler generating bank has separate downcomers
and risers.[1]
Feed water enters the boiler at the bottom part of economizers. Feed water
pumps supply feed water to the economizers where it is pre-heated by using the heat in flue gas. Ideally pre-heating is done up to the saturation temperature, but in practice some margin to evaporative temperature is needed to avoid boiling. If boiling occurs, it may cause serious harms to boiler operation and even damage it. After economizers preheated water enters into the steam drum and continues to furnace wall tubes or to boiler generating bank tubes and starts to evaporate. The whole boiling process takes place at almost constant temperature. After evaporative surfaces steam water mixture returns into the drum. In the drum steam and water is separated. The saturated steam continues to the superheaters. Increasing steam temperature above saturated point is called superheating, which allows higher power production in steam turbine. [1]
5
3 MATERIAL AND ENERGY BALANCES OF RECOVERY BOILER
Calculation of material and energy balances is fundamental for engineering of the re-covery boiler. Dimensioning of heat transfer surfaces can not be done if mass and en-ergy flows are unknown. [1] Material and energy balances are discussed briefly in this chapter.
3.1 Material balance
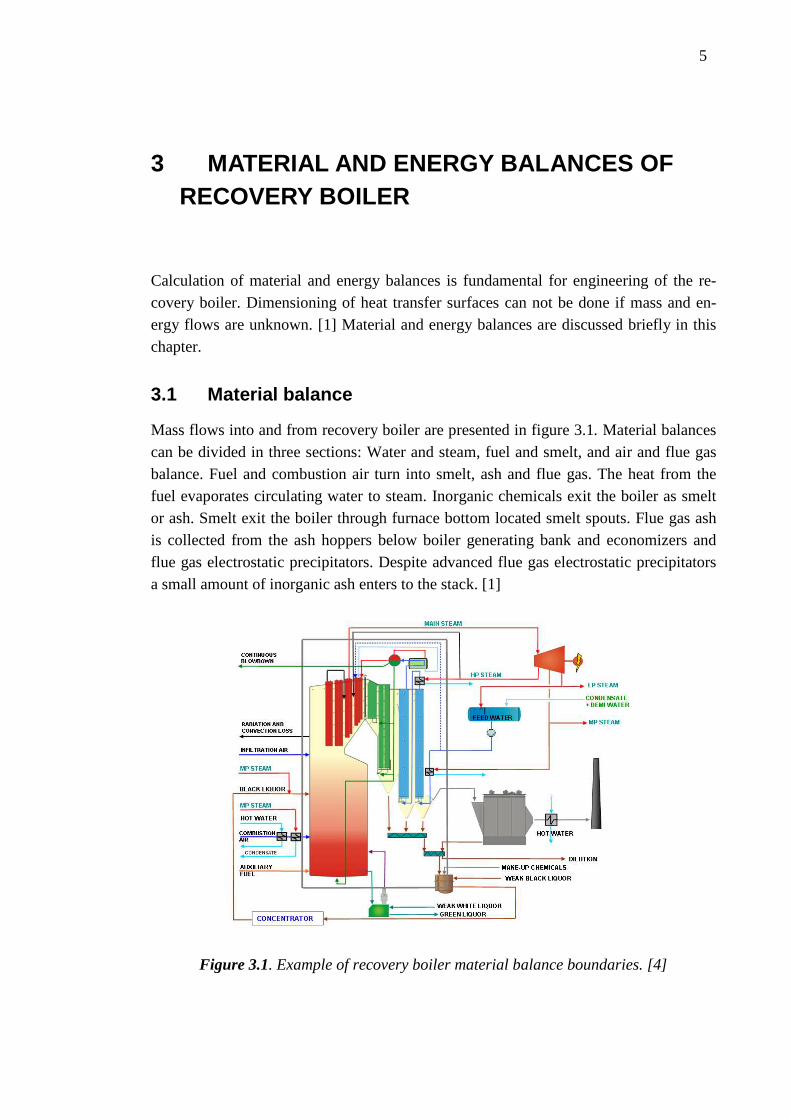
Mass flows into and from recovery boiler are presented in figure 3.1. Material balances can be divided in three sections: Water and steam, fuel and smelt, and air and flue gas balance. Fuel and combustion air turn into smelt, ash and flue gas. The heat from the fuel evaporates circulating water to steam. Inorganic chemicals exit the boiler as smelt or ash. Smelt exit the boiler through furnace bottom located smelt spouts. Flue gas ash is collected from the ash hoppers below boiler generating bank and economizers and flue gas electrostatic precipitators. Despite advanced flue gas electrostatic precipitators a small amount of inorganic ash enters to the stack. [1]
Figure 3.1. Example of recovery boiler material balance boundaries. [4]
6
3.1.1 Water and steam
Feed water is pumped from feed water tank to economizers where temperature rises close to the saturated temperature. Water evaporating occurs in furnace wall tubes and boiler generating bank tubes. Water steam mixture is collected to steam drum, where steam and water are separated. Water continues back to the evaporative surfaces and steam enters to the superheaters, where steam is heated above the saturated temperature. Some water is removed from the circulation with continuous blowdown to keep circula-tion water quality at good level. Little particles and possible dirtiness are removed from the circulation with the blowdown water. [1], [2] A certain amount of generated steam is used for keeping heat surfaces clean, because of boiler fouling. Carryover and flume stick to the heat transfer surface tubes plugging the flue gas flow and decreasing the heat transfer rate. Heat transfer surfaces are cleaned by sootblowers. Sootblowers inject steam between heat transfer surface tubes to keep tubes as clean as possible. Normally medium pressure steam specially meant for sootblowing is used or somewhat superheated steam is taken directly from the boiler. Sootblowing consumes 2…6 % of the generated steam. This amount of steam is out from the other process purposes. [1]
3.1.2 Fuel and Smelt
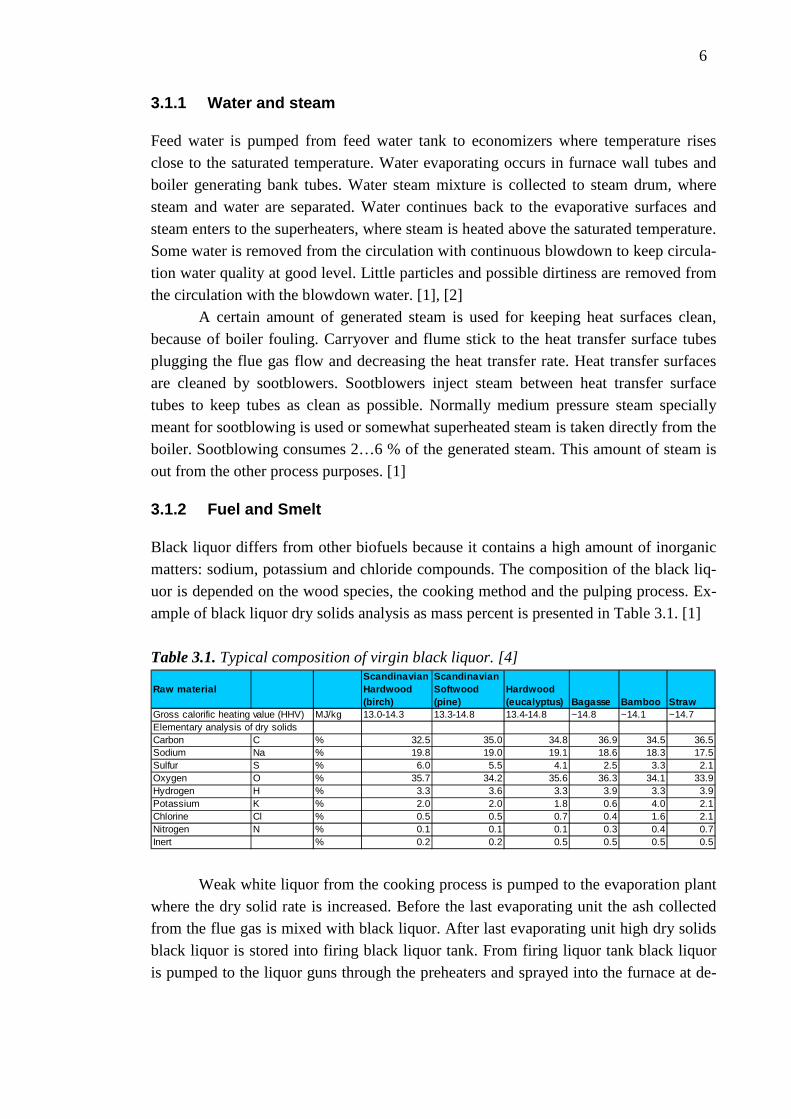
Black liquor differs from other biofuels because it contains a high amount of inorganic matters: sodium, potassium and chloride compounds. The composition of the black liq-uor is depended on the wood species, the cooking method and the pulping process. Ex-ample of black liquor dry solids analysis as mass percent is presented in Table 3.1. [1]
Table 3.1. Typical composition of virgin black liquor. [4]
Raw materialScandinavian Hardwood (birch)
Scandinavian Softwood (pine)
Hardwood (eucalyptus) Bagasse Bamboo Straw
Gross calorific heating value (HHV) MJ/kg 13.0-14.3 13.3-14.8 13.4-14.8 ~14.8 ~14.1 ~14.7Elementary analysis of dry solidsCarbon C % 32.5 35.0 34.8 36.9 34.5 36.5Sodium Na % 19.8 19.0 19.1 18.6 18.3 17.5Sulfur S % 6.0 5.5 4.1 2.5 3.3 2.1Oxygen O % 35.7 34.2 35.6 36.3 34.1 33.9Hydrogen H % 3.3 3.6 3.3 3.9 3.3 3.9Potassium K % 2.0 2.0 1.8 0.6 4.0 2.1Chlorine Cl % 0.5 0.5 0.7 0.4 1.6 2.1Nitrogen N % 0.1 0.1 0.1 0.3 0.4 0.7Inert % 0.2 0.2 0.5 0.5 0.5 0.5
Weak white liquor from the cooking process is pumped to the evaporation plant where the dry solid rate is increased. Before the last evaporating unit the ash collected from the flue gas is mixed with black liquor. After last evaporating unit high dry solids black liquor is stored into firing black liquor tank. From firing liquor tank black liquor is pumped to the liquor guns through the preheaters and sprayed into the furnace at de-
7
sired temperature. Normally liquor guns are placed symmetrically to the all furnace walls. [1], [2]
The black liquor droplet combustion is typically divided into four stages: drying, pyrolysis, char gasification and burning. As the char combustion is finished the inor-ganic residue remains. These inorganic compounds form a liquid smelt which flows to the char bed on bottom. If oxygen contacts the smelt the sulfide in smelt is reoxidized to sodium sulfate, NaSO4. In lower furnace, it is important to have enough reacting mate-rial (carbon) on top of the smelt to avoid smelt reoxidation. The liquid smelt is removed from the furnace through the smelt spouts located on the smelt overflow level. Removed smelt enters into the dissolving tank and forms the raw green liquor with mixed weak white liquor from the lime mud washing process. Green liquor is returned to the causti-cizing process for clarification and causticizing. [1], [2] Black liquor combustion and other furnace reactions are discussed more detailed in chapter 7.
3.1.3 Combustion air and flue gas
Control of the black liquor combustion requires air flow that is sufficient for the fuel flow. The amount of air required to burn a mass unit of black liquor depends mainly on the water content and the heating value of the fuel. Higher heating value of black liquor means that more air for combustion is needed. Other requirements for the air supply are maximum mixing of gas and correct air distribution between air levels to guarantee ef-fective combustion and recovery process. This means that conditions in the lower fur-nace part must be reducing.
Combustion air is injected into the furnace through air openings located in hori-zontal rows either on opposite walls or on all four walls, depending on air level. The air flow through nozzles can be controlled by the air dampers in the air ducts, or changing the rotation speed of the air fans. Each air stage usually has an own air fan. In case of odorous gases are used as part of needed combustion air there are separated fans for diluted odorous gas system. Normally there are three main air stages in modern recov-ery boiler: primary, secondary and tertiary air. Combustion air is normally preheated up to 120…205 ˚C except tertiary air which may be supplied into the upper furnace at boiler building temperature. Pressure of the air levels is a function of the boiler capacity. [1], [2], [3], [4]
The lowest air level is called primary air. The primary air openings are equally spaced on each furnace wall. Primary air level has minor effect on combustion than other air levels. Primary air keeps the char bed away from the walls by in increasing burning at the edges of the char bed. The effective area of primary air reaches only about 1m distance from the furnace walls. [1], [4]
Secondary air has the biggest effect on recovery boiler furnace operation. Sec-ondary air is introduced into the furnace just above the char bed to burn up flowing gases and to maintain the specific temperature in the lower furnace. Burning of these gases radiates heat back to the char bed and helps to maintain high enough char bed temperature. Sufficient temperature in lower furnace is needed for good reduction effi-
8
ciency and low emissions can be reached. Temperature in lower furnace affects on SO2-emissions. The higher temperature is in lower furnace the lower likelihood for SO2-emissions. In addition the secondary air prevents the char bed from growing too high. Effective mixing by high velocity secondary air jets is required for stable combustion in the lower furnace. [1], [4]
Tertiary openings are typically located on the front and rear wall. Tertiary air burns the remaining combustibles rising from the lower furnace section. Good tertiary air jet mixing is required for complete combustion. [1], [3]
Flue gas transport combusted material from the furnace pass through heat transfer surfaces, flue gas duct, dampers, electrostatic precipitator, flue gas fan and other possi-ble emission control devices before entering into the atmosphere. Flue gas fans control flue gas flow and also the furnace draft. The furnace pressure must be kept below boiler house pressure. [1]
3.2 Energy balance
To calculate energy balance for a recovery boiler one must make a boundary around the boiler and then calculate all energy flows in and out of the boiler. The basis for energy balance calculation is so called heat loss method. First sum of all input energy is calcu-lated and then from this the energy losses are subtracted. The result is the net heat avail-able for steam generation. [1]
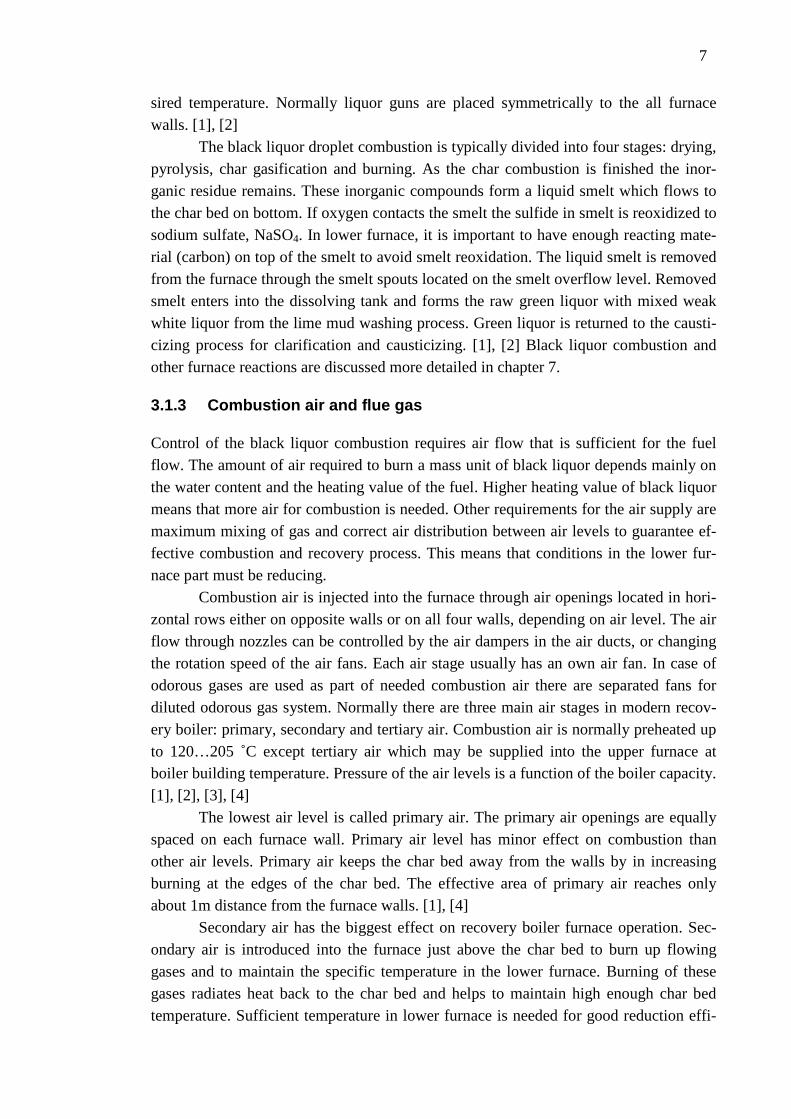
Most of the heat input comes from the combustion of black liquor. Heat from black liquor covers approximately over 90% of all heat input into the boiler. Other large sources are sensible heat in black liquor and preheated combustion air. Most of the available heat is converted to the steam. A typical share of usage of the heat input is presented in figure 3.2. Most of the available heat is spent to the steam generation. [1],[5]
to steam
reduction reactionsauto caustizingsmeltw et f lue gasRatiation and heat transferUnburned matter and others
Losses
Figure 3.2. Typical usage of input heat in a recovery boiler.[5]
9
3.2.1 Heat losses
There are also relatively large heat losses in recovery boiler. Reduction reactions and outgoing smelt take a lot of heat. There is also heat loss in wet flue gas. Heat loss in wet flue gas can be reduced by decreasing the flue gas outlet temperature. This recovered heat can be used for example air preheating. On the other hand this means higher in-vestment costs. A typical share of heat losses in a recovery boiler is presented in figure 3.2. The flue gas loss covers about half of the total losses. [1], [5]
Radiation and heat transfer losses from recovery boiler are quite hard to measure because there are many flows in and out to the space surrounding boiler proper inside the recovery boiler building. Radiation and convection loss can be estimated through eq.
3.1 [1]
7.00257.0 SRC Φ⋅=Φ (3.1)
where RCΦ is the radiation and convection heat loss [MW] and SΦ is useful heat output
[MW]. Radiation and convection losses from recovery boiler are relative small ap-proximately 0.3 % of total heat input. Most of the losses are from pipes (50 %). Furnace accounts for roughly the fifth part (22 %). Another large portion of heat losses is from electrical equipment (18 %). Ducts and tanks account for only a minor portion (10 %). [1]
3.2.2 Steam generation efficiency
Steam generation efficiency can be determinate in many ways. Most general efficiencies are ones based on total heat input and fuel heat input. Recovery boiler needs to spend part of the heat from fuel to reduce chemicals. Therefore it is more customary to look at boiler efficiency based on lower heating value and subtract the heat used to process pur-poses. This is called the net heating method. Net heating efficiency can be calculated through eq. 3.2 Efficiencies based on lower heating value are ones that modern well build boilers in practice can achieve. At its best about 90% of available heat can be transferred to steam. Thus recovery boiler is well in range of efficiencies of the modern biofuel boilers. [1]
inputheatEffective
steamtoHeatNHV =η (3.2)
3.2.3 High dry solids black liquor
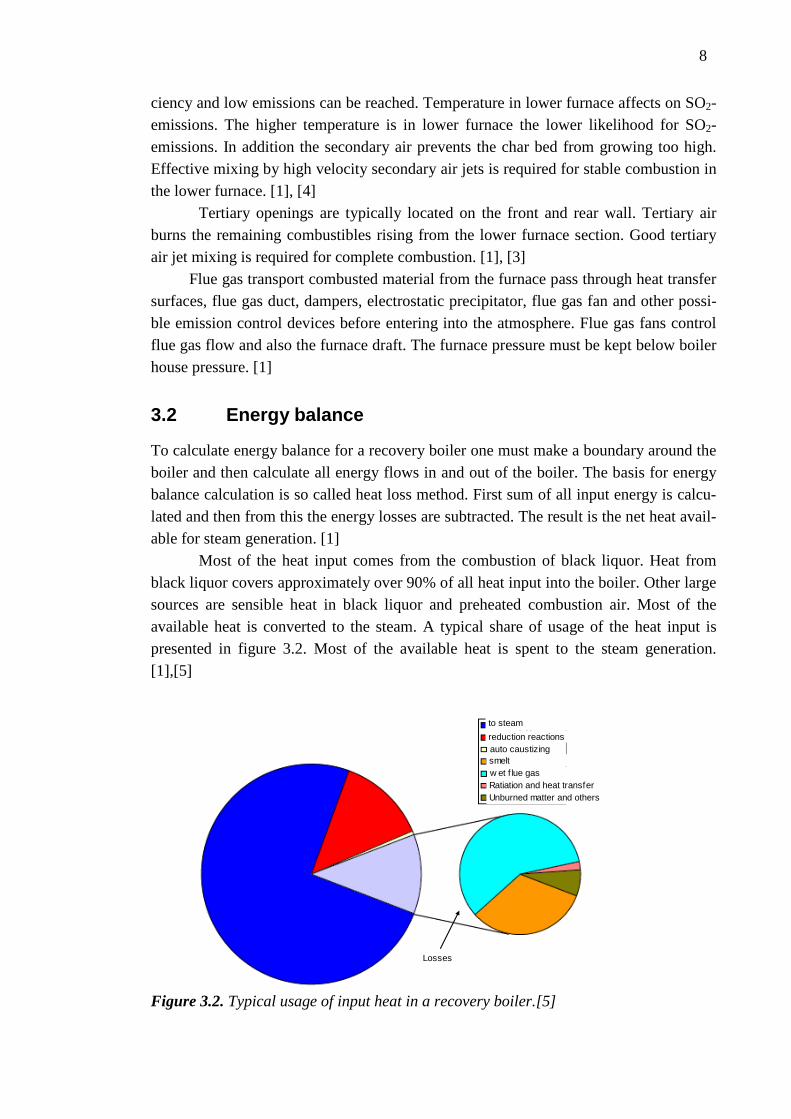
Major trend of current years has been the increase of dry solids of black liquor. Today black liquor dry solids content can be over 80 %. With increasing dry solid the flue gas flow decreases as less water enters the furnace but the smelt flow remains constant if the
10
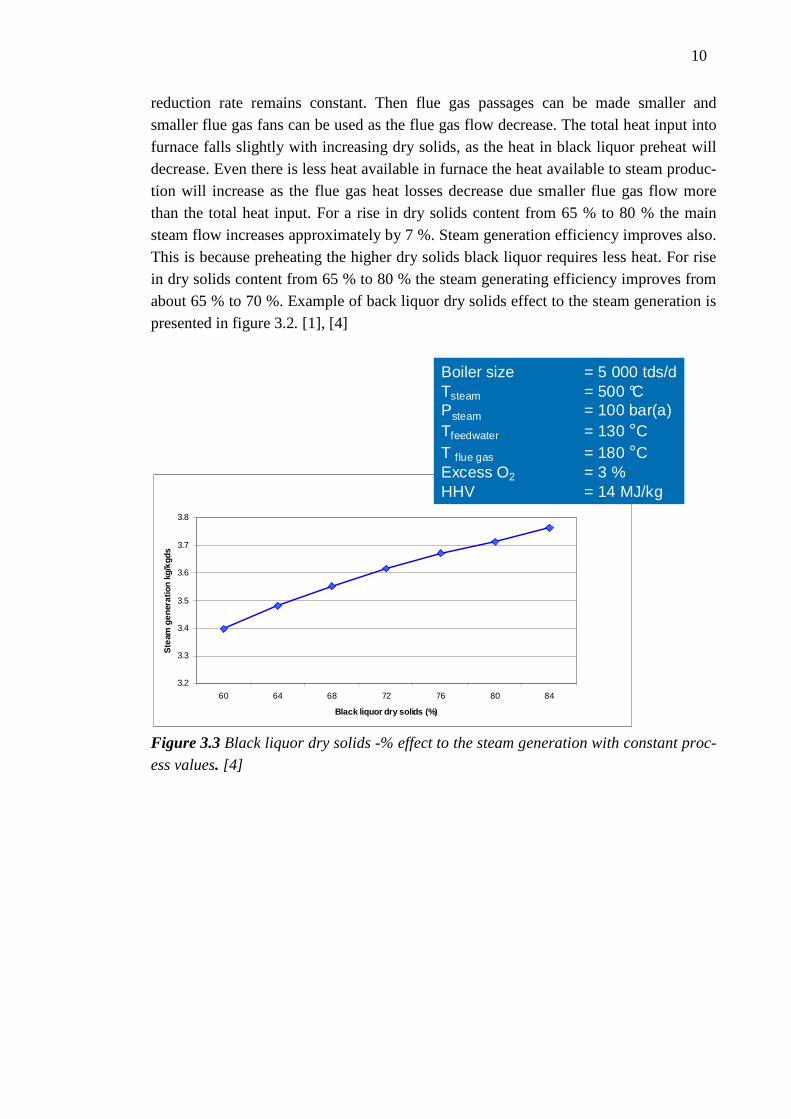
reduction rate remains constant. Then flue gas passages can be made smaller and smaller flue gas fans can be used as the flue gas flow decrease. The total heat input into furnace falls slightly with increasing dry solids, as the heat in black liquor preheat will decrease. Even there is less heat available in furnace the heat available to steam produc-tion will increase as the flue gas heat losses decrease due smaller flue gas flow more than the total heat input. For a rise in dry solids content from 65 % to 80 % the main steam flow increases approximately by 7 %. Steam generation efficiency improves also. This is because preheating the higher dry solids black liquor requires less heat. For rise in dry solids content from 65 % to 80 % the steam generating efficiency improves from about 65 % to 70 %. Example of back liquor dry solids effect to the steam generation is presented in figure 3.2. [1], [4]
3.2
3.3
3.4
3.5
3.6
3.7
3.8
60 64 68 72 76 80 84
Black liquor dry solids (%)
Ste
am g
ener
atio
n kg
/kgd
s
Boiler size = 5 000 tds/dTsteam = 500 °CPsteam = 100 bar(a)Tfeedwater = 130 °CT flue gas = 180 °CExcess O2 = 3 %HHV = 14 MJ/kg
Figure 3.3 Black liquor dry solids -% effect to the steam generation with constant proc-
ess values. [4]
11
4 BOILER PRESSURE PARTS
Recovery boiler pressure parts include heat transfer surface tubes, headers and connec-tion pipes. The main heat transfer surfaces in recovery boiler are evaporative surfaces, superheating surfaces and water preheating surfaces. Each type of surface has its own function in boiler design. The main characteristic of all the surfaces is that they are pri-marily made of seamless tubes. Main boiler pressure parts constructions are briefly dis-cussed in this section. [1], [2]
4.1 Furnace
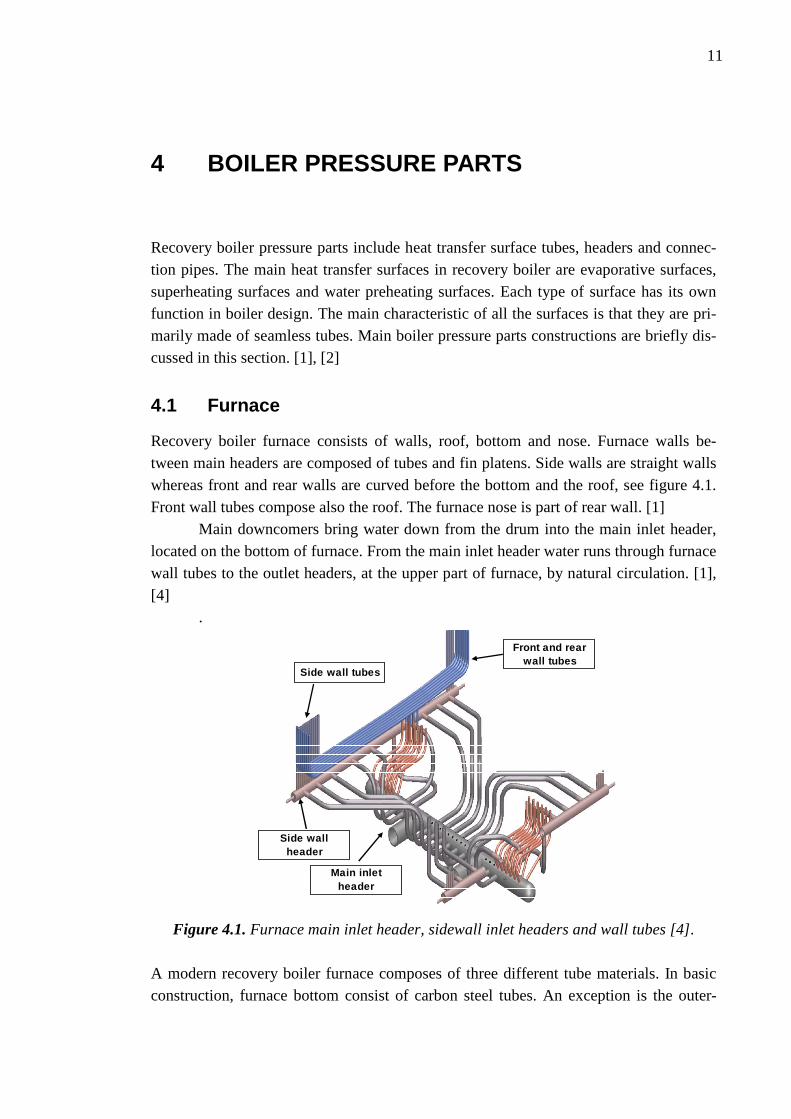
Recovery boiler furnace consists of walls, roof, bottom and nose. Furnace walls be-tween main headers are composed of tubes and fin platens. Side walls are straight walls whereas front and rear walls are curved before the bottom and the roof, see figure 4.1. Front wall tubes compose also the roof. The furnace nose is part of rear wall. [1]
Main downcomers bring water down from the drum into the main inlet header, located on the bottom of furnace. From the main inlet header water runs through furnace wall tubes to the outlet headers, at the upper part of furnace, by natural circulation. [1], [4] .
Side wall tubes
Front and rear wall tubes
Main inlet header
Side wall header
Figure 4.1. Furnace main inlet header, sidewall inlet headers and wall tubes [4].
A modern recovery boiler furnace composes of three different tube materials. In basic construction, furnace bottom consist of carbon steel tubes. An exception is the outer-
12
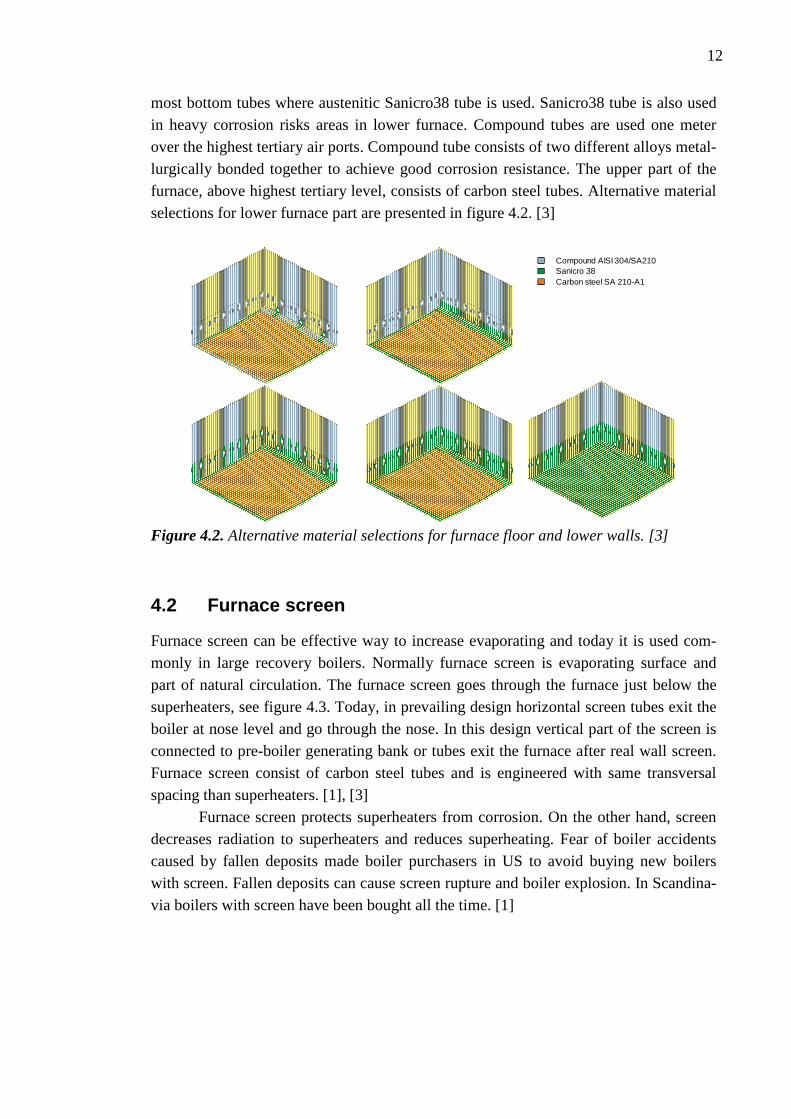
most bottom tubes where austenitic Sanicro38 tube is used. Sanicro38 tube is also used in heavy corrosion risks areas in lower furnace. Compound tubes are used one meter over the highest tertiary air ports. Compound tube consists of two different alloys metal-lurgically bonded together to achieve good corrosion resistance. The upper part of the furnace, above highest tertiary level, consists of carbon steel tubes. Alternative material selections for lower furnace part are presented in figure 4.2. [3]
Carbon steel SA 210-A1Sanicro 38Compound AISI 304/SA210
Figure 4.2. Alternative material selections for furnace floor and lower walls. [3]
4.2 Furnace screen
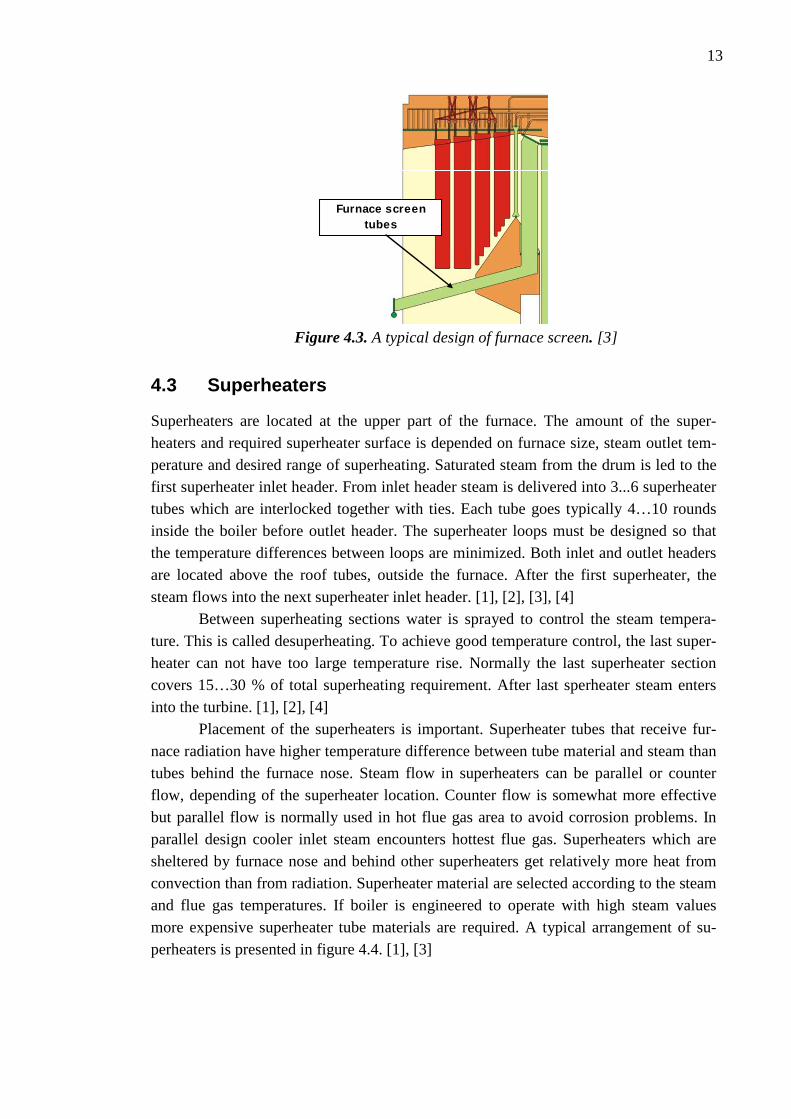
Furnace screen can be effective way to increase evaporating and today it is used com-monly in large recovery boilers. Normally furnace screen is evaporating surface and part of natural circulation. The furnace screen goes through the furnace just below the superheaters, see figure 4.3. Today, in prevailing design horizontal screen tubes exit the boiler at nose level and go through the nose. In this design vertical part of the screen is connected to pre-boiler generating bank or tubes exit the furnace after real wall screen. Furnace screen consist of carbon steel tubes and is engineered with same transversal spacing than superheaters. [1], [3]
Furnace screen protects superheaters from corrosion. On the other hand, screen decreases radiation to superheaters and reduces superheating. Fear of boiler accidents caused by fallen deposits made boiler purchasers in US to avoid buying new boilers with screen. Fallen deposits can cause screen rupture and boiler explosion. In Scandina-via boilers with screen have been bought all the time. [1]
13
Furnace screen tubes
Figure 4.3. A typical design of furnace screen. [3]
4.3 Superheaters
Superheaters are located at the upper part of the furnace. The amount of the super-heaters and required superheater surface is depended on furnace size, steam outlet tem-perature and desired range of superheating. Saturated steam from the drum is led to the first superheater inlet header. From inlet header steam is delivered into 3...6 superheater tubes which are interlocked together with ties. Each tube goes typically 4…10 rounds inside the boiler before outlet header. The superheater loops must be designed so that the temperature differences between loops are minimized. Both inlet and outlet headers are located above the roof tubes, outside the furnace. After the first superheater, the steam flows into the next superheater inlet header. [1], [2], [3], [4]
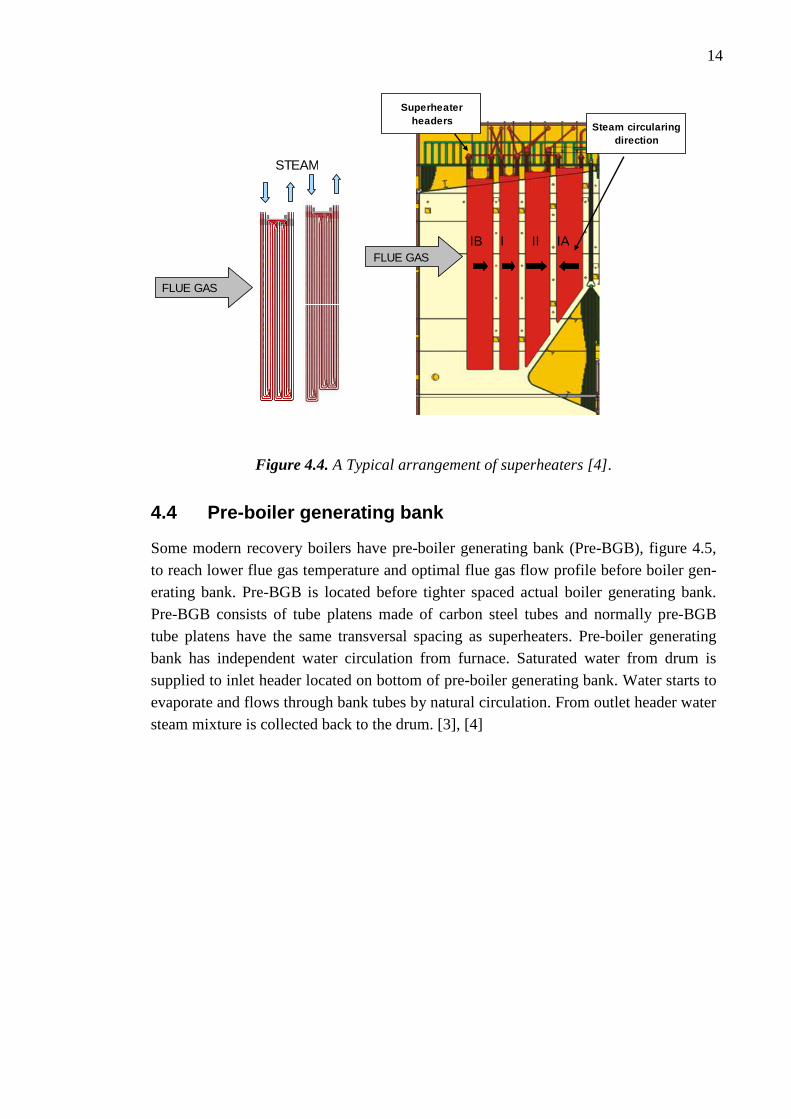
Between superheating sections water is sprayed to control the steam tempera-ture. This is called desuperheating. To achieve good temperature control, the last super-heater can not have too large temperature rise. Normally the last superheater section covers 15…30 % of total superheating requirement. After last sperheater steam enters into the turbine. [1], [2], [4] Placement of the superheaters is important. Superheater tubes that receive fur-nace radiation have higher temperature difference between tube material and steam than tubes behind the furnace nose. Steam flow in superheaters can be parallel or counter flow, depending of the superheater location. Counter flow is somewhat more effective but parallel flow is normally used in hot flue gas area to avoid corrosion problems. In parallel design cooler inlet steam encounters hottest flue gas. Superheaters which are sheltered by furnace nose and behind other superheaters get relatively more heat from convection than from radiation. Superheater material are selected according to the steam and flue gas temperatures. If boiler is engineered to operate with high steam values more expensive superheater tube materials are required. A typical arrangement of su-perheaters is presented in figure 4.4. [1], [3]
14
IAIIB II
FLUE GAS
STEAM
Steam circularing direction
Superheater headers
FLUE GAS
Figure 4.4. A Typical arrangement of superheaters [4].
4.4 Pre-boiler generating bank
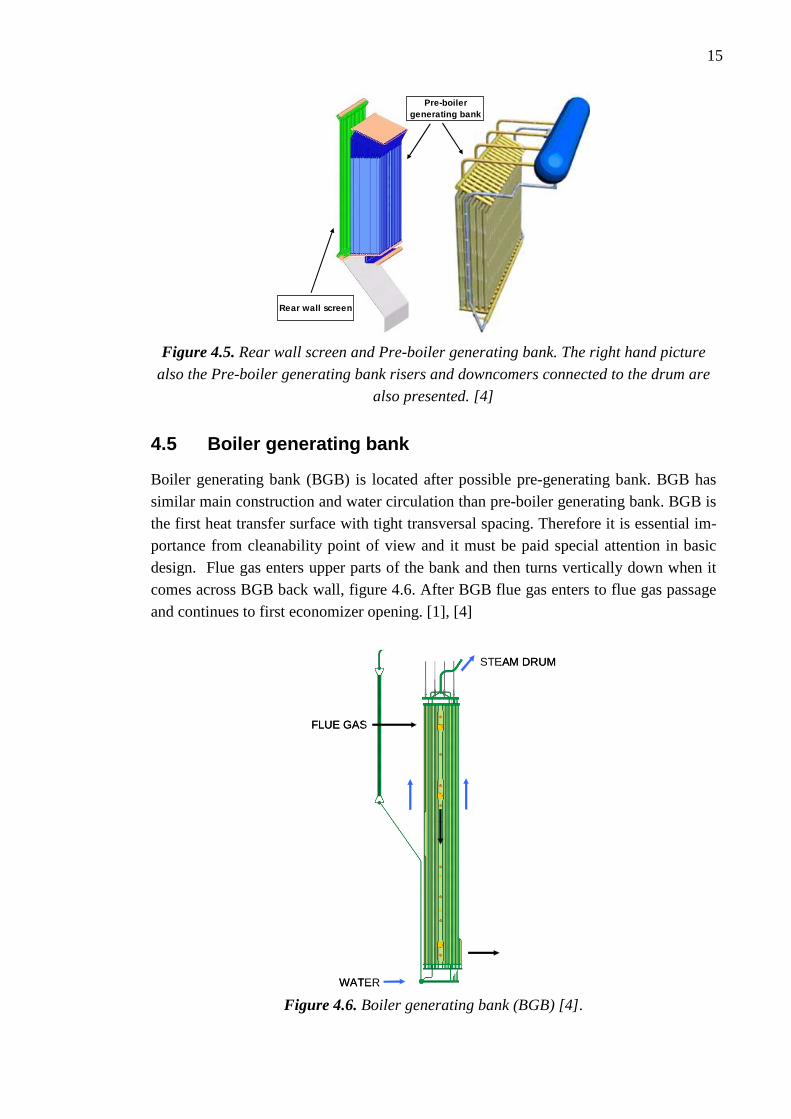
Some modern recovery boilers have pre-boiler generating bank (Pre-BGB), figure 4.5, to reach lower flue gas temperature and optimal flue gas flow profile before boiler gen-erating bank. Pre-BGB is located before tighter spaced actual boiler generating bank. Pre-BGB consists of tube platens made of carbon steel tubes and normally pre-BGB tube platens have the same transversal spacing as superheaters. Pre-boiler generating bank has independent water circulation from furnace. Saturated water from drum is supplied to inlet header located on bottom of pre-boiler generating bank. Water starts to evaporate and flows through bank tubes by natural circulation. From outlet header water steam mixture is collected back to the drum. [3], [4]
15
Rear wall screen
Pre-boiler generating bank
Figure 4.5. Rear wall screen and Pre-boiler generating bank. The right hand picture
also the Pre-boiler generating bank risers and downcomers connected to the drum are
also presented. [4]
4.5 Boiler generating bank
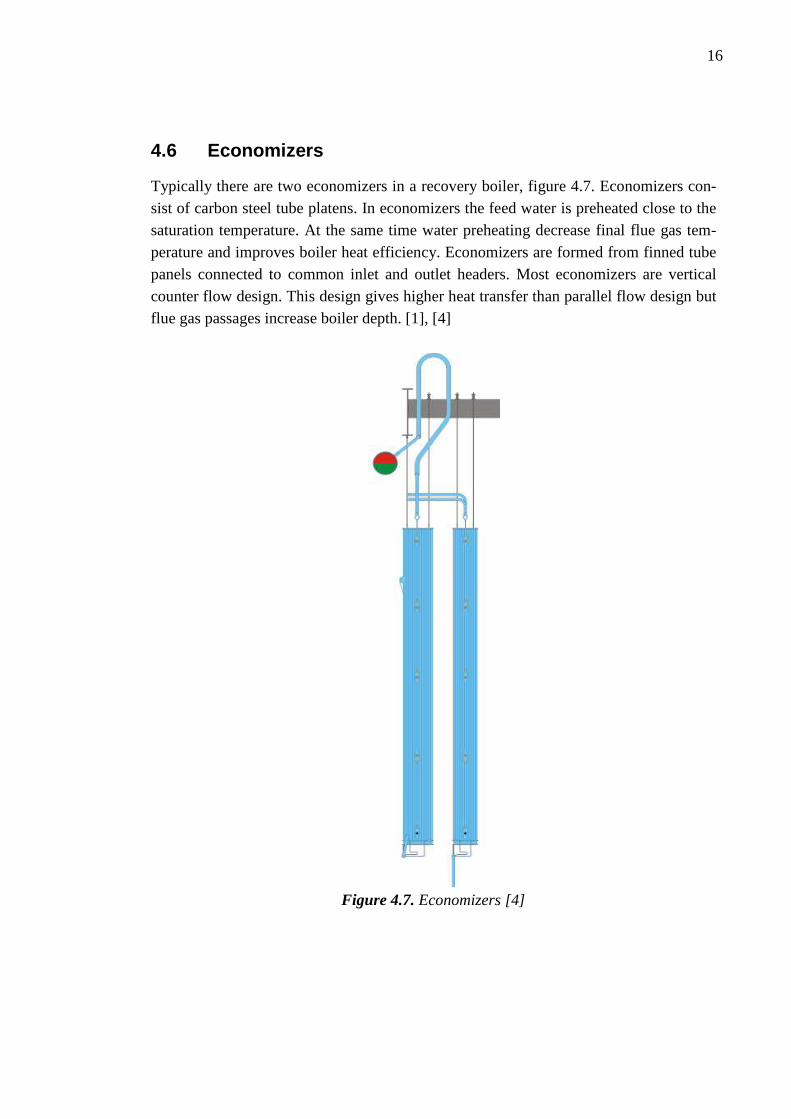
Boiler generating bank (BGB) is located after possible pre-generating bank. BGB has similar main construction and water circulation than pre-boiler generating bank. BGB is the first heat transfer surface with tight transversal spacing. Therefore it is essential im-portance from cleanability point of view and it must be paid special attention in basic design. Flue gas enters upper parts of the bank and then turns vertically down when it comes across BGB back wall, figure 4.6. After BGB flue gas enters to flue gas passage and continues to first economizer opening. [1], [4]
FLUE GAS
WATER
STEAM DRUM
FLUE GAS
WATER
STEAM DRUM
Figure 4.6. Boiler generating bank (BGB) [4].
16
4.6 Economizers
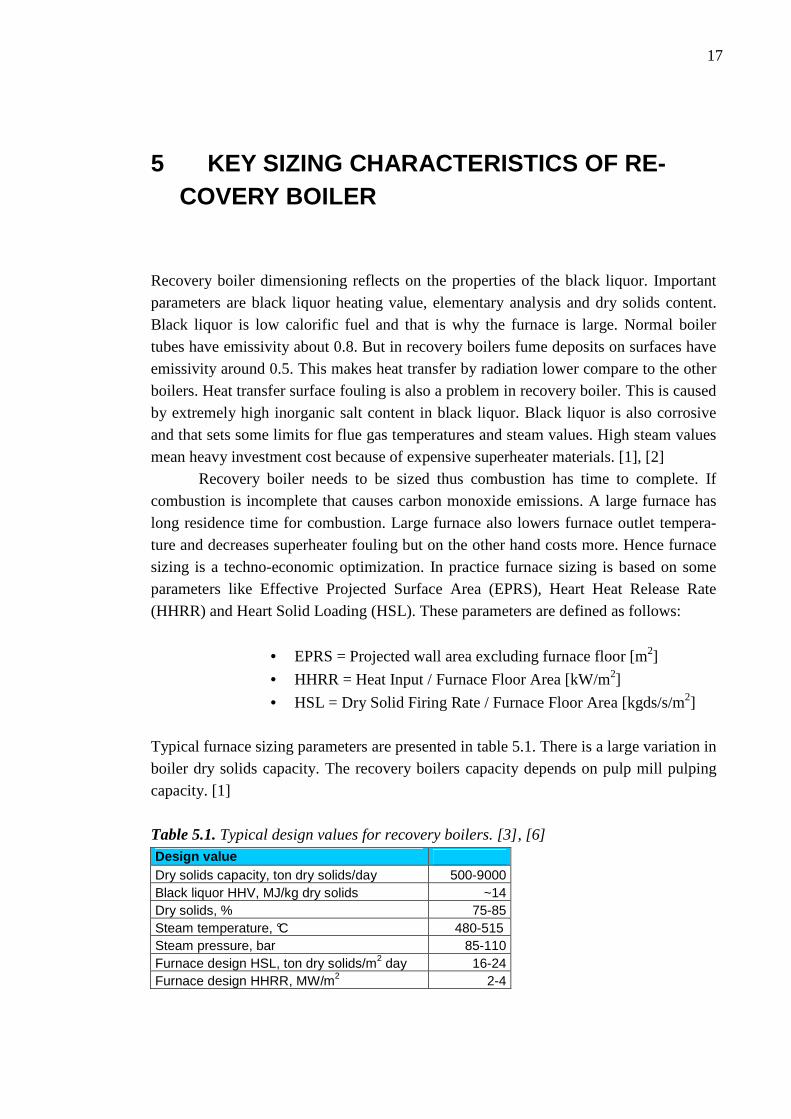
Typically there are two economizers in a recovery boiler, figure 4.7. Economizers con-sist of carbon steel tube platens. In economizers the feed water is preheated close to the saturation temperature. At the same time water preheating decrease final flue gas tem-perature and improves boiler heat efficiency. Economizers are formed from finned tube panels connected to common inlet and outlet headers. Most economizers are vertical counter flow design. This design gives higher heat transfer than parallel flow design but flue gas passages increase boiler depth. [1], [4]
Figure 4.7. Economizers [4]
17
5 KEY SIZING CHARACTERISTICS OF RE-COVERY BOILER
Recovery boiler dimensioning reflects on the properties of the black liquor. Important parameters are black liquor heating value, elementary analysis and dry solids content. Black liquor is low calorific fuel and that is why the furnace is large. Normal boiler tubes have emissivity about 0.8. But in recovery boilers fume deposits on surfaces have emissivity around 0.5. This makes heat transfer by radiation lower compare to the other boilers. Heat transfer surface fouling is also a problem in recovery boiler. This is caused by extremely high inorganic salt content in black liquor. Black liquor is also corrosive and that sets some limits for flue gas temperatures and steam values. High steam values mean heavy investment cost because of expensive superheater materials. [1], [2]
Recovery boiler needs to be sized thus combustion has time to complete. If combustion is incomplete that causes carbon monoxide emissions. A large furnace has long residence time for combustion. Large furnace also lowers furnace outlet tempera-ture and decreases superheater fouling but on the other hand costs more. Hence furnace sizing is a techno-economic optimization. In practice furnace sizing is based on some parameters like Effective Projected Surface Area (EPRS), Heart Heat Release Rate (HHRR) and Heart Solid Loading (HSL). These parameters are defined as follows:
• EPRS = Projected wall area excluding furnace floor [m2]
• HHRR = Heat Input / Furnace Floor Area [kW/m2]
• HSL = Dry Solid Firing Rate / Furnace Floor Area [kgds/s/m2] Typical furnace sizing parameters are presented in table 5.1. There is a large variation in boiler dry solids capacity. The recovery boilers capacity depends on pulp mill pulping capacity. [1] Table 5.1. Typical design values for recovery boilers. [3], [6] Design value Dry solids capacity, ton dry solids/day 500-9000 Black liquor HHV, MJ/kg dry solids ~14 Dry solids, % 75-85 Steam temperature, °C 480-515 Steam pressure, bar 85-110 Furnace design HSL, ton dry solids/m2 day 16-24 Furnace design HHRR, MW/m2 2-4
18
In addition, when looking at furnace performance residence time and flue gas velocity have to take into consideration. If flue gas velocity is excessive too high carry-over rates can exist. Carryover accumulates on the heating surfaces and decrease heat transfer and can plug flue gas passages. The char bed combustion rate also limits the furnace load. If combustion rate is too low the char bed growth may be uncontrollable. Complete combustion requires also a good mixing of combustible matter and air. To avoid unacceptable emission air jet mixing has to be effective enough. Air jet mixing and residence time effect on the combustion are discussed more specifically in chapter 9 and 10. [1]
5.1 Furnace
The bottom load is the very basic parameter for furnace sizing and has to be desided at the very beginning of the furnace engineering. Chosen HHRR, kW/m2, and black liquor elementary analysis defines the flue gas properties at the upper furnace part before the superheaters. Experience tells that high enough HHRR is needed to achieve sufficient and complete combustion. On the other hand too high HHRR leads to high flue gas ve-locities and carry over. [1]
Furnace height must be provided for the time needed for complete combustion. Furnace height is defined by required residence time. If the heat flux to the furnace walls is assumed to be constant, then for same heart loading, HHRR, the relative height (height/width) should be constant. But on the other hand, the larger recovery boiler needs lower relative furnace height to achieve same residence time. This is because doubling the width quadruples the capacity and if the height is also doubled then the furnace volume increases eight times larger. This would mean two times more time for combustion. Hence larger boiler has consequently more time for combustion, if furnace height is also increased. In addition one should keep in mind that air jet mixing has also strong effect on combustion, hence furnace height is not the only factor that defines the complete combustion. [1], [7]
5.1.1 Furnace loading
There are very limited amount of data about effect of recovery boiler size on its per-formance. The HHRR value is commonly used parameter when furnace size is deter-mined. If boiler is well tuned, operated with high dry solids black liquor and equipped with modern air feeding system the maximum operation rate may reach up to 4000 kW/m2. The recommended HHRR values have increased as design has improved. Smaller boilers are operated with lower HHRR values than large boilers [1], [6], [8] Another major dimensioning criterion for recovery boiler is Dry Solid Firing Rate per Furnace Floor Area, HSL. Typical heart solid loading is between 16-24 tds/d/m2. One should remember that black liquor properties also affect on the chosen HSL value. [1]
19
5.1.2 Furnace outlet temperature
The furnace height is determined to correspond to desired furnace exit temperature. Furnace height affects on the furnace exit temperature because heat from black liquor radiates to the furnace walls. Furnace exit temperatures are typically designed between 1000…1100 °C. Furnace exit temperature also depends strongly on black liquor dry solids, heating value and load. [1] Furnace exit temperature, often called nose temperature, affects the superheaters size. Low temperatures require large and expensive superheating surface. On the other hand high furnace outlet temperature means high heat flux to the superheaters and con-sequently high corrosion rates. This means expensive superheater materials and more maintenance costs. [1]
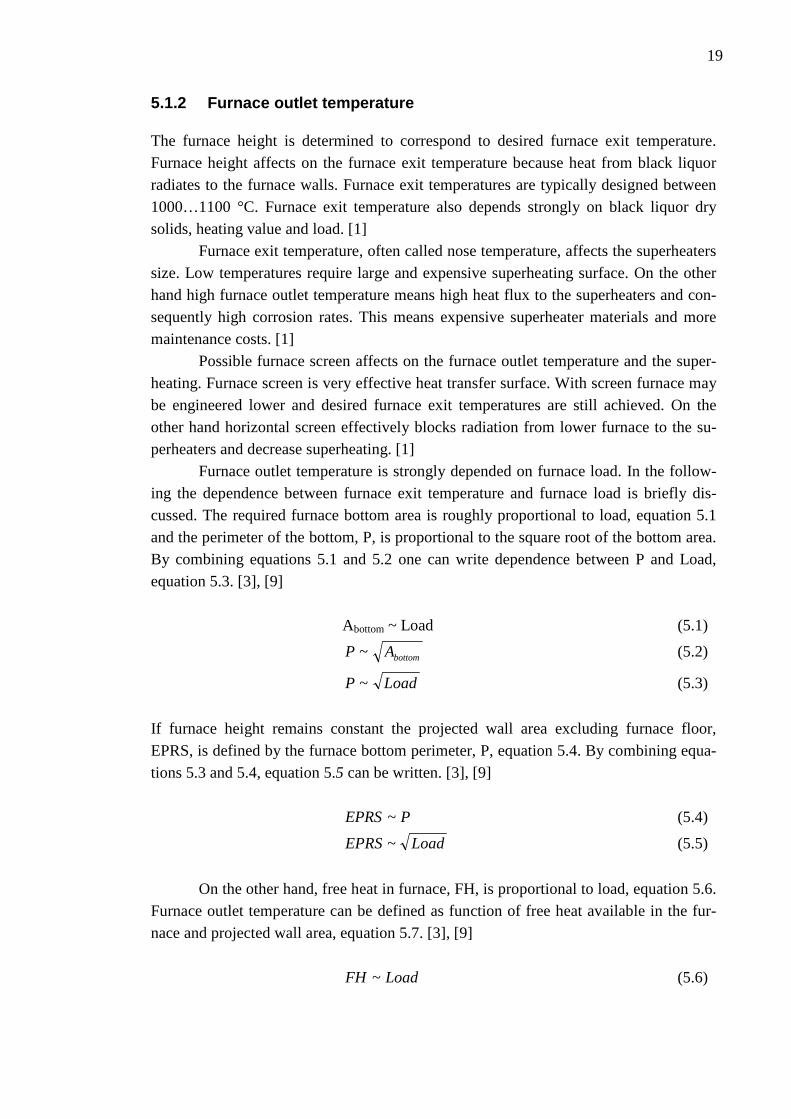
Possible furnace screen affects on the furnace outlet temperature and the super-heating. Furnace screen is very effective heat transfer surface. With screen furnace may be engineered lower and desired furnace exit temperatures are still achieved. On the other hand horizontal screen effectively blocks radiation from lower furnace to the su-perheaters and decrease superheating. [1] Furnace outlet temperature is strongly depended on furnace load. In the follow-ing the dependence between furnace exit temperature and furnace load is briefly dis-cussed. The required furnace bottom area is roughly proportional to load, equation 5.1 and the perimeter of the bottom, P, is proportional to the square root of the bottom area. By combining equations 5.1 and 5.2 one can write dependence between P and Load, equation 5.3. [3], [9] Abottom ~ Load (5.1)
bottomAP ~ (5.2)
LoadP ~ (5.3)
If furnace height remains constant the projected wall area excluding furnace floor, EPRS, is defined by the furnace bottom perimeter, P, equation 5.4. By combining equa-tions 5.3 and 5.4, equation 5.5 can be written. [3], [9]
PEPRS~ (5.4)
LoadEPRS~ (5.5)
On the other hand, free heat in furnace, FH, is proportional to load, equation 5.6.
Furnace outlet temperature can be defined as function of free heat available in the fur-nace and projected wall area, equation 5.7. [3], [9]
LoadFH ~ (5.6)
20
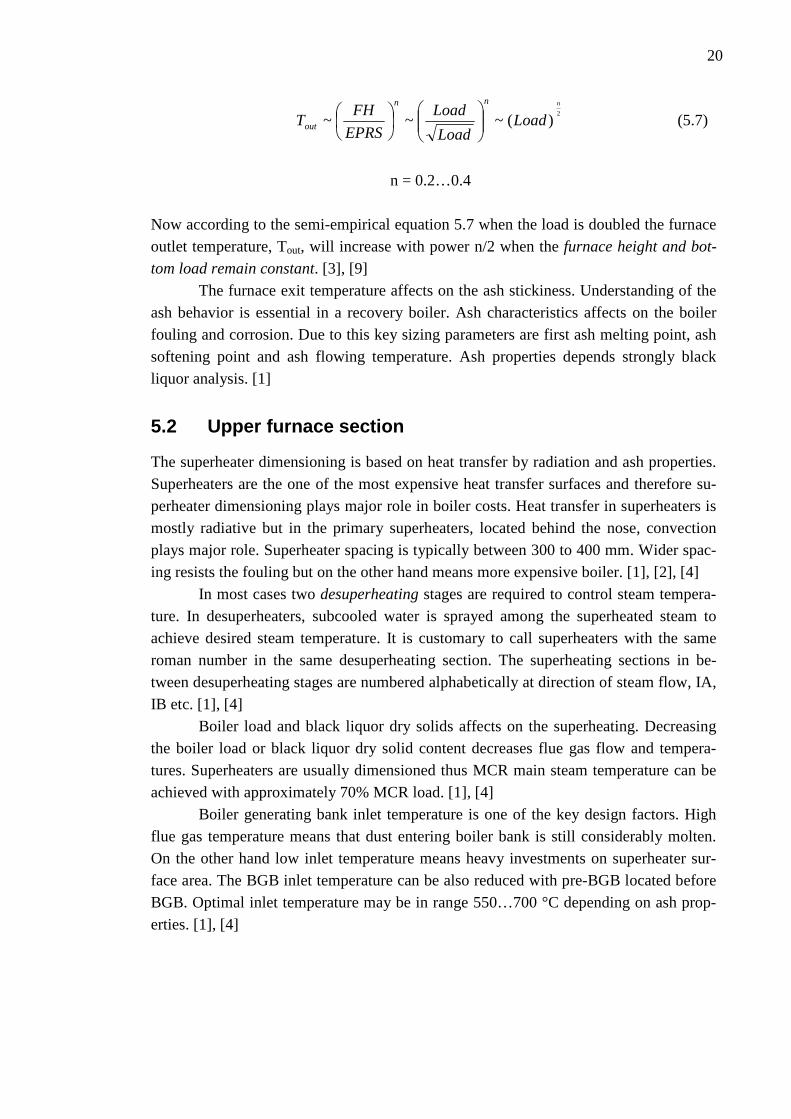
2
)(~~~n
LoadLoad
Load
EPRS
FHT
nn
out
(5.7)
n = 0.2…0.4
Now according to the semi-empirical equation 5.7 when the load is doubled the furnace outlet temperature, Tout, will increase with power n/2 when the furnace height and bot-
tom load remain constant. [3], [9] The furnace exit temperature affects on the ash stickiness. Understanding of the
ash behavior is essential in a recovery boiler. Ash characteristics affects on the boiler fouling and corrosion. Due to this key sizing parameters are first ash melting point, ash softening point and ash flowing temperature. Ash properties depends strongly black liquor analysis. [1]
5.2 Upper furnace section
The superheater dimensioning is based on heat transfer by radiation and ash properties. Superheaters are the one of the most expensive heat transfer surfaces and therefore su-perheater dimensioning plays major role in boiler costs. Heat transfer in superheaters is mostly radiative but in the primary superheaters, located behind the nose, convection plays major role. Superheater spacing is typically between 300 to 400 mm. Wider spac-ing resists the fouling but on the other hand means more expensive boiler. [1], [2], [4] In most cases two desuperheating stages are required to control steam tempera-ture. In desuperheaters, subcooled water is sprayed among the superheated steam to achieve desired steam temperature. It is customary to call superheaters with the same roman number in the same desuperheating section. The superheating sections in be-tween desuperheating stages are numbered alphabetically at direction of steam flow, IA, IB etc. [1], [4] Boiler load and black liquor dry solids affects on the superheating. Decreasing the boiler load or black liquor dry solid content decreases flue gas flow and tempera-tures. Superheaters are usually dimensioned thus MCR main steam temperature can be achieved with approximately 70% MCR load. [1], [4] Boiler generating bank inlet temperature is one of the key design factors. High flue gas temperature means that dust entering boiler bank is still considerably molten. On the other hand low inlet temperature means heavy investments on superheater sur-face area. The BGB inlet temperature can be also reduced with pre-BGB located before BGB. Optimal inlet temperature may be in range 550…700 °C depending on ash prop-erties. [1], [4]
21
6 PRINCIPLES OF HEAT TRANSFER IN RE-COVERY BOILER
Heat transfer in recovery boiler primarily occurs as radiation or convection, depending surface location in boiler. All mixing and combustion should be completed in furnace part below the nose level. Also about 40 % of the total heat transfer is completed in this furnace part. [1]
Radiation is primary heat transfer mechanism in the beginning of the flue gas circulation. In furnace combustion reactions take place near walls and released heat ra-diates to the wall tubes. Most water evaporation takes place in furnace below the nose. Steam generation is then completed in the convective heat transfer section, in poster parts of the boiler. [1], [10], [11]
An object between the radiation source and the surface prevent passage of radia-tion. Hence tubes which have not direct view to hot burning reactions, get less heat ra-diation than those, which have direct view to radiation source. However, in superheater region radiation is still very significant heat transfer mechanism even though superhea-ter tubes would be located behind the nose. Convection is depended on flue gas proper-ties and tube construction. In addition also some conduction occurs inside boiler struc-tures. [1], [10], [11]
Cross-flow is the most effective flow type for heat transfer surfaces. Cross-flow is used in superheaters, pre-boiler generating bank and rear wall screen. Vertical counter flow is used in boiler generating bank and economizers. More effective cross-flow is less used due the fouling. [1], [10], [11]
6.1 Convection
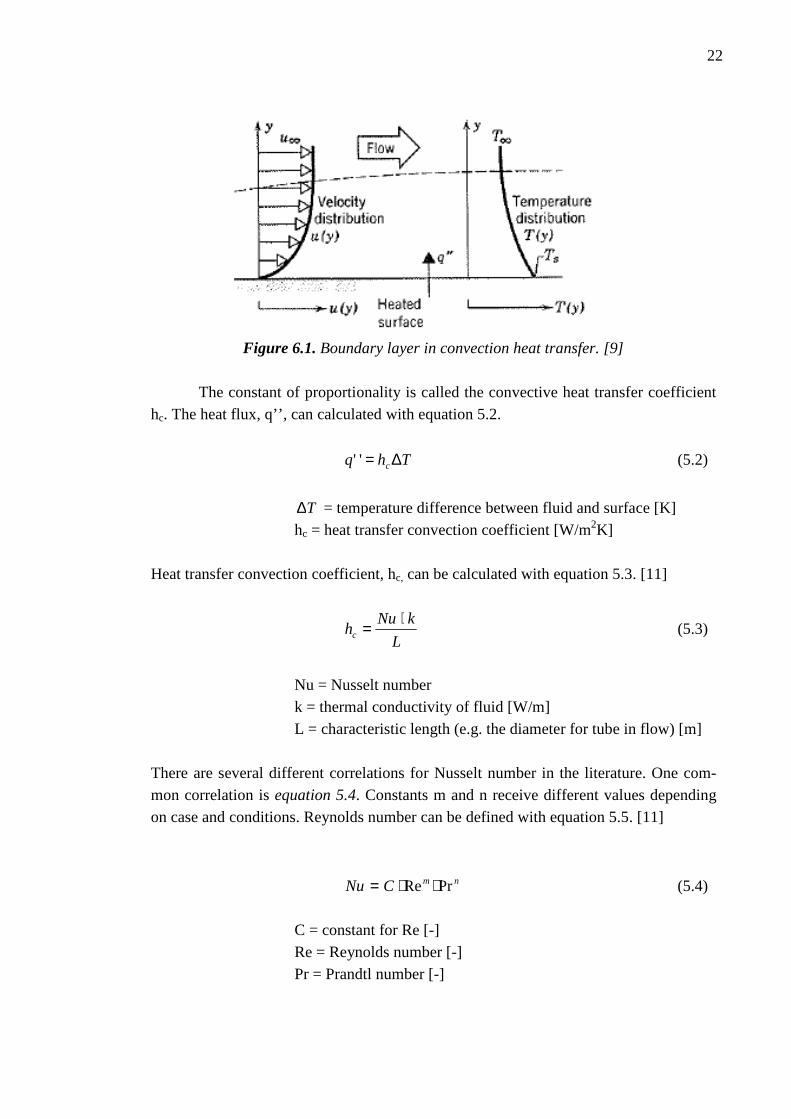
Convection or convective heat transfer is the term used to describe heat transfer from a moving fluid to a surface. The surface may be out or inside of a tube. The rate of heat transfer by convection is usually a complicated function of surface geometry and tem-perature, the fluid temperature and velocity, and fluid thermo physical properties. In external forced flow the rate of heat transfer is approximately proportional to the tem-perature difference, T∆ , between surface temperature, Ts, and moving fluid tempera-ture, T∞. See figure 6.1. [10], [11]
22
Figure 6.1. Boundary layer in convection heat transfer. [9]
The constant of proportionality is called the convective heat transfer coefficient
hc. The heat flux, q’’, can calculated with equation 5.2.
Thq c∆='' (5.2)
T∆ = temperature difference between fluid and surface [K]
hc = heat transfer convection coefficient [W/m2K] Heat transfer convection coefficient, hc, can be calculated with equation 5.3. [11]
L
kNuhc
⋅= (5.3)
Nu = Nusselt number k = thermal conductivity of fluid [W/m] L = characteristic length (e.g. the diameter for tube in flow) [m]
There are several different correlations for Nusselt number in the literature. One com-mon correlation is equation 5.4. Constants m and n receive different values depending on case and conditions. Reynolds number can be defined with equation 5.5. [11]
nmCNu PrRe ⋅⋅= (5.4)
C = constant for Re [-] Re = Reynolds number [-] Pr = Prandtl number [-]
23
η
ρ⋅⋅= dvRe (5.5)
v = flue gas velocity [m/s]
ρ = flue gas density [kg/m3]
η = viscosity [kg/ms]
In boilers many heat transfer surfaces consist of tube banks. There are many cor-
relations for heat transfer coefficient for tube banks. One commonly used correlation is defined by Zhukauskas, equation 5.6. [11]
4
1
36.0
Pr
PrPrRe
⋅⋅=
⋅=
s
mDc C
L
kNuh (5.6)
m = 0.4…0.84 (depending on placement of tubes) Prs = evaluated at temperature T∞.
6.2 Radiation
Radiation energy is caused by vibration of atoms or molecules. Emitting material can be solid, liquid or gas. Radiation does not require the medium between surfaces because it is transported by electromagnetic waves. Nonparticipating media include atmospheric air over short distances, in which photons can travel almost unimpeded from one surface to another. Radiation heat exchange between such surfaces depends only on surface temperature, surface radiation properties, and the geometry of the configuration. Par-ticipating media include combustion gases containing H2O and CO2, as well as gases containing aerosols, such as dust, soot and small liquid droplets. Heat exchange between surfaces separated by a participating medium depends also on the radiation properties of the medium. In the case of a participating gas species, the emissivity and absorptivity depends strongly on temperature. [1], [10], [11] The maximum theoretical heat flux that ideal radiator may emit can be calcu-lated with equation 5.7.
4'' sTq ⋅= σ (5.7)
σ = Stefan-Boltzmann constant, 5,67.10-8 [W/m2K4] Ts = surface temperature [K]
Radiation heat flow in recovery boiler can be estimated according equation 5.8 [12].
24
( )44vdggdg
wdgwdg
weff TTAq ⋅−⋅
⋅−+= αεσ
εαεαε
(5.8)
Aeff = effective area [m2]
wε = emissivity of the wall [-]
dgε = emissivity of the dust gas [-]
dgα = absorptivity of the dust gas [-]
gT = temperature of the gas [K]
wT = temperature of the wall [K]
Like can be seen from equation 5.8 radiation heat flow is highly depended of tempera-
tures. Radiation increases exponentially in power of four as a function of gas tempera-
ture is wall temperature is stable. [10], [12]
Radiation thermal conductivity is defined with equation 5.9. [10]
)( wgeffr TTA
h−⋅
Φ= (5.9)
Φ = heat flux [W]
effA = effective heat transfer area [m2]
Tg = surrounding gas temperature [K]
Tw = surface temperature [K]
6.3 Overall heat transfer
The overall heat transfer coefficient for tube plate profiles can be defined with equation 5.10. [1]
),,(11
0ddkFhhh
fk
stubecri
o
++
+= (5.10)
25
=
ss
tube
d
d
k
dddkF
00
0
ln2
1),,(
f0 = correction factor (fouling correction) [-] hi = inside heat transfer coefficient [W/m2K] hr = radiation heat transfer coefficient [W/m2K] hc = convection heat transfer coefficient [W/m2K] ktube = tube heat transfer coefficient [W/m] dO = outside diameter of tube [m] di = inside diameter of tube [m]
Terms ),,( 0ddkF tube and ih
1 are insignificant compare to the radiation and convection
terms. Now the overall heat transfer [W] in surface can be expressed with equation 5.11. [1]
TAeff ∆=Φ λ (5.11)
λ = the overall heat transfer coefficient [W/m2K] Aeff = the effective heat transfer area [m2]
T∆ = the temperature difference [K]
26
7 CHEMICAL PROCESSES IN FURNACE
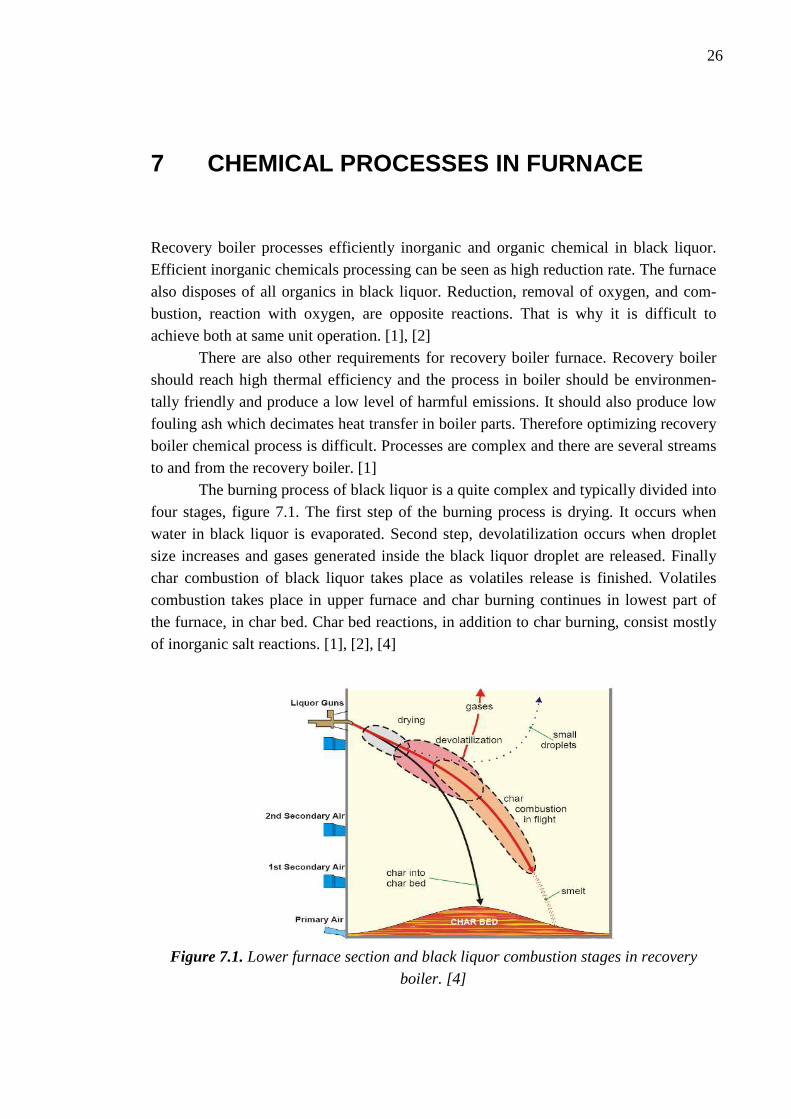
Recovery boiler processes efficiently inorganic and organic chemical in black liquor. Efficient inorganic chemicals processing can be seen as high reduction rate. The furnace also disposes of all organics in black liquor. Reduction, removal of oxygen, and com-bustion, reaction with oxygen, are opposite reactions. That is why it is difficult to achieve both at same unit operation. [1], [2] There are also other requirements for recovery boiler furnace. Recovery boiler should reach high thermal efficiency and the process in boiler should be environmen-tally friendly and produce a low level of harmful emissions. It should also produce low fouling ash which decimates heat transfer in boiler parts. Therefore optimizing recovery boiler chemical process is difficult. Processes are complex and there are several streams to and from the recovery boiler. [1] The burning process of black liquor is a quite complex and typically divided into four stages, figure 7.1. The first step of the burning process is drying. It occurs when water in black liquor is evaporated. Second step, devolatilization occurs when droplet size increases and gases generated inside the black liquor droplet are released. Finally char combustion of black liquor takes place as volatiles release is finished. Volatiles combustion takes place in upper furnace and char burning continues in lowest part of the furnace, in char bed. Char bed reactions, in addition to char burning, consist mostly of inorganic salt reactions. [1], [2], [4]
Figure 7.1. Lower furnace section and black liquor combustion stages in recovery
boiler. [4]
27
7.1 Furnace gas phase
Above the char bed there is a mixture of air from primary and secondary air jets and combustion gases. Some measurements of gaseous components in the recovery boiler furnace have been done. In addition equilibrium calculations of furnace have been done. According these results, there are large amounts of H2 and unburned CO in lower fur-nace. High CO concentrations are result of reducing conditions caused by multiple air levels. Measurements show that there are also large amounts of O2 and CH4 present in lower furnace. This shows that the kinetic and/or mixing rates prevent reactions from reaching equilibrium. Therefore use of equilibrium assumption in treating lower furnace should be avoided. [1], [13], [14] The temperature of the gas immediately above the char bed is lower than the temperature of the gas 1…2 m from bed surface. Temperature raise is caused by hot combustible gases from char bed and the CO combustion. Then temperature decreases 100…200 °C because the cooling effect of secondary air. After that temperature in-crease again to reach a peak a few meters higher, where main volatiles combustion takes place. Predominant temperature effects to the heat transfer but also to the level of harm-ful emissions. Recovery boiler air emissions are discussed in chapter 8. [1], [14]
7.2 Char beds
The char bed is the heart of recovery boiler. Without char bed the main target of the recovery boiler, high reduction, would be hard to achieve. Char bed is a pile of material that includes carbon, partially black liquor solids and smelt. Materials in char bed can be molten or solid. To keep char bed size stable and constant the incoming material flow must equal to the outflow from the char bed. Incoming flow consist of liquor droplets from spraying and fallen residue from heat transfer surfaces, furnace walls and super-heaters. The outgoing smelt flow is approximately 0.5 kg per kilogram of incoming black liquor dry solid flow. [1]
The reduction of sodium sulfate in char bed to sulfide is the main chemical proc-ess step in the recovery cycle. Sodium, potassium and chloride release takes place in char bed. Also part of black liquor burning takes place in char bed when dried and par-tially pyrolyzed black liquor droplets fall on it. Normally char bed is 1…2 meters height flat pile with sloping sides. On the surface there can be mounds and even smelt pools. In high beds there can be molten smelt pockets inside the bed. The char bed shape is not constant but chancing with time. [1]
The actual black liquor char content in char bed is only 5…20 %. Most of it is inorganic salts, containing mainly carbonaceous char, sodium carbonate, sodium sulfate, sodium sulfide and sodium chloride with smaller percentage of potassium salts and un-reacting material present. The char bed surface temperature has a strong influence on emissions from recovery boiler. The higher the char bed surface temperature the higher
28
the dust emissions and the lower sulphur (SO2 and H2S) emissions occur. Higher bed temperature results also better reduction rate. [1]
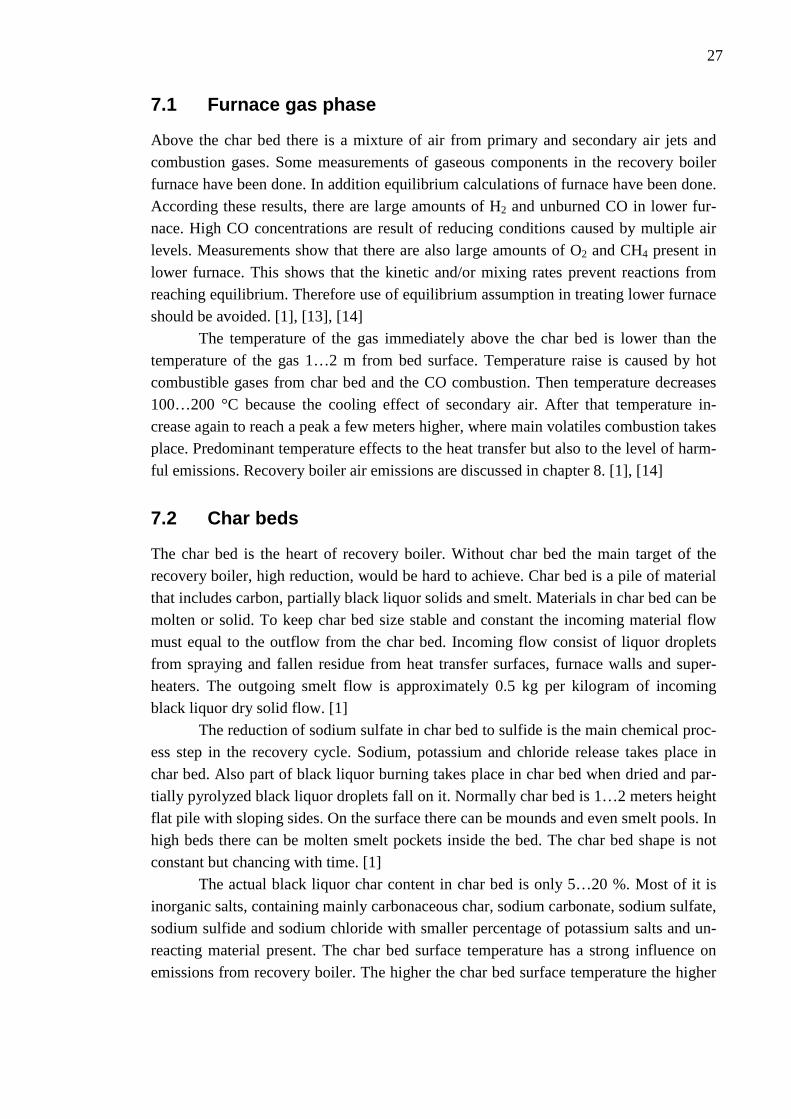
7.3 Sodium
Sodium is released during the black liquor burning and char bed reactions through va-porization and reduction of sodium carbonate. Sodium release from black liquor in-creases as a function of temperature. Sodium content in black liquor is about 20 w-% and sodium release in recovery boiler furnace is about 10 % of the sodium in black liq-uor. There are many reactions in recovery boiler involving sodium. Sodium reactions in recovery boiler are not fully understood. Most studied reactions are hydroxide forma-tion, reduction reactions, sulfate formation with chlorides and carbonate, and carbonate formation. Possible sodium reaction routes in the recovery boiler are presented in figure 7.1. The most probable reaction route is marked with red arrows. [1], [14]
NaNa22COCO33
HH22OO
SOSO22
NaNa22SOSO44
NaNa22COCO33
NaOHNaOH
NaClNaCl NaNa
COCO22SOSO22
SOSO22
NaNa22COCO33
HH22OO
SOSO22
NaNa22SOSO44
NaNa22COCO33
NaOHNaOH
NaClNaCl NaNa
COCO22SOSO22
SOSO22
Figure 7.1. Possible sodium reaction routes in recovery boiler. [4]
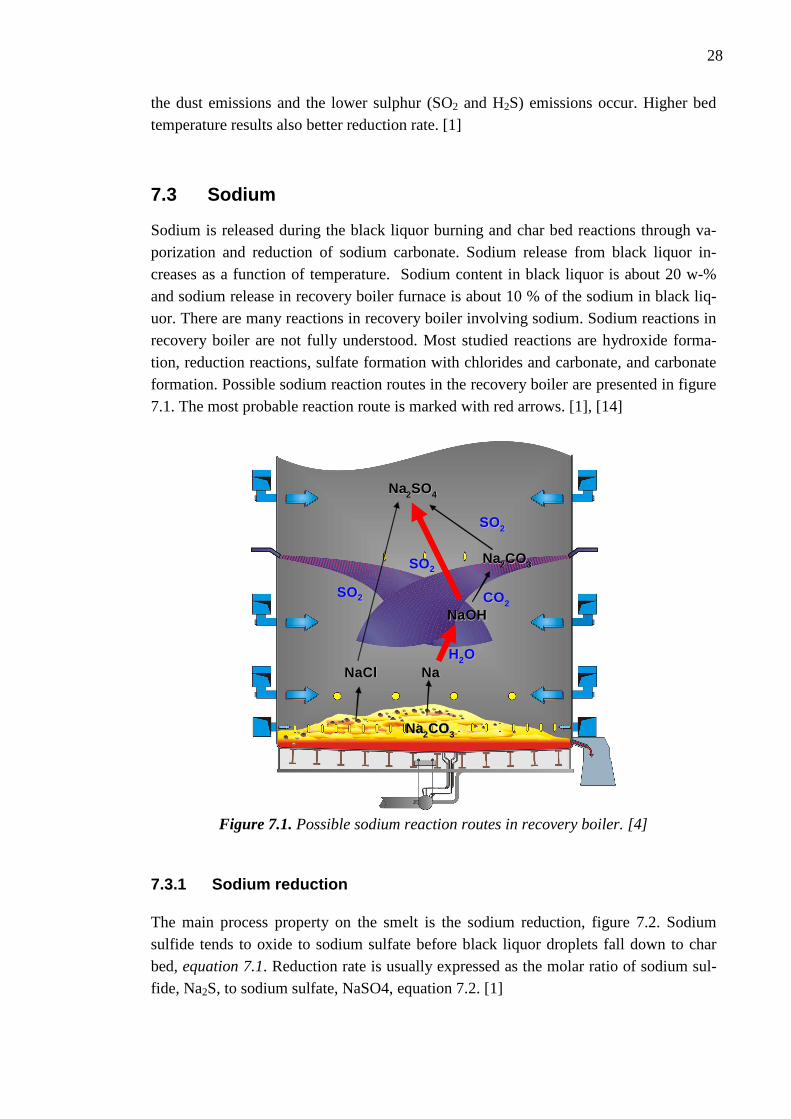
7.3.1 Sodium reduction
The main process property on the smelt is the sodium reduction, figure 7.2. Sodium sulfide tends to oxide to sodium sulfate before black liquor droplets fall down to char bed, equation 7.1. Reduction rate is usually expressed as the molar ratio of sodium sul-fide, Na2S, to sodium sulfate, NaSO4, equation 7.2. [1]
29
4222 SONaOSNa →+ (7.1)
422
2ReSONaSNa
SNaduction
+= (7.2)
NaNa22SSNaNa22SOSO44
REDUCTIONREDUCTION
OXIDATIONOXIDATION
NaNa22SSNaNa22SOSO44
REDUCTIONREDUCTION
OXIDATIONOXIDATION
NaNa22SSNaNa22SOSO44
REDUCTIONREDUCTION
OXIDATIONOXIDATION
Figure 7.2. Sodium reduction in recovery boiler. [4]
The higher the reduction the lower the amount of the sodium that reaches the cook un-usable. Reduction rates of 95…98 % are not uncommon in well operated modern recov-ery boilers. The carbon has a dual role in the char bed. During the sulfate – sulfide cycle the carbon reacts with Na2SO4 to from Na2S, equation 7.3 and 7.2. [1]
2242 22 COSNaCSONa +→+ (7.3)
COSNaCSONa 44 242 +→+ (7.4)
Usually, the reduction efficiency increases as the char bed temperature increases.
High reduction rate requires also reactive char layer above on the whole smelt area to block sodium from oxygen. For high reduction it is essential to control physical proper-ties of black liquor droplets. That can be done by controlling black liquor spraying pres-sure and temperature. Also the air feeding model in lower parts of the furnace has an effect on reduction efficiency. [1]
7.4 Sulfur
Sulfur emissions play crucial role in the char bed reactions. The sulfur in black liquor is for the most part in inorganic sulfur compounds, main compounds are sulfide and sul-fate. Some studies claim that about 30 % of incoming sulfur leaves the boiler furnace in
30
flue gas and fume. Black liquor dry solids do not have a strong correlation with sulfur release. But it should be pointed out that dry solid rate has great effect on the form in which sulfur leaves the boiler. At high dry solids there are hardly any gaseous SO2 emissions. This is because of the high temperatures in lower furnace and as a result more sodium is volatilized and reacted with SO2, see figure 7.1. Unwanted emissions from recovery boiler are discussed more closely in chapter 8. [1], [14]
Sulfidity is the molar ration of sodium sulfide to the total alkali content, equa-tion 7.2.
22 KNa
SSulfidity TOT
+= (7.2)
Equation 7.2 is widely used because of ease of measuring. Sulfidity depends on the liq-uor circulation of the mill. Too high sulfidity causes operating problems for the recov-ery boiler. Increased sulfidity increases SO2 and TRS emissions. [1]
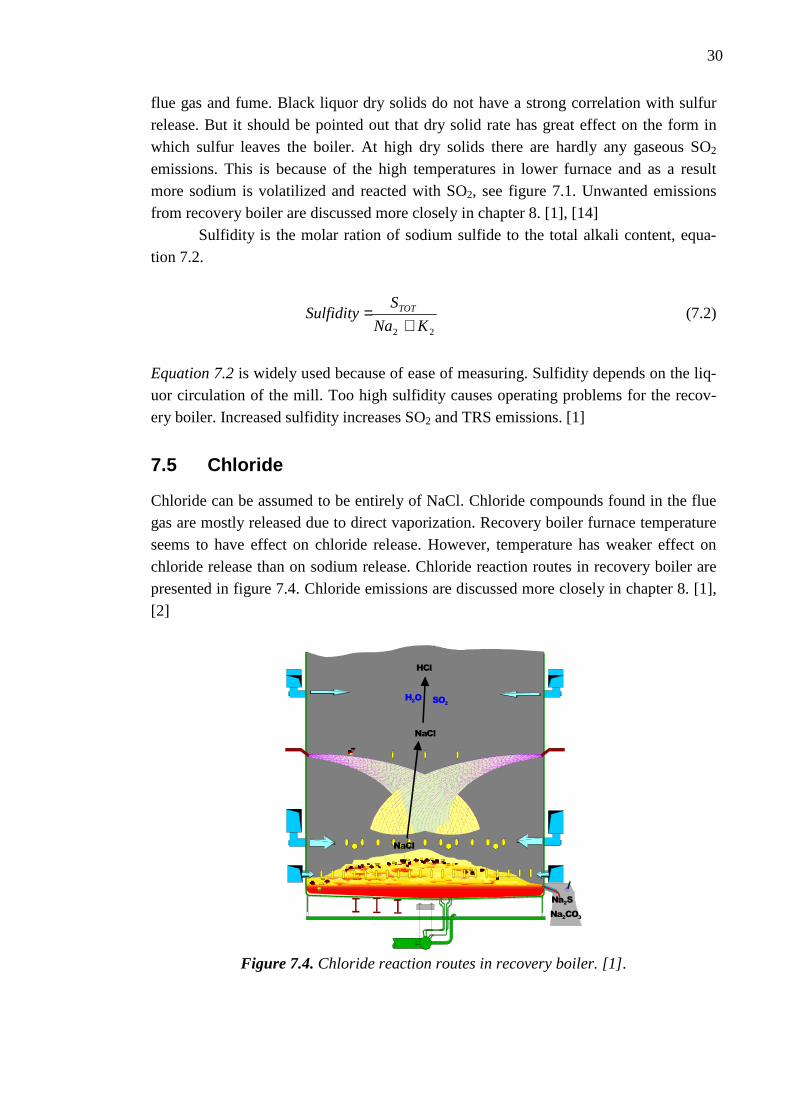
7.5 Chloride
Chloride can be assumed to be entirely of NaCl. Chloride compounds found in the flue gas are mostly released due to direct vaporization. Recovery boiler furnace temperature seems to have effect on chloride release. However, temperature has weaker effect on chloride release than on sodium release. Chloride reaction routes in recovery boiler are presented in figure 7.4. Chloride emissions are discussed more closely in chapter 8. [1], [2]
Na2S
Na2CO
3
NaCl
HCl
NaCl
H2O SO
2
Figure 7.4. Chloride reaction routes in recovery boiler. [1].
31
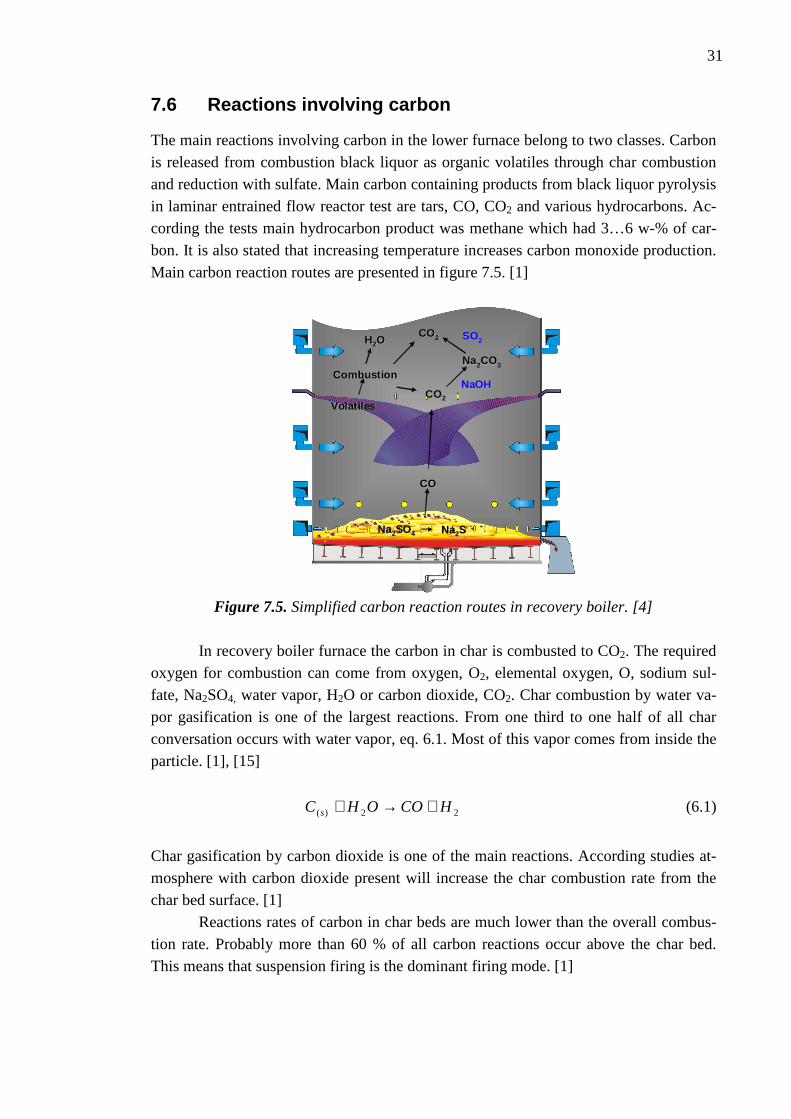
7.6 Reactions involving carbon
The main reactions involving carbon in the lower furnace belong to two classes. Carbon is released from combustion black liquor as organic volatiles through char combustion and reduction with sulfate. Main carbon containing products from black liquor pyrolysis in laminar entrained flow reactor test are tars, CO, CO2 and various hydrocarbons. Ac-cording the tests main hydrocarbon product was methane which had 3…6 w-% of car-bon. It is also stated that increasing temperature increases carbon monoxide production. Main carbon reaction routes are presented in figure 7.5. [1]
NaNa22SOSO44 NaNa22SS
COCO
COCO22VolatilesVolatiles
COCO22
NaNa22COCO33
NaOHNaOH
SOSO22
CombustionCombustion
HH22OO
NaNa22SOSO44 NaNa22SS
COCO
COCO22VolatilesVolatiles
COCO22
NaNa22COCO33
NaOHNaOH
SOSO22
CombustionCombustion
HH22OO
Figure 7.5. Simplified carbon reaction routes in recovery boiler. [4]
In recovery boiler furnace the carbon in char is combusted to CO2. The required
oxygen for combustion can come from oxygen, O2, elemental oxygen, O, sodium sul-fate, Na2SO4, water vapor, H2O or carbon dioxide, CO2. Char combustion by water va-por gasification is one of the largest reactions. From one third to one half of all char conversation occurs with water vapor, eq. 6.1. Most of this vapor comes from inside the particle. [1], [15]
22)( HCOOHC s +→+ (6.1)
Char gasification by carbon dioxide is one of the main reactions. According studies at-mosphere with carbon dioxide present will increase the char combustion rate from the char bed surface. [1] Reactions rates of carbon in char beds are much lower than the overall combus-tion rate. Probably more than 60 % of all carbon reactions occur above the char bed. This means that suspension firing is the dominant firing mode. [1]
32
8 RECOVERY BOILER EMISSIONS
In this section recovery boiler air emissions are discussed briefly. It can be claimed that harmful emissions from modern recovery boiler are very low. For example sulfur emis-sions are very limited problem nowadays due to high black liquor dry solids and im-proved air feeding system. Also particular matter emissions are low because of im-proved flue gas cleaning. CO and NOx emissions are the main issue for discussion to-day. In modern recovery boiler, equipped with advanced air system, NOx emissions below 300 mg/m3n (as NO2 in dry flue gas, 3% O2 content) are already a standard. [13], [16], [17]
8.1 Sulfur gas emissions
Sulfur dioxide SO2 is a colorless gas. Sulfur dioxide is a major contributor to acid rain. Sulfur dioxide is transported by air for long distances. In recovery boilers, SO2 emis-sions are dependent on the dry solids and the black liquor sulfur to sodium and potas-sium molar ratio. The higher dry solids and the better reduction of sulfur emissions can be predicted. This is because high dry solids increase lower furnace temperature. High sulfidity also correlates to high sulfur emissions. Even boilers that fire 80 % dry solids will have sulfur emissions if sulfidity is high enough. Generally recovery boiler sulfur emissions are very low. Even with very high sulfidities the sulfur dioxide emissions tent to decrease to levels below 10 ppm. [1]
8.2 HCL emissions
Chloride contain in virgin black liquor is typically 0.2…2 %. Released chlorine in the recovery boiler furnace reacts to form HCl. Chlorine can be found in ESP dust as NaCl and KCl and in flue gas as HCl. The enrichment factor, equation 8.1, of chlorine is 1-4.5 from black liquor to ESP dust. [1]
( )
( ) rblackliquo
dust
KNaCl
KNaCl
++
(8.1)
Chloride compounds have a great impact to dust behavior. Even small chloride
contents can make dust stickier and hence increase fouling. When deposits melt there is higher risk for corrosion. Temperature has effect on chloride concentration in flue gas. High temperatures, over 1000 °C, increase chloride vaporization. [1], [2], [18], [19]
33
8.3 Carbon monoxide emissions
Incomplete combustion produces carbon monoxide (CO) emissions. CO emissions in-crease dramatically when black liquor is burnt at very low excess oxygen conditions. Conditions with low oxygen content may occur if used combustion air ratio is too low or combustion air mixing with the flue gas is inefficient. CO emissions tend to correlate well with O2 content in flue gas. Enough high amounts of excess air and effective mix-ing guarantee low CO emissions. High furnace temperature and long residence time also decrease CO emission. [1]
However, the flue gas residence time in the furnace and excess air are not alone guarantee for low CO emissions. Resent studies show that the mixing of flue gas and air jets plays major role when CO emission are discussed. Also controlling char bed is im-portant. Char bed conditions have great effect on amount of CO rising from the char bed. Tertiary air burns the remaining combustibles, including high amount of CO, rising from the lower furnace section. Today, in modern recovery boiler design high air ve-locities in tertiary air ports are used to achieve good mixing and complete CO combus-tion. In modern recovery boilers the CO level is not greatly affected by as fired black liquor dry solid or boiler load. Generally CO emission level correlates usually the effi-ciency of overall combustion. One can assume that also other unburned matter can be found in flue gas if high CO levels exist. This may cause corrosion. [1], [9]
8.4 Nitrogen emissions
Wood contains about 0.05…0.15 w-% of nitrogen. During the kraft cooking most of it is released and transferred to black liquor. Main forms of nitrogen in black liquor are pyrrole, pyrinide and amino acids. Different wood species have nitrogen in different forms. For example in pine about fifteen different amino acids can be found. About two thirds of nitrogen in black liquor is released as ammonia during volatiles release. The rest remains in char and exits the recovery boiler with smelt. In generally, can be said that in recovery boiler nitrogen in black liquor has three pathways: It ends up as NO, elemental nitrogen or nitrogen in smelt. [1] The formation of NOx in coal, gas and oil flames has been extensively studied. NOx formation chemistry is quite complex. Today, the NOx formation chemistry is quite well understood and several NOx reduction technologies are available. The main sources of NOx in boilers are fuel and thermal NOx. The fuel NOx is formed during the pyrolysis and volatiles evolution. It is the main NOx source in recovery boilers. Thermal NOx is formed during combustion. The source is elemental nitrogen coming with combustion air. Formation of thermal NOx is low until the furnace temperatures reach 1400 °C. In recovery boilers temperatures are too low for significant thermal NOx production. Even increase of black liquor dry solids from 67 to 80 % does not produce significant amounts of thermal NOx. In lower furnace parts NOx formation is affected by the amount of air and combustible product. The lower furnace parts are at or below
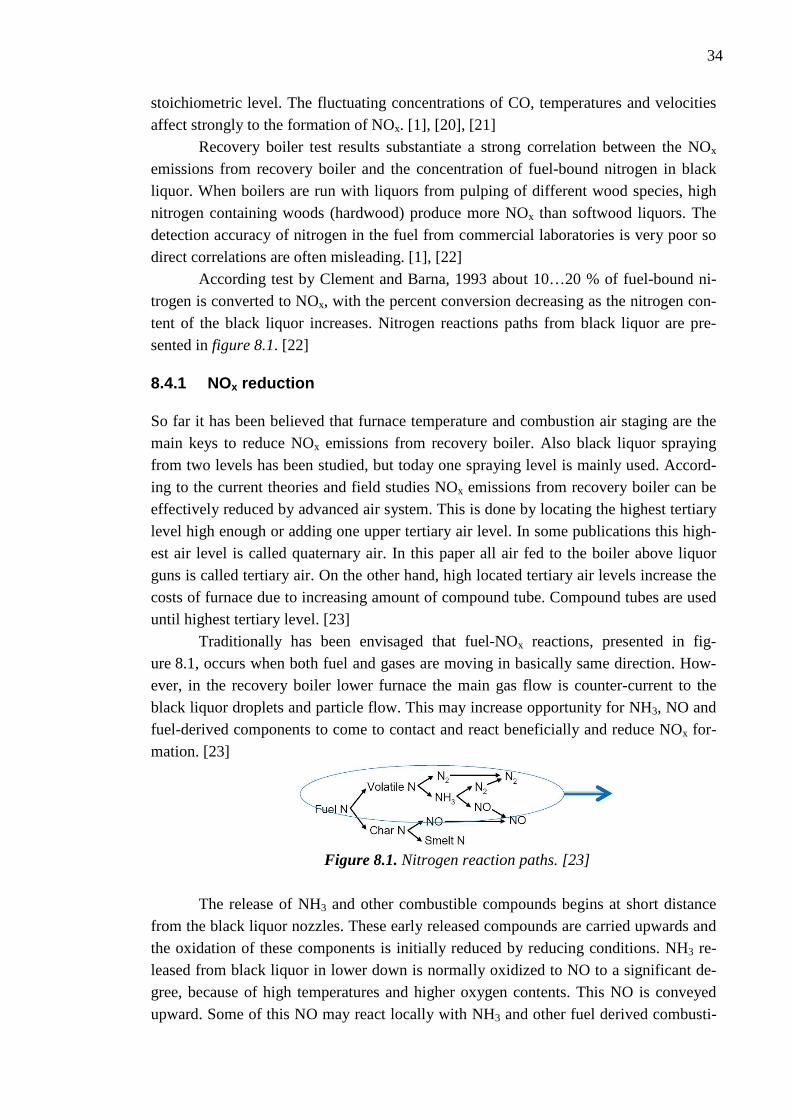
34
stoichiometric level. The fluctuating concentrations of CO, temperatures and velocities affect strongly to the formation of NOx. [1], [20], [21]
Recovery boiler test results substantiate a strong correlation between the NOx emissions from recovery boiler and the concentration of fuel-bound nitrogen in black liquor. When boilers are run with liquors from pulping of different wood species, high nitrogen containing woods (hardwood) produce more NOx than softwood liquors. The detection accuracy of nitrogen in the fuel from commercial laboratories is very poor so direct correlations are often misleading. [1], [22]
According test by Clement and Barna, 1993 about 10…20 % of fuel-bound ni-trogen is converted to NOx, with the percent conversion decreasing as the nitrogen con-tent of the black liquor increases. Nitrogen reactions paths from black liquor are pre-sented in figure 8.1. [22]
8.4.1 NOx reduction
So far it has been believed that furnace temperature and combustion air staging are the main keys to reduce NOx emissions from recovery boiler. Also black liquor spraying from two levels has been studied, but today one spraying level is mainly used. Accord-ing to the current theories and field studies NOx emissions from recovery boiler can be effectively reduced by advanced air system. This is done by locating the highest tertiary level high enough or adding one upper tertiary air level. In some publications this high-est air level is called quaternary air. In this paper all air fed to the boiler above liquor guns is called tertiary air. On the other hand, high located tertiary air levels increase the costs of furnace due to increasing amount of compound tube. Compound tubes are used until highest tertiary level. [23]
Traditionally has been envisaged that fuel-NOx reactions, presented in fig-ure 8.1, occurs when both fuel and gases are moving in basically same direction. How-ever, in the recovery boiler lower furnace the main gas flow is counter-current to the black liquor droplets and particle flow. This may increase opportunity for NH3, NO and fuel-derived components to come to contact and react beneficially and reduce NOx for-mation. [23]
Figure 8.1. Nitrogen reaction paths. [23]
The release of NH3 and other combustible compounds begins at short distance
from the black liquor nozzles. These early released compounds are carried upwards and the oxidation of these components is initially reduced by reducing conditions. NH3 re-leased from black liquor in lower down is normally oxidized to NO to a significant de-gree, because of high temperatures and higher oxygen contents. This NO is conveyed upward. Some of this NO may react locally with NH3 and other fuel derived combusti-
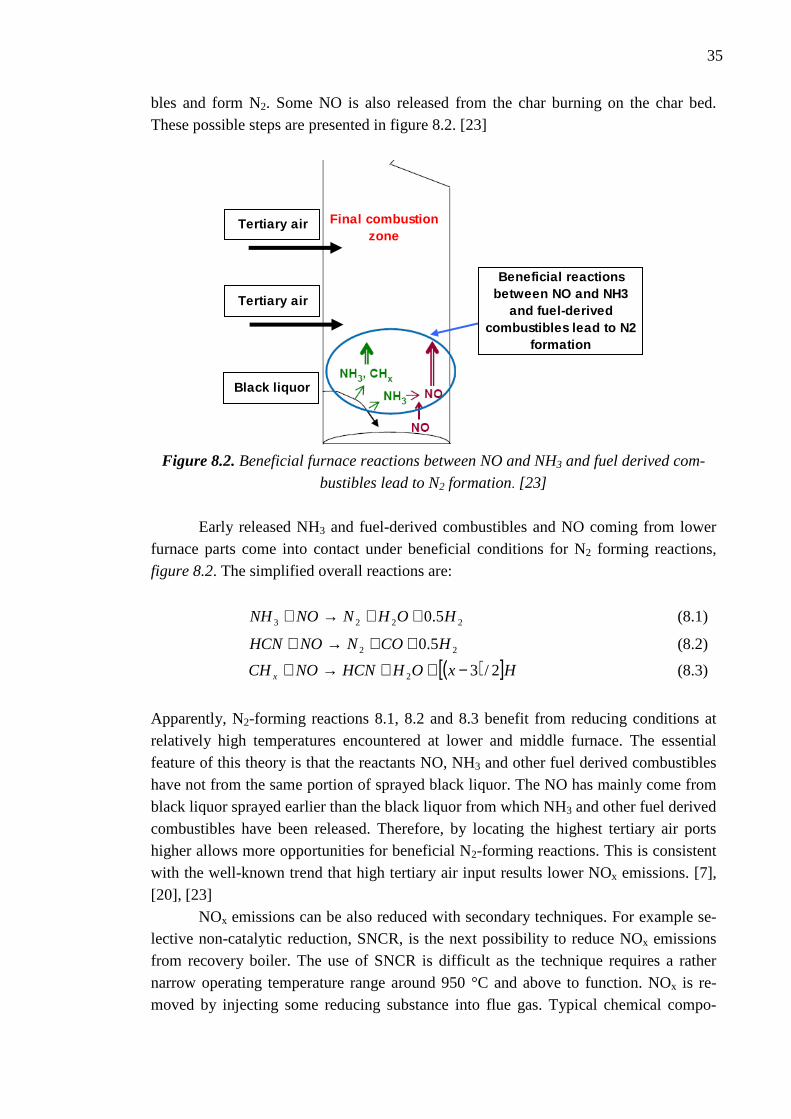
35
bles and form N2. Some NO is also released from the char burning on the char bed. These possible steps are presented in figure 8.2. [23]
Tertiary air
Tertiary air
Beneficial reactions between NO and NH3
and fuel-derived combustibles lead to N2
formation
Black liquor
Final combustion zone
Figure 8.2. Beneficial furnace reactions between NO and NH3 and fuel derived com-
bustibles lead to N2 formation. [23]
Early released NH3 and fuel-derived combustibles and NO coming from lower
furnace parts come into contact under beneficial conditions for N2 forming reactions, figure 8.2. The simplified overall reactions are:
2223 5.0 HOHNNONH ++→+ (8.1)
22 5.0 HCONNOHCN ++→+ (8.2)
( )[ ]HxOHHCNNOCH x 2/32 −++→+ (8.3)
Apparently, N2-forming reactions 8.1, 8.2 and 8.3 benefit from reducing conditions at relatively high temperatures encountered at lower and middle furnace. The essential feature of this theory is that the reactants NO, NH3 and other fuel derived combustibles have not from the same portion of sprayed black liquor. The NO has mainly come from black liquor sprayed earlier than the black liquor from which NH3 and other fuel derived combustibles have been released. Therefore, by locating the highest tertiary air ports higher allows more opportunities for beneficial N2-forming reactions. This is consistent with the well-known trend that high tertiary air input results lower NOx emissions. [7], [20], [23]
NOx emissions can be also reduced with secondary techniques. For example se-lective non-catalytic reduction, SNCR, is the next possibility to reduce NOx emissions from recovery boiler. The use of SNCR is difficult as the technique requires a rather narrow operating temperature range around 950 °C and above to function. NOx is re-moved by injecting some reducing substance into flue gas. Typical chemical compo-
36
nents used are ammonia, urea and their derivatives. The NOx level in the flue gas low-ered from depending on how much reducing agent is used and how big ammonia slip is allowed. With the spraying of the ammonia there exists always some ammonia slip caused by the unevenness of the spraying and NOx. Ammonia is known to cause low temperature corrosion and it is in itself a corrosive agent. [1], [24]
8.5 Particulates
Particulate or dust matter is small particles suspended in the air. They are one of the most noteworthy air quality problems in urban areas. Particular matter is usually re-ported as total solid mass flow. In recovery boilers dust emissions are strongly depended on boiler load. Even with high dry solids the emission after recovery boiler economizer is typically about 20 g/m3n. It has been noted that firing with high black liquor droplet velocities and small droplets causes excess carry over and dust emissions. Dust emis-sions can be reduced by using electrostatic precipitators. [1]
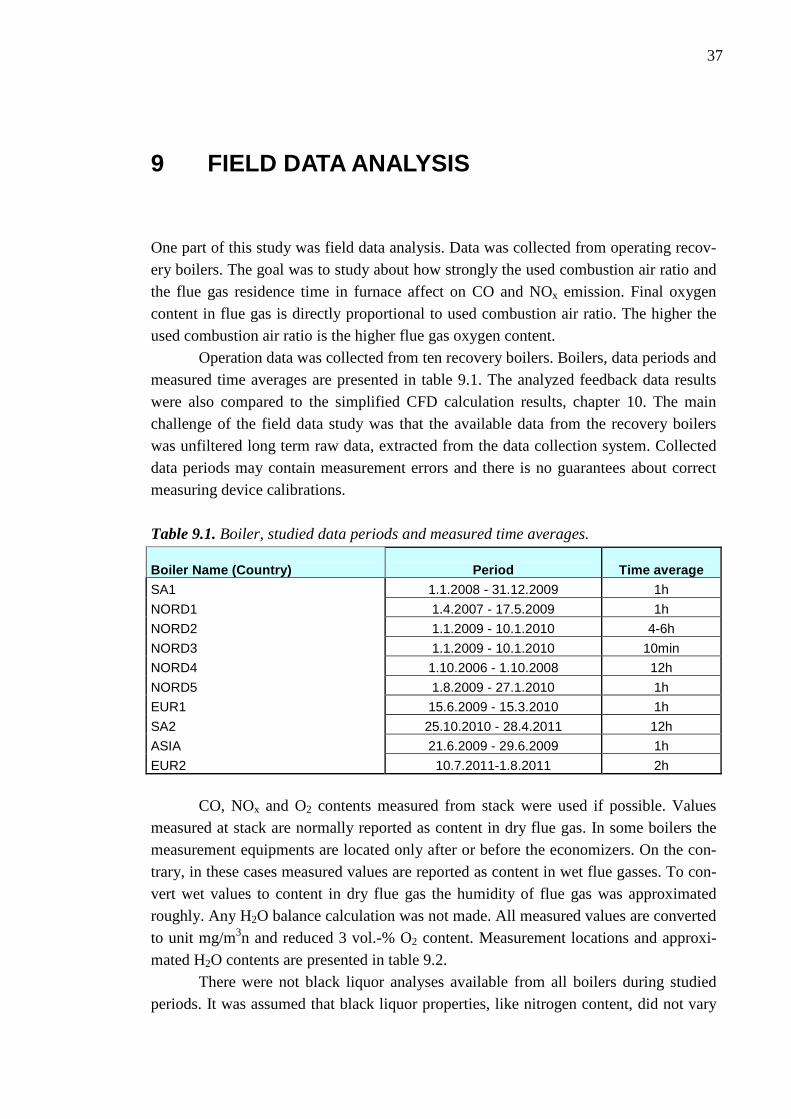
37
9 FIELD DATA ANALYSIS
One part of this study was field data analysis. Data was collected from operating recov-ery boilers. The goal was to study about how strongly the used combustion air ratio and the flue gas residence time in furnace affect on CO and NOx emission. Final oxygen content in flue gas is directly proportional to used combustion air ratio. The higher the used combustion air ratio is the higher flue gas oxygen content.
Operation data was collected from ten recovery boilers. Boilers, data periods and measured time averages are presented in table 9.1. The analyzed feedback data results were also compared to the simplified CFD calculation results, chapter 10. The main challenge of the field data study was that the available data from the recovery boilers was unfiltered long term raw data, extracted from the data collection system. Collected data periods may contain measurement errors and there is no guarantees about correct measuring device calibrations.
Table 9.1. Boiler, studied data periods and measured time averages.
Boiler Name (Country) Period Time average
SA1 1.1.2008 - 31.12.2009 1h
NORD1 1.4.2007 - 17.5.2009 1h
NORD2 1.1.2009 - 10.1.2010 4-6h
NORD3 1.1.2009 - 10.1.2010 10min
NORD4 1.10.2006 - 1.10.2008 12h
NORD5 1.8.2009 - 27.1.2010 1h
EUR1 15.6.2009 - 15.3.2010 1h
SA2 25.10.2010 - 28.4.2011 12h
ASIA 21.6.2009 - 29.6.2009 1h
EUR2 10.7.2011-1.8.2011 2h
CO, NOx and O2 contents measured from stack were used if possible. Values measured at stack are normally reported as content in dry flue gas. In some boilers the measurement equipments are located only after or before the economizers. On the con-trary, in these cases measured values are reported as content in wet flue gasses. To con-vert wet values to content in dry flue gas the humidity of flue gas was approximated roughly. Any H2O balance calculation was not made. All measured values are converted to unit mg/m3n and reduced 3 vol.-% O2 content. Measurement locations and approxi-mated H2O contents are presented in table 9.2.
There were not black liquor analyses available from all boilers during studied periods. It was assumed that black liquor properties, like nitrogen content, did not vary
38
too much during the study periods. Also possible used auxiliary fuels, like NCG gases and oil or natural gas were ignored. Fired black liquor nitrogen content and possible used auxiliary fuel may have some effect on NOx emissions.
Table 9.2. O2, CO and NOx content measurement locations.
Boiler Name (Country) Period Time average
SA1 1.1.2008 - 31.12.2009 1h
NORD1 1.4.2007 - 17.5.2009 1h
NORD2 1.1.2009 - 10.1.2010 4-6h
NORD3 1.1.2009 - 10.1.2010 10min
NORD4 1.10.2006 - 1.10.2008 12h
NORD5 1.8.2009 - 27.1.2010 1h
EUR1 15.6.2009 - 15.3.2010 1h
SA2 25.10.2010 - 28.4.2011 12h
ASIA 21.6.2009 - 29.6.2009 1h
EUR2 10.7.2011-1.8.2011 2h
9.1 Data filtering criteria
To get stable boiler operation periods raw data was filtered. Data filtering was made by setting upper and lower limit to crucial process values. The chosen process values were boiler load, black liquor properties and air feeding model. Limits were chosen close to engineered 100 % MCR values, if possible, in order to achieve good and effective boiler operating conditions. If the boiler was operated with over or under the MCR load during the available data period, the ranges were selected so that there was as much as possible continuous operating data available. Designed MCR values and selected value ranges of the studied boilers are presented in appendix 1.
The boiler load was controlled by the main steam flow and black liquor proper-ties were controlled by the black liquor dry solids content. Selected dry solid content values are relative high compare to engineered MCR values. This is because dry solids content measure equipment tends to show higher values compare to the actual values. The available feedback data gives no reliable information about used air feeding model. For example the information about the number of used tertiary air ports was not avail-able. Only the mass flow portions for used air levels were available. The combustion air feeding into the boiler was controlled only by tertiary air portion. Primary and secon-dary air portions were assumed to be quite constant.
At the very beginning of this the study, available data was filtered with very nar-row data ranges. In addition black liquor temperature and bottom load were regarded. However, this strict screening did not yield desired results but very few scattered data points and making reasonable conclusions was impossible. This is because the measured time averages in available data were too long to plot results from very stable operations
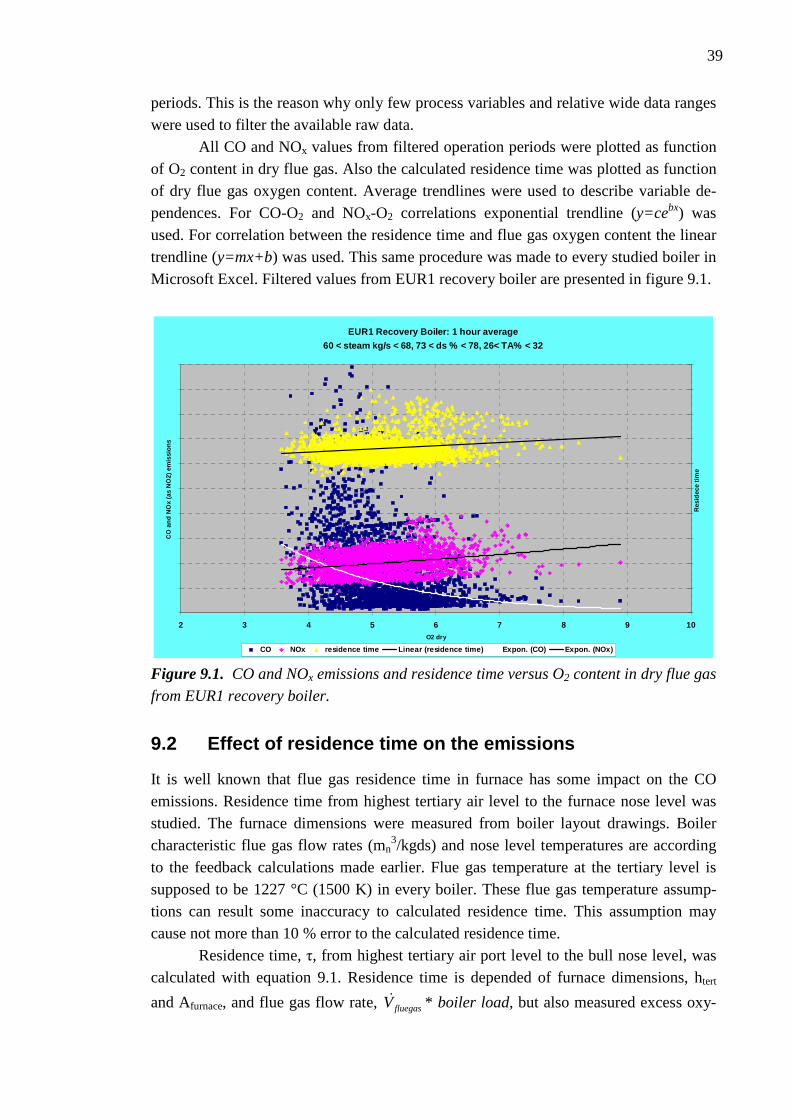
39
periods. This is the reason why only few process variables and relative wide data ranges were used to filter the available raw data.
All CO and NOx values from filtered operation periods were plotted as function of O2 content in dry flue gas. Also the calculated residence time was plotted as function of dry flue gas oxygen content. Average trendlines were used to describe variable de-pendences. For CO-O2 and NOx-O2 correlations exponential trendline (y=cebx) was used. For correlation between the residence time and flue gas oxygen content the linear trendline (y=mx+b) was used. This same procedure was made to every studied boiler in Microsoft Excel. Filtered values from EUR1 recovery boiler are presented in figure 9.1.
EUR1 Recovery Boiler: 1 hour average
60 < steam kg/s < 68, 73 < ds % < 78, 26< TA% < 32
2 3 4 5 6 7 8 9 10O2 dry
CO
and
NO
x (a
s N
O2)
em
issi
ons
Res
idec
e tim
e
CO NOx residence time Linear (residence time) Expon. (CO) Expon. (NOx) Figure 9.1. CO and NOx emissions and residence time versus O2 content in dry flue gas
from EUR1 recovery boiler.
9.2 Effect of residence time on the emissions
It is well known that flue gas residence time in furnace has some impact on the CO emissions. Residence time from highest tertiary air level to the furnace nose level was studied. The furnace dimensions were measured from boiler layout drawings. Boiler characteristic flue gas flow rates (mn
3/kgds) and nose level temperatures are according to the feedback calculations made earlier. Flue gas temperature at the tertiary level is supposed to be 1227 °C (1500 K) in every boiler. These flue gas temperature assump-tions can result some inaccuracy to calculated residence time. This assumption may cause not more than 10 % error to the calculated residence time. Residence time, τ, from highest tertiary air port level to the bull nose level, was calculated with equation 9.1. Residence time is depended of furnace dimensions, htert
and Afurnace, and flue gas flow rate, fluegasV& * boiler load, but also measured excess oxy-
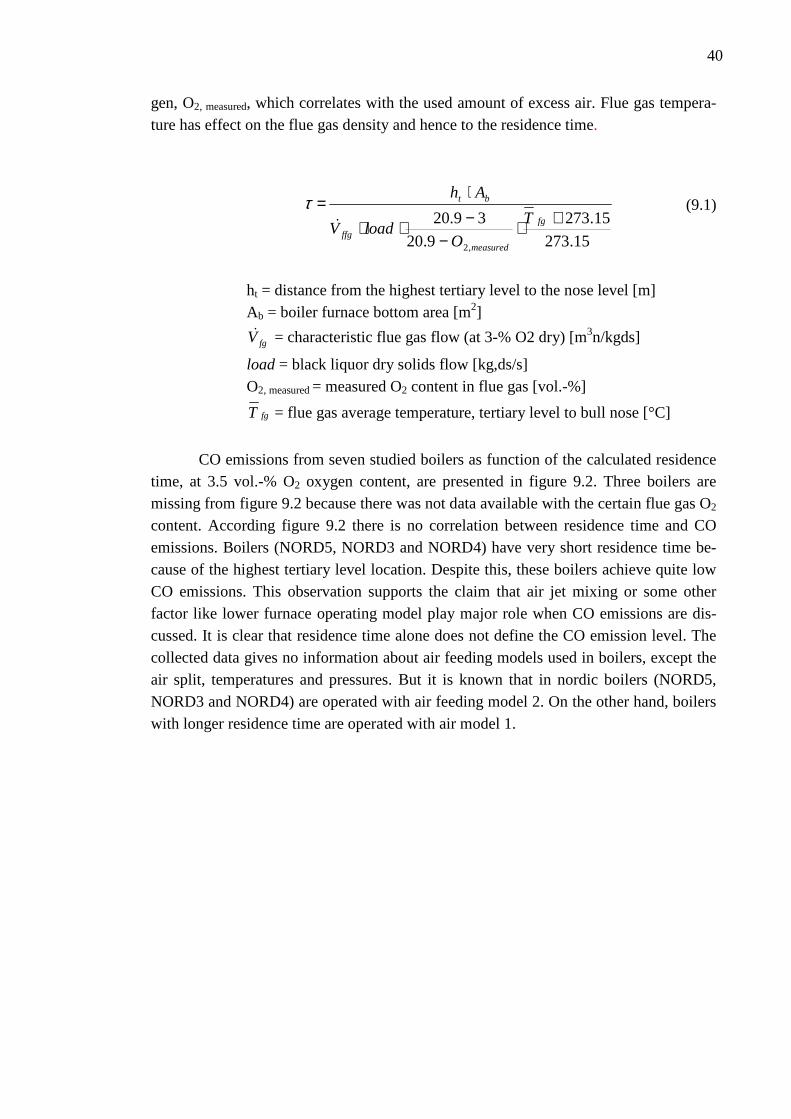
40
gen, O2, measured, which correlates with the used amount of excess air. Flue gas tempera-ture has effect on the flue gas density and hence to the residence time.
15.273
15.273
9.20
39.20
,2
+⋅−
−⋅⋅
⋅=
fg
measuredffg
bt
T
OloadV
Ah
&
τ (9.1)
ht = distance from the highest tertiary level to the nose level [m]
Ab = boiler furnace bottom area [m2]
fgV& = characteristic flue gas flow (at 3-% O2 dry) [m3n/kgds]
load = black liquor dry solids flow [kg,ds/s] O2, measured = measured O2 content in flue gas [vol.-%]
fgT = flue gas average temperature, tertiary level to bull nose [°C]
CO emissions from seven studied boilers as function of the calculated residence time, at 3.5 vol.-% O2 oxygen content, are presented in figure 9.2. Three boilers are missing from figure 9.2 because there was not data available with the certain flue gas O2 content. According figure 9.2 there is no correlation between residence time and CO emissions. Boilers (NORD5, NORD3 and NORD4) have very short residence time be-cause of the highest tertiary level location. Despite this, these boilers achieve quite low CO emissions. This observation supports the claim that air jet mixing or some other factor like lower furnace operating model play major role when CO emissions are dis-cussed. It is clear that residence time alone does not define the CO emission level. The collected data gives no information about air feeding models used in boilers, except the air split, temperatures and pressures. But it is known that in nordic boilers (NORD5, NORD3 and NORD4) are operated with air feeding model 2. On the other hand, boilers with longer residence time are operated with air model 1.
41
CO vs Residence time (Highest Tertiary to Nose Leve l) (3,5 % O2)
Residence time
CO
em
issi
ons
(3%
O2)
SA1 NORD1 NORD3 NORD4 NORD5 EUR1 ASIA
Air model 2
Air model 1
Figure 9.2. CO emissions versus residence time @ 3.5 vol.-% oxygen in flue gas.
9.3 Flue gas oxygen content effect on the CO emissi ons
CO values from the studied periods were plotted as function of O2 content in dry flue gas. In figure 9.3 results from NORD3 recovery are presented. There is a great disper-sion in used O2 range. Lower oxygen contents produce more CO, but there is no clear correlation. According to this, other variables than O2 alone affect on the level of CO emissions quite strongly. Results from other studied boilers were quite similar. Results from studied boilers based on CO-O2 average trendlines are presented in figure 9.4. Av-erage correlations between studied boilers are quite similar, high oxygen contents pro-duce lower CO emissions.
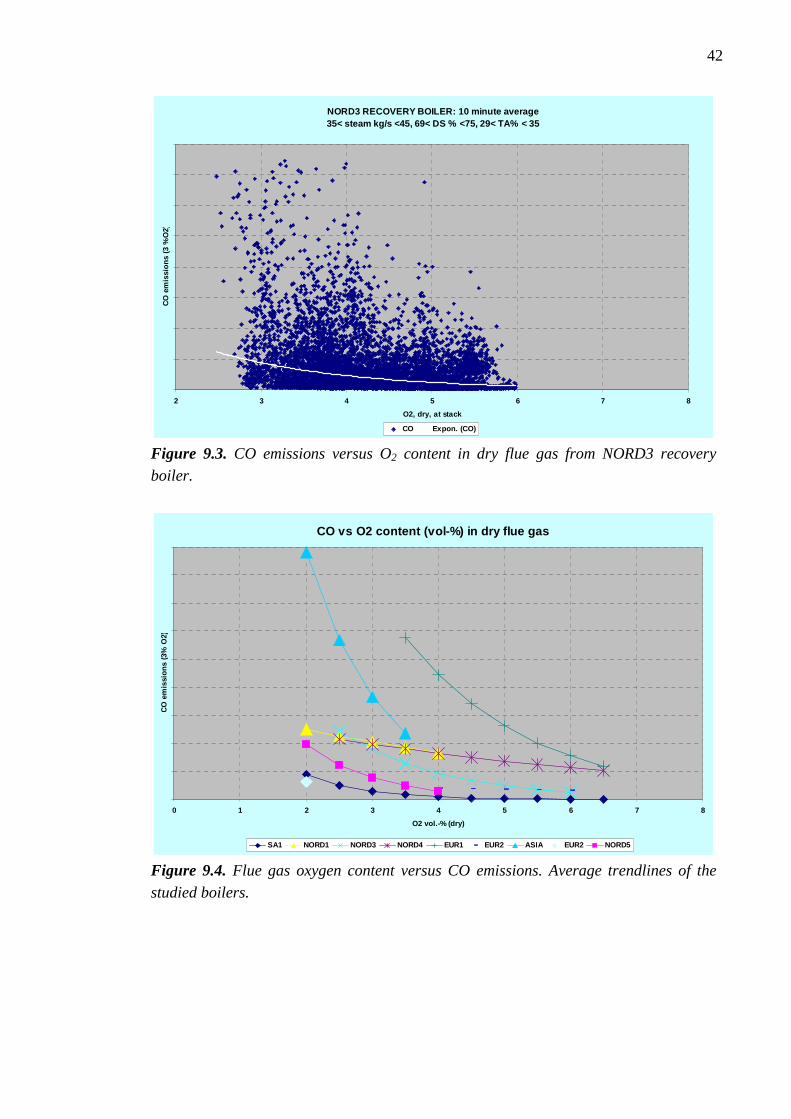
42
NORD3 RECOVERY BOILER: 10 minute average35< steam kg/s <45, 69< DS % <75, 29< TA% < 35
2 3 4 5 6 7 8
O2, dry, at stack
CO
em
issi
ons
(3 %
O2)
CO Expon. (CO)
Figure 9.3. CO emissions versus O2 content in dry flue gas from NORD3 recovery
boiler.
CO vs O2 content (vol-%) in dry flue gas
0 1 2 3 4 5 6 7 8
O2 vol.-% (dry)
CO
em
issi
ons
(3%
O2)
SA1 NORD1 NORD3 NORD4 EUR1 EUR2 ASIA EUR2 NORD5
Figure 9.4. Flue gas oxygen content versus CO emissions. Average trendlines of the
studied boilers.
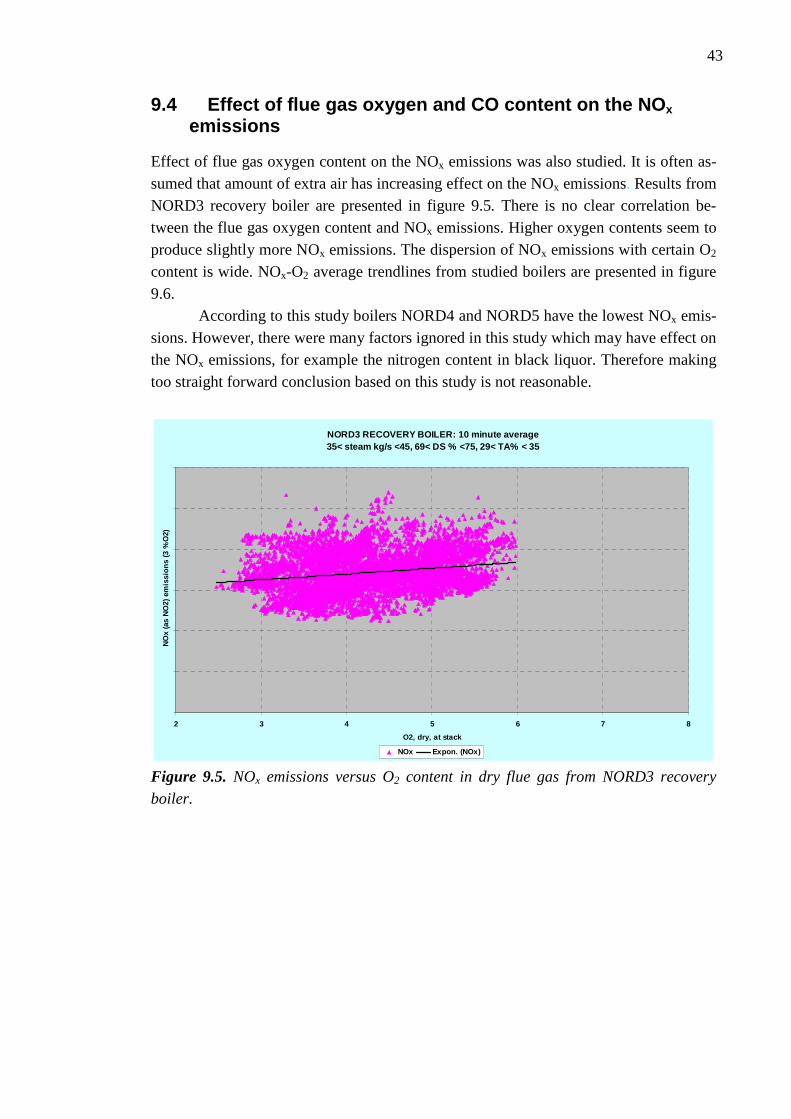
43
9.4 Effect of flue gas oxygen and CO content on the NOx
emissions
Effect of flue gas oxygen content on the NOx emissions was also studied. It is often as-sumed that amount of extra air has increasing effect on the NOx emissions. Results from NORD3 recovery boiler are presented in figure 9.5. There is no clear correlation be-tween the flue gas oxygen content and NOx emissions. Higher oxygen contents seem to produce slightly more NOx emissions. The dispersion of NOx emissions with certain O2 content is wide. NOx-O2 average trendlines from studied boilers are presented in figure 9.6.
According to this study boilers NORD4 and NORD5 have the lowest NOx emis-sions. However, there were many factors ignored in this study which may have effect on the NOx emissions, for example the nitrogen content in black liquor. Therefore making too straight forward conclusion based on this study is not reasonable.
NORD3 RECOVERY BOILER: 10 minute average35< steam kg/s <45, 69< DS % <75, 29< TA% < 35
2 3 4 5 6 7 8
O2, dry, at stack
NO
x (a
s N
O2)
em
issi
ons
(3 %
O2)
NOx Expon. (NOx)
Figure 9.5. NOx emissions versus O2 content in dry flue gas from NORD3 recovery
boiler.
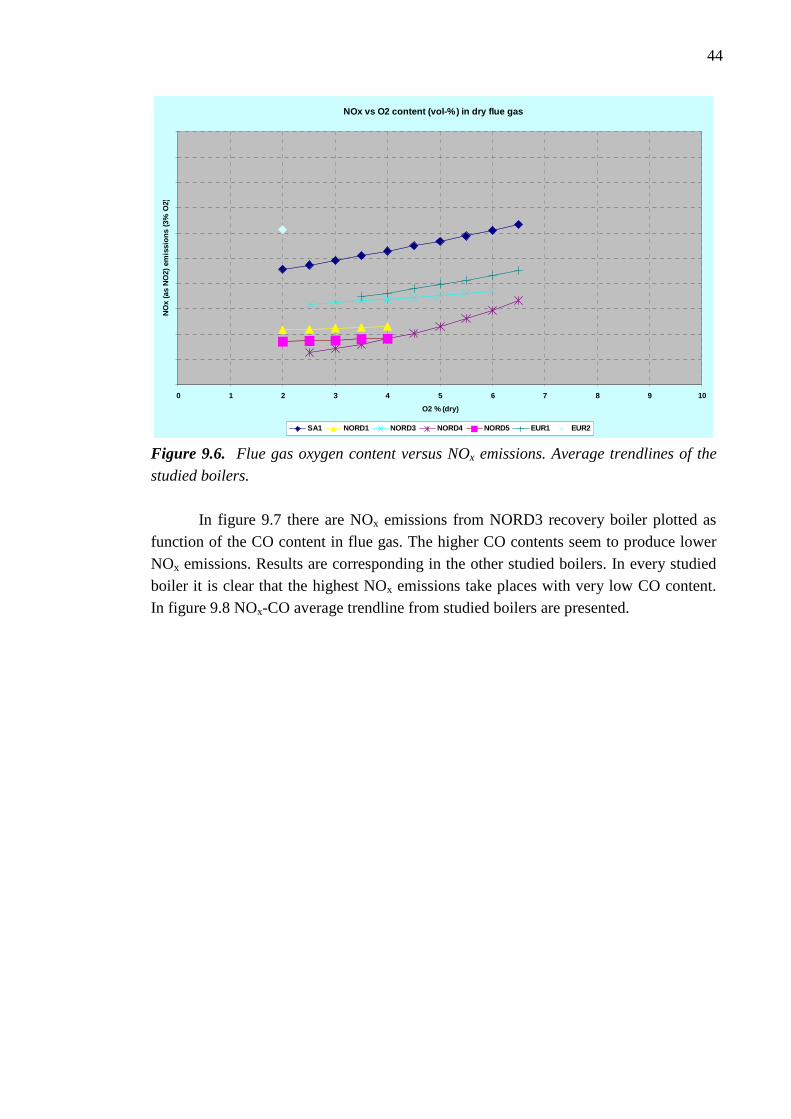
44
NOx vs O2 content (vol-%) in dry flue gas
0 1 2 3 4 5 6 7 8 9 10
O2 % (dry)
NO
x (a
s N
O2)
em
issi
ons
(3%
O2)
SA1 NORD1 NORD3 NORD4 NORD5 EUR1 EUR2
Figure 9.6. Flue gas oxygen content versus NOx emissions. Average trendlines of the
studied boilers.
In figure 9.7 there are NOx emissions from NORD3 recovery boiler plotted as function of the CO content in flue gas. The higher CO contents seem to produce lower NOx emissions. Results are corresponding in the other studied boilers. In every studied boiler it is clear that the highest NOx emissions take places with very low CO content. In figure 9.8 NOx-CO average trendline from studied boilers are presented.
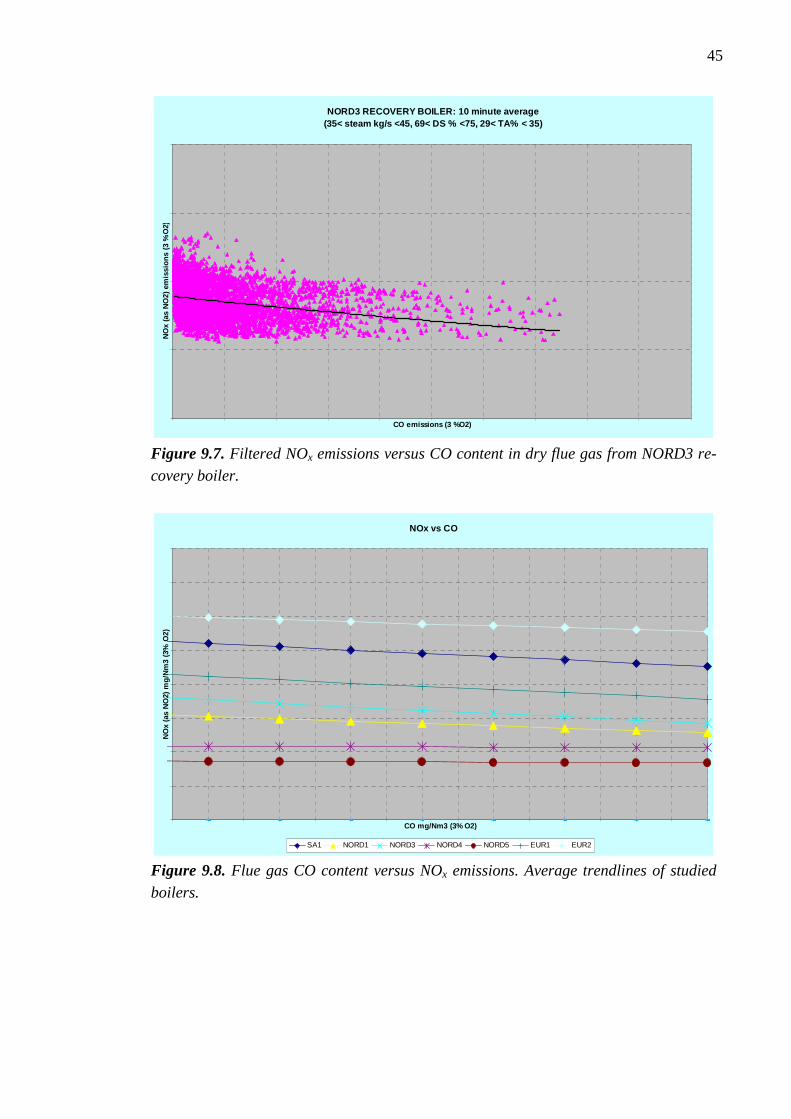
45
NORD3 RECOVERY BOILER: 10 minute average(35< steam kg/s <45, 69< DS % <75, 29< TA% < 35)
CO emissions (3 %O2)
NO
x (a
s N
O2)
em
issi
ons
(3 %
O2)
Figure 9.7. Filtered NOx emissions versus CO content in dry flue gas from NORD3 re-
covery boiler.
NOx vs CO
CO mg/Nm3 (3% O2)
NO
x (a
s N
O2)
mg/
Nm
3 (3
% O
2)
SA1 NORD1 NORD3 NORD4 NORD5 EUR1 EUR2
Figure 9.8. Flue gas CO content versus NOx emissions. Average trendlines of studied
boilers.
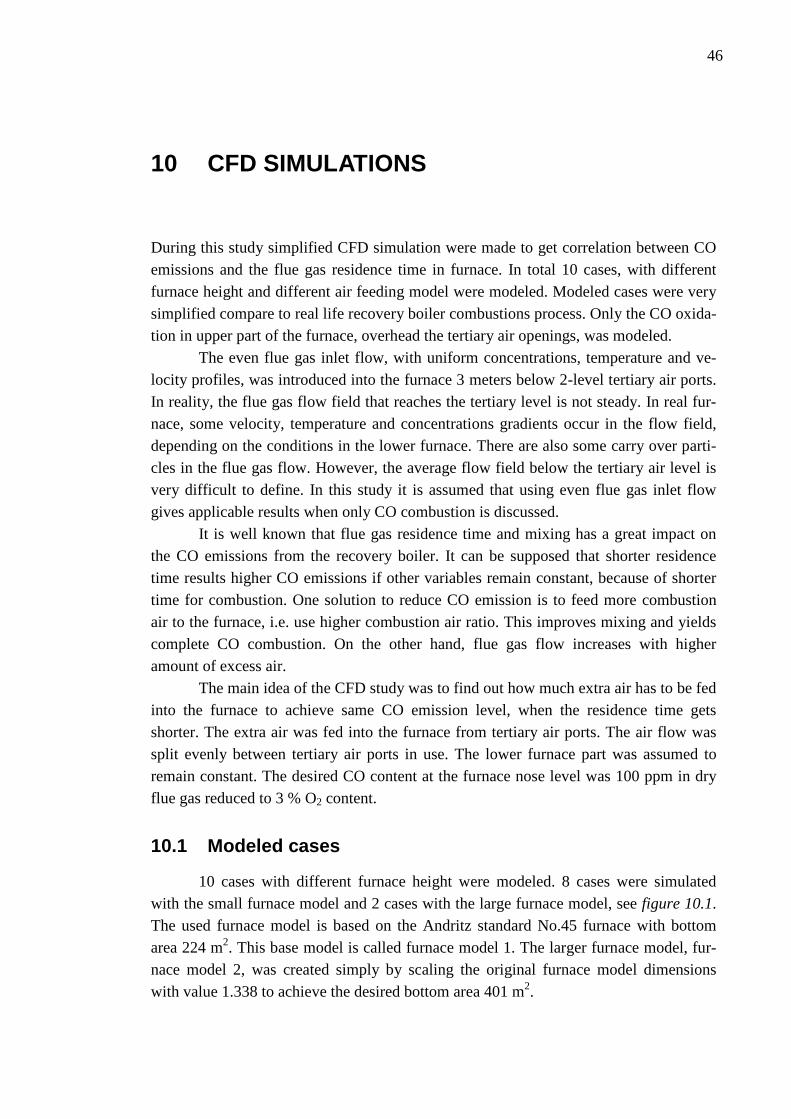
46
10 CFD SIMULATIONS
During this study simplified CFD simulation were made to get correlation between CO emissions and the flue gas residence time in furnace. In total 10 cases, with different furnace height and different air feeding model were modeled. Modeled cases were very simplified compare to real life recovery boiler combustions process. Only the CO oxida-tion in upper part of the furnace, overhead the tertiary air openings, was modeled.
The even flue gas inlet flow, with uniform concentrations, temperature and ve-locity profiles, was introduced into the furnace 3 meters below 2-level tertiary air ports. In reality, the flue gas flow field that reaches the tertiary level is not steady. In real fur-nace, some velocity, temperature and concentrations gradients occur in the flow field, depending on the conditions in the lower furnace. There are also some carry over parti-cles in the flue gas flow. However, the average flow field below the tertiary air level is very difficult to define. In this study it is assumed that using even flue gas inlet flow gives applicable results when only CO combustion is discussed. It is well known that flue gas residence time and mixing has a great impact on the CO emissions from the recovery boiler. It can be supposed that shorter residence time results higher CO emissions if other variables remain constant, because of shorter time for combustion. One solution to reduce CO emission is to feed more combustion air to the furnace, i.e. use higher combustion air ratio. This improves mixing and yields complete CO combustion. On the other hand, flue gas flow increases with higher amount of excess air.
The main idea of the CFD study was to find out how much extra air has to be fed into the furnace to achieve same CO emission level, when the residence time gets shorter. The extra air was fed into the furnace from tertiary air ports. The air flow was split evenly between tertiary air ports in use. The lower furnace part was assumed to remain constant. The desired CO content at the furnace nose level was 100 ppm in dry flue gas reduced to 3 % O2 content.
10.1 Modeled cases
10 cases with different furnace height were modeled. 8 cases were simulated with the small furnace model and 2 cases with the large furnace model, see figure 10.1. The used furnace model is based on the Andritz standard No.45 furnace with bottom area 224 m2. This base model is called furnace model 1. The larger furnace model, fur-nace model 2, was created simply by scaling the original furnace model dimensions with value 1.338 to achieve the desired bottom area 401 m2.
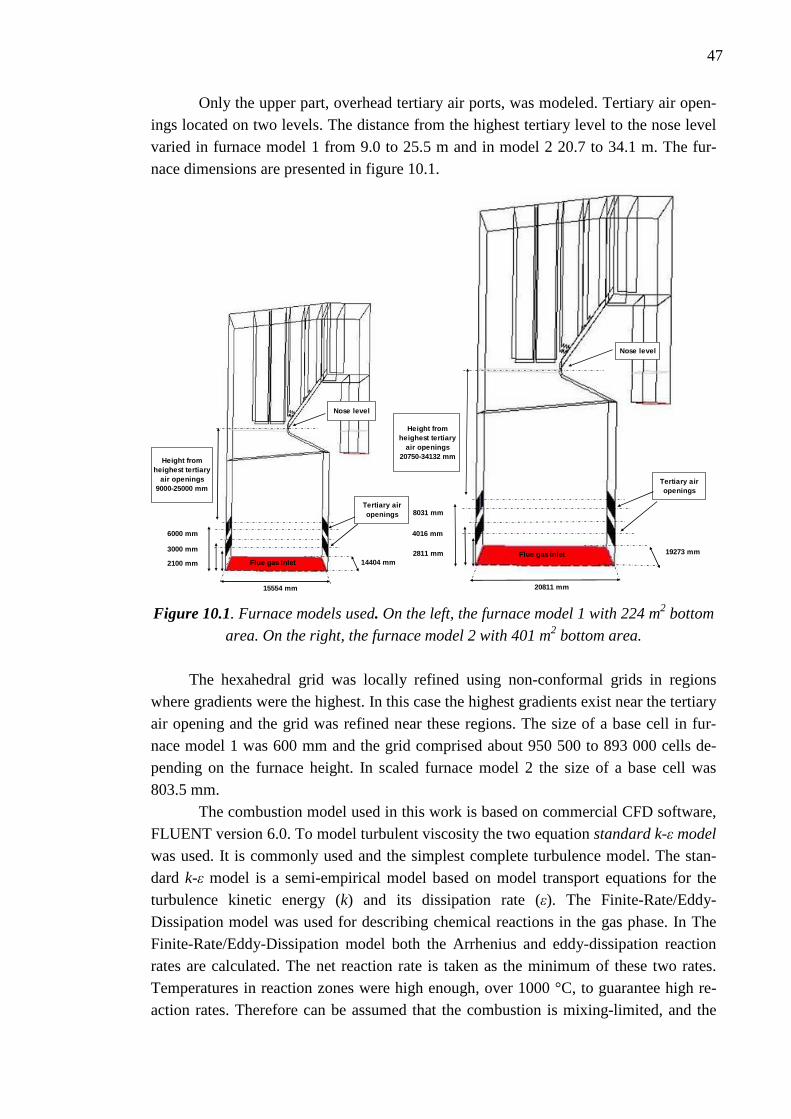
47
Only the upper part, overhead tertiary air ports, was modeled. Tertiary air open-ings located on two levels. The distance from the highest tertiary level to the nose level varied in furnace model 1 from 9.0 to 25.5 m and in model 2 20.7 to 34.1 m. The fur-nace dimensions are presented in figure 10.1.
15554 mm
14404 mm
Tertiary air openings
Nose level
Height from heighest tertiary
air openings9000-25000 mm
6000 mm
3000 mm
2100 mm Flue gas inlet
20811 mm
19273 mm
Tertiary air openings
Nose level
Height from heighest tertiary
air openings20750-34132 mm
8031 mm
4016 mm
2811 mm Flue gas inlet
Figure 10.1. Furnace models used. On the left, the furnace model 1 with 224 m2 bottom
area. On the right, the furnace model 2 with 401 m2 bottom area.
The hexahedral grid was locally refined using non-conformal grids in regions where gradients were the highest. In this case the highest gradients exist near the tertiary air opening and the grid was refined near these regions. The size of a base cell in fur-nace model 1 was 600 mm and the grid comprised about 950 500 to 893 000 cells de-pending on the furnace height. In scaled furnace model 2 the size of a base cell was 803.5 mm.
The combustion model used in this work is based on commercial CFD software, FLUENT version 6.0. To model turbulent viscosity the two equation standard k-ε model was used. It is commonly used and the simplest complete turbulence model. The stan-dard k-ε model is a semi-empirical model based on model transport equations for the turbulence kinetic energy (k) and its dissipation rate (ε). The Finite-Rate/Eddy-Dissipation model was used for describing chemical reactions in the gas phase. In The Finite-Rate/Eddy-Dissipation model both the Arrhenius and eddy-dissipation reaction rates are calculated. The net reaction rate is taken as the minimum of these two rates. Temperatures in reaction zones were high enough, over 1000 °C, to guarantee high re-action rates. Therefore can be assumed that the combustion is mixing-limited, and the
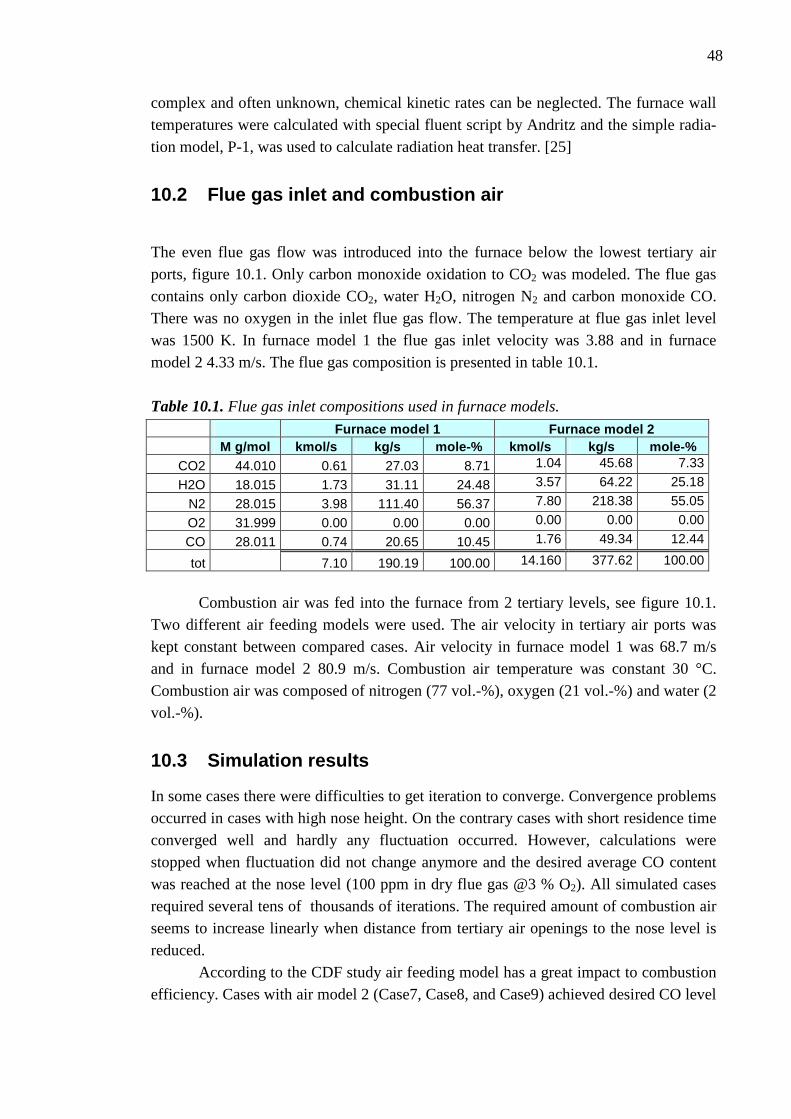
48
complex and often unknown, chemical kinetic rates can be neglected. The furnace wall temperatures were calculated with special fluent script by Andritz and the simple radia-tion model, P-1, was used to calculate radiation heat transfer. [25]
10.2 Flue gas inlet and combustion air
The even flue gas flow was introduced into the furnace below the lowest tertiary air ports, figure 10.1. Only carbon monoxide oxidation to CO2 was modeled. The flue gas contains only carbon dioxide CO2, water H2O, nitrogen N2 and carbon monoxide CO. There was no oxygen in the inlet flue gas flow. The temperature at flue gas inlet level was 1500 K. In furnace model 1 the flue gas inlet velocity was 3.88 and in furnace model 2 4.33 m/s. The flue gas composition is presented in table 10.1. Table 10.1. Flue gas inlet compositions used in furnace models.
Furnace model 1 Furnace model 2 M g/mol kmol/s kg/s mole-% kmol/s kg/s mole-%
CO2 44.010 0.61 27.03 8.71 1.04 45.68 7.33
H2O 18.015 1.73 31.11 24.48 3.57 64.22 25.18
N2 28.015 3.98 111.40 56.37 7.80 218.38 55.05
O2 31.999 0.00 0.00 0.00 0.00 0.00 0.00
CO 28.011 0.74 20.65 10.45 1.76 49.34 12.44
tot 7.10 190.19 100.00 14.160 377.62 100.00
Combustion air was fed into the furnace from 2 tertiary levels, see figure 10.1.
Two different air feeding models were used. The air velocity in tertiary air ports was kept constant between compared cases. Air velocity in furnace model 1 was 68.7 m/s and in furnace model 2 80.9 m/s. Combustion air temperature was constant 30 °C. Combustion air was composed of nitrogen (77 vol.-%), oxygen (21 vol.-%) and water (2 vol.-%).
10.3 Simulation results
In some cases there were difficulties to get iteration to converge. Convergence problems occurred in cases with high nose height. On the contrary cases with short residence time converged well and hardly any fluctuation occurred. However, calculations were stopped when fluctuation did not change anymore and the desired average CO content was reached at the nose level (100 ppm in dry flue gas @3 % O2). All simulated cases required several tens of thousands of iterations. The required amount of combustion air seems to increase linearly when distance from tertiary air openings to the nose level is reduced. According to the CDF study air feeding model has a great impact to combustion efficiency. Cases with air model 2 (Case7, Case8, and Case9) achieved desired CO level
49
with less amount of combustion air compare to cases with air model 1. In other words complete combustion was achieved with lower amount of excess air. This is because of the effective mixing of the air jets and unburned flue gas. The observation reinforces the idea how significant factor the mixing is when CO combustion is discussed.
The modeled cases are presented in table 10.4. The exact 100 ppm CO content at the nose level was very hard to achieve because of fluctuation. However, this inaccu-racy has no any significant impact to the results when correlation between residence time and flue gas oxygen content are discussed. Table 10.2. Modeled cases. Used furnace model, air feeding model, distance from high-
est tertiary ports to furnace nose level, required air flow, calculated dimensionless resi-
dence time, O2 and CO contents in dry flue gas at nose level.
Furnace model
Air port fingering
Dist. tert. to nose
[m]
Air flow [kg/s]
Dimen-sion-less residence
time
O2 (dry) at nose level
[mol-%]
CO (dry, 3% O2) [ppm]
Case1 1 Air model 1 25.5 72 1.6 2 105 Case2 1 Air model 1 23.5 85 1.6 3 97 Case3 1 Air model 1 21.5 95 1.3 4 110 Case5 1 Air model 1 17.5 114 1 5 102 Case6 1 Air model 1 15.5 118 1 5 99 Case7 1 Air model 2 25.5 66 1.6 1 104
Case8 1 Air model 2 15.5 70 1 2 98 Case9 1 Air model 2 9.0 72 0.6 2 97 Case10 2 Air model 1 20.7 247 1.3 6 112
Case11 2 Air model 1 34.1 140 2 2 113
Correlations between residence time (s) and oxygen content (mol-%, dry) are presented in figure 10.2. According to the figure 10.2, the desired CO level can be reached with considerably lower amounts of excess air by using air model 2, especially when short residence times are discussed. For example dimensionless residence time 1 requires approximately 3 times higher amount of excess oxygen to reach the desired 100 ppm CO content at the nose level if air model 1 is used.
The larger furnace model (furnace model 2) seems to require more excess air to reach the desired CO level compare to the furnace model 1 with same air feeding model. However, the furnace model 2 has larger base cell size compare to furnace model 1. This may cause some errors to the results.
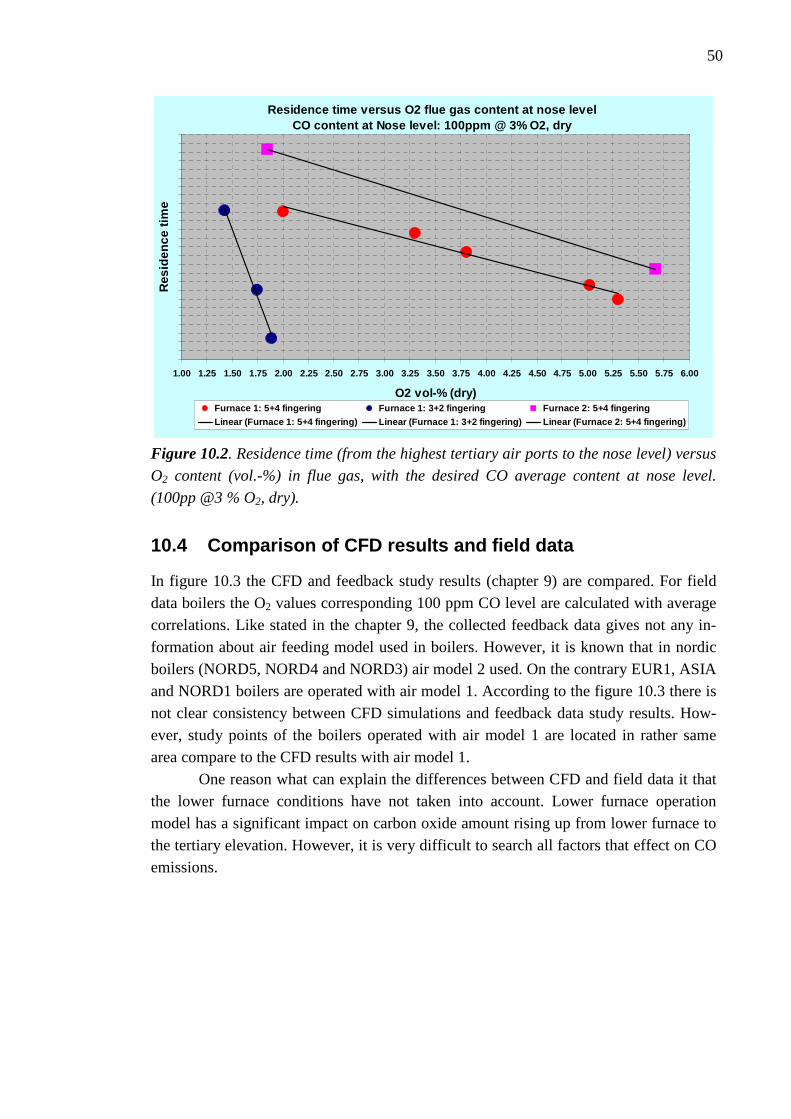
50
Residence time versus O2 flue gas content at nose l evelCO content at Nose level: 100ppm @ 3% O2, dry
1.00 1.25 1.50 1.75 2.00 2.25 2.50 2.75 3.00 3.25 3.50 3.75 4.00 4.25 4.50 4.75 5.00 5.25 5.50 5.75 6.00
O2 vol-% (dry)
Res
iden
ce ti
me
Furnace 1: 5+4 fingering Furnace 1: 3+2 fingering Furnace 2: 5+4 fingeringLinear (Furnace 1: 5+4 fingering) Linear (Furnace 1: 3+2 fingering) Linear (Furnace 2: 5+4 fingering)
Figure 10.2. Residence time (from the highest tertiary air ports to the nose level) versus
O2 content (vol.-%) in flue gas, with the desired CO average content at nose level.
(100pp @3 % O2, dry).
10.4 Comparison of CFD results and field data
In figure 10.3 the CFD and feedback study results (chapter 9) are compared. For field data boilers the O2 values corresponding 100 ppm CO level are calculated with average correlations. Like stated in the chapter 9, the collected feedback data gives not any in-formation about air feeding model used in boilers. However, it is known that in nordic boilers (NORD5, NORD4 and NORD3) air model 2 used. On the contrary EUR1, ASIA and NORD1 boilers are operated with air model 1. According to the figure 10.3 there is not clear consistency between CFD simulations and feedback data study results. How-ever, study points of the boilers operated with air model 1 are located in rather same area compare to the CFD results with air model 1. One reason what can explain the differences between CFD and field data it that the lower furnace conditions have not taken into account. Lower furnace operation model has a significant impact on carbon oxide amount rising up from lower furnace to the tertiary elevation. However, it is very difficult to search all factors that effect on CO emissions.
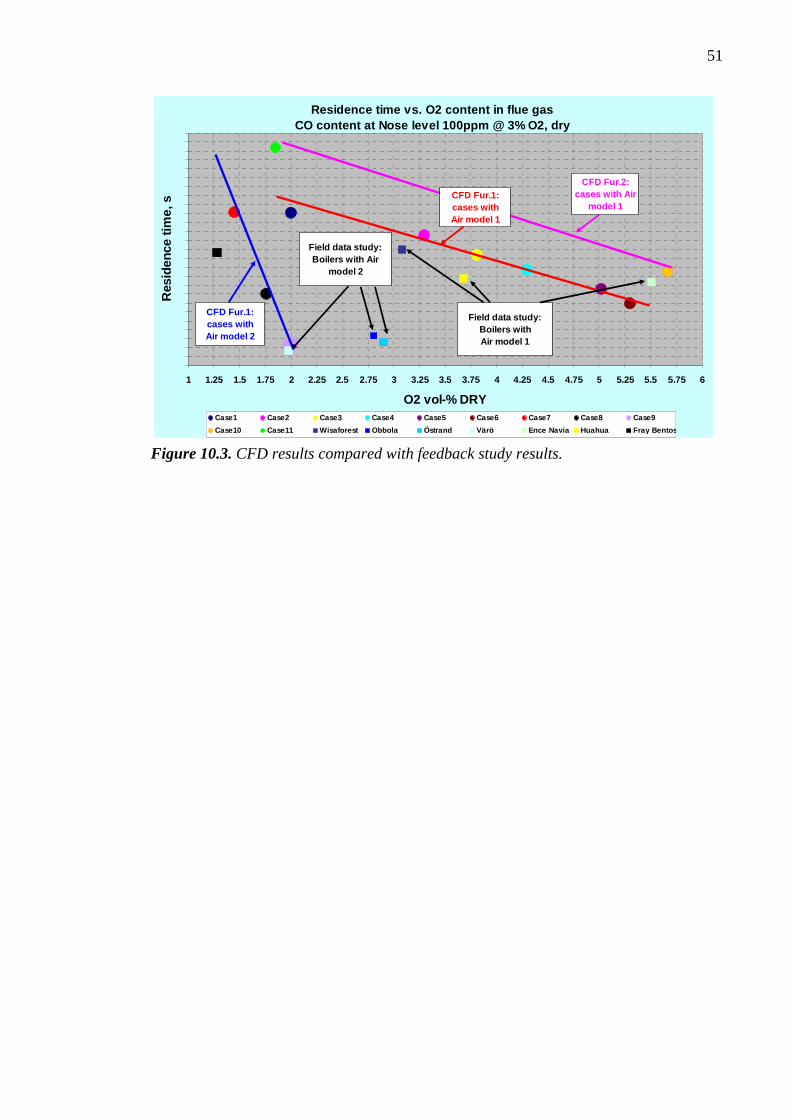
51
Residence time vs. O2 content in flue gasCO content at Nose level 100ppm @ 3% O2, dry
1 1.25 1.5 1.75 2 2.25 2.5 2.75 3 3.25 3.5 3.75 4 4.25 4.5 4.75 5 5.25 5.5 5.75 6
O2 vol-% DRY
Res
iden
ce ti
me,
s
Case1 Case2 Case3 Case4 Case5 Case6 Case7 Case8 Case9
Case10 Case11 Wisaforest Obbola Östrand Värö Ence Navia Huahua Fray Bentos
CFD Fur.1:cases withAir model 2
Field data study:Boilers with Air
model 2
Field data study:Boilers withAir model 1
CFD Fur.1:cases withAir model 1
CFD Fur.2:cases with Air
model 1
Figure 10.3. CFD results compared with feedback study results.
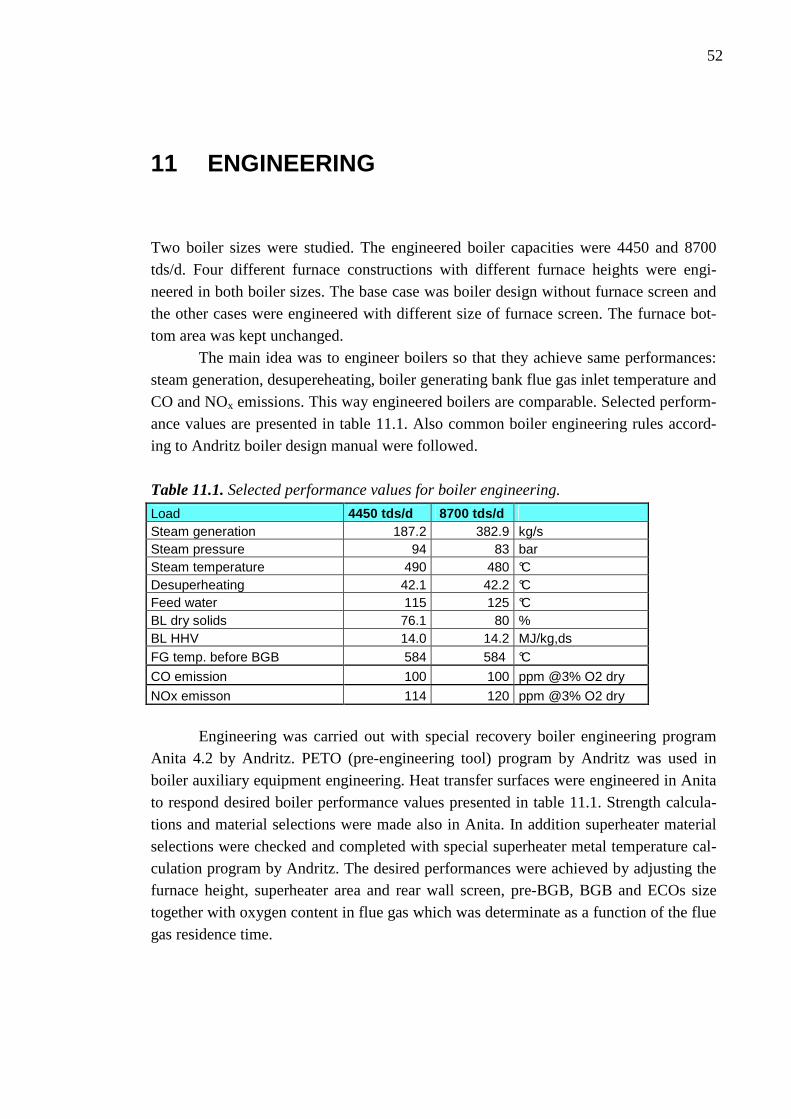
52
11 ENGINEERING
Two boiler sizes were studied. The engineered boiler capacities were 4450 and 8700 tds/d. Four different furnace constructions with different furnace heights were engi-neered in both boiler sizes. The base case was boiler design without furnace screen and the other cases were engineered with different size of furnace screen. The furnace bot-tom area was kept unchanged.
The main idea was to engineer boilers so that they achieve same performances: steam generation, desupereheating, boiler generating bank flue gas inlet temperature and CO and NOx emissions. This way engineered boilers are comparable. Selected perform-ance values are presented in table 11.1. Also common boiler engineering rules accord-ing to Andritz boiler design manual were followed.
Table 11.1. Selected performance values for boiler engineering.
Load 4450 tds/d 8700 tds/d Steam generation 187.2 382.9 kg/s Steam pressure 94 83 bar Steam temperature 490 480 °C Desuperheating 42.1 42.2 °C Feed water 115 125 °C BL dry solids 76.1 80 % BL HHV 14.0 14.2 MJ/kg,ds FG temp. before BGB 584 584 °C
CO emission 100 100 ppm @3% O2 dry
NOx emisson 114 120 ppm @3% O2 dry
Engineering was carried out with special recovery boiler engineering program Anita 4.2 by Andritz. PETO (pre-engineering tool) program by Andritz was used in boiler auxiliary equipment engineering. Heat transfer surfaces were engineered in Anita to respond desired boiler performance values presented in table 11.1. Strength calcula-tions and material selections were made also in Anita. In addition superheater material selections were checked and completed with special superheater metal temperature cal-culation program by Andritz. The desired performances were achieved by adjusting the furnace height, superheater area and rear wall screen, pre-BGB, BGB and ECOs size together with oxygen content in flue gas which was determinate as a function of the flue gas residence time.
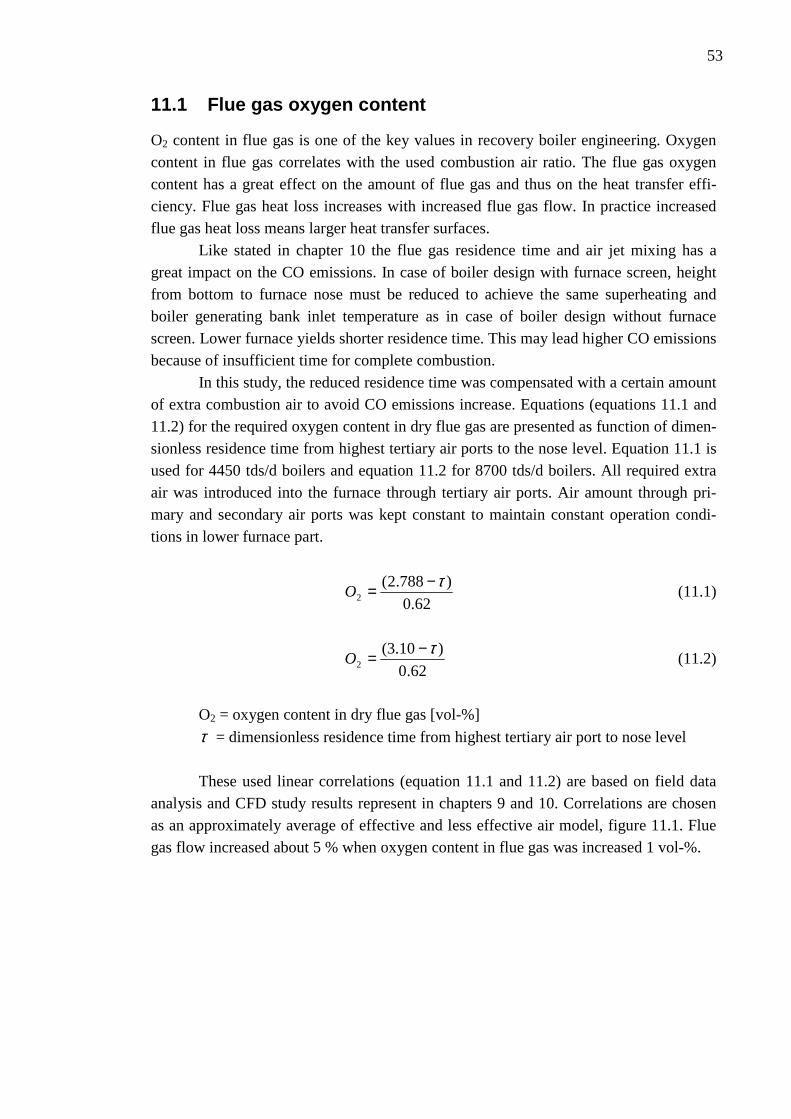
53
11.1 Flue gas oxygen content
O2 content in flue gas is one of the key values in recovery boiler engineering. Oxygen content in flue gas correlates with the used combustion air ratio. The flue gas oxygen content has a great effect on the amount of flue gas and thus on the heat transfer effi-ciency. Flue gas heat loss increases with increased flue gas flow. In practice increased flue gas heat loss means larger heat transfer surfaces.
Like stated in chapter 10 the flue gas residence time and air jet mixing has a great impact on the CO emissions. In case of boiler design with furnace screen, height from bottom to furnace nose must be reduced to achieve the same superheating and boiler generating bank inlet temperature as in case of boiler design without furnace screen. Lower furnace yields shorter residence time. This may lead higher CO emissions because of insufficient time for complete combustion.
In this study, the reduced residence time was compensated with a certain amount of extra combustion air to avoid CO emissions increase. Equations (equations 11.1 and 11.2) for the required oxygen content in dry flue gas are presented as function of dimen-sionless residence time from highest tertiary air ports to the nose level. Equation 11.1 is used for 4450 tds/d boilers and equation 11.2 for 8700 tds/d boilers. All required extra air was introduced into the furnace through tertiary air ports. Air amount through pri-mary and secondary air ports was kept constant to maintain constant operation condi-tions in lower furnace part.
62.0
)788.2(2
τ−=O (11.1)
62.0
)10.3(2
τ−=O (11.2)
O2 = oxygen content in dry flue gas [vol-%]
τ = dimensionless residence time from highest tertiary air port to nose level These used linear correlations (equation 11.1 and 11.2) are based on field data
analysis and CFD study results represent in chapters 9 and 10. Correlations are chosen as an approximately average of effective and less effective air model, figure 11.1. Flue gas flow increased about 5 % when oxygen content in flue gas was increased 1 vol-%.
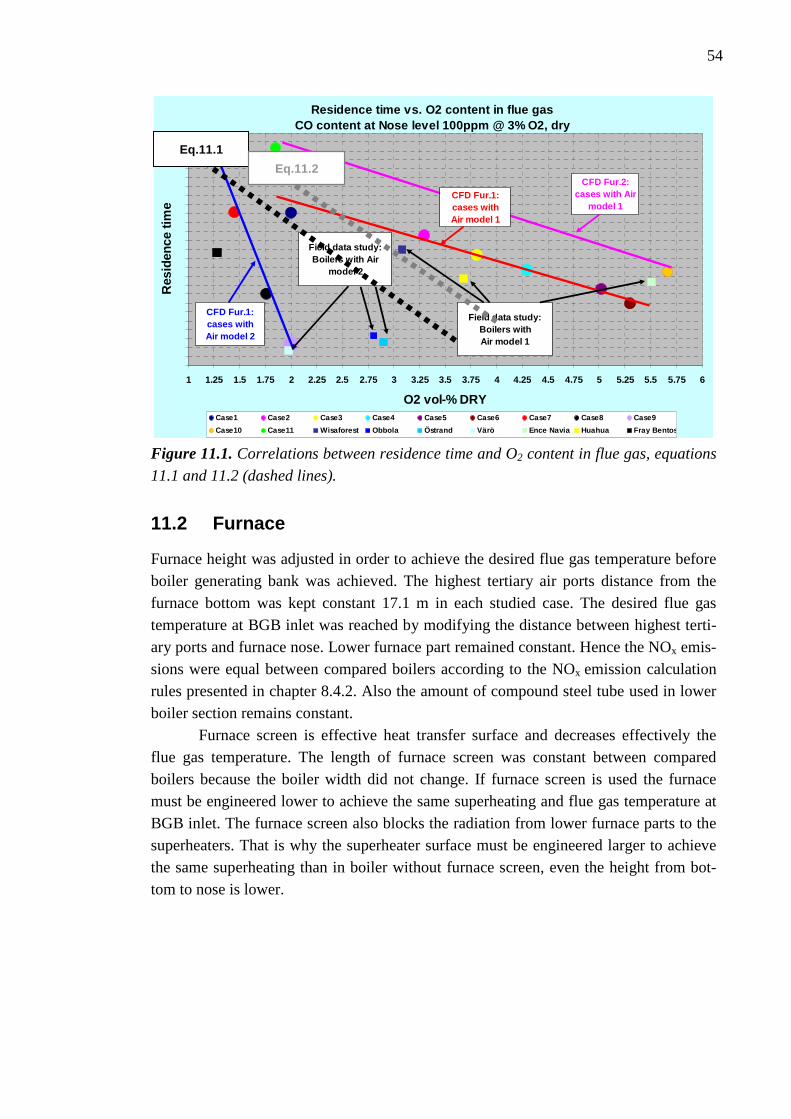
54
Residence time vs. O2 content in flue gasCO content at Nose level 100ppm @ 3% O2, dry
1 1.25 1.5 1.75 2 2.25 2.5 2.75 3 3.25 3.5 3.75 4 4.25 4.5 4.75 5 5.25 5.5 5.75 6
O2 vol-% DRY
Res
iden
ce ti
me
Case1 Case2 Case3 Case4 Case5 Case6 Case7 Case8 Case9
Case10 Case11 Wisaforest Obbola Östrand Värö Ence Navia Huahua Fray Bentos
CFD Fur.1:cases withAir model 2
Field data study:Boilers with Air
model 2
Field data study:Boilers withAir model 1
CFD Fur.1:cases withAir model 1
CFD Fur.2:cases with Air
model 1
Eq.11.1
Eq.11.2
Figure 11.1. Correlations between residence time and O2 content in flue gas, equations
11.1 and 11.2 (dashed lines).
11.2 Furnace
Furnace height was adjusted in order to achieve the desired flue gas temperature before boiler generating bank was achieved. The highest tertiary air ports distance from the furnace bottom was kept constant 17.1 m in each studied case. The desired flue gas temperature at BGB inlet was reached by modifying the distance between highest terti-ary ports and furnace nose. Lower furnace part remained constant. Hence the NOx emis-sions were equal between compared boilers according to the NOx emission calculation rules presented in chapter 8.4.2. Also the amount of compound steel tube used in lower boiler section remains constant. Furnace screen is effective heat transfer surface and decreases effectively the flue gas temperature. The length of furnace screen was constant between compared boilers because the boiler width did not change. If furnace screen is used the furnace must be engineered lower to achieve the same superheating and flue gas temperature at BGB inlet. The furnace screen also blocks the radiation from lower furnace parts to the superheaters. That is why the superheater surface must be engineered larger to achieve the same superheating than in boiler without furnace screen, even the height from bot-tom to nose is lower.
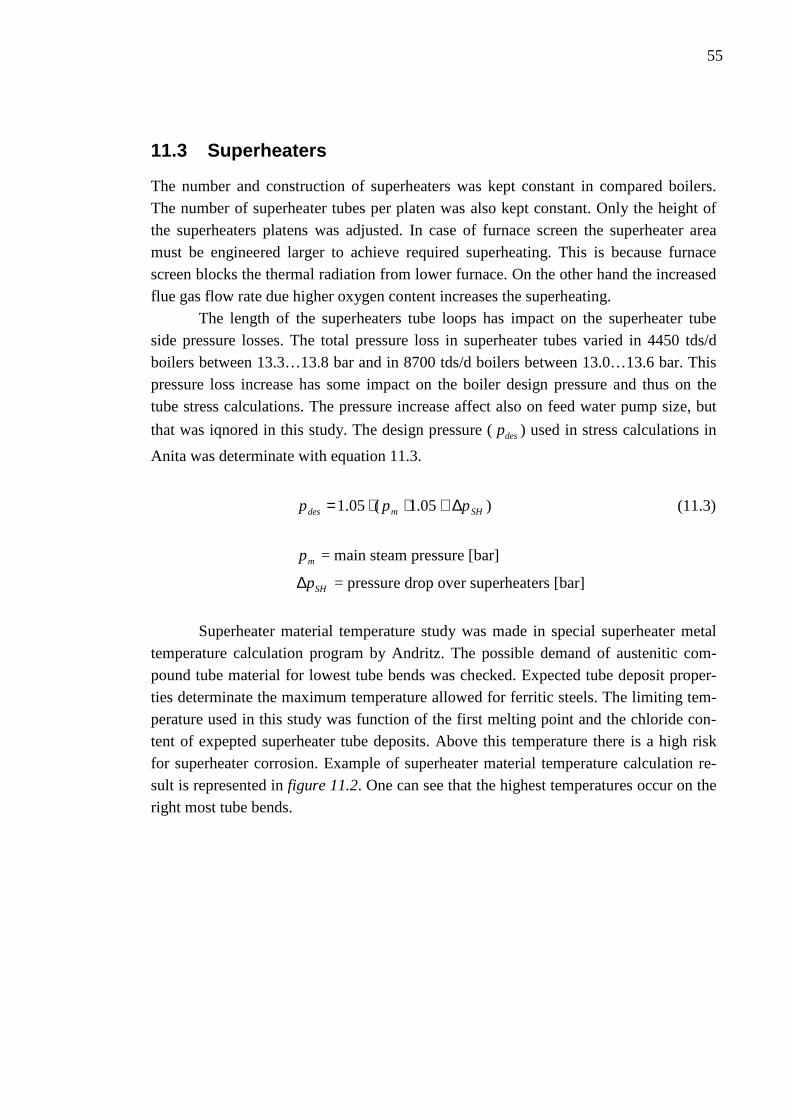
55
11.3 Superheaters
The number and construction of superheaters was kept constant in compared boilers. The number of superheater tubes per platen was also kept constant. Only the height of the superheaters platens was adjusted. In case of furnace screen the superheater area must be engineered larger to achieve required superheating. This is because furnace screen blocks the thermal radiation from lower furnace. On the other hand the increased flue gas flow rate due higher oxygen content increases the superheating. The length of the superheaters tube loops has impact on the superheater tube side pressure losses. The total pressure loss in superheater tubes varied in 4450 tds/d boilers between 13.3…13.8 bar and in 8700 tds/d boilers between 13.0…13.6 bar. This pressure loss increase has some impact on the boiler design pressure and thus on the tube stress calculations. The pressure increase affect also on feed water pump size, but
that was iqnored in this study. The design pressure ( desp ) used in stress calculations in
Anita was determinate with equation 11.3.
)05.1(05.1 SHmdes ppp ∆+⋅⋅= (11.3)
mp = main steam pressure [bar]
SHp∆ = pressure drop over superheaters [bar]
Superheater material temperature study was made in special superheater metal
temperature calculation program by Andritz. The possible demand of austenitic com-pound tube material for lowest tube bends was checked. Expected tube deposit proper-ties determinate the maximum temperature allowed for ferritic steels. The limiting tem-perature used in this study was function of the first melting point and the chloride con-tent of expepted superheater tube deposits. Above this temperature there is a high risk for superheater corrosion. Example of superheater material temperature calculation re-sult is represented in figure 11.2. One can see that the highest temperatures occur on the right most tube bends.
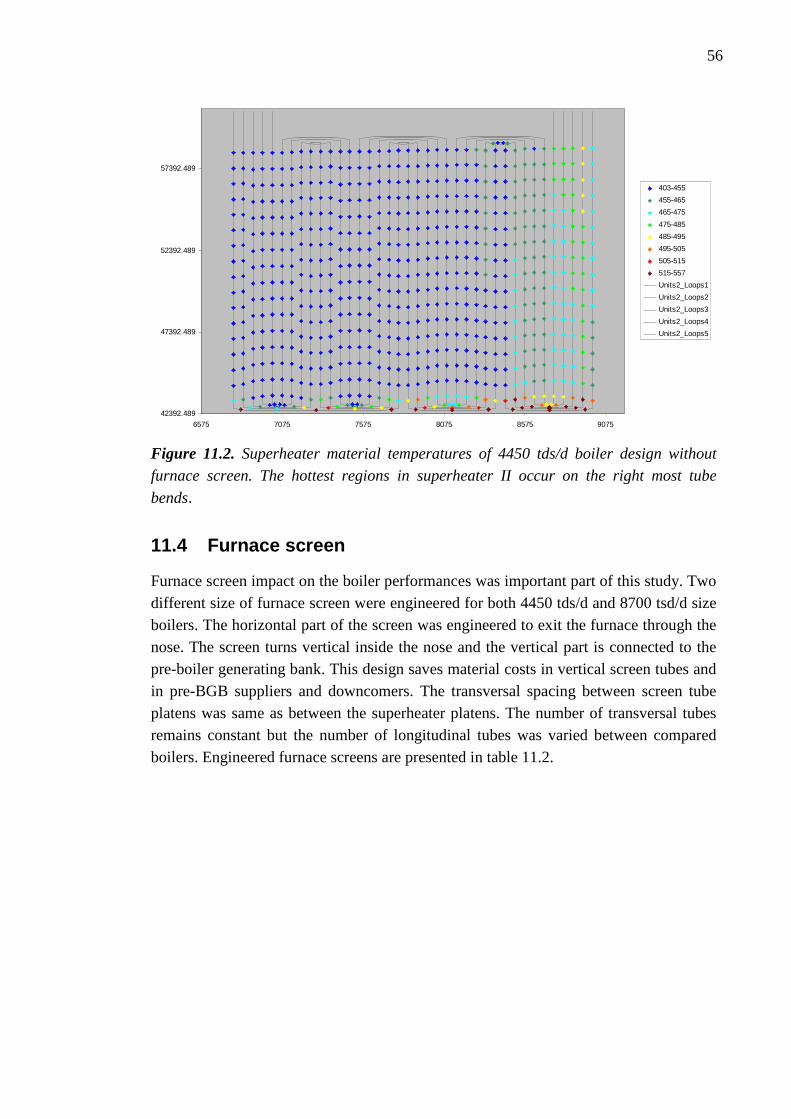
56
42392.489
47392.489
52392.489
57392.489
6575 7075 7575 8075 8575 9075
403-455
455-465
465-475
475-485
485-495
495-505
505-515
515-557
Units2_Loops1
Units2_Loops2
Units2_Loops3
Units2_Loops4
Units2_Loops5
Figure 11.2. Superheater material temperatures of 4450 tds/d boiler design without
furnace screen. The hottest regions in superheater II occur on the right most tube
bends.
11.4 Furnace screen
Furnace screen impact on the boiler performances was important part of this study. Two different size of furnace screen were engineered for both 4450 tds/d and 8700 tsd/d size boilers. The horizontal part of the screen was engineered to exit the furnace through the nose. The screen turns vertical inside the nose and the vertical part is connected to the pre-boiler generating bank. This design saves material costs in vertical screen tubes and in pre-BGB suppliers and downcomers. The transversal spacing between screen tube platens was same as between the superheater platens. The number of transversal tubes remains constant but the number of longitudinal tubes was varied between compared boilers. Engineered furnace screens are presented in table 11.2.
57
Table 11.2. Engineered furnace screens.
4450 tsd/d 450 screen tubes
900 screen tubes
Longitudinal tube pcs. 10 20 Transversal tube pcs. 45 45 Total tube pcs. 450 900 Transversal spacing 312 312
8700 tsd/d 660 screen tubes
1320 screen tubes
Longitudinal tube pcs. 10 20 Transversal tube pcs. 66 66 Total tube pcs. 660 1320 Transversal spacing 312 312
11.5 Pre-boiler generating bank
Pre-BGB platens consist of 20 tubes in every engineered case. Pre-BGB height was de-termined by the height of rear wall screen and superheaters. Pre-BGB has same trans-versal spacing than superheaters and rear wall screen. In case of furnace screen, the ver-tical part of the screen was connected to the pre-BGB tubes and pre-BGB tubes are part of the screen. In this case pre-BGB downcomers and supply pipes are omitted.
11.6 Boiler generating bank and economizers
BGB and economizers were engineered so that the desired steam generation was achieved. The number of platens was constant, but number of tubes per platens was var-ied. Other engineer argument was to keep flue gas velocities in BGB and ECOs as con-stant as possible between engineered cases. Hence the flue gas pressure loss and heat transfer efficiency as well as mechanical streght and fouling remained nearly constant between compared cases. In case of boilers with 20 longitudinal furnace screen tubes, economizers were engineered with tighter longitudinal spacing. This way the economizer dimensions and flue gas pressure losses could be kept in permitted limits with increased amount of flue gas. The other reason was that there must be enough space for process equipment be-tween ECOs and boiler building bottom elevation. The free space requirement between ECOs and floor was 17 m. However, this solution increased the amount of economizer tubes radically.
11.7 Auxiliary equipment
The studied auxiliary equipment was engineered to handle the desired flue gas and air flow. Electrostatic precipitator (ESP) size is determined by the flue gas flow rate and
58
dust content in flue gas. In this study the ESP design point was 80% MCR load and n-1 ESP chamber in use, where n is the amount of ESP chamber in use with normal opera-tion situation with 100 % MCR load. 4450 tds/d capacity boilers were engineered to operate with 3 chambers and 8700 tsd/d capacity boilers with 5 chambers. The desired dust content after ESP was 90 mg/m3n with 80 % MCR load and 50 mg/m3n with 100 % MCR load. Operating pressure at design point was -2000 Pa and with normal 100 % MCR load -4000 Pa.
One flue gas fan per ESP chamber was engineered. Flue gas fans design point was 80 % MCR load and one fan out of order. The flue gas pressure loss in the super-heaters, pre-BGB and flue gas duct was assumed to remain constant between compared cases. Pressure loss in BGB and ECOs was calculated for each case in Anita.
Tertiary air fan design point was the actual tertiary air flow plus 30 % design margin. Boilers were engineered to operate with one tertiary air fan. Primary and secon-dary air fans design remains constant because all the required excess air is introduced into the furnace through tertiary air ports.
11.8 Engineered boilers
Four different boilers were engineered in both boiler capacities. The base case was boiler without furnace screen. One boiler with 10 longitudinal screen tubes was engineered with the same O2 content in flue gas than base case. Two other boilers with furnace screens were engineered with O2 content according equations 11.1 and 11.2. The flue gas oxygen content used in engineering has a significant impact on BGB and ECOs size. Engineered boiler constructions are presented in table 11.3 and 11.4.
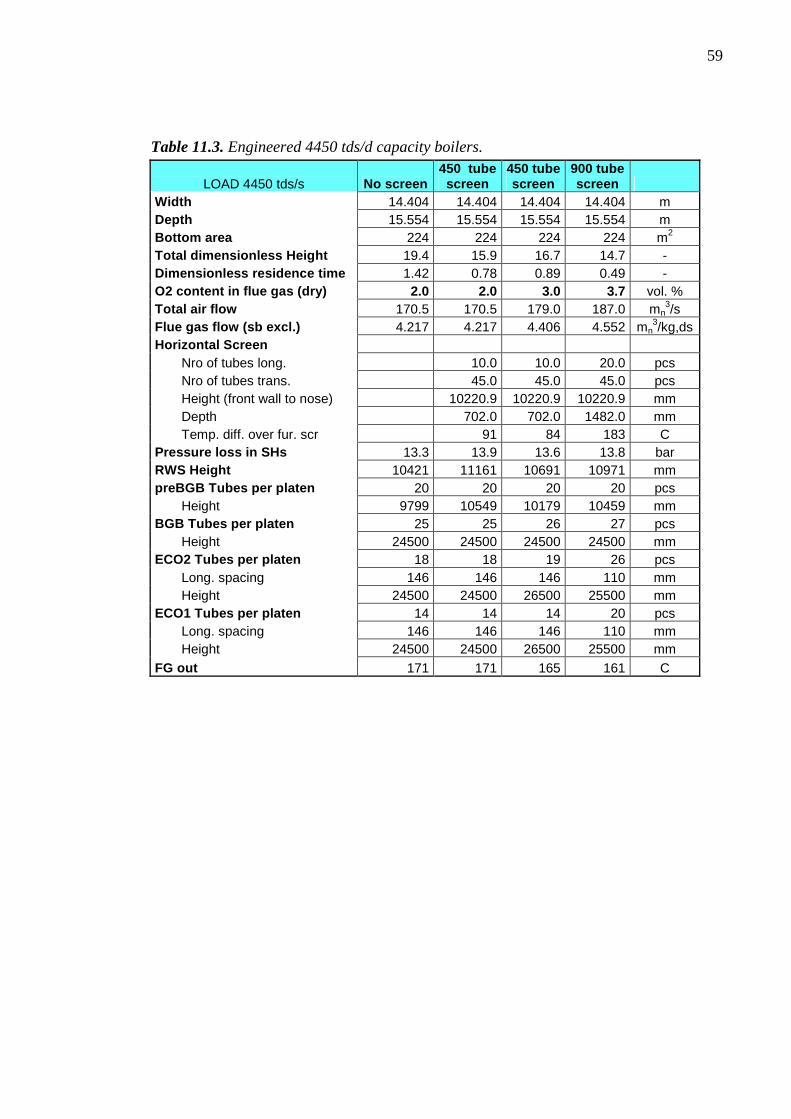
59
Table 11.3. Engineered 4450 tds/d capacity boilers.
LOAD 4450 tds/s No screen 450 tube
screen 450 tube screen
900 tube screen
Width 14.404 14.404 14.404 14.404 m Depth 15.554 15.554 15.554 15.554 m Bottom area 224 224 224 224 m2 Total dimensionless Height 19.4 15.9 16.7 14.7 - Dimensionless residence time 1.42 0.78 0.89 0.49 - O2 content in flue gas (dry) 2.0 2.0 3.0 3.7 vol. % Total air flow 170.5 170.5 179.0 187.0 mn
3/s Flue gas flow (sb excl.) 4.217 4.217 4.406 4.552 mn
3/kg,ds Horizontal Screen
Nro of tubes long. 10.0 10.0 20.0 pcs Nro of tubes trans. 45.0 45.0 45.0 pcs Height (front wall to nose) 10220.9 10220.9 10220.9 mm Depth 702.0 702.0 1482.0 mm Temp. diff. over fur. scr 91 84 183 C
Pressure loss in SHs 13.3 13.9 13.6 13.8 bar RWS Height 10421 11161 10691 10971 mm preBGB Tubes per platen 20 20 20 20 pcs
Height 9799 10549 10179 10459 mm BGB Tubes per platen 25 25 26 27 pcs
Height 24500 24500 24500 24500 mm ECO2 Tubes per platen 18 18 19 26 pcs
Long. spacing 146 146 146 110 mm Height 24500 24500 26500 25500 mm
ECO1 Tubes per platen 14 14 14 20 pcs Long. spacing 146 146 146 110 mm Height 24500 24500 26500 25500 mm
FG out 171 171 165 161 C
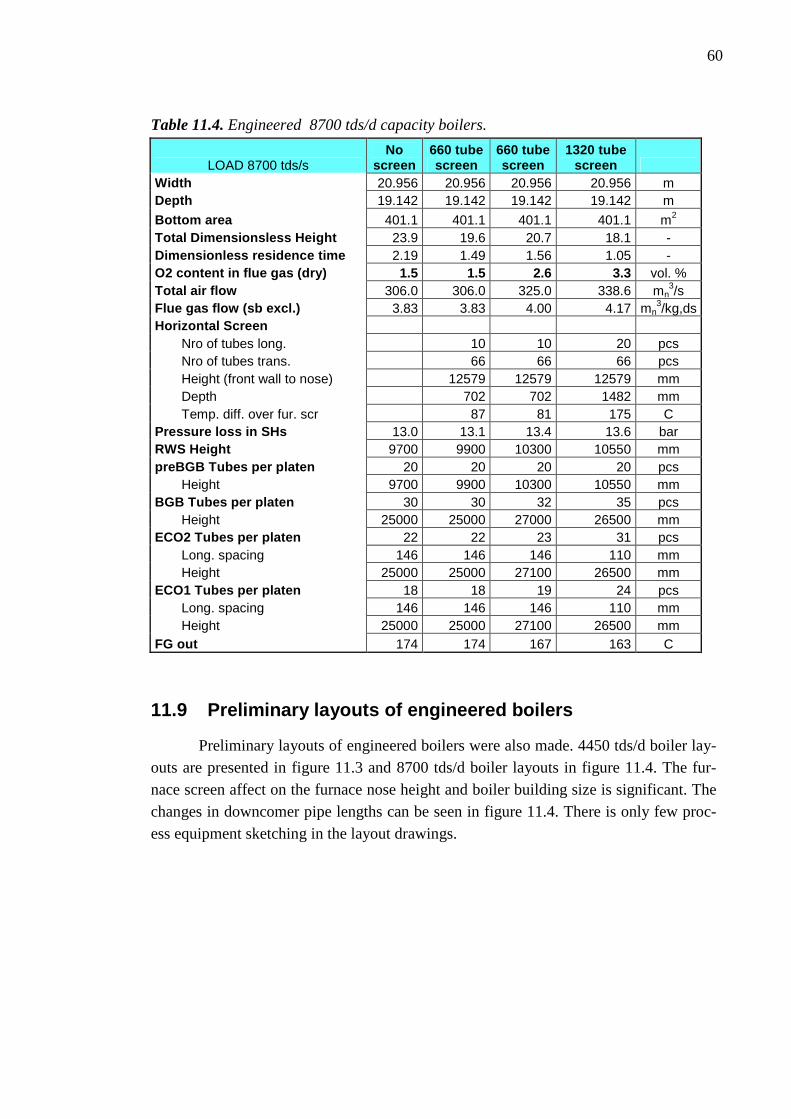
60
Table 11.4. Engineered 8700 tds/d capacity boilers.
LOAD 8700 tds/s No
screen 660 tube screen
660 tube screen
1320 tube screen
Width 20.956 20.956 20.956 20.956 m Depth 19.142 19.142 19.142 19.142 m
Bottom area 401.1 401.1 401.1 401.1 m2 Total Dimensionsless Height 23.9 19.6 20.7 18.1 - Dimensionless residence time 2.19 1.49 1.56 1.05 - O2 content in flue gas (dry) 1.5 1.5 2.6 3.3 vol. % Total air flow 306.0 306.0 325.0 338.6 mn
3/s Flue gas flow (sb excl.) 3.83 3.83 4.00 4.17 mn
3/kg,ds Horizontal Screen
Nro of tubes long. 10 10 20 pcs Nro of tubes trans. 66 66 66 pcs Height (front wall to nose) 12579 12579 12579 mm Depth 702 702 1482 mm Temp. diff. over fur. scr 87 81 175 C
Pressure loss in SHs 13.0 13.1 13.4 13.6 bar RWS Height 9700 9900 10300 10550 mm preBGB Tubes per platen 20 20 20 20 pcs
Height 9700 9900 10300 10550 mm BGB Tubes per platen 30 30 32 35 pcs
Height 25000 25000 27000 26500 mm ECO2 Tubes per platen 22 22 23 31 pcs
Long. spacing 146 146 146 110 mm Height 25000 25000 27100 26500 mm
ECO1 Tubes per platen 18 18 19 24 pcs Long. spacing 146 146 146 110 mm Height 25000 25000 27100 26500 mm
FG out 174 174 167 163 C
11.9 Preliminary layouts of engineered boilers
Preliminary layouts of engineered boilers were also made. 4450 tds/d boiler lay-outs are presented in figure 11.3 and 8700 tds/d boiler layouts in figure 11.4. The fur-nace screen affect on the furnace nose height and boiler building size is significant. The changes in downcomer pipe lengths can be seen in figure 11.4. There is only few proc-ess equipment sketching in the layout drawings.
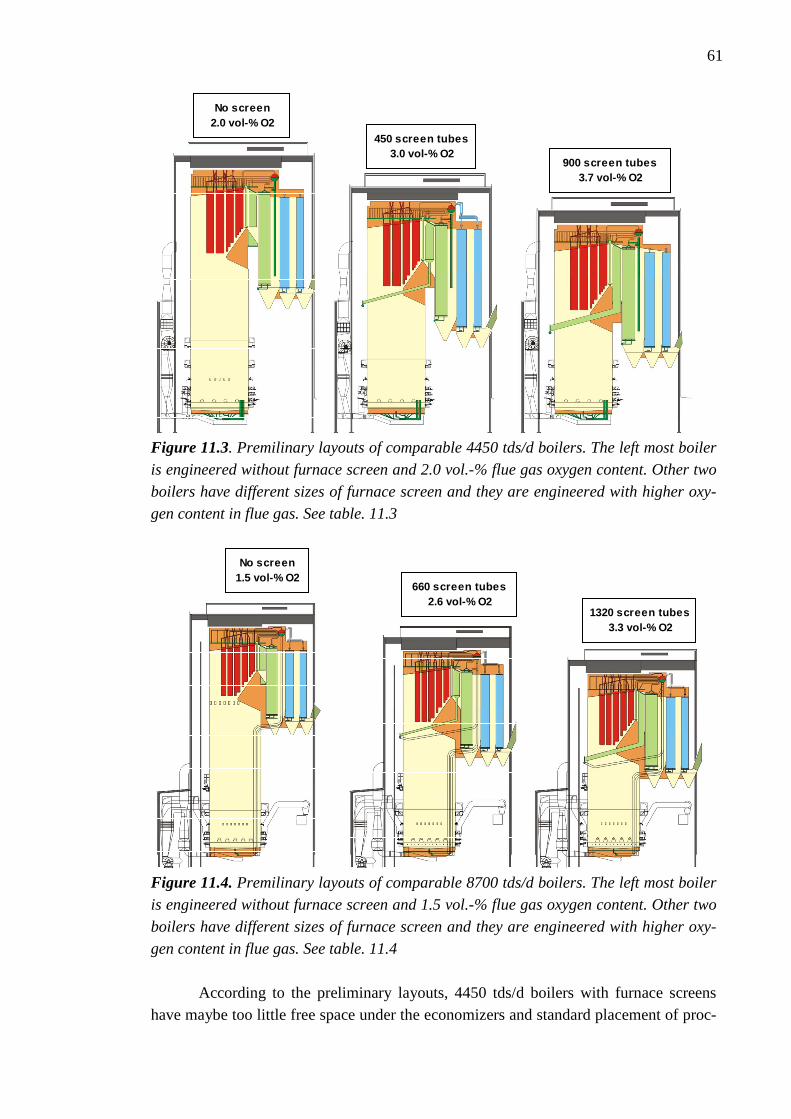
61
No screen2.0 vol-% O2
450 screen tubes3.0 vol-% O2
900 screen tubes3.7 vol-% O2
Figure 11.3. Premilinary layouts of comparable 4450 tds/d boilers. The left most boiler
is engineered without furnace screen and 2.0 vol.-% flue gas oxygen content. Other two
boilers have different sizes of furnace screen and they are engineered with higher oxy-
gen content in flue gas. See table. 11.3
No screen1.5 vol-% O2
660 screen tubes2.6 vol-% O2
1320 screen tubes3.3 vol-% O2
Figure 11.4. Premilinary layouts of comparable 8700 tds/d boilers. The left most boiler
is engineered without furnace screen and 1.5 vol.-% flue gas oxygen content. Other two
boilers have different sizes of furnace screen and they are engineered with higher oxy-
gen content in flue gas. See table. 11.4
According to the preliminary layouts, 4450 tds/d boilers with furnace screens
have maybe too little free space under the economizers and standard placement of proc-

62
ess equipment is not possible, figure 11.3. Problems may occur with secondary air fan and feed water tank placement. In addition the ash hopper of BGB limits the tertiary air level height. However, this design might be still viable. The right most boiler design, engineered with 900 furnace screen tubes, is not viable even the ECOs were engineered with tighter longitude spacing. The same problems occur in 8700 tds/d boiler size in case of larger furnace screen design. There is too little free space under the economiz-ers. [26]
63
12 PRICING CRITERIA
The main goal of this pricing study was to search how adding the furnace screen heat surface affects on the total cost of supplied boiler. All significant factors that effect on the price of the boiler when furnace height and flue gas flow are changed were studied. Boiler parts that remain equal between engineered cases were ignored. These kinds of parts are for example process piping and most auxiliary equipment. Height of the fur-nace has effect on the many pressure part dimensions. Pricing was divided to material, manufacturing and erection costs. However, pricing of the erection costs was challeng-ing because cost varies depending in which continent boiler is located. Studied boiler parts and pricing criteria are listed in appendix 3. The European average cost levels were used in this study. When recovery boiler is engineered with the furnace screen the furnace height can be engineered lower. That will cause some saving in furnace wall tubes, main down comers and boiler building costs. On the other hand, furnace screen tubes, screen head-ers and screen downcomers cause some costs. The amount of sootblowers was assumed to remain constant, also the possible changes in piping of sootblowers were ignored.
To keep CO emissions at the same level with reduced furnace height a certain amount of excess air was introduced into the boiler. The increased flue gas flow caused higher flue gas heat loss. Hence posterior heat transfer surfaces had to be engineered larger to keep the steam generation at the same level. This means higher boiler generat-ing bank and economizers costs. Also flue gas fan, air fan and ESP costs increase with the flue gas flow.
12.1 Pressure parts
Pressure parts include all the heat transfer surfaces in boiler. After dimensioning in Anita material data was sent to PETO program. In MTO (Material Take Out List), which is part of PETO the masses for different pressure parts was calculated automati-cally. These masses were used as a base of pricing. Material usages were collected into the pricing excel where different costs were calculated according to the pricing criteria presented in appendix 3.
The small change in tube wall thickness margin caused by design pressure in-crease was taken into account in pricing. The tube mass increase caused by wall thick-ness change was approximated with equation. 12.1.
64
++
=∆)(
)(*
2arg
1arg
desingm
desinm
pwtwt
pwtwtm (12.1)
*m∆ = relative tubes mass change [%]
wt = tube wall thickness [mm]
)( 1arg desinm pwt = tube wall thickness margin with pdes1 [mm]
)( 2arg desinm pwt = tube wall thickness margin with pdes2 [mm]
A modern recovery boiler furnace composes of three different tube materials,
see chapter 4.1. In this study, the tertiary air ports height was kept constant so the amounts compound tubes did not changed. Only the amount of carbon steel tube in up-per furnace part changed with the nose height. Furnace screen also consist of carbon steel tubes.
Main tube materials of superheaters were identical between compared cases. Only the amount of possible compound tube in lowest tube bends was varied. The demand of the compound bend tubes was determined with superheater metal temperature calcula-tion program.
12.2 High pressure piping
The significant changes in code piping lengths were taken into account in pricing. The changes in downcomer, supplier and riser costs were studied. Also the changes in fur-nace downcomers support costs were approximated. Main steam pipe length is also changing with the furnace height. Feed water pipe was assumed to remain the constant between the compared cases.
12.3 Boiler steel structures and plate works
Boiler suspension rod dimensions are changing with the mass distribution of boiler hanging weights. Suspension rod diameters and the number of the rods were calculated with the inhouse program by Andritz. Costs of buckstays to the furnace walls and boiler casing were calculated according to boiler layout dimensions.
The ash hopper areas are chancing with the dimensions of BGB and ECOs. The ash conveyor depth was decided to be constant 1 meter in every case. Also the flue gas passage depths in BGB and ECOs remain constant between cases. The equations and pricing criteria for the above structures are presented in appendix 3.
65
12.4 Auxiliary equipment and electrification
The increased flue gas and combustion air flow caused some changes to the auxiliary equipments. Cost changes in air and flue gas equipments were studied. When furnace height was decreased the desired extra air was introduced into the boiler through tertiary air ports. That caused changes to the tertiary air ducting and fan costs. Tertiary air ducts were dimensioned according to the tertiary air flow in order to reach the desired design velocity in duct was reached. This means increased material cost by increased cross section area. The length of the tertiary air ducts was assumed remain constant. Power consumption [kW] of fans was calculated with equation 12.2. [27] The pressure difference over the fan and the tertiary air flow are according to PETO. The material and motor costs of tertiary air fan were calculated as a function of fan power consumption, see appendix 3.
ηVp
P&⋅∆
= (12.2)
p∆ = pressure difference over fan [kPa]
V& = actual flow [m3/s]
η = fan and motor efficiency [-]
The flue gas ducting costs increase with the flue gas flow. Flue gas ducts cross
section areas was dimensioned thus the desired flue gas velocity in the duct was achieved. The lengths of the flue gas ducts were assumed remain constant between en-gineered boiler. This assumption may cost some errors to the pricing. The flue gas flows in the flue gas ducts are according to PETO. Size and power consumption of the flue gas fans increase with the flue gas flow. The power consumption of the flue gas fans was calculated with equation 12.2. Material and motor costs of the flue gas fans were calculated as a function of flue gas fan power consumption. Also the cabling and transformer costs of motors were taken into account. The equations derived during various cost studies carried out in Andritz are presented in appendix 3. Pricing of the electrostatic precipitators was challenging because EPS equipment are always purchased from ESP equipment suppliers. The ESP chamber size increases with amount of flue gas, due the required flue gas residence time and velocity limit in ESP chamber. ESP equipment price estimations were inquired from ESP supplier. The inquiry was made with two different actual flue gas flows. The pricing of ESP equip-ment was done according to linearly scaled equation 12.4 based on price estimations. The estimated price includes mechanical and electrical equipment.
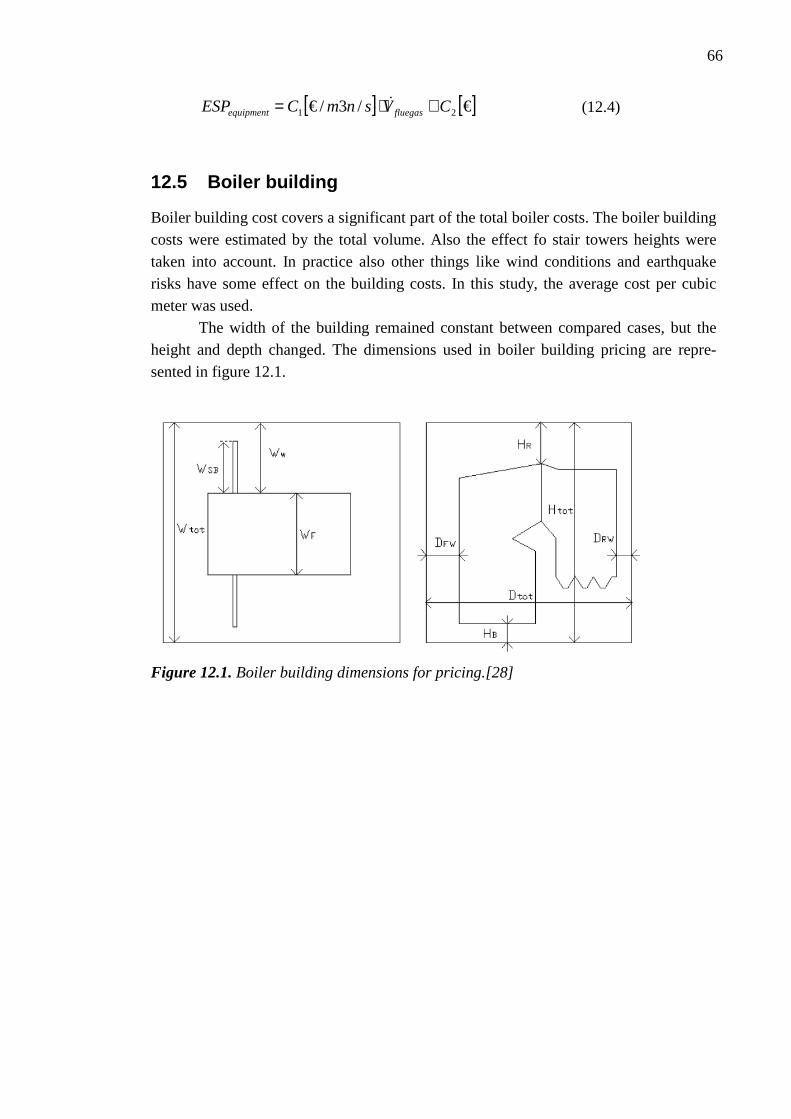
66
[ ] [ ]€/3/€ 21 CVsnmCESP fluegasequipment +⋅= & (12.4)
12.5 Boiler building
Boiler building cost covers a significant part of the total boiler costs. The boiler building costs were estimated by the total volume. Also the effect fo stair towers heights were taken into account. In practice also other things like wind conditions and earthquake risks have some effect on the building costs. In this study, the average cost per cubic meter was used.
The width of the building remained constant between compared cases, but the height and depth changed. The dimensions used in boiler building pricing are repre-sented in figure 12.1.
Figure 12.1. Boiler building dimensions for pricing.[28]
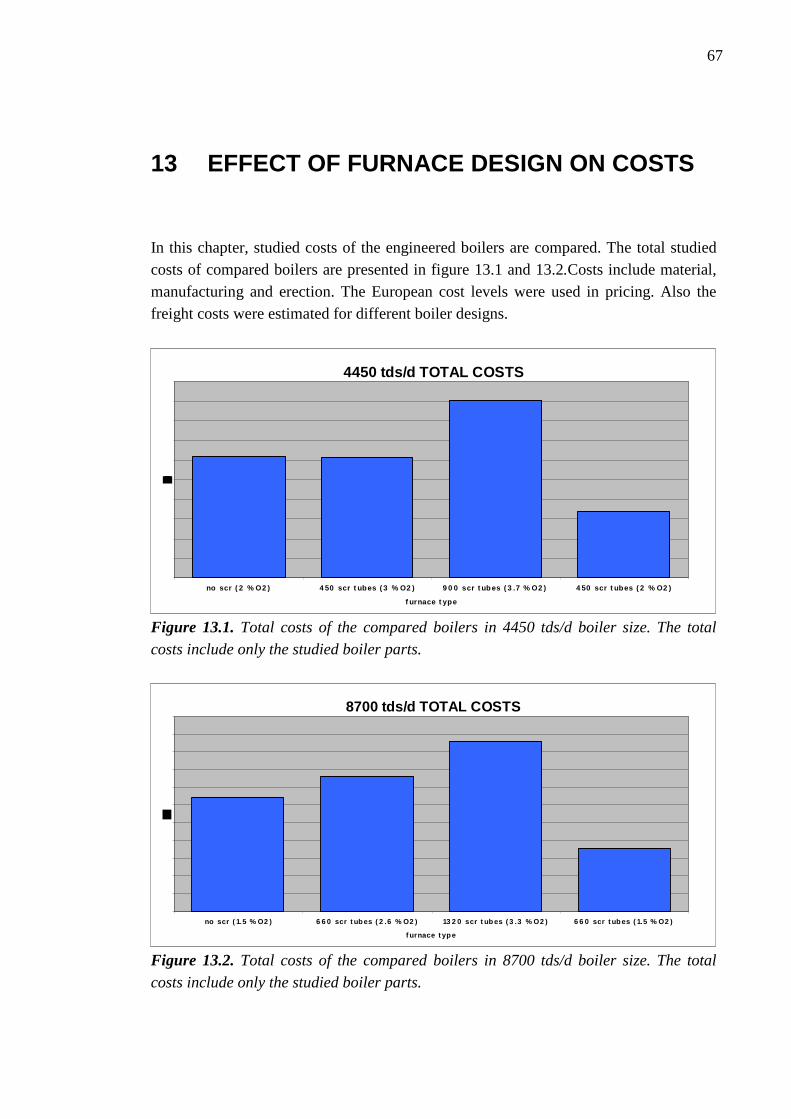
67
13 EFFECT OF FURNACE DESIGN ON COSTS
In this chapter, studied costs of the engineered boilers are compared. The total studied costs of compared boilers are presented in figure 13.1 and 13.2.Costs include material, manufacturing and erection. The European cost levels were used in pricing. Also the freight costs were estimated for different boiler designs.
4450 tds/d TOTAL COSTS
no scr ( 2 % O2 ) 4 50 scr t ubes ( 3 % O2 ) 9 0 0 scr t ub es ( 3 .7 % O2 ) 4 50 scr t ubes ( 2 % O2 )
f urnace t ype
Figure 13.1. Total costs of the compared boilers in 4450 tds/d boiler size. The total
costs include only the studied boiler parts.
8700 tds/d TOTAL COSTS
no scr ( 1.5 % O2 ) 6 6 0 scr t ub es ( 2 .6 % O2 ) 13 2 0 scr t ub es ( 3 .3 % O2 ) 6 6 0 scr t ub es ( 1.5 % O2 )
f urnace t yp e
Figure 13.2. Total costs of the compared boilers in 8700 tds/d boiler size. The total
costs include only the studied boiler parts.
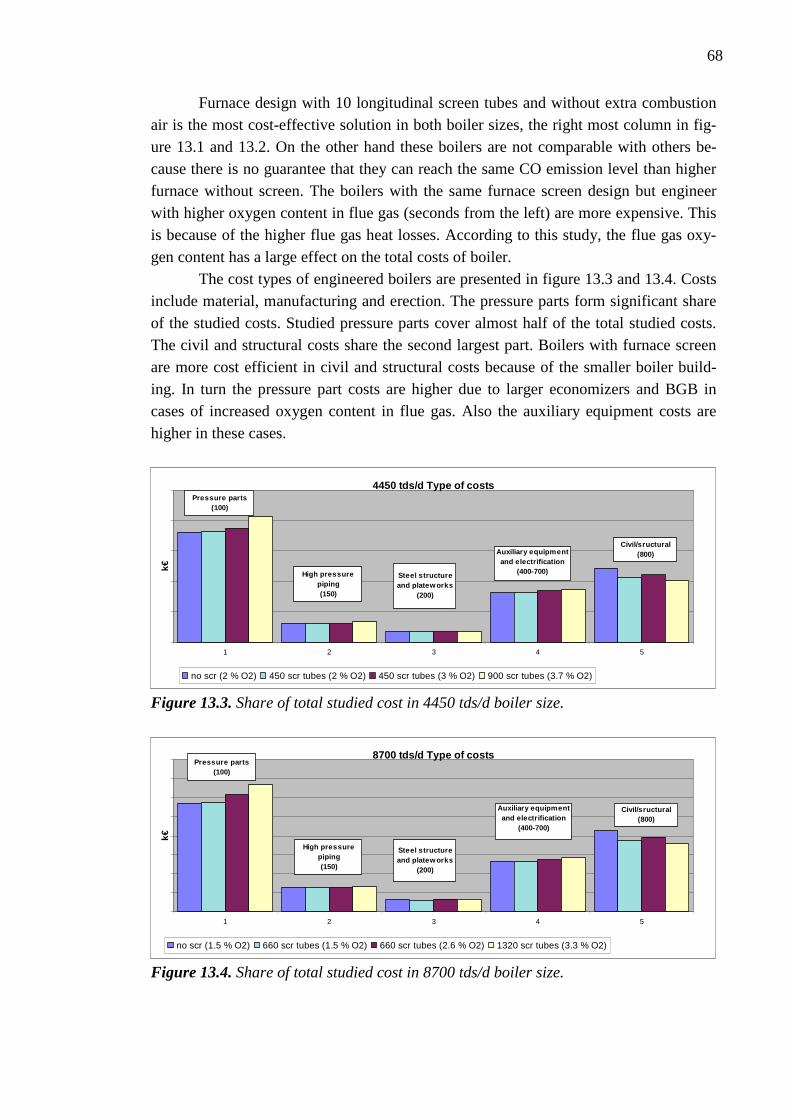
68
Furnace design with 10 longitudinal screen tubes and without extra combustion air is the most cost-effective solution in both boiler sizes, the right most column in fig-ure 13.1 and 13.2. On the other hand these boilers are not comparable with others be-cause there is no guarantee that they can reach the same CO emission level than higher furnace without screen. The boilers with the same furnace screen design but engineer with higher oxygen content in flue gas (seconds from the left) are more expensive. This is because of the higher flue gas heat losses. According to this study, the flue gas oxy-gen content has a large effect on the total costs of boiler. The cost types of engineered boilers are presented in figure 13.3 and 13.4. Costs include material, manufacturing and erection. The pressure parts form significant share of the studied costs. Studied pressure parts cover almost half of the total studied costs. The civil and structural costs share the second largest part. Boilers with furnace screen are more cost efficient in civil and structural costs because of the smaller boiler build-ing. In turn the pressure part costs are higher due to larger economizers and BGB in cases of increased oxygen content in flue gas. Also the auxiliary equipment costs are higher in these cases.
4450 tds/d Type of costs
1 2 3 4 5
k€
no scr (2 % O2) 450 scr tubes (2 % O2) 450 scr tubes (3 % O2) 900 scr tubes (3.7 % O2)
Pressure parts(100)
High pressure piping(150)
Steel structure and platew orks
(200)
Auxiliary equipment and electrification
(400-700)
Civil/sructural(800)
Figure 13.3. Share of total studied cost in 4450 tds/d boiler size.
8700 tds/d Type of costs
1 2 3 4 5
k€
no scr (1.5 % O2) 660 scr tubes (1.5 % O2) 660 scr tubes (2.6 % O2) 1320 scr tubes (3.3 % O2)
Pressure parts(100)
High pressure piping(150)
Steel structure and platew orks
(200)
Auxiliary equipment and electrification
(400-700)
Civil/sructural(800)
Figure 13.4. Share of total studied cost in 8700 tds/d boiler size.
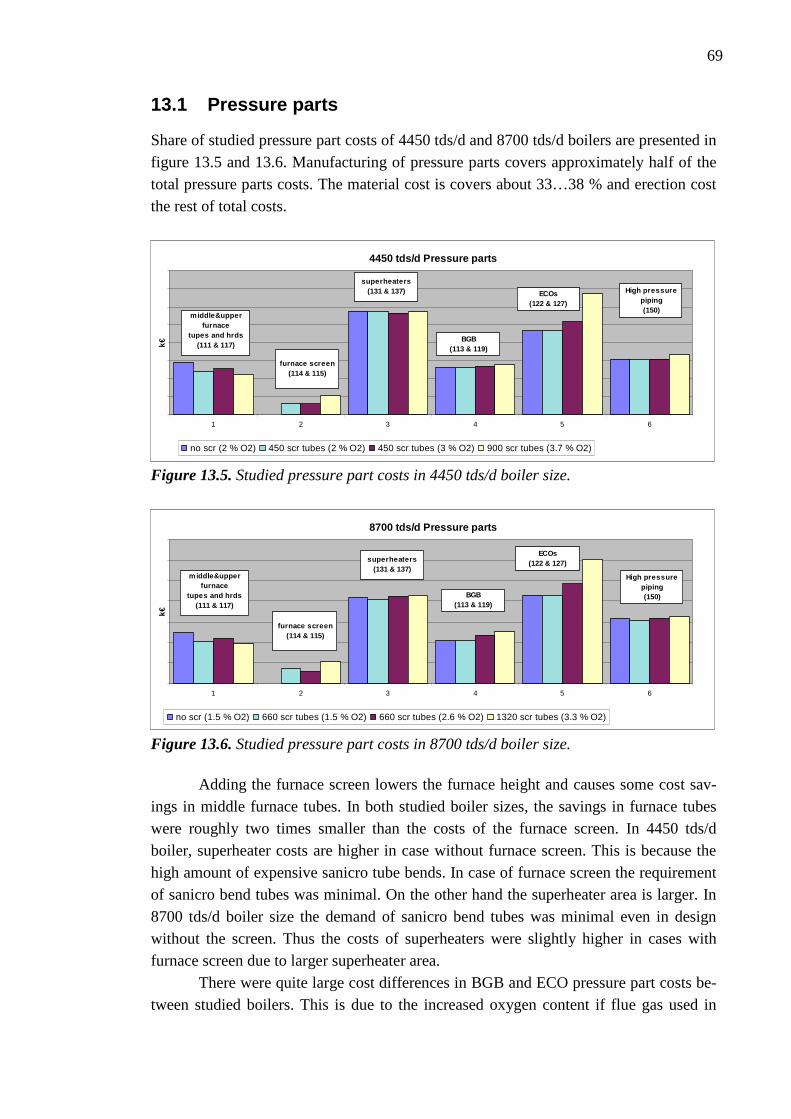
69
13.1 Pressure parts
Share of studied pressure part costs of 4450 tds/d and 8700 tds/d boilers are presented in figure 13.5 and 13.6. Manufacturing of pressure parts covers approximately half of the total pressure parts costs. The material cost is covers about 33…38 % and erection cost the rest of total costs.
4450 tds/d Pressure parts
1 2 3 4 5 6
k€
no scr (2 % O2) 450 scr tubes (2 % O2) 450 scr tubes (3 % O2) 900 scr tubes (3.7 % O2)
middle&upper furnace
tupes and hrds(111 & 117)
furnace screen(114 & 115)
superheaters(131 & 137)
BGB(113 & 119)
ECOs(122 & 127)
High pressure piping(150)
Figure 13.5. Studied pressure part costs in 4450 tds/d boiler size.
8700 tds/d Pressure parts
1 2 3 4 5 6
k€
no scr (1.5 % O2) 660 scr tubes (1.5 % O2) 660 scr tubes (2.6 % O2) 1320 scr tubes (3.3 % O2)
middle&upper furnace
tupes and hrds(111 & 117)
furnace screen(114 & 115)
superheaters(131 & 137)
BGB(113 & 119)
ECOs(122 & 127)
High pressure piping(150)
Figure 13.6. Studied pressure part costs in 8700 tds/d boiler size.
Adding the furnace screen lowers the furnace height and causes some cost sav-ings in middle furnace tubes. In both studied boiler sizes, the savings in furnace tubes were roughly two times smaller than the costs of the furnace screen. In 4450 tds/d boiler, superheater costs are higher in case without furnace screen. This is because the high amount of expensive sanicro tube bends. In case of furnace screen the requirement of sanicro bend tubes was minimal. On the other hand the superheater area is larger. In 8700 tds/d boiler size the demand of sanicro bend tubes was minimal even in design without the screen. Thus the costs of superheaters were slightly higher in cases with furnace screen due to larger superheater area.
There were quite large cost differences in BGB and ECO pressure part costs be-tween studied boilers. This is due to the increased oxygen content if flue gas used in
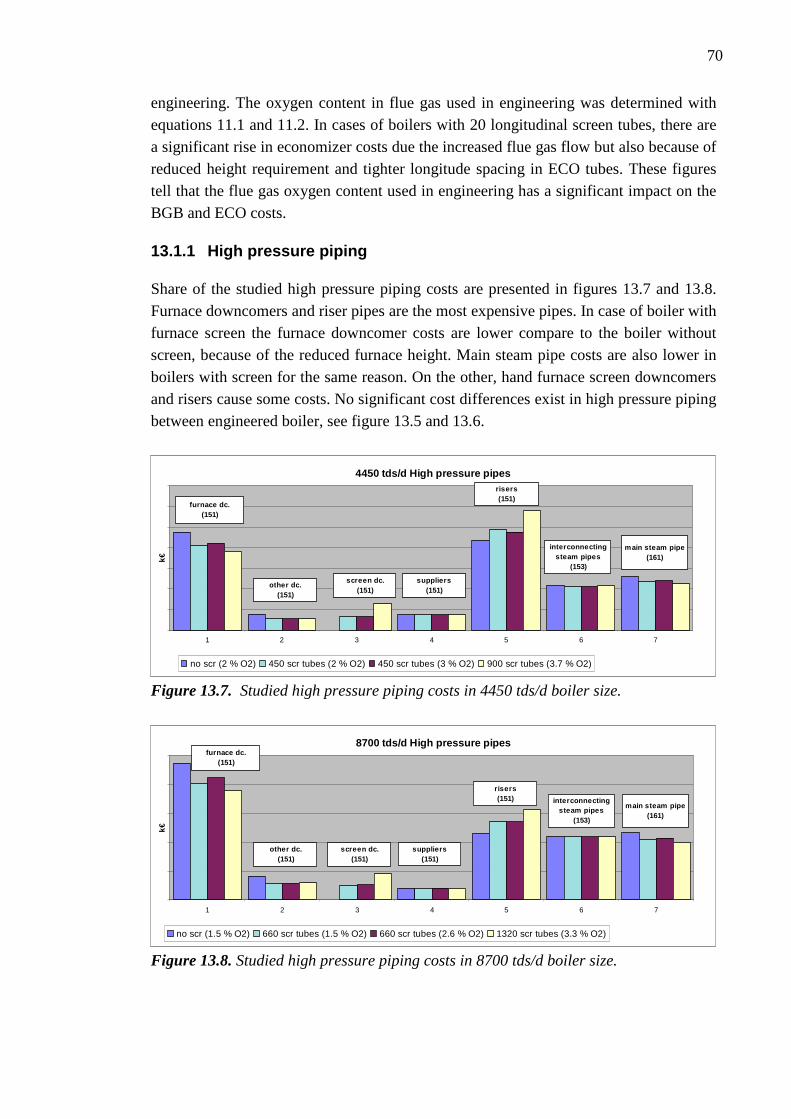
70
engineering. The oxygen content in flue gas used in engineering was determined with equations 11.1 and 11.2. In cases of boilers with 20 longitudinal screen tubes, there are a significant rise in economizer costs due the increased flue gas flow but also because of reduced height requirement and tighter longitude spacing in ECO tubes. These figures tell that the flue gas oxygen content used in engineering has a significant impact on the BGB and ECO costs.
13.1.1 High pressure piping
Share of the studied high pressure piping costs are presented in figures 13.7 and 13.8. Furnace downcomers and riser pipes are the most expensive pipes. In case of boiler with furnace screen the furnace downcomer costs are lower compare to the boiler without screen, because of the reduced furnace height. Main steam pipe costs are also lower in boilers with screen for the same reason. On the other, hand furnace screen downcomers and risers cause some costs. No significant cost differences exist in high pressure piping between engineered boiler, see figure 13.5 and 13.6.
4450 tds/d High pressure pipes
1 2 3 4 5 6 7
k€
no scr (2 % O2) 450 scr tubes (2 % O2) 450 scr tubes (3 % O2) 900 scr tubes (3.7 % O2)
furnace dc.(151)
other dc.(151)
screen dc.(151)
suppliers(151)
risers(151)
interconnecting steam pipes
(153)
main steam pipe(161)
Figure 13.7. Studied high pressure piping costs in 4450 tds/d boiler size.
8700 tds/d High pressure pipes
1 2 3 4 5 6 7
k€
no scr (1.5 % O2) 660 scr tubes (1.5 % O2) 660 scr tubes (2.6 % O2) 1320 scr tubes (3.3 % O2)
furnace dc.(151)
other dc.(151)
screen dc.(151)
suppliers(151)
risers(151) interconnecting
steam pipes(153)
main steam pipe(161)
Figure 13.8. Studied high pressure piping costs in 8700 tds/d boiler size.
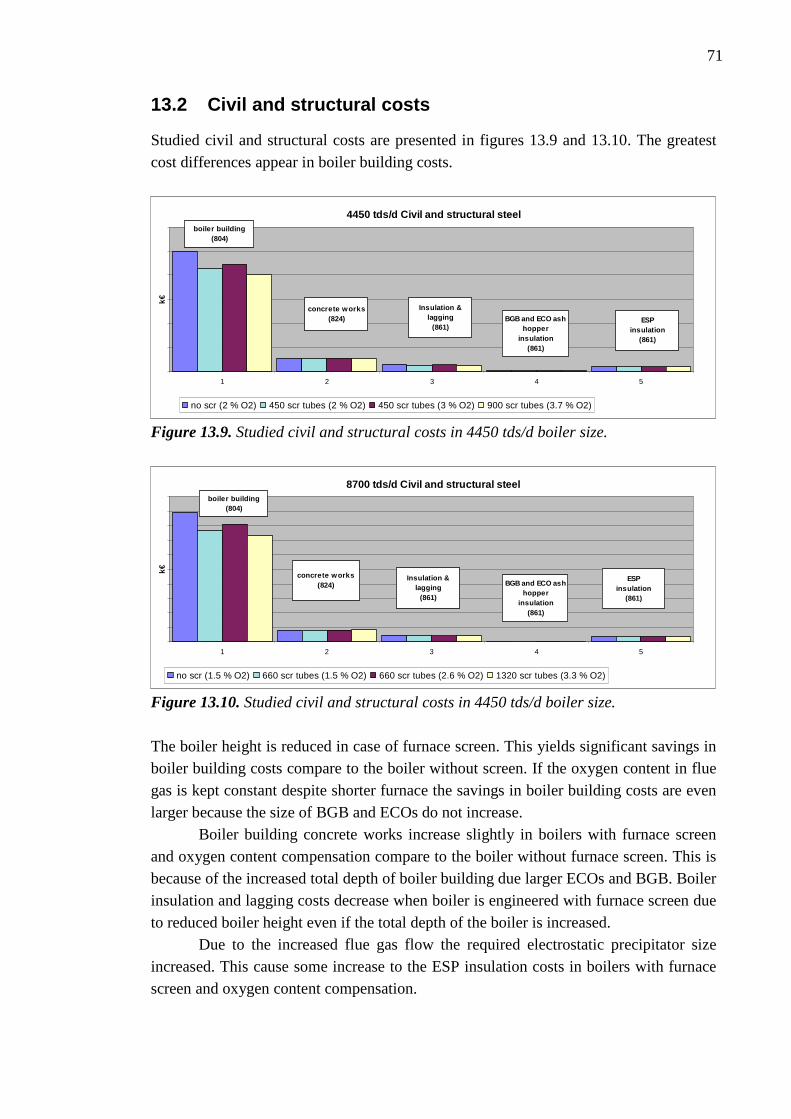
71
13.2 Civil and structural costs
Studied civil and structural costs are presented in figures 13.9 and 13.10. The greatest cost differences appear in boiler building costs.
4450 tds/d Civil and structural steel
1 2 3 4 5
k€
no scr (2 % O2) 450 scr tubes (2 % O2) 450 scr tubes (3 % O2) 900 scr tubes (3.7 % O2)
boiler building(804)
concrete works(824)
Insulation & lagging
(861)BGB and ECO ash
hopper insulation
(861)
ESPinsulation
(861)
Figure 13.9. Studied civil and structural costs in 4450 tds/d boiler size.
8700 tds/d Civil and structural steel
1 2 3 4 5
k€
no scr (1.5 % O2) 660 scr tubes (1.5 % O2) 660 scr tubes (2.6 % O2) 1320 scr tubes (3.3 % O2)
boiler building(804)
concrete works(824)
Insulation & lagging
(861)
BGB and ECO ash hopper
insulation(861)
ESPinsulation
(861)
Figure 13.10. Studied civil and structural costs in 4450 tds/d boiler size. The boiler height is reduced in case of furnace screen. This yields significant savings in boiler building costs compare to the boiler without screen. If the oxygen content in flue gas is kept constant despite shorter furnace the savings in boiler building costs are even larger because the size of BGB and ECOs do not increase. Boiler building concrete works increase slightly in boilers with furnace screen and oxygen content compensation compare to the boiler without furnace screen. This is because of the increased total depth of boiler building due larger ECOs and BGB. Boiler insulation and lagging costs decrease when boiler is engineered with furnace screen due to reduced boiler height even if the total depth of the boiler is increased. Due to the increased flue gas flow the required electrostatic precipitator size increased. This cause some increase to the ESP insulation costs in boilers with furnace screen and oxygen content compensation.
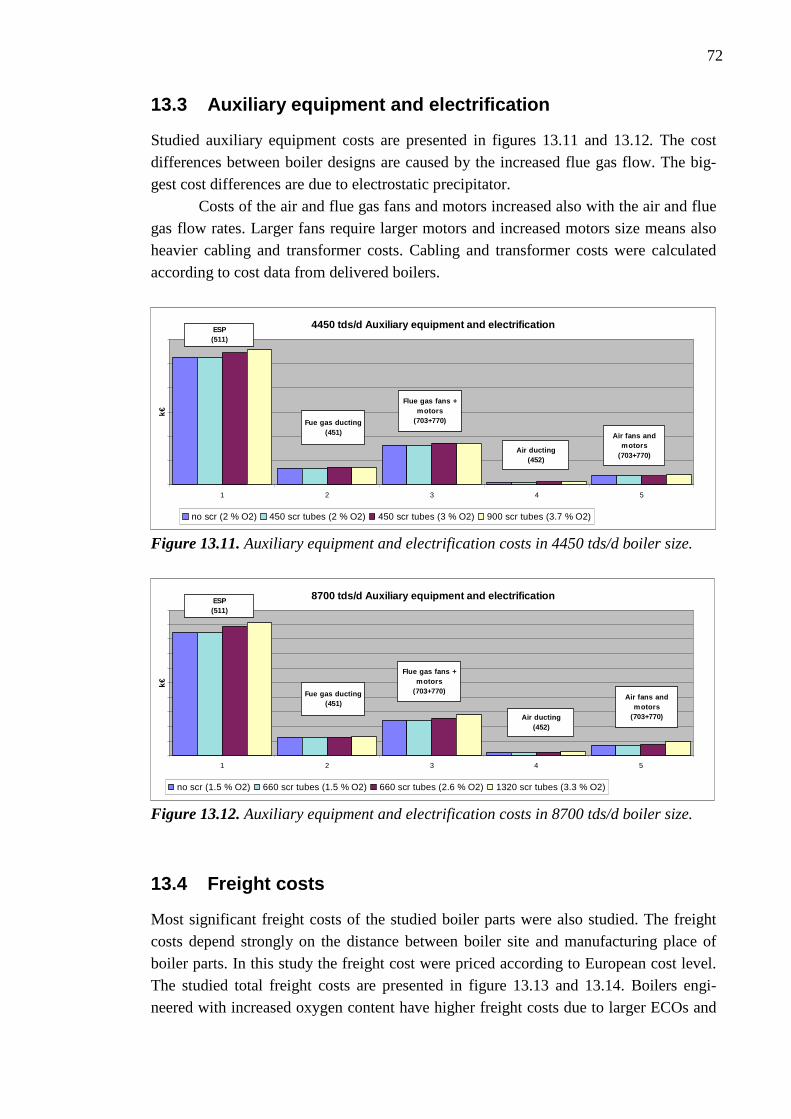
72
13.3 Auxiliary equipment and electrification
Studied auxiliary equipment costs are presented in figures 13.11 and 13.12. The cost differences between boiler designs are caused by the increased flue gas flow. The big-gest cost differences are due to electrostatic precipitator.
Costs of the air and flue gas fans and motors increased also with the air and flue gas flow rates. Larger fans require larger motors and increased motors size means also heavier cabling and transformer costs. Cabling and transformer costs were calculated according to cost data from delivered boilers.
4450 tds/d Auxiliary equipment and electrification
1 2 3 4 5
k€
no scr (2 % O2) 450 scr tubes (2 % O2) 450 scr tubes (3 % O2) 900 scr tubes (3.7 % O2)
ESP(511)
Fue gas ducting(451)
Flue gas fans + motors
(703+770)
Air ducting(452)
Air fans and motors
(703+770)
Figure 13.11. Auxiliary equipment and electrification costs in 4450 tds/d boiler size.
8700 tds/d Auxiliary equipment and electrification
1 2 3 4 5
k€
no scr (1.5 % O2) 660 scr tubes (1.5 % O2) 660 scr tubes (2.6 % O2) 1320 scr tubes (3.3 % O2)
ESP(511)
Fue gas ducting(451)
Flue gas fans + motors
(703+770)
Air ducting(452)
Air fans and motors
(703+770)
Figure 13.12. Auxiliary equipment and electrification costs in 8700 tds/d boiler size.
13.4 Freight costs
Most significant freight costs of the studied boiler parts were also studied. The freight costs depend strongly on the distance between boiler site and manufacturing place of boiler parts. In this study the freight cost were priced according to European cost level. The studied total freight costs are presented in figure 13.13 and 13.14. Boilers engi-neered with increased oxygen content have higher freight costs due to larger ECOs and
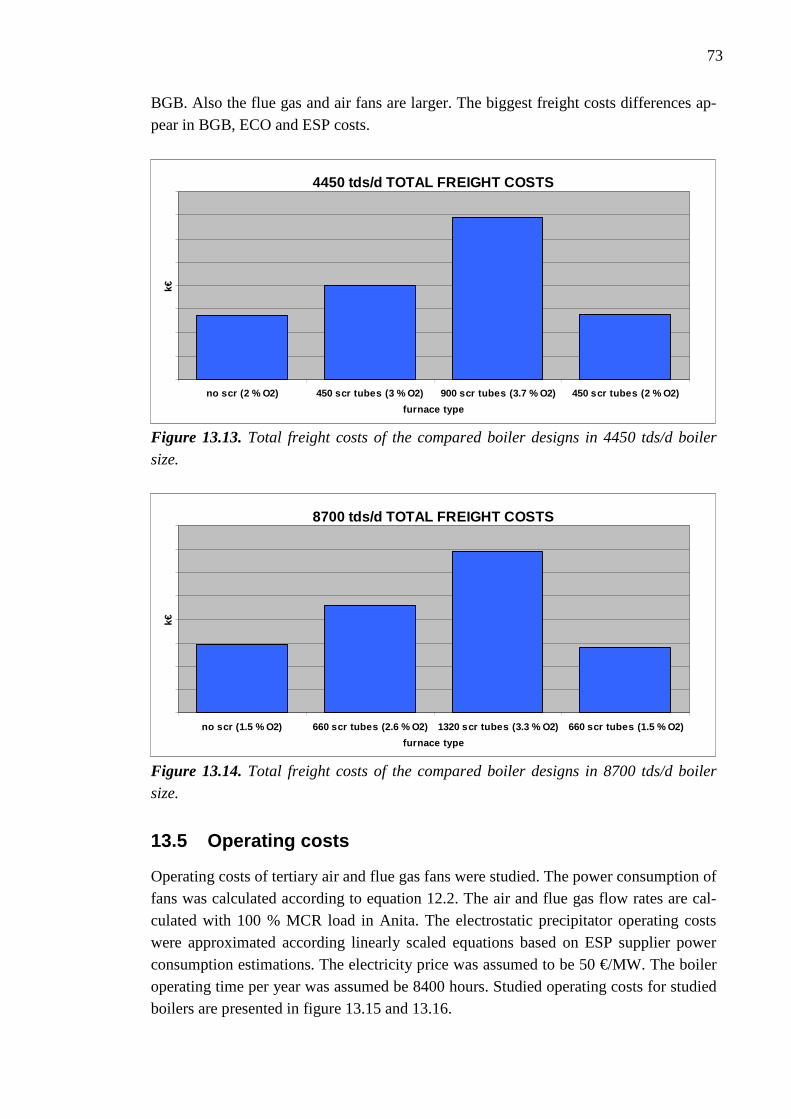
73
BGB. Also the flue gas and air fans are larger. The biggest freight costs differences ap-pear in BGB, ECO and ESP costs.
4450 tds/d TOTAL FREIGHT COSTS
no scr (2 % O2) 450 scr tubes (3 % O2) 900 scr tubes (3.7 % O2) 450 scr tubes (2 % O2)
furnace type
k€
Figure 13.13. Total freight costs of the compared boiler designs in 4450 tds/d boiler
size.
8700 tds/d TOTAL FREIGHT COSTS
no scr (1.5 % O2) 660 scr tubes (2.6 % O2) 1320 scr t ubes (3.3 % O2) 660 scr tubes (1.5 % O2)
furnace type
k€
Figure 13.14. Total freight costs of the compared boiler designs in 8700 tds/d boiler
size.
13.5 Operating costs
Operating costs of tertiary air and flue gas fans were studied. The power consumption of fans was calculated according to equation 12.2. The air and flue gas flow rates are cal-culated with 100 % MCR load in Anita. The electrostatic precipitator operating costs were approximated according linearly scaled equations based on ESP supplier power consumption estimations. The electricity price was assumed to be 50 €/MW. The boiler operating time per year was assumed be 8400 hours. Studied operating costs for studied boilers are presented in figure 13.15 and 13.16.
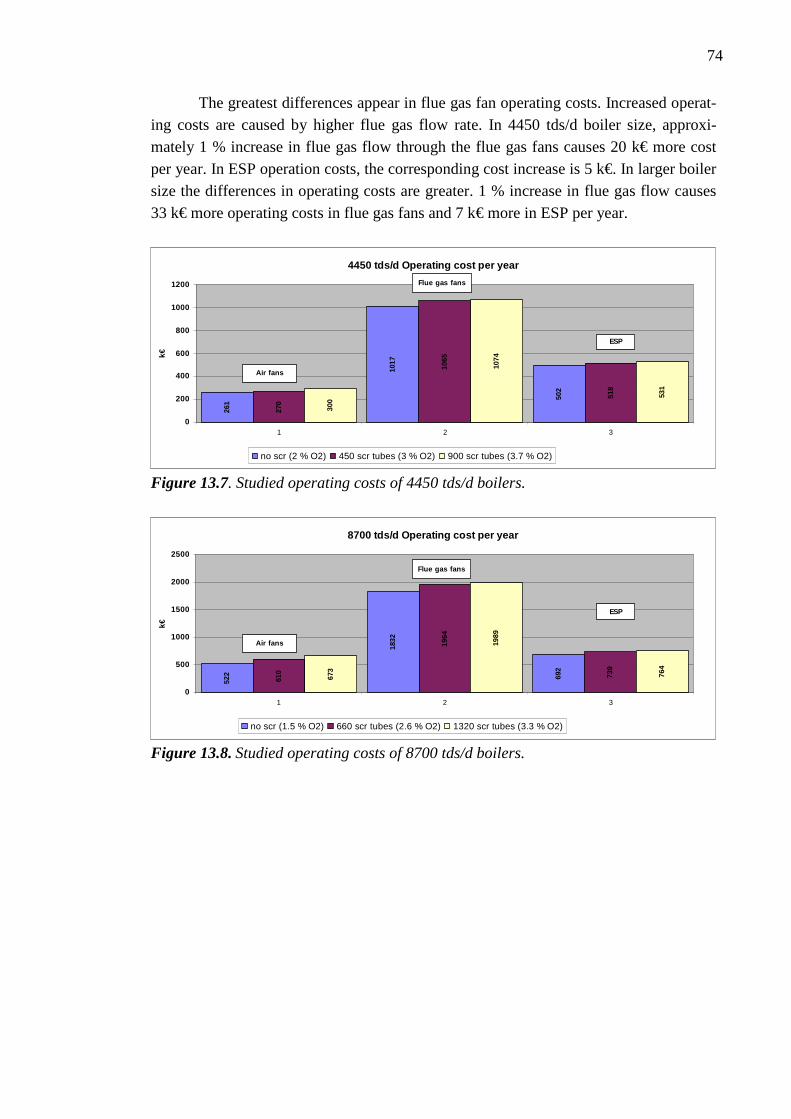
74
The greatest differences appear in flue gas fan operating costs. Increased operat-ing costs are caused by higher flue gas flow rate. In 4450 tds/d boiler size, approxi-mately 1 % increase in flue gas flow through the flue gas fans causes 20 k€ more cost per year. In ESP operation costs, the corresponding cost increase is 5 k€. In larger boiler size the differences in operating costs are greater. 1 % increase in flue gas flow causes 33 k€ more operating costs in flue gas fans and 7 k€ more in ESP per year.
4450 tds/d Operating cost per year
1017
502
261
1065
518
270
1074
531
300
0
200
400
600
800
1000
1200
1 2 3
k€
no scr (2 % O2) 450 scr tubes (3 % O2) 900 scr tubes (3.7 % O2)
Air fans
Flue gas fans
ESP
Figure 13.7. Studied operating costs of 4450 tds/d boilers.
8700 tds/d Operating cost per year
522 69
2
1832
610 739
1964
673
764
1989
0
500
1000
1500
2000
2500
1 2 3
k€
no scr (1.5 % O2) 660 scr tubes (2.6 % O2) 1320 scr tubes (3.3 % O2)
Air fans
Flue gas fans
ESP
Figure 13.8. Studied operating costs of 8700 tds/d boilers.
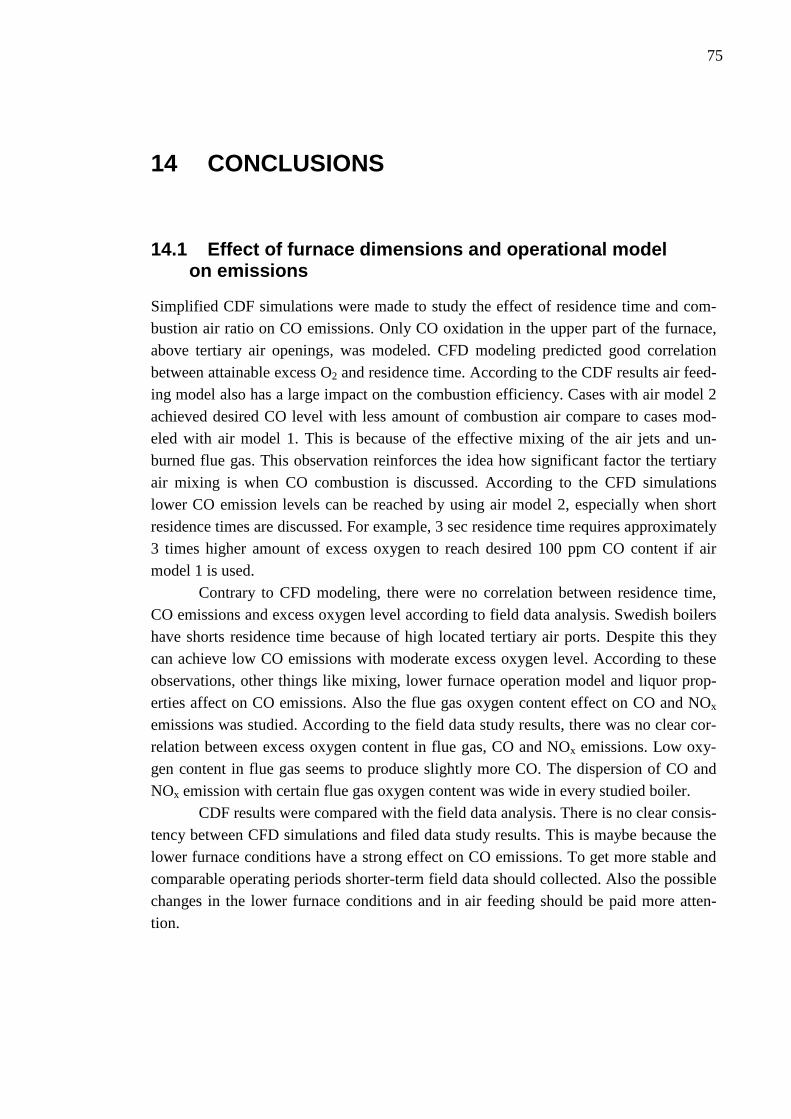
75
14 CONCLUSIONS
14.1 Effect of furnace dimensions and operational m odel on emissions
Simplified CDF simulations were made to study the effect of residence time and com-bustion air ratio on CO emissions. Only CO oxidation in the upper part of the furnace, above tertiary air openings, was modeled. CFD modeling predicted good correlation between attainable excess O2 and residence time. According to the CDF results air feed-ing model also has a large impact on the combustion efficiency. Cases with air model 2 achieved desired CO level with less amount of combustion air compare to cases mod-eled with air model 1. This is because of the effective mixing of the air jets and un-burned flue gas. This observation reinforces the idea how significant factor the tertiary air mixing is when CO combustion is discussed. According to the CFD simulations lower CO emission levels can be reached by using air model 2, especially when short residence times are discussed. For example, 3 sec residence time requires approximately 3 times higher amount of excess oxygen to reach desired 100 ppm CO content if air model 1 is used.
Contrary to CFD modeling, there were no correlation between residence time, CO emissions and excess oxygen level according to field data analysis. Swedish boilers have shorts residence time because of high located tertiary air ports. Despite this they can achieve low CO emissions with moderate excess oxygen level. According to these observations, other things like mixing, lower furnace operation model and liquor prop-erties affect on CO emissions. Also the flue gas oxygen content effect on CO and NOx emissions was studied. According to the field data study results, there was no clear cor-relation between excess oxygen content in flue gas, CO and NOx emissions. Low oxy-gen content in flue gas seems to produce slightly more CO. The dispersion of CO and NOx emission with certain flue gas oxygen content was wide in every studied boiler.
CDF results were compared with the field data analysis. There is no clear consis-tency between CFD simulations and filed data study results. This is maybe because the lower furnace conditions have a strong effect on CO emissions. To get more stable and comparable operating periods shorter-term field data should collected. Also the possible changes in the lower furnace conditions and in air feeding should be paid more atten-tion.
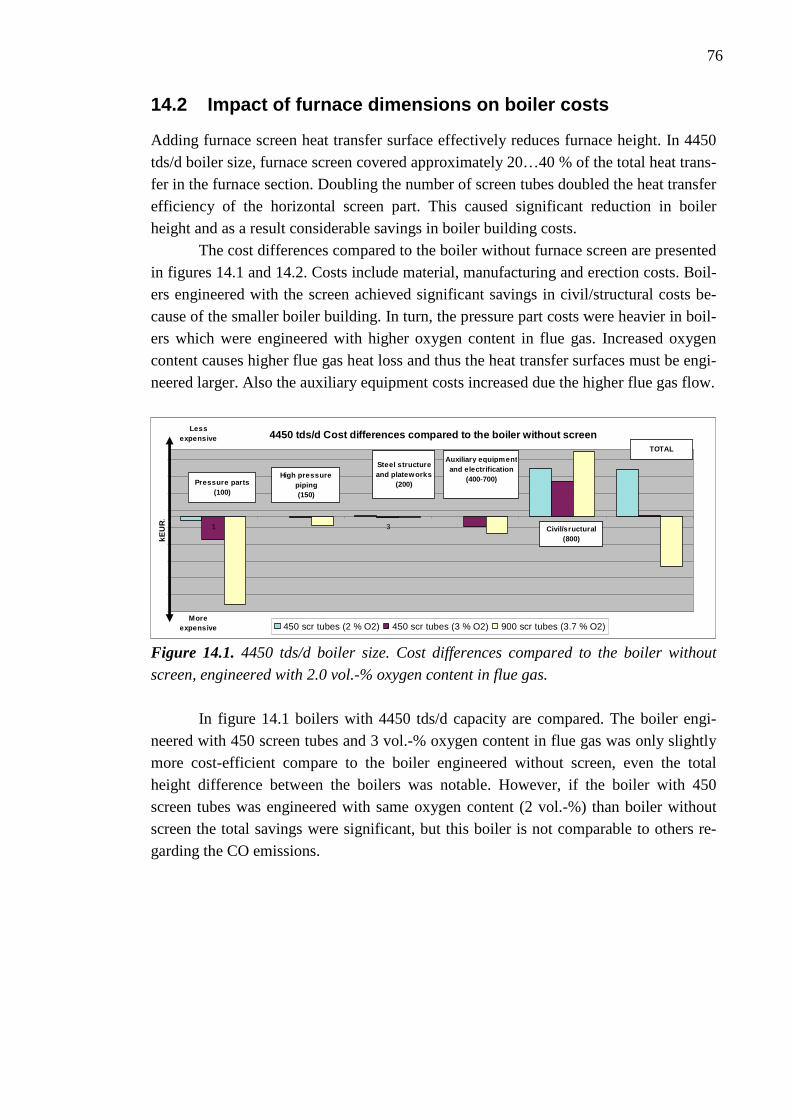
76
14.2 Impact of furnace dimensions on boiler costs
Adding furnace screen heat transfer surface effectively reduces furnace height. In 4450 tds/d boiler size, furnace screen covered approximately 20…40 % of the total heat trans-fer in the furnace section. Doubling the number of screen tubes doubled the heat transfer efficiency of the horizontal screen part. This caused significant reduction in boiler height and as a result considerable savings in boiler building costs. The cost differences compared to the boiler without furnace screen are presented in figures 14.1 and 14.2. Costs include material, manufacturing and erection costs. Boil-ers engineered with the screen achieved significant savings in civil/structural costs be-cause of the smaller boiler building. In turn, the pressure part costs were heavier in boil-ers which were engineered with higher oxygen content in flue gas. Increased oxygen content causes higher flue gas heat loss and thus the heat transfer surfaces must be engi-neered larger. Also the auxiliary equipment costs increased due the higher flue gas flow.
4450 tds/d Cost differences compared to the boiler without screen
1 3 5
kEU
R.
450 scr tubes (2 % O2) 450 scr tubes (3 % O2) 900 scr tubes (3.7 % O2)
Pressure parts(100)
High pressure piping(150)
Steel structure and plateworks
(200)
Auxiliary equipment and electrification
(400-700)
Civil/sructural(800)
TOTAL
Lessexpensive
Moreexpensive
Figure 14.1. 4450 tds/d boiler size. Cost differences compared to the boiler without
screen, engineered with 2.0 vol.-% oxygen content in flue gas.
In figure 14.1 boilers with 4450 tds/d capacity are compared. The boiler engi-
neered with 450 screen tubes and 3 vol.-% oxygen content in flue gas was only slightly more cost-efficient compare to the boiler engineered without screen, even the total height difference between the boilers was notable. However, if the boiler with 450 screen tubes was engineered with same oxygen content (2 vol.-%) than boiler without screen the total savings were significant, but this boiler is not comparable to others re-garding the CO emissions.
77
8700 tds/d Cost differences compared to the boiler without screen
1 2 3 4 5 6
kEU
R.
660 scr tubes (1.5 % O2) 660 scr tubes (2.6 % O2) 1320 scr tubes (3.3 % O2)
Pressure parts(100)
High pressure piping(150)
Steel structure and plateworks
(200)
Auxiliary equipment and electrification
(400-700)
Civil/sructural(800)
TOTAL
Lessexpensive
Moreexpensive
Figure 14.2 . 8700 tds/d: Cost differences compared to the boiler without screen, engi-
neered with 1.5 vol.-% oxygen content in flue gas.
Costs in 8700 boiler, behaved same way than in 4450 tds/d boiler size. The flue gas oxygen content used in engineering had a significant effect on costs. If oxygen con-tent used in engineering is determined by the equation 11.2 adding the furnace screen is not a cost-effective solution, see figure 14.2. In turn, boiler engineered with 660 screen tubes and with the same oxygen content (1.5 vol.-%) than boiler without screen, savings in civil/structural costs were significant.
According to this study, furnace screen is not a cost-effective solution if oxygen content in flue gas is determined by the equations 11.1 and 11.2. Increased combustion air ratio causes higher flue gas flow rate [mn
3/kg,ds] and as a result flue gas heat loss increases. This means larger heat transfer surfaces if the steam generation requirement remains constant. On the other hand, if the combustion air ratio, or oxygen content in flue gas, is kept constant despite the shorter residence time, adding the furnace screen is a cost-effective solution.
However, low furnace height may lead to layout problems. If furnace is engi-neered low there may be too little free space for process equipment under economizers. Some problems occur already with 450 furnace screen tubes in 4450 tds/d boiler. Low furnace can also lead to incomplete combustion and cause increased carbon monoxide emissions. But it is clear that combustion physics in recovery boiler are not known well enough to make definite conclusion about shorter residence time impact on CO emis-sion.
78
REFERENCES [1] Vakkilainen Esa, 2005. Kraft Recovery Boilers – Principles and practice. Helsinki: Valopaino Oy. ISBN 952-91-8603-7. [2] Adams, Frederick, Grace. 1997. Kraft Recovery Boilers. New York: Tappi press. ISBN 0-9625985-9-3 [3] Andritz internal recovery boiler design manual. 2012. [4] Andritz internal training material. 2010. [5] Vakkilainen Esa. 2006. Soodakattilan vastaanottokokeet, Materiaali- ja energiatase, Finland, Suomen soodakattilayhdistys. [6] Internal discussion with Sales Manager Marja Heinola and Product Manager Pasi Miikkulainen. [7] Vakkilainen E, Holm K, Simonen L. Emission Performance Of Large Recovery Boilers. [8] Andritz feedback System. 1012. [9] Internal discussion with Technology Manager Lauri Pakarinen [10] A.F. Mills. 1999. Basic Heat Transfer. ISBN 0-13-096247-3 [11] Incropera, De Witt. 1990. Fundamentals of heat and mass transfer. 3 rd edition. Singapore. ISBN 0-471-51729-1. [12] VDI Heat Atlas. 1993. Google books. [13] Vainio E, Brink A, In-Furnace Measurement of Sulfur and Nitrogen Species in a Recovery Boiler. Finland: VTT/Åbo Akademi University. [14] McKeough P. 2010. Understanding and Precicting the Release of Sodium, Potas-sium and Chlorine during Black-Liquor Combustion in the Recovery Furnace. Finland: Andritz Oy. [15] Andritz internal online recovery boiler training material. Recovery Boiler Emis-sions.
79
[15] Kulig J. 2006. NOx Control Using Quaternary Air – Mill Experience. USA, Ohio: Tappi press. [17] Gullichsen Johan, Fogelholm Carl-Johan. 1999. Chemical Pulping 6B. Jyväskylä:
Gummerus Oy, ISBN 952-5216-06-3.
[18] Suomen soodakattilayhdistys. 2004. 40 Years recovery boiler co-operation in
Finland. Helsinki: Kyriiri Oy.
[19] Salmenoja K, 2000, Report 00-1 Field and Laboratory Studies on Chlorine-induced Superheater Corrosion in Boilers Fired with Biofuels. Finland, Åbo. [20] Brink A, Zabetta E, Hupa M. NOx Chemistry in Recovery Boilers under Staging Conditions. Finland. [21] International Flame Research Foundation – Suomen kansallinen osasto. 1995. Poltto ja Palaminen. Finland, Jyväskylä: Gummerus Kirjapaino Oy. [22] Clement J.L., Barna J.L. 1993. The Effect of Black Liquor Fuel-bound Nitrogen on NOx Emissions. Environmental Conference, USA, Ohio. [23] McKeough P, Savolainen J. 2011. Predicting of recovery-boiler NOx emissions in the light of new field data and theoretical deliberations. Soodakattilapäivä, Helsinki [24] Lundberg M, Niemi P, 2008. Effect of Ammonia Injection on Black Liquor Recov-ery Boiler NOx emissions and Ash Chemistry. Tappi Engineering, Pulping & Environ-mental Conference, USA, Portland. [25] Fluent 6.0 User Manual. [26] Internal discussion with Plant Design Manager Veli Riikonen. [27] Tampereen teknillinen yliopisto. 2006. Luentomoniste: Virtausoppi. [28] V-M. Pentinsaari. 2009. Modern Recovery Boiler Design Criteria, Master’s Thesis. Finland, Lappeenranta.
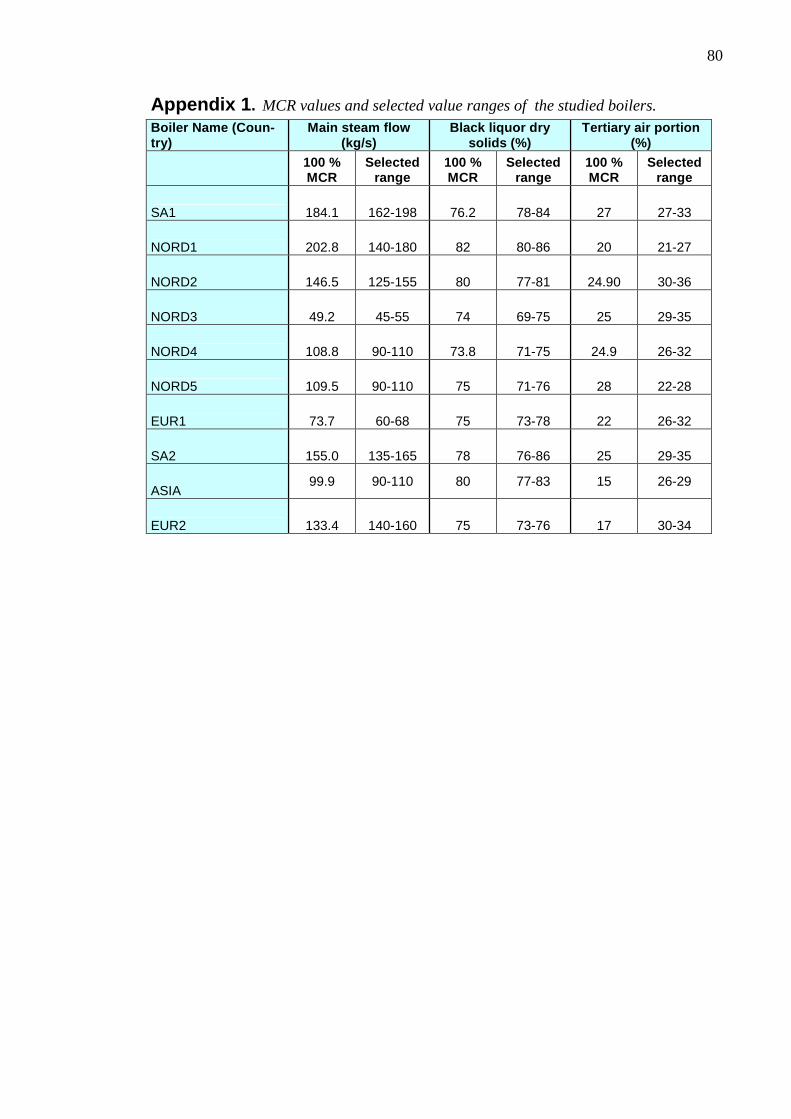
80
Appendix 1 . MCR values and selected value ranges of the studied boilers. Boiler Name (Coun-try)
Main steam flow (kg/s)
Black liquor dry solids (%)
Tertiary air portion (%)
100 % MCR
Selected range
100 % MCR
Selected range
100 % MCR
Selected range
SA1 184.1 162-198 76.2 78-84 27 27-33
NORD1 202.8 140-180 82 80-86 20 21-27
NORD2 146.5 125-155 80 77-81 24.90 30-36
NORD3 49.2 45-55 74 69-75 25 29-35
NORD4 108.8 90-110 73.8 71-75 24.9 26-32
NORD5 109.5 90-110 75 71-76 28 22-28
EUR1 73.7 60-68 75 73-78 22 26-32
SA2 155.0 135-165 78 76-86 25 29-35
ASIA 99.9 90-110 80 77-83 15 26-29
EUR2 133.4 140-160 75 73-76 17 30-34
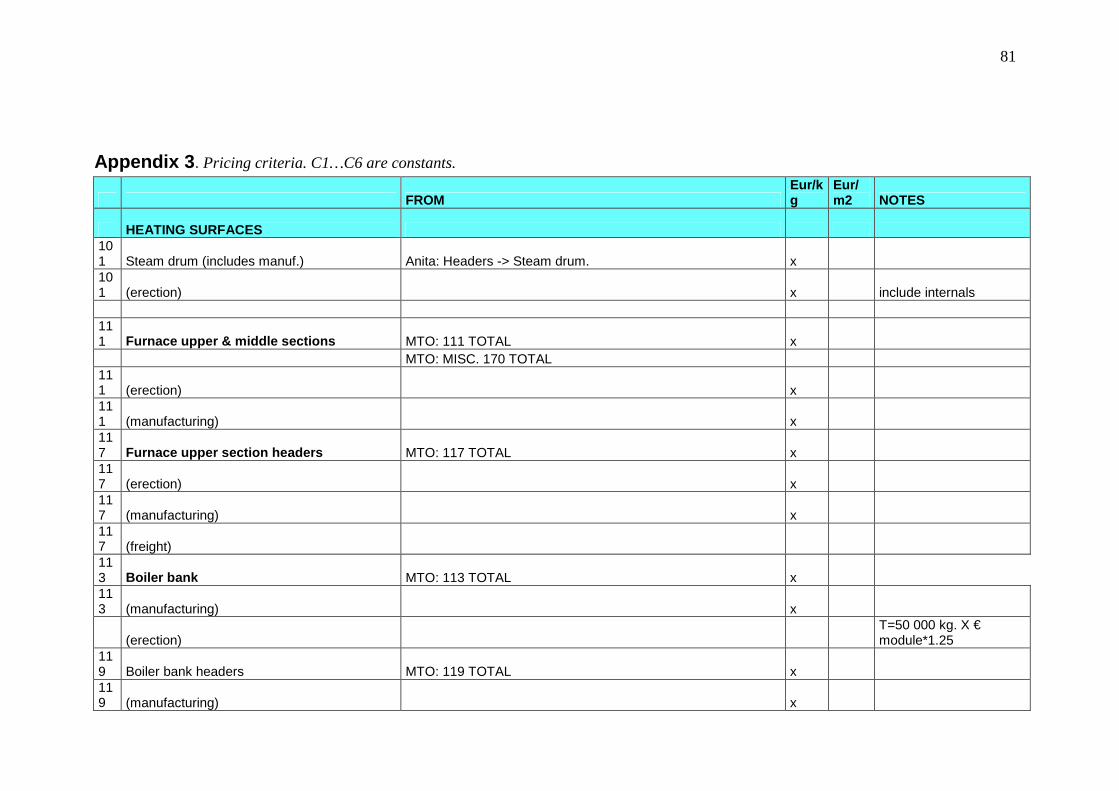
81
Appendix 3 . Pricing criteria. C1…C6 are constants.
FROM Eur/kg
Eur/m2 NOTES
HEATING SURFACES 101 Steam drum (includes manuf.) Anita: Headers -> Steam drum. x 101 (erection) x include internals 111 Furnace upper & middle sections MTO: 111 TOTAL x MTO: MISC. 170 TOTAL 111 (erection) x 111 (manufacturing) x 117 Furnace upper section headers MTO: 117 TOTAL x 117 (erection) x 117 (manufacturing) x 117 (freight) 113 Boiler bank MTO: 113 TOTAL x 113 (manufacturing) x
(erection) T=50 000 kg. X € module*1.25
119 Boiler bank headers MTO: 119 TOTAL x 119 (manufacturing) x
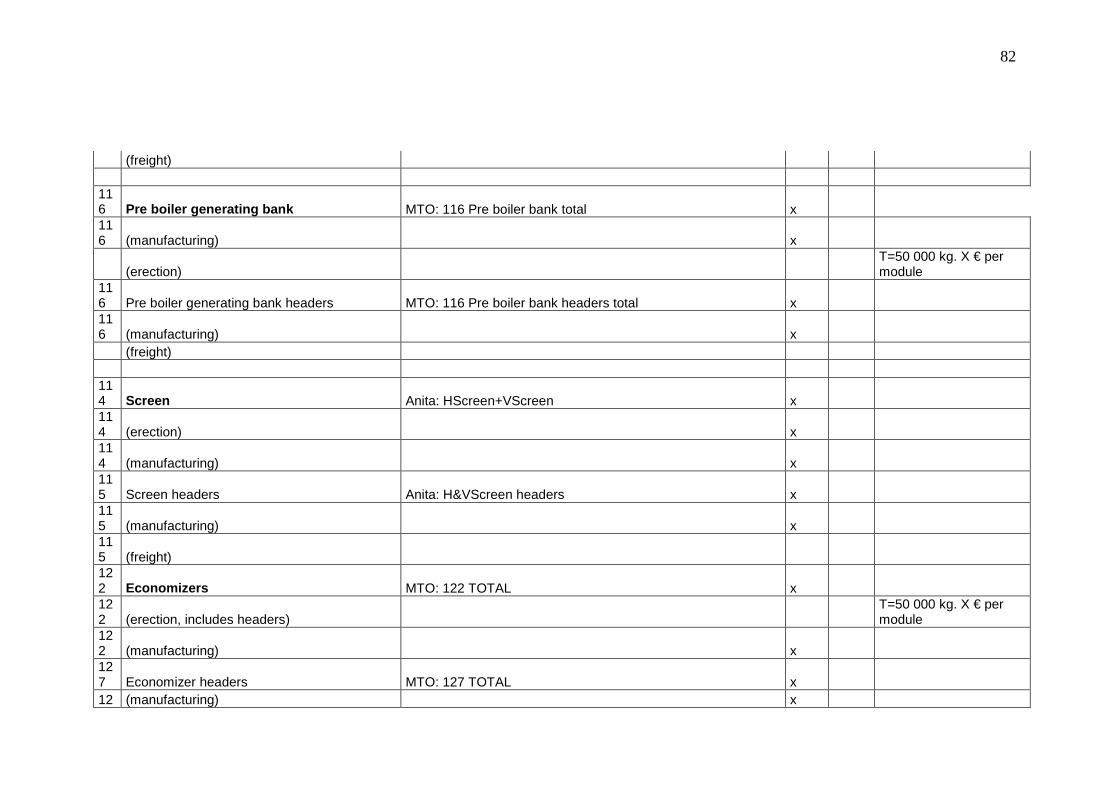
82
(freight) 116 Pre boiler generating bank MTO: 116 Pre boiler bank total x 116 (manufacturing) x
(erection) T=50 000 kg. X € per module
116 Pre boiler generating bank headers MTO: 116 Pre boiler bank headers total x 116 (manufacturing) x (freight) 114 Screen Anita: HScreen+VScreen x 114 (erection) x 114 (manufacturing) x 115 Screen headers Anita: H&VScreen headers x 115 (manufacturing) x 115 (freight) 122 Economizers MTO: 122 TOTAL x 122 (erection, includes headers)
T=50 000 kg. X € per module
122 (manufacturing) x 127 Economizer headers MTO: 127 TOTAL x 12 (manufacturing) x
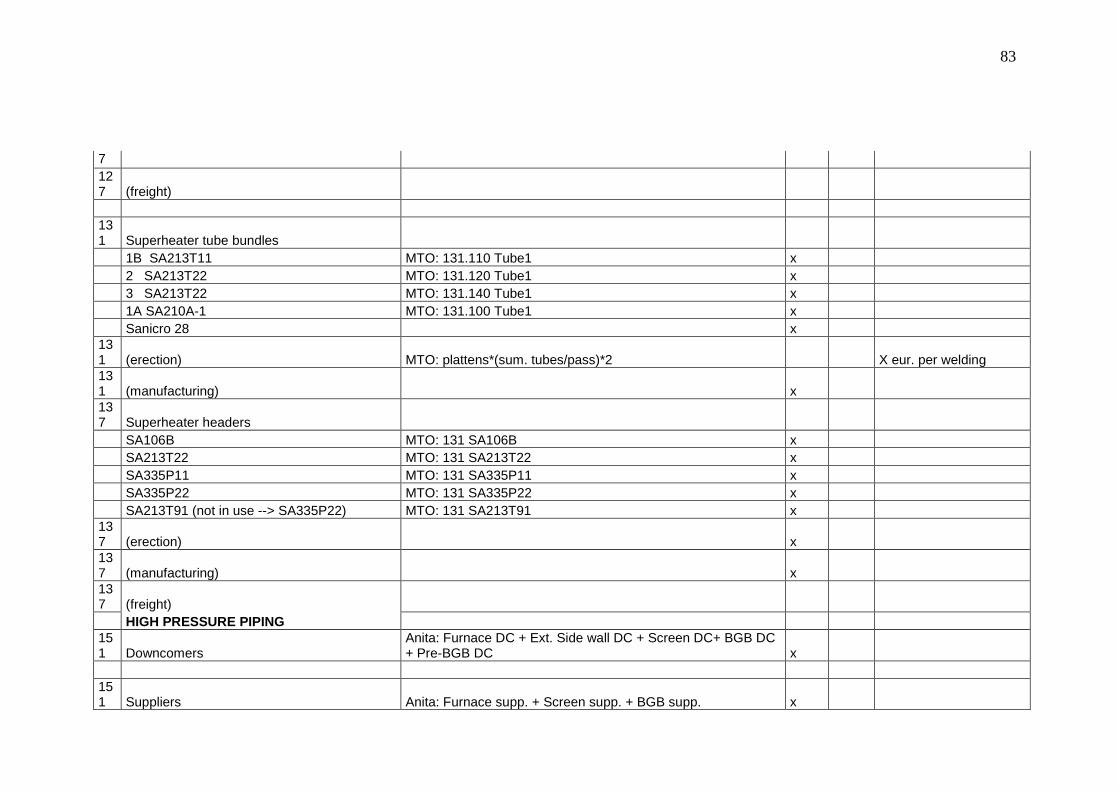
83
7 127 (freight) 131 Superheater tube bundles 1B SA213T11 MTO: 131.110 Tube1 x 2 SA213T22 MTO: 131.120 Tube1 x 3 SA213T22 MTO: 131.140 Tube1 x 1A SA210A-1 MTO: 131.100 Tube1 x Sanicro 28 x 131 (erection) MTO: plattens*(sum. tubes/pass)*2 X eur. per welding 131 (manufacturing) x 137 Superheater headers SA106B MTO: 131 SA106B x SA213T22 MTO: 131 SA213T22 x SA335P11 MTO: 131 SA335P11 x SA335P22 MTO: 131 SA335P22 x SA213T91 (not in use --> SA335P22) MTO: 131 SA213T91 x 137 (erection) x 137 (manufacturing) x 137 (freight) HIGH PRESSURE PIPING 151 Downcomers
Anita: Furnace DC + Ext. Side wall DC + Screen DC+ BGB DC + Pre-BGB DC x
151 Suppliers Anita: Furnace supp. + Screen supp. + BGB supp. x
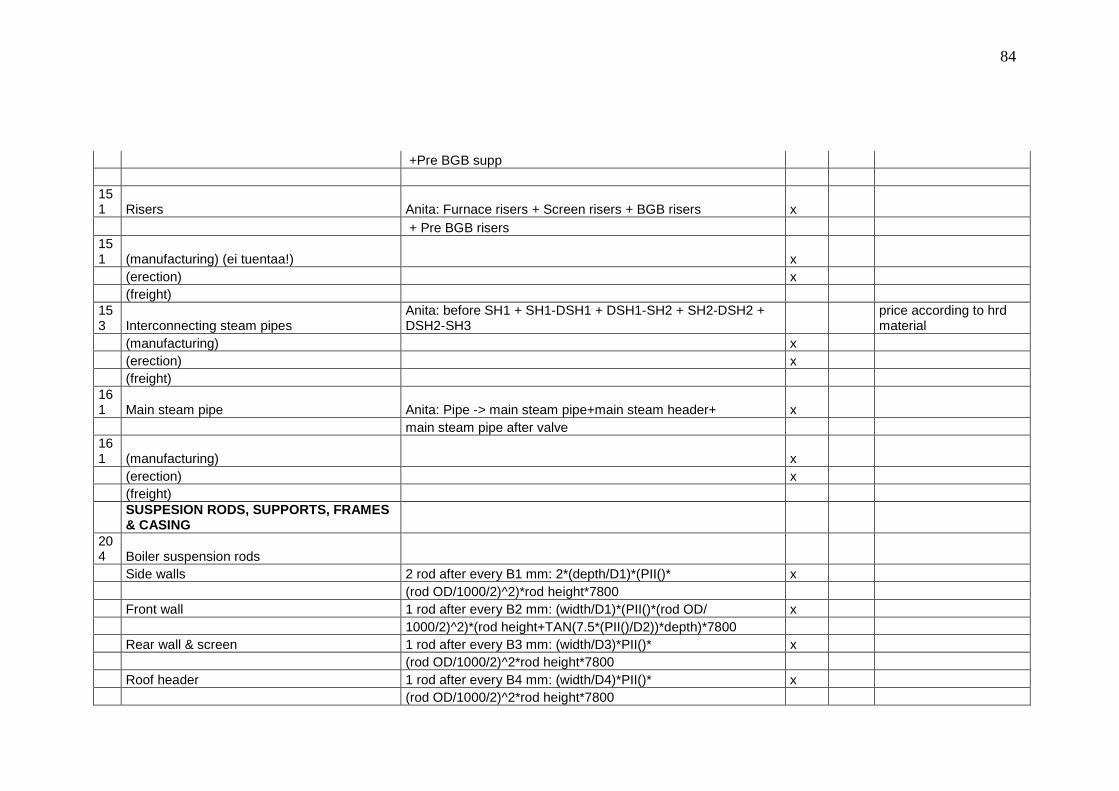
84
+Pre BGB supp 151 Risers Anita: Furnace risers + Screen risers + BGB risers x + Pre BGB risers 151 (manufacturing) (ei tuentaa!) x (erection) x (freight) 153 Interconnecting steam pipes
Anita: before SH1 + SH1-DSH1 + DSH1-SH2 + SH2-DSH2 + DSH2-SH3
price according to hrd material
(manufacturing) x (erection) x (freight) 161 Main steam pipe Anita: Pipe -> main steam pipe+main steam header+ x main steam pipe after valve 161 (manufacturing) x (erection) x (freight)
SUSPESION RODS, SUPPORTS, FRAMES & CASING
204 Boiler suspension rods Side walls 2 rod after every B1 mm: 2*(depth/D1)*(PII()* x (rod OD/1000/2)^2)*rod height*7800 Front wall 1 rod after every B2 mm: (width/D1)*(PII()*(rod OD/ x 1000/2)^2)*(rod height+TAN(7.5*(PII()/D2))*depth)*7800 Rear wall & screen 1 rod after every B3 mm: (width/D3)*PII()* x (rod OD/1000/2)^2*rod height*7800 Roof header 1 rod after every B4 mm: (width/D4)*PII()* x (rod OD/1000/2)^2*rod height*7800
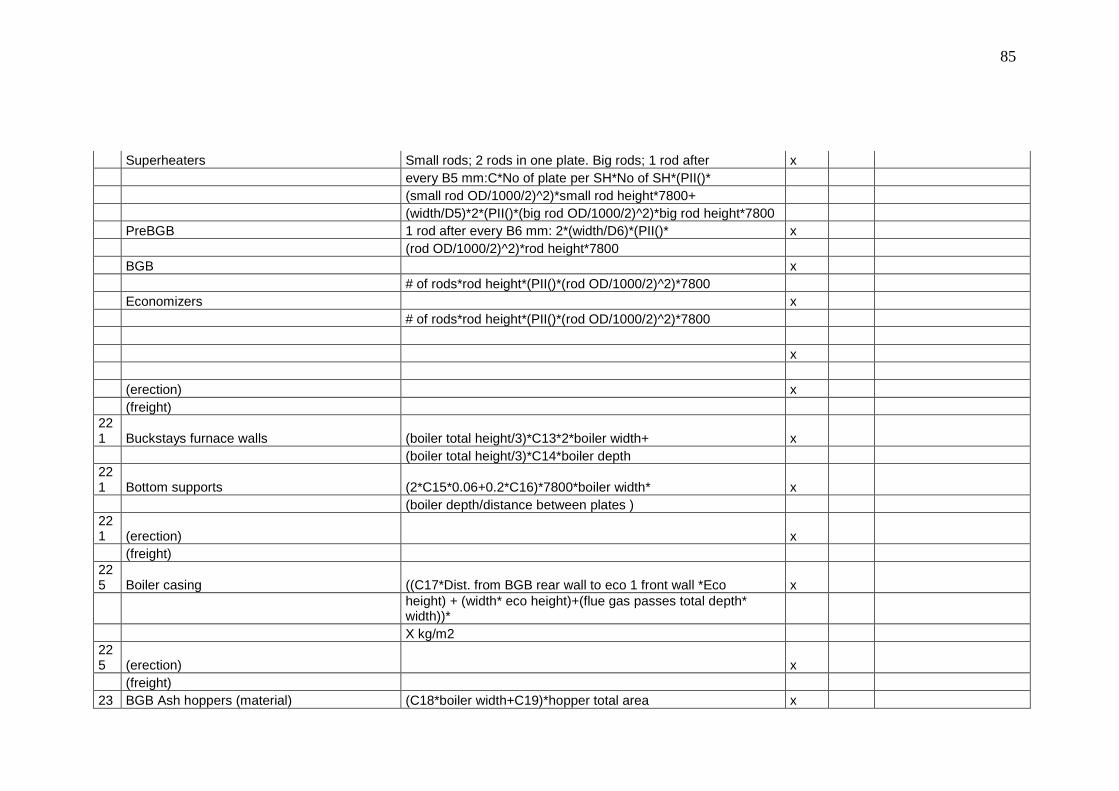
85
Superheaters Small rods; 2 rods in one plate. Big rods; 1 rod after x every B5 mm:C*No of plate per SH*No of SH*(PII()* (small rod OD/1000/2)^2)*small rod height*7800+ (width/D5)*2*(PII()*(big rod OD/1000/2)^2)*big rod height*7800 PreBGB 1 rod after every B6 mm: 2*(width/D6)*(PII()* x (rod OD/1000/2)^2)*rod height*7800 BGB x # of rods*rod height*(PII()*(rod OD/1000/2)^2)*7800 Economizers x # of rods*rod height*(PII()*(rod OD/1000/2)^2)*7800 x (erection) x (freight) 221 Buckstays furnace walls (boiler total height/3)*C13*2*boiler width+ x (boiler total height/3)*C14*boiler depth 221 Bottom supports (2*C15*0.06+0.2*C16)*7800*boiler width* x (boiler depth/distance between plates ) 221 (erection) x (freight) 225 Boiler casing ((C17*Dist. from BGB rear wall to eco 1 front wall *Eco x
height) + (width* eco height)+(flue gas passes total depth* width))*
X kg/m2 225 (erection) x (freight) 23 BGB Ash hoppers (material) (C18*boiler width+C19)*hopper total area x
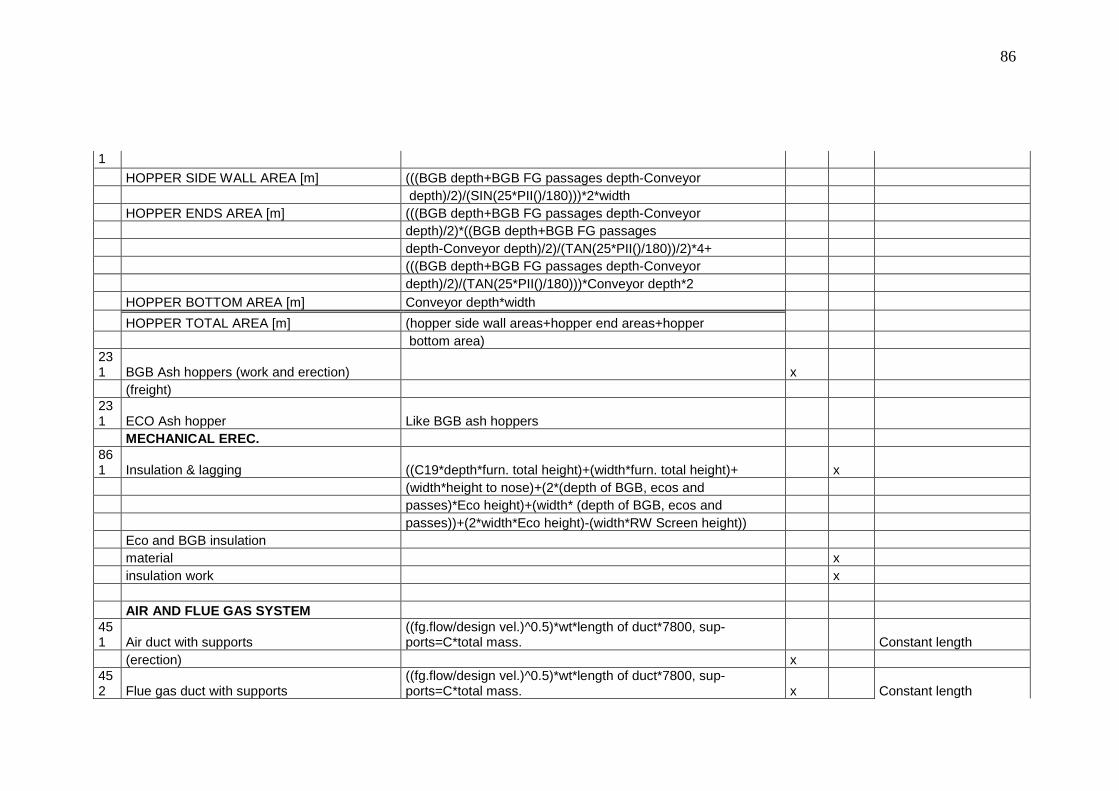
86
1
HOPPER SIDE WALL AREA [m] (((BGB depth+BGB FG passages depth-Conveyor depth)/2)/(SIN(25*PII()/180)))*2*width HOPPER ENDS AREA [m] (((BGB depth+BGB FG passages depth-Conveyor depth)/2)*((BGB depth+BGB FG passages depth-Conveyor depth)/2)/(TAN(25*PII()/180))/2)*4+ (((BGB depth+BGB FG passages depth-Conveyor depth)/2)/(TAN(25*PII()/180)))*Conveyor depth*2 HOPPER BOTTOM AREA [m] Conveyor depth*width
HOPPER TOTAL AREA [m] (hopper side wall areas+hopper end areas+hopper bottom area) 231 BGB Ash hoppers (work and erection) x (freight) 231 ECO Ash hopper Like BGB ash hoppers MECHANICAL EREC. 861 Insulation & lagging ((C19*depth*furn. total height)+(width*furn. total height)+ x (width*height to nose)+(2*(depth of BGB, ecos and passes)*Eco height)+(width* (depth of BGB, ecos and passes))+(2*width*Eco height)-(width*RW Screen height)) Eco and BGB insulation material x insulation work x AIR AND FLUE GAS SYSTEM 451 Air duct with supports
((fg.flow/design vel.)^0.5)*wt*length of duct*7800, sup-ports=C*total mass. Constant length
(erection) x 452 Flue gas duct with supports
((fg.flow/design vel.)^0.5)*wt*length of duct*7800, sup-ports=C*total mass. x Constant length
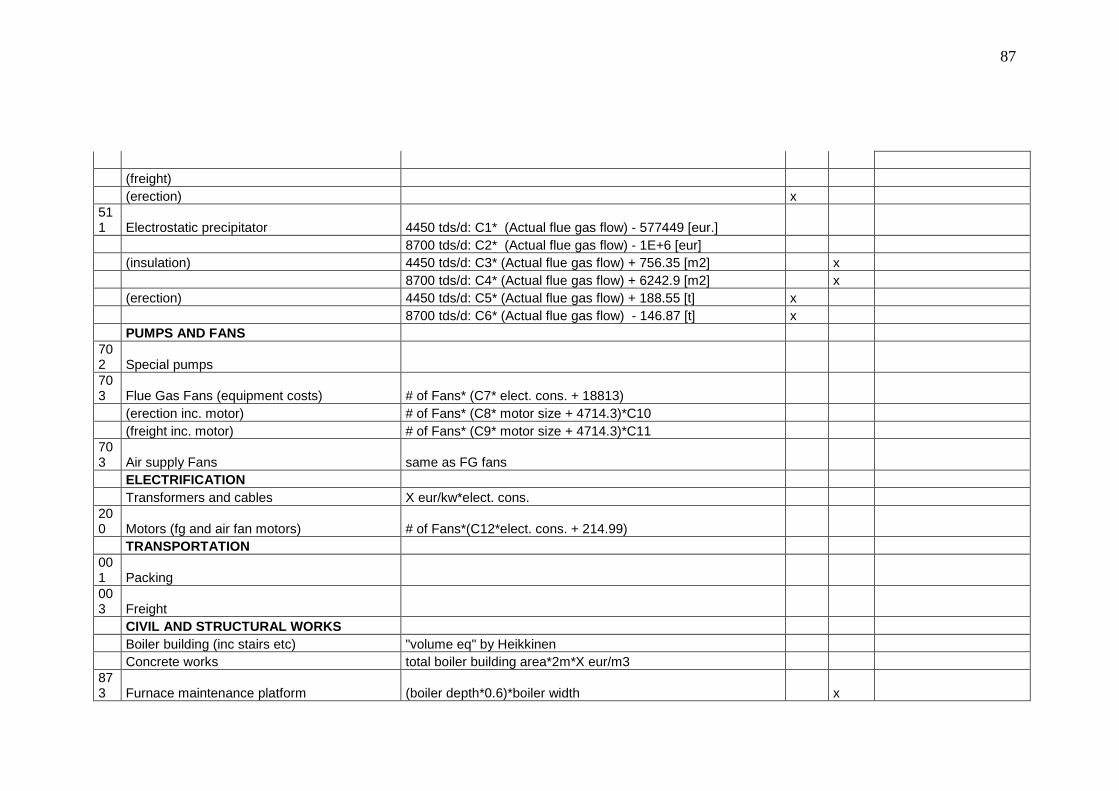
87
(freight) (erection) x 511 Electrostatic precipitator 4450 tds/d: C1* (Actual flue gas flow) - 577449 [eur.] 8700 tds/d: C2* (Actual flue gas flow) - 1E+6 [eur] (insulation) 4450 tds/d: C3* (Actual flue gas flow) + 756.35 [m2] x 8700 tds/d: C4* (Actual flue gas flow) + 6242.9 [m2] x (erection) 4450 tds/d: C5* (Actual flue gas flow) + 188.55 [t] x 8700 tds/d: C6* (Actual flue gas flow) - 146.87 [t] x PUMPS AND FANS 702 Special pumps 703 Flue Gas Fans (equipment costs) # of Fans* (C7* elect. cons. + 18813) (erection inc. motor) # of Fans* (C8* motor size + 4714.3)*C10 (freight inc. motor) # of Fans* (C9* motor size + 4714.3)*C11 703 Air supply Fans same as FG fans ELECTRIFICATION Transformers and cables X eur/kw*elect. cons. 200 Motors (fg and air fan motors) # of Fans*(C12*elect. cons. + 214.99) TRANSPORTATION 001 Packing 003 Freight CIVIL AND STRUCTURAL WORKS Boiler building (inc stairs etc) "volume eq" by Heikkinen Concrete works total boiler building area*2m*X eur/m3 873 Furnace maintenance platform (boiler depth*0.6)*boiler width x
88
Stairs Incluled in Boiler building eq.

89