Embed Size (px)
Citation preview
Minimum Wage in India, and role of WageIndicator Foundation
Biju Varkkey, Faculty, HRM Area
Indian Institute of Management Ahmedabad (IIMA), India
Rupa Korde, Faculty, Economics Area
FLAME University, Pune, India
Sunny Wadhwaniya, Research Associate
Indian Institute of Management Ahmedabad (IIMA), India
Introduction
• Minimum Wages (MW) crucial for developing developing countries
• Protection for low-wage workers
• Ensure payment of fair wages
• Provide a basic floor wage
• Instrument of macroeconomic policy
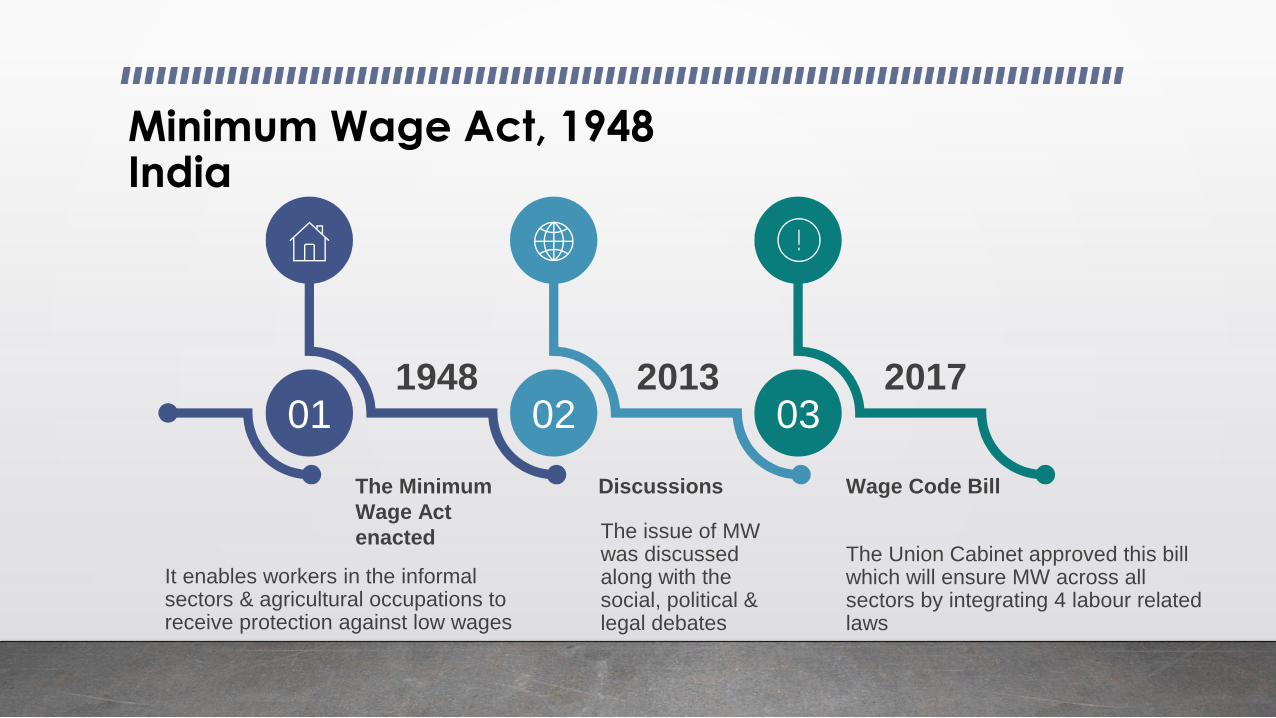
Minimum Wage Act, 1948India
01 02 031948 2013 2017
It enables workers in the informal sectors & agricultural occupations to receive protection against low wages
The Minimum
Wage Act
enacted The issue of MW was discussed along with the social, political & legal debates
Discussions
The Union Cabinet approved this bill which will ensure MW across all sectors by integrating 4 labour related laws
Wage Code Bill
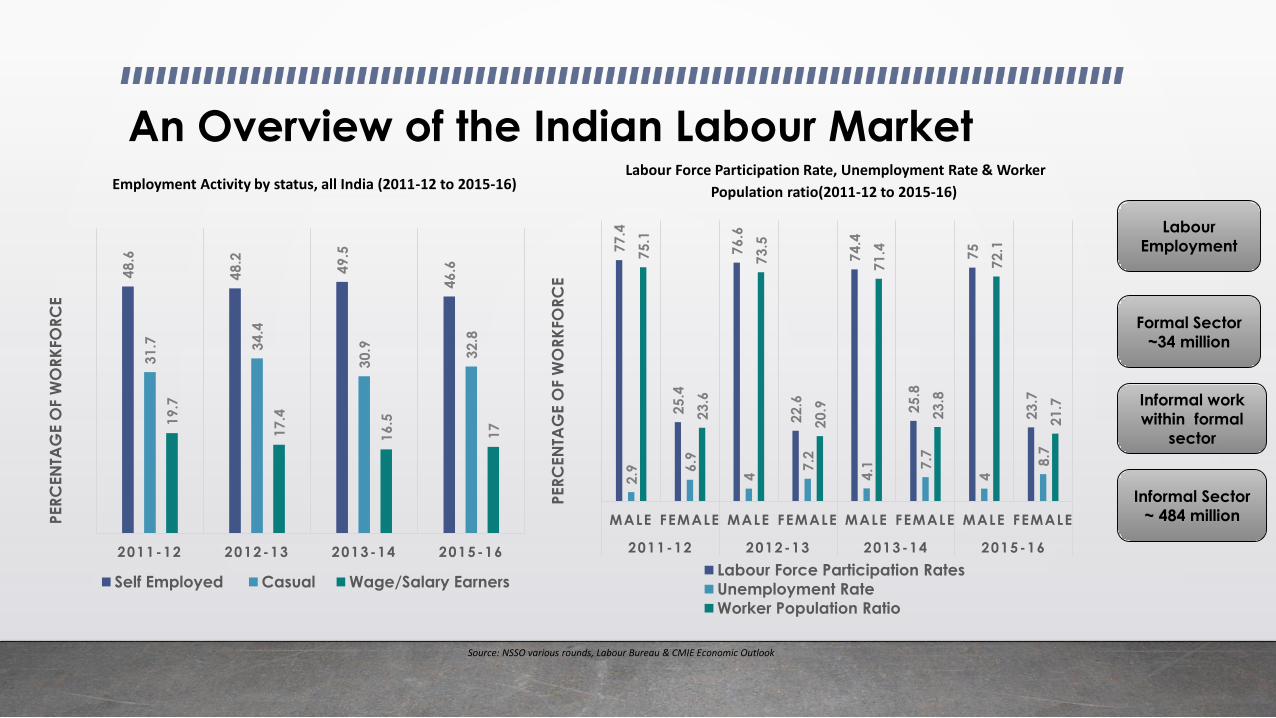
An Overview of the Indian Labour MarketLabour Force Participation Rate, Unemployment Rate & Worker
Population ratio(2011-12 to 2015-16)Employment Activity by status, all India (2011-12 to 2015-16)
48
.6
48
.2
49
.5
46
.6
31
.7 34
.4
30
.9 32
.8
19
.7
17
.4
16
.5
17
2011-12 2012-13 2013-14 2015-16
PER
CEN
TAG
E O
F W
OR
KFO
RC
E
Self Employed Casual Wage/Salary Earners
77
.4
25
.4
76
.6
22
.6
74
.4
25
.8
75
23
.7
2.9 6
.9
4
7.2
4.1 7
.7
4
8.7
75
.1
23
.6
73
.5
20
.9
71
.4
23
.8
72
.1
21
.7
MALE FEMALE MALE FEMALE MALE FEMALE MALE FEMALE
2011-12 2012-13 2013-14 2015-16P
ER
CEN
TAG
E O
F W
OR
KFO
RC
ELabour Force Participation RatesUnemployment Rate
Worker Population Ratio
Source: NSSO various rounds, Labour Bureau & CMIE Economic Outlook
Informal Sector
~ 484 million
Labour
Employment
Informal work
within formal
sector
Formal Sector
~34 million
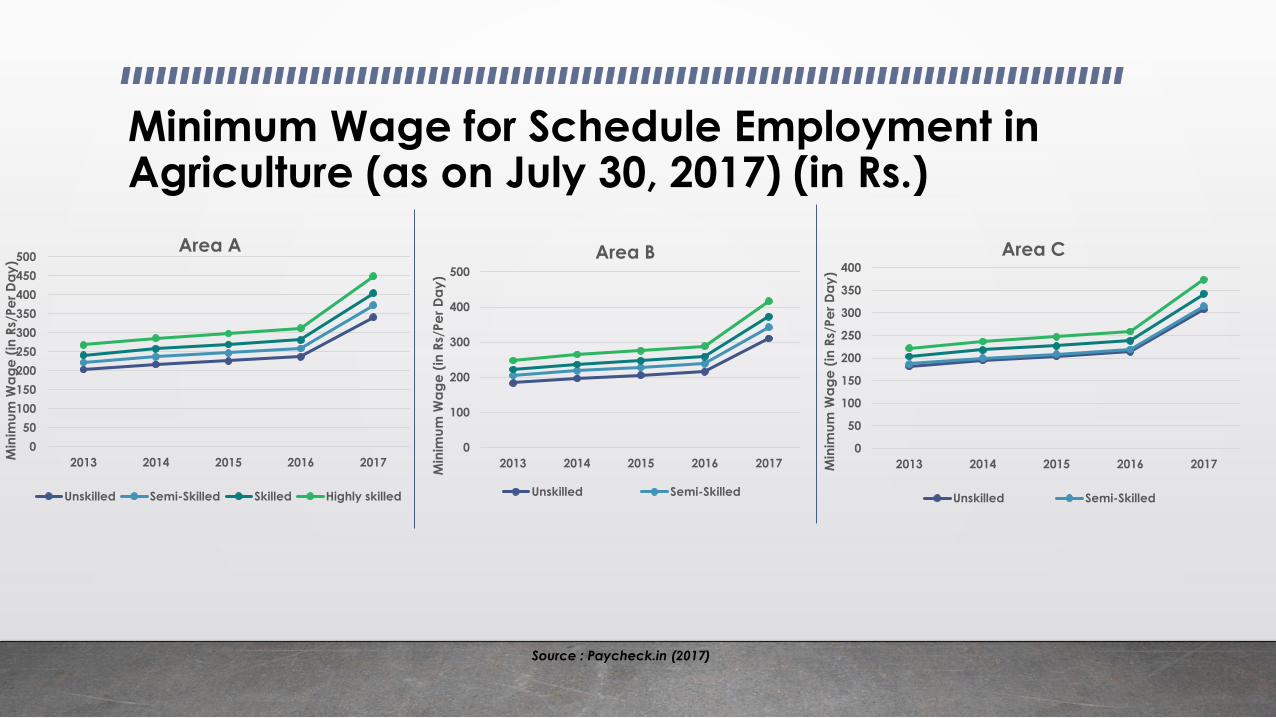
Minimum Wage for Schedule Employment in Agriculture (as on July 30, 2017) (in Rs.)
0
50
100
150
200
250
300
350
400
450
500
2013 2014 2015 2016 2017
Min
imu
m W
ag
e (
in R
s/Pe
r D
ay
)
Area A
Unskilled Semi-Skilled Skilled Highly skilled
0
100
200
300
400
500
2013 2014 2015 2016 2017
Min
imu
m W
ag
e (
in R
s/Pe
r D
ay
)
Area B
Unskilled Semi-Skilled
0
50
100
150
200
250
300
350
400
2013 2014 2015 2016 2017Min
imu
m W
ag
e (
in R
s/Pe
r D
ay
)
Area C
Unskilled Semi-Skilled
Source : Paycheck.in (2017)
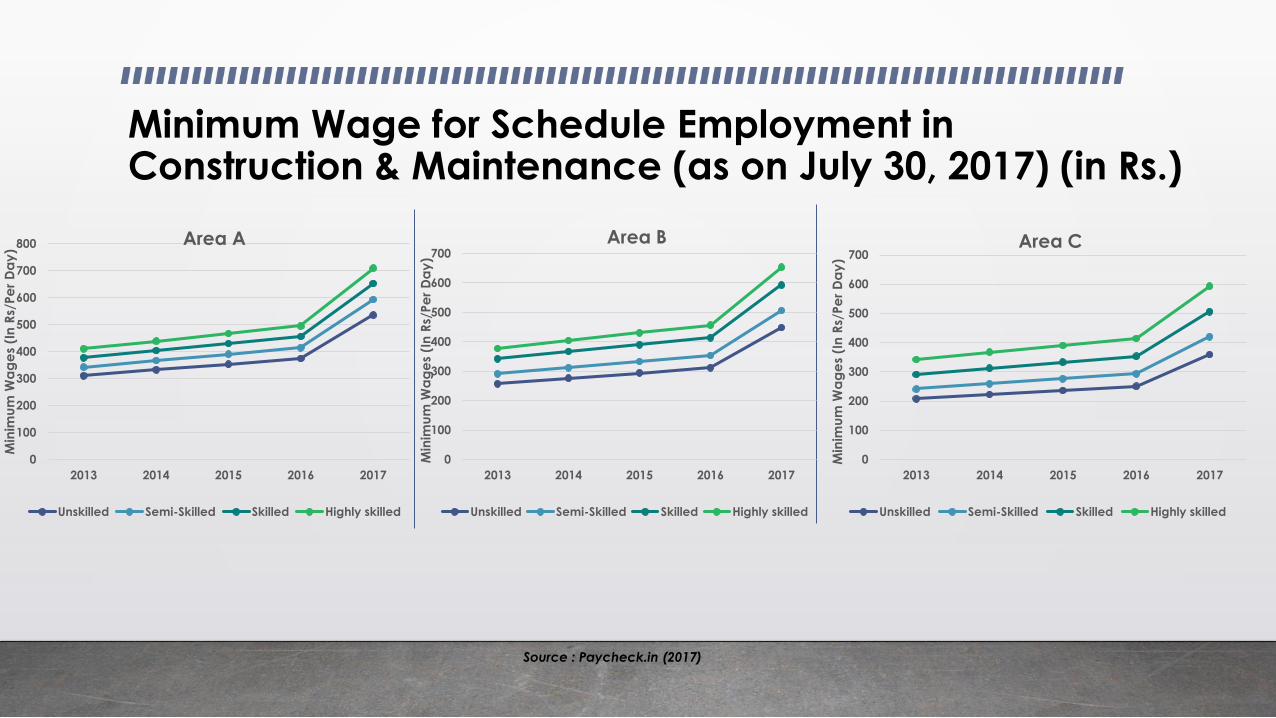
Minimum Wage for Schedule Employment in Construction & Maintenance (as on July 30, 2017) (in Rs.)
Source : Paycheck.in (2017)
0
100
200
300
400
500
600
700
800
2013 2014 2015 2016 2017
Min
imu
m W
ag
es
(In
Rs/
Pe
r D
ay
)
Area A
Unskilled Semi-Skilled Skilled Highly skilled
0
100
200
300
400
500
600
700
2013 2014 2015 2016 2017
Min
imu
m W
ag
es
(In
Rs/
Pe
r D
ay
)
Area B
Unskilled Semi-Skilled Skilled Highly skilled
0
100
200
300
400
500
600
700
2013 2014 2015 2016 2017
Min
imu
m W
ag
es
(In
Rs/
Pe
r D
ay
)
Area C
Unskilled Semi-Skilled Skilled Highly skilled
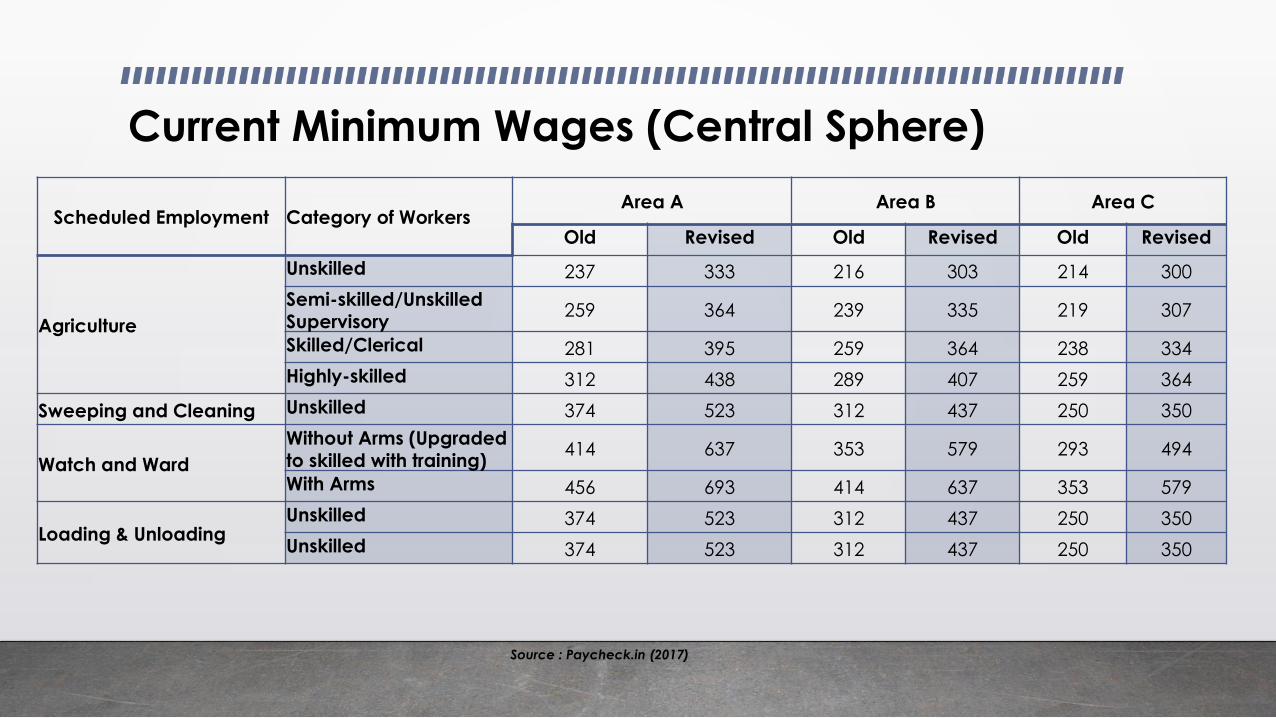
Current Minimum Wages (Central Sphere)
Scheduled Employment Category of WorkersArea A Area B Area C
Old Revised Old Revised Old Revised
Agriculture
Unskilled 237 333 216 303 214 300
Semi-skilled/Unskilled Supervisory
259 364 239 335 219 307
Skilled/Clerical 281 395 259 364 238 334
Highly-skilled 312 438 289 407 259 364
Sweeping and Cleaning Unskilled 374 523 312 437 250 350
Watch and Ward
Without Arms (Upgraded to skilled with training)
414 637 353 579 293 494
With Arms 456 693 414 637 353 579
Loading & UnloadingUnskilled 374 523 312 437 250 350
Unskilled 374 523 312 437 250 350
Source : Paycheck.in (2017)
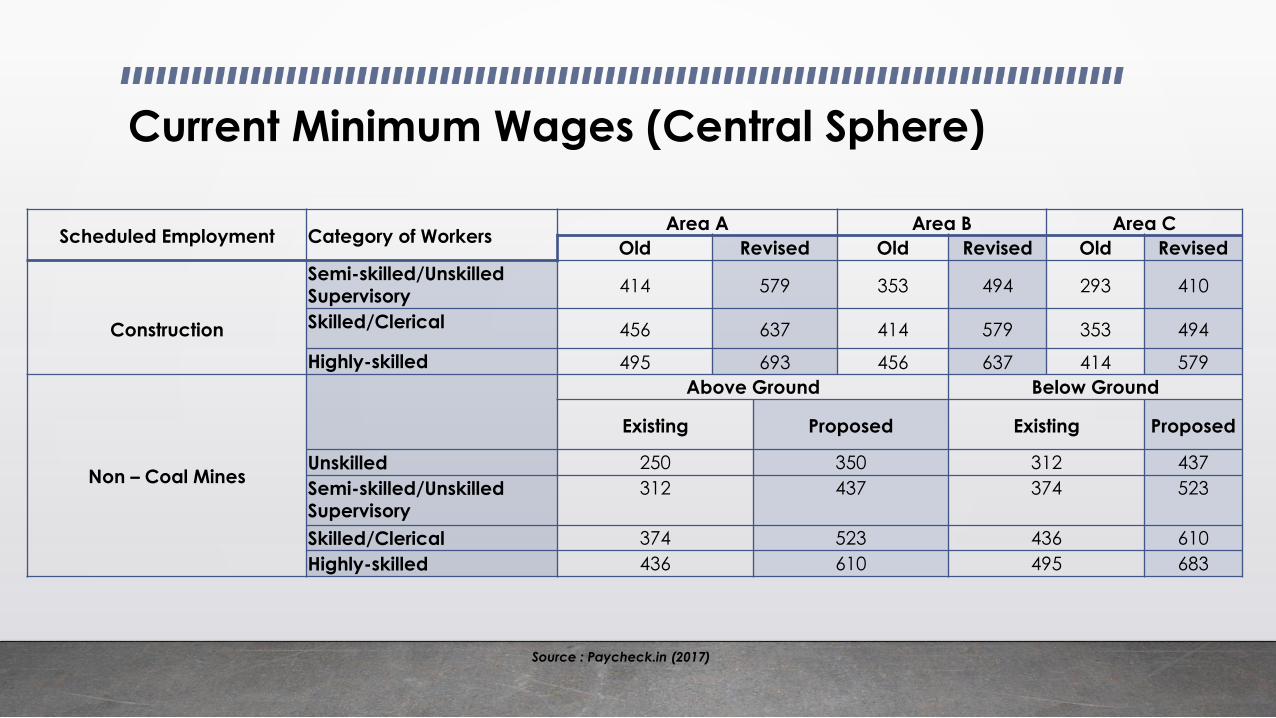
Current Minimum Wages (Central Sphere)
Scheduled Employment Category of WorkersArea A Area B Area C
Old Revised Old Revised Old Revised
Construction
Semi-skilled/Unskilled Supervisory
414 579 353 494 293 410
Skilled/Clerical 456 637 414 579 353 494
Highly-skilled 495 693 456 637 414 579
Non – Coal Mines
Above Ground Below Ground
Existing Proposed Existing Proposed
Unskilled 250 350 312 437
Semi-skilled/Unskilled Supervisory
312 437 374 523
Skilled/Clerical 374 523 436 610
Highly-skilled 436 610 495 683
Source : Paycheck.in (2017)
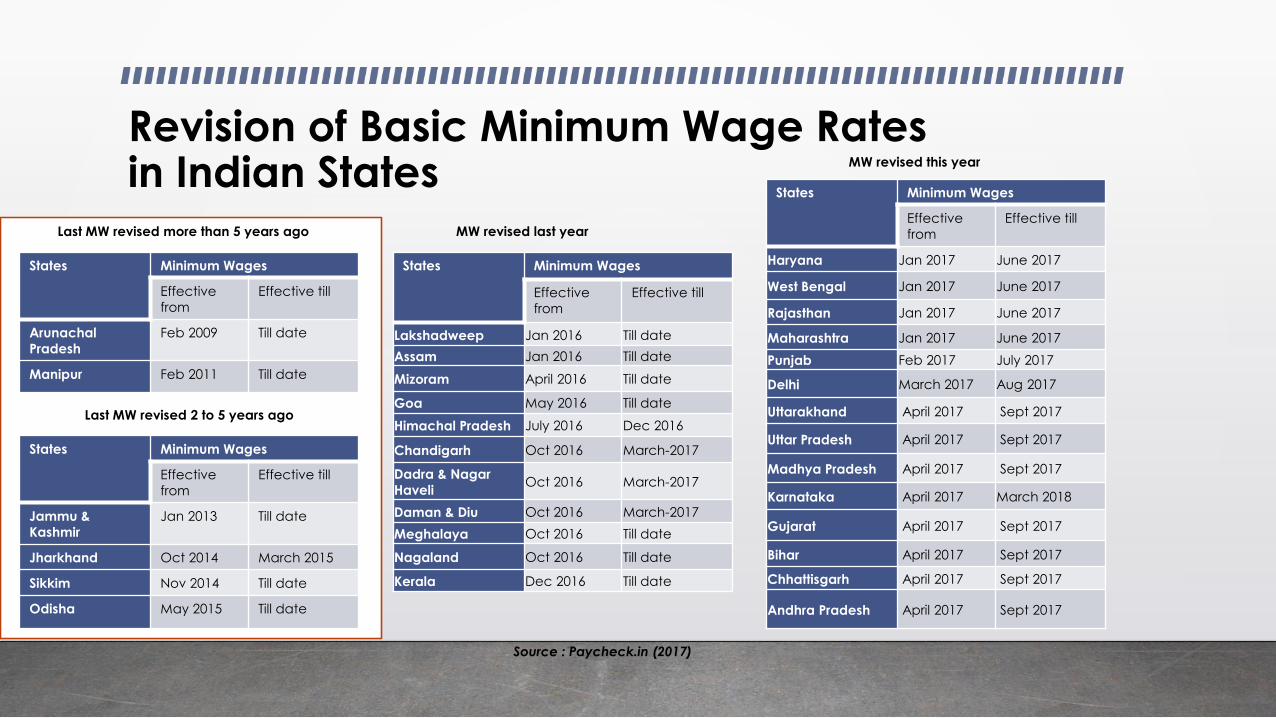
Revision of Basic Minimum Wage Ratesin Indian States
States Minimum Wages
Effective
from
Effective till
Arunachal
Pradesh
Feb 2009 Till date
Manipur Feb 2011 Till date
States Minimum Wages
Effective
from
Effective till
Jammu &
Kashmir
Jan 2013 Till date
Jharkhand Oct 2014 March 2015
Sikkim Nov 2014 Till date
Odisha May 2015 Till date
States Minimum Wages
Effective
from
Effective till
Lakshadweep Jan 2016 Till date
Assam Jan 2016 Till date
Mizoram April 2016 Till date
Goa May 2016 Till date
Himachal Pradesh July 2016 Dec 2016
Chandigarh Oct 2016 March-2017
Dadra & Nagar
HaveliOct 2016 March-2017
Daman & Diu Oct 2016 March-2017
Meghalaya Oct 2016 Till date
Nagaland Oct 2016 Till date
Kerala Dec 2016 Till date
States Minimum Wages
Effective
from
Effective till
Haryana Jan 2017 June 2017
West Bengal Jan 2017 June 2017
Rajasthan Jan 2017 June 2017
Maharashtra Jan 2017 June 2017
Punjab Feb 2017 July 2017
Delhi March 2017 Aug 2017
Uttarakhand April 2017 Sept 2017
Uttar Pradesh April 2017 Sept 2017
Madhya Pradesh April 2017 Sept 2017
Karnataka April 2017 March 2018
Gujarat April 2017 Sept 2017
Bihar April 2017 Sept 2017
Chhattisgarh April 2017 Sept 2017
Andhra Pradesh April 2017 Sept 2017
Source : Paycheck.in (2017)
Last MW revised more than 5 years ago
Last MW revised 2 to 5 years ago
MW revised last year
MW revised this year
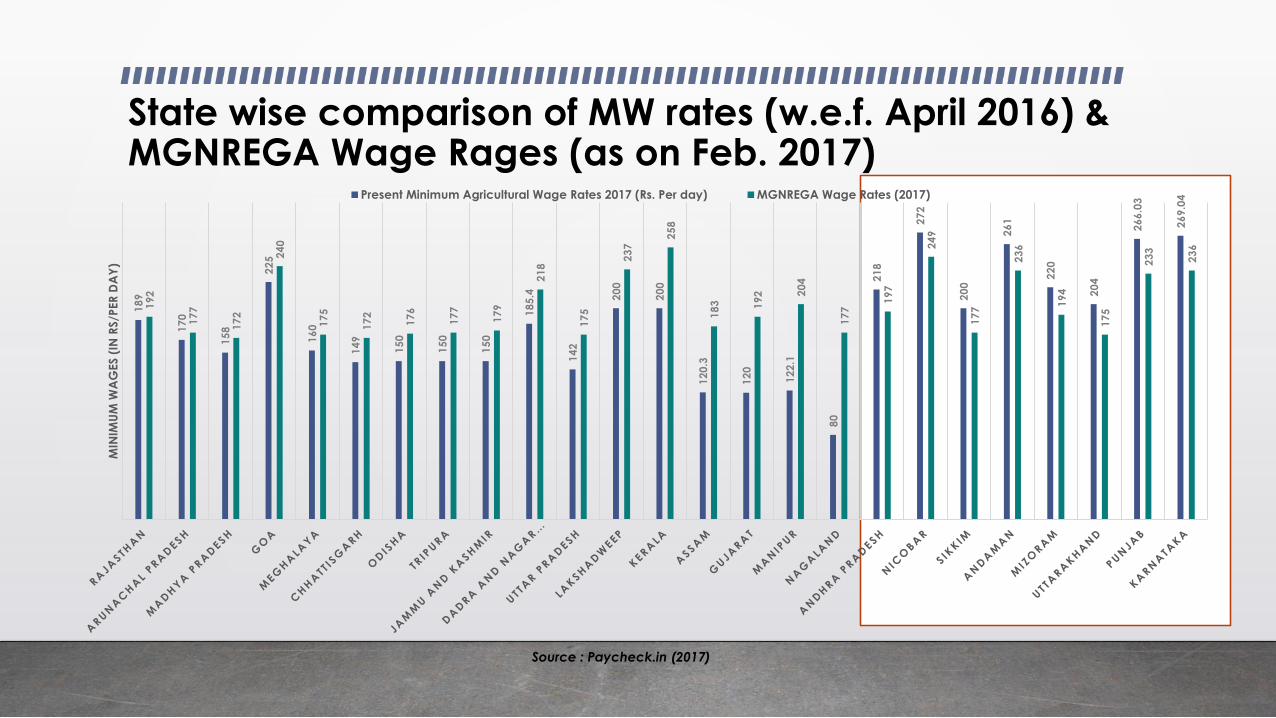
State wise comparison of MW rates (w.e.f. April 2016) & MGNREGA Wage Rages (as on Feb. 2017)
Source : Paycheck.in (2017)
18
9
17
0
15
8
22
5
16
0
14
9
15
0
15
0
15
0
18
5.4
14
2
20
0
20
0
12
0.3
12
0
12
2.1
80
21
8
27
2
20
0
26
1
22
0
20
4
26
6.0
3
26
9.0
4
19
2
17
7
17
2
24
0
17
5
17
2
17
6
17
7
17
9
21
8
17
5
23
7
25
8
18
3 19
2 20
4
17
7
19
7
24
9
17
7
23
6
19
4
17
5
23
3
23
6
MIN
IMU
M W
AG
ES (
IN R
S/P
ER
DA
Y)
Present Minimum Agricultural Wage Rates 2017 (Rs. Per day) MGNREGA Wage Rates (2017)
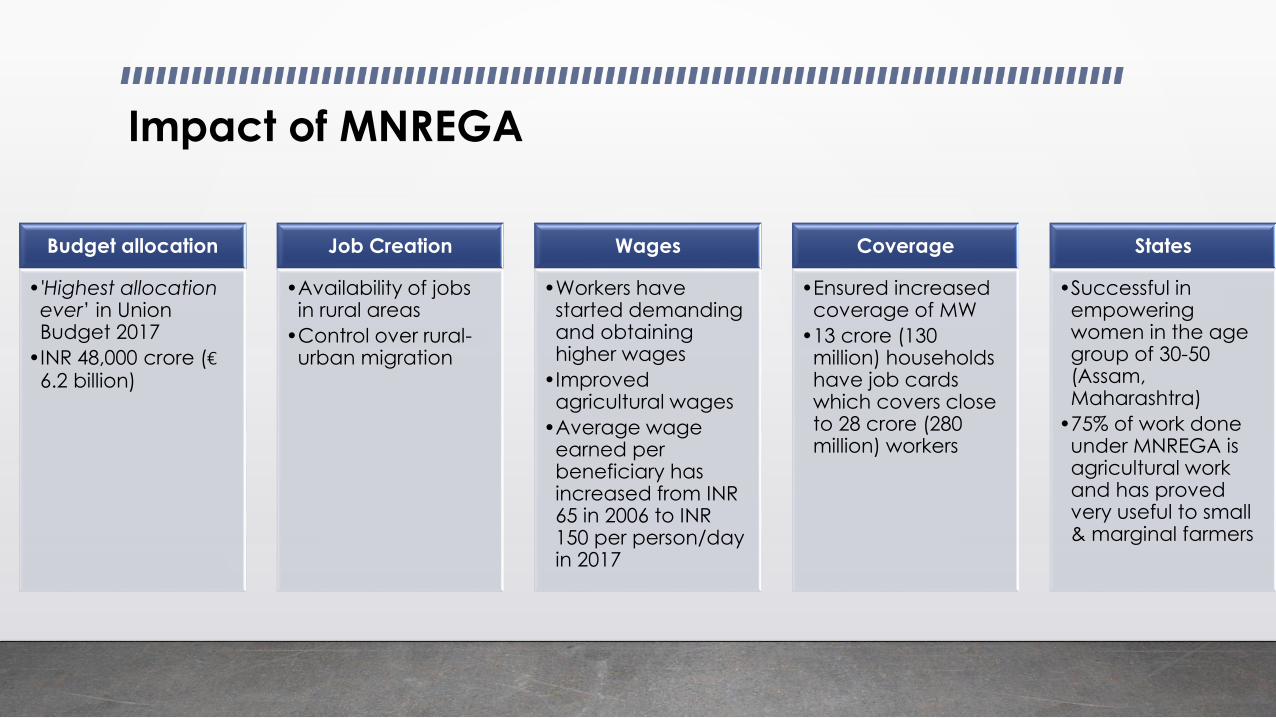
Impact of MNREGA
Budget allocation
•'Highest allocation ever’ in Union Budget 2017
•INR 48,000 crore (€ 6.2 billion)
Job Creation
•Availability of jobs in rural areas
•Control over rural-urban migration
Wages
•Workers have started demanding and obtaining higher wages
•Improved agricultural wages
•Average wage earned per beneficiary has increased from INR 65 in 2006 to INR 150 per person/day in 2017
Coverage
•Ensured increased coverage of MW
•13 crore (130 million) households have job cards which covers close to 28 crore (280 million) workers
States
•Successful in empowering women in the age group of 30-50 (Assam, Maharashtra)
•75% of work done under MNREGA is agricultural work and has proved very useful to small & marginal farmers
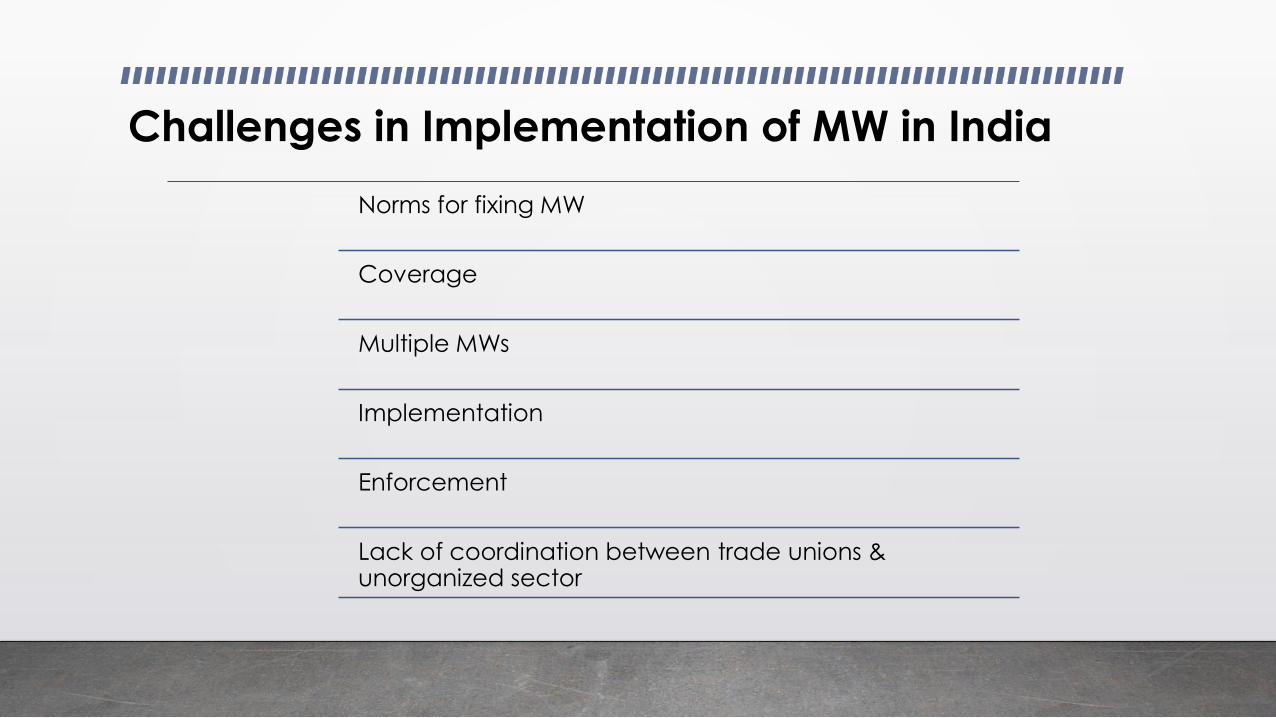
Challenges in Implementation of MW in India
Norms for fixing MW
Coverage
Multiple MWs
Implementation
Enforcement
Lack of coordination between trade unions & unorganized sector
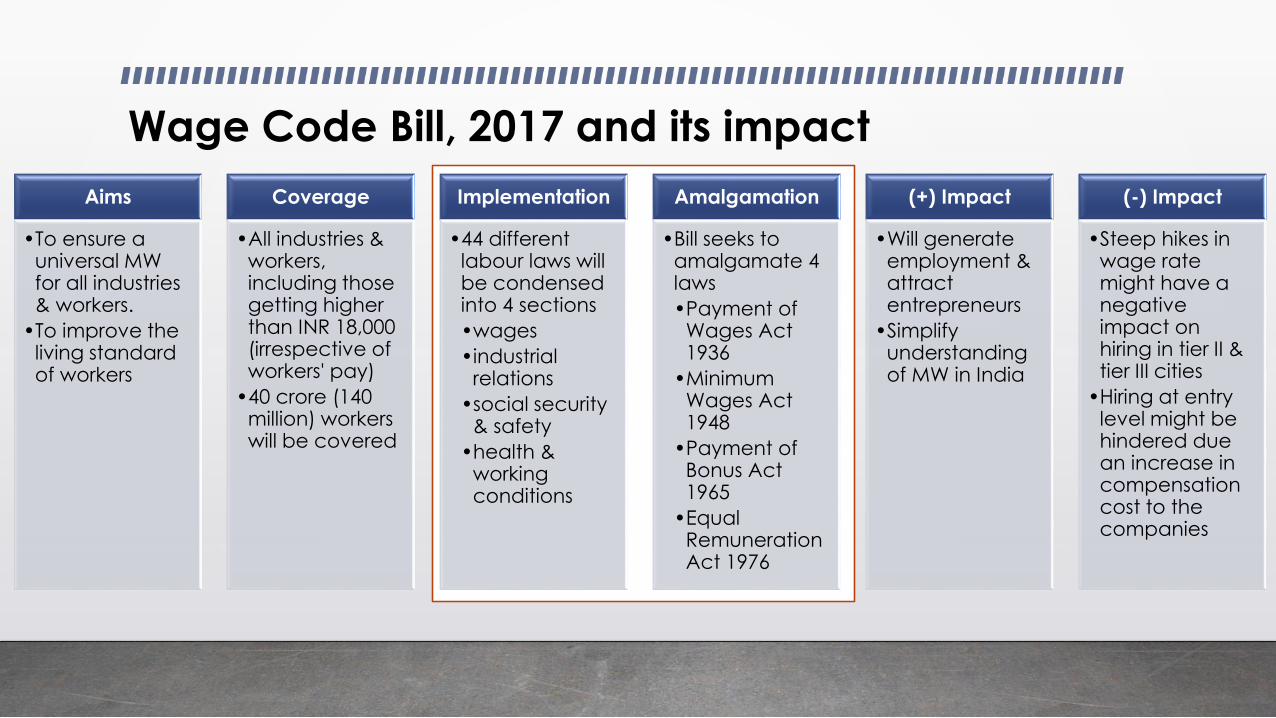
Wage Code Bill, 2017 and its impact
Aims
•To ensure a universal MW for all industries & workers.
•To improve the living standard of workers
Coverage
•All industries & workers, including those getting higher than INR 18,000 (irrespective of workers' pay)
•40 crore (140 million) workers will be covered
Implementation
•44 different labour laws will be condensed into 4 sections
•wages
•industrial relations
•social security & safety
•health & working conditions
Amalgamation
•Bill seeks to amalgamate 4 laws
•Payment of Wages Act 1936
•Minimum Wages Act 1948
•Payment of Bonus Act 1965
•Equal Remuneration Act 1976
(+) Impact
•Will generate employment & attract entrepreneurs
•Simplify understanding of MW in India
(-) Impact
•Steep hikes in wage rate might have a negative impact on hiring in tier II & tier III cities
•Hiring at entry level might be hindered due an increase in compensation cost to the companies
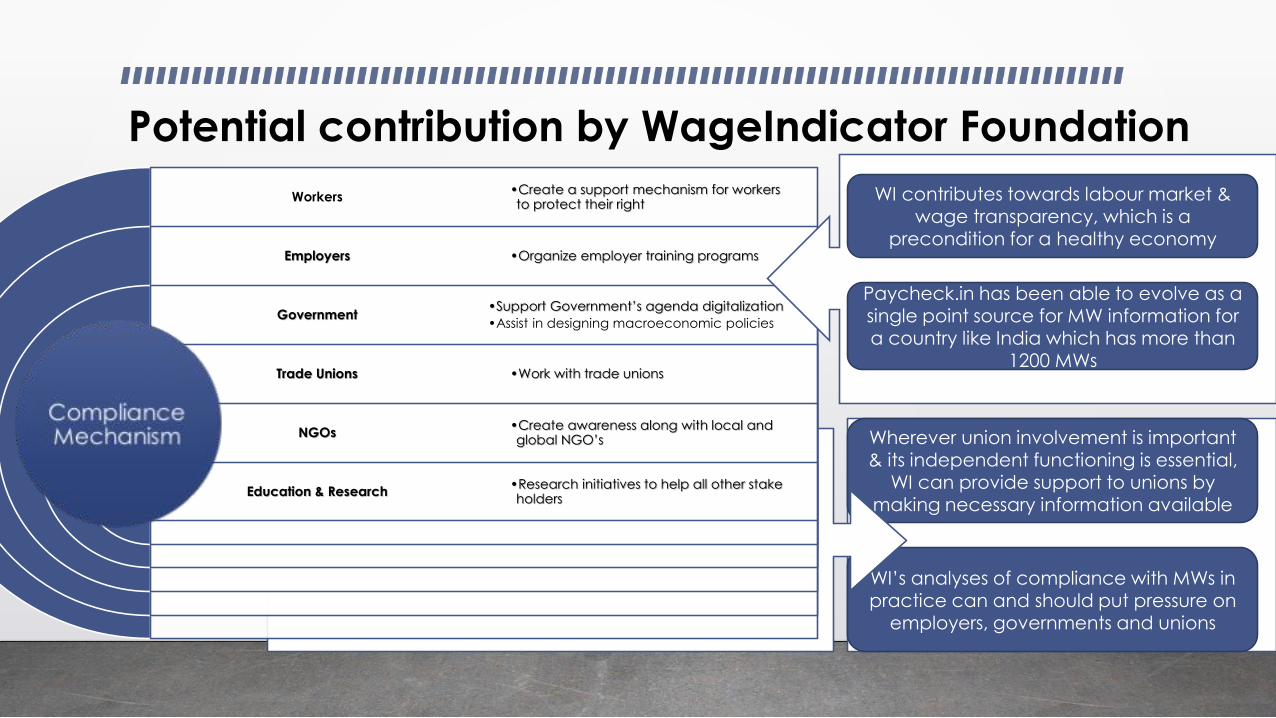
Wherever union involvement is important & its independent functioning is essential,
WI can provide support to unions by making necessary information available
WI’s analyses of compliance with MWs in practice can and should put pressure on
employers, governments and unions
Workers
Employers
Government
Trade Unions
NGOs
Education & Research
•Create a support mechanism for workers to protect their right
•Organize employer training programs
•Support Government’s agenda digitalization
•Assist in designing macroeconomic policies
•Work with trade unions
•Create awareness along with local and global NGO’s
•Research initiatives to help all other stake holders
Potential contribution by WageIndicator Foundation
WI contributes towards labour market & wage transparency, which is a
precondition for a healthy economy
Paycheck.in has been able to evolve as a single point source for MW information for a country like India which has more than
1200 MWs
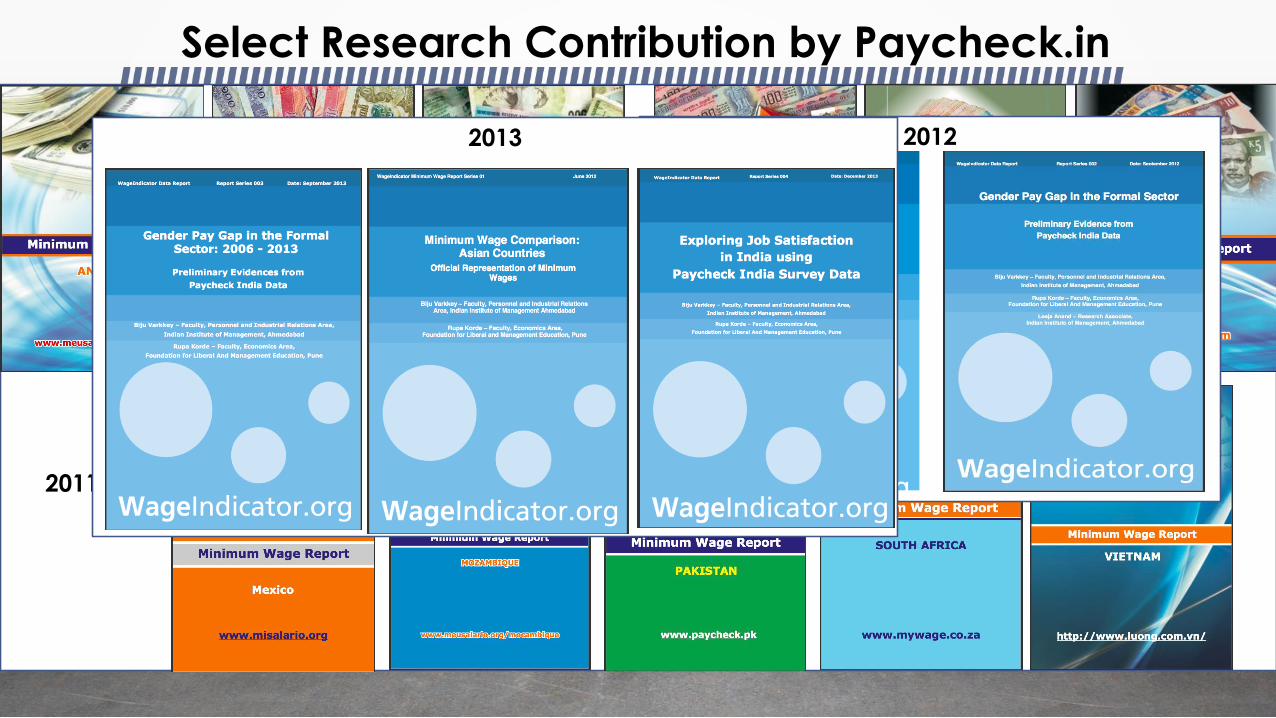
Select Research Contribution by Paycheck.in
2011
20122013
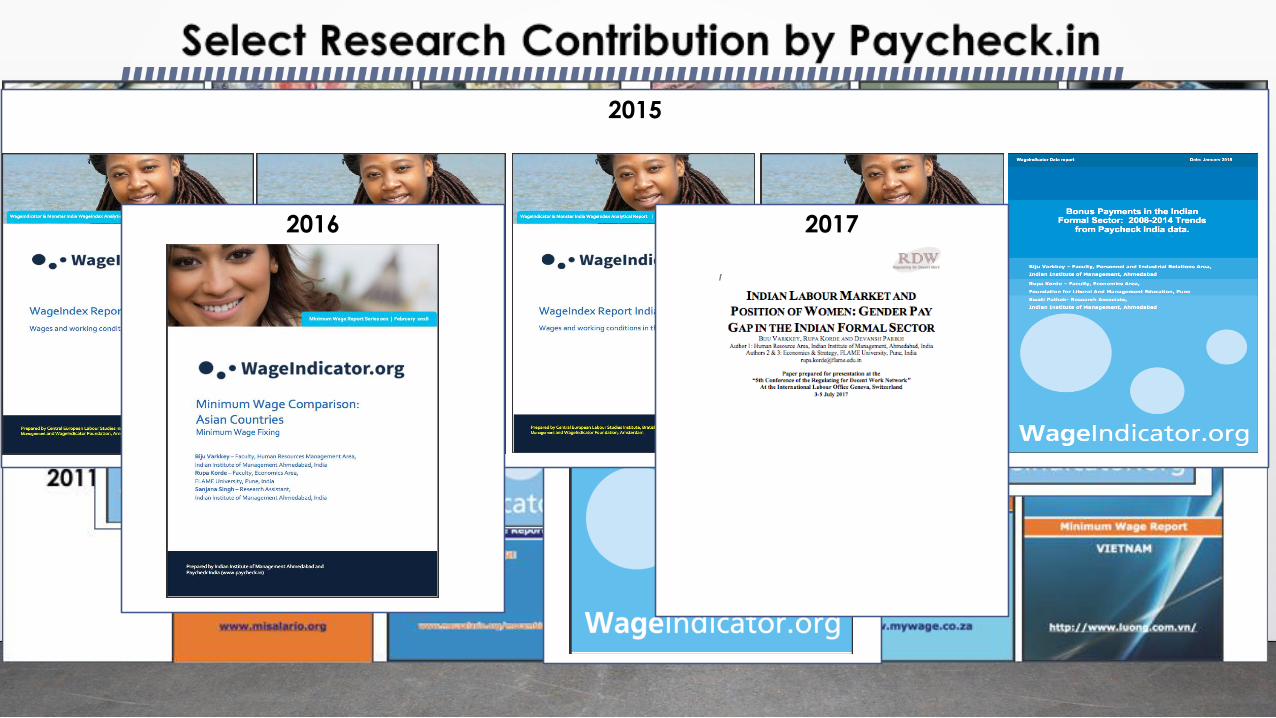
2014
2015
2016 2017
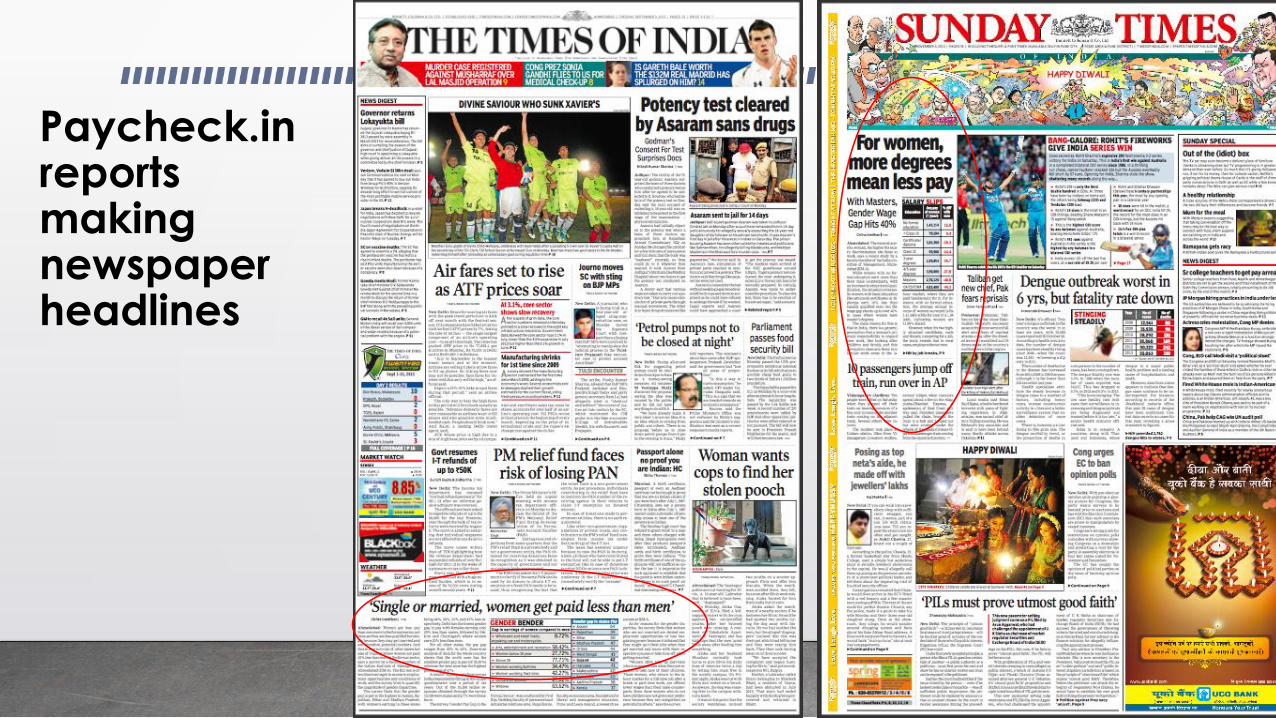
Paycheck.inreports making newspaper headlines
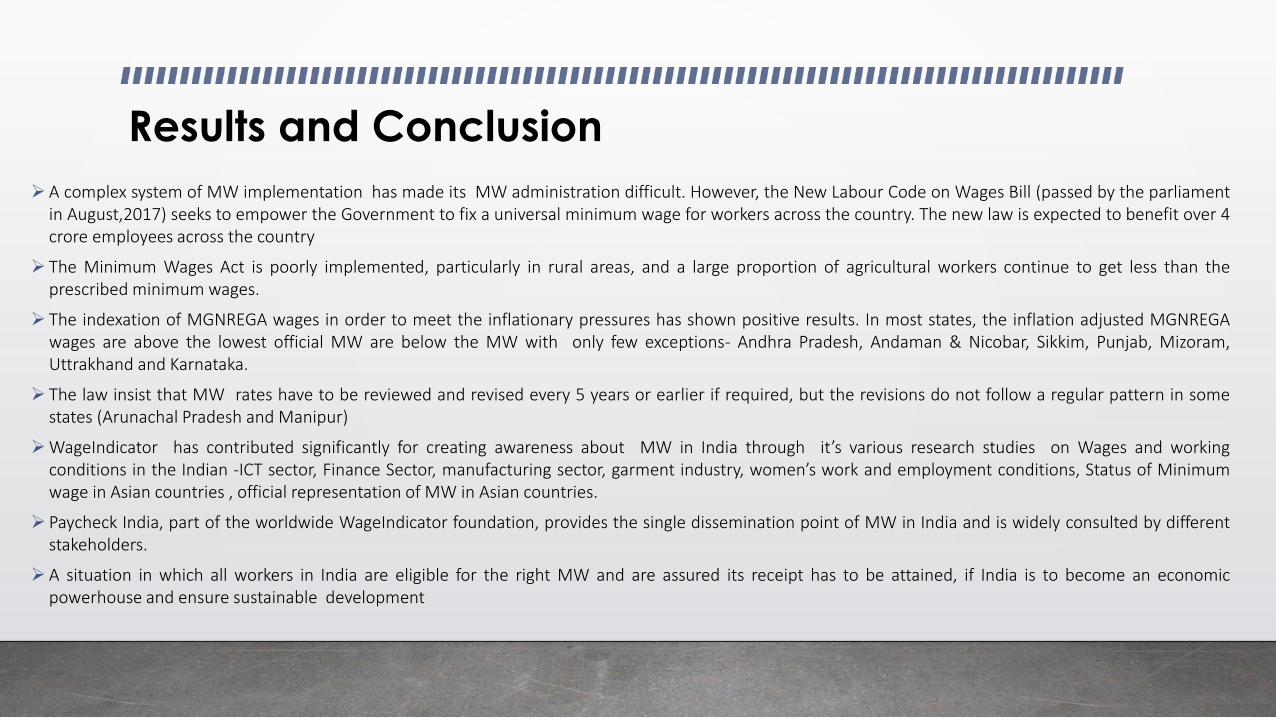
Results and Conclusion
➢ A complex system of MW implementation has made its MW administration difficult. However, the New Labour Code on Wages Bill (passed by the parliamentin August,2017) seeks to empower the Government to fix a universal minimum wage for workers across the country. The new law is expected to benefit over 4crore employees across the country
➢ The Minimum Wages Act is poorly implemented, particularly in rural areas, and a large proportion of agricultural workers continue to get less than theprescribed minimum wages.
➢ The indexation of MGNREGA wages in order to meet the inflationary pressures has shown positive results. In most states, the inflation adjusted MGNREGAwages are above the lowest official MW are below the MW with only few exceptions- Andhra Pradesh, Andaman & Nicobar, Sikkim, Punjab, Mizoram,Uttrakhand and Karnataka.
➢ The law insist that MW rates have to be reviewed and revised every 5 years or earlier if required, but the revisions do not follow a regular pattern in somestates (Arunachal Pradesh and Manipur)
➢WageIndicator has contributed significantly for creating awareness about MW in India through it’s various research studies on Wages and workingconditions in the Indian -ICT sector, Finance Sector, manufacturing sector, garment industry, women’s work and employment conditions, Status of Minimumwage in Asian countries , official representation of MW in Asian countries.
➢ Paycheck India, part of the worldwide WageIndicator foundation, provides the single dissemination point of MW in India and is widely consulted by differentstakeholders.
➢ A situation in which all workers in India are eligible for the right MW and are assured its receipt has to be attained, if India is to become an economicpowerhouse and ensure sustainable development


![6]«8 olgog cfGbf]ngsf - bishnurimal.com.np … · /fi6« a}+s sd{rf/L ;+3sf] nflu k]h 2 df3 @), @)^# Patterson's Pyramid of wage: Global Wage model 300 workers Poverty wage 100 workers](https://img.pdfslide.tips/doc/110x75/6030f253b385127d7b2282ca/68-olgog-cfgbfngsf-fi6-as-sdrfl-3sf-nflu-kh-2-df3-pattersons.jpg)