Embed Size (px)
Citation preview
Psychiatry and Clinical Neurosciences (2002), 56, 443–452
Regular Article
Minnesota Multiphasic Personality Inventory profilecharacteristics of schizotypal personality disorder
MIÉ MATSUI, phd,1 TOMIKI SUMIYOSHI, md,2 LISHA NIU, md,1
KENZO KUROKAWA, md2 AND MASAYOSHI KURACHI, md2
Departments of 1Psychology and 2Neuropsychiatry, School of Medicine,Toyama Medical and PharmaceuticalUniversity,Toyama, Japan
Abstract The goal of the present study was to determine whether precursors for psychopathology can befound in personality dimensions of the general population. Two hundred and 62 university stu-dents were compared with 41 schizophrenic patients and 18 patients with schizotypal personalitydisorder (SPD) on the Minnesota Multiphasic Personality Inventory (MMPI). Schizotypal personality disorder patients showed significantly elevated Pt and Si scales compared with theschizophrenic patients. Schizophrenia and SPD groups generally produced two-point codetypesof 6–8/8–6, 2–6/6–2, 7–8/8–7, and 7–8/8–7, 2–7/7–2, 6–8/8–6. A total of 77.5% of students had nocodetype with a T-value of ≥ 70, although the frequency of codetypes of spike 5, spike 0 and2–7/7–2 was relatively high in the student group compared with the general population. Discrimi-nant function analysis of the MMPI profiles revealed significant variance among the threegroups. The overall rate of correct classification of the subjects into schizophrenia, SPD or uni-versity students was 90.3%. The first coefficient, mainly defined by a negative weight on the Scscale, best distinguished the patients with either schizophrenia or SPD from the students. Thesecond coefficient, defined by negative weights on the Sc and Si scales, and positive weights onthe F and Ma scales identified patients with schizophrenia and SPD patients. The Harris-Lingoessubscales, which are supposed to provide the profile patterns characteristic of schizotypy, welldiscriminated the three groups. These results suggest the usefulness of the MMPI subscales forthe detection of subjects with the SPD trait.
Key words Harris-Lingoes scales, mental health, Minnesota Multiphasic Personality Inventory, psy-chopathology, schizophrenia, schizotypal personality disorder, university students.
INTRODUCTION
The Minnesota Multiphasic Personality Inventory(MMPI) is one of the widely used objective tests ofpersonality and has the ability to detect both schizo-phrenia and schizophrenia-related conditions to somedegree. It also provides transmissible indicators forthe liability to develop schizophrenia.1,2 Several previ-ous studies have attempted to determine in healthypeople whether precursors for psychopathology can
be found in personality dimensions, which are measured by the MMPI. Thus, Claridge and Beechdescribed the dimensional personality-based con-tinuity models of schizotypy and schizophrenia.3 Thismodel predicts that the trends toward psychopatho-logical personality in healthy people predisposes topsychopathology (i.e. the biological liability for schizophrenia may be expressed as schizotypal per-sonality organization).3 Some studies have attemptedto clarify in healthy people the association betweenpersonality traits as assessed by the MMPI and bio-logical markers.4–7 Recently, Matsui et al. have pro-vided evidence that in healthy people the high Scscale of the MMPI was associated with reducedfrontal white matter volume as measured by magneticresonance imaging (MRI).4 These findings suggestthat personality dimensions may be linked to someneural substrates.
Correspondence address: Mié Matsui, Department of Psychology,School of Medicine, Toyama Medical and Pharmaceutical University, 2630 Sugitani, Toyama 930-0194, Japan. Email:[email protected]
Received 29 August 2001; revised 28 November 2001; accepted 2December 2001.
444 M. Matsui et al.
Other investigators have administered several kindsof psychological tests, in addition to the MMPI, touniversity students in order to identify individualswho have schizotypal personality, and compared theMMPI profiles between subjects who were consideredto have schizotypal personality and those who werenot.8–10 Thus, Haier et al. compared results from theMMPI and those from the Research Diagnostic Criteria (RDC) in college students, and found acertain degree of correlation between specific MMPIcodetypes and the RDC evaluations.8 Similarly,Moldin et al. identified the schizophrenia-relatedcodetypes of the MMPI.11 Lenzenweger9 used thePerceptual Aberration Scale (PAS)12 as a measure ofschizotypal personality, and found that the PAS-iden-tified schizotypic students showed schizophrenia-related MMPI high-point codes more frequently thanthe controls. On the other hand, Merritt et al.10 foundno evidence for correlations between the diagnosis ofschizotypy based on the Social Anhedonia Scale(SAS)13 and the MMPI profiles.
The primary purpose of the present study was to compare the MMPI profiles, including theschizophrenia-related high-point codetypes11 in addi-tion to the individual subscales, among patients witheither schizophrenia or schizotypal personality disor-der (SPD) and university students. In addition, as thecodetypes of MMPI typically have been determinedaccording to the high-point pairs (i.e. the two highestscales with T scores of more than 70),14 we examinedall two-point codetypes and compared them betweenpatients with schizophrenia and those with SPD. Thesecond purpose was to determine the ability of theMMPI to distinguish among subjects with schizophre-nia or SPD, and normal students, using multiple dis-criminant function analyses. In view of the continuitymodels of healthy people and patients with schizo-phrenia-spectrum disorders, it is hypothesized that acertain degree of overlap between university studentsand patients with schizophrenia or SPD exists interms of the MMPI profiles. Therefore, we sought toidentify a measure of the liability to schizotypy byanalyzing the MMPI profiles. Our a priori hypothesiswas that subjects with SPD are associated with moredistress, irrational struggle, social withdrawal and soon, which are represented by the correspondingMMPI subscales and profiles, compared with patientswith schizophrenia or normal students.
METHODS
Subjects
The sample included 326 participants (59 patients and267 students). A total of 267 freshmen (115 males and
152 females) who entered Toyama Medical and Pharmaceutical University, Toyama, Japan, in 1998participated in the study. The mean age of these subjects at the time of testing was 19.2 (SD 2.1) years.
The clinical group consists of 41 patients with schizophrenia (23 males and 18 females) and 18patients with schizotypal disorder (17 males and onefemale) who meet the ICD-10 Diagnostic Criteria forResearch.15 Schizotypal disorder is characterized byeccentric behavior and anomalies of thinking andaffect which resemble those seen in schizophrenia,although no definite and characteristic schizophrenicanomalies have occurred. The clinical picture ofschizotypal disorder is similar to the prodromal stateof schizophrenia. The phenomenological differencesbetween schizotypal disorder and schizophrenia arethe absence of overt symptoms and the presence ofsustained psychotic symptoms. Eighteen patients withschizotypal disorder have never met criteria for schizophrenia itself. The mean age of schizophreniaand SPD subjects was 29.2 (SD 7.0) and 24.0 (SD 8.0)years, respectively. All patients were under 45 years ofage. The mean duration of illness for the schizophre-nia and SPD subjects was 4.6 (SD 5.1, range 0.08–21)and 2.2 (SD 2.9, range 0.02–11) years, respectively. Themean daily haloperidol-equivalent neuroleptic dosesfor schizophrenia and SPD subjects were 8.6 (SD 8.9,range 0.6–37.8) and 4.4 (SD 8.2, range 0–32.9) mg,respectively. Diagnoses were made by experiencedpsychiatrists using medical histories. All patients werephysically healthy at the time of the study, and nopatient had a history of head trauma, serious medicalor surgical illness, or substance abuse.
Personality assessment
All subjects gave informed consent before enteringthe study. The new Japanese version of MinnesotaMultiphasic Personality Inventory (MMPI) wasadministered to students as a routine mental healthcheckup during the orientation following entranceinto the university. All patients were administered thefull version of the MMPI by well-trained clinical psychologists in a quiet, comfortable, conventionallylit testing room. The MMPI is a widely used instru-ment for personality assessment with established psy-chometric properties. The new Japanese version of theMMPI was recently revised following comprehensivere-standardization in 1993.16 To date, there have beenseveral Japanese versions of the MMPI which havebeen used since the 1950s. However, they wereviewed as decreasingly applicable in contemporarysociety, as the original Japanese MMPI items andnorms were translated and developed about 40–
50 years ago. The last Japanese version had someproblems: one problem is that of mistranslation;second, there was sample bias of population for nor-malization (i.e. 80% of subjects was less than 30 yearsold); third, basic materials of normalization such aspercentage of endorsement and distribution of two-point codes have not been published. The new Japan-ese version was based on the MMPI, but not MMPI-2,as there has been vast information on the MMPI. Thenew version was developed based on considerationsof nine previous Japanese versions. Sampling for nor-malization was based on a national census. Thus, thevalidity and reliability of the new version of MMPIhave been confirmed17 and it is at present in commonuse in Japan.
Initially, we analyzed the 13 basic scores consistingof three validity and 10 clinical scores. The threevalidity scales (L, lie; F, infrequency; K, defensiveness)provide information about the subject’s approach tothe test including accuracy of the self-appraisal by the subject, which can also reveal psychopathology tosome degree.14 The 10 clinical scales provide levels ofsymptomatology in specific pathological domains andinformation on personality including hypochondriasis(Hs; code 1), depression (D; code 2), hysteria (Hy;code 3), psychopathic deviate (Pd; code 4), paranoia(Pa; code 6), psychasthenia (Pt; code 7), schizophrenia(Sc; code 8), mania (Ma; code 9), masculinity-femininity (Mf; code 5), and social introversion (Si;code 0). Second, the Harris-Lingoes and theSerkownek subscales were examined. The Harris-Lingoes subscales for depression, paranoia and schiz-ophrenia, and the Serkownek subscales for socialintroversion provide more detailed information ondomains associated with schizotypy, and allow moresubtle analysis of an individual’s clinical scale eleva-tions.14 The depression subscales include subjectivedepression (D1), psychomotor retardation (D2), phys-ical malfunctioning (D3), mental dullness (D4), andbrooding (D5). The paranoia subscales include perse-cutory ideas (Pa1), poignancy (Pa2), and naivete(Pa3). The schizophrenia subscales include socialalienation (Sc1), emotional alienation (Sc2), lack ofego mastery, cognitive (Sc3), lack of ego mastery,conative (Sc4), lack of ego mastery, defective inhibi-tion (Sc5), and bizarre sensory experiences (Sc6). Thesocial introversion subscales include inferiority-per-sonal discomfort (Si1), discomfort with others (Si2),staid-personal rigidity (Si3), hypersensitivity (Si4), dis-trust (Si5), and physical-somatic concerns (Si6).
A T score is a standard score, whose distributionhas a mean of 50 and a standard deviation of 10. Rawscores on the MMPI are converted to T scores inorder to permit interscale comparisons. K-corrected
MMPI T scores of basic scores were used in theanalyses. The frequency of individual MMPI scale elevations, as well as the ‘TOP3’, ‘Highest’, and ‘Any’,as employed by Holdnack et al.,18 was obtained pergroup (schizophrenia, schizotypal disorder and stu-dents). The scales were considered elevated when T ≥ 70. The TOP3 means that the scale is one of thethree highest elevations. The Highest means that thescale was the highest elevation in the profile, and‘Any’ shows that the scale was elevated above 70 T.
Moreover, the classification strategy employed byMoldin et al.11 was used to classify groups according toelevated profiles specific to schizophrenia spectrumdisorders. By this classification, the following code-types are regarded to be associated with the spectrumdisorders: 2-7-8, 2-8, 4-6, 4-2-8, 8-6, 8-9, 9-6, 8-3, and 8-1-3.
Statistical analysis
Multivariate analysis of variance (MANOVA) was usedfor overall analysis of the MMPI subscales followingthe previous MMPI studies.18,19 Fisher’s exact proba-bility tests were employed to examine the differencesin the frequency of scale elevations and the Moldin’scodes between schizophrenia and SPD. An alpha levelof 0.05 was used for these statistical tests.
Discriminant function analysis was performed usingthe MMPI basic scores and other scores by theHarris-Lingoes Subscales and the Serkownek Sub-scales in order to discriminate among patients withschizophrenia or schizotypal disorder, and universitystudents.
RESULTS
Group differences
Profile analysis
Basic scores: Five of 267 students (1.9%) wereexcluded from the analysis because the T scores ofthe Cannot Say (?) scale of these students werehigher than 70. Therefore, data from the remaining262 students were examined. Means and standarddeviations derived from K-corrected T scores of theMMPI 3 validity scores and 10 clinical scales arelisted in Table 1.
The MANOVAs were employed to test the hypothe-ses that the three groups (schizophrenia, SPD, andstudents group) would respond differently to theMMPI. The validity scales and clinical scales wereanalyzed separately, as was each group of the Harris-Lingoes and Serkownek subscales (e.g. depression,paranoia, schizophrenia, and social introversion).
MMPI profile characteristics of SPD 445
446 M. Matsui et al.
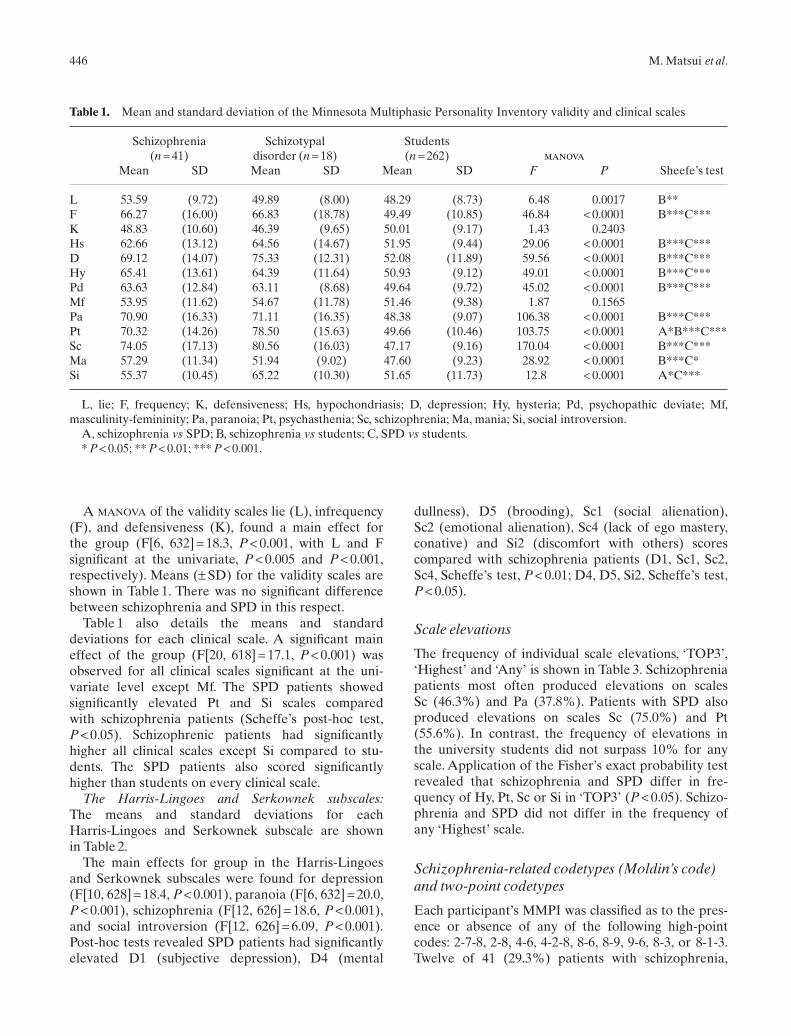
Table 1. Mean and standard deviation of the Minnesota Multiphasic Personality Inventory validity and clinical scales
Schizophrenia Schizotypal Students (n = 41) disorder (n = 18) (n = 262) manova
Mean SD Mean SD Mean SD F P Sheefe’s test
L 53.59 (9.72) 49.89 (8.00) 48.29 (8.73) 6.48 0.0017 B**F 66.27 (16.00) 66.83 (18.78) 49.49 (10.85) 46.84 < 0.0001 B***C***K 48.83 (10.60) 46.39 (9.65) 50.01 (9.17) 1.43 0.2403Hs 62.66 (13.12) 64.56 (14.67) 51.95 (9.44) 29.06 < 0.0001 B***C***D 69.12 (14.07) 75.33 (12.31) 52.08 (11.89) 59.56 < 0.0001 B***C***Hy 65.41 (13.61) 64.39 (11.64) 50.93 (9.12) 49.01 < 0.0001 B***C***Pd 63.63 (12.84) 63.11 (8.68) 49.64 (9.72) 45.02 < 0.0001 B***C***Mf 53.95 (11.62) 54.67 (11.78) 51.46 (9.38) 1.87 0.1565Pa 70.90 (16.33) 71.11 (16.35) 48.38 (9.07) 106.38 < 0.0001 B***C***Pt 70.32 (14.26) 78.50 (15.63) 49.66 (10.46) 103.75 < 0.0001 A*B***C***Sc 74.05 (17.13) 80.56 (16.03) 47.17 (9.16) 170.04 < 0.0001 B***C***Ma 57.29 (11.34) 51.94 (9.02) 47.60 (9.23) 28.92 < 0.0001 B***C*Si 55.37 (10.45) 65.22 (10.30) 51.65 (11.73) 12.8 < 0.0001 A*C***
L, lie; F, frequency; K, defensiveness; Hs, hypochondriasis; D, depression; Hy, hysteria; Pd, psychopathic deviate; Mf,masculinity-femininity; Pa, paranoia; Pt, psychasthenia; Sc, schizophrenia; Ma, mania; Si, social introversion.
A, schizophrenia vs SPD; B, schizophrenia vs students; C, SPD vs students.* P < 0.05; ** P < 0.01; *** P < 0.001.
A MANOVA of the validity scales lie (L), infrequency(F), and defensiveness (K), found a main effect forthe group (F[6, 632] = 18.3, P < 0.001, with L and F significant at the univariate, P < 0.005 and P < 0.001,respectively). Means (± SD) for the validity scales areshown in Table 1. There was no significant differencebetween schizophrenia and SPD in this respect.
Table 1 also details the means and standard deviations for each clinical scale. A significant maineffect of the group (F[20, 618] = 17.1, P < 0.001) wasobserved for all clinical scales significant at the uni-variate level except Mf. The SPD patients showed significantly elevated Pt and Si scales compared with schizophrenia patients (Scheffe’s post-hoc test,P < 0.05). Schizophrenic patients had significantlyhigher all clinical scales except Si compared to stu-dents. The SPD patients also scored significantlyhigher than students on every clinical scale.
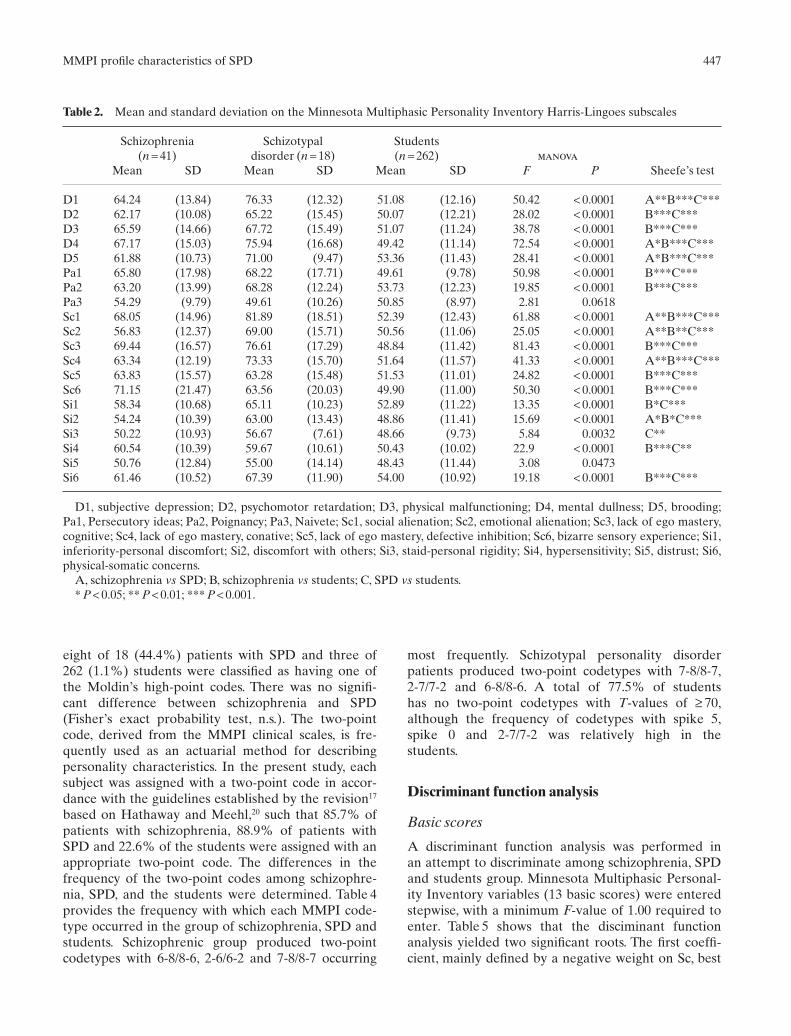
The Harris-Lingoes and Serkownek subscales:The means and standard deviations for each Harris-Lingoes and Serkownek subscale are shown in Table 2.
The main effects for group in the Harris-Lingoesand Serkownek subscales were found for depression(F[10, 628] = 18.4, P < 0.001), paranoia (F[6, 632] = 20.0,P < 0.001), schizophrenia (F[12, 626] = 18.6, P < 0.001),and social introversion (F[12, 626] = 6.09, P < 0.001).Post-hoc tests revealed SPD patients had significantlyelevated D1 (subjective depression), D4 (mental
dullness), D5 (brooding), Sc1 (social alienation),Sc2 (emotional alienation), Sc4 (lack of ego mastery,conative) and Si2 (discomfort with others) scorescompared with schizophrenia patients (D1, Sc1, Sc2,Sc4, Scheffe’s test, P < 0.01; D4, D5, Si2, Scheffe’s test,P < 0.05).
Scale elevations
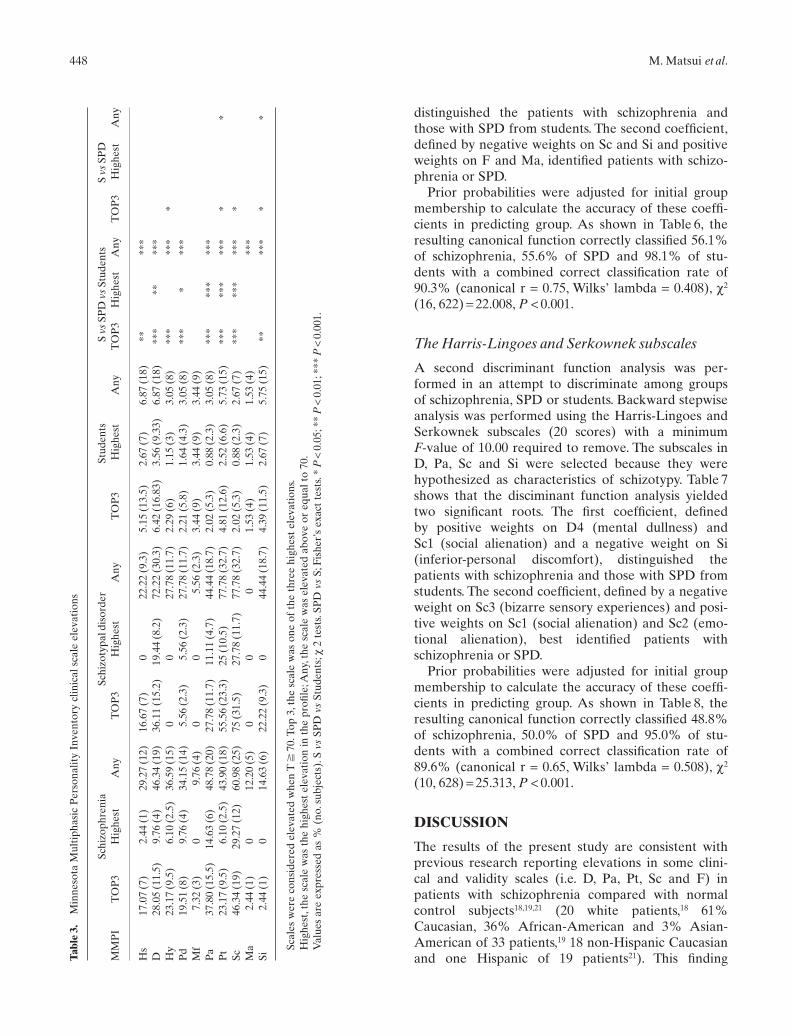
The frequency of individual scale elevations, ‘TOP3’,‘Highest’ and ‘Any’ is shown in Table 3. Schizophreniapatients most often produced elevations on scales Sc (46.3%) and Pa (37.8%). Patients with SPD alsoproduced elevations on scales Sc (75.0%) and Pt(55.6%). In contrast, the frequency of elevations inthe university students did not surpass 10% for anyscale. Application of the Fisher’s exact probability testrevealed that schizophrenia and SPD differ in fre-quency of Hy, Pt, Sc or Si in ‘TOP3’ (P < 0.05). Schizo-phrenia and SPD did not differ in the frequency ofany ‘Highest’ scale.
Schizophrenia-related codetypes (Moldin’s code)and two-point codetypes
Each participant’s MMPI was classified as to the pres-ence or absence of any of the following high-pointcodes: 2-7-8, 2-8, 4-6, 4-2-8, 8-6, 8-9, 9-6, 8-3, or 8-1-3.Twelve of 41 (29.3%) patients with schizophrenia,
eight of 18 (44.4%) patients with SPD and three of262 (1.1%) students were classified as having one ofthe Moldin’s high-point codes. There was no signifi-cant difference between schizophrenia and SPD(Fisher’s exact probability test, n.s.). The two-pointcode, derived from the MMPI clinical scales, is fre-quently used as an actuarial method for describingpersonality characteristics. In the present study, eachsubject was assigned with a two-point code in accor-dance with the guidelines established by the revision17
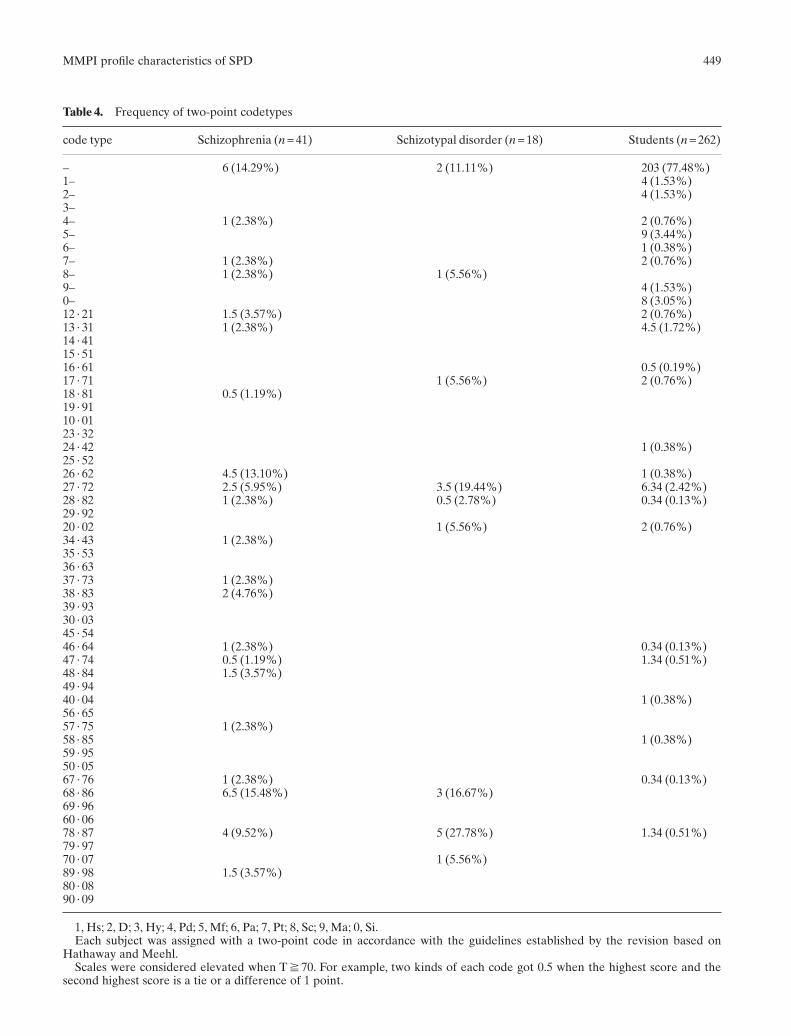
based on Hathaway and Meehl,20 such that 85.7% ofpatients with schizophrenia, 88.9% of patients withSPD and 22.6% of the students were assigned with anappropriate two-point code. The differences in thefrequency of the two-point codes among schizophre-nia, SPD, and the students were determined. Table 4provides the frequency with which each MMPI code-type occurred in the group of schizophrenia, SPD andstudents. Schizophrenic group produced two-pointcodetypes with 6-8/8-6, 2-6/6-2 and 7-8/8-7 occurring
MMPI profile characteristics of SPD 447
Table 2. Mean and standard deviation on the Minnesota Multiphasic Personality Inventory Harris-Lingoes subscales
Schizophrenia Schizotypal Students (n = 41) disorder (n = 18) (n = 262) manova
Mean SD Mean SD Mean SD F P Sheefe’s test
D1 64.24 (13.84) 76.33 (12.32) 51.08 (12.16) 50.42 < 0.0001 A**B***C***D2 62.17 (10.08) 65.22 (15.45) 50.07 (12.21) 28.02 < 0.0001 B***C***D3 65.59 (14.66) 67.72 (15.49) 51.07 (11.24) 38.78 < 0.0001 B***C***D4 67.17 (15.03) 75.94 (16.68) 49.42 (11.14) 72.54 < 0.0001 A*B***C***D5 61.88 (10.73) 71.00 (9.47) 53.36 (11.43) 28.41 < 0.0001 A*B***C***Pa1 65.80 (17.98) 68.22 (17.71) 49.61 (9.78) 50.98 < 0.0001 B***C***Pa2 63.20 (13.99) 68.28 (12.24) 53.73 (12.23) 19.85 < 0.0001 B***C***Pa3 54.29 (9.79) 49.61 (10.26) 50.85 (8.97) 2.81 0.0618Sc1 68.05 (14.96) 81.89 (18.51) 52.39 (12.43) 61.88 < 0.0001 A**B***C***Sc2 56.83 (12.37) 69.00 (15.71) 50.56 (11.06) 25.05 < 0.0001 A**B**C***Sc3 69.44 (16.57) 76.61 (17.29) 48.84 (11.42) 81.43 < 0.0001 B***C***Sc4 63.34 (12.19) 73.33 (15.70) 51.64 (11.57) 41.33 < 0.0001 A**B***C***Sc5 63.83 (15.57) 63.28 (15.48) 51.53 (11.01) 24.82 < 0.0001 B***C***Sc6 71.15 (21.47) 63.56 (20.03) 49.90 (11.00) 50.30 < 0.0001 B***C***Si1 58.34 (10.68) 65.11 (10.23) 52.89 (11.22) 13.35 < 0.0001 B*C***Si2 54.24 (10.39) 63.00 (13.43) 48.86 (11.41) 15.69 < 0.0001 A*B*C***Si3 50.22 (10.93) 56.67 (7.61) 48.66 (9.73) 5.84 0.0032 C**Si4 60.54 (10.39) 59.67 (10.61) 50.43 (10.02) 22.9 < 0.0001 B***C**Si5 50.76 (12.84) 55.00 (14.14) 48.43 (11.44) 3.08 0.0473Si6 61.46 (10.52) 67.39 (11.90) 54.00 (10.92) 19.18 < 0.0001 B***C***
D1, subjective depression; D2, psychomotor retardation; D3, physical malfunctioning; D4, mental dullness; D5, brooding;Pa1, Persecutory ideas; Pa2, Poignancy; Pa3, Naivete; Sc1, social alienation; Sc2, emotional alienation; Sc3, lack of ego mastery,cognitive; Sc4, lack of ego mastery, conative; Sc5, lack of ego mastery, defective inhibition; Sc6, bizarre sensory experience; Si1,inferiority-personal discomfort; Si2, discomfort with others; Si3, staid-personal rigidity; Si4, hypersensitivity; Si5, distrust; Si6,physical-somatic concerns.
A, schizophrenia vs SPD; B, schizophrenia vs students; C, SPD vs students.* P < 0.05; ** P < 0.01; *** P < 0.001.
most frequently. Schizotypal personality disorderpatients produced two-point codetypes with 7-8/8-7,2-7/7-2 and 6-8/8-6. A total of 77.5% of students has no two-point codetypes with T-values of ≥ 70,although the frequency of codetypes with spike 5,spike 0 and 2-7/7-2 was relatively high in the students.
Discriminant function analysis
Basic scores
A discriminant function analysis was performed in an attempt to discriminate among schizophrenia, SPDand students group. Minnesota Multiphasic Personal-ity Inventory variables (13 basic scores) were enteredstepwise, with a minimum F-value of 1.00 required toenter. Table 5 shows that the disciminant functionanalysis yielded two significant roots. The first coeffi-cient, mainly defined by a negative weight on Sc, best
448 M. Matsui et al.
distinguished the patients with schizophrenia andthose with SPD from students. The second coefficient,defined by negative weights on Sc and Si and positiveweights on F and Ma, identified patients with schizo-phrenia or SPD.
Prior probabilities were adjusted for initial groupmembership to calculate the accuracy of these coeffi-cients in predicting group. As shown in Table 6, theresulting canonical function correctly classified 56.1%of schizophrenia, 55.6% of SPD and 98.1% of stu-dents with a combined correct classification rate of90.3% (canonical r = 0.75, Wilks’ lambda = 0.408), c2
(16, 622) = 22.008, P < 0.001.
The Harris-Lingoes and Serkownek subscales
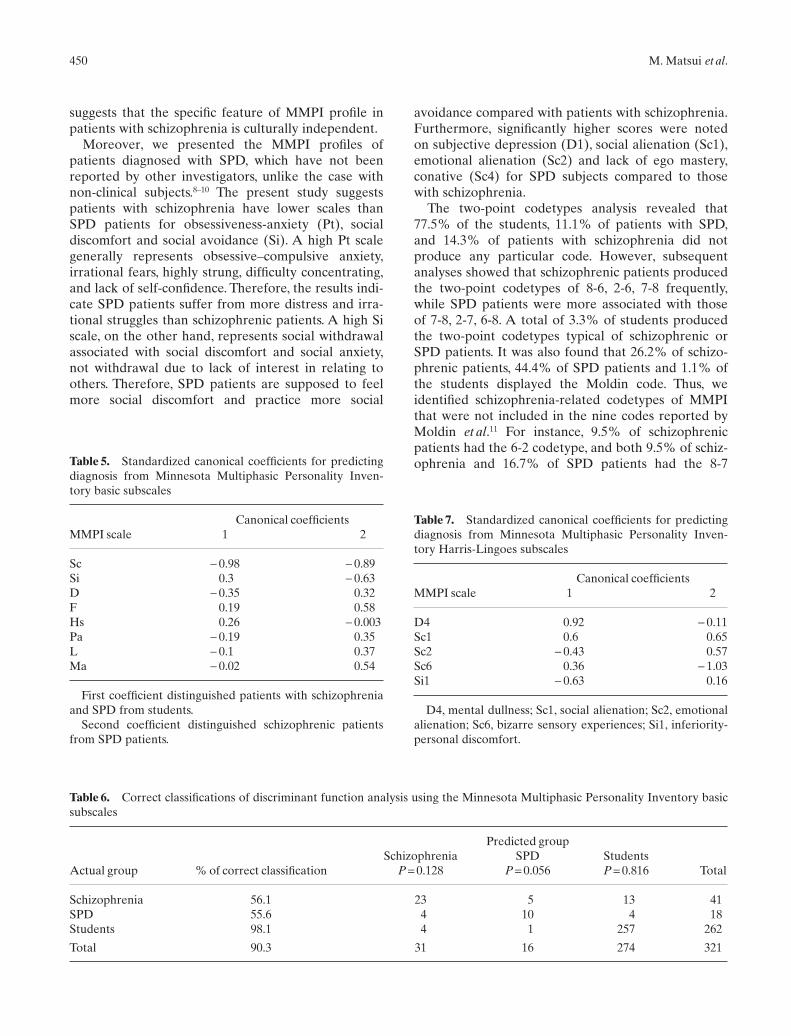
A second discriminant function analysis was per-formed in an attempt to discriminate among groupsof schizophrenia, SPD or students. Backward stepwiseanalysis was performed using the Harris-Lingoes andSerkownek subscales (20 scores) with a minimum F-value of 10.00 required to remove. The subscales inD, Pa, Sc and Si were selected because they werehypothesized as characteristics of schizotypy. Table 7shows that the disciminant function analysis yieldedtwo significant roots. The first coefficient, defined by positive weights on D4 (mental dullness) and Sc1 (social alienation) and a negative weight on Si (inferior-personal discomfort), distinguished thepatients with schizophrenia and those with SPD fromstudents. The second coefficient, defined by a negativeweight on Sc3 (bizarre sensory experiences) and posi-tive weights on Sc1 (social alienation) and Sc2 (emo-tional alienation), best identified patients withschizophrenia or SPD.
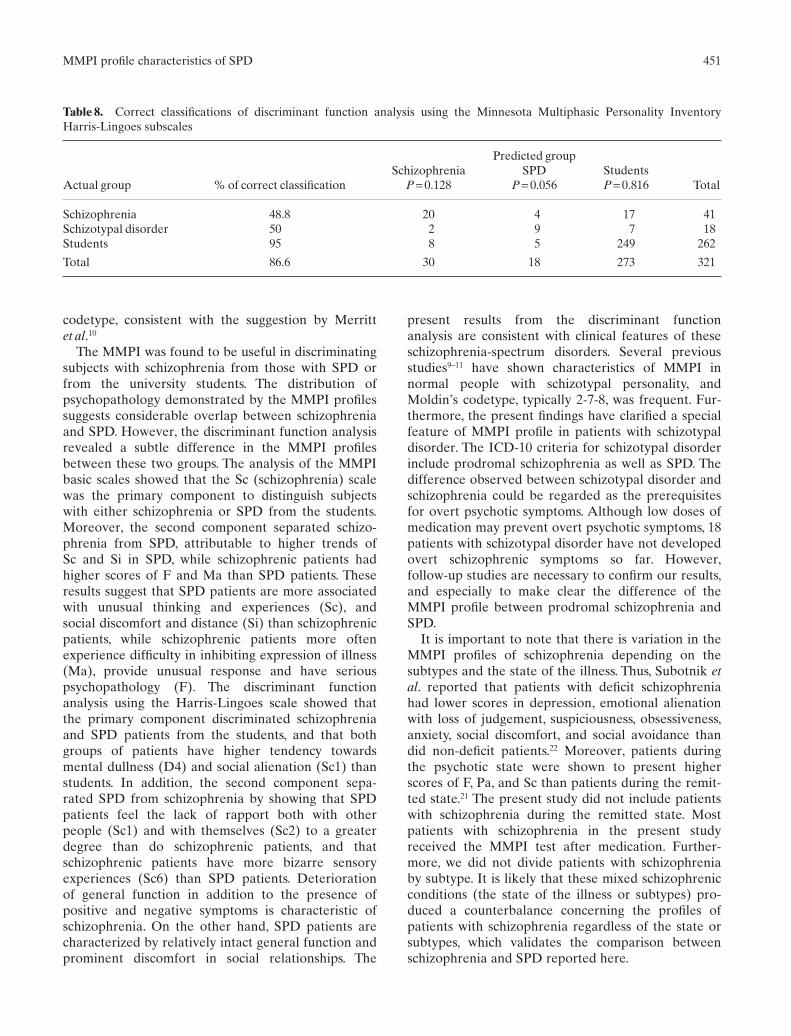
Prior probabilities were adjusted for initial groupmembership to calculate the accuracy of these coeffi-cients in predicting group. As shown in Table 8, theresulting canonical function correctly classified 48.8%of schizophrenia, 50.0% of SPD and 95.0% of stu-dents with a combined correct classification rate of89.6% (canonical r = 0.65, Wilks’ lambda = 0.508), c2
(10, 628) = 25.313, P < 0.001.
DISCUSSION
The results of the present study are consistent withprevious research reporting elevations in some clini-cal and validity scales (i.e. D, Pa, Pt, Sc and F) inpatients with schizophrenia compared with normalcontrol subjects18,19,21 (20 white patients,18 61% Caucasian, 36% African-American and 3% Asian-American of 33 patients,19 18 non-Hispanic Caucasianand one Hispanic of 19 patients21). This finding Ta
ble
3.M
inne
sota
Mul
tiph
asic
Per
sona
lity
Inve
ntor
y cl
inic
al s
cale
ele
vati
ons
Schi
zoph
reni
aSc
hizo
typa
l dis
orde
rSt
uden
tsS
vsSP
D v
sSt
uden
tsS
vsSP
DM
MP
IT
OP
3H
ighe
stA
nyT
OP
3H
ighe
stA
nyT
OP
3H
ighe
stA
nyT
OP
3H
ighe
stA
nyT
OP
3H
ighe
stA
ny
Hs
17.0
7 (7
)2.
44 (
1)29
.27
(12)
16.6
7 (7
)0
22.2
2 (9
.3)
5.15
(13
.5)
2.67
(7)
6.87
(18
)**
***
D28
.05
(11.
5)9.
76 (
4)46
.34
(19)
36.1
1 (1
5.2)
19.4
4 (8
.2)
72.2
2 (3
0.3)
6.42
(16
.83)
3.56
(9.
33)
6.87
(18
)**
***
***
Hy
23.1
7 (9
.5)
6.10
(2.
5)36
.59
(15)
00
27.7
8 (1
1.7)
2.29
(6)
1.15
(3)
3.05
(8)
***
***
*P
d19
.51
(8)
9.76
(4)
34.1
5 (1
4)5.
56 (
2.3)
5.56
(2.
3)27
.78
(11.
7)2.
21 (
5.8)
1.64
(4.
3)3.
05 (
8)**
**
***
Mf
7.32
(3)
09.
76 (
4)0
05.
56 (
2.3)
3.44
(9)
3.44
(9)
3.44
(9)
Pa
37.8
0 (1
5.5)
14.6
3 (6
)48
.78
(20)
27.7
8 (1
1.7)
11.1
1 (4
.7)
44.4
4 (1
8.7)
2.02
(5.
3)0.
88 (
2.3)
3.05
(8)
***
***
***
Pt
23.1
7 (9
.5)
6.10
(2.
5)43
.90
(18)
55.5
6 (2
3.3)
25 (
10.5
)77
.78
(32.
7)4.
81 (
12.6
)2.
52 (
6.6)
5.73
(15
)**
***
***
**
*Sc
46.3
4 (1
9)29
.27
(12)
60.9
8 (2
5)75
(31
.5)
27.7
8 (1
1.7)
77.7
8 (3
2.7)
2.02
(5.
3)0.
88 (
2.3)
2.67
(7)
***
***
***
*M
a2.
44 (
1)0
12.2
0 (5
)0
00
1.53
(4)
1.53
(4)
1.53
(4)
***
Si2.
44 (
1)0
14.6
3 (6
)22
.22
(9.3
)0
44.4
4 (1
8.7)
4.39
(11
.5)
2.67
(7)
5.75
(15
)**
***
**
Scal
es w
ere
cons
ider
ed e
leva
ted
whe
n T
�70
.Top
3,t
he s
cale
was
one
of
the
thre
e hi
ghes
t el
evat
ions
.H
ighe
st,t
he s
cale
was
the
hig
hest
ele
vati
on in
the
pro
file;
Any
,the
sca
le w
as e
leva
ted
abov
e or
equ
al t
o 70
.V
alue
s ar
e ex
pres
sed
as %
(no
.sub
ject
s).S
vs
SPD
vs
Stud
ents
;c2
test
s.SP
D v
sS;
Fish
er’s
exa
ct t
ests
.*P
<0.
05;*
*P
<0.
01;*
**P
<0.
001.
MMPI profile characteristics of SPD 449
Table 4. Frequency of two-point codetypes
code type Schizophrenia (n = 41) Schizotypal disorder (n = 18) Students (n = 262)
– 6 (14.29%) 2 (11.11%) 203 (77.48%)1– 4 (1.53%)2– 4 (1.53%)3–4– 1 (2.38%) 2 (0.76%)5– 9 (3.44%)6– 1 (0.38%)7– 1 (2.38%) 2 (0.76%)8– 1 (2.38%) 1 (5.56%)9– 4 (1.53%)0– 8 (3.05%)12 · 21 1.5 (3.57%) 2 (0.76%)13 · 31 1 (2.38%) 4.5 (1.72%)14 · 4115 · 5116 · 61 0.5 (0.19%)17 · 71 1 (5.56%) 2 (0.76%)18 · 81 0.5 (1.19%)19 · 9110 · 0123 · 3224 · 42 1 (0.38%)25 · 5226 · 62 4.5 (13.10%) 1 (0.38%)27 · 72 2.5 (5.95%) 3.5 (19.44%) 6.34 (2.42%)28 · 82 1 (2.38%) 0.5 (2.78%) 0.34 (0.13%)29 · 9220 · 02 1 (5.56%) 2 (0.76%)34 · 43 1 (2.38%)35 · 5336 · 6337 · 73 1 (2.38%)38 · 83 2 (4.76%)39 · 9330 · 0345 · 5446 · 64 1 (2.38%) 0.34 (0.13%)47 · 74 0.5 (1.19%) 1.34 (0.51%)48 · 84 1.5 (3.57%)49 · 9440 · 04 1 (0.38%)56 · 6557 · 75 1 (2.38%)58 · 85 1 (0.38%)59 · 9550 · 0567 · 76 1 (2.38%) 0.34 (0.13%)68 · 86 6.5 (15.48%) 3 (16.67%)69 · 9660 · 0678 · 87 4 (9.52%) 5 (27.78%) 1.34 (0.51%)79 · 9770 · 07 1 (5.56%)89 · 98 1.5 (3.57%)80 · 0890 · 09
1, Hs; 2, D; 3, Hy; 4, Pd; 5, Mf; 6, Pa; 7, Pt; 8, Sc; 9, Ma; 0, Si.Each subject was assigned with a two-point code in accordance with the guidelines established by the revision based on
Hathaway and Meehl.Scales were considered elevated when T � 70. For example, two kinds of each code got 0.5 when the highest score and the
second highest score is a tie or a difference of 1 point.
450 M. Matsui et al.
suggests that the specific feature of MMPI profile inpatients with schizophrenia is culturally independent.
Moreover, we presented the MMPI profiles ofpatients diagnosed with SPD, which have not beenreported by other investigators, unlike the case withnon-clinical subjects.8–10 The present study suggestspatients with schizophrenia have lower scales thanSPD patients for obsessiveness-anxiety (Pt), socialdiscomfort and social avoidance (Si). A high Pt scalegenerally represents obsessive–compulsive anxiety,irrational fears, highly strung, difficulty concentrating,and lack of self-confidence. Therefore, the results indi-cate SPD patients suffer from more distress and irra-tional struggles than schizophrenic patients. A high Siscale, on the other hand, represents social withdrawalassociated with social discomfort and social anxiety,not withdrawal due to lack of interest in relating toothers. Therefore, SPD patients are supposed to feelmore social discomfort and practice more social
avoidance compared with patients with schizophrenia.Furthermore, significantly higher scores were notedon subjective depression (D1), social alienation (Sc1),emotional alienation (Sc2) and lack of ego mastery,conative (Sc4) for SPD subjects compared to thosewith schizophrenia.
The two-point codetypes analysis revealed that77.5% of the students, 11.1% of patients with SPD,and 14.3% of patients with schizophrenia did notproduce any particular code. However, subsequentanalyses showed that schizophrenic patients producedthe two-point codetypes of 8-6, 2-6, 7-8 frequently,while SPD patients were more associated with thoseof 7-8, 2-7, 6-8. A total of 3.3% of students producedthe two-point codetypes typical of schizophrenic orSPD patients. It was also found that 26.2% of schizo-phrenic patients, 44.4% of SPD patients and 1.1% ofthe students displayed the Moldin code. Thus, weidentified schizophrenia-related codetypes of MMPIthat were not included in the nine codes reported byMoldin et al.11 For instance, 9.5% of schizophrenicpatients had the 6-2 codetype, and both 9.5% of schiz-ophrenia and 16.7% of SPD patients had the 8-7Table 5. Standardized canonical coefficients for predicting
diagnosis from Minnesota Multiphasic Personality Inven-tory basic subscales
Canonical coefficientsMMPI scale 1 2
Sc - 0.98 - 0.89Si 0.3 - 0.63D - 0.35 0.32F 0.19 0.58Hs 0.26 - 0.003Pa - 0.19 0.35L - 0.1 0.37Ma - 0.02 0.54
First coefficient distinguished patients with schizophreniaand SPD from students.
Second coefficient distinguished schizophrenic patientsfrom SPD patients.
Table 6. Correct classifications of discriminant function analysis using the Minnesota Multiphasic Personality Inventory basicsubscales
Predicted groupSchizophrenia SPD Students
Actual group % of correct classification P = 0.128 P = 0.056 P = 0.816 Total
Schizophrenia 56.1 23 5 13 41SPD 55.6 4 10 4 18Students 98.1 4 1 257 262
Total 90.3 31 16 274 321
Table 7. Standardized canonical coefficients for predictingdiagnosis from Minnesota Multiphasic Personality Inven-tory Harris-Lingoes subscales
Canonical coefficientsMMPI scale 1 2
D4 0.92 - 0.11Sc1 0.6 0.65Sc2 - 0.43 0.57Sc6 0.36 - 1.03Si1 - 0.63 0.16
D4, mental dullness; Sc1, social alienation; Sc2, emotionalalienation; Sc6, bizarre sensory experiences; Si1, inferiority-personal discomfort.
codetype, consistent with the suggestion by Merritt et al.10
The MMPI was found to be useful in discriminatingsubjects with schizophrenia from those with SPD orfrom the university students. The distribution of psychopathology demonstrated by the MMPI profilessuggests considerable overlap between schizophreniaand SPD. However, the discriminant function analysisrevealed a subtle difference in the MMPI profilesbetween these two groups. The analysis of the MMPIbasic scales showed that the Sc (schizophrenia) scalewas the primary component to distinguish subjectswith either schizophrenia or SPD from the students.Moreover, the second component separated schizo-phrenia from SPD, attributable to higher trends of Sc and Si in SPD, while schizophrenic patients hadhigher scores of F and Ma than SPD patients. Theseresults suggest that SPD patients are more associatedwith unusual thinking and experiences (Sc), and social discomfort and distance (Si) than schizophrenicpatients, while schizophrenic patients more oftenexperience difficulty in inhibiting expression of illness(Ma), provide unusual response and have serious psychopathology (F). The discriminant function analysis using the Harris-Lingoes scale showed thatthe primary component discriminated schizophreniaand SPD patients from the students, and that bothgroups of patients have higher tendency towardsmental dullness (D4) and social alienation (Sc1) thanstudents. In addition, the second component sepa-rated SPD from schizophrenia by showing that SPDpatients feel the lack of rapport both with otherpeople (Sc1) and with themselves (Sc2) to a greaterdegree than do schizophrenic patients, and that schizophrenic patients have more bizarre sensoryexperiences (Sc6) than SPD patients. Deterioration of general function in addition to the presence of positive and negative symptoms is characteristic ofschizophrenia. On the other hand, SPD patients arecharacterized by relatively intact general function andprominent discomfort in social relationships. The
present results from the discriminant function analysis are consistent with clinical features of theseschizophrenia-spectrum disorders. Several previousstudies9–11 have shown characteristics of MMPI innormal people with schizotypal personality, andMoldin’s codetype, typically 2-7-8, was frequent. Fur-thermore, the present findings have clarified a specialfeature of MMPI profile in patients with schizotypaldisorder. The ICD-10 criteria for schizotypal disorderinclude prodromal schizophrenia as well as SPD. Thedifference observed between schizotypal disorder andschizophrenia could be regarded as the prerequisitesfor overt psychotic symptoms. Although low doses ofmedication may prevent overt psychotic symptoms, 18patients with schizotypal disorder have not developedovert schizophrenic symptoms so far. However,follow-up studies are necessary to confirm our results,and especially to make clear the difference of theMMPI profile between prodromal schizophrenia andSPD.
It is important to note that there is variation in theMMPI profiles of schizophrenia depending on thesubtypes and the state of the illness. Thus, Subotnik etal. reported that patients with deficit schizophreniahad lower scores in depression, emotional alienationwith loss of judgement, suspiciousness, obsessiveness,anxiety, social discomfort, and social avoidance thandid non-deficit patients.22 Moreover, patients duringthe psychotic state were shown to present higherscores of F, Pa, and Sc than patients during the remit-ted state.21 The present study did not include patientswith schizophrenia during the remitted state. Mostpatients with schizophrenia in the present studyreceived the MMPI test after medication. Further-more, we did not divide patients with schizophreniaby subtype. It is likely that these mixed schizophrenicconditions (the state of the illness or subtypes) pro-duced a counterbalance concerning the profiles ofpatients with schizophrenia regardless of the state orsubtypes, which validates the comparison betweenschizophrenia and SPD reported here.
MMPI profile characteristics of SPD 451
Table 8. Correct classifications of discriminant function analysis using the Minnesota Multiphasic Personality InventoryHarris-Lingoes subscales
Predicted groupSchizophrenia SPD Students
Actual group % of correct classification P = 0.128 P = 0.056 P = 0.816 Total
Schizophrenia 48.8 20 4 17 41Schizotypal disorder 50 2 9 7 18Students 95 8 5 249 262
Total 86.6 30 18 273 321
452 M. Matsui et al.
There are several limitations of the present studythat should be taken into account. Five out of 262(1.9%) students were classified into patients (eitherschizophrenia or SPD) by the discriminant functionanalysis. Although this indicates specificity fairly well,it is possible that a limited degree of personality deviation characteristics of schizophrenia or SPD ispresent in normal population.
The MMPI is a useful tool for identifying people,including university students, who have problemsrelated to mental health. The results of the presentstudy suggest that the MMPI also provides a windowinto the internal world of patients with either schizo-phrenia or SPD, for whom a standard clinical inter-view alone is not sufficient to grasp. Although theclinical and validity scales of the MMPI were found tobe sensitive to general psychopathology characteris-tics of the psychotic groups, SPD was best distin-guished by the specific patterns of elevations on theHarris-Lingoes subscales.
ACKNOWLEDGEMENTS
This study was supported by a Grant-in-Aid forExploratory Research, 12871016 (DrMatsui) from theMinistry of Education, Science, Sports and Culture ofJapan.
REFERENCES
1. Walters GD. The MMPI and schizophrenia: review.Schizophr. Bull. 1983; 9: 226–246.
2. Carter JW, Parnas J, Cannon TD, Schulsinger F,Mednick SA. MMPI variables predictive of schizophre-nia in the Copenhagen high-risk project: a 25-yearfollow-up. Acta Psychiatr. Scand. 1999; 99: 432–440.
3. Claridge G, Beech T. Fully and quasi-dimensional con-structions of schizotypy. In: Raine A, Lencz T, MednickSA (eds). Schizotypal Personality. Cambridge Univer-sity Press, New York, 1995; 192–216.
4. Matsui M, Gur RC, Turetsky BI, Yan M, Gur RE. Therelation between tendency for psychopathology andreduced frontal brain volume in healthy people.Neuropsychiatry, Neuropsychol. Behav. Neurol. 2000; 13:155–162.
5. Haier RJ, Murphy DL, Buchsbaum MS. Paranoia andplatelet MAO in normals and nonschizophrenic psychi-atric groups. Am. J. Psychiatry 1979; 136: 308–310.
6. Haier RJ, Buchsbaum MS, Murphy DL, Gottesman II,Coursey RD. Psychiatric vulnerability, monoamineoxidase, and the average evoked potential. Arch. Gen.Psychiatry 1980; 37: 340–345.
7. Ogura C, Hirano K, Nageishi Y et al. Deviate P200 andP300 in non-patient college students with high scores onthe schizophrenia scale of the Minnesota MultiphasicPersonality Inventory (MMPI). Int. J. Psychophysiol.1994; 16: 89–97.
8. Haier RJ, Rieder RO, Khouri PJ, Buchsbaum MS.Extreme MMPI scores and the Research DiagnosticCriteria. Screening college men for psychopathology.Arch. Gen. Psychiatry 1979; 36: 528–534.
9. Lenzenweger MF. Confirming schizotypic personalityconfigurations in hypothetically psychosis-prone univer-sity students. Psychiatry Res. 1991; 37: 81–96.
10. Merritt RD, Balogh DW, DeVinney SE. Use of theMMPI to assess the construct validity of the revisedsocial anhedonia scale as an index of schizotypy. J.Personality Assessment 1993; 60: 227–238.
11. Moldin SO, Gottesman II, Erlenmeyer-Kimling L.Psychometric validation of psychiatric diagnoses in theNew York High-Risk study. Psychiatry Res. 1987; 22:159–177.
12. Chapman LJ, Chapman JP, Raulin ML. Body-imageaberration in schizophrenia. J. Abnorm. Psychol. 1978;87: 399–407.
13. Chapman LJ, Chapman JP, Raulin ML. Scales for physi-cal and social anhedonia. J. Abnorm. Psychol. 1976; 85:374–382.
14. Greene RL. The MMPI-2/MMPI. An InterpretiveManual. Allyn & Bacon, Boston, 1991.
15. World Health Organization. The ICD-10 Classificationof Mental and Behavioral Disorders: Diagnostic Criteriafor Research. World Health Organization, Geneva, 1993.
16. New Japanese MMPI Committee. Manual for the NewJapanese Minnesota Multiphasic Personality Inventory.San-Kyo-Bo, Kyoto, 1993 (in Japanese).
17. New Japanese MMPI Committee. Study of Standardiza-tion for the New Japanese MMPI. San-Kyo-Bo, Kyoto,1997 (in Japanese).
18. Holdnack JA, Moberg PJ, Arnold SE, Gur RE, Gur RC.MMPI characteristics in adults diagnosed with ADD. Apreliminary report. Int. J. Neurosci. 1994; 79: 47–58.
19. Coleman AR, Norstrand JA, Moberg PJ, Kohler CG,Gur RC, Gur RE. MMPI-2 characteristics of adultsdiagnosed with attention deficit disorder. Int. J. Neu-rosci. 1998; 96: 161–175.
20. Hathaway SR, Meehl PE. An Atlas for the Clinical Use of the MMPI. University of Minnesota Press,Minneapolis, 1951.
21. Subotnik KL, Nuechterlein KH, Green MF. Trait versus state aspects of the MMPI during the earlycourse of schizophrenia. J. Psychiatric Res. 1999; 33:275–284.
22. Subotnik KL, Nuechterlein KH, Ventura J. MMPI discriminators of deficit vs. non-deficit recent-onsetschizophrenia patients. Psychiatry Res. 2000; 93:111–123.