Embed Size (px)
Citation preview
Harold CoulombeThomas Otter
National Statistical Office (NSO) United Nations Development Programme (UNDP)
MONGOLIA CENSUS-BASED MONGOLIA CENSUS-BASED
POVERTY MAP:POVERTY MAP:
Region, Aimag and Soum Level Results
March 2009
ͯÁ-ÛÍ ÕªÃÆËÈÉÍ ÕªÒªËÁªÐÈÉÍ “ßÄÓÓÐËÛÍ ÑÓÄÀËÃÀÀ, ժĪË̪РÝÐÕËÝËÒÈÉÃ
ÄÝÌÆÈÕ ÁÎÄËÎÃÛà ժÃƯ¯ËÝÕ” ҪѪË
MongoliaGovernment of Mongolia
Harold CoulombeThomas Otter
National Statistical Offi ce (NSO) United Nations Development Programme (UNDP)
MONGOLIA CENSUS-BASED POVERTY MAP:
Region, Aimag and Soum Level Results
March 2009
MONGOLIA CENSUS-BASED POVERTY MAPRegion, Aimag and Soum Level Results
3
ABSTRACT
This paper documents the construction and presents the main results of a poverty map of Mongolia based on the LSMS 2002/03 survey and the Census 2000. The methodology takes advantages of detailed information found in the survey and the exhaustive coverage of the census. It permits the calculation of poverty indicators at low levels of desegregation; aimag and soum in the case of Mongolia. The heterogeneity of the country in terms of poverty across aimag and soum should make the poverty map a useful statistical tool in any poverty alleviating programmes or projects. Our aimag-level results are also broken down by gender of household head.
MONGOLIA CENSUS-BASED POVERTY MAP:
Region, Aimag and Soum Level Results1
1 This project was funded by the United Nation Development Programme (UNDP). The work was undertaken by Harold Coulombe and Thomas Otter (consultants) with full support from the National Statistic Office (NSO) staff, in particular Mr. BYAMBATSEREN Pandi (Chairman), Mr. DAGVADORJ CH, (General Manager), Mrs. OYUNCHIMEG Dandar (Head of Population and Social Statistics Department), Mrs TSERENKHAND Bideriya (Head of Data Processing and Technology Department), Mrs. AMARTUVSHIN Tserennadmid (Senior Officer, Population and Social Statistics Department) and Mr. DAVAAJARGAL Davaatseren (Officer, Population and Social Statistics Department). GIS issues were kindly solved by Mr. MYAGMARSUREN L from NSO Information Technology Department. We would also thanks Mrs Doljinsuren Jambal and Mrs Tsetsgee Puntsag from UNDP to make that project possible. The authors can be reached at [email protected].
Ministry of Social Welfare and Labour, 3rd Floor, Room 301, Government Building 2, United Nations Street -44, Ulaanbaatar -46, Mongolia, Phone/Fax: (976) 11 318637; Phone: (976) 11 319177
UNDP PROJECT “POVERTY RESEARCH AND EMPLOYMENT FACILITATION FOR POLICY DEVELOPMENT” II
MONGOLIA CENSUS-BASED POVERTY MAPRegion, Aimag and Soum Level Results
4
MONGOLIA CENSUS-BASED POVERTY MAPRegion, Aimag and Soum Level Results
5
INTRODUCTION
1. This paper documents the construction and shows some results of a poverty map based on data from the 2002/03 Living Standards Measurement Survey (LSMS) and the Housing & Population Census 2000. Based on a methodology developped by Elbers et al. (2002, 2003), we calculate poverty indicators at low levels of aggregation, using the detailed information found in the survey and the exhaustive coverage of the Census. Results at region, aimag and soum levels are presented.
2. In the past decade poverty profi les2 have been developed into useful tools to characterize, assess and monitor poverty. Based on information collected in household surveys, including detailed information on expenditures and incomes, those profi les present the characteristics of the population according to their level of - monetary and non-monetary - standard of living, help assessing the poverty reducing effect of some policies and compare poverty level between regions, groups or over time. While these household survey-based studies have greatly improved our knowledge of welfare level of households in general and of the poorer ones in particular, the approach has a number of limitations. In particular, policy makers and planners need fi nely disaggregated information in order to implement their anti-poverty schemes. Typically they need information for small geographic units such as city neighbourhoods, towns or even villages. Telling a Mongolian policy maker that the neediest people are in the rural areas would not be too impressive as that information is well known and not useful since it would be too vague; telling them in which aimags or even soums the poorest households are concentrated would be more useful and convincing! Using aimag-level information often hides the existence of poverty pockets in otherwise relatively well-off aimag which would lead to poorly targeted schemes if soum-level information is not used. Having better information at local level would necessarily minimize leaks and therefore permit more cost-effective and effi cient anti-poverty schemes. Poverty indicators are needed at a local level as spatial inequalities can be important within a given region.
3. The methodology used have been developed by Elbers, Lanjouw and Lanjouw (2002, 2003) and should be seen as more sophisticated than other methods3 as it uses information on household expenditure, is fully consistent with poverty profi le fi gures, and permits the computation of standard errors of those poverty indicators. Since those types of poverty maps are fully compatible with poverty profi le results, they should be seen as a natural extension to poverty profi les, a way to operationalise poverty profi le results. This report documents the construction of the Mongolia poverty map but the map would reach its full potential once a series of applications under consideration would be undertaken.
4. The remaining of this paper is structured as follow: we fi rst present the methodology in layman words, follow by a description of the data used. The paper ends by a discussion of the results – including gender-specifi c ones – and on furthers work to undertake. A more technical presentation of the methodology can be found in Annex 1; along with some more detailed results (Annexes 2 to 4).
METHODOLOGY4
5. The basic idea behind the methodology is rather straightforward. First a regression model of per capita expenditure is estimated using LSMS survey data, limiting the set of explanatory variables to those which are common to both that survey and the latest Census. Next, the coeffi cients from that model are applied to the Census data set to predict the expenditure level of every household in the Census. And fi nally, these predicted household expenditures are used to construct a series of welfare indicators (e.g. poverty level, depth, severity, inequality) for different geographical subgroups.
6. Although it is conceptually simple, its proper implementation requires complex computations. Those complexities are mainly coming from the need to take into account spatial autocorrelation (expenditure from households within the same local area are correlated) and heteroskedasticity in the development of the predictive model. Taking into account those econometric issues insure unbiased predictions. A further issue making computation non-trivial is our willingness to compute standard errors for each welfare statistics. Those standard errors are important since they would tell us how low we can disaggregate the poverty indicators. As we disaggregate our results at lower and lower levels, the number of households on which the econometric models are based decrease as well and therefore yield less and less precise estimates. At a certain point, the estimated poverty indicators would become too imprecise to be used with confi dence. The computation of those standard errors would help us to decide where to stop the disaggregation process. The methodology used is further discussed in Annex 1.
DATA
7. The construction of such poverty maps is very demanding in terms of data. The uttermost requirement is a household survey having an expenditure module and a population and housing census. If not already done, a monetary-based poverty profi le would have to be constructed from the survey. The household-level welfare index and the poverty line from such poverty profi le would be used in the construction of the poverty maps. Apart from household-level information, community level characteristics is also useful in the construction of poverty map as differences in geography, history, ethnicity, access to markets, public services and infrastructure, and other aspects of public policy can all lead to important differences in standard of living, defi ned in monetary terms or not. In the case of Mongolia, some of that information was available.
Census:
8. The latest Population and Housing Census was conducted in January 2000. The questionnaire is relatively detailed but does not contain any information on neither household incomes nor household expenditures. At the individual level, it covers demography, education and economic activities. At the household level, dwelling characteristics are covered. The Census database turns out more than 2.2 million individuals grouped into around 541,000 households. The Census fi eld
2 See NSO (2004) for the latest published poverty profile in Mongolia.3 See Henninger (1998) for a review of the different mapping techniques.
4 The methodology has been applied to a myriad of developing countries, including in Asia. For example, Coulombe and Wodon (2007) described the West and Central Africa Poverty Map Initiative in which 15 countries participated.
MONGOLIA CENSUS-BASED POVERTY MAPRegion, Aimag and Soum Level Results
6
MONGOLIA CENSUS-BASED POVERTY MAPRegion, Aimag and Soum Level Results
7
work grouped households into around 11,000 enumeration areas (EAs) of 50 households each on average.
LSMS Survey:
9. The Living Standard Measurement Survey is a national survey having collected expenditure data at household level. Having been administrated in 2002/03, it is also the most appropriate survey time wise. It also collected information similar to the one found in the Census questionnaire.
10. The welfare index to be used in our regression models (per capita expenditure) is the same as the one used in the Government-sponsored poverty profi le based on the LSMS database (NSO, 2004). Using the same household-level welfare index and the associated poverty lines would ensure full consistency between that poverty profi le and the new poverty map. It will also permit to test whether the predicted poverty indicators match those found in the poverty profi le at strata level, the lowest statistically robust level achievable in LSMS.
Administrative Layers
11. The administrative structure of Mongolia is rather straightforward. The top tier is composed of 21 aimags and the Capital City regouped into fi ve regions while 331 soums ands the nine Capital’s districts make the lower level administrative level. Table 1 presents some descriptive statistics on the size of those different administrative levels. The different aimag vary a lot in terms of population, from Govisumber with only 12,449 people to the capital of the country having close to 773,000 individuals in 2000. Those 22 aimags/capital can be further divided into 340 soums/districts. The population of the different soums/districts vary tremendously between small rural soum like Choir (873 people) to the largest Ulaanbaatar district, namely Songinokhairkhan.
Table 1: Descriptive Statistics on the Mongolian Administrative Structure
Administrative # of Number of Households Number of Individuals
Unit Units Median Minimum Maximum Median Minimum Maximum
Region 5 104,914 47,464 159,991 445,613 205,395 772,969
Aimag (see note) 22 18,708 2,953 159,991 85,328 12,449 772,969
Soum (see note) 340 770 207 31,962 3,270 873 159,346
Note: For our analysis, we consider Ulaanbaatar’s nine districts as soums, and the Capital City as an Aimag. From an administrative point of view, Ulaanbaatar is at the same level as Aimags, and both soums and the capital’s districts are sub-aimag administrative level.Source: Authors’ calculation based on the Census 2000
RESULTS
12. In order to maximise accuracy of the poverty estimates we have estimated the model at the lowest geographical level for which the LSMS survey is deemed representative; the four strata used in the sampling design: Ulaan Baatar, Aimag Center, Soum Center and Countryside. A household level expenditure model has been developed for each of these strata using explanatory variables which are common to both the LSMS and the Census.
Stage 1: Aligning the data
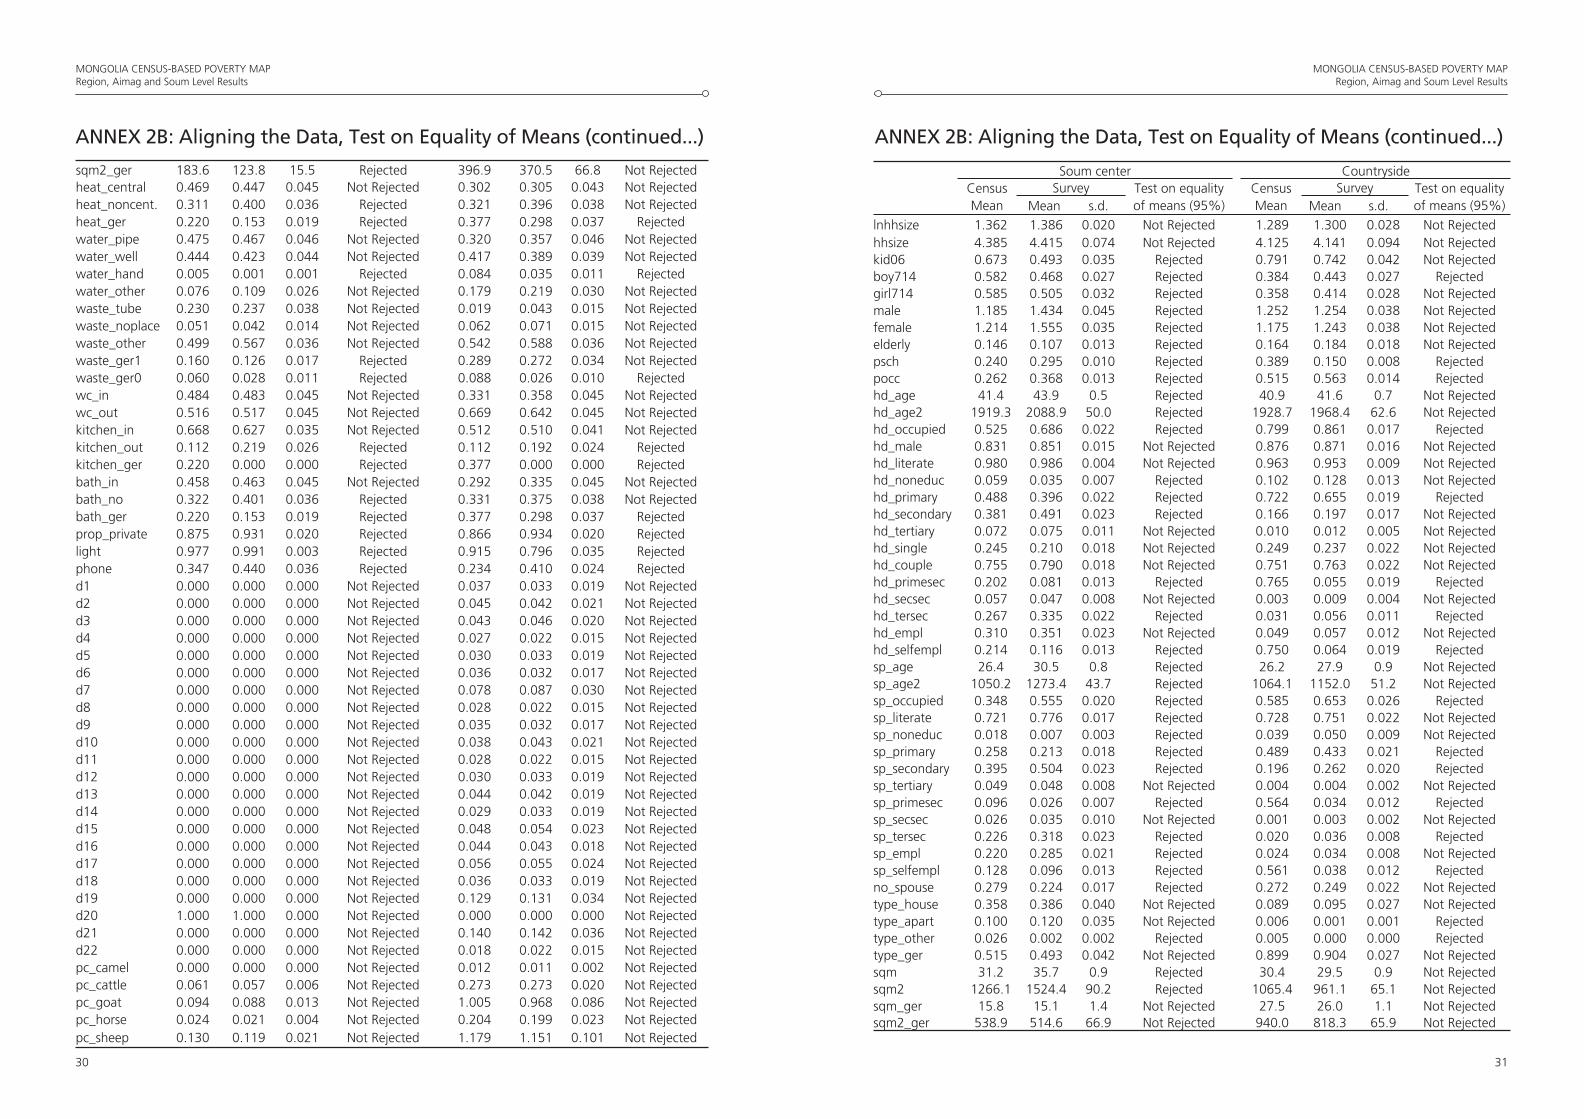
13. The fi rst task was to make sure the variables deemed common to both the census and the survey were really measuring the same characteristics. In the fi rst instance, we compared the questions and modalities in both questionnaires to isolate potential variables. We then compared the means of those (dichotomized) variables and tested whether they were equal using a 95% confi dence interval. Restricting ourselves to those variables should ensure the predicted welfare fi gures would be consistent with survey-based poverty profi le5. As noted above that comparison exercise was done at strata level. The two-stage sample design of the survey was taken into account in the computation of the standard errors. The results are presented in Annex 2.
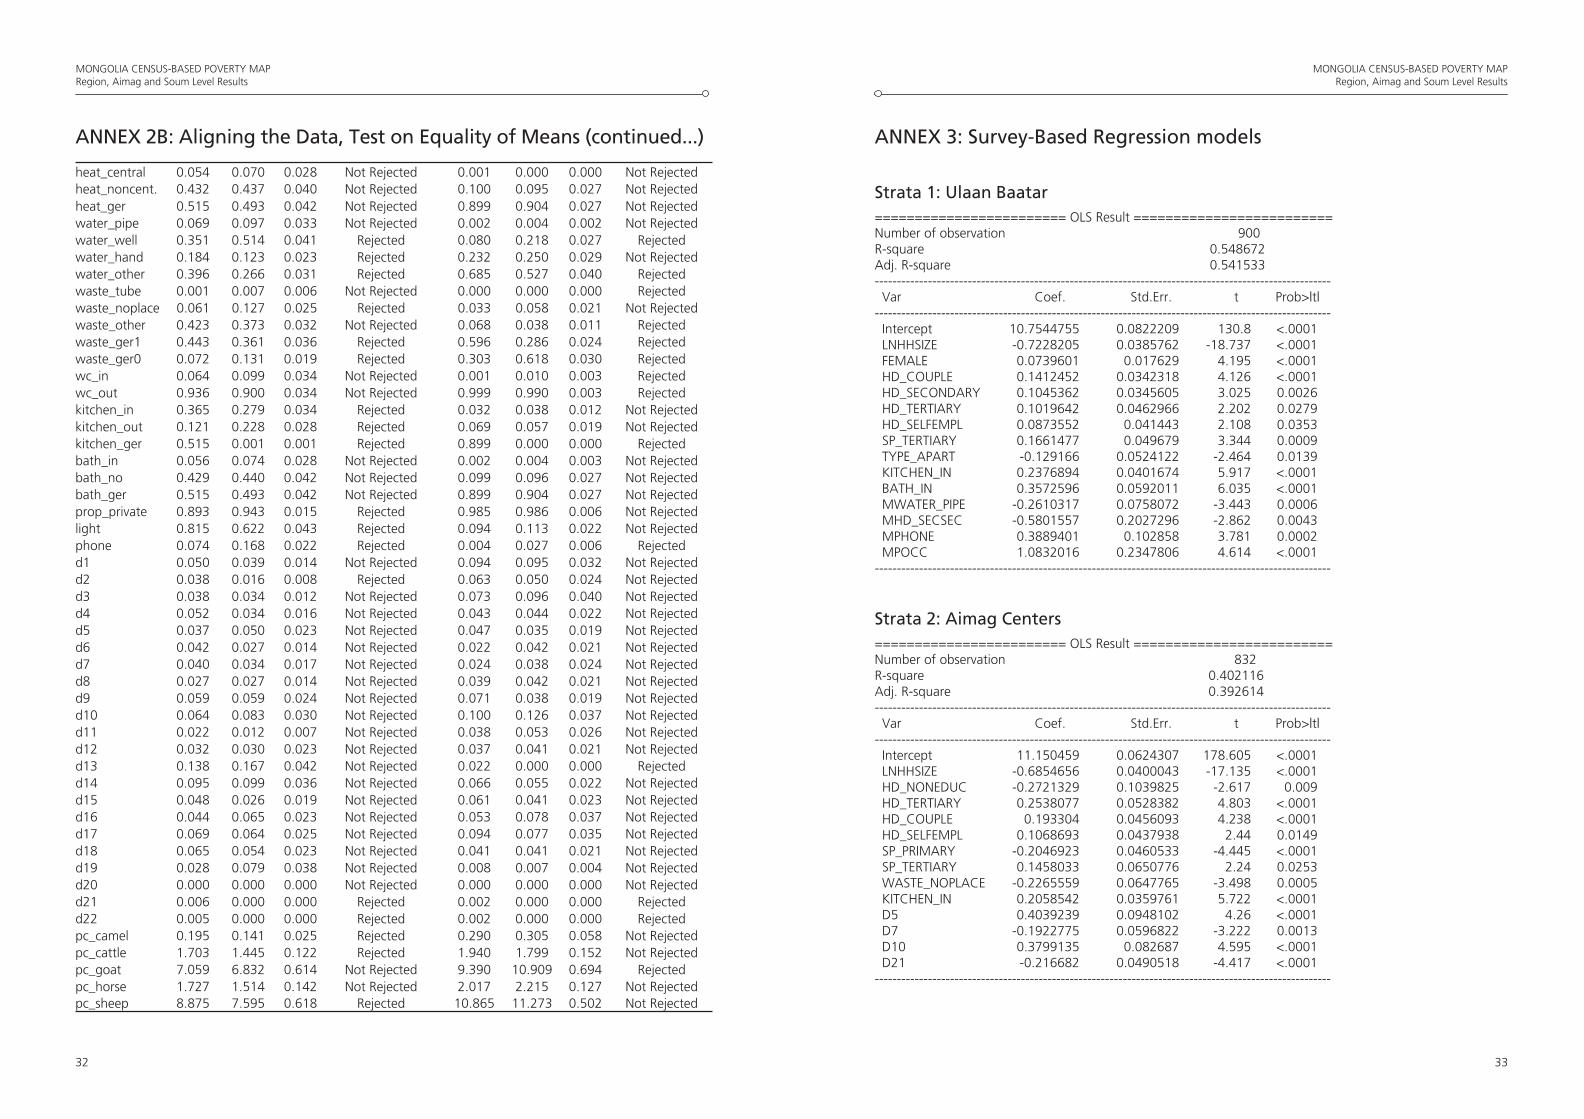
Stage 2: Survey-based regressions
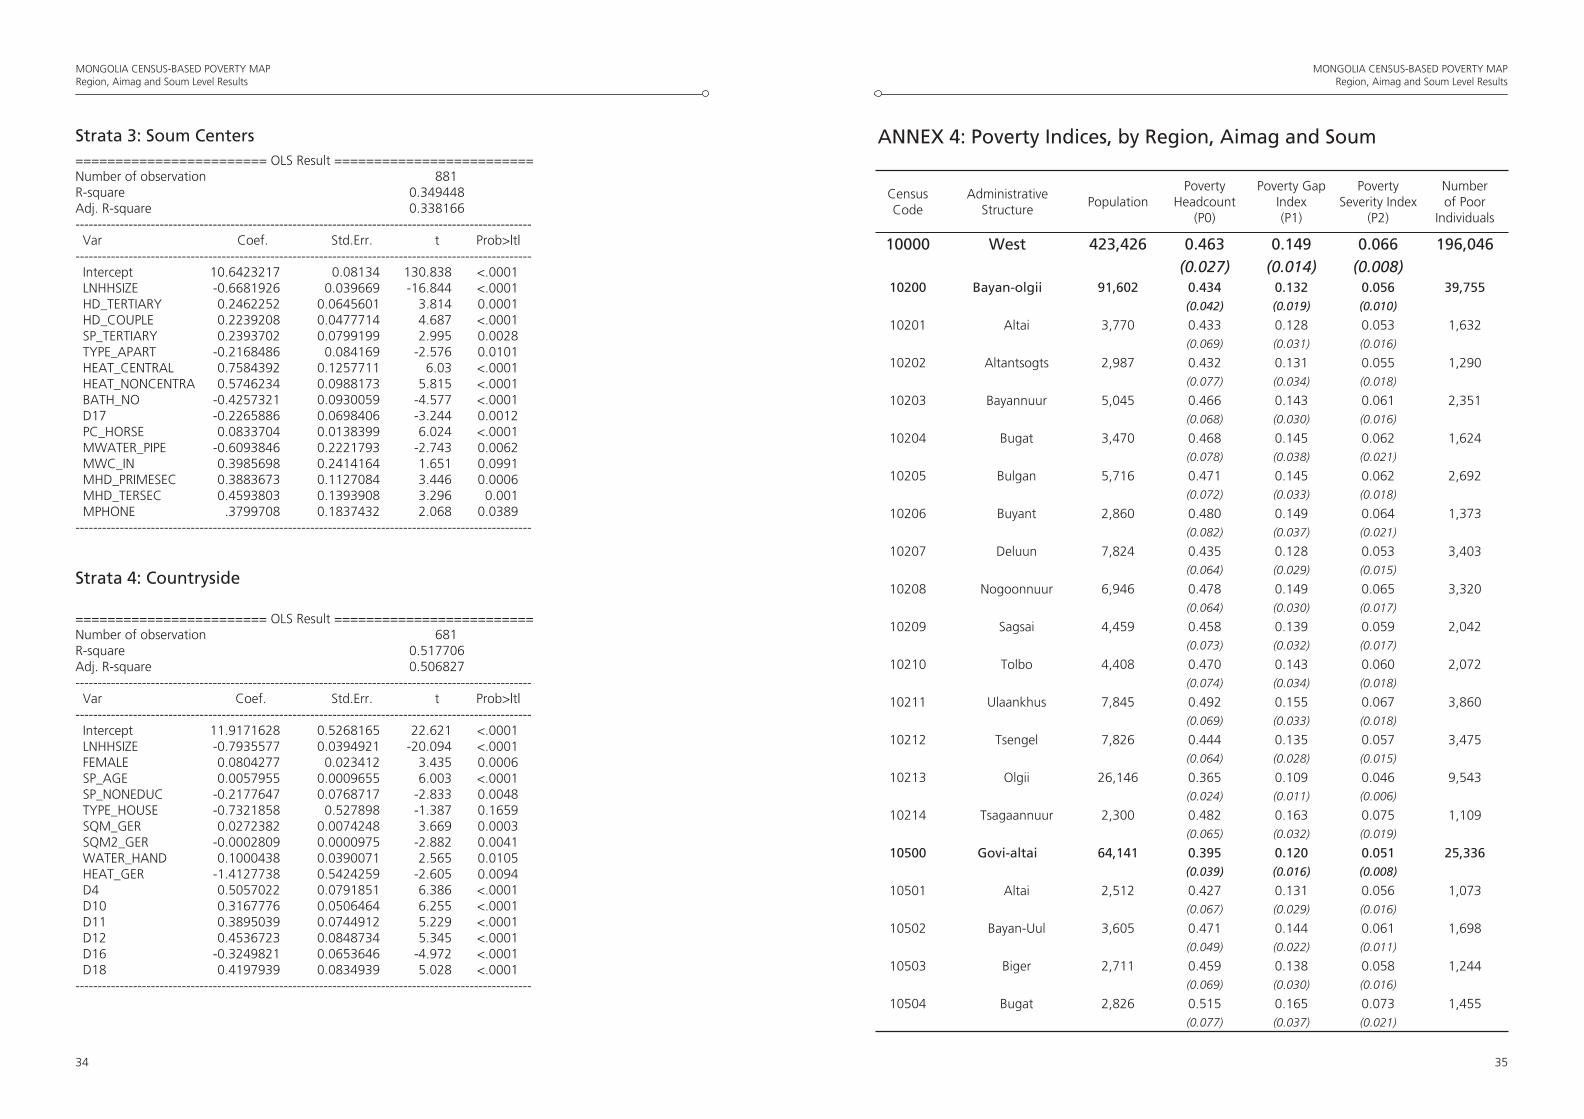
14. Annex 3 presents the strata-specifi c regression (Ordinary Least Squares) results based on LSMS. The ultimate choice of the independent variables was based on a backward stepwise selection model. A check of the results confi rmed that almost all the coeffi cients are of expected sign. As said earlier, those models are not for discussions. They are exclusively prediction models, not determinants of poverty models that can be analyzed in terms of causal relationships. In the models used for the poverty map we were only concerned by the predictive power of the regressors without regards, for example, to endogenous variables. At that stage, we attempt to control location effect by incorporating cluster average of some of the variables. We also ran a series of regressions using the base model residuals as dependant variables. Those results – not shown here – would be used in the last stage in order to correct for heteroskedasticity6.
15. The R2s of the different regressions vary from 0.35 to 0.55. Although they might appear to be on the low side, they are typical of survey-based cross-section regressions and can be favourably compared with results from other non-Mongolian poverty maps. While those coeffi cients look “credible”, it is important to note those models were purely predictive in the statistical sense and should not be viewed as determinant of welfare or poverty. For all the different strata the relatively low R2s are mainly due to four important factors. First, in many areas households are rather homogeneous in terms of observable characteristics even if there consumptions vary relatively more. That necessarily
5 We also deleted or redefined dichotomic variables being less that 0.03 or larger than 0.97 to avoid serious multicollinearity problems in our econometric models.6 As described in the methodology section and Annexe 1, two statistical problems are likely to violate Ordinary Least Squares assumptions. Spatial autocorrelation (expenditure from households within a same cluster are surely correlated, i.e. there are location effects) are minimized by incorporating in the regressions Enumeration Areas’s means of some key variables. The heteroskedasticity (error terms are not constant across observations) is corrected by modelizing the error terms. Correcting for those two problems yields unbiased estimates. See Elbers et al. (2002, 2003) and Mistiaen et al. (2002) for more details.
MONGOLIA CENSUS-BASED POVERTY MAPRegion, Aimag and Soum Level Results
8
MONGOLIA CENSUS-BASED POVERTY MAPRegion, Aimag and Soum Level Results
9
yields lower R2. Second, a large number of potential correlates are simply not observables using surveys with closed-questionnaires. Third, many good predictors had been discarded at fi rst stage since their distributions (mean and standard error) did not appears to be identical. And fi nally, many indicators do not take into account the quality of the correlates. Not taking into account the wide variation in quality of the different observable correlates makes many of those potential correlates useless in term of predictive power.
Stage 3: Welfare indicators7
16. Based on the results from the previous stage, we applied the estimated parameters8 to the Census data to compute a series of poverty indicators: the headcount ratio (P0), the poverty gap index (P1) and the poverty severity index (P2). Table 2 presents estimated poverty fi gures for each stratum and compares them with actual fi gures from the latest survey-based poverty profi les. For each stratum and poverty indicators, the equality of LSMS-based and Census-based indicators cannot be rejected (at 95%)9. The census-based headcount ratio is minute for all strata except for the Aimag Center strata for which the difference is 2.7 percentage points. Although census-based poverty fi gures can only be compared with the ones provided by the LSMS survey at stratum level, equality of those poverty fi gures provided an excellent reliability test of the methodology used here.
Poverty Headcount (P0)
Poverty Gap Index (P
1)
Poverty Severity Index (P
2)
LSMS(Actual)
Census (Predicted)
LSMS(Actual)
Census (Predicted)
LSMS(Actual)
Census (Predicted)
Ulaan Baatar 0.273 0.278 0.081 0.074 0.033 0.029
(0.026) (0.016) (0.010) (0.006) (0.005) (0.003)
Aimag Center 0.339 0.366 0.105 0.113 0.047 0.050
(0.022) (0.017) (0.010) (0.008) (0.007) (0.005)
Soum Center 0.445 0.439 0.144 0.145 0.064 0.066
(0.030) (0.023) (0.015) (0.012) (0.009) (0.007)
Countryside 0.427 0.421 0.126 0.128 0.051 0.054
(0.033) (0.024) (0.013) (0.011) (0.007) (0.006)
Sources: Authors’ calculation based on LSMS 2002/03 and Census 2000 Note: Robust standard errors are in parentheses.
17. After having established the reliability of the different predictive models, we estimated poverty fi gures for the three disaggregated levels described in Table 1: region, aimag and soum. Before presenting the actual results we need to determine whether those results are precise enough to be useful. As discussed in the methodological section, the precision of the poverty estimates decline as the number of households in the different administrative units is getting smaller. While we expect the aimag-level poverty estimates to be precise enough it is legitimate to be more interrogative about soum-level estimates.
How low cancan we go?
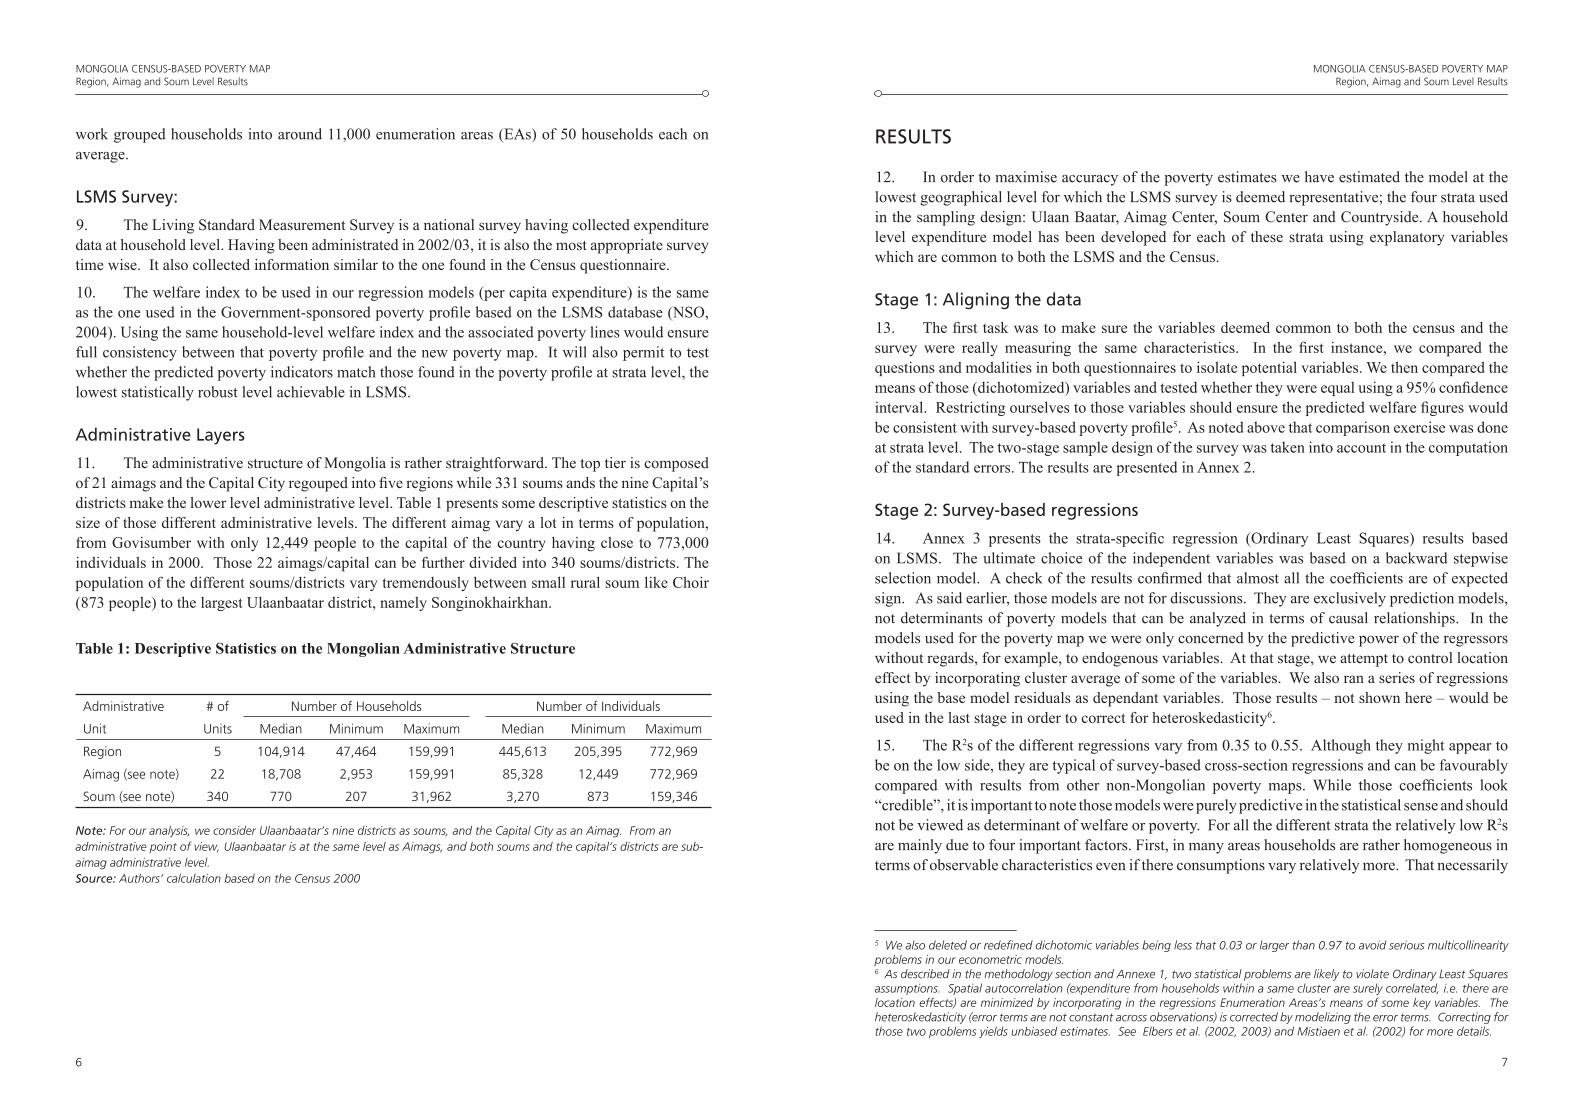
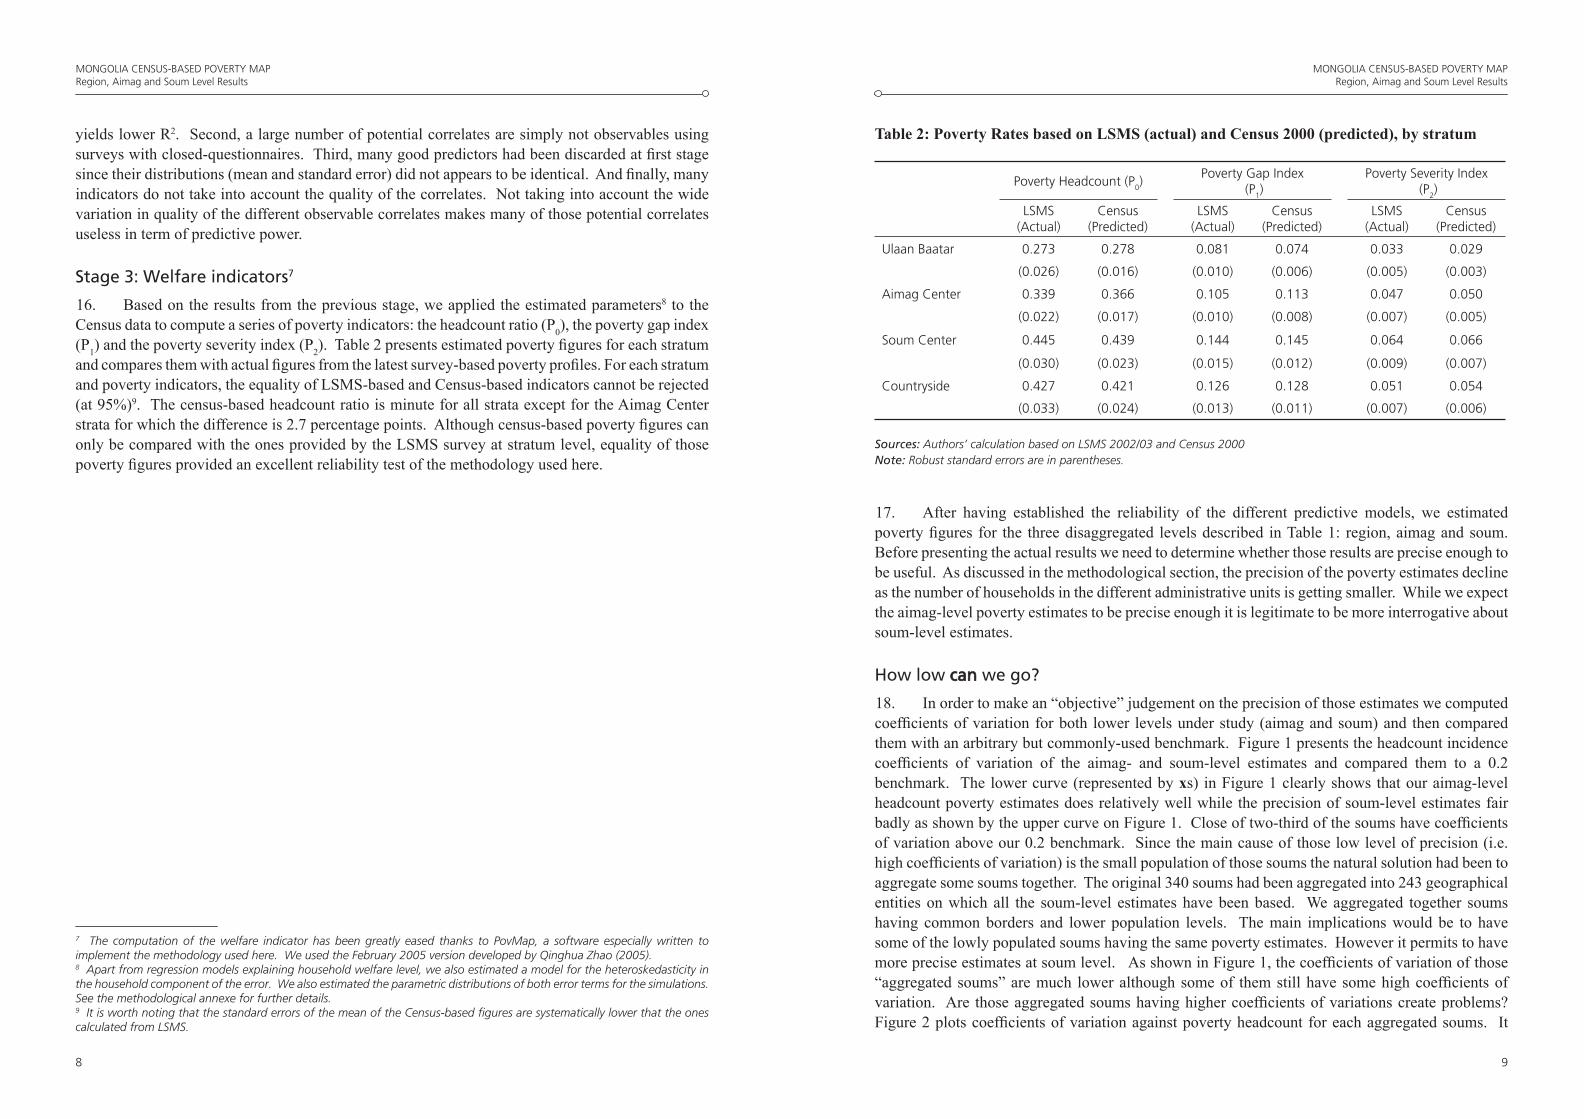
18. In order to make an “objective” judgement on the precision of those estimates we computed coeffi cients of variation for both lower levels under study (aimag and soum) and then compared them with an arbitrary but commonly-used benchmark. Figure 1 presents the headcount incidence coeffi cients of variation of the aimag- and soum-level estimates and compared them to a 0.2 benchmark. The lower curve (represented by xs) in Figure 1 clearly shows that our aimag-level headcount poverty estimates does relatively well while the precision of soum-level estimates fair badly as shown by the upper curve on Figure 1. Close of two-third of the soums have coeffi cients of variation above our 0.2 benchmark. Since the main cause of those low level of precision (i.e. high coeffi cients of variation) is the small population of those soums the natural solution had been to aggregate some soums together. The original 340 soums had been aggregated into 243 geographical entities on which all the soum-level estimates have been based. We aggregated together soums having common borders and lower population levels. The main implications would be to have some of the lowly populated soums having the same poverty estimates. However it permits to have more precise estimates at soum level. As shown in Figure 1, the coeffi cients of variation of those “aggregated soums” are much lower although some of them still have some high coeffi cients of variation. Are those aggregated soums having higher coeffi cients of variations create problems? Figure 2 plots coeffi cients of variation against poverty headcount for each aggregated soums. It
7 The computation of the welfare indicator has been greatly eased thanks to PovMap, a software especially written to implement the methodology used here. We used the February 2005 version developed by Qinghua Zhao (2005).8 Apart from regression models explaining household welfare level, we also estimated a model for the heteroskedasticity in the household component of the error. We also estimated the parametric distributions of both error terms for the simulations. See the methodological annexe for further details.9 It is worth noting that the standard errors of the mean of the Census-based figures are systematically lower that the ones calculated from LSMS.
Table 2: Poverty Rates based on LSMS (actual) and Census 2000 (predicted), by stratum
MONGOLIA CENSUS-BASED POVERTY MAPRegion, Aimag and Soum Level Results
10
MONGOLIA CENSUS-BASED POVERTY MAPRegion, Aimag and Soum Level Results
11
shows that amongst the soums with higher coeffi cients of variation a single soum has also a poverty headcount level above the national level (36.0%). Since one of the main applications of the poverty map would be to target the poorest aimags and soums we believe that level of precision of the relevant “aggregated soums” is acceptable and suitable for targeting purposes. It is clear that our poverty estimates at disaggregated levels would be good guides to policy-makers.
Figure 1: Poverty Headcount Accuracy, by disaggregation administrative level
0.2
.4.6
Rat
io (s
.e./p
oint
est
imat
e)
0 .2 .4 .6 .8 1Proportion of Households (ranked by s.e./point estimate)
Benchmark Aimag (Census)Soum aggregated (Census) Soum (Census)
Source: Authors' computations based on LSMS 2002/03 and Census 2000
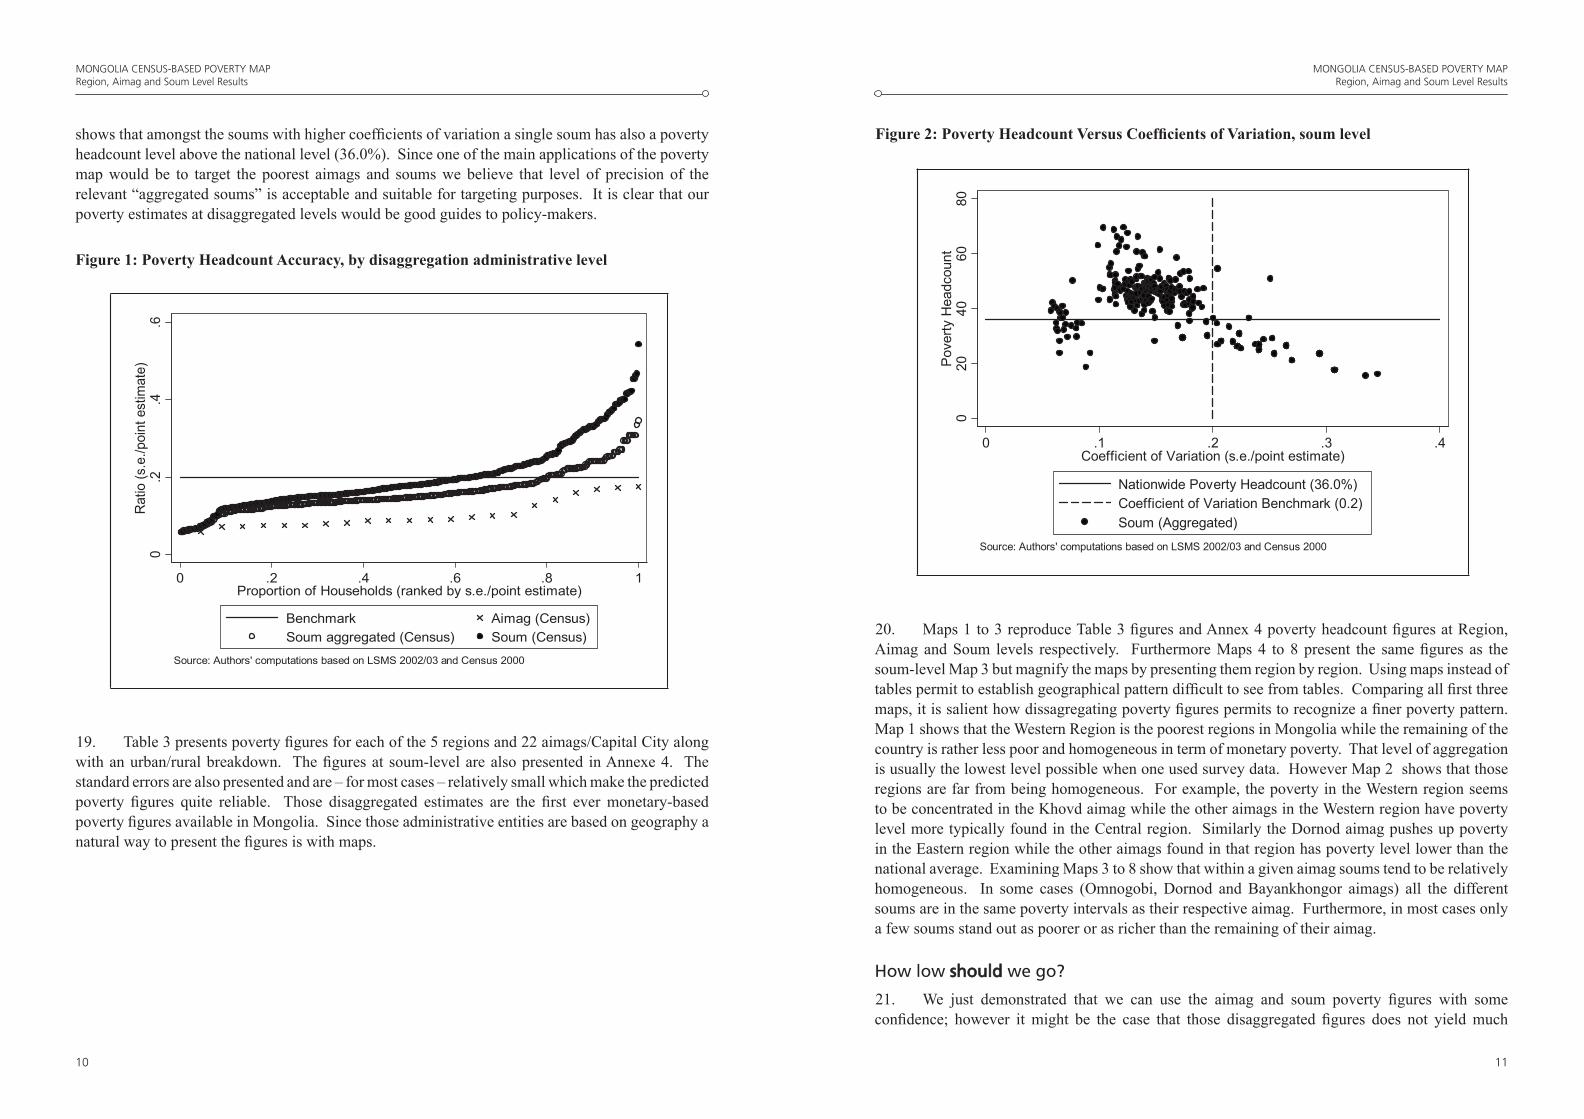
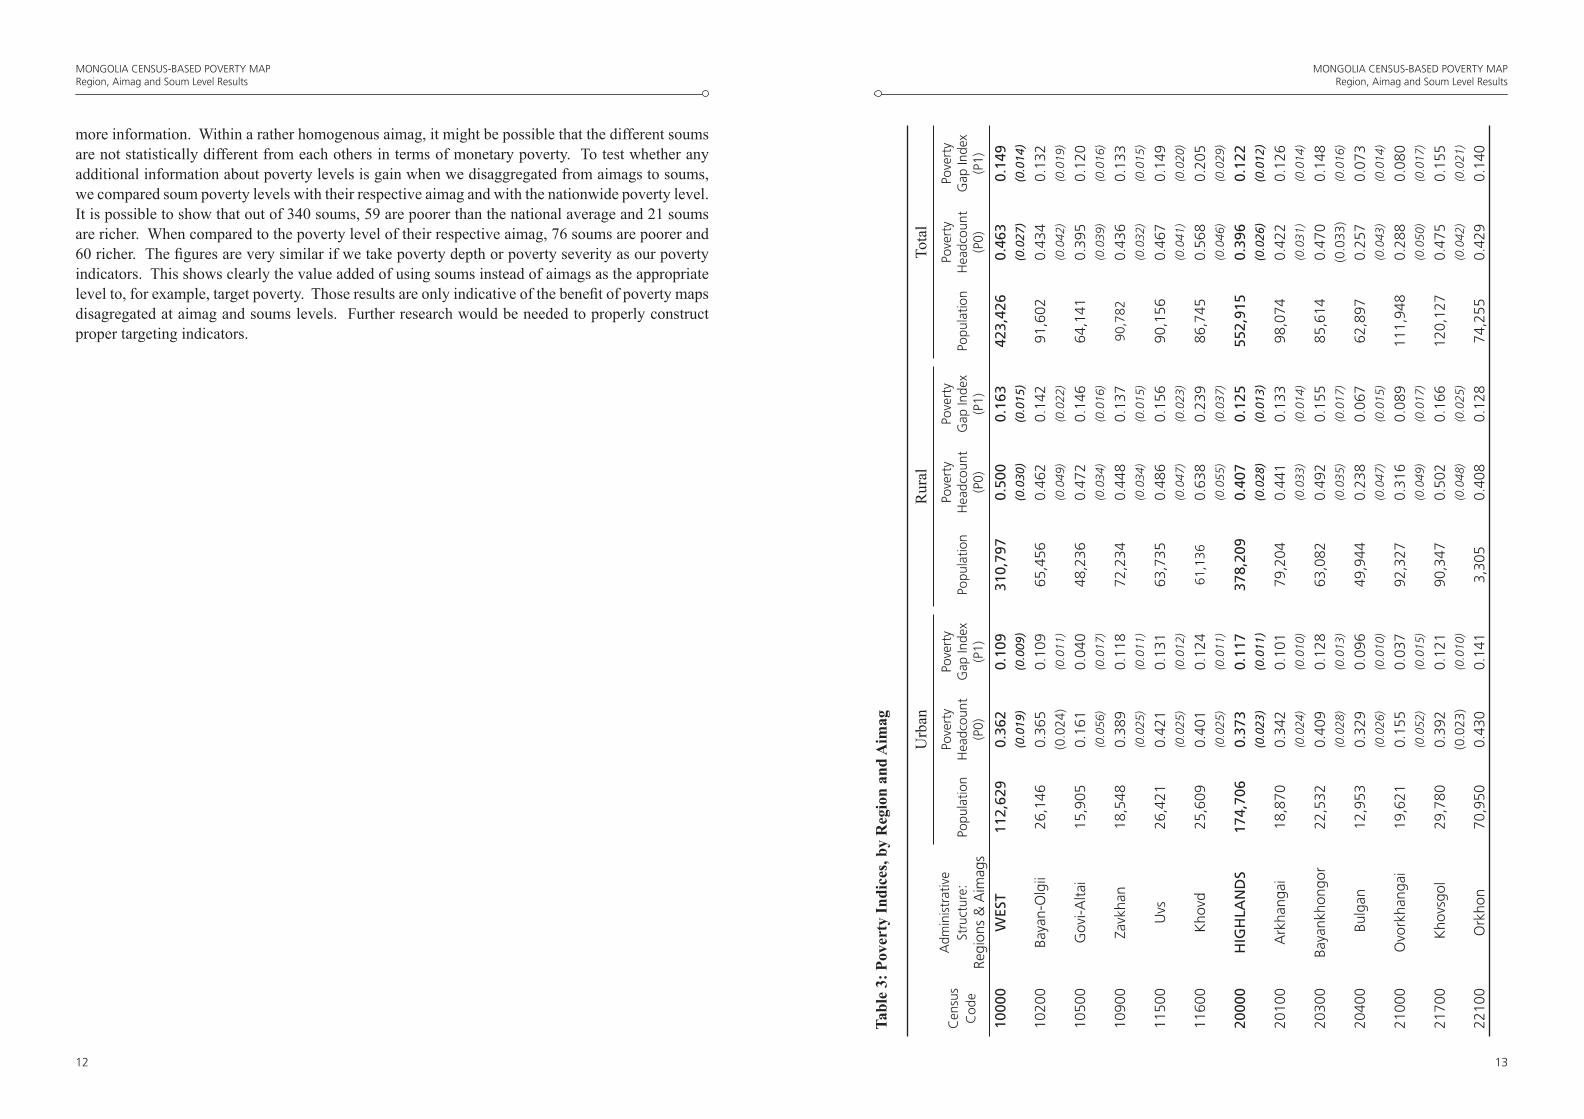
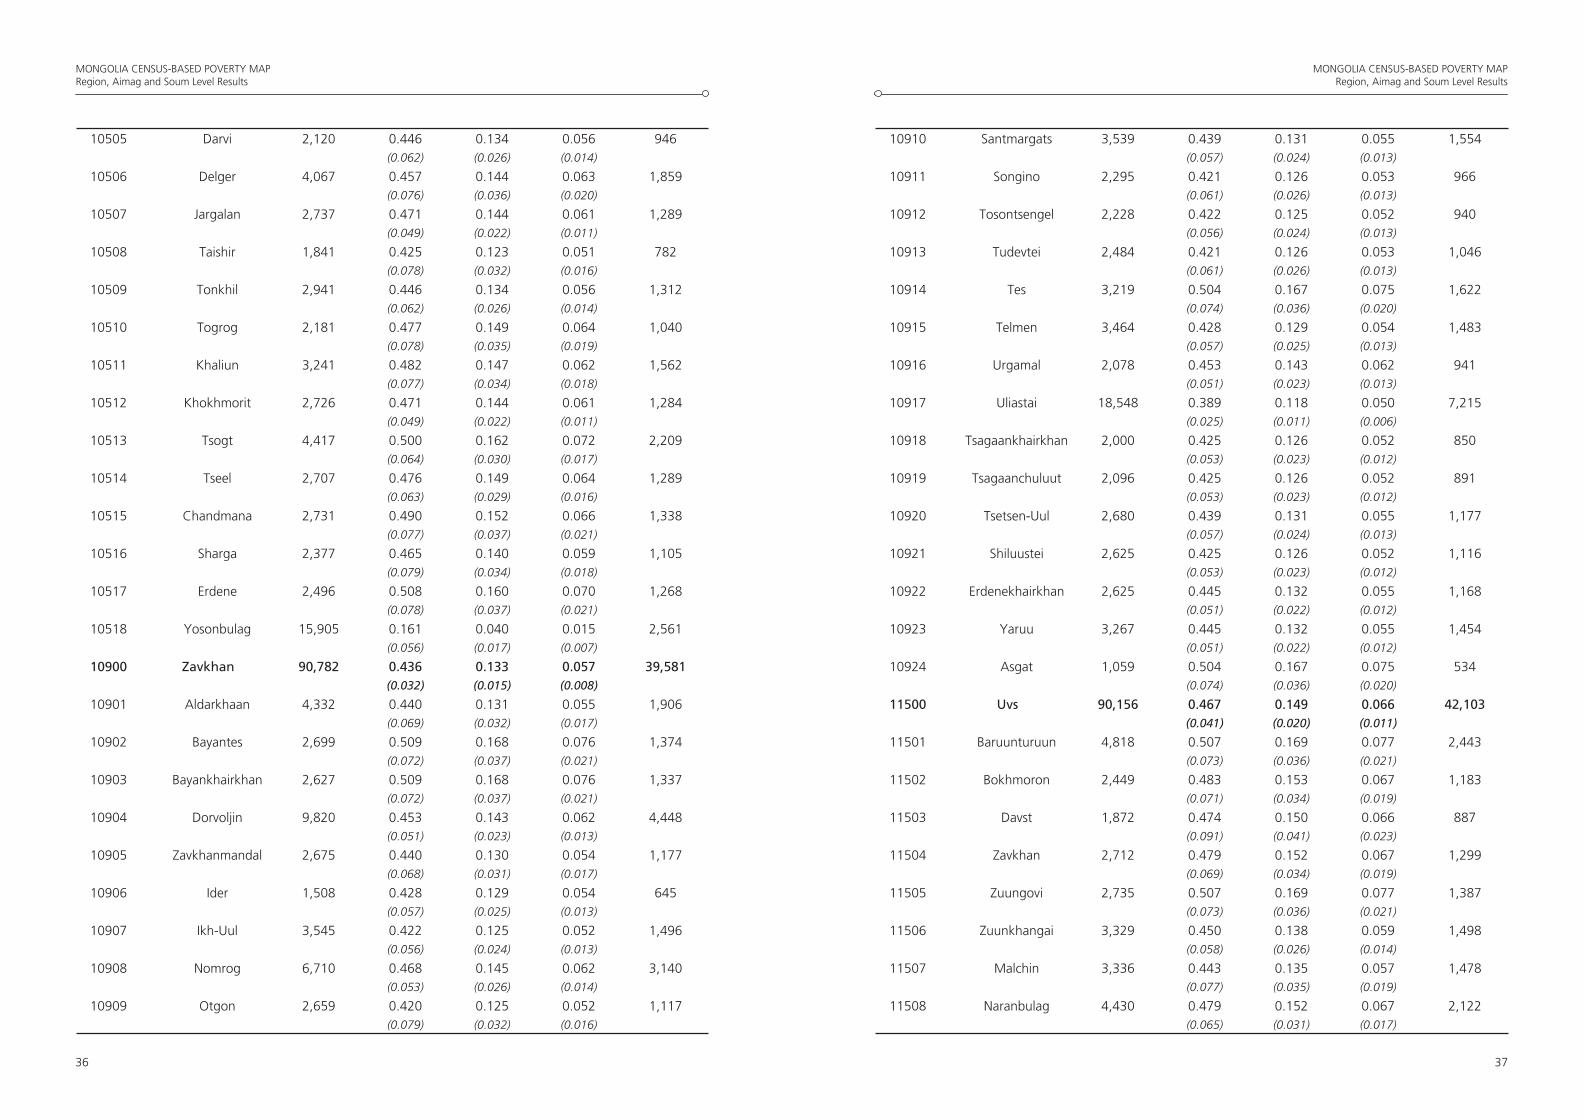
19. Table 3 presents poverty fi gures for each of the 5 regions and 22 aimags/Capital City along with an urban/rural breakdown. The fi gures at soum-level are also presented in Annexe 4. The standard errors are also presented and are – for most cases – relatively small which make the predicted poverty fi gures quite reliable. Those disaggregated estimates are the fi rst ever monetary-based poverty fi gures available in Mongolia. Since those administrative entities are based on geography a natural way to present the fi gures is with maps.
020
4060
80P
over
ty H
eadc
ount
0 .1 .2 .3 .4Coefficient of Variation (s.e./point estimate)
Nationwide Poverty Headcount (36.0%)Coefficient of Variation Benchmark (0.2)Soum (Aggregated)
Source: Authors' computations based on LSMS 2002/03 and Census 2000
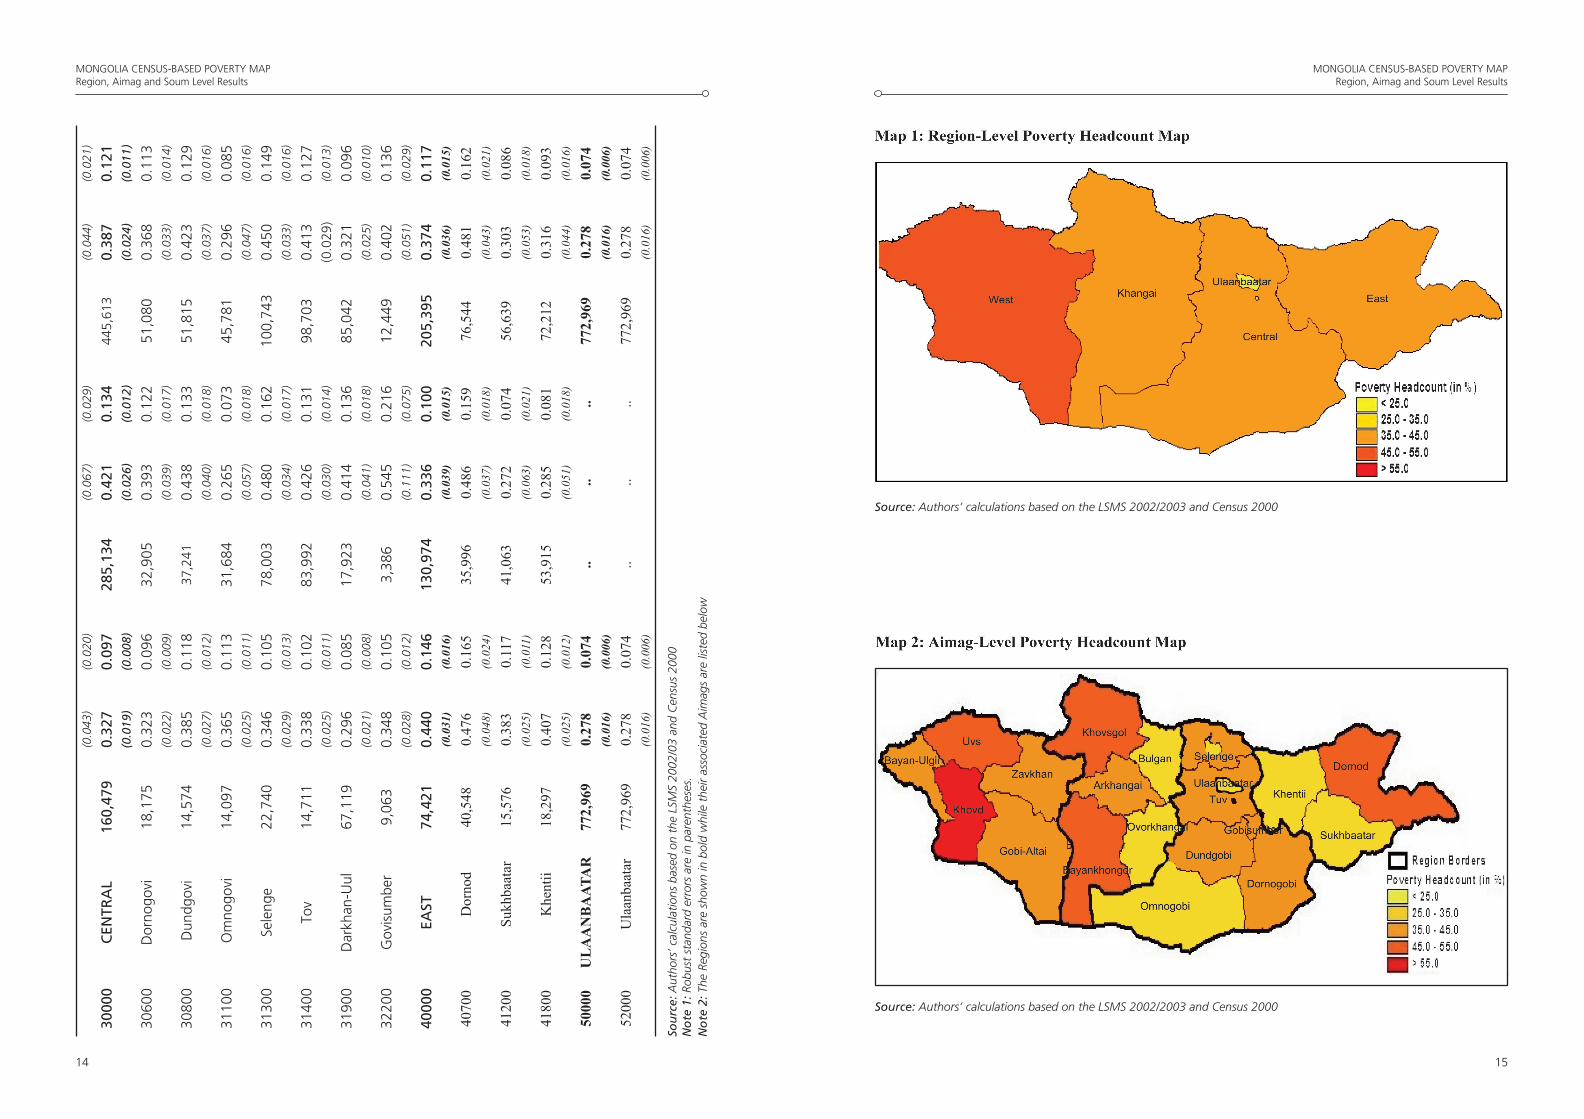
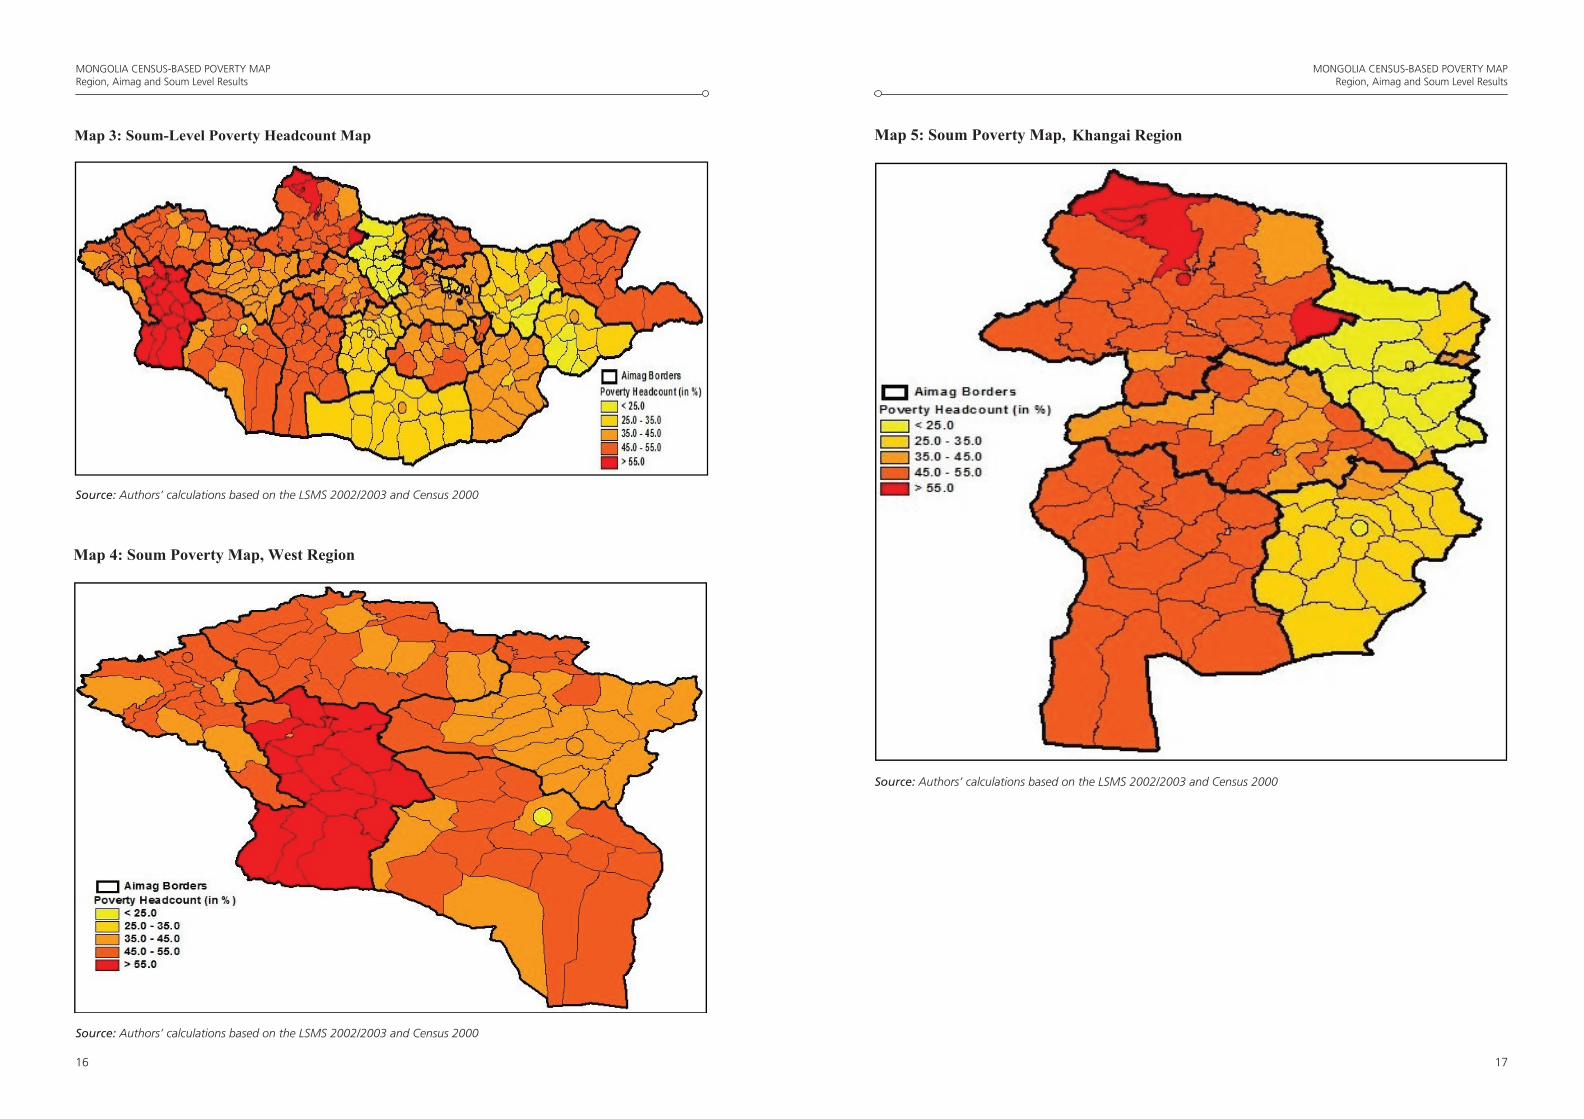
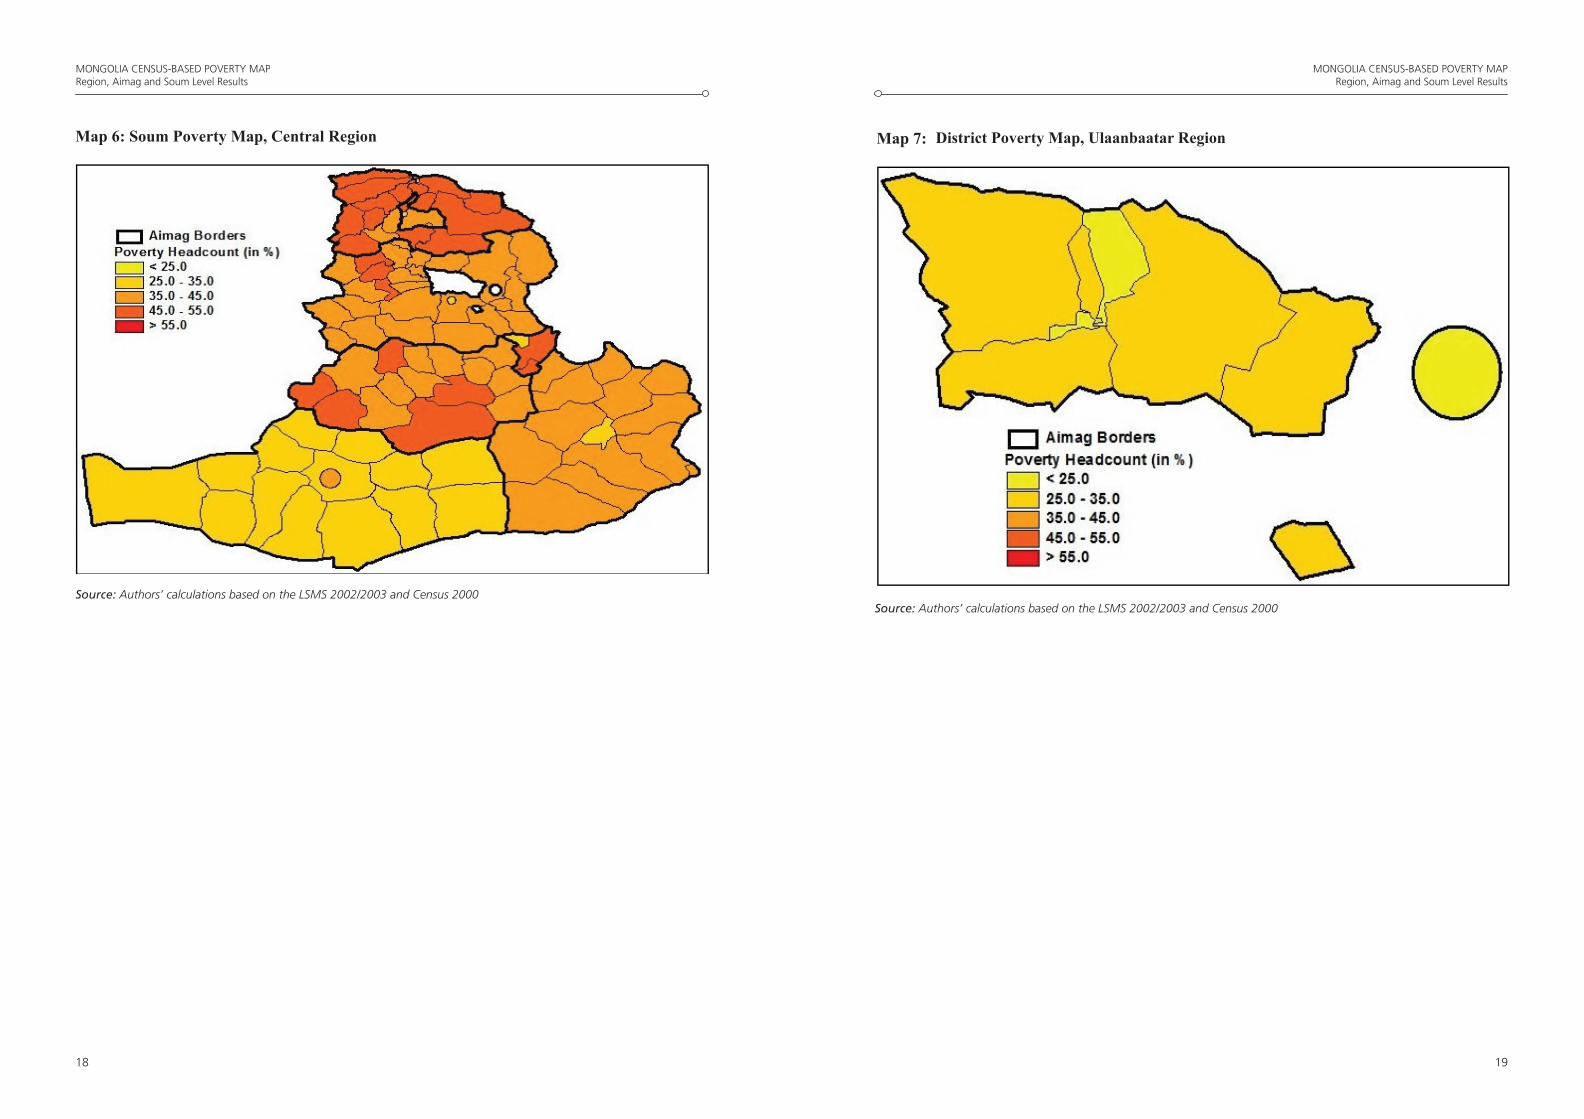
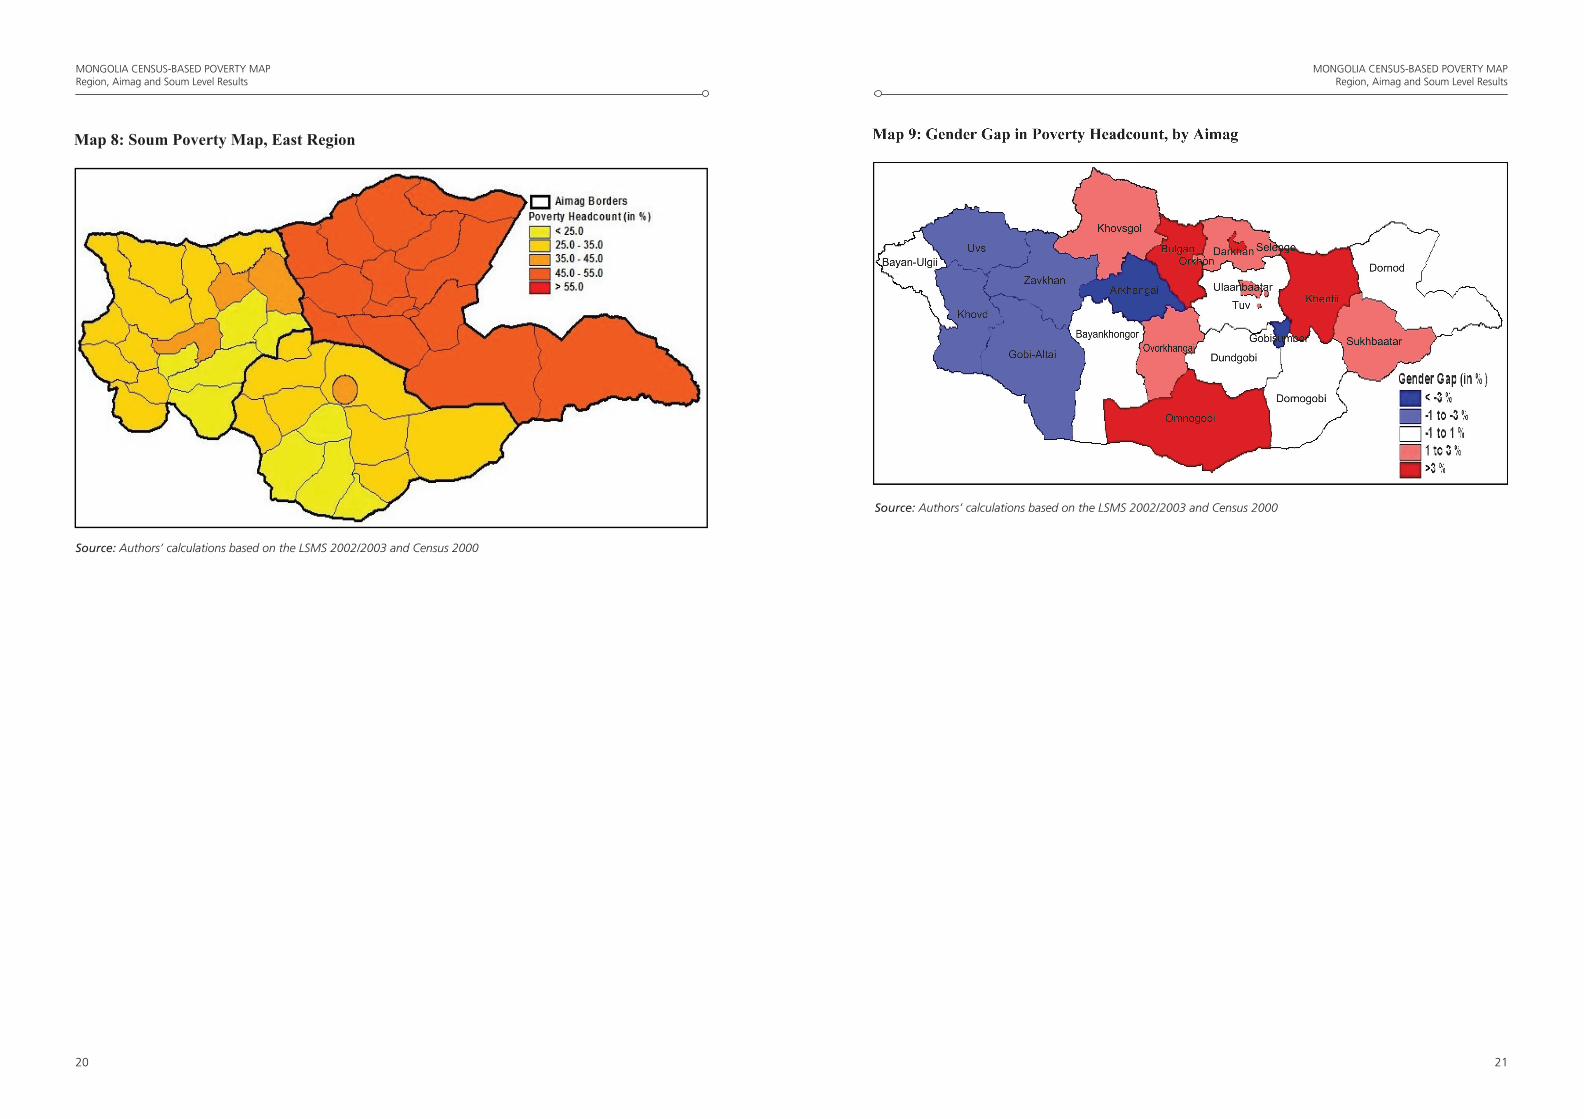
20. Maps 1 to 3 reproduce Table 3 fi gures and Annex 4 poverty headcount fi gures at Region, Aimag and Soum levels respectively. Furthermore Maps 4 to 8 present the same fi gures as the soum-level Map 3 but magnify the maps by presenting them region by region. Using maps instead of tables permit to establish geographical pattern diffi cult to see from tables. Comparing all fi rst three maps, it is salient how dissagregating poverty fi gures permits to recognize a fi ner poverty pattern. Map 1 shows that the Western Region is the poorest regions in Mongolia while the remaining of the country is rather less poor and homogeneous in term of monetary poverty. That level of aggregation is usually the lowest level possible when one used survey data. However Map 2 shows that those regions are far from being homogeneous. For example, the poverty in the Western region seems to be concentrated in the Khovd aimag while the other aimags in the Western region have poverty level more typically found in the Central region. Similarly the Dornod aimag pushes up poverty in the Eastern region while the other aimags found in that region has poverty level lower than the national average. Examining Maps 3 to 8 show that within a given aimag soums tend to be relatively homogeneous. In some cases (Omnogobi, Dornod and Bayankhongor aimags) all the different soums are in the same poverty intervals as their respective aimag. Furthermore, in most cases only a few soums stand out as poorer or as richer than the remaining of their aimag.
How low shouldshould we go?
21. We just demonstrated that we can use the aimag and soum poverty fi gures with some confi dence; however it might be the case that those disaggregated fi gures does not yield much
Figure 2: Poverty Headcount Versus Coeffi cients of Variation, soum level
MONGOLIA CENSUS-BASED POVERTY MAPRegion, Aimag and Soum Level Results
12
MONGOLIA CENSUS-BASED POVERTY MAPRegion, Aimag and Soum Level Results
13
more information. Within a rather homogenous aimag, it might be possible that the different soums are not statistically different from each others in terms of monetary poverty. To test whether any additional information about poverty levels is gain when we disaggregated from aimags to soums, we compared soum poverty levels with their respective aimag and with the nationwide poverty level. It is possible to show that out of 340 soums, 59 are poorer than the national average and 21 soums are richer. When compared to the poverty level of their respective aimag, 76 soums are poorer and 60 richer. The fi gures are very similar if we take poverty depth or poverty severity as our poverty indicators. This shows clearly the value added of using soums instead of aimags as the appropriate level to, for example, target poverty. Those results are only indicative of the benefi t of poverty maps disagregated at aimag and soums levels. Further research would be needed to properly construct proper targeting indicators.
Tabl
e 3:
Pov
erty
Indi
ces,
by R
egio
n an
d A
imag
Urb
anR
ural
Tota
l
Cen
sus
Code
Adm
inis
trat
ive
Stru
cture
:R
egio
ns
& A
imag
sPo
pula
tion
Pove
rty
Hea
dco
unt
(P0)
Pove
rty
Gap
Index
(P1)
Popula
tion
Pove
rty
Hea
dco
unt
(P0)
Pove
rty
Gap
Index
(P1)
Popu
lation
Pove
rty
Hea
dco
unt
(P0
)
Pove
rty
Gap
Index
(P1)
1000
0W
EST
112,
629
0.36
20.
109
310,
797
0.50
00.
163
423,
426
0.46
30.
149
(0.0
19)
(0.0
09)
(0.0
30)
(0.0
15)
(0.0
27)
(0.0
14)
10
20
0B
ayan
-Olg
ii2
6,1
46
0.3
65
0.1
09
65,4
56
0.4
62
0.1
42
91
,60
20
.434
0.1
32
(0.0
24)
(0.0
11)
(0.0
49)
(0.0
22
)(0
.04
2)
(0.0
19)
10
50
0G
ovi
-Altai
15
,90
50
.16
10.0
40
48,2
36
0.4
72
0.1
46
64,1
41
0.3
95
0.1
20
(0.0
56
)(0
.017)
(0.0
34)
(0.0
16
)(0
.03
9)
(0.0
16)
10
90
0Za
vkh
an1
8,5
48
0.3
89
0.1
18
72,2
34
0.4
48
0.1
37
90
,782
0.4
36
0.1
33
(0.0
25
)(0
.011)
(0.0
34)
(0.0
15
)(0
.03
2)
(0.0
15)
11
50
0U
vs2
6,4
21
0.4
21
0.1
31
63,7
35
0.4
86
0.1
56
90
,15
60
.467
0.1
49
(0.0
25
)(0
.012)
(0.0
47)
(0.0
23
)(0
.04
1)
(0.0
20)
11
60
0K
ho
vd2
5,6
09
0.4
01
0.1
24
61,1
36
0.6
38
0.2
39
86,7
45
0.5
68
0.2
05
(0.0
25
)(0
.011)
(0.0
55)
(0.0
37
)(0
.04
6)
(0.0
29)
2000
0H
IGH
LAN
DS
174,
706
0.37
30.
117
378,
209
0.40
70.
125
552,
915
0.39
60.
122
(0.0
23)
(0.0
11)
(0.0
28)
(0.0
13)
(0.0
26)
(0.0
12)
20
10
0A
rkh
ang
ai1
8,8
70
0.3
42
0.1
01
79,2
04
0.4
41
0.1
33
98,0
74
0.4
22
0.1
26
(0.0
24
)(0
.010)
(0.0
33)
(0.0
14
)(0
.03
1)
(0.0
14)
20
30
0B
ayan
kho
ng
or
22
,53
20
.40
90.1
28
63,0
82
0.4
92
0.1
55
85
,61
40
.470
0.1
48
(0.0
28
)(0
.013)
(0.0
35)
(0.0
17
)(0
.033
)(0
.016)
20
40
0 B
ulg
an1
2,9
53
0.3
29
0.0
96
49,9
44
0.2
38
0.0
67
62,8
97
0.2
57
0.0
73
(0.0
26
)(0
.010)
(0.0
47)
(0.0
15
)(0
.04
3)
(0.0
14)
21
00
0O
vork
han
gai
19
,62
10
.15
50.0
37
92,3
27
0.3
16
0.0
89
111,9
48
0.2
88
0.0
80
(0.0
52
)(0
.015)
(0.0
49)
(0.0
17
)(0
.05
0)
(0.0
17)
21
70
0 K
ho
vsg
ol
29
,78
00
.39
20.1
21
90,3
47
0.5
02
0.1
66
12
0,1
27
0.4
75
0.1
55
(0.0
23)
(0.0
10)
(0.0
48)
(0.0
25
)(0
.04
2)
(0.0
21)
22
10
0O
rkh
on
70
,95
00
.43
00.1
41
3,3
05
0.4
08
0.1
28
74,2
55
0.4
29
0.1
40
MONGOLIA CENSUS-BASED POVERTY MAPRegion, Aimag and Soum Level Results
14
MONGOLIA CENSUS-BASED POVERTY MAPRegion, Aimag and Soum Level Results
15
Sou
rce:
Au
tho
rs’
calc
ula
tio
ns
bas
ed o
n t
he
LSM
S 2
00
2/0
3 a
nd
Cen
sus
2000
No
te 1
: Ro
bu
st s
tan
dar
d e
rro
rs a
re in
par
enth
eses
.N
ote
2: T
he
Reg
ion
s ar
e sh
ow
n in
bo
ld w
hile
th
eir
asso
ciat
ed A
imag
s ar
e lis
ted b
elow
(0.0
43
)(0
.020)
(0.0
67)
(0.0
29
)(0
.044
)(0
.02
1)
3000
0C
ENTR
AL
160,
479
0.32
70.
097
285,
134
0.42
10.
134
445,6
13
0.38
70.
121
(0.0
19)
(0.0
08)
(0.0
26)
(0.0
12)
(0.0
24)
(0.0
11)
30
60
0D
orn
og
ovi
18
,17
50
.32
30.0
96
32,9
05
0.3
93
0.1
22
51,0
80
0.3
68
0.1
13
(0.0
22
)(0
.009)
(0.0
39)
(0.0
17
)(0
.033
)(0
.01
4)
30
80
0 D
un
dg
ovi
14
,57
40
.38
50.1
18
37,2
41
0.4
38
0.1
33
51,8
15
0.4
23
0.1
29
(0.0
27
)(0
.012)
(0.0
40)
(0.0
18
)(0
.037
)(0
.01
6)
31
10
0 O
mn
og
ovi
14
,09
70
.36
50.1
13
31,6
84
0.2
65
0.0
73
45,7
81
0.2
96
0.0
85
(0.0
25
)(0
.011)
(0.0
57)
(0.0
18
)(0
.047
)(0
.01
6)
31
30
0Se
len
ge
22
,74
00
.34
60.1
05
78,0
03
0.4
80
0.1
62
10
0,7
43
0.4
50
0.1
49
(0.0
29
)(0
.013)
(0.0
34)
(0.0
17
)(0
.033
)(0
.01
6)
31
40
0To
v1
4,7
11
0.3
38
0.1
02
83,9
92
0.4
26
0.1
31
98,7
03
0.4
13
0.1
27
(0.0
25
)(0
.011)
(0.0
30)
(0.0
14
)(0
.029)
(0.0
13)
31
90
0D
arkh
an-U
ul
67
,11
90
.29
60.0
85
17,9
23
0.4
14
0.1
36
85
,04
20
.321
0.0
96
(0.0
21
)(0
.008)
(0.0
41)
(0.0
18
)(0
.025
)(0
.01
0)
32
20
0G
ovi
sum
ber
9,0
63
0.3
48
0.1
05
3,3
86
0.5
45
0.2
16
12
,44
90
.402
0.1
36
(0.0
28
)(0
.012)
(0.1
11)
(0.0
75
)(0
.051
)(0
.02
9)
4000
0EA
ST74
,421
0.44
00.
146
130,
974
0.33
60.
100
205,
395
0.37
40.
117
(0.031)
(0.016)
(0.039)
(0.015)
(0.036)
(0.015)
4070
0
Dor
nod
40,5
480.
476
0.16
535
,996
0.48
60.
159
76,5
440.
481
0.16
2(0
.048
)(0
.024
)(0
.037
)(0
.018
)(0
.043
)(0
.021
)
4120
0
Suk
hbaa
tar
15,5
760.
383
0.11
741
,063
0.27
20.
074
56,6
390.
303
0.08
6(0
.025
)(0
.011
)(0
.063
)(0
.021
)(0
.053
)(0
.018
)
4180
0
Khe
ntii
18,2
970.
407
0.12
853
,915
0.28
50.
081
72,2
120.
316
0.09
3(0
.025
)(0
.012
)(0
.051
)(0
.018
)(0
.044
)(0
.016
)
5000
0U
LA
AN
BA
ATA
R77
2,96
90.
278
0.07
4..
....
772,
969
0.27
80.
074
(0.016)
(0.006)
(0.016)
(0.006)
5200
0
Ula
anba
atar
772,
969
0.27
80.
074
....
..77
2,96
90.
278
0.07
4(0
.016
)(0
.006
)(0
.016
)(0
.006
)
Source: Authors’ calculations based on the LSMS 2002/2003 and Census 2000
Source: Authors’ calculations based on the LSMS 2002/2003 and Census 2000
MONGOLIA CENSUS-BASED POVERTY MAPRegion, Aimag and Soum Level Results
16
MONGOLIA CENSUS-BASED POVERTY MAPRegion, Aimag and Soum Level Results
17
Map 3: Soum-Level Poverty Headcount Map
Map 4: Soum Poverty Map, West Region
Source: Authors’ calculations based on the LSMS 2002/2003 and Census 2000
Source: Authors’ calculations based on the LSMS 2002/2003 and Census 2000
Source: Authors’ calculations based on the LSMS 2002/2003 and Census 2000
Map 5: Soum Poverty Map, Xangai Region Khangai Region
MONGOLIA CENSUS-BASED POVERTY MAPRegion, Aimag and Soum Level Results
18
MONGOLIA CENSUS-BASED POVERTY MAPRegion, Aimag and Soum Level Results
19
Map 6: Soum Poverty Map, Central Region
Source: Authors’ calculations based on the LSMS 2002/2003 and Census 2000Source: Authors’ calculations based on the LSMS 2002/2003 and Census 2000
Map 7: Soum Poverty Map, Ulaan Baatar Region District Poverty Map, Ulaanbaatar Region
MONGOLIA CENSUS-BASED POVERTY MAPRegion, Aimag and Soum Level Results
20
Map 8: Soum Poverty Map, East Region
MONGOLIA CENSUS-BASED POVERTY MAPRegion, Aimag and Soum Level Results
21
Source: Authors’ calculations based on the LSMS 2002/2003 and Census 2000
Source: Authors’ calculations based on the LSMS 2002/2003 and Census 2000
MONGOLIA CENSUS-BASED POVERTY MAPRegion, Aimag and Soum Level Results
23
GENDER
22. Although the methodology used to construct poverty maps is mainly geared toward geographical-based outcomes, it is possible to compute poverty indicators for any groups having large enough population size. In Mongolia, around 16 percent of households are headed by a female. On average, those female-headed households are not poorer since both male- and female-headed housedolds have a 37 percent poverty rate. However, Map 9 shows the existence of a mild gender gap in some aimags; but also that the gap is “reverse” in some other aimags. It should be noted that none of those gender gap are signifi cantly different from zero (using a 95% confi dence interval).
CONCLUDING REMARKS
23. This paper has documented the construction of a series of region-, aimag- and soum-level poverty maps for Mongolia. The methodology developed by Elbers et al. (2003) has permitted to obtain the fi rst ever reliable poverty estimates at those local levels in Mongolia. Those fi nely disaggregated poverty fi gures are fully compatible with the latest Mongolia Poverty Profi le.
24. One of the main advantages of the methodology used here is the possibility of computing standard errors of the different poverty estimates and therefore to have an idea of the reliability of those estimates. We concluded that the fi gures presented here are precise enough to be useful to planners, policy-makers and researchers.
25. However interesting those results, they would acquire their full potential if they are use. How? Amongst others, those results can be used to design budget allocation rules to be applied by the different administrative levels toward their subdivisions: the central government toward the regions, and the regions toward their aimags and soums. That map could become an important tool in support of the decentralization process currently undertaken in Mongolia. Poverty being a multi-dimensional phenomenon such monetary-based target indicators should be supplemented by alternative measures of poverty based on education, health or infrastructure. The construction of a series of MDG10 maps is currently undertaken. In particular merging the poverty map with education and health maps would yields powerful targeting tools. Others uses of the poverty map would include the evaluation of locally targeted anti-poverty schemes (Social funds, Town/village development schemes), impact analysis etc. And fi nally, researchers could use it in a multitude of ways such as the study of relationship between poverty distribution and different socio-economic outcomes.
REFERENCES
Coulombe, H. And Q. Wodon, 2007, Combining census and household survey data for better targeting: The West and Central Africa Poverty Mapping Initiative, Findings Africa Region No. 280, The World Bank, Washington, D.C.
Elbers, Chris, Jean Olson Lanjouw, and Peter Lanjouw, 2002, “Welfare in Villages and Towns: Micro level Estimation of Poverty and Inequality.” Policy Research Working Paper No. 2911, DECRG-World Bank, Washington DC
Elbers, Chris, Jean Olson Lanjouw, and Peter Lanjouw, 2003, “Micro-Level Estimation of Poverty and Inequality” Econometrica, 71(1), 355-364
Henninger, Norbert, 1998, Mapping and Geographical Analysis of Human Welfare and Poverty, Review and Assessment, World Resources Institute, Washington, D.C.
National Statistical Offi ce (CSO), 2004, Main Report of “Household Income and Expenditure Survey / Living Standards Measurement Survey”, 2002-2003, Ulaanbataar: National Statistical Service
Mistiaen, Johan, Berk Ozler, Tiaray Razafi manantena and Jean Razafi ndravonona, 2002, Putting Welfare on the Map in Madagascar, Africa Region Working Paper Series, Number 34, The World Bank. Washington, D.C.
Zhao, Qinghua, 2005, User Manual for PovMap, mimeo, Development research Group, The World Bank, Washington, D.C.
10 Millennium Development Goals (MDGs).
MONGOLIA CENSUS-BASED POVERTY MAPRegion, Aimag and Soum Level Results
22
MONGOLIA CENSUS-BASED POVERTY MAPRegion, Aimag and Soum Level Results
24
MONGOLIA CENSUS-BASED POVERTY MAPRegion, Aimag and Soum Level Results
25
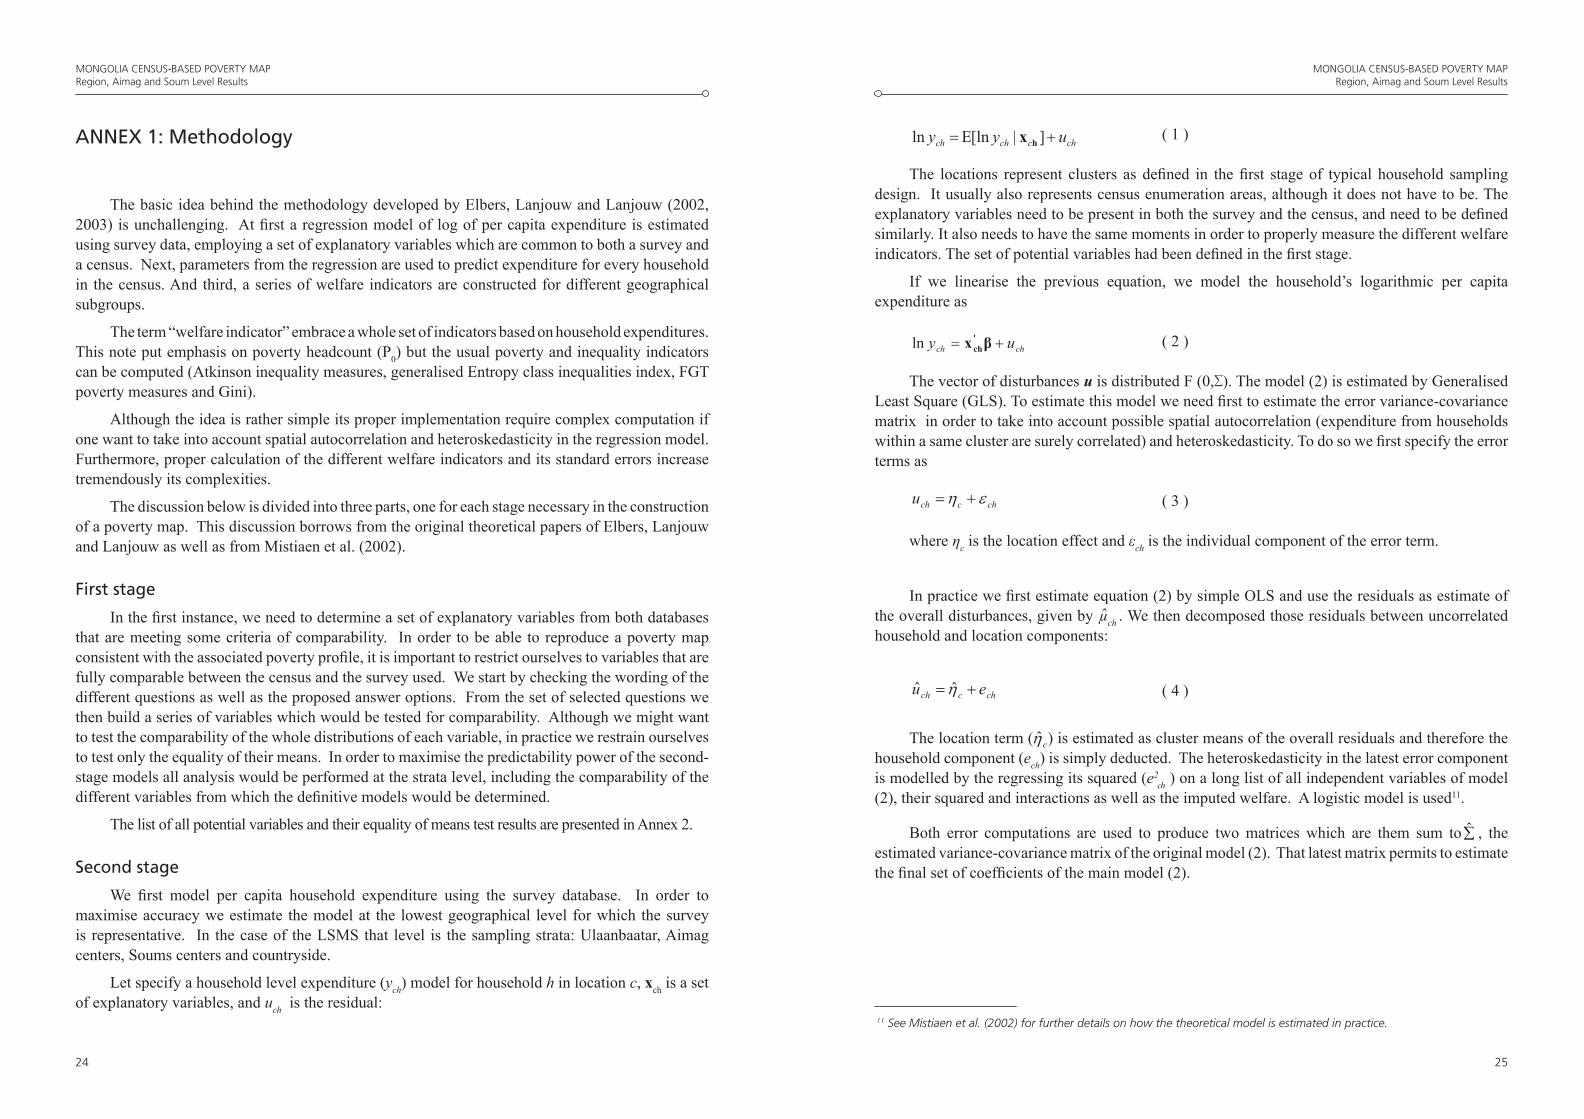
( 1 )
The locations represent clusters as defi ned in the fi rst stage of typical household sampling design. It usually also represents census enumeration areas, although it does not have to be. The explanatory variables need to be present in both the survey and the census, and need to be defi ned similarly. It also needs to have the same moments in order to properly measure the different welfare indicators. The set of potential variables had been defi ned in the fi rst stage.
If we linearise the previous equation, we model the household’s logarithmic per capita expenditure as
( 2 )
The vector of disturbances u is distributed F (0,∑). The model (2) is estimated by Generalised Least Square (GLS). To estimate this model we need fi rst to estimate the error variance-covariance matrix in order to take into account possible spatial autocorrelation (expenditure from households within a same cluster are surely correlated) and heteroskedasticity. To do so we fi rst specify the error terms as
( 3 )
where ηc is the location effect and εch is the individual component of the error term.
In practice we fi rst estimate equation (2) by simple OLS and use the residuals as estimate of the overall disturbances, given by µch
ˆ . We then decomposed those residuals between uncorrelated household and location components:
( 4 )
The location term ( cˆ ) is estimated as cluster means of the overall residuals and therefore the household component (ech) is simply deducted. The heteroskedasticity in the latest error component is modelled by the regressing its squared (e2
ch ) on a long list of all independent variables of model (2), their squared and interactions as well as the imputed welfare. A logistic model is used11.
Both error computations are used to produce two matrices which are them sum to ∑̂ , the estimated variance-covariance matrix of the original model (2). That latest matrix permits to estimate the fi nal set of coeffi cients of the main model (2).
ANNEX 1: Methodology
The basic idea behind the methodology developed by Elbers, Lanjouw and Lanjouw (2002, 2003) is unchallenging. At fi rst a regression model of log of per capita expenditure is estimated using survey data, employing a set of explanatory variables which are common to both a survey and a census. Next, parameters from the regression are used to predict expenditure for every household in the census. And third, a series of welfare indicators are constructed for different geographical subgroups.
The term “welfare indicator” embrace a whole set of indicators based on household expenditures. This note put emphasis on poverty headcount (P0) but the usual poverty and inequality indicators can be computed (Atkinson inequality measures, generalised Entropy class inequalities index, FGT poverty measures and Gini).
Although the idea is rather simple its proper implementation require complex computation if one want to take into account spatial autocorrelation and heteroskedasticity in the regression model. Furthermore, proper calculation of the different welfare indicators and its standard errors increase tremendously its complexities.
The discussion below is divided into three parts, one for each stage necessary in the construction of a poverty map. This discussion borrows from the original theoretical papers of Elbers, Lanjouw and Lanjouw as well as from Mistiaen et al. (2002).
First stage
In the fi rst instance, we need to determine a set of explanatory variables from both databases that are meeting some criteria of comparability. In order to be able to reproduce a poverty map consistent with the associated poverty profi le, it is important to restrict ourselves to variables that are fully comparable between the census and the survey used. We start by checking the wording of the different questions as well as the proposed answer options. From the set of selected questions we then build a series of variables which would be tested for comparability. Although we might want to test the comparability of the whole distributions of each variable, in practice we restrain ourselves to test only the equality of their means. In order to maximise the predictability power of the second-stage models all analysis would be performed at the strata level, including the comparability of the different variables from which the defi nitive models would be determined.
The list of all potential variables and their equality of means test results are presented in Annex 2.
Second stage
We fi rst model per capita household expenditure using the survey database. In order to maximise accuracy we estimate the model at the lowest geographical level for which the survey is representative. In the case of the LSMS that level is the sampling strata: Ulaanbaatar, Aimag centers, Soums centers and countryside.
Let specify a household level expenditure (ych) model for household h in location c, xch is a set of explanatory variables, and uch is the residual:
chcchch uyy ]|[lnln hx
chch uy x'chln
chcchu
chcch eu ˆˆ
11 See Mistiaen et al. (2002) for further details on how the theoretical model is estimated in practice.
MONGOLIA CENSUS-BASED POVERTY MAPRegion, Aimag and Soum Level Results
26
MONGOLIA CENSUS-BASED POVERTY MAPRegion, Aimag and Soum Level Results
27
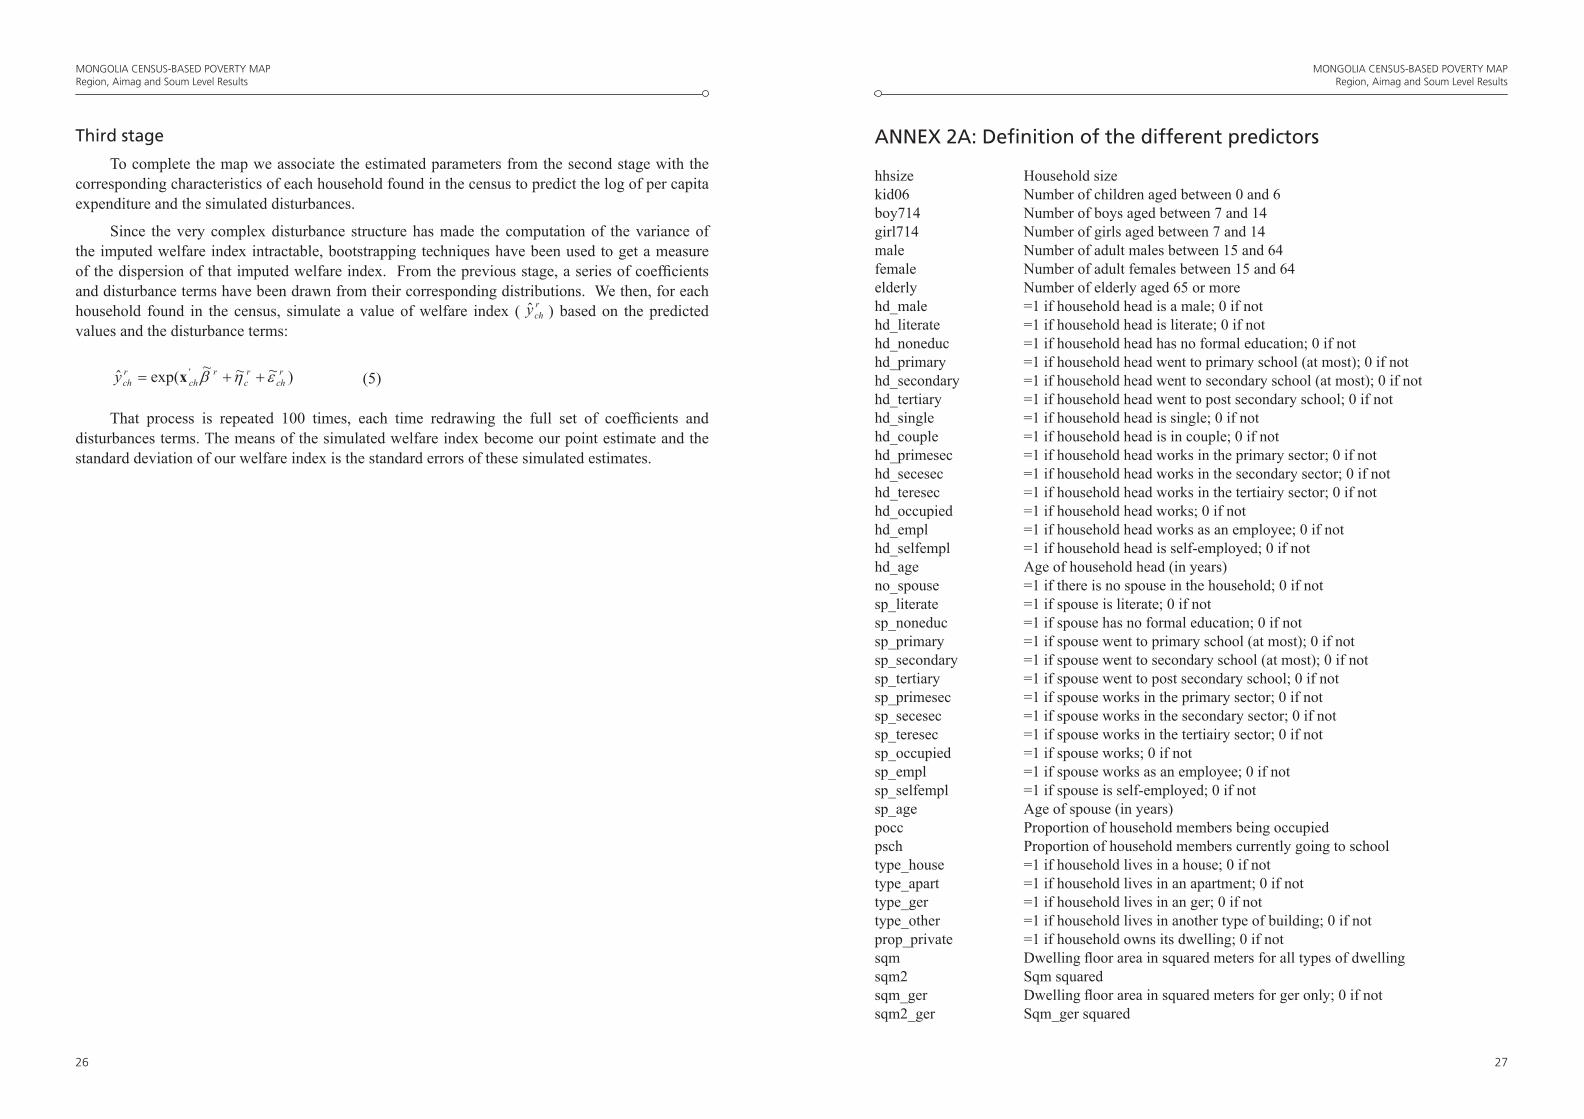
Third stage
To complete the map we associate the estimated parameters from the second stage with the corresponding characteristics of each household found in the census to predict the log of per capita expenditure and the simulated disturbances.
Since the very complex disturbance structure has made the computation of the variance of the imputed welfare index intractable, bootstrapping techniques have been used to get a measure of the dispersion of that imputed welfare index. From the previous stage, a series of coeffi cients and disturbance terms have been drawn from their corresponding distributions. We then, for each household found in the census, simulate a value of welfare index ( ˆ r
chy ) based on the predicted values and the disturbance terms:
(5)
That process is repeated 100 times, each time redrawing the full set of coeffi cients and disturbances terms. The means of the simulated welfare index become our point estimate and the standard deviation of our welfare index is the standard errors of these simulated estimates.
)~~~exp(ˆ ' rch
rc
rch
rchy x
ANNEX 2A: Definition of the different predictors
hhsize Household sizekid06 Number of children aged between 0 and 6boy714 Number of boys aged between 7 and 14girl714 Number of girls aged between 7 and 14male Number of adult males between 15 and 64female Number of adult females between 15 and 64elderly Number of elderly aged 65 or morehd_male =1 if household head is a male; 0 if nothd_literate =1 if household head is literate; 0 if nothd_noneduc =1 if household head has no formal education; 0 if nothd_primary =1 if household head went to primary school (at most); 0 if nothd_secondary =1 if household head went to secondary school (at most); 0 if nothd_tertiary =1 if household head went to post secondary school; 0 if nothd_single =1 if household head is single; 0 if nothd_couple =1 if household head is in couple; 0 if nothd_primesec =1 if household head works in the primary sector; 0 if nothd_secesec =1 if household head works in the secondary sector; 0 if nothd_teresec =1 if household head works in the tertiairy sector; 0 if nothd_occupied =1 if household head works; 0 if nothd_empl =1 if household head works as an employee; 0 if nothd_selfempl =1 if household head is self-employed; 0 if nothd_age Age of household head (in years)no_spouse =1 if there is no spouse in the household; 0 if notsp_literate =1 if spouse is literate; 0 if notsp_noneduc =1 if spouse has no formal education; 0 if notsp_primary =1 if spouse went to primary school (at most); 0 if notsp_secondary =1 if spouse went to secondary school (at most); 0 if notsp_tertiary =1 if spouse went to post secondary school; 0 if notsp_primesec =1 if spouse works in the primary sector; 0 if notsp_secesec =1 if spouse works in the secondary sector; 0 if notsp_teresec =1 if spouse works in the tertiairy sector; 0 if notsp_occupied =1 if spouse works; 0 if notsp_empl =1 if spouse works as an employee; 0 if notsp_selfempl =1 if spouse is self-employed; 0 if notsp_age Age of spouse (in years)pocc Proportion of household members being occupiedpsch Proportion of household members currently going to schooltype_house =1 if household lives in a house; 0 if nottype_apart =1 if household lives in an apartment; 0 if nottype_ger =1 if household lives in an ger; 0 if nottype_other =1 if household lives in another type of building; 0 if notprop_private =1 if household owns its dwelling; 0 if notsqm Dwelling fl oor area in squared meters for all types of dwellingsqm2 Sqm squaredsqm_ger Dwelling fl oor area in squared meters for ger only; 0 if notsqm2_ger Sqm_ger squared
MONGOLIA CENSUS-BASED POVERTY MAPRegion, Aimag and Soum Level Results
28
MONGOLIA CENSUS-BASED POVERTY MAPRegion, Aimag and Soum Level Results
29
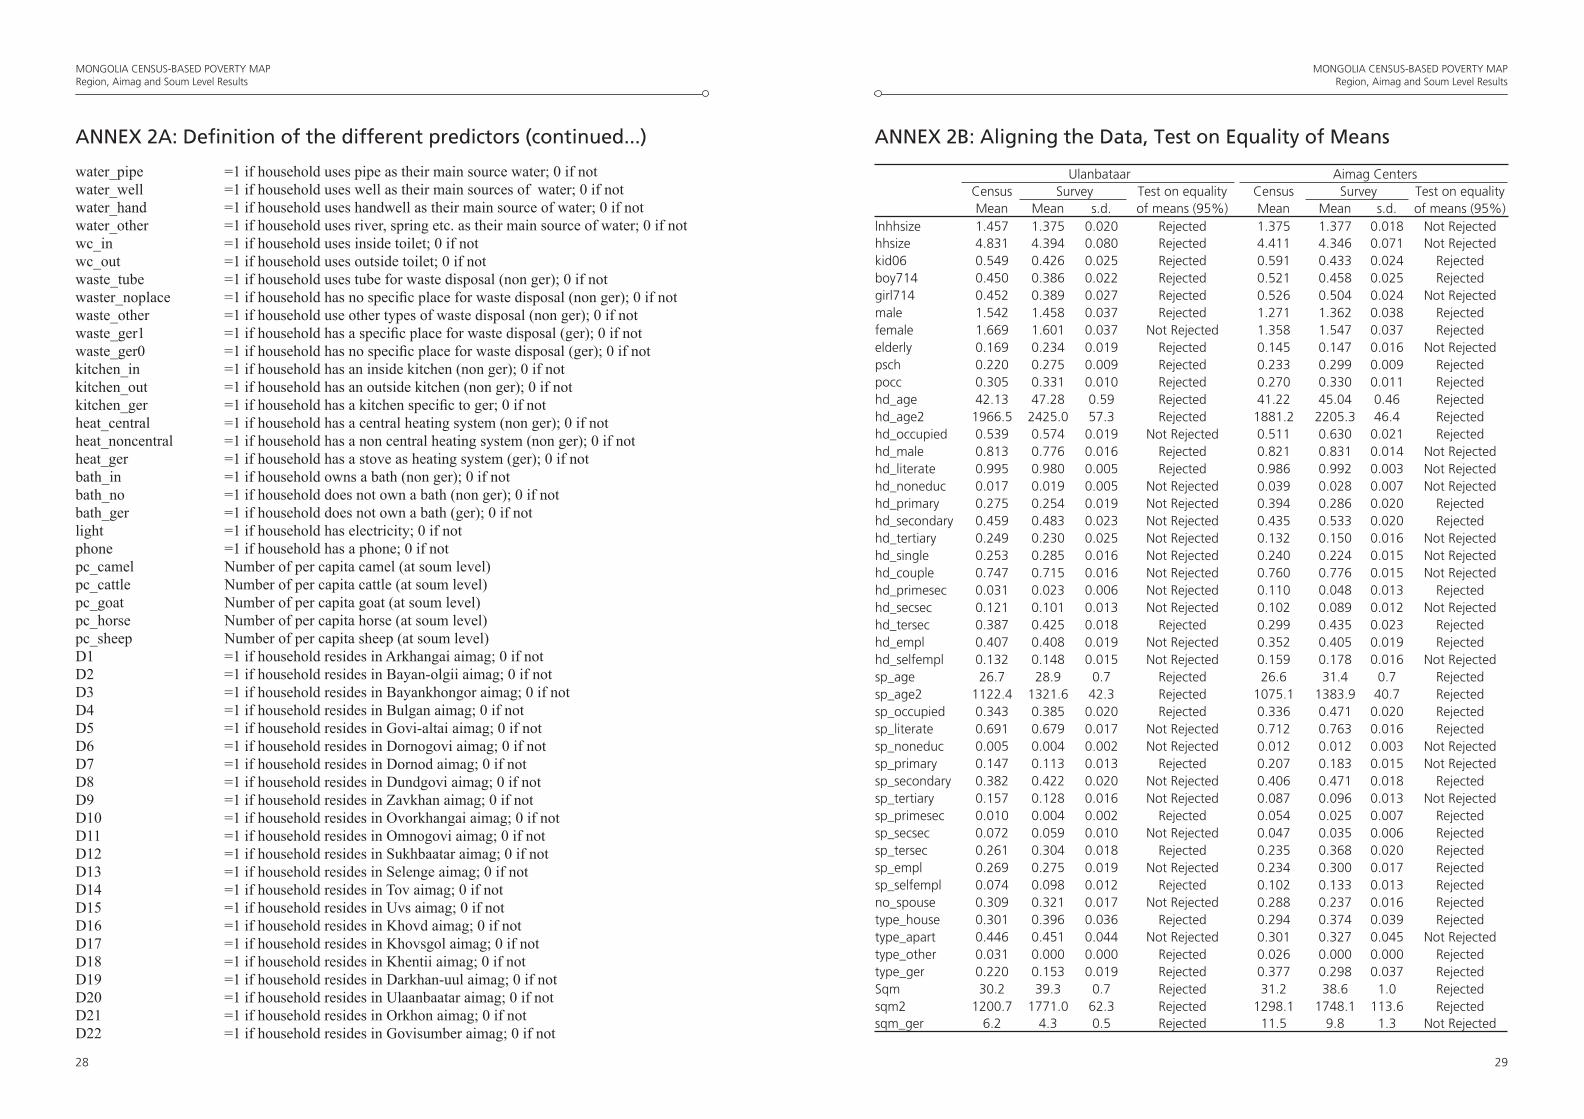
ANNEX 2A: Definition of the different predictors (continued...)
water_pipe =1 if household uses pipe as their main source water; 0 if notwater_well =1 if household uses well as their main sources of water; 0 if notwater_hand =1 if household uses handwell as their main source of water; 0 if notwater_other =1 if household uses river, spring etc. as their main source of water; 0 if notwc_in =1 if household uses inside toilet; 0 if notwc_out =1 if household uses outside toilet; 0 if notwaste_tube =1 if household uses tube for waste disposal (non ger); 0 if notwaster_noplace =1 if household has no specifi c place for waste disposal (non ger); 0 if notwaste_other =1 if household use other types of waste disposal (non ger); 0 if notwaste_ger1 =1 if household has a specifi c place for waste disposal (ger); 0 if notwaste_ger0 =1 if household has no specifi c place for waste disposal (ger); 0 if notkitchen_in =1 if household has an inside kitchen (non ger); 0 if notkitchen_out =1 if household has an outside kitchen (non ger); 0 if notkitchen_ger =1 if household has a kitchen specifi c to ger; 0 if notheat_central =1 if household has a central heating system (non ger); 0 if notheat_noncentral =1 if household has a non central heating system (non ger); 0 if notheat_ger =1 if household has a stove as heating system (ger); 0 if notbath_in =1 if household owns a bath (non ger); 0 if notbath_no =1 if household does not own a bath (non ger); 0 if notbath_ger =1 if household does not own a bath (ger); 0 if notlight =1 if household has electricity; 0 if notphone =1 if household has a phone; 0 if notpc_camel Number of per capita camel (at soum level)pc_cattle Number of per capita cattle (at soum level)pc_goat Number of per capita goat (at soum level)pc_horse Number of per capita horse (at soum level)pc_sheep Number of per capita sheep (at soum level)D1 =1 if household resides in Arkhangai aimag; 0 if notD2 =1 if household resides in Bayan-olgii aimag; 0 if notD3 =1 if household resides in Bayankhongor aimag; 0 if notD4 =1 if household resides in Bulgan aimag; 0 if notD5 =1 if household resides in Govi-altai aimag; 0 if notD6 =1 if household resides in Dornogovi aimag; 0 if notD7 =1 if household resides in Dornod aimag; 0 if notD8 =1 if household resides in Dundgovi aimag; 0 if notD9 =1 if household resides in Zavkhan aimag; 0 if notD10 =1 if household resides in Ovorkhangai aimag; 0 if notD11 =1 if household resides in Omnogovi aimag; 0 if notD12 =1 if household resides in Sukhbaatar aimag; 0 if notD13 =1 if household resides in Selenge aimag; 0 if notD14 =1 if household resides in Tov aimag; 0 if notD15 =1 if household resides in Uvs aimag; 0 if notD16 =1 if household resides in Khovd aimag; 0 if notD17 =1 if household resides in Khovsgol aimag; 0 if notD18 =1 if household resides in Khentii aimag; 0 if notD19 =1 if household resides in Darkhan-uul aimag; 0 if notD20 =1 if household resides in Ulaanbaatar aimag; 0 if notD21 =1 if household resides in Orkhon aimag; 0 if notD22 =1 if household resides in Govisumber aimag; 0 if not
ANNEX 2B: Aligning the Data, Test on Equality of Means
Ulanbataar Aimag CentersCensus Survey Test on equality Census Survey Test on equalityMean Mean s.d. of means (95%) Mean Mean s.d. of means (95%)
lnhhsize 1.457 1.375 0.020 Rejected 1.375 1.377 0.018 Not Rejectedhhsize 4.831 4.394 0.080 Rejected 4.411 4.346 0.071 Not Rejectedkid06 0.549 0.426 0.025 Rejected 0.591 0.433 0.024 Rejectedboy714 0.450 0.386 0.022 Rejected 0.521 0.458 0.025 Rejectedgirl714 0.452 0.389 0.027 Rejected 0.526 0.504 0.024 Not Rejectedmale 1.542 1.458 0.037 Rejected 1.271 1.362 0.038 Rejectedfemale 1.669 1.601 0.037 Not Rejected 1.358 1.547 0.037 Rejectedelderly 0.169 0.234 0.019 Rejected 0.145 0.147 0.016 Not Rejectedpsch 0.220 0.275 0.009 Rejected 0.233 0.299 0.009 Rejectedpocc 0.305 0.331 0.010 Rejected 0.270 0.330 0.011 Rejectedhd_age 42.13 47.28 0.59 Rejected 41.22 45.04 0.46 Rejectedhd_age2 1966.5 2425.0 57.3 Rejected 1881.2 2205.3 46.4 Rejectedhd_occupied 0.539 0.574 0.019 Not Rejected 0.511 0.630 0.021 Rejectedhd_male 0.813 0.776 0.016 Rejected 0.821 0.831 0.014 Not Rejectedhd_literate 0.995 0.980 0.005 Rejected 0.986 0.992 0.003 Not Rejectedhd_noneduc 0.017 0.019 0.005 Not Rejected 0.039 0.028 0.007 Not Rejectedhd_primary 0.275 0.254 0.019 Not Rejected 0.394 0.286 0.020 Rejectedhd_secondary 0.459 0.483 0.023 Not Rejected 0.435 0.533 0.020 Rejectedhd_tertiary 0.249 0.230 0.025 Not Rejected 0.132 0.150 0.016 Not Rejectedhd_single 0.253 0.285 0.016 Not Rejected 0.240 0.224 0.015 Not Rejectedhd_couple 0.747 0.715 0.016 Not Rejected 0.760 0.776 0.015 Not Rejectedhd_primesec 0.031 0.023 0.006 Not Rejected 0.110 0.048 0.013 Rejectedhd_secsec 0.121 0.101 0.013 Not Rejected 0.102 0.089 0.012 Not Rejectedhd_tersec 0.387 0.425 0.018 Rejected 0.299 0.435 0.023 Rejectedhd_empl 0.407 0.408 0.019 Not Rejected 0.352 0.405 0.019 Rejectedhd_selfempl 0.132 0.148 0.015 Not Rejected 0.159 0.178 0.016 Not Rejectedsp_age 26.7 28.9 0.7 Rejected 26.6 31.4 0.7 Rejectedsp_age2 1122.4 1321.6 42.3 Rejected 1075.1 1383.9 40.7 Rejectedsp_occupied 0.343 0.385 0.020 Rejected 0.336 0.471 0.020 Rejectedsp_literate 0.691 0.679 0.017 Not Rejected 0.712 0.763 0.016 Rejectedsp_noneduc 0.005 0.004 0.002 Not Rejected 0.012 0.012 0.003 Not Rejectedsp_primary 0.147 0.113 0.013 Rejected 0.207 0.183 0.015 Not Rejectedsp_secondary 0.382 0.422 0.020 Not Rejected 0.406 0.471 0.018 Rejectedsp_tertiary 0.157 0.128 0.016 Not Rejected 0.087 0.096 0.013 Not Rejectedsp_primesec 0.010 0.004 0.002 Rejected 0.054 0.025 0.007 Rejectedsp_secsec 0.072 0.059 0.010 Not Rejected 0.047 0.035 0.006 Rejectedsp_tersec 0.261 0.304 0.018 Rejected 0.235 0.368 0.020 Rejectedsp_empl 0.269 0.275 0.019 Not Rejected 0.234 0.300 0.017 Rejectedsp_selfempl 0.074 0.098 0.012 Rejected 0.102 0.133 0.013 Rejectedno_spouse 0.309 0.321 0.017 Not Rejected 0.288 0.237 0.016 Rejectedtype_house 0.301 0.396 0.036 Rejected 0.294 0.374 0.039 Rejectedtype_apart 0.446 0.451 0.044 Not Rejected 0.301 0.327 0.045 Not Rejectedtype_other 0.031 0.000 0.000 Rejected 0.026 0.000 0.000 Rejectedtype_ger 0.220 0.153 0.019 Rejected 0.377 0.298 0.037 RejectedSqm 30.2 39.3 0.7 Rejected 31.2 38.6 1.0 Rejectedsqm2 1200.7 1771.0 62.3 Rejected 1298.1 1748.1 113.6 Rejectedsqm_ger 6.2 4.3 0.5 Rejected 11.5 9.8 1.3 Not Rejected
MONGOLIA CENSUS-BASED POVERTY MAPRegion, Aimag and Soum Level Results
30
MONGOLIA CENSUS-BASED POVERTY MAPRegion, Aimag and Soum Level Results
31
sqm2_ger 183.6 123.8 15.5 Rejected 396.9 370.5 66.8 Not Rejectedheat_central 0.469 0.447 0.045 Not Rejected 0.302 0.305 0.043 Not Rejectedheat_noncent. 0.311 0.400 0.036 Rejected 0.321 0.396 0.038 Not Rejectedheat_ger 0.220 0.153 0.019 Rejected 0.377 0.298 0.037 Rejectedwater_pipe 0.475 0.467 0.046 Not Rejected 0.320 0.357 0.046 Not Rejectedwater_well 0.444 0.423 0.044 Not Rejected 0.417 0.389 0.039 Not Rejectedwater_hand 0.005 0.001 0.001 Rejected 0.084 0.035 0.011 Rejectedwater_other 0.076 0.109 0.026 Not Rejected 0.179 0.219 0.030 Not Rejectedwaste_tube 0.230 0.237 0.038 Not Rejected 0.019 0.043 0.015 Not Rejectedwaste_noplace 0.051 0.042 0.014 Not Rejected 0.062 0.071 0.015 Not Rejectedwaste_other 0.499 0.567 0.036 Not Rejected 0.542 0.588 0.036 Not Rejectedwaste_ger1 0.160 0.126 0.017 Rejected 0.289 0.272 0.034 Not Rejectedwaste_ger0 0.060 0.028 0.011 Rejected 0.088 0.026 0.010 Rejectedwc_in 0.484 0.483 0.045 Not Rejected 0.331 0.358 0.045 Not Rejectedwc_out 0.516 0.517 0.045 Not Rejected 0.669 0.642 0.045 Not Rejectedkitchen_in 0.668 0.627 0.035 Not Rejected 0.512 0.510 0.041 Not Rejectedkitchen_out 0.112 0.219 0.026 Rejected 0.112 0.192 0.024 Rejectedkitchen_ger 0.220 0.000 0.000 Rejected 0.377 0.000 0.000 Rejectedbath_in 0.458 0.463 0.045 Not Rejected 0.292 0.335 0.045 Not Rejectedbath_no 0.322 0.401 0.036 Rejected 0.331 0.375 0.038 Not Rejectedbath_ger 0.220 0.153 0.019 Rejected 0.377 0.298 0.037 Rejectedprop_private 0.875 0.931 0.020 Rejected 0.866 0.934 0.020 Rejectedlight 0.977 0.991 0.003 Rejected 0.915 0.796 0.035 Rejectedphone 0.347 0.440 0.036 Rejected 0.234 0.410 0.024 Rejectedd1 0.000 0.000 0.000 Not Rejected 0.037 0.033 0.019 Not Rejectedd2 0.000 0.000 0.000 Not Rejected 0.045 0.042 0.021 Not Rejectedd3 0.000 0.000 0.000 Not Rejected 0.043 0.046 0.020 Not Rejectedd4 0.000 0.000 0.000 Not Rejected 0.027 0.022 0.015 Not Rejectedd5 0.000 0.000 0.000 Not Rejected 0.030 0.033 0.019 Not Rejectedd6 0.000 0.000 0.000 Not Rejected 0.036 0.032 0.017 Not Rejectedd7 0.000 0.000 0.000 Not Rejected 0.078 0.087 0.030 Not Rejectedd8 0.000 0.000 0.000 Not Rejected 0.028 0.022 0.015 Not Rejectedd9 0.000 0.000 0.000 Not Rejected 0.035 0.032 0.017 Not Rejectedd10 0.000 0.000 0.000 Not Rejected 0.038 0.043 0.021 Not Rejectedd11 0.000 0.000 0.000 Not Rejected 0.028 0.022 0.015 Not Rejectedd12 0.000 0.000 0.000 Not Rejected 0.030 0.033 0.019 Not Rejectedd13 0.000 0.000 0.000 Not Rejected 0.044 0.042 0.019 Not Rejectedd14 0.000 0.000 0.000 Not Rejected 0.029 0.033 0.019 Not Rejectedd15 0.000 0.000 0.000 Not Rejected 0.048 0.054 0.023 Not Rejectedd16 0.000 0.000 0.000 Not Rejected 0.044 0.043 0.018 Not Rejectedd17 0.000 0.000 0.000 Not Rejected 0.056 0.055 0.024 Not Rejectedd18 0.000 0.000 0.000 Not Rejected 0.036 0.033 0.019 Not Rejectedd19 0.000 0.000 0.000 Not Rejected 0.129 0.131 0.034 Not Rejectedd20 1.000 1.000 0.000 Not Rejected 0.000 0.000 0.000 Not Rejectedd21 0.000 0.000 0.000 Not Rejected 0.140 0.142 0.036 Not Rejectedd22 0.000 0.000 0.000 Not Rejected 0.018 0.022 0.015 Not Rejectedpc_camel 0.000 0.000 0.000 Not Rejected 0.012 0.011 0.002 Not Rejectedpc_cattle 0.061 0.057 0.006 Not Rejected 0.273 0.273 0.020 Not Rejectedpc_goat 0.094 0.088 0.013 Not Rejected 1.005 0.968 0.086 Not Rejectedpc_horse 0.024 0.021 0.004 Not Rejected 0.204 0.199 0.023 Not Rejected
pc_sheep 0.130 0.119 0.021 Not Rejected 1.179 1.151 0.101 Not Rejected
Soum center CountrysideCensus Survey Test on equality Census Survey Test on equalityMean Mean s.d. of means (95%) Mean Mean s.d. of means (95%)
lnhhsize 1.362 1.386 0.020 Not Rejected 1.289 1.300 0.028 Not Rejected
hhsize 4.385 4.415 0.074 Not Rejected 4.125 4.141 0.094 Not Rejectedkid06 0.673 0.493 0.035 Rejected 0.791 0.742 0.042 Not Rejectedboy714 0.582 0.468 0.027 Rejected 0.384 0.443 0.027 Rejectedgirl714 0.585 0.505 0.032 Rejected 0.358 0.414 0.028 Not Rejectedmale 1.185 1.434 0.045 Rejected 1.252 1.254 0.038 Not Rejectedfemale 1.214 1.555 0.035 Rejected 1.175 1.243 0.038 Not Rejectedelderly 0.146 0.107 0.013 Rejected 0.164 0.184 0.018 Not Rejectedpsch 0.240 0.295 0.010 Rejected 0.389 0.150 0.008 Rejectedpocc 0.262 0.368 0.013 Rejected 0.515 0.563 0.014 Rejectedhd_age 41.4 43.9 0.5 Rejected 40.9 41.6 0.7 Not Rejectedhd_age2 1919.3 2088.9 50.0 Rejected 1928.7 1968.4 62.6 Not Rejectedhd_occupied 0.525 0.686 0.022 Rejected 0.799 0.861 0.017 Rejectedhd_male 0.831 0.851 0.015 Not Rejected 0.876 0.871 0.016 Not Rejectedhd_literate 0.980 0.986 0.004 Not Rejected 0.963 0.953 0.009 Not Rejectedhd_noneduc 0.059 0.035 0.007 Rejected 0.102 0.128 0.013 Not Rejectedhd_primary 0.488 0.396 0.022 Rejected 0.722 0.655 0.019 Rejectedhd_secondary 0.381 0.491 0.023 Rejected 0.166 0.197 0.017 Not Rejectedhd_tertiary 0.072 0.075 0.011 Not Rejected 0.010 0.012 0.005 Not Rejectedhd_single 0.245 0.210 0.018 Not Rejected 0.249 0.237 0.022 Not Rejectedhd_couple 0.755 0.790 0.018 Not Rejected 0.751 0.763 0.022 Not Rejectedhd_primesec 0.202 0.081 0.013 Rejected 0.765 0.055 0.019 Rejectedhd_secsec 0.057 0.047 0.008 Not Rejected 0.003 0.009 0.004 Not Rejectedhd_tersec 0.267 0.335 0.022 Rejected 0.031 0.056 0.011 Rejectedhd_empl 0.310 0.351 0.023 Not Rejected 0.049 0.057 0.012 Not Rejectedhd_selfempl 0.214 0.116 0.013 Rejected 0.750 0.064 0.019 Rejectedsp_age 26.4 30.5 0.8 Rejected 26.2 27.9 0.9 Not Rejectedsp_age2 1050.2 1273.4 43.7 Rejected 1064.1 1152.0 51.2 Not Rejectedsp_occupied 0.348 0.555 0.020 Rejected 0.585 0.653 0.026 Rejectedsp_literate 0.721 0.776 0.017 Rejected 0.728 0.751 0.022 Not Rejectedsp_noneduc 0.018 0.007 0.003 Rejected 0.039 0.050 0.009 Not Rejectedsp_primary 0.258 0.213 0.018 Rejected 0.489 0.433 0.021 Rejectedsp_secondary 0.395 0.504 0.023 Rejected 0.196 0.262 0.020 Rejectedsp_tertiary 0.049 0.048 0.008 Not Rejected 0.004 0.004 0.002 Not Rejectedsp_primesec 0.096 0.026 0.007 Rejected 0.564 0.034 0.012 Rejectedsp_secsec 0.026 0.035 0.010 Not Rejected 0.001 0.003 0.002 Not Rejectedsp_tersec 0.226 0.318 0.023 Rejected 0.020 0.036 0.008 Rejectedsp_empl 0.220 0.285 0.021 Rejected 0.024 0.034 0.008 Not Rejectedsp_selfempl 0.128 0.096 0.013 Rejected 0.561 0.038 0.012 Rejectedno_spouse 0.279 0.224 0.017 Rejected 0.272 0.249 0.022 Not Rejectedtype_house 0.358 0.386 0.040 Not Rejected 0.089 0.095 0.027 Not Rejectedtype_apart 0.100 0.120 0.035 Not Rejected 0.006 0.001 0.001 Rejectedtype_other 0.026 0.002 0.002 Rejected 0.005 0.000 0.000 Rejectedtype_ger 0.515 0.493 0.042 Not Rejected 0.899 0.904 0.027 Not Rejectedsqm 31.2 35.7 0.9 Rejected 30.4 29.5 0.9 Not Rejectedsqm2 1266.1 1524.4 90.2 Rejected 1065.4 961.1 65.1 Not Rejectedsqm_ger 15.8 15.1 1.4 Not Rejected 27.5 26.0 1.1 Not Rejectedsqm2_ger 538.9 514.6 66.9 Not Rejected 940.0 818.3 65.9 Not Rejected
ANNEX 2B: Aligning the Data, Test on Equality of Means (continued...)ANNEX 2B: Aligning the Data, Test on Equality of Means (continued...)
MONGOLIA CENSUS-BASED POVERTY MAPRegion, Aimag and Soum Level Results
32
MONGOLIA CENSUS-BASED POVERTY MAPRegion, Aimag and Soum Level Results
33
heat_central 0.054 0.070 0.028 Not Rejected 0.001 0.000 0.000 Not Rejectedheat_noncent. 0.432 0.437 0.040 Not Rejected 0.100 0.095 0.027 Not Rejectedheat_ger 0.515 0.493 0.042 Not Rejected 0.899 0.904 0.027 Not Rejectedwater_pipe 0.069 0.097 0.033 Not Rejected 0.002 0.004 0.002 Not Rejectedwater_well 0.351 0.514 0.041 Rejected 0.080 0.218 0.027 Rejectedwater_hand 0.184 0.123 0.023 Rejected 0.232 0.250 0.029 Not Rejectedwater_other 0.396 0.266 0.031 Rejected 0.685 0.527 0.040 Rejectedwaste_tube 0.001 0.007 0.006 Not Rejected 0.000 0.000 0.000 Rejectedwaste_noplace 0.061 0.127 0.025 Rejected 0.033 0.058 0.021 Not Rejectedwaste_other 0.423 0.373 0.032 Not Rejected 0.068 0.038 0.011 Rejectedwaste_ger1 0.443 0.361 0.036 Rejected 0.596 0.286 0.024 Rejectedwaste_ger0 0.072 0.131 0.019 Rejected 0.303 0.618 0.030 Rejectedwc_in 0.064 0.099 0.034 Not Rejected 0.001 0.010 0.003 Rejectedwc_out 0.936 0.900 0.034 Not Rejected 0.999 0.990 0.003 Rejectedkitchen_in 0.365 0.279 0.034 Rejected 0.032 0.038 0.012 Not Rejectedkitchen_out 0.121 0.228 0.028 Rejected 0.069 0.057 0.019 Not Rejectedkitchen_ger 0.515 0.001 0.001 Rejected 0.899 0.000 0.000 Rejectedbath_in 0.056 0.074 0.028 Not Rejected 0.002 0.004 0.003 Not Rejectedbath_no 0.429 0.440 0.042 Not Rejected 0.099 0.096 0.027 Not Rejectedbath_ger 0.515 0.493 0.042 Not Rejected 0.899 0.904 0.027 Not Rejectedprop_private 0.893 0.943 0.015 Rejected 0.985 0.986 0.006 Not Rejectedlight 0.815 0.622 0.043 Rejected 0.094 0.113 0.022 Not Rejectedphone 0.074 0.168 0.022 Rejected 0.004 0.027 0.006 Rejectedd1 0.050 0.039 0.014 Not Rejected 0.094 0.095 0.032 Not Rejectedd2 0.038 0.016 0.008 Rejected 0.063 0.050 0.024 Not Rejectedd3 0.038 0.034 0.012 Not Rejected 0.073 0.096 0.040 Not Rejectedd4 0.052 0.034 0.016 Not Rejected 0.043 0.044 0.022 Not Rejectedd5 0.037 0.050 0.023 Not Rejected 0.047 0.035 0.019 Not Rejectedd6 0.042 0.027 0.014 Not Rejected 0.022 0.042 0.021 Not Rejectedd7 0.040 0.034 0.017 Not Rejected 0.024 0.038 0.024 Not Rejectedd8 0.027 0.027 0.014 Not Rejected 0.039 0.042 0.021 Not Rejectedd9 0.059 0.059 0.024 Not Rejected 0.071 0.038 0.019 Not Rejectedd10 0.064 0.083 0.030 Not Rejected 0.100 0.126 0.037 Not Rejectedd11 0.022 0.012 0.007 Not Rejected 0.038 0.053 0.026 Not Rejectedd12 0.032 0.030 0.023 Not Rejected 0.037 0.041 0.021 Not Rejectedd13 0.138 0.167 0.042 Not Rejected 0.022 0.000 0.000 Rejectedd14 0.095 0.099 0.036 Not Rejected 0.066 0.055 0.022 Not Rejectedd15 0.048 0.026 0.019 Not Rejected 0.061 0.041 0.023 Not Rejectedd16 0.044 0.065 0.023 Not Rejected 0.053 0.078 0.037 Not Rejectedd17 0.069 0.064 0.025 Not Rejected 0.094 0.077 0.035 Not Rejectedd18 0.065 0.054 0.023 Not Rejected 0.041 0.041 0.021 Not Rejectedd19 0.028 0.079 0.038 Not Rejected 0.008 0.007 0.004 Not Rejectedd20 0.000 0.000 0.000 Not Rejected 0.000 0.000 0.000 Not Rejectedd21 0.006 0.000 0.000 Rejected 0.002 0.000 0.000 Rejectedd22 0.005 0.000 0.000 Rejected 0.002 0.000 0.000 Rejectedpc_camel 0.195 0.141 0.025 Rejected 0.290 0.305 0.058 Not Rejectedpc_cattle 1.703 1.445 0.122 Rejected 1.940 1.799 0.152 Not Rejectedpc_goat 7.059 6.832 0.614 Not Rejected 9.390 10.909 0.694 Rejectedpc_horse 1.727 1.514 0.142 Not Rejected 2.017 2.215 0.127 Not Rejectedpc_sheep 8.875 7.595 0.618 Rejected 10.865 11.273 0.502 Not Rejected
ANNEX 3: Survey-Based Regression models
Strata 1: Ulaan Baatar======================== OLS Result =========================Number of observation 900R-square 0.548672Adj. R-square 0.541533------------------------------------------------------------------------------------------------------- Var Coef. Std.Err. t Prob>|t| ------------------------------------------------------------------------------------------------------- Intercept 10.7544755 0.0822209 130.8 <.0001 LNHHSIZE -0.7228205 0.0385762 -18.737 <.0001 FEMALE 0.0739601 0.017629 4.195 <.0001 HD_COUPLE 0.1412452 0.0342318 4.126 <.0001 HD_SECONDARY 0.1045362 0.0345605 3.025 0.0026 HD_TERTIARY 0.1019642 0.0462966 2.202 0.0279 HD_SELFEMPL 0.0873552 0.041443 2.108 0.0353 SP_TERTIARY 0.1661477 0.049679 3.344 0.0009 TYPE_APART -0.129166 0.0524122 -2.464 0.0139 KITCHEN_IN 0.2376894 0.0401674 5.917 <.0001 BATH_IN 0.3572596 0.0592011 6.035 <.0001 MWATER_PIPE -0.2610317 0.0758072 -3.443 0.0006 MHD_SECSEC -0.5801557 0.2027296 -2.862 0.0043 MPHONE 0.3889401 0.102858 3.781 0.0002 MPOCC 1.0832016 0.2347806 4.614 <.0001-------------------------------------------------------------------------------------------------------
Strata 2: Aimag Centers======================== OLS Result =========================Number of observation 832R-square 0.402116Adj. R-square 0.392614------------------------------------------------------------------------------------------------------- Var Coef. Std.Err. t Prob>|t| ------------------------------------------------------------------------------------------------------- Intercept 11.150459 0.0624307 178.605 <.0001 LNHHSIZE -0.6854656 0.0400043 -17.135 <.0001 HD_NONEDUC -0.2721329 0.1039825 -2.617 0.009 HD_TERTIARY 0.2538077 0.0528382 4.803 <.0001 HD_COUPLE 0.193304 0.0456093 4.238 <.0001 HD_SELFEMPL 0.1068693 0.0437938 2.44 0.0149 SP_PRIMARY -0.2046923 0.0460533 -4.445 <.0001 SP_TERTIARY 0.1458033 0.0650776 2.24 0.0253 WASTE_NOPLACE -0.2265559 0.0647765 -3.498 0.0005 KITCHEN_IN 0.2058542 0.0359761 5.722 <.0001 D5 0.4039239 0.0948102 4.26 <.0001 D7 -0.1922775 0.0596822 -3.222 0.0013 D10 0.3799135 0.082687 4.595 <.0001 D21 -0.216682 0.0490518 -4.417 <.0001-------------------------------------------------------------------------------------------------------
ANNEX 2B: Aligning the Data, Test on Equality of Means (continued...)
MONGOLIA CENSUS-BASED POVERTY MAPRegion, Aimag and Soum Level Results
34
MONGOLIA CENSUS-BASED POVERTY MAPRegion, Aimag and Soum Level Results
35
Strata 3: Soum Centers======================== OLS Result =========================Number of observation 881R-square 0.349448Adj. R-square 0.338166------------------------------------------------------------------------------------------------------- Var Coef. Std.Err. t Prob>|t| ------------------------------------------------------------------------------------------------------- Intercept 10.6423217 0.08134 130.838 <.0001 LNHHSIZE -0.6681926 0.039669 -16.844 <.0001 HD_TERTIARY 0.2462252 0.0645601 3.814 0.0001 HD_COUPLE 0.2239208 0.0477714 4.687 <.0001 SP_TERTIARY 0.2393702 0.0799199 2.995 0.0028 TYPE_APART -0.2168486 0.084169 -2.576 0.0101 HEAT_CENTRAL 0.7584392 0.1257711 6.03 <.0001 HEAT_NONCENTRA 0.5746234 0.0988173 5.815 <.0001 BATH_NO -0.4257321 0.0930059 -4.577 <.0001 D17 -0.2265886 0.0698406 -3.244 0.0012 PC_HORSE 0.0833704 0.0138399 6.024 <.0001 MWATER_PIPE -0.6093846 0.2221793 -2.743 0.0062 MWC_IN 0.3985698 0.2414164 1.651 0.0991 MHD_PRIMESEC 0.3883673 0.1127084 3.446 0.0006 MHD_TERSEC 0.4593803 0.1393908 3.296 0.001 MPHONE .3799708 0.1837432 2.068 0.0389-------------------------------------------------------------------------------------------------------
Strata 4: Countryside
======================== OLS Result =========================Number of observation 681R-square 0.517706Adj. R-square 0.506827------------------------------------------------------------------------------------------------------- Var Coef. Std.Err. t Prob>|t| ------------------------------------------------------------------------------------------------------- Intercept 11.9171628 0.5268165 22.621 <.0001 LNHHSIZE -0.7935577 0.0394921 -20.094 <.0001 FEMALE 0.0804277 0.023412 3.435 0.0006 SP_AGE 0.0057955 0.0009655 6.003 <.0001 SP_NONEDUC -0.2177647 0.0768717 -2.833 0.0048 TYPE_HOUSE -0.7321858 0.527898 -1.387 0.1659 SQM_GER 0.0272382 0.0074248 3.669 0.0003 SQM2_GER -0.0002809 0.0000975 -2.882 0.0041 WATER_HAND 0.1000438 0.0390071 2.565 0.0105 HEAT_GER -1.4127738 0.5424259 -2.605 0.0094 D4 0.5057022 0.0791851 6.386 <.0001 D10 0.3167776 0.0506464 6.255 <.0001 D11 0.3895039 0.0744912 5.229 <.0001 D12 0.4536723 0.0848734 5.345 <.0001 D16 -0.3249821 0.0653646 -4.972 <.0001 D18 0.4197939 0.0834939 5.028 <.0001-------------------------------------------------------------------------------------------------------
ANNEX 4: Poverty Indices, by Region, Aimag and Soum
Census Code
AdministrativeStructure
Population Poverty
Headcount(P0)
Poverty Gap Index(P1)
Poverty Severity Index
(P2)
Number of Poor
Individuals
10000 West 423,426 0.463 0.149 0.066 196,046
(0.027) (0.014) (0.008)10200 Bayan-olgii 91,602 0.434 0.132 0.056 39,755
(0.042) (0.019) (0.010)
10201 Altai 3,770 0.433 0.128 0.053 1,632
(0.069) (0.031) (0.016)
10202 Altantsogts 2,987 0.432 0.131 0.055 1,290
(0.077) (0.034) (0.018)
10203 Bayannuur 5,045 0.466 0.143 0.061 2,351
(0.068) (0.030) (0.016)
10204 Bugat 3,470 0.468 0.145 0.062 1,624
(0.078) (0.038) (0.021)
10205 Bulgan 5,716 0.471 0.145 0.062 2,692
(0.072) (0.033) (0.018)
10206 Buyant 2,860 0.480 0.149 0.064 1,373
(0.082) (0.037) (0.021)
10207 Deluun 7,824 0.435 0.128 0.053 3,403
(0.064) (0.029) (0.015)
10208 Nogoonnuur 6,946 0.478 0.149 0.065 3,320
(0.064) (0.030) (0.017)
10209 Sagsai 4,459 0.458 0.139 0.059 2,042
(0.073) (0.032) (0.017)
10210 Tolbo 4,408 0.470 0.143 0.060 2,072
(0.074) (0.034) (0.018)
10211 Ulaankhus 7,845 0.492 0.155 0.067 3,860
(0.069) (0.033) (0.018)
10212 Tsengel 7,826 0.444 0.135 0.057 3,475
(0.064) (0.028) (0.015)
10213 Olgii 26,146 0.365 0.109 0.046 9,543
(0.024) (0.011) (0.006)
10214 Tsagaannuur 2,300 0.482 0.163 0.075 1,109
(0.065) (0.032) (0.019)
10500 Govi-altai 64,141 0.395 0.120 0.051 25,336(0.039) (0.016) (0.008)
10501 Altai 2,512 0.427 0.131 0.056 1,073
(0.067) (0.029) (0.016)
10502 Bayan-Uul 3,605 0.471 0.144 0.061 1,698
(0.049) (0.022) (0.011)
10503 Biger 2,711 0.459 0.138 0.058 1,244
(0.069) (0.030) (0.016)
10504 Bugat 2,826 0.515 0.165 0.073 1,455
(0.077) (0.037) (0.021)
MONGOLIA CENSUS-BASED POVERTY MAPRegion, Aimag and Soum Level Results
36
MONGOLIA CENSUS-BASED POVERTY MAPRegion, Aimag and Soum Level Results
37
10505 Darvi 2,120 0.446 0.134 0.056 946
(0.062) (0.026) (0.014)
10506 Delger 4,067 0.457 0.144 0.063 1,859
(0.076) (0.036) (0.020)
10507 Jargalan 2,737 0.471 0.144 0.061 1,289
(0.049) (0.022) (0.011)
10508 Taishir 1,841 0.425 0.123 0.051 782
(0.078) (0.032) (0.016)
10509 Tonkhil 2,941 0.446 0.134 0.056 1,312
(0.062) (0.026) (0.014)
10510 Togrog 2,181 0.477 0.149 0.064 1,040
(0.078) (0.035) (0.019)
10511 Khaliun 3,241 0.482 0.147 0.062 1,562
(0.077) (0.034) (0.018)
10512 Khokhmorit 2,726 0.471 0.144 0.061 1,284
(0.049) (0.022) (0.011)
10513 Tsogt 4,417 0.500 0.162 0.072 2,209
(0.064) (0.030) (0.017)
10514 Tseel 2,707 0.476 0.149 0.064 1,289
(0.063) (0.029) (0.016)
10515 Chandmana 2,731 0.490 0.152 0.066 1,338
(0.077) (0.037) (0.021)
10516 Sharga 2,377 0.465 0.140 0.059 1,105
(0.079) (0.034) (0.018)
10517 Erdene 2,496 0.508 0.160 0.070 1,268
(0.078) (0.037) (0.021)
10518 Yosonbulag 15,905 0.161 0.040 0.015 2,561
(0.056) (0.017) (0.007)
10900 Zavkhan 90,782 0.436 0.133 0.057 39,581(0.032) (0.015) (0.008)
10901 Aldarkhaan 4,332 0.440 0.131 0.055 1,906
(0.069) (0.032) (0.017)
10902 Bayantes 2,699 0.509 0.168 0.076 1,374
(0.072) (0.037) (0.021)
10903 Bayankhairkhan 2,627 0.509 0.168 0.076 1,337
(0.072) (0.037) (0.021)
10904 Dorvoljin 9,820 0.453 0.143 0.062 4,448
(0.051) (0.023) (0.013)
10905 Zavkhanmandal 2,675 0.440 0.130 0.054 1,177
(0.068) (0.031) (0.017)
10906 Ider 1,508 0.428 0.129 0.054 645
(0.057) (0.025) (0.013)
10907 Ikh-Uul 3,545 0.422 0.125 0.052 1,496
(0.056) (0.024) (0.013)
10908 Nomrog 6,710 0.468 0.145 0.062 3,140
(0.053) (0.026) (0.014)
10909 Otgon 2,659 0.420 0.125 0.052 1,117
(0.079) (0.032) (0.016)
10910 Santmargats 3,539 0.439 0.131 0.055 1,554
(0.057) (0.024) (0.013)
10911 Songino 2,295 0.421 0.126 0.053 966
(0.061) (0.026) (0.013)
10912 Tosontsengel 2,228 0.422 0.125 0.052 940
(0.056) (0.024) (0.013)
10913 Tudevtei 2,484 0.421 0.126 0.053 1,046
(0.061) (0.026) (0.013)
10914 Tes 3,219 0.504 0.167 0.075 1,622
(0.074) (0.036) (0.020)
10915 Telmen 3,464 0.428 0.129 0.054 1,483
(0.057) (0.025) (0.013)
10916 Urgamal 2,078 0.453 0.143 0.062 941
(0.051) (0.023) (0.013)
10917 Uliastai 18,548 0.389 0.118 0.050 7,215
(0.025) (0.011) (0.006)
10918 Tsagaankhairkhan 2,000 0.425 0.126 0.052 850
(0.053) (0.023) (0.012)
10919 Tsagaanchuluut 2,096 0.425 0.126 0.052 891
(0.053) (0.023) (0.012)
10920 Tsetsen-Uul 2,680 0.439 0.131 0.055 1,177
(0.057) (0.024) (0.013)
10921 Shiluustei 2,625 0.425 0.126 0.052 1,116
(0.053) (0.023) (0.012)
10922 Erdenekhairkhan 2,625 0.445 0.132 0.055 1,168
(0.051) (0.022) (0.012)
10923 Yaruu 3,267 0.445 0.132 0.055 1,454
(0.051) (0.022) (0.012)
10924 Asgat 1,059 0.504 0.167 0.075 534
(0.074) (0.036) (0.020)
11500 Uvs 90,156 0.467 0.149 0.066 42,103(0.041) (0.020) (0.011)
11501 Baruunturuun 4,818 0.507 0.169 0.077 2,443
(0.073) (0.036) (0.021)
11502 Bokhmoron 2,449 0.483 0.153 0.067 1,183
(0.071) (0.034) (0.019)
11503 Davst 1,872 0.474 0.150 0.066 887
(0.091) (0.041) (0.023)
11504 Zavkhan 2,712 0.479 0.152 0.067 1,299
(0.069) (0.034) (0.019)
11505 Zuungovi 2,735 0.507 0.169 0.077 1,387
(0.073) (0.036) (0.021)
11506 Zuunkhangai 3,329 0.450 0.138 0.059 1,498
(0.058) (0.026) (0.014)
11507 Malchin 3,336 0.443 0.135 0.057 1,478
(0.077) (0.035) (0.019)
11508 Naranbulag 4,430 0.479 0.152 0.067 2,122
(0.065) (0.031) (0.017)
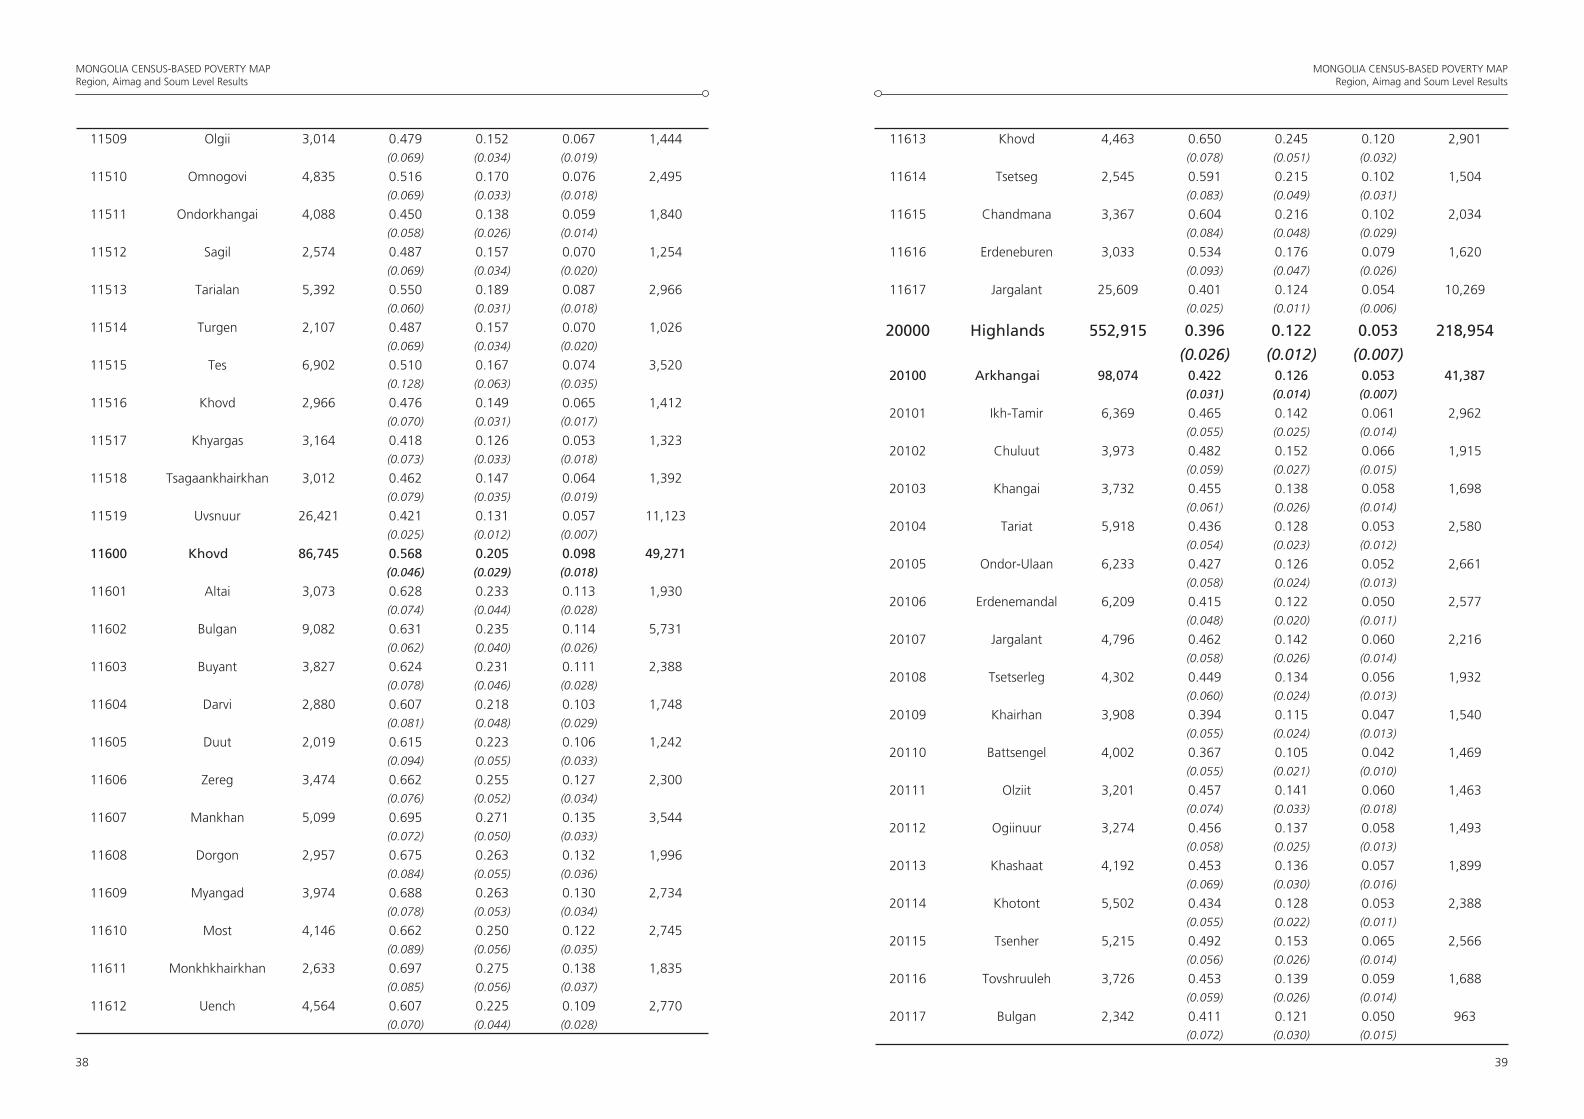
MONGOLIA CENSUS-BASED POVERTY MAPRegion, Aimag and Soum Level Results
38
MONGOLIA CENSUS-BASED POVERTY MAPRegion, Aimag and Soum Level Results
39
11509 Olgii 3,014 0.479 0.152 0.067 1,444
(0.069) (0.034) (0.019)
11510 Omnogovi 4,835 0.516 0.170 0.076 2,495
(0.069) (0.033) (0.018)
11511 Ondorkhangai 4,088 0.450 0.138 0.059 1,840
(0.058) (0.026) (0.014)
11512 Sagil 2,574 0.487 0.157 0.070 1,254
(0.069) (0.034) (0.020)
11513 Tarialan 5,392 0.550 0.189 0.087 2,966
(0.060) (0.031) (0.018)
11514 Turgen 2,107 0.487 0.157 0.070 1,026
(0.069) (0.034) (0.020)
11515 Tes 6,902 0.510 0.167 0.074 3,520
(0.128) (0.063) (0.035)
11516 Khovd 2,966 0.476 0.149 0.065 1,412
(0.070) (0.031) (0.017)
11517 Khyargas 3,164 0.418 0.126 0.053 1,323
(0.073) (0.033) (0.018)
11518 Tsagaankhairkhan 3,012 0.462 0.147 0.064 1,392
(0.079) (0.035) (0.019)
11519 Uvsnuur 26,421 0.421 0.131 0.057 11,123
(0.025) (0.012) (0.007)
11600 Khovd 86,745 0.568 0.205 0.098 49,271(0.046) (0.029) (0.018)
11601 Altai 3,073 0.628 0.233 0.113 1,930
(0.074) (0.044) (0.028)
11602 Bulgan 9,082 0.631 0.235 0.114 5,731
(0.062) (0.040) (0.026)
11603 Buyant 3,827 0.624 0.231 0.111 2,388
(0.078) (0.046) (0.028)
11604 Darvi 2,880 0.607 0.218 0.103 1,748
(0.081) (0.048) (0.029)
11605 Duut 2,019 0.615 0.223 0.106 1,242
(0.094) (0.055) (0.033)
11606 Zereg 3,474 0.662 0.255 0.127 2,300
(0.076) (0.052) (0.034)
11607 Mankhan 5,099 0.695 0.271 0.135 3,544
(0.072) (0.050) (0.033)
11608 Dorgon 2,957 0.675 0.263 0.132 1,996
(0.084) (0.055) (0.036)
11609 Myangad 3,974 0.688 0.263 0.130 2,734
(0.078) (0.053) (0.034)
11610 Most 4,146 0.662 0.250 0.122 2,745
(0.089) (0.056) (0.035)
11611 Monkhkhairkhan 2,633 0.697 0.275 0.138 1,835
(0.085) (0.056) (0.037)
11612 Uench 4,564 0.607 0.225 0.109 2,770
(0.070) (0.044) (0.028)
11613 Khovd 4,463 0.650 0.245 0.120 2,901
(0.078) (0.051) (0.032)
11614 Tsetseg 2,545 0.591 0.215 0.102 1,504
(0.083) (0.049) (0.031)
11615 Chandmana 3,367 0.604 0.216 0.102 2,034
(0.084) (0.048) (0.029)
11616 Erdeneburen 3,033 0.534 0.176 0.079 1,620
(0.093) (0.047) (0.026)
11617 Jargalant 25,609 0.401 0.124 0.054 10,269
(0.025) (0.011) (0.006)
20000 Highlands 552,915 0.396 0.122 0.053 218,954
(0.026) (0.012) (0.007)20100 Arkhangai 98,074 0.422 0.126 0.053 41,387
(0.031) (0.014) (0.007)
20101 Ikh-Tamir 6,369 0.465 0.142 0.061 2,962
(0.055) (0.025) (0.014)
20102 Chuluut 3,973 0.482 0.152 0.066 1,915
(0.059) (0.027) (0.015)
20103 Khangai 3,732 0.455 0.138 0.058 1,698
(0.061) (0.026) (0.014)
20104 Tariat 5,918 0.436 0.128 0.053 2,580
(0.054) (0.023) (0.012)
20105 Ondor-Ulaan 6,233 0.427 0.126 0.052 2,661
(0.058) (0.024) (0.013)
20106 Erdenemandal 6,209 0.415 0.122 0.050 2,577
(0.048) (0.020) (0.011)
20107 Jargalant 4,796 0.462 0.142 0.060 2,216
(0.058) (0.026) (0.014)
20108 Tsetserleg 4,302 0.449 0.134 0.056 1,932
(0.060) (0.024) (0.013)
20109 Khairhan 3,908 0.394 0.115 0.047 1,540
(0.055) (0.024) (0.013)
20110 Battsengel 4,002 0.367 0.105 0.042 1,469
(0.055) (0.021) (0.010)
20111 Olziit 3,201 0.457 0.141 0.060 1,463
(0.074) (0.033) (0.018)
20112 Ogiinuur 3,274 0.456 0.137 0.058 1,493
(0.058) (0.025) (0.013)
20113 Khashaat 4,192 0.453 0.136 0.057 1,899
(0.069) (0.030) (0.016)
20114 Khotont 5,502 0.434 0.128 0.053 2,388
(0.055) (0.022) (0.011)
20115 Tsenher 5,215 0.492 0.153 0.065 2,566
(0.056) (0.026) (0.014)
20116 Tovshruuleh 3,726 0.453 0.139 0.059 1,688
(0.059) (0.026) (0.014)
20117 Bulgan 2,342 0.411 0.121 0.050 963
(0.072) (0.030) (0.015)
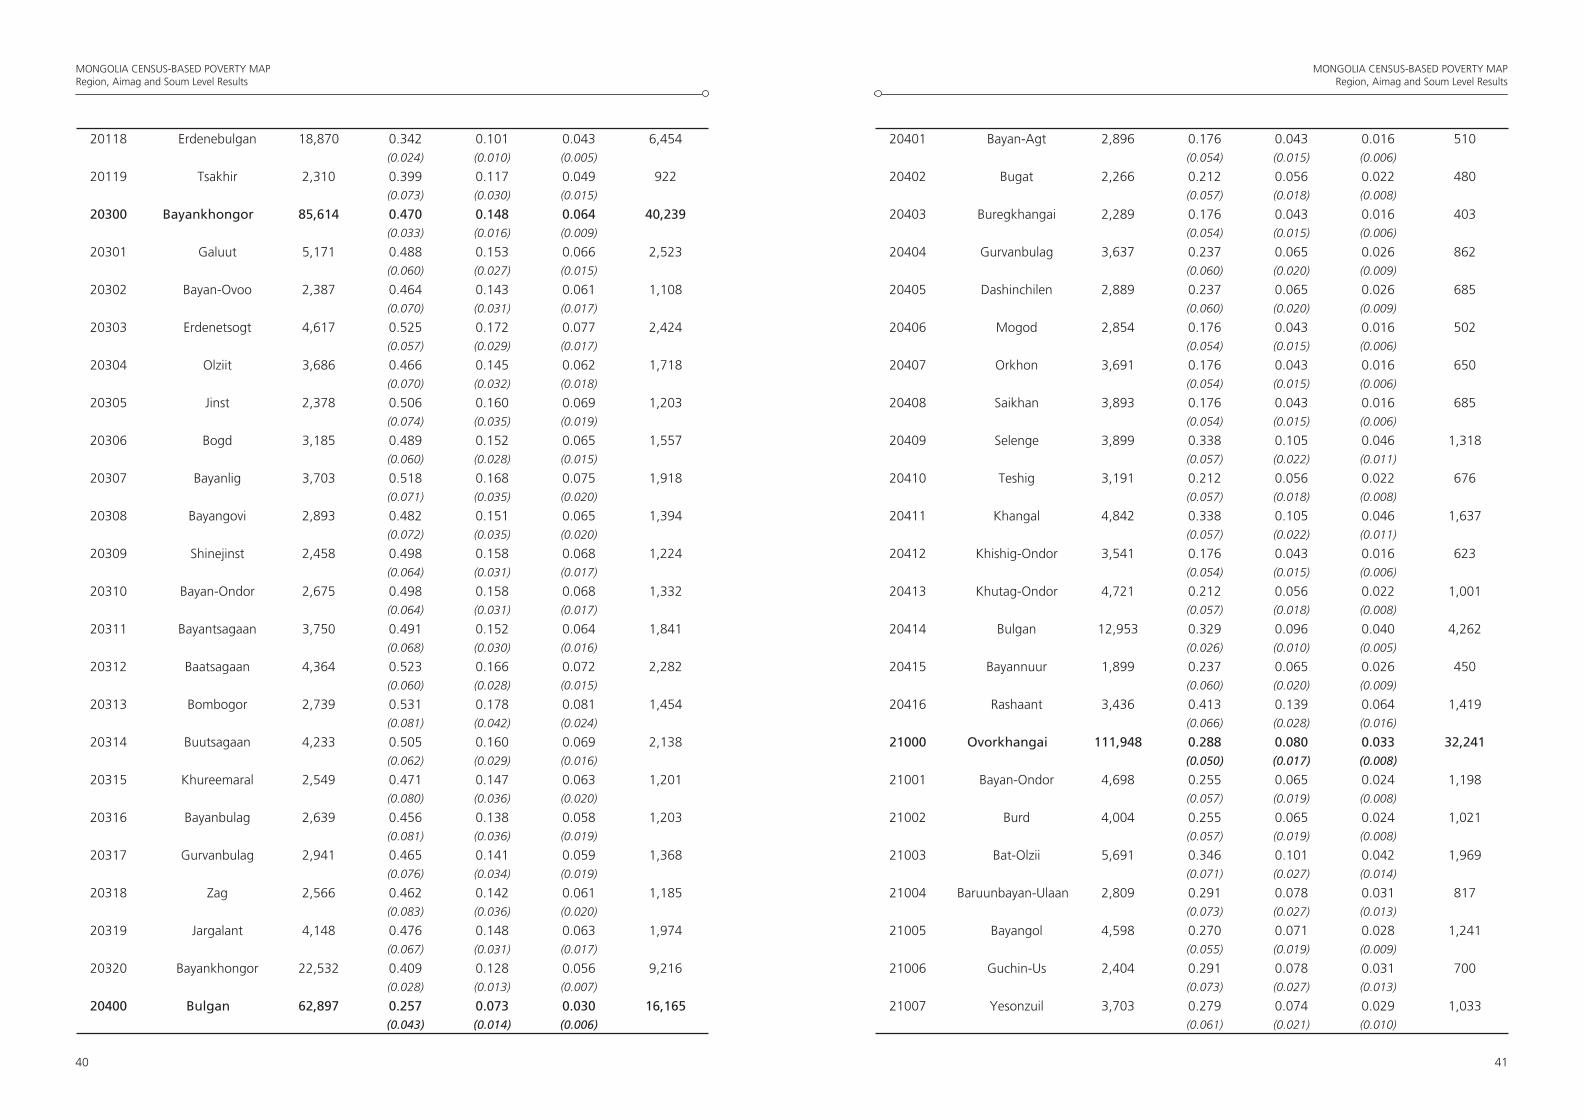
MONGOLIA CENSUS-BASED POVERTY MAPRegion, Aimag and Soum Level Results
40
MONGOLIA CENSUS-BASED POVERTY MAPRegion, Aimag and Soum Level Results
41
20118 Erdenebulgan 18,870 0.342 0.101 0.043 6,454
(0.024) (0.010) (0.005)
20119 Tsakhir 2,310 0.399 0.117 0.049 922
(0.073) (0.030) (0.015)
20300 Bayankhongor 85,614 0.470 0.148 0.064 40,239(0.033) (0.016) (0.009)
20301 Galuut 5,171 0.488 0.153 0.066 2,523
(0.060) (0.027) (0.015)
20302 Bayan-Ovoo 2,387 0.464 0.143 0.061 1,108
(0.070) (0.031) (0.017)
20303 Erdenetsogt 4,617 0.525 0.172 0.077 2,424
(0.057) (0.029) (0.017)
20304 Olziit 3,686 0.466 0.145 0.062 1,718
(0.070) (0.032) (0.018)
20305 Jinst 2,378 0.506 0.160 0.069 1,203
(0.074) (0.035) (0.019)
20306 Bogd 3,185 0.489 0.152 0.065 1,557
(0.060) (0.028) (0.015)
20307 Bayanlig 3,703 0.518 0.168 0.075 1,918
(0.071) (0.035) (0.020)
20308 Bayangovi 2,893 0.482 0.151 0.065 1,394
(0.072) (0.035) (0.020)
20309 Shinejinst 2,458 0.498 0.158 0.068 1,224
(0.064) (0.031) (0.017)
20310 Bayan-Ondor 2,675 0.498 0.158 0.068 1,332
(0.064) (0.031) (0.017)
20311 Bayantsagaan 3,750 0.491 0.152 0.064 1,841
(0.068) (0.030) (0.016)
20312 Baatsagaan 4,364 0.523 0.166 0.072 2,282
(0.060) (0.028) (0.015)
20313 Bombogor 2,739 0.531 0.178 0.081 1,454
(0.081) (0.042) (0.024)
20314 Buutsagaan 4,233 0.505 0.160 0.069 2,138
(0.062) (0.029) (0.016)
20315 Khureemaral 2,549 0.471 0.147 0.063 1,201
(0.080) (0.036) (0.020)
20316 Bayanbulag 2,639 0.456 0.138 0.058 1,203
(0.081) (0.036) (0.019)
20317 Gurvanbulag 2,941 0.465 0.141 0.059 1,368
(0.076) (0.034) (0.019)
20318 Zag 2,566 0.462 0.142 0.061 1,185
(0.083) (0.036) (0.020)
20319 Jargalant 4,148 0.476 0.148 0.063 1,974
(0.067) (0.031) (0.017)
20320 Bayankhongor 22,532 0.409 0.128 0.056 9,216
(0.028) (0.013) (0.007)
20400 Bulgan 62,897 0.257 0.073 0.030 16,165(0.043) (0.014) (0.006)
20401 Bayan-Agt 2,896 0.176 0.043 0.016 510
(0.054) (0.015) (0.006)
20402 Bugat 2,266 0.212 0.056 0.022 480
(0.057) (0.018) (0.008)
20403 Buregkhangai 2,289 0.176 0.043 0.016 403
(0.054) (0.015) (0.006)
20404 Gurvanbulag 3,637 0.237 0.065 0.026 862
(0.060) (0.020) (0.009)
20405 Dashinchilen 2,889 0.237 0.065 0.026 685
(0.060) (0.020) (0.009)
20406 Mogod 2,854 0.176 0.043 0.016 502
(0.054) (0.015) (0.006)
20407 Orkhon 3,691 0.176 0.043 0.016 650
(0.054) (0.015) (0.006)
20408 Saikhan 3,893 0.176 0.043 0.016 685
(0.054) (0.015) (0.006)
20409 Selenge 3,899 0.338 0.105 0.046 1,318
(0.057) (0.022) (0.011)
20410 Teshig 3,191 0.212 0.056 0.022 676
(0.057) (0.018) (0.008)
20411 Khangal 4,842 0.338 0.105 0.046 1,637
(0.057) (0.022) (0.011)
20412 Khishig-Ondor 3,541 0.176 0.043 0.016 623
(0.054) (0.015) (0.006)
20413 Khutag-Ondor 4,721 0.212 0.056 0.022 1,001
(0.057) (0.018) (0.008)
20414 Bulgan 12,953 0.329 0.096 0.040 4,262
(0.026) (0.010) (0.005)
20415 Bayannuur 1,899 0.237 0.065 0.026 450
(0.060) (0.020) (0.009)
20416 Rashaant 3,436 0.413 0.139 0.064 1,419
(0.066) (0.028) (0.016)
21000 Ovorkhangai 111,948 0.288 0.080 0.033 32,241(0.050) (0.017) (0.008)
21001 Bayan-Ondor 4,698 0.255 0.065 0.024 1,198
(0.057) (0.019) (0.008)
21002 Burd 4,004 0.255 0.065 0.024 1,021
(0.057) (0.019) (0.008)
21003 Bat-Olzii 5,691 0.346 0.101 0.042 1,969
(0.071) (0.027) (0.014)
21004 Baruunbayan-Ulaan 2,809 0.291 0.078 0.031 817
(0.073) (0.027) (0.013)
21005 Bayangol 4,598 0.270 0.071 0.028 1,241
(0.055) (0.019) (0.009)
21006 Guchin-Us 2,404 0.291 0.078 0.031 700
(0.073) (0.027) (0.013)
21007 Yesonzuil 3,703 0.279 0.074 0.029 1,033
(0.061) (0.021) (0.010)
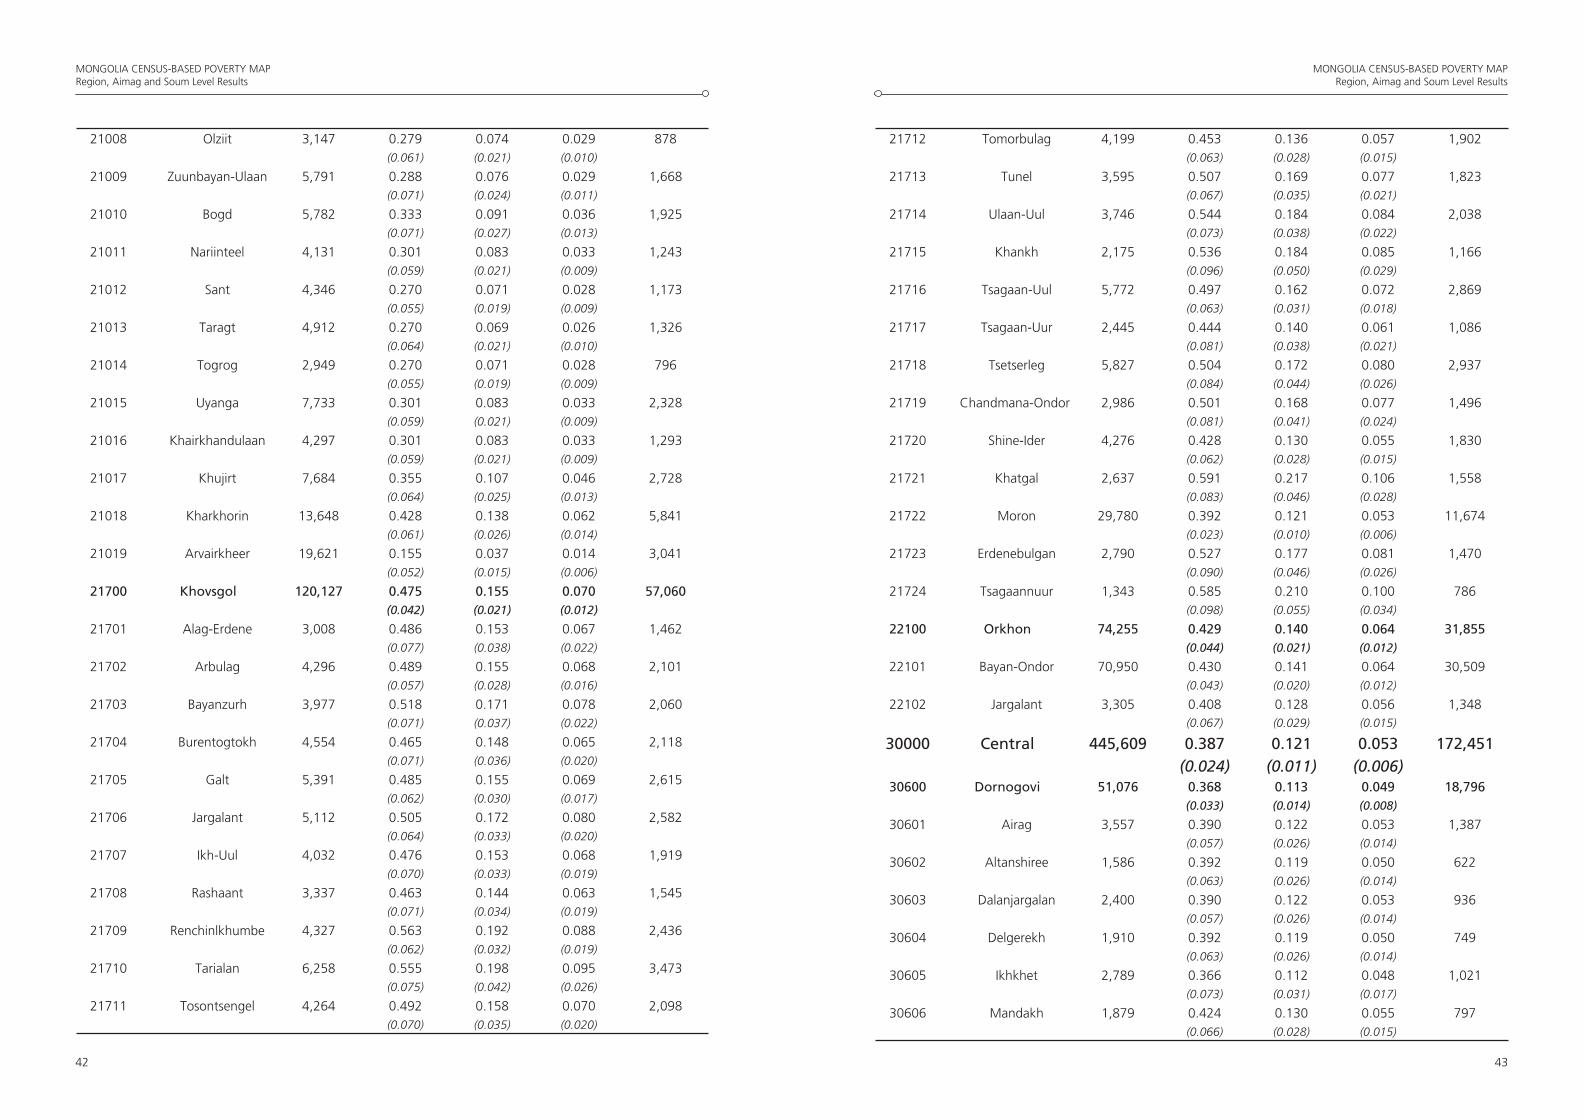
MONGOLIA CENSUS-BASED POVERTY MAPRegion, Aimag and Soum Level Results
42
MONGOLIA CENSUS-BASED POVERTY MAPRegion, Aimag and Soum Level Results
43
21008 Olziit 3,147 0.279 0.074 0.029 878
(0.061) (0.021) (0.010)
21009 Zuunbayan-Ulaan 5,791 0.288 0.076 0.029 1,668
(0.071) (0.024) (0.011)
21010 Bogd 5,782 0.333 0.091 0.036 1,925
(0.071) (0.027) (0.013)
21011 Nariinteel 4,131 0.301 0.083 0.033 1,243
(0.059) (0.021) (0.009)
21012 Sant 4,346 0.270 0.071 0.028 1,173
(0.055) (0.019) (0.009)
21013 Taragt 4,912 0.270 0.069 0.026 1,326
(0.064) (0.021) (0.010)
21014 Togrog 2,949 0.270 0.071 0.028 796
(0.055) (0.019) (0.009)
21015 Uyanga 7,733 0.301 0.083 0.033 2,328
(0.059) (0.021) (0.009)
21016 Khairkhandulaan 4,297 0.301 0.083 0.033 1,293
(0.059) (0.021) (0.009)
21017 Khujirt 7,684 0.355 0.107 0.046 2,728
(0.064) (0.025) (0.013)
21018 Kharkhorin 13,648 0.428 0.138 0.062 5,841
(0.061) (0.026) (0.014)
21019 Arvairkheer 19,621 0.155 0.037 0.014 3,041
(0.052) (0.015) (0.006)
21700 Khovsgol 120,127 0.475 0.155 0.070 57,060(0.042) (0.021) (0.012)
21701 Alag-Erdene 3,008 0.486 0.153 0.067 1,462
(0.077) (0.038) (0.022)
21702 Arbulag 4,296 0.489 0.155 0.068 2,101
(0.057) (0.028) (0.016)
21703 Bayanzurh 3,977 0.518 0.171 0.078 2,060
(0.071) (0.037) (0.022)
21704 Burentogtokh 4,554 0.465 0.148 0.065 2,118
(0.071) (0.036) (0.020)
21705 Galt 5,391 0.485 0.155 0.069 2,615
(0.062) (0.030) (0.017)
21706 Jargalant 5,112 0.505 0.172 0.080 2,582
(0.064) (0.033) (0.020)
21707 Ikh-Uul 4,032 0.476 0.153 0.068 1,919
(0.070) (0.033) (0.019)
21708 Rashaant 3,337 0.463 0.144 0.063 1,545
(0.071) (0.034) (0.019)
21709 Renchinlkhumbe 4,327 0.563 0.192 0.088 2,436
(0.062) (0.032) (0.019)
21710 Tarialan 6,258 0.555 0.198 0.095 3,473
(0.075) (0.042) (0.026)
21711 Tosontsengel 4,264 0.492 0.158 0.070 2,098
(0.070) (0.035) (0.020)
21712 Tomorbulag 4,199 0.453 0.136 0.057 1,902
(0.063) (0.028) (0.015)
21713 Tunel 3,595 0.507 0.169 0.077 1,823
(0.067) (0.035) (0.021)
21714 Ulaan-Uul 3,746 0.544 0.184 0.084 2,038
(0.073) (0.038) (0.022)
21715 Khankh 2,175 0.536 0.184 0.085 1,166
(0.096) (0.050) (0.029)
21716 Tsagaan-Uul 5,772 0.497 0.162 0.072 2,869
(0.063) (0.031) (0.018)
21717 Tsagaan-Uur 2,445 0.444 0.140 0.061 1,086
(0.081) (0.038) (0.021)
21718 Tsetserleg 5,827 0.504 0.172 0.080 2,937
(0.084) (0.044) (0.026)
21719 Chandmana-Ondor 2,986 0.501 0.168 0.077 1,496
(0.081) (0.041) (0.024)
21720 Shine-Ider 4,276 0.428 0.130 0.055 1,830
(0.062) (0.028) (0.015)
21721 Khatgal 2,637 0.591 0.217 0.106 1,558
(0.083) (0.046) (0.028)
21722 Moron 29,780 0.392 0.121 0.053 11,674
(0.023) (0.010) (0.006)
21723 Erdenebulgan 2,790 0.527 0.177 0.081 1,470
(0.090) (0.046) (0.026)
21724 Tsagaannuur 1,343 0.585 0.210 0.100 786
(0.098) (0.055) (0.034)
22100 Orkhon 74,255 0.429 0.140 0.064 31,855(0.044) (0.021) (0.012)
22101 Bayan-Ondor 70,950 0.430 0.141 0.064 30,509
(0.043) (0.020) (0.012)
22102 Jargalant 3,305 0.408 0.128 0.056 1,348
(0.067) (0.029) (0.015)
30000 Central 445,609 0.387 0.121 0.053 172,451
(0.024) (0.011) (0.006)30600 Dornogovi 51,076 0.368 0.113 0.049 18,796
(0.033) (0.014) (0.008)
30601 Airag 3,557 0.390 0.122 0.053 1,387
(0.057) (0.026) (0.014)
30602 Altanshiree 1,586 0.392 0.119 0.050 622
(0.063) (0.026) (0.014)
30603 Dalanjargalan 2,400 0.390 0.122 0.053 936
(0.057) (0.026) (0.014)
30604 Delgerekh 1,910 0.392 0.119 0.050 749
(0.063) (0.026) (0.014)
30605 Ikhkhet 2,789 0.366 0.112 0.048 1,021
(0.073) (0.031) (0.017)
30606 Mandakh 1,879 0.424 0.130 0.055 797
(0.066) (0.028) (0.015)
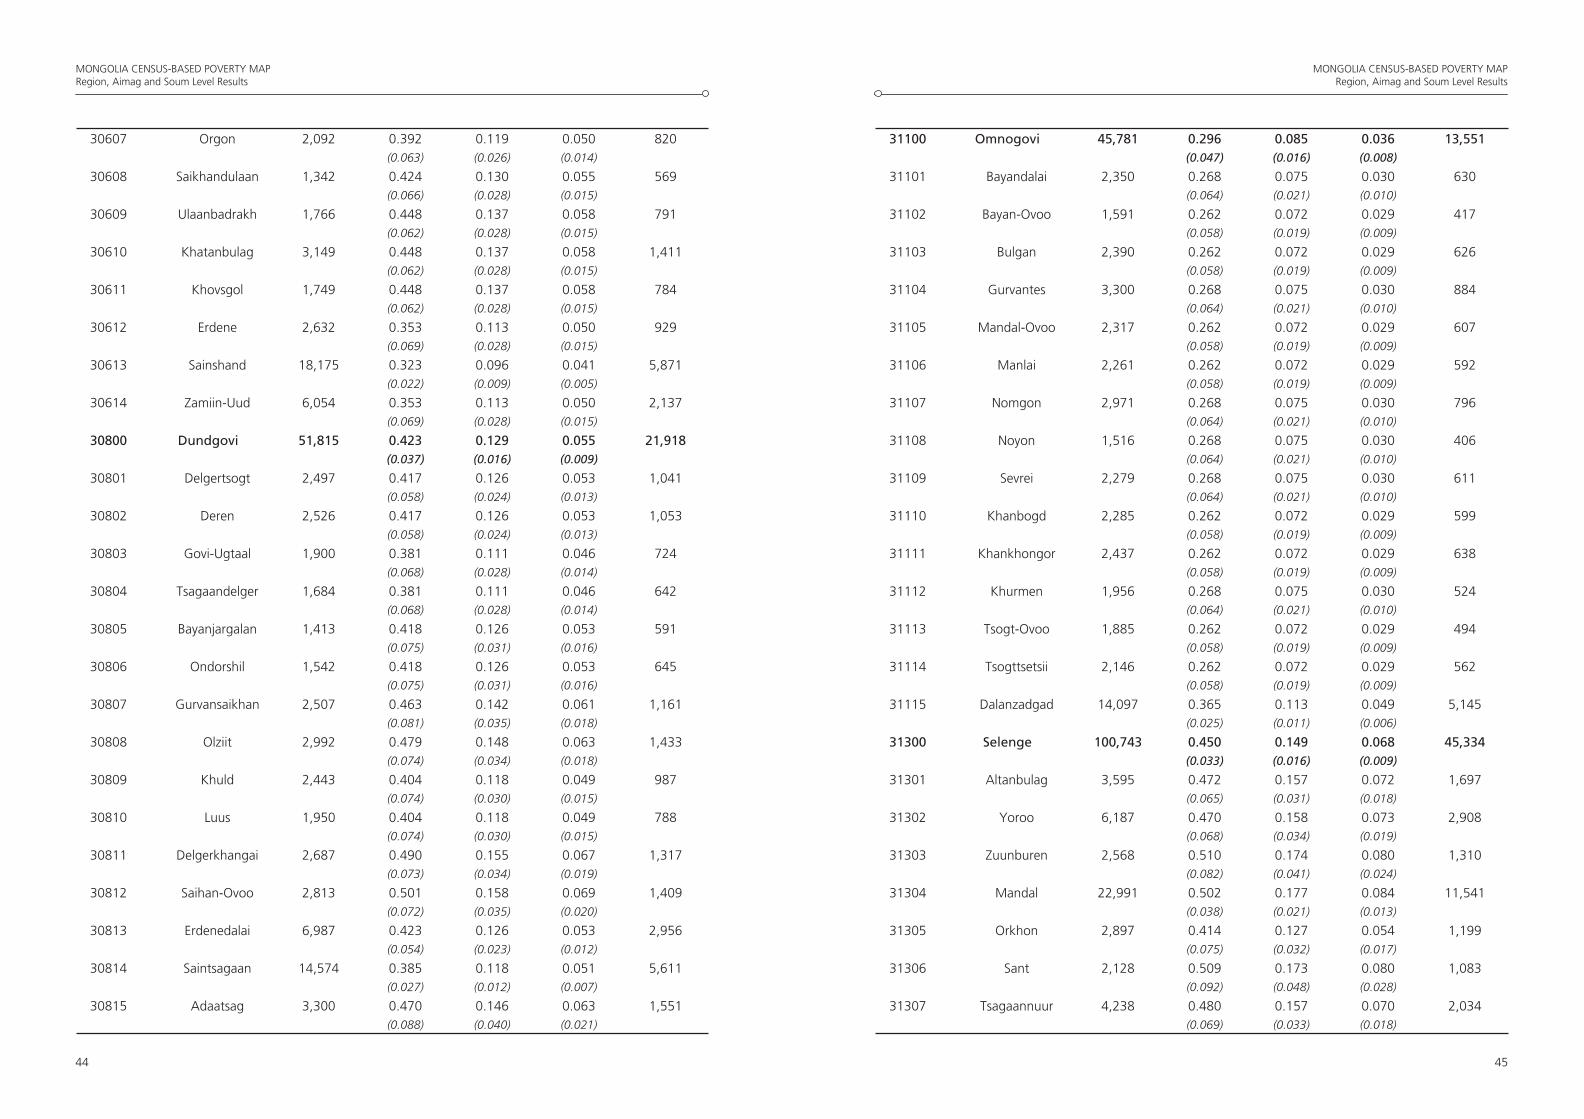
MONGOLIA CENSUS-BASED POVERTY MAPRegion, Aimag and Soum Level Results
44
MONGOLIA CENSUS-BASED POVERTY MAPRegion, Aimag and Soum Level Results
45
30607 Orgon 2,092 0.392 0.119 0.050 820
(0.063) (0.026) (0.014)
30608 Saikhandulaan 1,342 0.424 0.130 0.055 569
(0.066) (0.028) (0.015)
30609 Ulaanbadrakh 1,766 0.448 0.137 0.058 791
(0.062) (0.028) (0.015)
30610 Khatanbulag 3,149 0.448 0.137 0.058 1,411
(0.062) (0.028) (0.015)
30611 Khovsgol 1,749 0.448 0.137 0.058 784
(0.062) (0.028) (0.015)
30612 Erdene 2,632 0.353 0.113 0.050 929
(0.069) (0.028) (0.015)
30613 Sainshand 18,175 0.323 0.096 0.041 5,871
(0.022) (0.009) (0.005)
30614 Zamiin-Uud 6,054 0.353 0.113 0.050 2,137
(0.069) (0.028) (0.015)
30800 Dundgovi 51,815 0.423 0.129 0.055 21,918(0.037) (0.016) (0.009)
30801 Delgertsogt 2,497 0.417 0.126 0.053 1,041
(0.058) (0.024) (0.013)
30802 Deren 2,526 0.417 0.126 0.053 1,053
(0.058) (0.024) (0.013)
30803 Govi-Ugtaal 1,900 0.381 0.111 0.046 724
(0.068) (0.028) (0.014)
30804 Tsagaandelger 1,684 0.381 0.111 0.046 642
(0.068) (0.028) (0.014)
30805 Bayanjargalan 1,413 0.418 0.126 0.053 591
(0.075) (0.031) (0.016)
30806 Ondorshil 1,542 0.418 0.126 0.053 645
(0.075) (0.031) (0.016)
30807 Gurvansaikhan 2,507 0.463 0.142 0.061 1,161
(0.081) (0.035) (0.018)
30808 Olziit 2,992 0.479 0.148 0.063 1,433
(0.074) (0.034) (0.018)
30809 Khuld 2,443 0.404 0.118 0.049 987
(0.074) (0.030) (0.015)
30810 Luus 1,950 0.404 0.118 0.049 788
(0.074) (0.030) (0.015)
30811 Delgerkhangai 2,687 0.490 0.155 0.067 1,317
(0.073) (0.034) (0.019)
30812 Saihan-Ovoo 2,813 0.501 0.158 0.069 1,409
(0.072) (0.035) (0.020)
30813 Erdenedalai 6,987 0.423 0.126 0.053 2,956
(0.054) (0.023) (0.012)
30814 Saintsagaan 14,574 0.385 0.118 0.051 5,611
(0.027) (0.012) (0.007)
30815 Adaatsag 3,300 0.470 0.146 0.063 1,551
(0.088) (0.040) (0.021)
31100 Omnogovi 45,781 0.296 0.085 0.036 13,551(0.047) (0.016) (0.008)
31101 Bayandalai 2,350 0.268 0.075 0.030 630
(0.064) (0.021) (0.010)
31102 Bayan-Ovoo 1,591 0.262 0.072 0.029 417
(0.058) (0.019) (0.009)
31103 Bulgan 2,390 0.262 0.072 0.029 626
(0.058) (0.019) (0.009)
31104 Gurvantes 3,300 0.268 0.075 0.030 884
(0.064) (0.021) (0.010)
31105 Mandal-Ovoo 2,317 0.262 0.072 0.029 607
(0.058) (0.019) (0.009)
31106 Manlai 2,261 0.262 0.072 0.029 592
(0.058) (0.019) (0.009)
31107 Nomgon 2,971 0.268 0.075 0.030 796
(0.064) (0.021) (0.010)
31108 Noyon 1,516 0.268 0.075 0.030 406
(0.064) (0.021) (0.010)
31109 Sevrei 2,279 0.268 0.075 0.030 611
(0.064) (0.021) (0.010)
31110 Khanbogd 2,285 0.262 0.072 0.029 599
(0.058) (0.019) (0.009)
31111 Khankhongor 2,437 0.262 0.072 0.029 638
(0.058) (0.019) (0.009)
31112 Khurmen 1,956 0.268 0.075 0.030 524
(0.064) (0.021) (0.010)
31113 Tsogt-Ovoo 1,885 0.262 0.072 0.029 494
(0.058) (0.019) (0.009)
31114 Tsogttsetsii 2,146 0.262 0.072 0.029 562
(0.058) (0.019) (0.009)
31115 Dalanzadgad 14,097 0.365 0.113 0.049 5,145
(0.025) (0.011) (0.006)
31300 Selenge 100,743 0.450 0.149 0.068 45,334(0.033) (0.016) (0.009)
31301 Altanbulag 3,595 0.472 0.157 0.072 1,697
(0.065) (0.031) (0.018)
31302 Yoroo 6,187 0.470 0.158 0.073 2,908
(0.068) (0.034) (0.019)
31303 Zuunburen 2,568 0.510 0.174 0.080 1,310
(0.082) (0.041) (0.024)
31304 Mandal 22,991 0.502 0.177 0.084 11,541
(0.038) (0.021) (0.013)
31305 Orkhon 2,897 0.414 0.127 0.054 1,199
(0.075) (0.032) (0.017)
31306 Sant 2,128 0.509 0.173 0.080 1,083
(0.092) (0.048) (0.028)
31307 Tsagaannuur 4,238 0.480 0.157 0.070 2,034
(0.069) (0.033) (0.018)
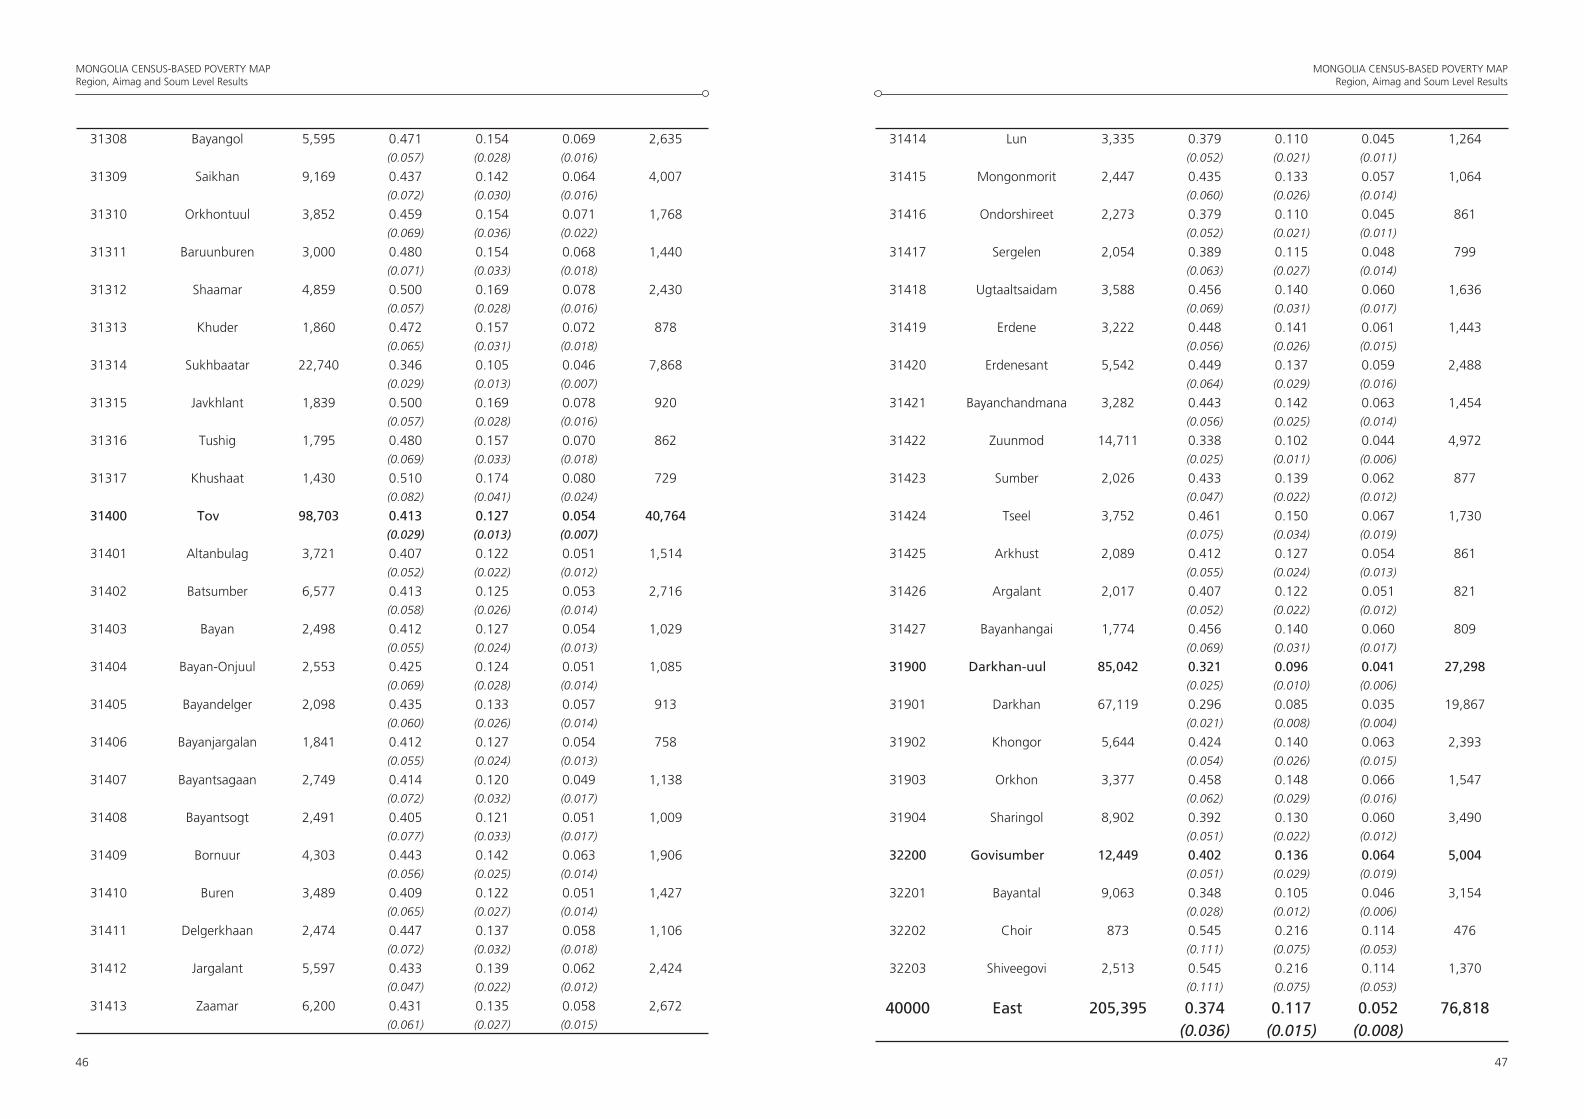
MONGOLIA CENSUS-BASED POVERTY MAPRegion, Aimag and Soum Level Results
46
MONGOLIA CENSUS-BASED POVERTY MAPRegion, Aimag and Soum Level Results
47
31308 Bayangol 5,595 0.471 0.154 0.069 2,635
(0.057) (0.028) (0.016)
31309 Saikhan 9,169 0.437 0.142 0.064 4,007
(0.072) (0.030) (0.016)
31310 Orkhontuul 3,852 0.459 0.154 0.071 1,768
(0.069) (0.036) (0.022)
31311 Baruunburen 3,000 0.480 0.154 0.068 1,440
(0.071) (0.033) (0.018)
31312 Shaamar 4,859 0.500 0.169 0.078 2,430
(0.057) (0.028) (0.016)
31313 Khuder 1,860 0.472 0.157 0.072 878
(0.065) (0.031) (0.018)
31314 Sukhbaatar 22,740 0.346 0.105 0.046 7,868
(0.029) (0.013) (0.007)
31315 Javkhlant 1,839 0.500 0.169 0.078 920
(0.057) (0.028) (0.016)
31316 Tushig 1,795 0.480 0.157 0.070 862
(0.069) (0.033) (0.018)
31317 Khushaat 1,430 0.510 0.174 0.080 729
(0.082) (0.041) (0.024)
31400 Tov 98,703 0.413 0.127 0.054 40,764(0.029) (0.013) (0.007)
31401 Altanbulag 3,721 0.407 0.122 0.051 1,514
(0.052) (0.022) (0.012)
31402 Batsumber 6,577 0.413 0.125 0.053 2,716
(0.058) (0.026) (0.014)
31403 Bayan 2,498 0.412 0.127 0.054 1,029
(0.055) (0.024) (0.013)
31404 Bayan-Onjuul 2,553 0.425 0.124 0.051 1,085
(0.069) (0.028) (0.014)
31405 Bayandelger 2,098 0.435 0.133 0.057 913
(0.060) (0.026) (0.014)
31406 Bayanjargalan 1,841 0.412 0.127 0.054 758
(0.055) (0.024) (0.013)
31407 Bayantsagaan 2,749 0.414 0.120 0.049 1,138
(0.072) (0.032) (0.017)
31408 Bayantsogt 2,491 0.405 0.121 0.051 1,009
(0.077) (0.033) (0.017)
31409 Bornuur 4,303 0.443 0.142 0.063 1,906
(0.056) (0.025) (0.014)
31410 Buren 3,489 0.409 0.122 0.051 1,427
(0.065) (0.027) (0.014)
31411 Delgerkhaan 2,474 0.447 0.137 0.058 1,106
(0.072) (0.032) (0.018)
31412 Jargalant 5,597 0.433 0.139 0.062 2,424
(0.047) (0.022) (0.012)
31413 Zaamar 6,200 0.431 0.135 0.058 2,672
(0.061) (0.027) (0.015)
31414 Lun 3,335 0.379 0.110 0.045 1,264
(0.052) (0.021) (0.011)
31415 Mongonmorit 2,447 0.435 0.133 0.057 1,064
(0.060) (0.026) (0.014)
31416 Ondorshireet 2,273 0.379 0.110 0.045 861
(0.052) (0.021) (0.011)
31417 Sergelen 2,054 0.389 0.115 0.048 799
(0.063) (0.027) (0.014)
31418 Ugtaaltsaidam 3,588 0.456 0.140 0.060 1,636
(0.069) (0.031) (0.017)
31419 Erdene 3,222 0.448 0.141 0.061 1,443
(0.056) (0.026) (0.015)
31420 Erdenesant 5,542 0.449 0.137 0.059 2,488
(0.064) (0.029) (0.016)
31421 Bayanchandmana 3,282 0.443 0.142 0.063 1,454
(0.056) (0.025) (0.014)
31422 Zuunmod 14,711 0.338 0.102 0.044 4,972
(0.025) (0.011) (0.006)
31423 Sumber 2,026 0.433 0.139 0.062 877
(0.047) (0.022) (0.012)
31424 Tseel 3,752 0.461 0.150 0.067 1,730
(0.075) (0.034) (0.019)
31425 Arkhust 2,089 0.412 0.127 0.054 861
(0.055) (0.024) (0.013)
31426 Argalant 2,017 0.407 0.122 0.051 821
(0.052) (0.022) (0.012)
31427 Bayanhangai 1,774 0.456 0.140 0.060 809
(0.069) (0.031) (0.017)
31900 Darkhan-uul 85,042 0.321 0.096 0.041 27,298(0.025) (0.010) (0.006)
31901 Darkhan 67,119 0.296 0.085 0.035 19,867
(0.021) (0.008) (0.004)
31902 Khongor 5,644 0.424 0.140 0.063 2,393
(0.054) (0.026) (0.015)
31903 Orkhon 3,377 0.458 0.148 0.066 1,547
(0.062) (0.029) (0.016)
31904 Sharingol 8,902 0.392 0.130 0.060 3,490
(0.051) (0.022) (0.012)
32200 Govisumber 12,449 0.402 0.136 0.064 5,004(0.051) (0.029) (0.019)
32201 Bayantal 9,063 0.348 0.105 0.046 3,154
(0.028) (0.012) (0.006)
32202 Choir 873 0.545 0.216 0.114 476
(0.111) (0.075) (0.053)
32203 Shiveegovi 2,513 0.545 0.216 0.114 1,370
(0.111) (0.075) (0.053)
40000 East 205,395 0.374 0.117 0.052 76,818
(0.036) (0.015) (0.008)
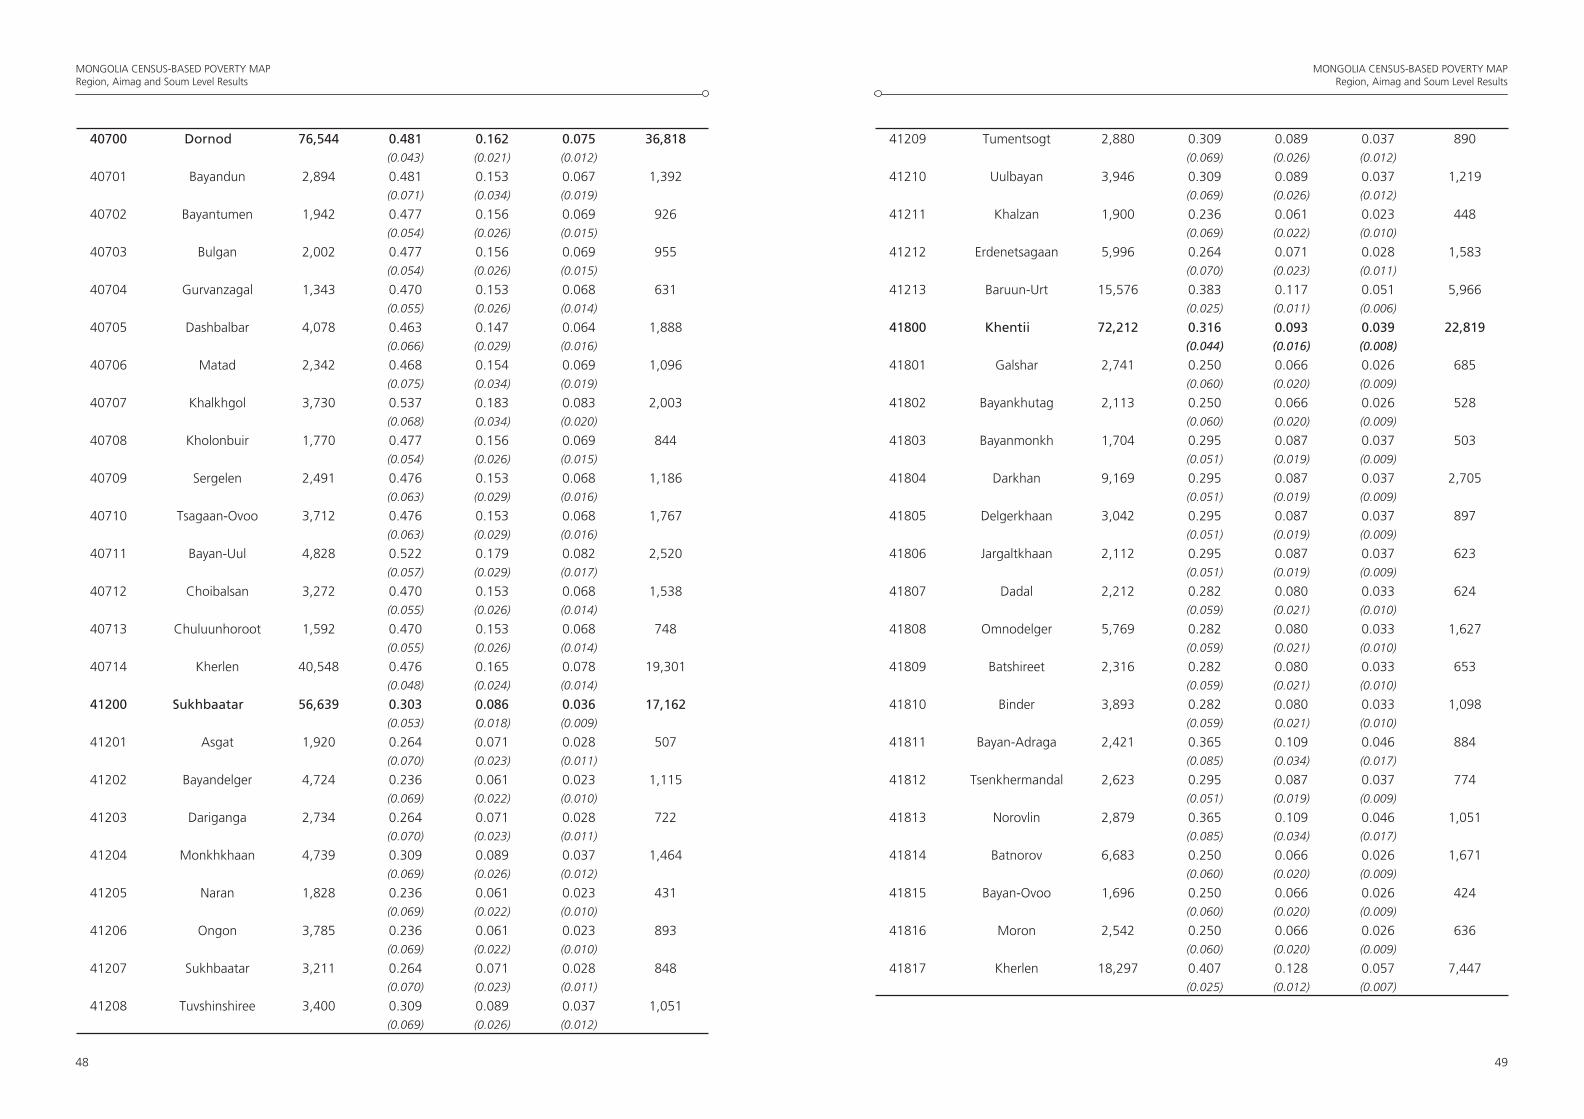
MONGOLIA CENSUS-BASED POVERTY MAPRegion, Aimag and Soum Level Results
48
MONGOLIA CENSUS-BASED POVERTY MAPRegion, Aimag and Soum Level Results
49
40700 Dornod 76,544 0.481 0.162 0.075 36,818(0.043) (0.021) (0.012)
40701 Bayandun 2,894 0.481 0.153 0.067 1,392
(0.071) (0.034) (0.019)
40702 Bayantumen 1,942 0.477 0.156 0.069 926
(0.054) (0.026) (0.015)
40703 Bulgan 2,002 0.477 0.156 0.069 955
(0.054) (0.026) (0.015)
40704 Gurvanzagal 1,343 0.470 0.153 0.068 631
(0.055) (0.026) (0.014)
40705 Dashbalbar 4,078 0.463 0.147 0.064 1,888
(0.066) (0.029) (0.016)
40706 Matad 2,342 0.468 0.154 0.069 1,096
(0.075) (0.034) (0.019)
40707 Khalkhgol 3,730 0.537 0.183 0.083 2,003
(0.068) (0.034) (0.020)
40708 Kholonbuir 1,770 0.477 0.156 0.069 844
(0.054) (0.026) (0.015)
40709 Sergelen 2,491 0.476 0.153 0.068 1,186
(0.063) (0.029) (0.016)
40710 Tsagaan-Ovoo 3,712 0.476 0.153 0.068 1,767
(0.063) (0.029) (0.016)
40711 Bayan-Uul 4,828 0.522 0.179 0.082 2,520
(0.057) (0.029) (0.017)
40712 Choibalsan 3,272 0.470 0.153 0.068 1,538
(0.055) (0.026) (0.014)
40713 Chuluunhoroot 1,592 0.470 0.153 0.068 748
(0.055) (0.026) (0.014)
40714 Kherlen 40,548 0.476 0.165 0.078 19,301
(0.048) (0.024) (0.014)
41200 Sukhbaatar 56,639 0.303 0.086 0.036 17,162(0.053) (0.018) (0.009)
41201 Asgat 1,920 0.264 0.071 0.028 507
(0.070) (0.023) (0.011)
41202 Bayandelger 4,724 0.236 0.061 0.023 1,115
(0.069) (0.022) (0.010)
41203 Dariganga 2,734 0.264 0.071 0.028 722
(0.070) (0.023) (0.011)
41204 Monkhkhaan 4,739 0.309 0.089 0.037 1,464
(0.069) (0.026) (0.012)
41205 Naran 1,828 0.236 0.061 0.023 431
(0.069) (0.022) (0.010)
41206 Ongon 3,785 0.236 0.061 0.023 893
(0.069) (0.022) (0.010)
41207 Sukhbaatar 3,211 0.264 0.071 0.028 848
(0.070) (0.023) (0.011)
41208 Tuvshinshiree 3,400 0.309 0.089 0.037 1,051
(0.069) (0.026) (0.012)
41209 Tumentsogt 2,880 0.309 0.089 0.037 890
(0.069) (0.026) (0.012)
41210 Uulbayan 3,946 0.309 0.089 0.037 1,219
(0.069) (0.026) (0.012)
41211 Khalzan 1,900 0.236 0.061 0.023 448
(0.069) (0.022) (0.010)
41212 Erdenetsagaan 5,996 0.264 0.071 0.028 1,583
(0.070) (0.023) (0.011)
41213 Baruun-Urt 15,576 0.383 0.117 0.051 5,966
(0.025) (0.011) (0.006)
41800 Khentii 72,212 0.316 0.093 0.039 22,819(0.044) (0.016) (0.008)
41801 Galshar 2,741 0.250 0.066 0.026 685
(0.060) (0.020) (0.009)
41802 Bayankhutag 2,113 0.250 0.066 0.026 528
(0.060) (0.020) (0.009)
41803 Bayanmonkh 1,704 0.295 0.087 0.037 503
(0.051) (0.019) (0.009)
41804 Darkhan 9,169 0.295 0.087 0.037 2,705
(0.051) (0.019) (0.009)
41805 Delgerkhaan 3,042 0.295 0.087 0.037 897
(0.051) (0.019) (0.009)
41806 Jargaltkhaan 2,112 0.295 0.087 0.037 623
(0.051) (0.019) (0.009)
41807 Dadal 2,212 0.282 0.080 0.033 624
(0.059) (0.021) (0.010)
41808 Omnodelger 5,769 0.282 0.080 0.033 1,627
(0.059) (0.021) (0.010)
41809 Batshireet 2,316 0.282 0.080 0.033 653
(0.059) (0.021) (0.010)
41810 Binder 3,893 0.282 0.080 0.033 1,098
(0.059) (0.021) (0.010)
41811 Bayan-Adraga 2,421 0.365 0.109 0.046 884
(0.085) (0.034) (0.017)
41812 Tsenkhermandal 2,623 0.295 0.087 0.037 774
(0.051) (0.019) (0.009)
41813 Norovlin 2,879 0.365 0.109 0.046 1,051
(0.085) (0.034) (0.017)
41814 Batnorov 6,683 0.250 0.066 0.026 1,671
(0.060) (0.020) (0.009)
41815 Bayan-Ovoo 1,696 0.250 0.066 0.026 424
(0.060) (0.020) (0.009)
41816 Moron 2,542 0.250 0.066 0.026 636
(0.060) (0.020) (0.009)
41817 Kherlen 18,297 0.407 0.128 0.057 7,447
(0.025) (0.012) (0.007)
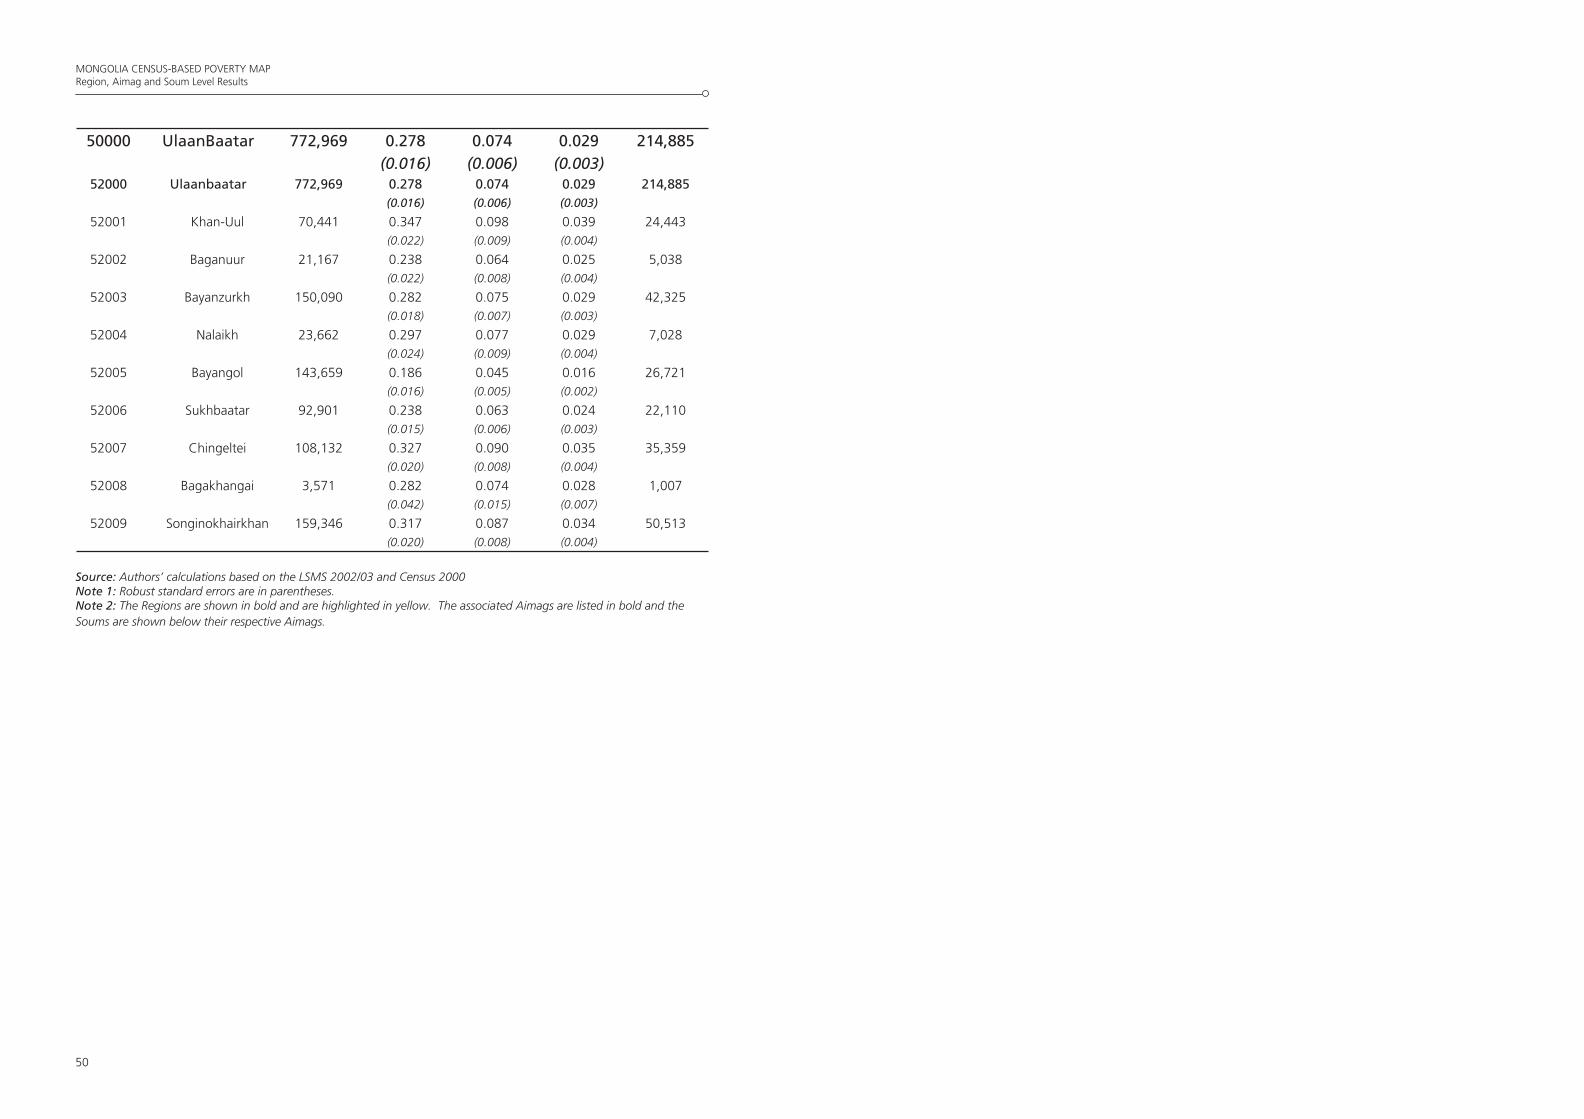
MONGOLIA CENSUS-BASED POVERTY MAPRegion, Aimag and Soum Level Results
50
50000 UlaanBaatar 772,969 0.278 0.074 0.029 214,885
(0.016) (0.006) (0.003)52000 Ulaanbaatar 772,969 0.278 0.074 0.029 214,885
(0.016) (0.006) (0.003)
52001 Khan-Uul 70,441 0.347 0.098 0.039 24,443
(0.022) (0.009) (0.004)
52002 Baganuur 21,167 0.238 0.064 0.025 5,038
(0.022) (0.008) (0.004)
52003 Bayanzurkh 150,090 0.282 0.075 0.029 42,325
(0.018) (0.007) (0.003)
52004 Nalaikh 23,662 0.297 0.077 0.029 7,028
(0.024) (0.009) (0.004)
52005 Bayangol 143,659 0.186 0.045 0.016 26,721
(0.016) (0.005) (0.002)
52006 Sukhbaatar 92,901 0.238 0.063 0.024 22,110
(0.015) (0.006) (0.003)
52007 Chingeltei 108,132 0.327 0.090 0.035 35,359
(0.020) (0.008) (0.004)
52008 Bagakhangai 3,571 0.282 0.074 0.028 1,007
(0.042) (0.015) (0.007)
52009 Songinokhairkhan 159,346 0.317 0.087 0.034 50,513
(0.020) (0.008) (0.004)
Source: Authors’ calculations based on the LSMS 2002/03 and Census 2000Note 1: Robust standard errors are in parentheses.Note 2: The Regions are shown in bold and are highlighted in yellow. The associated Aimags are listed in bold and the Soums are shown below their respective Aimags.