Embed Size (px)
Citation preview
MNRAS 000, 1–18 (2016) Preprint 21 October 2019 Compiled using MNRAS LATEX style file v3.0
Galaxy Simulation with Dust Formation and Destruction
Shohei Aoyama,1,2? Kuan-Chou Hou,3,4 Ikkoh Shimizu,1,2 Hiroyuki Hirashita,3
Keita Todoroki,5,6 Jun-Hwan Choi,7 and Kentaro Nagamine1,61Theoretical Astrophysics, Department of Earth & Space Science, Osaka University, 1-1 Machikaneyama, Toyonaka, Osaka 560-0043, Japan2College of General Education, Osaka Sangyo University, 3-1-1, Nakagaito, Daito, Osaka, 574-8530, Japan3Institute of Astronomy, and Astrophysics, Academia Sinica, PO Box 23-141, Taipei 10617, Taiwan4Department of Physics & Institute of Astrophysics, National Taiwan University, Taipei 10617, Taiwan5Department of Physics & Astronomy, University of Kansas,1082 Malott,1251 Wescoe Hall Dr., Lawrence, KS 66045-758, USA6Department of Physics & Astronomy, University of Nevada, Las Vegas, 4505 S. Maryland Pkwy, Las Vegas, NV 89154-4002, USA7Department of Astronomy, University of Texas Austin, TX 78712-1205, USA
Accepted XXX. Received YYY; in original form ZZZ
ABSTRACTWe perform smoothed particle hydrodynamics (SPH) simulations of an isolated galaxywith a new treatment for dust formation and destruction. To this aim, we treat dustand metal production self-consistently with star formation and supernova feedback.For dust, we consider a simplified model of grain size distribution by representing theentire range of grain sizes with large and small grains. We include dust production instellar ejecta, dust destruction by supernova (SN) shocks, grain growth by accretionand coagulation, and grain disruption by shattering. We find that the assumptionof fixed dust-to-metal mass ratio becomes no longer valid when the galaxy is olderthan 0.2 Gyr, at which point the grain growth by accretion starts to contribute tothe nonlinear rise of dust-to-gas ratio. As expected in our previous one-zone model,shattering triggers grain growth by accretion since it increases the total surface area ofgrains. Coagulation becomes significant when the galaxy age is greater than ∼ 1 Gyr: atthis epoch the abundance of small grains becomes high enough to raise the coagulationrate of small grains. We further compare the radial profiles of dust-to-gas ratio (D) anddust-to-metal ratio (D/Z) (i.e., depletion) at various ages with observational data. Wefind that our simulations broadly reproduce the radial gradients of dust-to-gas ratioand depletion. In the early epoch (. 0.3 Gyr), the radial gradient of D follows themetallicity gradient with D/Z determined by the dust condensation efficiency in stellarejecta, while the D gradient is steeper than the Z gradient at the later epochs becauseof grain growth by accretion. The framework developed in this paper is applicable toany SPH-based galaxy evolution simulations including cosmological ones.
Key words: methods: numerical – ISM: dust – galaxies: evolution – galaxies: forma-tion – galaxies: ISM – galaxies: general
1 INTRODUCTION
The importance of cosmic dust in astrophysical processes hasbeen recognized in recent decades. Dust acts as an efficientcatalyst of molecular hydrogen (H2) formation in the inter-stellar medium (ISM) (e.g., Gould & Salpeter 1963; Cazaux& Tielens 2004; Cazaux & Spaans 2009). In addition, thetypical mass of the final fragments in star-forming cloudsis also regulated by dust cooling (Whitworth et al. 1998;Larson 2005; Omukai et al. 2005; Schneider et al. 2006). Inprotoplanetary discs, dust growth eventually leads to planetformation (e.g., Okuzumi et al. 2009; Kataoka et al. 2014).
? E-mail: [email protected] (SA)
Dust grains also play an important role in radiative pro-cesses in the ISM by absorbing stellar light and reemittingit in the far-infrared, and change the spectral energy distri-butions of galaxies (Calzetti et al. 2000; Buat et al. 2002;Takeuchi et al. 2012).
For the dust properties in galaxies, the size distributionof dust grains is of fundamental importance (e.g., Mathiset al. 1977; Nozawa & Fukugita 2013). In particular, theextinction curve (i.e., the wavelength dependence of absorp-tion and scattering cross-section) is shaped by the grain sizedistribution, given the grain materials (Bohren et al. 1983).Precise estimates of star formation rate (SFR) in galaxiesalso require correction for dust extinction (e.g., Steidel et al.1999; Takeuchi et al. 2010; Kennicutt & Evans 2012). In ad-
c© 2016 The Authors
arX
iv:1
609.
0754
7v1
[as
tro-
ph.G
A]
24
Sep
2016

2 S. Aoyama et al.
dition, the total dust surface area which depends on thegrain size distribution governs the formation rate of molec-ular hydrogen (e.g., Barlow & Silk 1976; Yamasawa et al.2011).
Dust interacts with gas, metals and dust itself in theISM. It is not only destroyed by supernova (SN) shocks, butalso disrupted or shattered by grain-grain collisions in thediffuse ISM (Yan et al. 2004). In dense environments such asmolecular clouds, it grows by accretion and coagulation (Hi-rashita & Voshchinnikov 2014; Voshchinnikov & Hirashita2014). All these processes play important roles in the evolu-tion of dust abundance and grain size distribution.
Asano et al. (2013b) have established a full frameworkfor treating the evolution of grain size distribution consis-tently with the chemical enrichment in a galaxy. Their workrevealed that the collisional effects of dust grains such ascoagulation, shattering, and accretion are necessary for acomprehensive understanding of the observed dust-to-gasmass ratio and extinction curves in nearby galaxies. How-ever, Asano et al. (2013b) treated a galaxy as a single zonewithout taking into account the spatial distribution of gaswith different density structures. Since the efficiencies of var-ious dust processing mechanisms depend on the density andtemperature of the ISM, hydrodynamical evolution of theISM should also be considered simultaneously with dust evo-lution.
Hydrodynamical simulations have indeed been a power-ful tool to clarify galaxy formation and evolution. Many cos-mological hydrodynamic simulations have reproduced andpredicted the observed galaxy mass and luminosity func-tions (e.g., Nagamine et al. 2001, 2004; Choi & Nagamine2012; Jaacks et al. 2012, 2013; Shimizu et al. 2014; Thomp-son et al. 2014; Vogelsberger et al. 2014; Shimizu et al. 2015;Schaye et al. 2015). In order to compute luminosity functionsfrom simulated galaxies and compare them with observeddata, a precise estimate of dust extinction effect is required.For example, Yajima et al. (2015) calculated the galaxy UVluminosity function at high redshifts (6 ≤ z ≤ 12) usingcosmological zoom-in hydrodynamical simulations with con-strained initial conditions. In their work, chemistry and cool-ing of hydrogen, helium and metals were computed as inChoi & Nagamine (2009), however, the dust-to-metal ra-tio was fixed. Bekki (2015) treated dust as a new parti-cle species in addition to gas, dark matter, and star parti-cles. They included not only the formation and destructionof dust, but also dust-dependent star formation and stel-lar feedback (Bekki 2013). Furthermore, in a more recentwork, McKinnon et al. (2016b) regarded dust as an addi-tional component in gas, and performed cosmological zoom-in simulations. They revealed the importance of dust growthby the accretion of gas-phase metals, and pointed out thenecessity of a more realistic treatment of dust destructionand feedback by SNe. In addition, McKinnon et al. (2016a)ran cosmological simulations and compared the dust massfunction and radial profile of dust with corresponding ob-servational data. They found that their simulation broadlyreproduced the observation in the present-day Universe, al-though it tended to underestimate the dust abundance inhigh-redshift galaxies.
In all of these simulations mentioned above, dust pro-cessing by grain-grain collisions such as coagulation andshattering, both of which are important for the grain size
distribution, has not been included yet (but see Zhukovskaet al. 2016, who implemented part of these processes bypostprocessing a hydrodynamic simulation of an isolatedgalaxy with a particular focus on temperature-dependentsticking coefficient). Implementation of dust size distribu-tions in SPH simulations has not been successful, mainly be-cause of the high computational cost. Calculating the grainsize distribution in a fully self-consistent manner is compu-tationally expensive even in one-zone calculation as shownby Asano et al. (2013b). However, because of the aforemen-tioned effects of grain size distribution, implementation ofgrain size distribution in hydrodynamic simulations is essen-tial in understanding the role of dust in galaxy evolution.
In this paper, we perform N -body/SPH simulations ofisolated galaxies with a model of dust formation and de-struction. For the purpose of treating the evolution of grainsize distribution within a reasonable computational time, weadopt the two-size approximation formulated by Hirashita(2015), in which the entire grain size range is representedby two sizes divided at around a ' 0.03 µm, where a is thegrain radius. Hirashita (2015) has confirmed that the two-size approximation gives the same evolutionary behaviourof grain sizes and extinction curves as calculated by the fulltreatment of Asano et al. (2013b, 2014). Thus, implement-ing the two-size model, which is computationally light, inhydrodynamic simulations provides a feasible way to com-pute the grain size evolution in the ISM. Consequently, notonly can we compute the spatial variations in dust proper-ties, but also examine the grain size distribution as a func-tion of time and metallicity. This is a significant advantageover the simple one-zone calculations, which generally needto introduce some strong assumptions such as instantaneousmixing and homogeneity.
Although our ultimate goal is to understand dust evo-lution in the cosmological structure formation, the target ofthis paper is an isolated galaxy for the purpose of the firstimplementation of dust evolution. Using an isolated galaxyenables us to compare our results with previous one-zone cal-culations and to test our implementation. Since the spatialresolution is higher than typical cosmological simulations,we will be able to predict spatially resolved properties ofdust evolution in detail.
This paper is organised as follows. In Section 2, we in-troduce our dust evolution model and calculation method.We present the simulation results in Section 3. We discussthe parameter dependence in Section 4 and compare thesimulation results with observational data in Section 5. Weconclude in Section 6. Throughout this paper, we adoptZ� = 0.02 for solar metallicity following Hirashita (2015).
2 MODEL
2.1 Numerical Simulations
In this section, we overview our simulation setup first be-fore we describe the details of our dust implementation. Weuse the modified version of GADGET-3 N -body/SPH code(originally explained by Springel 2005), and our simula-tion includes dark matter, gas, and star particles. The dy-namics of collisionless particles are computed with a tree-particle-mesh method, and the hydrodynamics is solved
MNRAS 000, 1–18 (2016)
Galaxy Simulation with Dust Formation and Destruction 3
Table 1. Initial physical parameters of our isolated galaxy. In thispaper, we adopt the low-resolution model of the AGORA project
(Kim et al. 2014). The disk and bulge components are pre-existing
stellar components treated by collisionless star particles dynam-ically, but those particles are not destroyed nor created during
the simulation. †The gravitational softening length is taken to be
80 pc, and we allow the baryons to collapse to 10% of this value.However, in practice, we find that the variable gas smoothing
length reached a minimum value of only ∼ 22 pc with our modelsof gas cooling, star formation, and feedback.
Parameter Value
Gas mass 8.59× 10⁹M�Dark matter mass 1.25× 10¹²M�Disk mass 4.30× 10⁹M�Bulge mass 3.44× 10¹⁰M�
Total mass 1.3× 10¹²M�
Number of gas particle 1.00× 10⁵
Number of dark matter 1.00× 10⁵
Number of disk particle 1.00× 10⁵
Number of bulge particle 1.25× 10⁴
Gas particle mass 8.59× 10⁴M�Dark matter particle mass 1.25× 10⁷M�Disk particle mass 3.44× 10⁵M�Bulge particle mass 3.44× 10⁵M�
Grav. softening length 80 pc †
with the entropy-conserving, density-independent formula-tion (Springel & Hernquist 2002; Saitoh & Makino 2013;Hopkins 2013), using the quintec spline kernel of Morris(1996). The star particles are stochastically created from gasparticles as described in Springel & Hernquist (2003), con-sistently with the SFR equation which we describe below.Our code uses the Grackle1 chemistry and cooling library(Bryan et al. 2014; Kim et al. 2014), which solves the non-equilibrium primordial chemistry network for atomic H, D,He, H2, and HD. Using the Grackle’s nonequilibrium chem-istry with H2 allows us to compute the gas properties tolower temperatures and higher densities, which is necessaryfor a proper treatment of dust physics as we will see below.
The initial condition of our isolated galaxy is taken fromthe low-resolution model of AGORA simulations (Kim et al.2014), and various parameter values of this disc galaxy issummarised in Table 1. The highest density that we can re-solve is also determined by the minimum gravitational soft-ening length of εgrav = 80 pc, and we allow the minimum gassmoothing to reach 10% of εgrav. Following Hopkins et al.(2011) and Kim et al. (2016, in prep.), we adopt the Jeanspressure floor,
PJeans = 1.2γ−1N2/3JeansGρ
2gash
2sml, (1)
where γ = 5/3, NJeans = 8.75, and hsml is the smoothinglength of gas. This is to avoid artificial numerical fragmen-tation when the Jeans mass at low temperatures is not re-solved.
The gas particles in our simulations carry physical infor-mation such as density, internal energy, entropy, ionization
1 https://grackle.readthedocs.org/
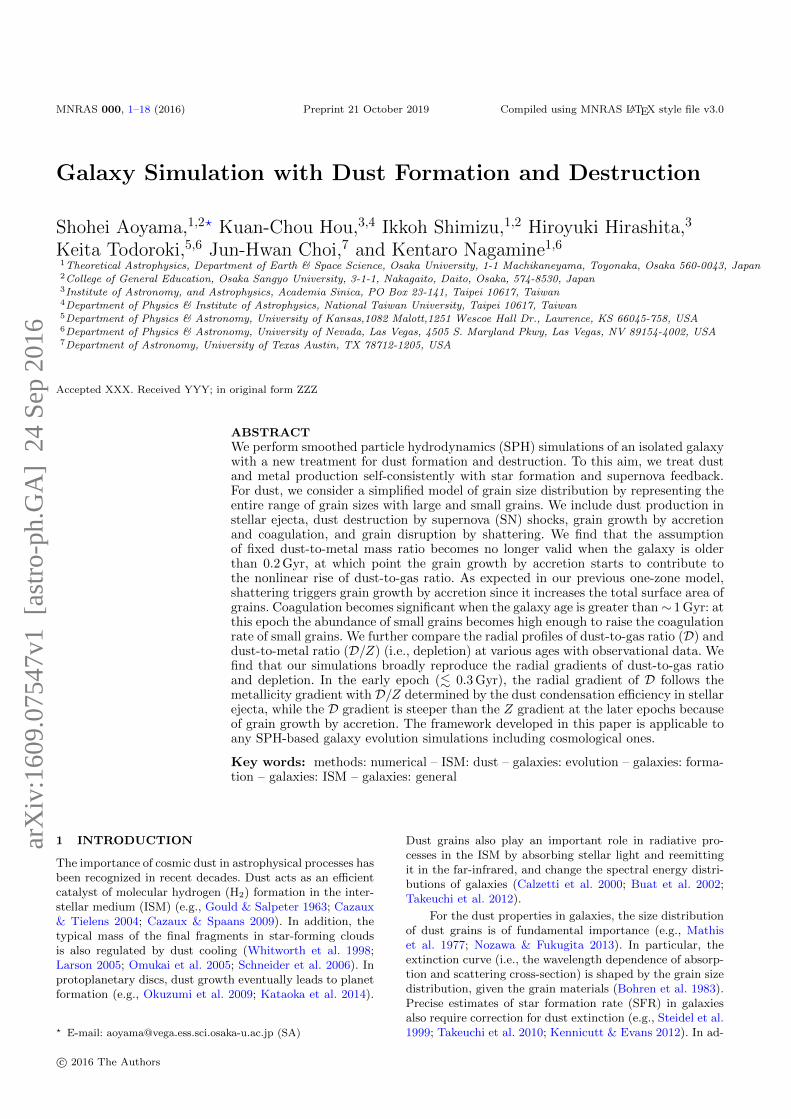
Figure 1. Face-on view of the distribution of gas surface density
(left panel) and stellar surface density (right) of our simulationat t = 1 Gyr. The colour bar indicates the mass surface density
in logarithmic units of [M� pc−2]. The image was produced with
a pixel size of ∼ 93 pc.
fraction, metallicity, and SFR. The gas pressure can be com-puted from entropy and density, and the temperature frominternal energy and ionization fraction. Therefore we can usethese dynamically computed physical quantities to evaluatethe dust processes at each point in space and time. With ournew treatment for dust, the gas particles now also carry thedust mass as an additional physical parameter.
As an example, Fig. 1 shows the face-on view of sur-face densities of gas and stars of our simulated galaxy att = 1 Gyr. Spiral arms are prominent and well developedafter 1 Gyr since the beginning of the simulation, and stellardisk is clearly visible in the right panel. We also smooth thespatial distribution of metal and dust within the smoothingkernel, in a similar manner to the computation of gas densitywhile the simulation is running.
Fig. 2 shows the overall distribution of gas in our sim-ulated galaxy on the temperature–density plane. With ourcurrent resolution and Grackle cooling, we achieve gas num-ber densities slightly higher than 104 cm−3 and temperaturesas low as Tgas ∼ 30 K. There is also a distribution of tenuousgas heated by the stellar feedback effects (see Section 2.1.2)at Tgas > 105 K, which would be absent if we turn off thefeedback processes.
2.1.1 Star Formation
We follow the star formation prescription of the AGORAproject (Kim et al. 2014). In this model, the local SFR den-sity dρ∗/dt is estimated as
dρ∗dt
= εSFρgas
tff, (2)
where εSF = 0.01 is the star formation efficiency, ρgas isthe gas density and tff =
√3π/(32Gρgas) is the local free-
fall time. The star particles are stochastically created fromgas particles as described in Springel & Hernquist (2003),consistently with the above SFR. But the star formation isallowed only for gas particles with ngas ≥ 10 cm−3. Eachstar particle is regarded as a simple stellar population witha Chabrier (2003) initial stellar mass function (IMF), andit carries stellar mass, metallicity, and formation time as itsphysical attributes.
Our simulation results show that the gas is convertedinto stars at a steady rate of ∼ 1 M�/yr, although we donot show the figure here as it is a simple result. Total stellarmass increases monotonically from zero at t = 0 Gyr to 3.4×
MNRAS 000, 1–18 (2016)

4 S. Aoyama et al.
Figure 2. Distribution of gas particles on the temperature–density (Tgas − ngas) phase diagram in our simulation at t = 1
Gyr. The colour indicates the logarithmic surface density of gas
particles on this diagram as indicated by the colour bar on theright.
109M� at t = 10 Gyr. Disk and bulge mass given Table 1do not change as they are assumed to be made of old stellarpopulation and treated by collisionless stellar particles. Theoverall gas mass of the galaxy decreases monotonically from8.6× 109 M� at t = 0 Gyr to 5.2× 10⁹ M� at t = 10 Gyr.
2.1.2 Early Stellar Feedback
Several studies have pointed out the impact of feedback fromstellar winds and radiation of massive stars before they ex-plode as supernovae (Wise et al. 2012; Agertz et al. 2013;Stinson et al. 2013), which is often called the ‘early stellarfeedback.’ For example, Agertz et al. (2013) considered themomentum of ionizing radiation onto the ambient gas, andfound that it is effective in sweeping up the gas in the vicinityof young star clusters. Stinson et al. (2013) also implementeda phenomenological model, which assumes that the energyfrom massive stars are converted and deposited among theneighbouring gas particles in a form of pure thermal energy,while turning the radiative cooling off for 30 Myrs to avoidthe overcooling problem.
While our present work is more focused on the physicsof dust formation and evolution, we have implement the ef-fect of stellar feedback model, roughly following the workby Stinson et al. (2013) and Todoroki (2014). In our model,the thermal energy from early stellar feedback is injected ata constant rate for texplode = 4 Myr, which is an approxi-mate life-time of a massive star (e.g., Fall et al. 2010). Thefractional thermal energy deposited from a star particle ina single time-step is
∆Eth = εesf Eradt− tdeposit
texplode, (3)
where t is the current simulation time, tdeposit is the timeat which the star deposited a fraction of the thermal energy
in the previous time-step, εesf is the early stellar feedbackefficiency, and Erad is the radiation energy which is emittedby massive stars. We adopt Erad = 2× 1050 erg per 1 M� ofstars (Stinson et al. 2013).
The energy ∆Eth is then distributed among all theneighbour gas particles using the mass-weighted SPH ker-nel. The physical meaning of early stellar feedback efficiency,εesf , is the fraction of UV photons that contributes to theearly stellar feedback. Stinson et al. (2013) find that themodel with εesf = 0.1 reproduces a good agreement with thestellar-to-halo mass relation obtained from halo occupationdistribution models, but here we take εesf = 0.3 to see themaximum impact of early stellar feedback. However, havingexamined our results on dust properties in the runs with andwithout the early stellar feedback, we actually find that itsimpact on dust results is not so strong.
2.1.3 SN model
Dust destruction by SNe is also treated by a subgrid model,as our simulations do not have the resolution to solve thegas dynamics at sub-parsec scales. In our subgrid model, wefirst compute a ‘shock radius’ (Rsh) for newly formed starparticles, inside which the gas particles are affected by theSN shock and the dust is destroyed. We adopt the shockradius from Chevalier (1974) and McKee & Ostriker (1977),who performed spherically symmetric hydrodynamical simu-lation of supernova remnant in an uniform medium. In theirsimulation, they considered not only the cooling via infrared,UV and X-ray radiation, but also the effects of magnetic fieldon the remnant. As a consequence, they obtained a shock ra-dius as
Rsh = 55.0 [pc]
(ESN
1051 erg
)0.32
×( ngas
1 cm−3
)−0.16(
P0
10−4kB cm−3 K
)−0.20
,(4)
where P0 is the ambient pressure which is obtained by cal-culating the kernel-weighted mean pressure of neighbour-ing gas particles located within the smoothing length of theyoung star particle. The value of ESN, which is the total col-lective energy from all SNe in the star particle of concern,will be specified in equation (7).
2.1.4 Metal production and Supernova Feedback
Dust is produced from metals, and metals are ejected fromsupernova explosions; therefore we need to treat dust andmetal production in a consistent manner with star forma-tion and SN feedback. In this subsection, we first describeour treatment of supernova feedback and metal enrichment,which are based on the AGORA project (Kim et al. 2014)and Todoroki (2014).
We assume that stars with masses between 8 and 40M�explode as Type II SNe after a time-delay of texplode =4 Myr from the star formation, and deposit a net energy of1051 erg into the ambient medium. For the assumed ChabrierIMF, the number of Type II SNe per unit stellar mass is0.011 M�
−1. We include the effects of gas recycling andmetal production from Type II SNe. We return the mass
MNRAS 000, 1–18 (2016)

Galaxy Simulation with Dust Formation and Destruction 5
of stars in between 8M� < M < 40M� into ISM after sub-stracting the remnant mass of 1.4 M� per star.
The total amount of metals produced and ejected fromType II SNe per stellar mass, MZ, is calculated as
MZ = 2.09MO + 1.06MFe, (5)
with the corresponding fractional masses of oxygen MO andiron MFe being 0.0133 M� and 0.011 M�, respectively, perone solar mass of stars formed. These values come from thetabulated results of Woosley & Heger (2007) and for theChabrier IMF (see also Section 3.5 of Kim et al. 2014). In-serting these values into Eq. (5) gives MZ = 0.02896 M� perone solar mass of stars formed. In other words, in the actualsimulation, the amount of metal mass injected into the i-thgas particle is computed as
∆Ai =miW (|ri − rs|, hs)
N∑j=1
mjW (|rj − rs|, hs)
A, (6)
where A is taken as Y ′Z∆m∗ in this case, Y ′Z = 0.02896 is theeffective yield, ∆m∗ is the mass of the star particle whichprovides the metal and dust to the i-th gas particle withmass mi, W is a kernel function, ri is the positional vector ofi-th gas particle measured from the star particle of concernat rs, and hs is the smoothing length recomputed for thestar particle using neighbouring gas particles, respectively.
The produced metals are distributed by the SN shockwave to the neighbouring gas particles within Rsh. If there isonly one neighbouring gas particle within Rsh (which couldhappen in a low resolution simulation), then all the metalsare given to the corresponding gas particle.
When a star particle with mass m∗ explodes, the fol-lowing energy ESN is released (Kim et al. 2014):
ESN = 0.011× 1051 (m∗/M�) erg . (7)
As for the kinetic SN feedback, we take 28.3% of the totalSN energy (ESN,k = 0.283ESN; Durier & Dalla Vecchia 2012)as the available kinetic energy, and give the correspondingmomentum to gas particles within Rsh in random directions.The remaining 71.7% of the total SN energy is given to thegas as a thermal feedback similarly to the metals above.
2.1.5 Time evolution of dust abundances
We solve dust evolution on each gas particle. In this paper,the treatment of grain size distribution is based on the two-size approximation by Hirashita (2015). The whole range ofgrain radii is represented by large and small grain popula-tions considering that various grain processing mechanismswork differently between these two grain populations. Theboundary of these two populations is chosen at a ' 0.03 µm(Hirashita 2015) based on the full treatment of grain sizedistribution by Asano et al. (2013b). We adopt typical radiiof the large and small grain populations as 0.1 µm and5× 10−3 µm, respectively. The abundances of the two dustpopulations on a gas particle are represented by the dust-to-gas mass ratios, DL and DS as
DL =mL
mg, (8)
DS =mS
mg, (9)
where mg is the mass of the gas particle, and mL and mS
are the total mass of large and small grains in the gas parti-cle, respectively. Hereafter we refer to DL (DS) as the large(small) grain abundance. The total dust-to-gas ratio Dtot isdefined as
Dtot ≡ DL +DS . (10)
In our simulation, each gas particle has its own dust abun-dance DL(i) and DS(i), where suffix i indicates the label forthe gas particle. The dust production and destruction pro-cesses are calculated for each particle by the model describedbelow.
Based on the two-size model, we calculate the formationand destruction of large and small dust grains on each gasparticle using variables and outputs in the simulation. Con-sidering the relevant processes for large and small grains, theequations governing the masses of large and small grains arewritten as (Hirashita 2015)
dmS
dt= −DSψ −
mS
τSN+mL
τsh− mS
τco+mS
τacc, (11)
dmL
dt= −DLψ + finEZ −
mL
τSN− mL
τsh+mS
τco, (12)
where ψ is the star formation rate, EZ is the injection rate ofmetals from stars, and fin is the dust condensation efficiencyof the metals in the stellar ejecta. The time-scales of variousprocesses are also introduced: τSN is the time-scale of dustdestruction by SN shocks, and τsh, τco, and τacc are the time-scales of shattering, coagulation, and accretion, respectively.
Based on the above equations, we formulate the timeevolution of the large and small grain abundances in the i-th particle from time t to the next time step t+ ∆t as (seealso equation 15 and 16 in Hirashita (2015))
DL(i)(t+ ∆t) = DL(i)(t)−∆D(SNe/L)(i)
−(DL(i)(t)
τsh−DS(i)(t)
τco
)∆t
+fin∆mZ
mg(1− δ) , (13)
DS(i)(t+ ∆t) = DS(i)(t)−∆D(SNe/S)(i)
+
(DL(i)(t)
τsh−DS(i)(t)
τco+DS(i)(t)
τacc
)∆t ,
(14)
where ∆D(SNe/L)(i) and ∆D(SNe/S)(i) are the decrease ofthe large and small grain abundances in the i-th particleby SN destruction, respectively. The amount of newly pro-duced metals, ∆mZ , is computed according to Eq. (6). Thedestroyed fraction of the newly supplied dust from stars,δ, is derived in Appendix A. We explain how to estimate∆D(SNe/L)(i), ∆D(SNe/S)(i), τsh, τco and τacc in the followingsubsections.
One can see in equations (13) and (14) that followingprocesses are implemented in our model: stars produce onlylarge grains; shattering reduces large grains and increasessmall grains; coagulation reduces small grains and increaseslarge grains; accretion increases only small grains; and SNshocks destroys both large and small grains. As we describefurther in the following subsections, accretion and coagula-tion occurs only in dense ISM, and shattering occurs only inlower density ISM. Accretion is the only process that gen-uinely increases the dust amount, and shattering and coag-
MNRAS 000, 1–18 (2016)
6 S. Aoyama et al.
ulation does not change the total mass of dust. One furtherimportant point in our formulation is that ‘astration’, i.e.,the consumption of dust (as well as gas and metals) by starformation is automatically taken care of in our computation,as our dust formulation is using dust-to-gas ratio instead ofdust mass itself. If the amount of gas is reduced by star for-mation, the amount of dust on the relevant gas particle isalso reduced by the same factor. The dust in stars are as-sumed to be locked and do not change as a function of timeafter the formation of star particles.
The current setup of the code does not allow us to treatdelayed dust input from AGB stars. However, contributionfrom AGB stars can be effectively included in fin, althoughAGB star dust production occurs at the same time as SNdust production in our treatment. As compiled by Inoue(2011b) and Kuo et al. (2013), the value of fin is in therange of ∼ 0.01−0.5, and it varies among theoretical modelsadopted. Since implementing delayed metal input requires adeeper modification of the code, we only vary fin to exam-ine the effect of dust production by stars, given that theuncertainty in fin is large. Moreover, as shown later, inter-stellar processing, especially dust mass growth by accretion,is much more efficient than stellar dust input at ages >∼several hundreds Myr, when AGB stars would start to con-tribute (Valiante et al. 2009). We leave delayed dust inputfrom AGB stars to future work.
2.2 Dust destruction in SN shocks
Each SN destroys the dust in its sweeping radius. Since eachSN is not spatially resolved in our simulations, we simplyadopt the following analytic formula for swept gas mass msw
from McKee (1989):
msw = 6800M�
(E
(1)SN
1051 erg
)( vs
100 km s−1
)−2
,(15)
where E(1)SN is the energy of a single SN (we fix it to E
(1)SN =
1051 erg). The shock velocity vs is adopted from McKee et al.(1987), which is based on the Sedov-Taylor solution for singleSNe:
vs = 200(n0/1 cm−3)1/7
(E
(1)SN/1051 erg
)1/14
km s−1,(16)
where n0 is the number density of ambient gas.A single SN destroys the dust in each gas particle by
the following fraction:
η =
εSN
(msw
mg
)(msw < mg) ,
εSN (msw ≥ mg) ,(17)
where εSN is the efficiency of dust destruction in an SN blastwave. We adopt εSN = 0.1 based on Nozawa et al. (2006)and McKee (1989) unless otherwise stated (see also Joneset al. 1994, 1996).
We estimate the number of SNe affecting the i-th par-ticle, Ni, as
Ni = floor
(ESN
E(1)SN
W (|ri|, hexp∗ )
), (18)
where floor(x) is Gauss’ floor function which returns the
integer part of the argument, and ESN/E(1)SN is the number
of SN explosions. Since the survival fraction of the dust is1− η after an SN, the reduction of dust abundance after NSNe can be estimated as
∆D(SNe/L,S)(i)(t) =[1− (1− η)N
]D(SNe/L,S)(i)(t), (19)
which is used in equations (13) and (14).
2.3 Subgrid models for dust physics
Accretion and coagulation of dust occur in dense molecularclouds (Hirashita & Voshchinnikov 2014), which cannot befully resolved by our current SPH simulations. Therefore,we have to treat these processes by sub-grid models as wedescribe below.
We impose following criteria for the selection of gas par-ticles hosting unresolved dense gas:
ngas > 10 cm−3 and Tgas < 103 K. (20)
We call these gas particles dense gas particles, and they oc-cupy lower right corner of the phase diagram shown in Fig. 2.We also assume that the fraction fdense of each dense gasparticle is dense enough to allow accretion and coagulation,and that the hydrogen number density and temperature ofsuch dense media are 103 cm−3 and 50 K, respectively. Weadopt fdense = 0.5 as a fiducial value, and examine the effectof varying fdense in Section 4.4.4.
2.3.1 Accretion
Accretion is a process in which small grains gain their massby accreting gas from ambient medium. We obtain the time-scale of accretion from eq. (23) in Hirashita & Kuo (2011):
τacc =
1.2× 10⁶ yr
(Z
Z�
)−1(1− Dtot
Z
)−1
/fdense
(for dense gas particles),
∞ (otherwise).
(21)
In deriving this equation, we adopted hydrogen number den-sity nH = 103 cm−3, gas temperature Tgas = 50 K, stickingefficiency of gas-phase metals S = 0.3, and typical radius ofsmall grains a = 5× 10⁻³ µm. The infinity for τ means thatwe turn off the process. The term (1−Dtot/Z)−1 expressesthe fact that only the metals in the gas phase contribute todust growth. We note that the above time-scale is one thirdof that in Kuo & Hirashita (2012), who treated the time-scale in terms of grain radius, while we define the time-scaleby mass growth rate.
2.3.2 Coagulation
Coagulation is a process in which small grains collide witheach other and turns into large grains. Since it is a collisionalprocess between dust grains, its time-scale τco can be esti-mated based on the collision time-scale (see Appendix B):
τco =
2.71× 10⁵ yr
(DS
0.01
)−1 ( vco
0.1 km s−1
)−1
/fdense
(for dense clouds) ,
∞ (for others) .
(22)
MNRAS 000, 1–18 (2016)

Galaxy Simulation with Dust Formation and Destruction 7
In using equation (B4), we adoptedD = DS, a = 5×10⁻³ µmfor the typical radius of small grains, s = 3 g cm−3 for thegrain material density, and v = vco for the typical velocitydispersion of small grains. We adopt vco = 0.1 km s−1 for thefiducial run. Here the typical velocity dispersion is based onthe turbulence-induced grain velocity dispersion calculatedby a magnetohydrodynamic turbulence model in cold densemolecular clouds (Yan et al. 2004). Since the uncertainty inthe velocity dispersion is large, we also examine the case forvco = 0.01 km s−1 in Section 4.
2.4 Shattering
Shattering is a process in which large grains collide witheach other and get shattered into small grains. Since shat-tering occurs in the diffuse ISM (Hirashita & Yan 2009), itcan be spatially resolved in our simulations, and no subgridmodel is necessary. We assume that shattering occurs onlyin gas particles whose gas density is lower than the shat-tering threshold density nSH
th . We estimate the shatteringtime-scale based on the collisional time-scale in Appendix Busing directly the gas density of gas particles as
τsh =
5.41× 10⁷ yr
(DL
0.01
)−1 ( ngas
1 cm−3
)−1
(ngas < nSHth ) ,
∞ (ngas ≥ 1 cm−3) .
(23)
In estimating equation (23), we adopted a = 0.1 µm, s = 3g cm−3, v = 10 km s−1 (a typical velocity dispersion of largegrains; Yan et al. 2004), D = DL, and nH = ngas. We adoptnSH
th = 1 cm−3 unless otherwise stated.
3 RESULTS
3.1 Dust enrichment
One of the most fundamental features in our calculation isthe spatial distribution of dust in a galaxy. We present thetime evolution of surface densities of large and small grainsat t = 0.1, 0.3, 1, and 5 Gyr in Fig. 3.
At t ' 0.1 Gyr, the dust-abundant region is limitedto the central region of the galaxy because of the relativelyhigh star formation rate (i.e., high dust formation by stellarsources). The processes of increasing the small grain abun-dance (shattering and accretion) are not efficient yet becauseof low dust abundance. Thus, the amount of small grains ismuch smaller than that of large grains in the early phase ofevolution.
At t ' 0.3 Gyr, the distribution of large grains becomesmore similar to the gas distribution as the dust enrichmentbecomes more prevalent in the entire disc. As time passes,the existence of small grains becomes clearer and clearer be-cause large grains are converted to small ones via shattering.After t ' 1.0 Gyr, accretion becomes dominant (Section 4.2)and the small grain abundance becomes comparable to thelarge grain abundance in the inner region of the galaxy. Thisis because the high-density environment in the central partraises both accretion and shattering efficiencies.
At t ' 5.0 Gyr, not only large grains but also smallgrains exist in a wide area of several kpc from the galactic
Figure 3. Face-on view of the surface densities of small grains
(left column) and large grains (right column) at t = 0.1, 0.3, 1,and 5 Gyr (top to bottom).
centre, tracing the gas distribution well. The density con-trast becomes higher than that at t = 0.1 Gyr because of thenon-linear dependence of accretion on density. In addition,large grains are formed not only via stellar production butalso via coagulation in this phase, because the coagulationrate becomes sufficiently high as the small grain abundanceincreases at later times (Section 4.2).
3.2 Comparison between large and small grainabundances
We have newly incorporated the two-size approximation,which provides information on grain size distribution. Thus,we are able to show the spatially resolved grain size distri-bution map in a galaxy for the first time, although the grainsize distribution is represented by two sizes to save the com-putational time. In Fig. 4, we present the surface densityratio of small to large grains, log10 (DS/DL). In the earlystage at t = 0.1 Gyr, as discussed in Section 3.1, the abun-dance of large grains is dominant over that of small grains(i.e. most of the area is covered by blue or green colours) inalmost all regions of the galaxy, because the dust productionis dominated by stellar sources and DL is large.
MNRAS 000, 1–18 (2016)

8 S. Aoyama et al.
By comparing DS/DL at various ages in Fig. 4, wefind a drastic increase of small grain abundance betweent = 0.1 and 0.3 Gyr, as we already noted in Section 3.1.Before t = 0.1 Gyr, because the shattering time-scale ismuch shorter than that of accretion, small grains are gen-erated predominantly by shattering. After that, accretion isthe dominant process for increasing small grain abundance(Section 4.2). Because accretion is more efficient in moremetal-rich and denser gas, we find more regions with a highDS/DL close to the central part than in the outskirts att . 0.3 Gyr. But in some localised dense regions, DS/DL
is already reaching close to unity, as seen by red spots ofactively star-forming regions.
At t ' 1 Gyr, shattering and coagulation start to showoverall balance, and DS/DL begin to reach a temporary con-vergence, and more wider regions start to show redder colourapproaching unity, with weaker dependence on the density.
After t ' 5 Gyr, DS/DL reaches close to unity, andthe outer part of galaxy also becomes largely red colour. Incontrast, we observe a suppression of small grain abundancein the central part (green colour with DS/DL ' 0.1) becauseof enhanced coagulation there.
4 DISCUSSION
4.1 Time evolution of total mass of eachcomponent
We discuss the dust mass budget in the entire galaxy. InFig. 5, we show the time evolution of the total masses ofsmall and large grains. We also present the total dust andmetal masses (metals include both gas-phase and dust-phasecomponents). Because we assume that only large grains arecreated by stellar sources and adopt a fixed dust condensa-tion efficiency fin, the mass ratio of large grains to metalsis approximately fin(= 0.1) in the early phase of the evo-lution. In addition, the abundance of small grains is muchsmaller in the early epoch such as . 0.1 Gyr. This is becausethe small grains are created only via shattering and its timescale is much longer than the age.
After t ∼ 0.1 Gyr, small grains start to increase dramat-ically by shattering and accretion. However the site whereshattering and accretion occur efficiently is limited to thecentral part (Fig. 3) and the total abundance of dust is stillmuch lower than that of metals. At & 1 Gyr, because smallgrains increase further by accretion, a significant fraction ofmetals is locked into the dust. The total mass ratio of smallto large grains is (0.0036, 0.0659, 0.1795, 0.5641), and thetotal mass ratio of dust to metal is (0.0844, 0.1008, 0.3130,0.6875) for t = (0.1, 0.3, 1.0, 5.0) Gyr, respectively.
4.2 Contribution of each process
In this section, we examine the contribution of each physi-cal process to dust production and destruction rate. In thiscalculation, we take into account all gas particles in the sim-ulation, and sum up the contribution of each term on theright-hand-side of Eq. (13) and (14) for each process, asshown in Fig. 6.
Stellar dust production is the dominant productionmechanism of large grains in the early stage (t<∼ 0.3 Gyr).
For SN dust destruction, we separate the destruction of
newly formed dust (fin∆mZ
mgδ in eq. 13) and pre-existing
dust (eq. 19) according to the formulation in equation (13)and Appendix A. By construction of our model, the destruc-tion rate of newly formed large grains (SN-destr-2 in Fig. 6)is proportional to the stellar dust production rate (red solidline in Fig. 6). Among all dust processing mechanisms, att < 0.1 Gyr, SN dust destruction of newly formed ones isthe most dominant (SN-destr-2 in Fig. 6).
On the other hand, the destruction rate of pre-existinglarge grains (i.e., SN-destr-1 in Fig. 6 and eq. 19) increasesas the system is enriched with dust, simply because the de-struction rate is proportional to the destroyed material. TheSN destruction rate of small grains also traces the increase ofsmall grains. There is no destruction of small newly formedgrains, since we assume that all grains formed by stellarsources are large.
The initial increase of small grains is governed by shat-tering at t<∼ 0.1 Gyr. As the metallicity and dust abundanceincrease, accretion catches up with the contribution fromshattering, becoming the dominant source of small grainsaround t ∼ 0.1 Gyr. As the small grain abundance increasesfurther, the coagulation rate becomes comparable to the stel-lar dust production rate, which means that coagulation is themost dominant mechanism of producing large grains. Thus,the combination of accretion and coagulation is importantin increasing the dust abundance at t>∼ 0.3 Gyr (note thatfor the dust mass increase, accretion is more fundamentalthan coagulation since coagulation itself does not increasethe total dust mass). Accretion saturates afterwards becausea significant fraction of metals are already accreted on thedust. The contributions of coagulation and shattering be-come comparable at t>∼ 1 Gyr; thus, the small-to-large grainabundance ratio is determined by the balance between shat-tering and coagulation. Note that, since these two processesdo not change the total dust amount, the total dust amountis still determined by the balance between accretion and SNdestruction. The above evolutionary behaviours of variousprocesses are consistent with those in one-zone calculations(Asano et al. 2013b; Hirashita 2015).
4.3 Dust abundance as a function of metallicity
We plot the time evolution of the relation between dust-to-gas ratio (Dtot) and metallicity (Z) for all gas particlesin Fig. 7. In this figure, we also plot the relation predictedby the one-zone two-size approximation calculation by Hi-rashita (2015) (white thin solid line). For the one-zone result,we choose their simple fiducial parameters for various pro-cesses as a reference, although in our simulations, the time-scale of each process varies from particle to particle. We alsoshow a simple constant dust-to-metal ratio expected frompure stellar dust production Dtot = finZ (yellow dashedline) and the saturation limit Dtot = Z (red dot-dashedline).
One can see that a fixed dust-to-metal ratio is a goodapproximation in the early phase (t<∼ 0.1 Gyr), since thedust evolution is driven by stellar production. Many simula-tions simply assume a constant dust-to-metal ratio, insteadof solving the evolution dust-to-gas ratio (e.g., Yajima et al.2015). However, because accretion, whose efficiency responds
MNRAS 000, 1–18 (2016)

Galaxy Simulation with Dust Formation and Destruction 9
Figure 4. Time evolution of log10 (DS/DL) at t = 0.1, 0.3, 1 and 5 Gyr. Deep blue colour is used for DS ∼ 0, corresponding to −4 dex
on the colour bar.
Figure 5. Time evolution of total masses of metals (red solid),total dust mass (dotted), large grains (blue dashed), and small
grains (dot-dashed).
to metallicity nonlinearly, is dominating after that, the fixeddust-to-metal ratio no longer gives a good approximation att>∼ 0.3 Gyr. The important feature of the increase of dust-to-gas mass ratio due to accretion is that it becomes prominentabove a certain metallicity. This metallicity is called criticalmetallicity in, for example, Asano et al. (2013a). This crit-ical behaviour of accretion in terms of metallicity is causedby the metallicity dependence of the accretion efficiency, as
is clear from the accretion time-scale in equation (21) (seealso Dwek 1998; Zhukovska et al. 2008). As the system isenriched with metals, the Dtot–Z relation extends towardshigher metallicities and higher Dtot. Because accretion sat-urates after a significant fraction of gas-phase metals arelocked into dust, the increase of Dtot as a function of Z be-comes moderate at the highest metallicity range.
We also plot the observed Dtot–Z relation for nearbygalaxies with each point corresponding to each individualgalaxy (not spatially resolved) (Remy-Ruyer et al. 2014;Zhukovska 2014). Since our theoretical plots are for eachSPH particle in our single-galaxy simulation, strictly speak-ing, we cannot compare our results with an unresolvednearby galaxy sample. Nevertheless, the fact that our modelsroughly reproduces the observed Dtot–Z relation for nearbygalaxies indicates that our implementation of various dustformation and processing mechanisms is successful in catch-ing the trend of dust evolution as a function of metallicity.
In Fig. 8, we also show the relation between small-to-large grain abundance ratio and metallicity, in order to clar-ify the evolution of grain size distribution. In the earlieststage of evolution the main source of small grains is shat-tering, whose efficiency increases in proportion to the largegrain abundance. While the large grain abundance increasesas a function of metallicity by stellar dust production, theproduction rate of small grains depends on the square of thelarge grain abundance. Thus DS/DL has a positive corre-lation with Z. At t>∼ 0.3 Gyr, the DS/DL shows a strong
MNRAS 000, 1–18 (2016)

10 S. Aoyama et al.
Figure 6. Time evolution of dust production and destruction rate for each process. Left panel: the terms from the right-hand-side
of equation (13) are shown for large grains: shattering (blue dashed), coagulation (green dot-dashed), stellar production (red solid),
SN-destr-1 (orange dot-long-dashed; corresponding to the destruction rate of pre-existing dust in eq. (19)), and SN-destr-2 (purple dot-
dot-dashed; corresponding to the destruction rate of newly formed dust, fin∆mZ
mgδ). Right panel: the terms from the right-hand-side of
equation (14) are shown for small grains: shattering (blue dashed), coagulation (green dot-long-dashed), accretion (black dotted), andSN-destr-1 (orange dot-dashed; same as left panel).
dependence on Z around Z ∼ 0.1 Z� because of accretion.At higher metallicities, as is clear in the plots at t = 1 and5 Gyr, DS/DL decreases as Z increases because small grainsturn into large ones via coagulation. The above behavioron the DS/DL–Z diagram is consistent with the analysis inHirashita (2015).
At t = 5 Gyr, the distribution of DS/DL seems to splitinto two components at log10(Z/Z�) . −0.5. The uppercomponent with DS/DL ∼ 1 corresponds to low temperature(Tgas < 104 K) and diffuse gas (10−2 . ngas < 1 cm−3) inthe disk, and the bottom component with DS/DL ∼ 0.1corresponds to high temperature (Tgas > 104 K) and diffusegas (ngas < 1 cm−3, but largely . 10−2 cm−3; see the phasediagram in Fig. 2) in both disk and circum-galactic regionsaffected by SN feedback. The former component has higherdensities than the latter component; therefore the impact ofshattering is much stronger, resulting in higher DS/DL.
4.4 Parameter dependence
There are some uncertain parameters involved in the abovesubgrid dust physics models. Although the values of thoseparameters are chosen based on physical reasoning, it is stillworth examining the effect of varying them. Below we exam-ine how a representative parameter for each process affectsthe results. We use the Dtot–Z and DS/DL–Z diagrams toexamine the effects of various processes, since we have shownabove that these diagrams are useful for such a purpose. Wefind that the qualitative behaviour as a function of time inthis diagram does not change so much when we vary theparameters, therefore we focus on t = 1 Gyr for this com-parison.
4.4.1 Stellar dust production fin
For stellar dust production, the condensation efficiency fin
is the key parameter. Inoue (2011a) and Kuo & Hirashita(2012) found that fin varies in the range of 0.01–0.5 evenamong different theoretical calculations.
To clarify the effect of varying fin, we compare theresults of fin = 0.01 and our fiducial value fin = 0.1 inFig. 9. The dust-to-gas ratio at low metallicity is simplyproportional to fin (i.e., Dtot ∼ DL ∼ finZ), because stel-lar dust production dominates the dust abundance increase.The value of DS/DL at low metallicity is also lower forfin = 0.01 than for fin = 0.1, because the production rate ofsmall grains by shattering is proportional to DL accordingto equation (23).
However, both Dtot and DS/DL reach similar values athigh metallicity regardless of the difference in fin, becausethe processes other than stellar dust production, especiallyaccretion, dominate these quantities. Thus changing fin af-fects the dust abundance only at low metallicities, typicallyZ <∼ 0.1 Z�.
4.4.2 Density threshold of shattering
We also examine the dependence on the treatment of shat-tering. The strength of shattering is mostly regulated by thedensity threshold below which shattering occurs (nSH
th ). Ex-amining a low threshold density for shattering is especiallyimportant since setting too-high a threshold may cause anunreasonably strong shattering effect, because the shatteringtime-scale is inversely proportional to the density (equation(23)). In Fig. 10, we compare the results for a lower den-sity threshold nSH
th = 0.1 cm−3 and the fiducial nSHth = 1
cm−3 (equation 23). Since shattering occurs in lower den-sity gas than nSH
th , lowering this threshold density reducesthe amount of gas which will be affected by shattering.
MNRAS 000, 1–18 (2016)

Galaxy Simulation with Dust Formation and Destruction 11
Figure 7. Distribution of gas particles on the Dtot−Z plane at t = 0.1, 0.3, 1 and 5 Gyr as labelled. The colour indicates the logarithmic
surface density of the gas particle on this diagram. The white line represents the one-zone calculation by Hirashita (2015). The yellowdashed and red dot-dashed lines denote the linear relation of the stellar yield (Dtot = finZ) and the saturation limit (Dtot = Z),
respectively. Cyan crosses denote the observational data of nearby galaxies taken from Remy-Ruyer et al. (2014) and Zhukovska (2014).
From this comparison, we find that the increase of Dtot
is slightly suppressed at Z > 0.1Z� for a lower nSHth , because
less production of small grains by shattering leads to lessefficient accretion. Suppression of small-grain formation isclearly observed in lower DS/DL at low metallicities withlower nSH
th in Fig. 10, and the overall distribution of DS/DL
is also slightly lower even at higher metallicities.
4.4.3 Grain velocity for coagulation
The coagulation time-scale is regulated by the typical ve-locity of small grains vco. As shown by Yan et al. (2004),the velocity of small grains in the dense medium dependsstrongly on gas density. Our fiducial value (vco = 0.1 kms−1) is taken from their calculation for molecular clouds,however, if we adopt their dense cloud cases, the velocitydispersion could be smaller by an order of magnitude. Thus,we examine the case of a smaller vco = 0.01 km s−1.
Fig. 11 compares the results with vco = 0.1 (fiducial)and 0.01 km s−1. We observe that a larger vco (i.e., moreefficient coagulation) predicts a lower DS/DL at high metal-
licities, as the small grains are converted into large grains viacoagulation more. The resulting DS/DL is roughly inverselyproportional to vco at Z >∼ 0.3 Z�, because it scales with theinverse of coagulation efficiency. Since coagulation conservesthe total dust mass, Dtot is hardly affected by the change ofvco.
4.4.4 Mass fraction of dense cloud: fdense
The subgrid parameter introduced to describe accretionand coagulation is the fraction of dense clouds fdense (Sec-tion 2.3). In addition to the fiducial case of fdense = 0.5, wealso examine a low fraction fdense = 0.1, as shown in Fig. 12.
The increase ofDtot by accretion occurs at higher metal-licity for fdense = 0.1 than for fdense = 0.5, because of a lowerefficiency of accretion. In other words, a higher metallicityis required for accretion to be efficient enough to raise thedust-to-gas ratio. However, the dust-to-gas ratio eventuallyreaches similar values at solar metallicity in both cases.
The effect of coagulation is seen in DS/DL, which issystematically lower at high metallicities for fdense = 0.5
MNRAS 000, 1–18 (2016)

12 S. Aoyama et al.
Figure 8. Small-to-large grain abundance ratio (DS/DL) as a
function of metallicity Z at various epoch. The colour indicatesthe logarithmic surface density of the gas particle in each pixel of
this diagram.
Figure 9. Dependence of Dtot − Z and DS/DL − Z relations
on the dust coagulation efficiency fin at t = 1 Gyr. In the left
column, we plot the distribution of gas particles for the fiducialcase (fin = 0.1), which are also shown in Figs. 7 and 8. In theright column, we show the results of fin = 0.01 for comparison.
than for fdense = 0.1 due to more efficient coagulation. Incontrast, the change of fdense does not affect the results atlow metallicities, because neither coagulation nor accretionis the dominant mechanism for driving the dust evolution atlow metallicities.
4.4.5 Dust destruction efficiency in an SN blast: εSN
Nozawa et al. (2006) studied the efficiency of dust destruc-tion in an SN blast for various dust species, and showedthat it varies by about a factor of four among differentdust species. Therefore we also simulate a high efficiency
Figure 10. Same as Fig. 9, but for the comparison betweennSH
th = 1 cm−3 (left column) and nSHth = 0.1 cm−3 (right col-
umn).
Figure 11. Same as Fig. 9, but for the comparison between vco =0.1 km s−1 (left column) and vco = 0.01 km s−1 (right column).
case with εSN = 0.4 and compare with the fiducial case,εSN = 0.1, in Fig. 13.
We find that the dispersion of gas particles on theDtot − Z plane at Z ∼ 0.1 Z� is greater for εSN = 0.4than for εSN = 0.1. The dispersion is especially increasedtoward small Dtot. In addition, DS/DL is slightly suppressedat Z ∼ 0.03 Z� for εSN = 0.4 case compared to εSN = 0.1case. These results suggest that the location of the increaseof Dtot and DS/DL by accretion is shifted to higher metal-licity if SN destruction is stronger. This is consistent withthe one-zone calculation result in Hirashita (2015). The ’dis-turbance’ by SN destruction also increases scatter at highmetallicities. Therefore, although SN destruction does notchange the overall behaviour in the Dtot − Z diagram, it
MNRAS 000, 1–18 (2016)

Galaxy Simulation with Dust Formation and Destruction 13
Figure 12. Same as Fig. 9, but for the comparison between
fdense = 0.5 (left column) and fdense = 0.1 (right column).
Figure 13. Same as Fig. 9, but for the comparison between εSN =0.1 (left column) and εSN = 0.4 (right column).
produces more scatter in the dust abundance and grain sizedistribution.
5 OBSERVATIONAL IMPLICATIONS
Although the main purpose of this paper has been to estab-lish a computational framework of dust evolution in galaxysimulations, it is an important step to compare the output ofsimulations with observational data. Among the quantitiesthat can be compared directly with observations, we choosethe radial distribution of dust-to-gas ratio and dust-to-metalratio. The dust-to-metal ratio is referred to as the ‘depletion’in this paper.
Depletion is one of the observational quantities that sug-gest the existence of dust in the ISM (e.g., Mathis 1990).
Galaxy m∗ [109M�] ψ [M�/yr] sSFR [Gyr−1] Category
HolmbergII 0.20(1) 6.61(1) 33.128(1) I
NGC925 7.94(1) 10.72(1) 1.350(1) II
NGC3621 58.88(2) 125.89(3) 2.138 II
NGC628 12.59(1) 9.77(1) 0.776(1) III
NGC2403 2.14(4) 1.74(4) 0.813(4) III
NGC4736 19.95(1) 7.76(1) 0.389(1) III
NGC5055 63.10(1) 11.75(1) 0.186(1) III
NGC5194 39.81(1) 7.76(1) 0.195(1) III
NGC7793 3.39(2) 3.16(3) 0.933 III
NGC2841 79.43(1) 6.92(1) 0.087(1) IV
NGC3031 85.11(2) 12.59(3) 0.148 IV
NGC3198 10.00(4) 1.00(4) 0.100(4) IV
NGC3351 56.23(4) 3.31(4) 0.059(4) IV
NGC3521 190.55(4) 10.47(4) 0.055(4) IV
NGC7331 79.43(1) 9.12(1) 0.115(1) IV
Table 2. Stellar mass (m∗), global star formation rate (ψ), spe-
cific star formation rate (sSFR) and corresponding category ofeach galaxy. The references of each values are described as a su-
perscript. (1), (2), (3) and (4) correspond to Heesen et al. (2014),
Dutta et al. (2013); de Blok et al. (2008) and Zhou et al. (2015),respectively. For SFR and stellar mass, Dutta et al. (2013) and
de Blok et al. (2008) are used, respectively.
There is no direct observational data for grain size distri-butions, although extinction curves and dust emission spec-tra may give some constraints on them (Yajima et al. 2014;Nozawa et al. 2015; Hou et al. 2016). However, further mod-elling is necessary to predict dust extinction and emission,requiring additional sets of assumptions (Draine & Li 2001;Li & Draine 2001). Therefore we leave those issues for ourfuture work (Hou et al., in preparation).
5.1 Radial profile
We discuss and compare the total dust surface density insimulations and observations. First, we show the time evo-lution of the radial profile of dust surface density in Fig. 14.Overall, the dust surface density increases as time passesdue to dust enrichment. The dust surface density rapidly in-creases from t = 0.3 Gyr to 1 Gyr due to accretion, especiallyin the central region. However, the star formation activityin the central region is also high and the gas is consumedrapidly before t ' 1 Gyr. Thus the dust surface density issaturated by astration (i.e., consumption of gas, metals anddust by star formation) at the central region after t ' 1 Gyr.In contrast, the dust-to-gas ratio and metallicity monotoni-cally increase at all radii even in this phase, because astra-tion decreases dust, metals and gas at the same rate.
The time evolution of radial profile of DS/DL can beunderstood in the following way. In the early phase such ast . 0.3 Gyr, the source of small grains is mainly shatteringand the abundance of small grains is determined only bythat of large grains. Hence DS/DL roughly follows the radialprofile of Dtot. At 0.2 . t . 0.5 Gyr, small grains startsto increase more than large grains via accretion, especiallyin the central region where the gas density (i.e., efficiencyof shattering) and star formation rate (i.e., production rateof large grains) are high. The rapid increase in DS/DL isobserved at later epochs (∼ 1 Gyr) in the outer region. In
MNRAS 000, 1–18 (2016)
14 S. Aoyama et al.
Figure 14. Radial profiles of the dust surface density Σdust,tot
(top-left), small-to-large grain abundance ratio DS/DL (top-
right), total dust-to-gas mass ratio Dtot (bottom-left), and metal-licity Z (bottom-right) at t = 0.3 Gyr (dotted), 1.0 Gyr (dot-
short-dashed), 3.0 Gyr (dot-long-dashed), and 10.0 Gyr (dashed).
In the top left panel, we also overplot the observationally derivedradial profiles by Sandstrom et al. (2013) and Smith et al. (2016).
contrast, in the central region, coagulation decreases DS/DL
at t>∼ 1 Gyr.In the later stage of simulation (t>∼ 1 Gyr), shattering
further increases DS/DL. The reason is the following. Astime passes, dense gas particles are consumed by star for-mation and the sites of coagulation monotonically decreases.On the other hand, the sites of shattering do not decrease somuch, because diffuse ISM does not form stars. As a result,DS/DL continues to increase after t = 1 Gyr.
The radial profile of dust-to-gas ratio have been ob-servationally investigated by Sandstrom et al. (2013) fornearby galaxies. To cancel the galaxy size effect, we nor-malise the radius by R25 (the radius at which surface bright-ness falls to 25 mag arcsec−2) for the simulated galaxy,following Mattsson & Andersen (2012). The value of R25
changes as time passes, because the distribution of stel-lar component changes: R25 = (6.9, 7.0, 7.2, 8.4) kpc att = (0.3, 1.0, 3.0, 10.0) Gyr, respectively.
The surface density profile of stellar disc in a spiralgalaxy, Σ∗(r), can be approximately described by a singleexponential function as Σ∗(r) = Σ0 exp(−r/Rd), where Σ0
is the central surface density. The scale length of stellar disk,Rd, is determined by fitting the stellar surface density profileof simulated galaxy at each epoch. We relate Rd and R25 byR25 ' 4Rd (Elmegreen 1998). This relation can be confirmedby the data in, e.g., de Vaucouleurs & Pence (1978). Sand-strom et al. (2013) showed that the stacked radial profile ofdust surface density is well explained by exp (−0.56 r/R25).We plot this slope in Fig. 14 together with the simulationresults, and find that the simulation results at t > 3.0 Gyragree well with the observed one by Sandstrom et al. (2013).Smith et al. (2016) also gave a fit of −1.7 dexR−1
25 to the ob-served dust surface density profile using 110 spiral galaxiesin the Herschel Reference Survey, as shown in the top leftpanel of Fig. 14.
(a)
(b)
(c)
(d)
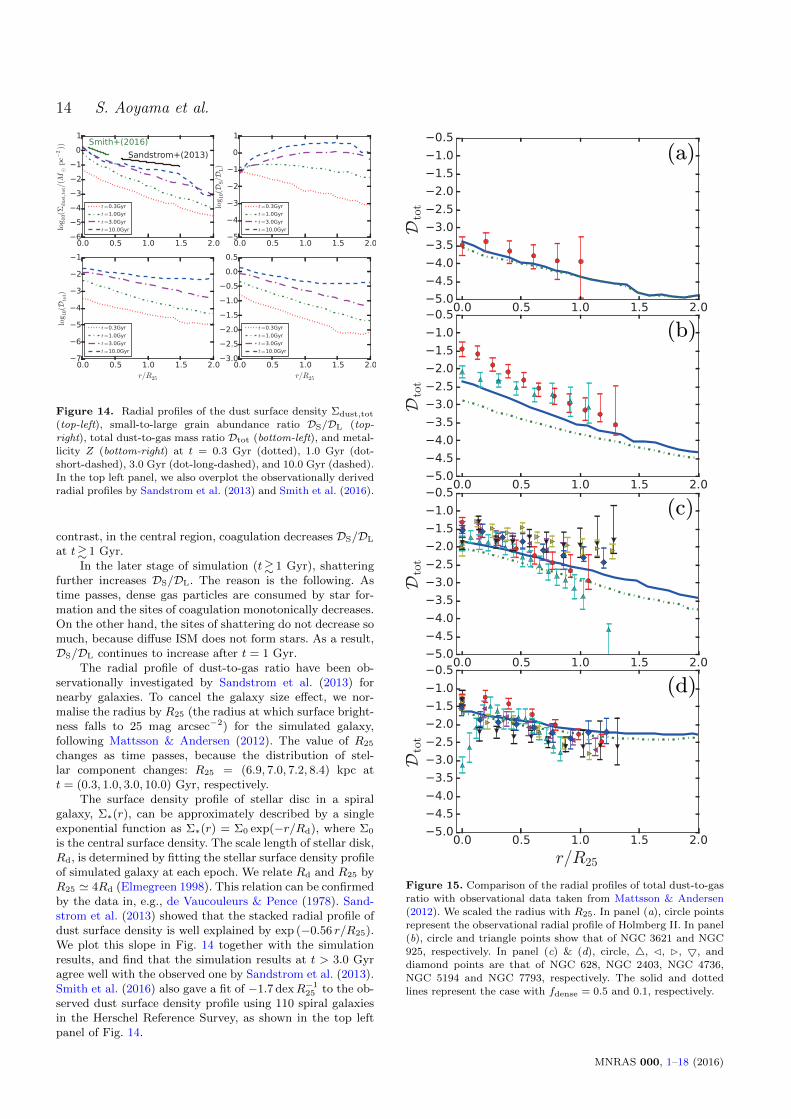
Figure 15. Comparison of the radial profiles of total dust-to-gasratio with observational data taken from Mattsson & Andersen
(2012). We scaled the radius with R25. In panel (a), circle points
represent the observational radial profile of Holmberg II. In panel(b), circle and triangle points show that of NGC 3621 and NGC
925, respectively. In panel (c) & (d), circle, 4, C, B, 5, and
diamond points are that of NGC 628, NGC 2403, NGC 4736,NGC 5194 and NGC 7793, respectively. The solid and dotted
lines represent the case with fdense = 0.5 and 0.1, respectively.
MNRAS 000, 1–18 (2016)
Galaxy Simulation with Dust Formation and Destruction 15
In addition, we also compare our simulation against theobserved data by Mattsson & Andersen (2012), who inves-tigated the radial profile of dust-to-gas ratio and dust-to-metal ratio in nearby star-forming galaxies (mainly spiralgalaxies). They used the metallicity calibration method ofMoustakas et al. (2010). In order to compare the simula-tion snapshots at various ages with observations, we classifythe observed galaxy sample according to their evolutionarystage. We use the specific star formation rate (sSFR) asan indicator of evolutionary stage, as the build-up of stellarmass is tightly related to the metal and dust enrichment. Wetake sSFR in the literature as summarised in Table 2, and di-vide the sample into following four categories: 10 Gyr−1 <sSFR, 1 Gyr−1 ≤ sSFR ≤ 10 Gyr−1, 10−0.8 < sSFR < 1Gyr−1, and sSFR < 10−0.8 Gyr−1 for Category I, II, III andIV, respectively. Holmberg II is a dwarf irregular galaxy,not a spiral galaxy, but it is also included as a representa-tive of young objects, although the comparison should betaken as preliminary until we really simulate a dwarf irreg-ular galaxy. In our simulated galaxy, we adopt the ages 0.3,1, 3, and 10 Gyr, when the average sSFR is ∼ 3 , 1, 0.3, and0.1 Gyr−1, respectively. We compare the simulation resultsat t = 0.3, 1, 3, and 10 Gyr with Category I, II, III and IV,respectively.
We plot the radial profile of Dtot of each category inFig. 15. Since the radial profile is sensitive to grain growth,we show the results with fdense = 0.5 (solid line) and 0.1(dotted line). The dust-to-gas ratio in the ‘youngest’ phaserepresented by Category I (Holmberg II) is broadly repro-duced in terms of not only the slope but also the absolutevalue. The difference between the results with fdense = 0.5and 0.1 is small, because the dust formation is dominatedby stellar production at this early age.
For the galaxies in Category II compared with the sim-ulation result at t = 1 Gyr in Fig. 15b, the slope of the ra-dial profile is reproduced well, although the simulated Dtot
tend to be lower than the observed data points. However,the dust-to-metal ratio is reproduced well over the entireradii (see Section 5.2); thus, we suspect that the metallic-ity evolution implemented in our model underproduces themetallicities for those galaxies. It requires a further checkin the future, but this could simply be regarded as an earlytransient feature in isolated galaxy simulations of this typewhich does not include any cosmological evolution.
The galaxies in Category III are compared with the sim-ulation results at t = 3.0 Gyr in Fig. 15c. Although theobserved data points have large dispersion, the simulationsroughly reproduce both the absolute value and slope of ex-cept the outer part of NGC 2403. Even when we adopt thesmaller fdense, the result changes only by 30 % and the dif-ference is smaller than most observational uncertainties.
The simulation results at t = 10 Gyr are compared withthe galaxies in Category IV in Fig. 15d. The simulated slopeis shallower at t = 10 Gyr than at 3.0 Gyr, because the in-crease of Dtot by accretion is efficient up to the outer radii.The simulation result reproduces the overall trend of ob-served data except for the central part of NGC 3031. Sincethe deficiency of dust abundance in NGC 3031 is also seen inthe dust-to-metal ratio (see Section 5.2), the dust destruc-tion in the central part of NGC 3031 may be much moreefficient than assumed in this paper. Because the accretion
is saturated at this late age, the dependence of simulationresult on fdense is very weak.
5.2 Depletion
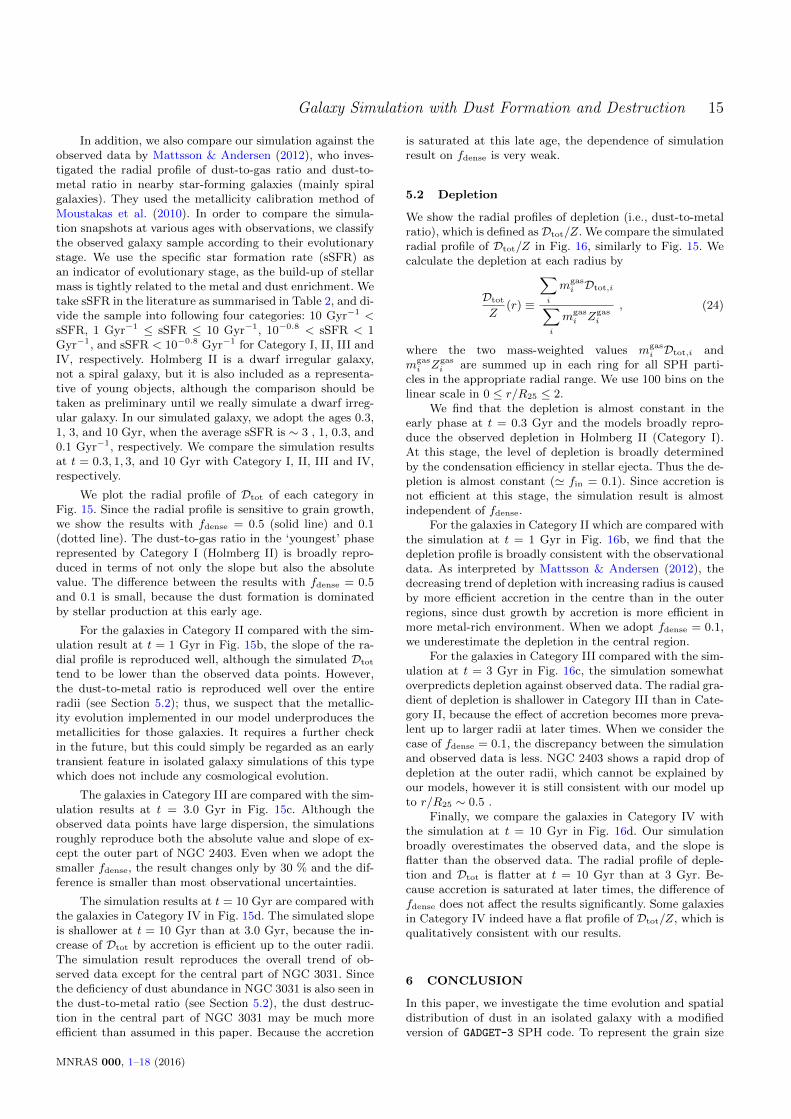
We show the radial profiles of depletion (i.e., dust-to-metalratio), which is defined asDtot/Z. We compare the simulatedradial profile of Dtot/Z in Fig. 16, similarly to Fig. 15. Wecalculate the depletion at each radius by
Dtot
Z(r) ≡
∑i
mgasi Dtot,i∑
i
mgasi Zgas
i
, (24)
where the two mass-weighted values mgasi Dtot,i and
mgasi Zgas
i are summed up in each ring for all SPH parti-cles in the appropriate radial range. We use 100 bins on thelinear scale in 0 ≤ r/R25 ≤ 2.
We find that the depletion is almost constant in theearly phase at t = 0.3 Gyr and the models broadly repro-duce the observed depletion in Holmberg II (Category I).At this stage, the level of depletion is broadly determinedby the condensation efficiency in stellar ejecta. Thus the de-pletion is almost constant (' fin = 0.1). Since accretion isnot efficient at this stage, the simulation result is almostindependent of fdense.
For the galaxies in Category II which are compared withthe simulation at t = 1 Gyr in Fig. 16b, we find that thedepletion profile is broadly consistent with the observationaldata. As interpreted by Mattsson & Andersen (2012), thedecreasing trend of depletion with increasing radius is causedby more efficient accretion in the centre than in the outerregions, since dust growth by accretion is more efficient inmore metal-rich environment. When we adopt fdense = 0.1,we underestimate the depletion in the central region.
For the galaxies in Category III compared with the sim-ulation at t = 3 Gyr in Fig. 16c, the simulation somewhatoverpredicts depletion against observed data. The radial gra-dient of depletion is shallower in Category III than in Cate-gory II, because the effect of accretion becomes more preva-lent up to larger radii at later times. When we consider thecase of fdense = 0.1, the discrepancy between the simulationand observed data is less. NGC 2403 shows a rapid drop ofdepletion at the outer radii, which cannot be explained byour models, however it is still consistent with our model upto r/R25 ∼ 0.5 .
Finally, we compare the galaxies in Category IV withthe simulation at t = 10 Gyr in Fig. 16d. Our simulationbroadly overestimates the observed data, and the slope isflatter than the observed data. The radial profile of deple-tion and Dtot is flatter at t = 10 Gyr than at 3 Gyr. Be-cause accretion is saturated at later times, the difference offdense does not affect the results significantly. Some galaxiesin Category IV indeed have a flat profile of Dtot/Z, which isqualitatively consistent with our results.
6 CONCLUSION
In this paper, we investigate the time evolution and spatialdistribution of dust in an isolated galaxy with a modifiedversion of GADGET-3 SPH code. To represent the grain size
MNRAS 000, 1–18 (2016)

16 S. Aoyama et al.
(a)
(b)
(c)
(d)
Figure 16. Comparison of simulation results with observed ra-
dial profiles of depletion in each category (panels (a) to (d) cor-
respond to Category I to IV, respectively). The solid and dottedlines represent the cases with fdense = 0.5 and 0.1, respectively.
The data points are obtained by Mattsson & Andersen (2012).The symbols for observational points indicate the same galaxiesas Fig. 15.
distribution, we calculate the abundances of small and largegrains separately based on the one-zone model by Hirashita(2015) Dust production by stars and destruction by SNe areimplemented consistently with star formation. In order toovercome the mass resolution of the simulation, we developsubgrid models for accretion and coagulation, since theseprocesses occur in dense clouds whose sizes are below thespatial resolution of the simulation.
We find that the assumption of fixed dust-to-metal massratio becomes no longer valid when the galaxy age is & 0.2Gyr, because the grain growth by accretion produces a non-linear dependence of dust-to-gas ratio on the metallicity.Small grain production by shattering triggers accretion, be-cause small grains are more efficient in accreting the gas-phase metals. In addition, coagulation becomes also signif-icant at ages >∼ 1 Gyr after a large amount of small grainsare produced by accretion. The age-dependent contributionsof those processes are all important in driving the evolutionof dust-to-gas ratio and grain size distribution at variousepochs, and thus should be included in any calculation ofdust evolution in galaxies.
Finally, we made a first attempt of comparing our sim-ulation results with spatially resolved observational data ofnearby galaxies. To extract the typical age in a simple way,we use the specific star formation rate (sSFR) as an indica-tor, and compared the observed radial profiles of dust-to-gasratio and dust-to-metal ratio (i.e., depletion) with the sim-ulation snapshots at various ages. We find that the radialprofiles calculated in our models are broadly consistent withobservations. The negative radial gradient of dust-to-gas ra-tio is explained by the tight relation between dust-to-gasratio and metallicity. The radial profile of depletion is flatat early epochs (t . 0.3 Gyr), because the dust-to-metal ra-tio is simply determined by the dust condensation efficiencyin stellar ejecta. At later stages, the radial gradient of deple-tion is negative, which represents the fact that the dust-to-gas ratio is a nonlinear (strong) function of metallicity dueto accretion. We also reproduce the observational trend thatthe radial gradient of depletion becomes flatter as the galaxyis aged, which indicates that the regions with efficient graingrowth by accretion extend from inside to outwards.
ACKNOWLEDGMENT
We are grateful to Volker Springel for providing us with theoriginal version of GADGET-3 code, and to Akio Inoue andHidenobu Yajima for useful discussions. This work was sup-ported in part by JSPS KAKENHI Grant Number 26247022.HH thanks the Ministry of Science and Technology for sup-port through grant MOST 105-2112-M-001-027-MY3. Nu-merical simulations were in part carried out on XC30 atthe Centre for Computational Astrophysics, National As-tronomical Observatory of Japan.
REFERENCES
Agertz O., Kravtsov A. V., Leitner S. N., Gnedin N. Y., 2013,
ApJ, 770, 25
Asano R. S., Takeuchi T. T., Hirashita H., Inoue A. K., 2013a,
Earth, Planets, and Space, 65, 213
MNRAS 000, 1–18 (2016)
Galaxy Simulation with Dust Formation and Destruction 17
Asano R. S., Takeuchi T. T., Hirashita H., Nozawa T., 2013b,
MNRAS, 432, 637
Asano R. S., Takeuchi T. T., Hirashita H., Nozawa T., 2014,MNRAS, 440, 134
Barlow M. J., Silk J., 1976, ApJ, 207, 131
Bekki K., 2013, MNRAS, 432, 2298
Bekki K., 2015, MNRAS, 449, 1625
Bohren C. F., Huffman D. R., Kam Z., 1983, Nature, 306, 625
Bryan G. L., et al., 2014, ApJS, 211, 19
Buat V., Boselli A., Gavazzi G., Bonfanti C., 2002, A&A, 383,801
Calzetti D., Armus L., Bohlin R. C., Kinney A. L., Koornneef J.,
Storchi-Bergmann T., 2000, ApJ, 533, 682
Cazaux S., Spaans M., 2009, A&A, 496, 365
Cazaux S., Tielens A. G. G. M., 2004, ApJ, 604, 222
Chabrier G., 2003, PASP, 115, 763
Chevalier R. A., 1974, ApJ, 188, 501
Choi J.-H., Nagamine K., 2009, MNRAS, 393, 1595
Choi J.-H., Nagamine K., 2012, MNRAS, 419, 1280
Draine B. T., Li A., 2001, ApJ, 551, 807
Durier F., Dalla Vecchia C., 2012, MNRAS, 419, 465
Dutta P., Begum A., Bharadwaj S., Chengalur J. N., 2013,
New Astron., 19, 89
Dwek E., 1998, ApJ, 501, 643
Elmegreen D. M., 1998, Galaxies and galactic structure. UpperSaddle River, NJ : Prentice Hall
Fall S. M., Krumholz M. R., Matzner C. D., 2010, ApJ, 710, L142
Gould R. J., Salpeter E. E., 1963, ApJ, 138, 393
Heesen V., Brinks E., Leroy A. K., Heald G., Braun R., Bigiel F.,
Beck R., 2014, AJ, 147, 103
Hirashita H., 2015, MNRAS, 447, 2937
Hirashita H., Kuo T.-M., 2011, MNRAS, 416, 1340
Hirashita H., Voshchinnikov N. V., 2014, MNRAS, 437, 1636
Hirashita H., Yan H., 2009, MNRAS, 394, 1061
Hopkins P. F., 2013, MNRAS, 428, 2840
Hopkins P. F., Quataert E., Murray N., 2011, MNRAS, 417, 950
Hou K.-C., Hirashita H., Micha lowski M. J., 2016, preprint,
(arXiv:1608.06099)
Inoue A. K., 2011a, Earth, Planets, and Space, 63, 1027
Inoue A. K., 2011b, MNRAS, 415, 2920
Jaacks J., Nagamine K., Choi J. H., 2012, MNRAS, 427, 403
Jaacks J., Thompson R., Nagamine K., 2013, ApJ, 766, 94
Jones A. P., Tielens A. G. G. M., Hollenbach D. J., McKee C. F.,
1994, ApJ, 433, 797
Jones A. P., Tielens A. G. G. M., Hollenbach D. J., 1996, ApJ,469, 740
Kataoka A., Okuzumi S., Tanaka H., Nomura H., 2014, A&A,568, A42
Kennicutt R. C., Evans N. J., 2012, ARA&A, 50, 531
Kim J.-h., et al., 2014, ApJS, 210, 14
Kuo T.-M., Hirashita H., 2012, MNRAS, 424, L34
Kuo T.-M., Hirashita H., Zafar T., 2013, MNRAS, 436, 1238
Larson R. B., 2005, MNRAS, 359, 211
Li A., Draine B. T., 2001, ApJ, 554, 778
Mathis J. S., 1990, ARA&A, 28, 37
Mathis J. S., Rumpl W., Nordsieck K. H., 1977, ApJ, 217, 425
Mattsson L., Andersen A. C., 2012, MNRAS, 423, 38
McKee C., 1989, in Allamandola L. J., Tielens A. G. G. M., eds,
IAU Symposium Vol. 135, Interstellar Dust. p. 431
McKee C. F., Ostriker J. P., 1977, ApJ, 218, 148
McKee C. F., Hollenbach D. J., Seab G. C., Tielens A. G. G. M.,
1987, ApJ, 318, 674
McKinnon R., Torrey P., Vogelsberger M., Hayward C. C., Mari-
nacci F., 2016a, preprint, (arXiv:1606.02714)
McKinnon R., Torrey P., Vogelsberger M., 2016b, MNRAS, 457,3775
Morris J. P., 1996, Publ. Astron. Soc. Australia, 13, 97
Moustakas J., Kennicutt Jr. R. C., Tremonti C. A., Dale D. A.,
Smith J.-D. T., Calzetti D., 2010, ApJS, 190, 233
Nagamine K., Fukugita M., Cen R., Ostriker J. P., 2001, ApJ,
558, 497
Nagamine K., Springel V., Hernquist L., Machacek M., 2004, MN-
RAS, 350, 385
Nozawa T., Fukugita M., 2013, ApJ, 770, 27
Nozawa T., Kozasa T., Habe A., 2006, ApJ, 648, 435
Nozawa T., Asano R. S., Hirashita H., Takeuchi T. T., 2015,
MNRAS, 447, L16
Okuzumi S., Tanaka H., Sakagami M.-a., 2009, ApJ, 707, 1247
Omukai K., Tsuribe T., Schneider R., Ferrara A., 2005, ApJ, 626,627
Remy-Ruyer A., et al., 2014, A&A, 563, A31
Saitoh T. R., Makino J., 2013, ApJ, 768, 44
Sandstrom K. M., et al., 2013, ApJ, 777, 5
Schaye J., et al., 2015, MNRAS, 446, 521
Schneider R., Omukai K., Inoue A. K., Ferrara A., 2006, MNRAS,369, 1437
Shimizu I., Inoue A. K., Okamoto T., Yoshida N., 2014, MNRAS,440, 731
Shimizu I., Inoue A. K., Yoshida N., Okamoto T., 2015, preprint,(arXiv:1509.00800)
Smith M. W. L., et al., 2016, MNRAS, 462, 331
Springel V., 2005, MNRAS, 364, 1105
Springel V., Hernquist L., 2002, MNRAS, 333, 649
Springel V., Hernquist L., 2003, MNRAS, 339, 289
Steidel C. C., Adelberger K. L., Giavalisco M., Dickinson M.,Pettini M., 1999, ApJ, 519, 1
Stinson G. S., Brook C., Maccio A. V., Wadsley J., Quinn T. R.,Couchman H. M. P., 2013, MNRAS, 428, 129
Takeuchi T. T., Buat V., Heinis S., Giovannoli E., Yuan F.-T.,Iglesias-Paramo J., Murata K. L., Burgarella D., 2010, A&A,
514, A4
Takeuchi T. T., Yuan F.-T., Ikeyama A., Murata K. L., Inoue
A. K., 2012, ApJ, 755, 144
Thompson R., Nagamine K., Jaacks J., Choi J.-H., 2014, ApJ,
780, 145
Todoroki K., 2014, Master’s thesis, University of Nevada, LasVegas
Valiante R., Schneider R., Bianchi S., Andersen A. C., 2009, MN-RAS, 397, 1661
Vogelsberger M., et al., 2014, MNRAS, 444, 1518
Voshchinnikov N. V., Hirashita H., 2014, MNRAS, 445, 301
Whitworth A. P., Boffin H. M. J., Francis N., 1998, MNRAS, 299,554
Wise J. H., Abel T., Turk M. J., Norman M. L., Smith B. D.,2012, MNRAS, 427, 311
Woosley S. E., Heger A., 2007, Phys. Rep., 442, 269
Yajima H., Nagamine K., Thompson R., Choi J.-H., 2014, MN-
RAS, 439, 3073
Yajima H., Shlosman I., Romano-Dıaz E., Nagamine K., 2015,
MNRAS, 451, 418
Yamasawa D., Habe A., Kozasa T., Nozawa T., Hirashita H.,
Umeda H., Nomoto K., 2011, ApJ, 735, 44
Yan H., Lazarian A., Draine B. T., 2004, ApJ, 616, 895
Zhou Z.-M., Cao C., Wu H., 2015, AJ, 149, 1
Zhukovska S., 2014, A&A, 562, A76
Zhukovska S., Gail H.-P., Trieloff M., 2008, A&A, 479, 453
Zhukovska S., Dobbs C., Jenkins E. B., Klessen R., 2016, preprint,(arXiv:1608.04781)
de Blok W. J. G., Walter F., Brinks E., Trachternach C., Oh
S.-H., Kennicutt Jr. R. C., 2008, AJ, 136, 2648
de Vaucouleurs G., Pence W. D., 1978, AJ, 83, 1163
MNRAS 000, 1–18 (2016)
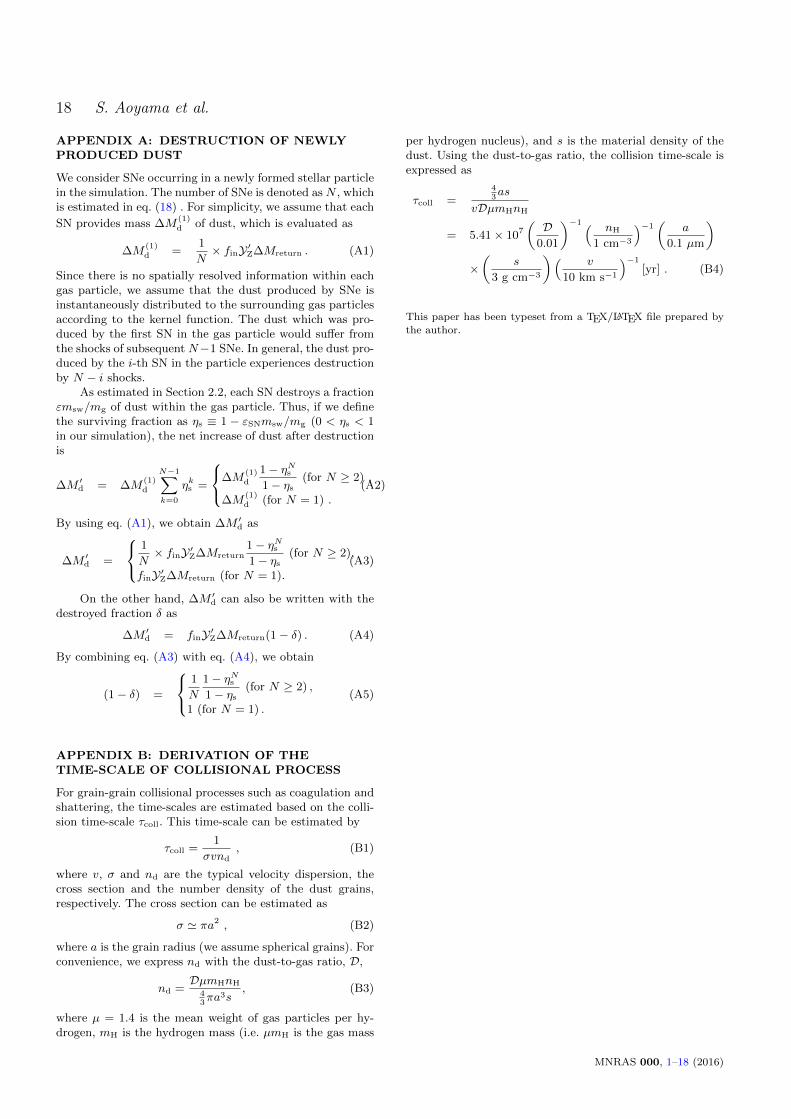
18 S. Aoyama et al.
APPENDIX A: DESTRUCTION OF NEWLYPRODUCED DUST
We consider SNe occurring in a newly formed stellar particlein the simulation. The number of SNe is denoted as N , whichis estimated in eq. (18) . For simplicity, we assume that each
SN provides mass ∆M(1)d of dust, which is evaluated as
∆M(1)d =
1
N× finY ′Z∆Mreturn . (A1)
Since there is no spatially resolved information within eachgas particle, we assume that the dust produced by SNe isinstantaneously distributed to the surrounding gas particlesaccording to the kernel function. The dust which was pro-duced by the first SN in the gas particle would suffer fromthe shocks of subsequent N−1 SNe. In general, the dust pro-duced by the i-th SN in the particle experiences destructionby N − i shocks.
As estimated in Section 2.2, each SN destroys a fractionεmsw/mg of dust within the gas particle. Thus, if we definethe surviving fraction as ηs ≡ 1 − εSNmsw/mg (0 < ηs < 1in our simulation), the net increase of dust after destructionis
∆M ′d = ∆M(1)d
N−1∑k=0
ηks =
∆M(1)d
1− ηNs1− ηs
(for N ≥ 2) ,
∆M(1)d (for N = 1) .
(A2)
By using eq. (A1), we obtain ∆M ′d as
∆M ′d =
1
N× finY ′Z∆Mreturn
1− ηNs1− ηs
(for N ≥ 2),
finY ′Z∆Mreturn (for N = 1).(A3)
On the other hand, ∆M ′d can also be written with thedestroyed fraction δ as
∆M ′d = finY ′Z∆Mreturn(1− δ) . (A4)
By combining eq. (A3) with eq. (A4), we obtain
(1− δ) =
1
N
1− ηNs1− ηs
(for N ≥ 2) ,
1 (for N = 1) .(A5)
APPENDIX B: DERIVATION OF THETIME-SCALE OF COLLISIONAL PROCESS
For grain-grain collisional processes such as coagulation andshattering, the time-scales are estimated based on the colli-sion time-scale τcoll. This time-scale can be estimated by
τcoll =1
σvnd, (B1)
where v, σ and nd are the typical velocity dispersion, thecross section and the number density of the dust grains,respectively. The cross section can be estimated as
σ ' πa2 , (B2)
where a is the grain radius (we assume spherical grains). Forconvenience, we express nd with the dust-to-gas ratio, D,
nd =DµmHnH
43πa3s
, (B3)
where µ = 1.4 is the mean weight of gas particles per hy-drogen, mH is the hydrogen mass (i.e. µmH is the gas mass
per hydrogen nucleus), and s is the material density of thedust. Using the dust-to-gas ratio, the collision time-scale isexpressed as
τcoll =43as
vDµmHnH
= 5.41× 10⁷
(D
0.01
)−1 ( nH
1 cm−3
)−1(
a
0.1 µm
)×(
s
3 g cm−3
)( v
10 km s−1
)−1
[yr] . (B4)
This paper has been typeset from a TEX/LATEX file prepared by
the author.
MNRAS 000, 1–18 (2016)
![EmbeddedBinariesandTheirDenseCores - arXiv · arXiv:1705.00049v1 [astro-ph.SR] 28 Apr 2017 MNRAS 000, 1–16 (2017) Preprint 2 May 2017 Compiled using MNRAS LATEX style file v3.0](https://img.pdfslide.tips/doc/110x75/5f658294006a691ae35852ca/embeddedbinariesandtheirdensecores-arxiv-arxiv170500049v1-astro-phsr-28-apr.jpg)


![arXiv:1701.03103v1 [astro-ph.CO] 11 Jan 2017authors.library.caltech.edu/77200/2/1701.03103.pdf · MNRAS 000,1–10(2015) Preprint 13 January 2017 Compiled using MNRAS LATEX style](https://img.pdfslide.tips/doc/110x75/5f10cc517e708231d44addf4/arxiv170103103v1-astro-phco-11-jan-mnras-0001a102015-preprint-13-january.jpg)
![InvestigationoftheinnerstructuresaroundHD169142 withVLT ......arXiv:1709.01734v2 [astro-ph.EP] 3 Nov 2017 MNRAS 000, 1–10 (2017) Preprint 7 November 2017 Compiled using MNRAS LATEX](https://img.pdfslide.tips/doc/110x75/60b7f974f1360d536d463d22/investigationoftheinnerstructuresaroundhd169142-withvlt-arxiv170901734v2.jpg)