Embed Size (px)
Citation preview
Modeling and Design Diaphragm Micropump
University of South Florida - March 17, 2008
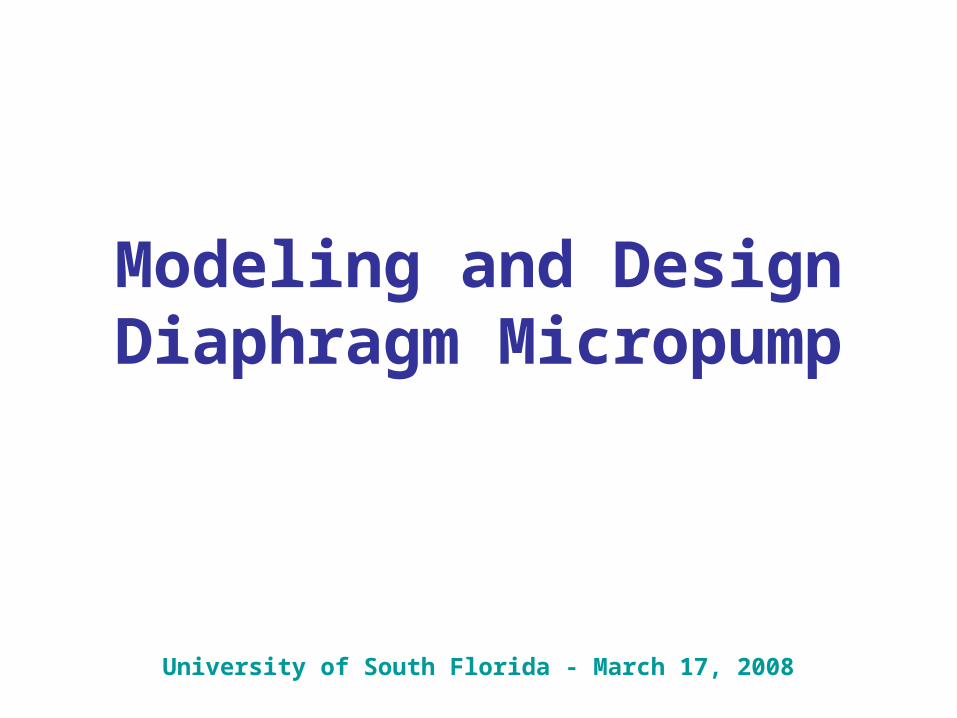
Diaphragm micropump with passive check-valves
Destination
Inlet valve
Outlet valve
Pump chamber
Pump chamber
Pump chamber
p1
p2
s s
1 1 2 2
d d
Diaphragm
Source
1
2 2
Valve discs
z
Vdead
p2*
p1*
p(t)
p(t)
ΔV
22
1 1
1
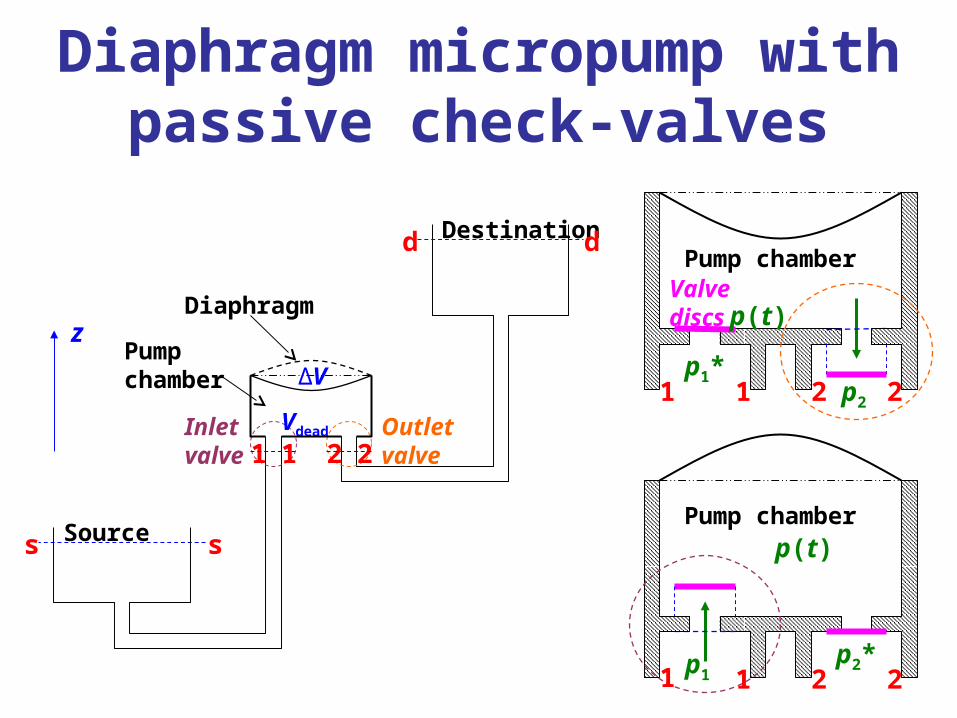
Pump chamber: mathematical model
outoutinin QQdt
dV
dt
dp
K
V
dt
dwAQQ
whA
K
dt
dpoutin
ppQin 11 22 ppQout
whAV
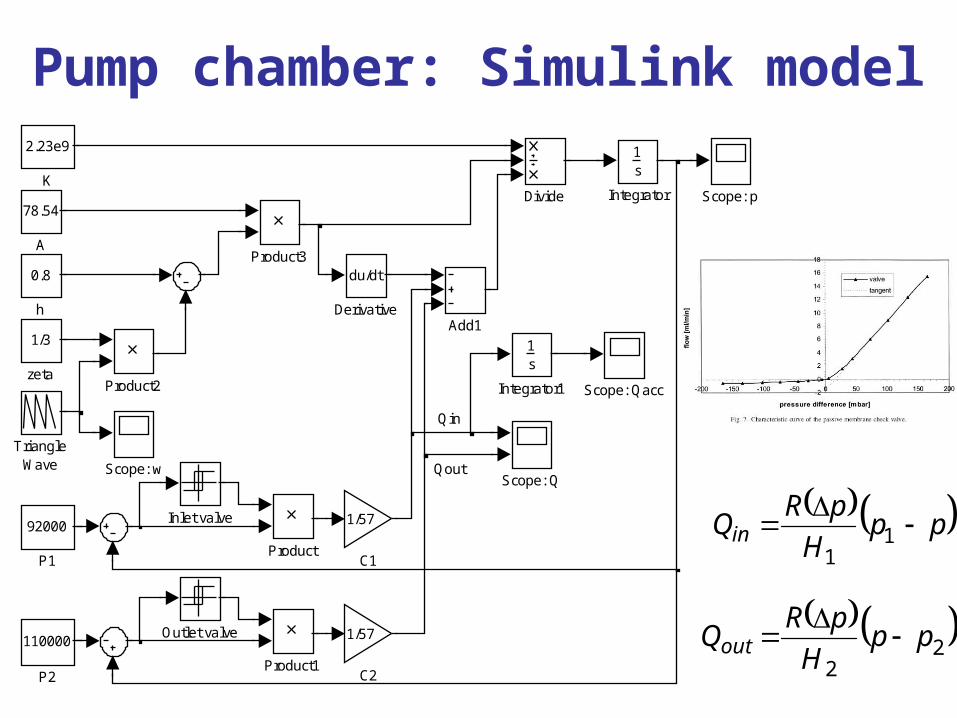
Pump chamber: Simulink model
Qin
Qout
1/3
zeta
0.8
h
TriangleWave Scope: w
Scope: p
Scope: Qacc
Scope: Q
Product3
Product2
Product1
Product
110000
P2
92000
P1
Outlet valve
2.23e9
K
1s
Integrator1
1s
Integrator
Inlet valve
Divide
du/dt
Derivative
1/57
C2
1/57
C1
Add1
78.54
A
ppH
pRQin
1
1
22
ppH
pRQout
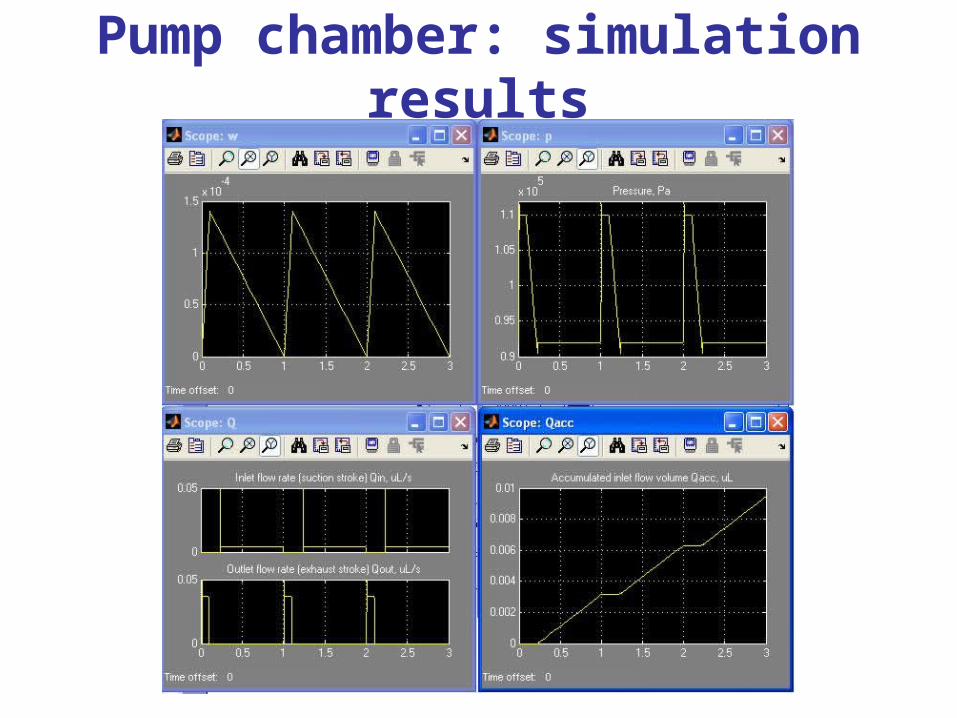
Pump chamber: simulation results
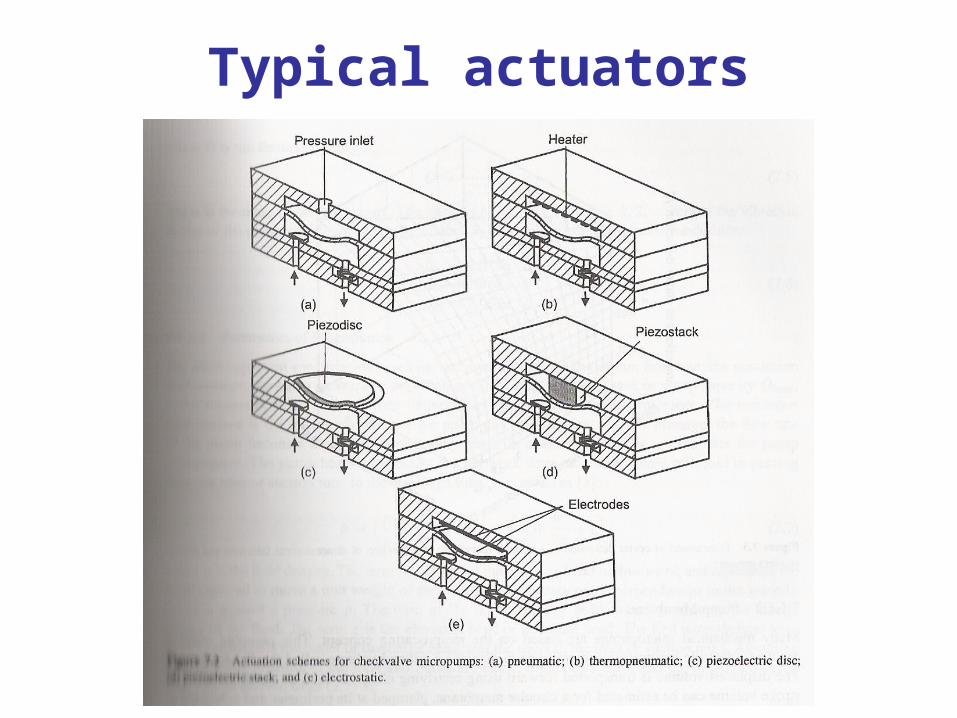
Typical actuators
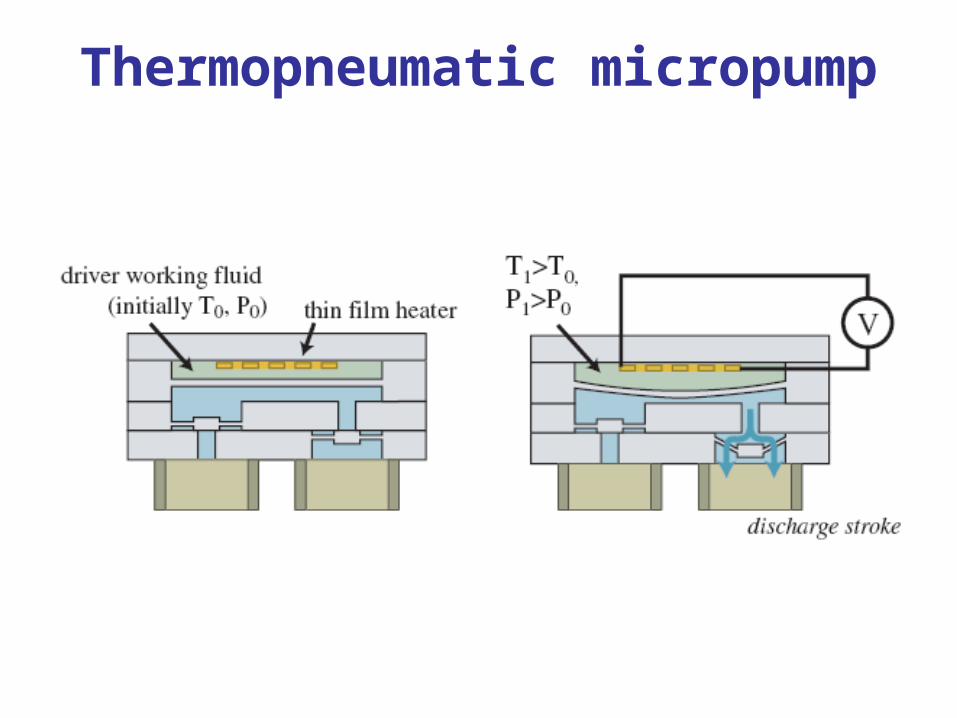
Thermopneumatic micropump
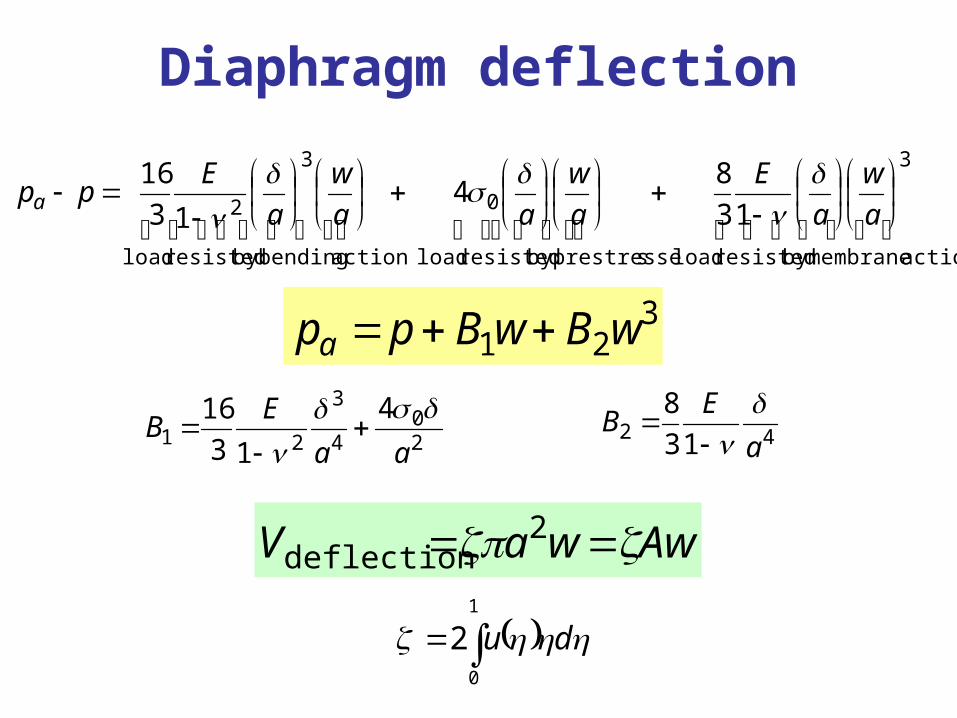
Diaphragm deflection
action membraneby resisted load
3
sprestresseby resisted load
0
action bendingby resisted load
3
2 13
84
13
16
a
w
a
E
a
w
aa
w
a
Eppa
321 wBwBppa
20
4
3
214
13
16
aa
EB
42 13
8
a
EB
AwwaV 2deflection
1
0
2 du
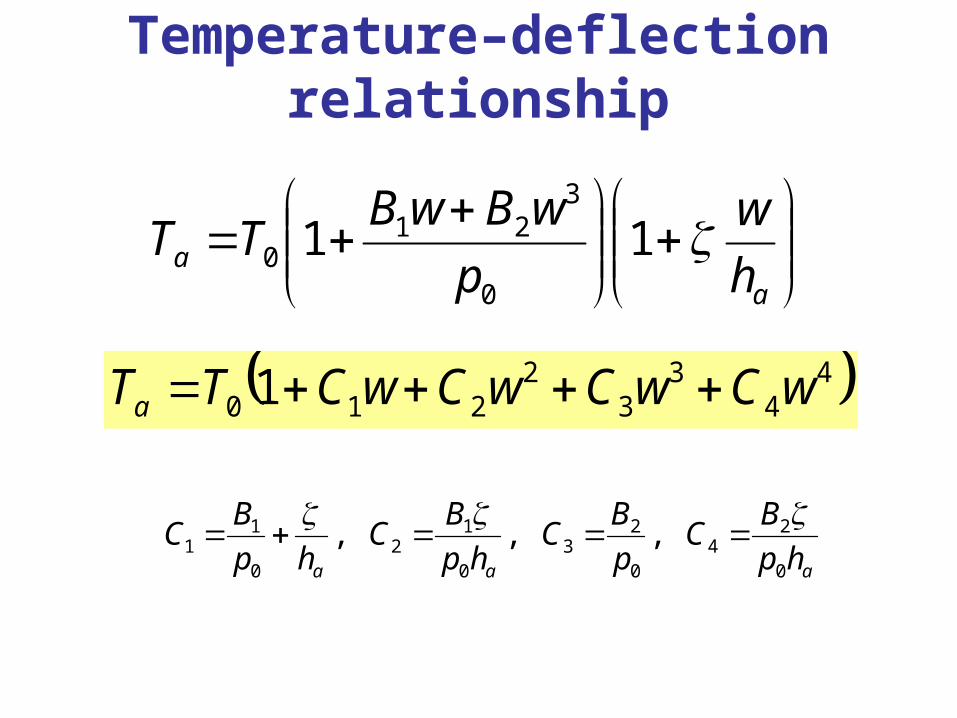
Temperature–deflection relationship
aa h
w
p
wBwBTT 11
0
321
0
44
33
2210 1 wCwCwCwCTTa
aaa hp
BC
p
BC
hp
BC
hp
BC
0
24
0
23
0
12
0
11 ,,,
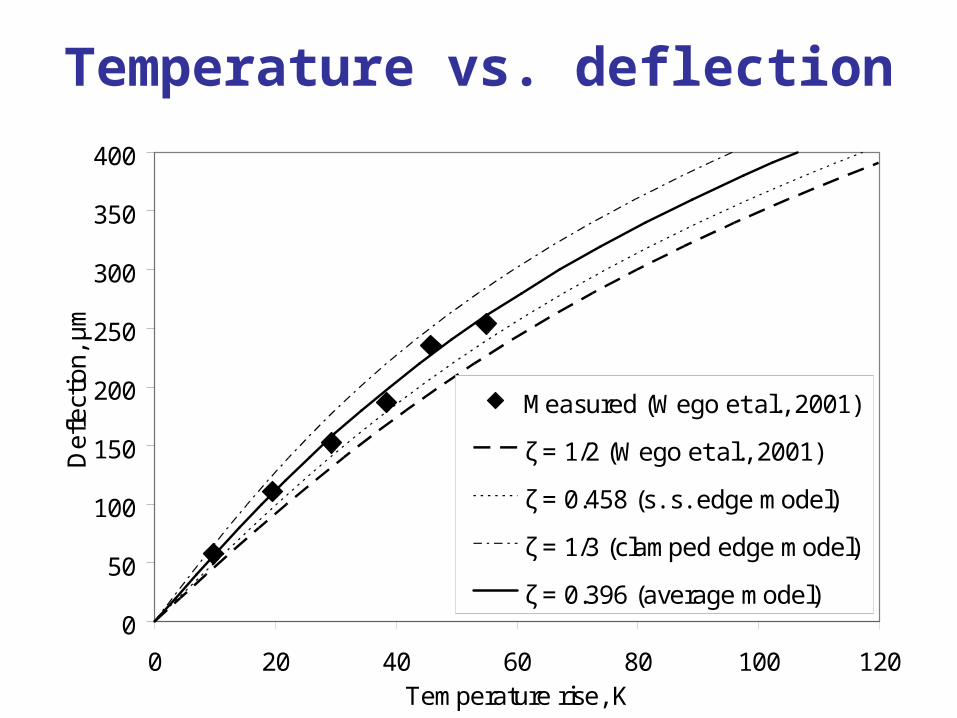
Temperature vs. deflection
0
50
100
150
200
250
300
350
400
0 20 40 60 80 100 120Temperature rise, K
Def
lect
ion,
µm
Measured (Wego et al., 2001)
ζ = 1/2 (Wego et al., 2001)
ζ = 0.458 (s. s. edge model)
ζ = 1/3 (clamped edge model)
ζ = 0.396 (average model)
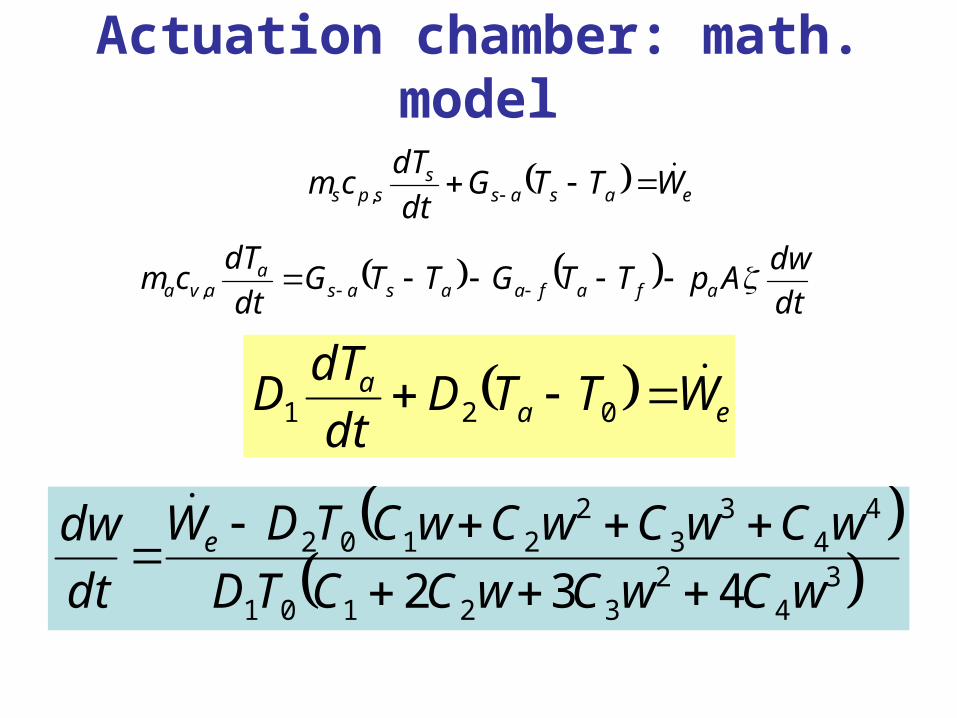
Actuation chamber: math. model
easass
sps WTTGdt
dTcm ,
dt
dwApTTGTTG
dt
dTcm afafaasas
aava ,
eaa WTTDdt
dTD 021
3
42
32101
44
33
22102
432 wCwCwCCTD
wCwCwCwCTDW
dt
dw e
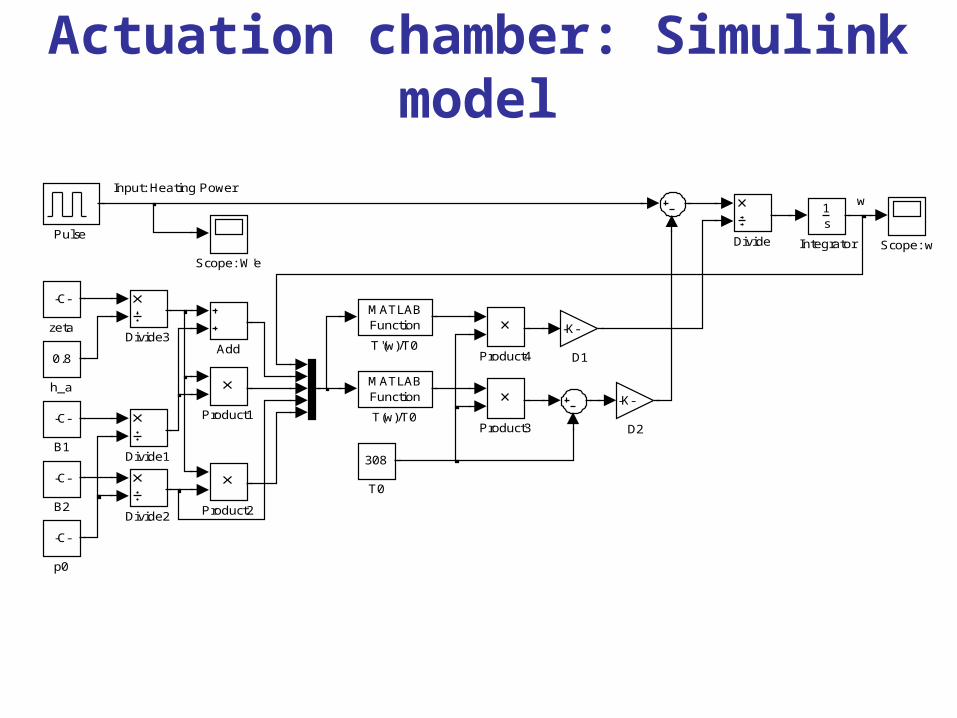
Actuation chamber: Simulink model
wInput: Heating Power
-C-
zeta
-C-
p0
0.8
h_a
308
T0
MATLABFunction
T(w)/T0
MATLABFunction
T'(w)/T0
Scope: w
Scope: W'e
Pulse
Product4
Product3
Product2
Product1
1s
Integrator
Divide3
Divide2
Divide1
Divide
-K-
D2
-K-
D1
-C-
B2
-C-
B1
Add
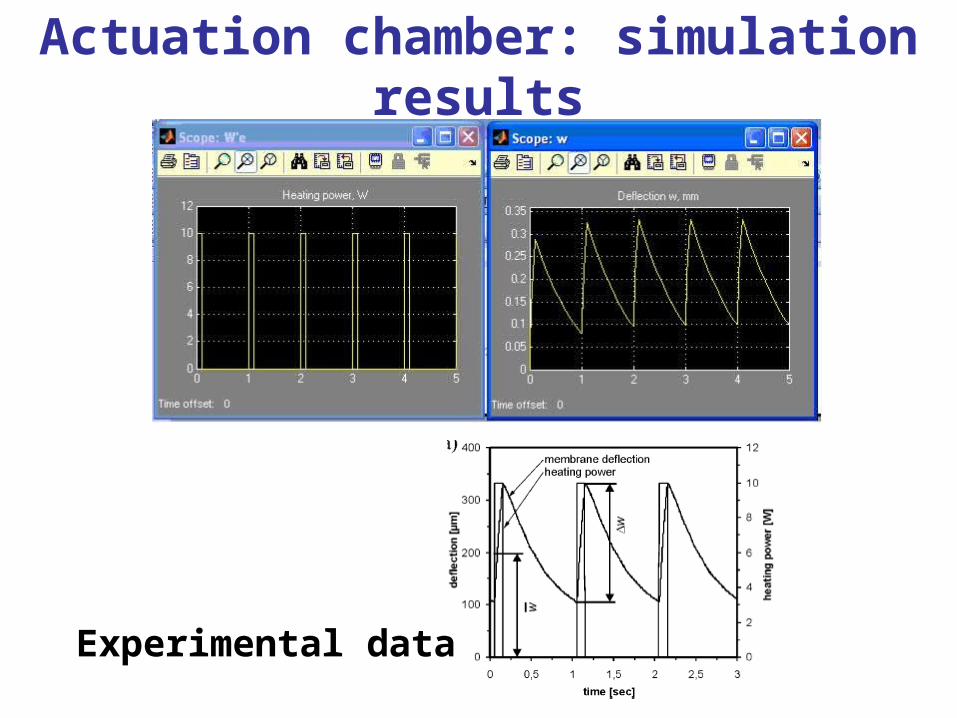
Actuation chamber: simulation results
Experimental data
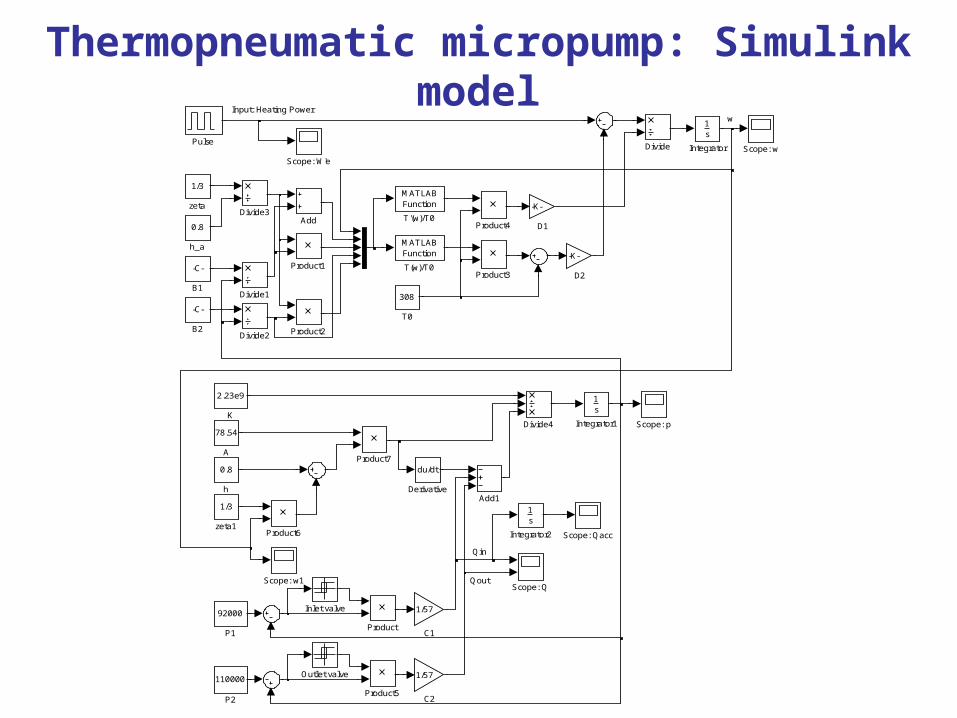
Thermopneumatic micropump: Simulink modelw
Input: Heating Power
Qin
Qout
1/3
zeta1
1/3
zeta
0.8
h_a
0.8
h
308
T0
MATLABFunction
T(w)/T0
MATLABFunction
T'(w)/T0
Scope: w1
Scope: w
Scope: p
Scope: W'e
Scope: Qacc
Scope: Q
Pulse
Product7
Product6
Product5
Product4
Product3
Product2
Product1
Product
110000
P2
92000
P1
Outlet valve
2.23e9
K
1s
Integrator2
1s
Integrator1
1s
Integrator
Inlet valve
Divide4
Divide3
Divide2
Divide1
Divide
du/dt
Derivative
-K-
D2
-K-
D1
1/57
C2
1/57
C1
-C-
B2
-C-
B1
Add1
Add
78.54
A
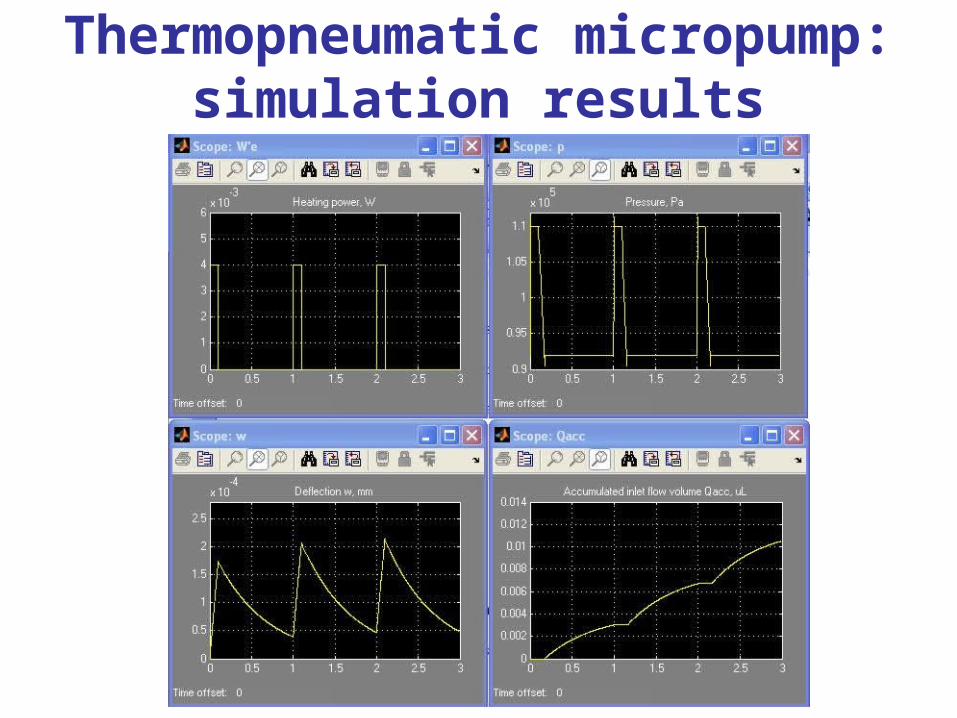
Thermopneumatic micropump: simulation results
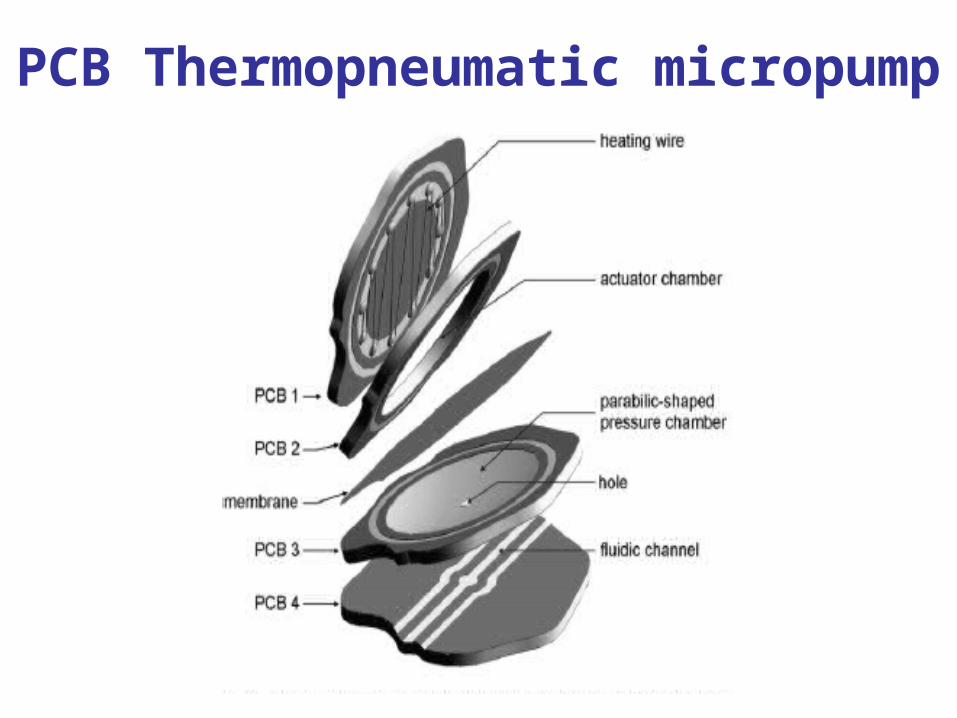
PCB Thermopneumatic micropump
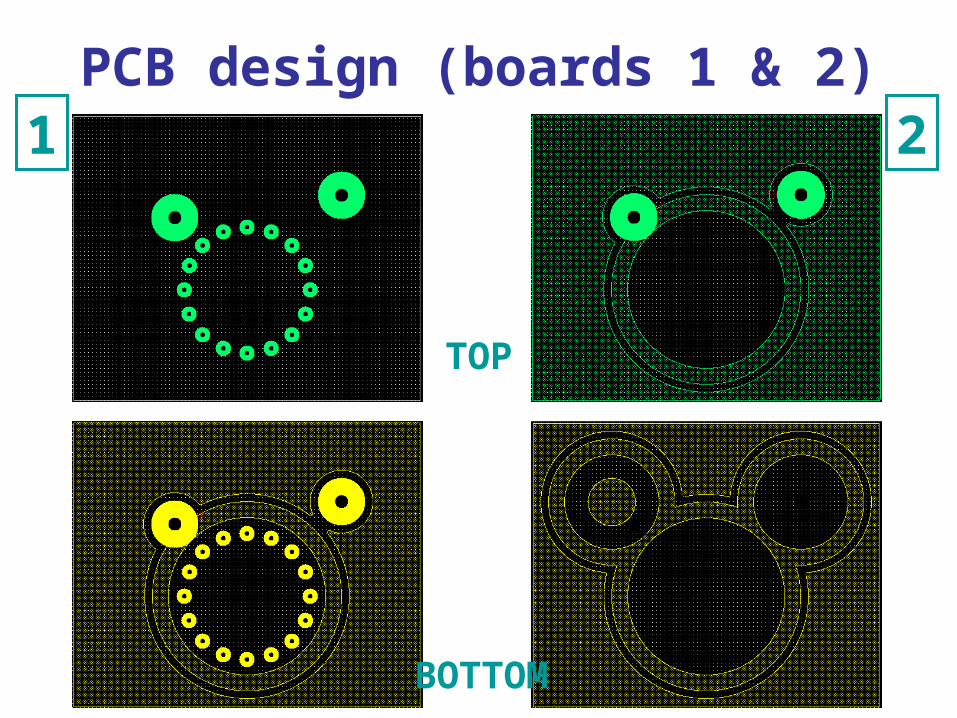
PCB design (boards 1 & 2)
TOP
BOTTOM
1 2
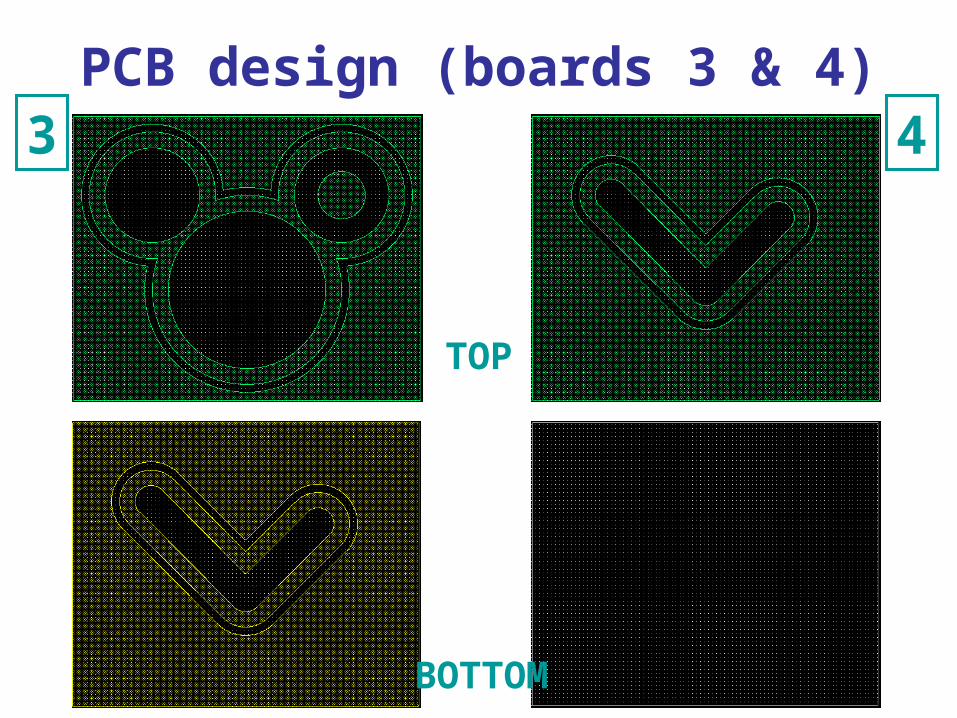
PCB design (boards 3 & 4)
TOP
BOTTOM
3 4
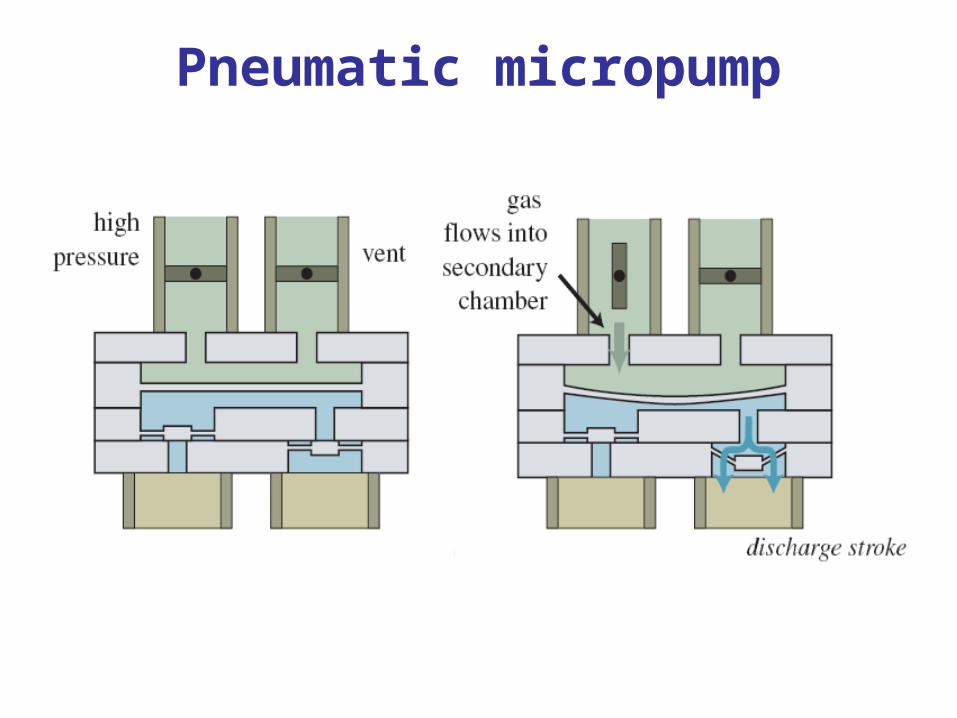
Pneumatic micropump
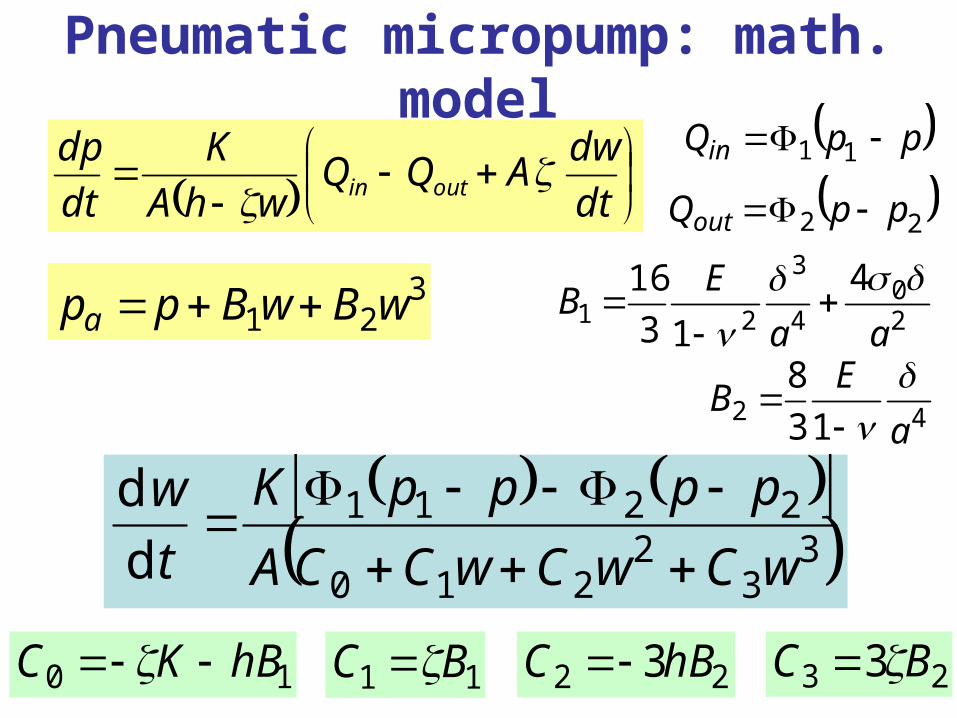
Pneumatic micropump: math. model
321 wBwBppa
dt
dwAQQ
whA
K
dt
dpoutin
ppQin 11
22 ppQout
42 13
8
a
EB
20
4
3
214
13
16
aa
EB
3
32
210
2211
d
d
wCwCwCCA
ppppK
t
w
10 hBKC 11 BC 22 3hBC 23 3 BC
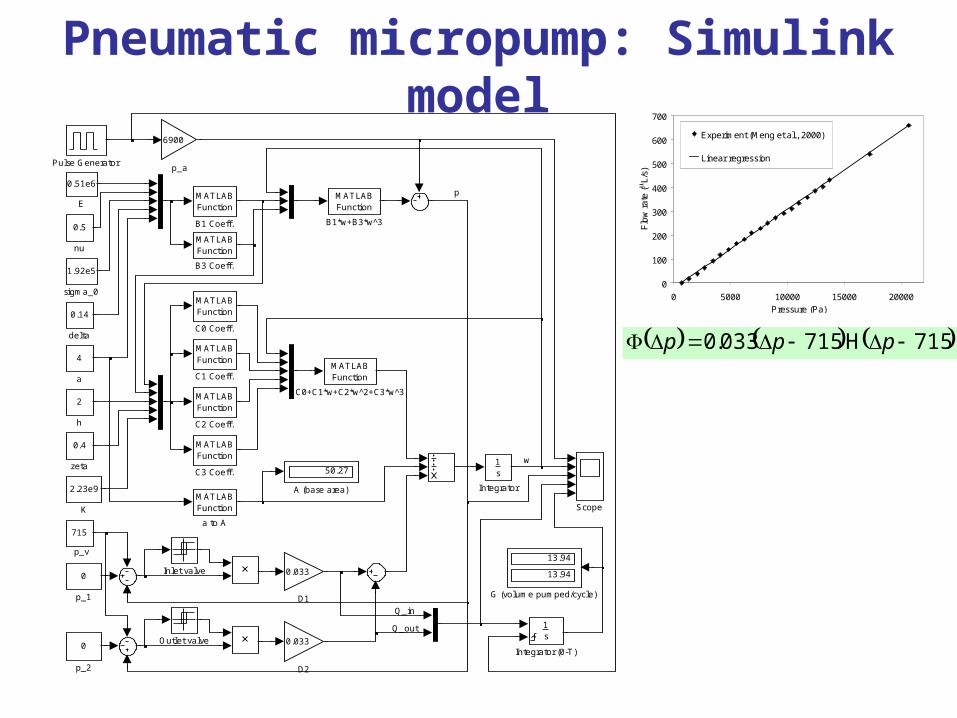
Pneumatic micropump: Simulink model
Q_in
Q_out
w
p
p_v
0.4
zeta
1.92e5
sigma_0
6900
p_a
0
p_2
0
p_1
0.5
nu
2
h
0.14
delta
MATLABFunction
a to A
4
a
Scope
Pulse Generator
Outlet valve
2.23e9
K
1s
Integrator (0-T)
1s
Integrator
Inlet valve
13.94
13.94
G (volume pumped/cycle)
0.51e6
E
0.033
D2
0.033
D1
715
MATLABFunction
C3 Coeff.
MATLABFunction
C2 Coeff.
MATLABFunction
C1 Coeff.MATLABFunction
C0+C1*w+C2*w^2+C3*w^3
MATLABFunction
C0 Coeff.
MATLABFunction
B3 Coeff.
MATLABFunction
B1*w+B3*w^3
MATLABFunction
B1 Coeff.
50.27
A (base area)
0
100
200
300
400
500
600
700
0 5000 10000 15000 20000Pressure (Pa)
Flo
w r
ate
(m L
/s)
Experiment (Meng et al., 2000)
Linear regression
715H715033.0 ppp
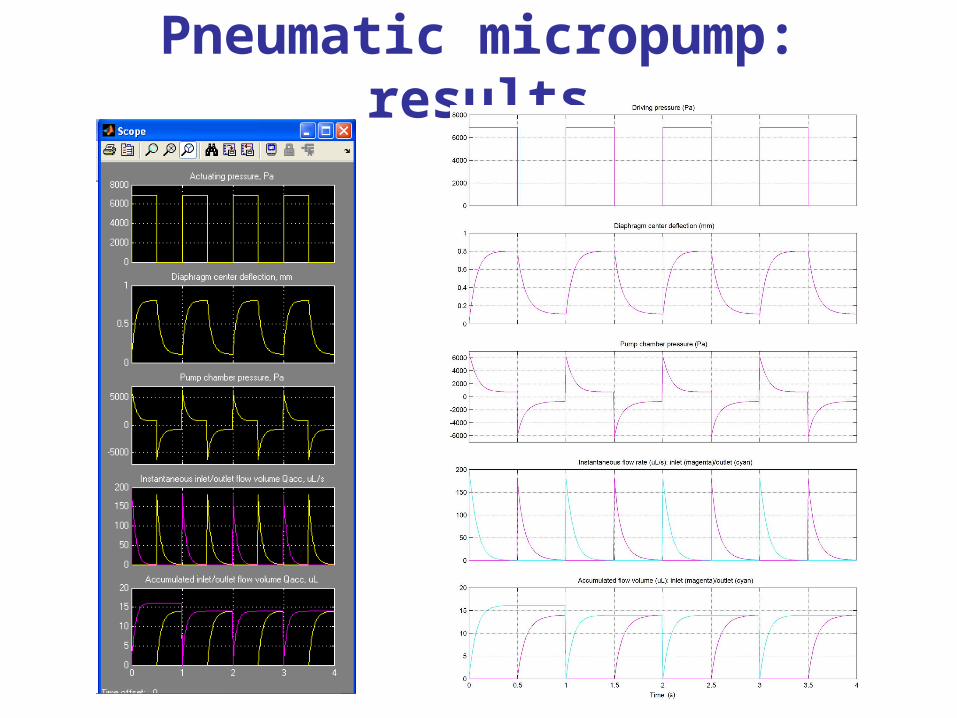
Pneumatic micropump: results
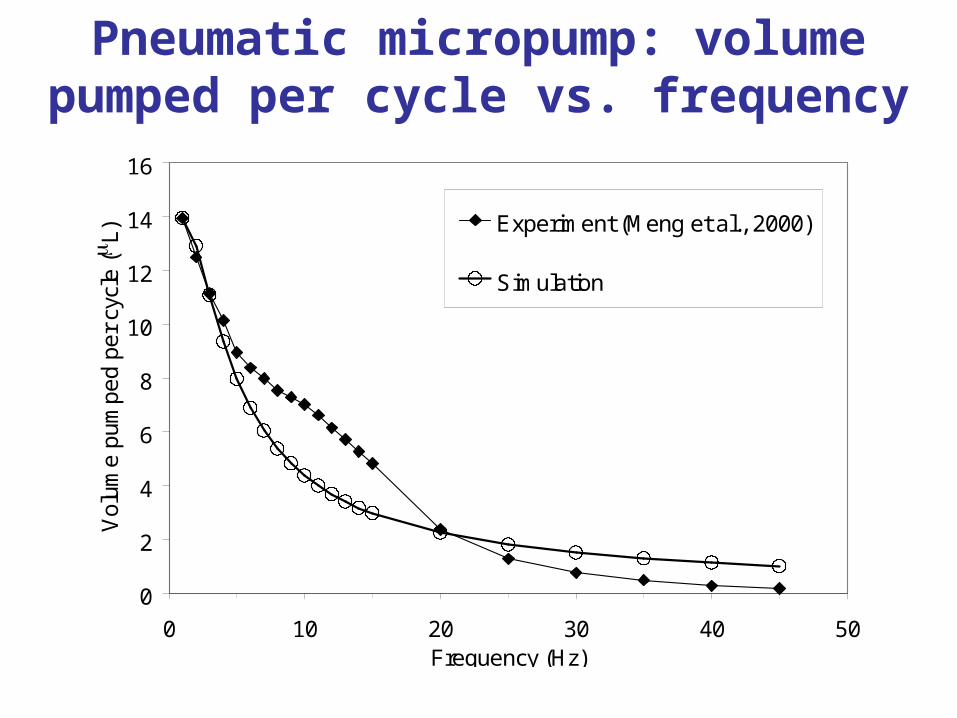
Pneumatic micropump: volume pumped per cycle vs. frequency
0
2
4
6
8
10
12
14
16
0 10 20 30 40 50Frequency (Hz)
Vo
lum
e p
um
pe
d p
er
cycl
e (m L
) Experiment (Meng et al., 2000)
Simulation
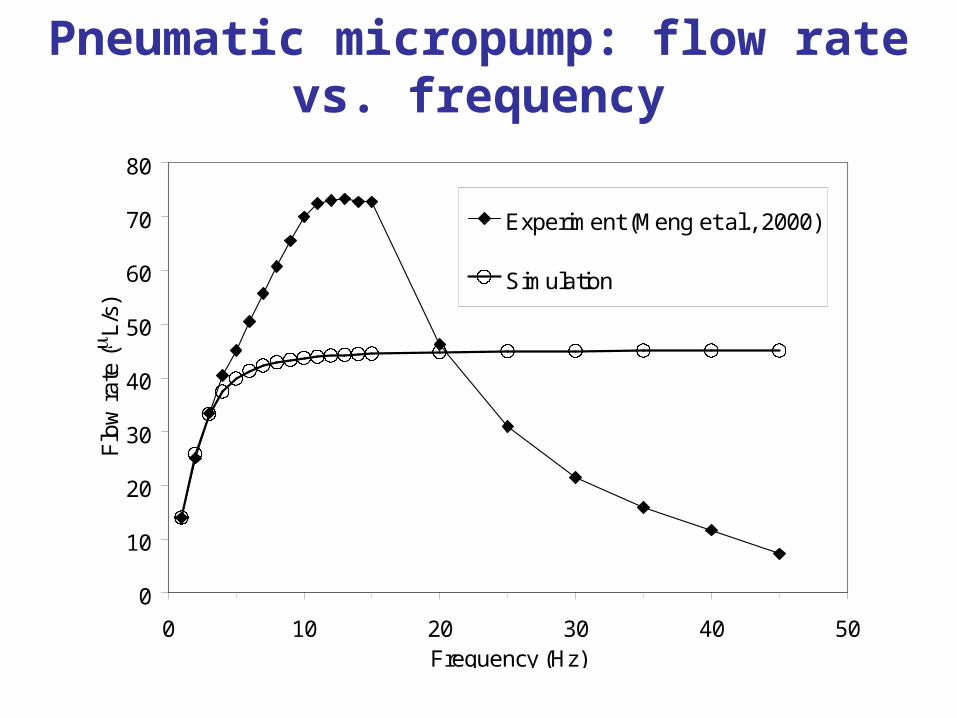
Pneumatic micropump: flow rate vs. frequency
0
10
20
30
40
50
60
70
80
0 10 20 30 40 50Frequency (Hz)
Flo
w r
ate
(m L
/s)
Experiment (Meng et al., 2000)
Simulation
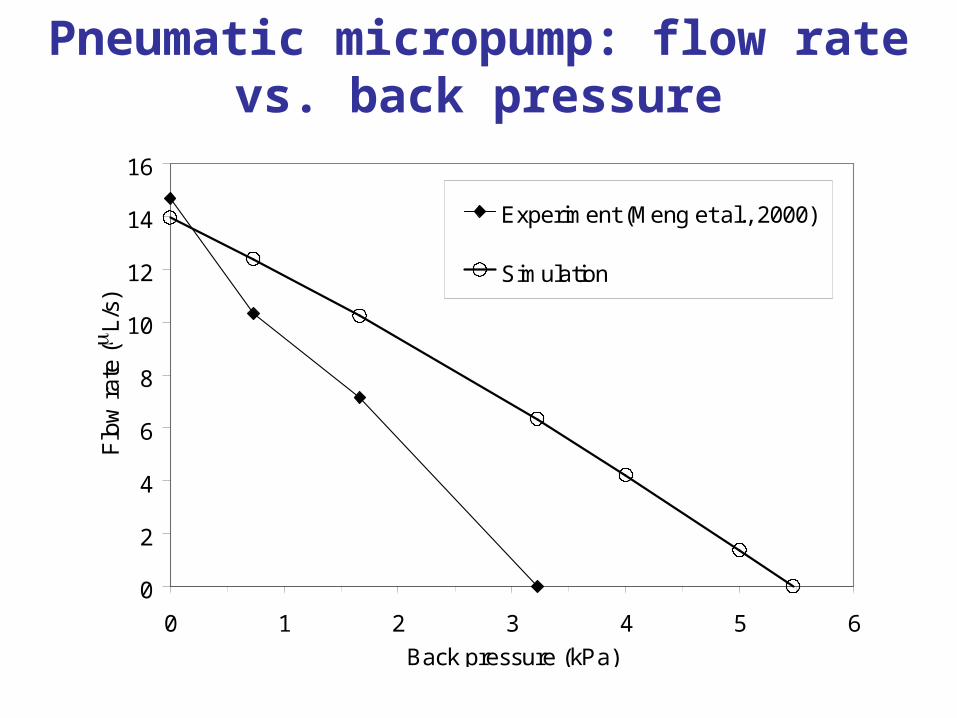
Pneumatic micropump: flow rate vs. back pressure
0
2
4
6
8
10
12
14
16
0 1 2 3 4 5 6
Back pressure (kPa)
Flo
w r
ate
(mL/
s)
Experiment (Meng et al., 2000)
Simulation