Embed Size (px)
Citation preview
1
Modeling Pedestrians’ Subjective Danger Perception toward Personal Mobility Vehicles
Yu Hasegawa1, Charitha Dias2, Miho Iryo-Asano3,* and Hiroaki Nishiuchi4 1 Department of Civil Engineering, The University of Tokyo, 4-6-1, Komaba, Meguro-ku, Tokyo 153-8505, Japan Tel: +81-3-5452-6419, Fax: +81-3-5452-6420 Email: [email protected] 2 Institute of Industrial Science, The University of Tokyo, Japan Email: [email protected] 3 Department of Environmental Engineering and Architecture, Graduate School of Environmental Studies, Nagoya University, Japan Email: [email protected] 4 School of Systems Engineering, Kochi University of Technology, Japan Email: [email protected] *Corresponding Author
2
ABSTRACT Personal mobility vehicles (PMVs) are gaining popularity as an eco-friendly transport mode for short-distance trips in urban environments. These vehicles can provide numerous economic, environmental, and social benefits and are likely to become more common in urban spaces in the near future. Before permitting them in shared environments, the impacts of the PMVs on the other users of the shared space should be properly evaluated, particularly from a safety perspective. This study focuses on pedestrians’ danger perception toward PMVs interacting with them in shared spaces. To estimate the perceived danger, a model was developed. The developed model is inspired by the social-force concept, and it estimates a safety index called subjective danger index (SDI). The model is then calibrated with data collected through controlled laboratory experiments. The experiments revealed two important features of the pedestrians’ subjective danger perception against PMVs. First, the pedestrians' sensitivity to the distance between a PMV and them is higher when the PMV is in front of them compared to when it is behind them. Secondly, pedestrians perceive a PMV in front of them as more dangerous compared to a PMV behind them when they are near the PMV, although they perceive higher danger when a PMV is approaching from behind them compared to when a PMV is approaching from the front of them when they are relatively far from the PMV. The calibration results demonstrate that the enhanced model can accurately capture such trends and therefore the perception of danger. A case study that uses experimental trajectory data from a PMV–pedestrian interaction situation is also presented to clarify potential applications, characteristics, and limitations of the calibrated SDI model. Keywords: Pedestrians; Danger perception model; Subjective safety measurement; Personal mobility vehicles; Shared space users 1. Introduction As the requirement for sustainable transportation is growing, particularly in the city centers of developed countries, many technologically advanced personal mobility vehicle (PMV) types have been developed and released to the public by different manufacturers over the last decade (e.g., Segway, Toyota winglet, Honda UNI-CUB, Robstep, Ninebot, Hyundai E4U, Whill PEV, and DTV Shredder). Although there are several definitions for PMVs, this study uses the definition that PMVs are motorized compact vehicles for one passenger, e.g., electric personal assistive mobility devices (EPAMDs). However, PMVs are a wider concept than EPAMDs, and PMVs include self-balancing devices with two wheels such as Segway as well as other moving mechanism vehicles. Emerging as a highly advanced transportation mode, PMVs can provide numerous economic, environmental, and social benefits such as reducing congestion in urban centers, reducing noxious emissions, and providing a means of transport for people with impaired mobility (e.g., elderly and disabled pedestrians) (Ulrich, 2005). Liu & Parthasarathy (2003) explained that if a small portion of the short trips made by vehicles in urban environments can be replaced by Segway trips, a considerable amount of vehicle miles traveled (VMT) can be removed from the roads, thereby substantially reducing congestion and
3
pollutant emissions. Shaheen & Finson (2003) studied the feasibility of the shared use of Segway as a connectivity device for improving the accessibility to transit stations, thus increasing public transport ridership, reducing the number of single-occupancy vehicles, and decreasing congestion and air pollution in urban environments. Sawatzky et al. (2007) explored the usability of Segway as an alternative mobility device for people with disabilities. In addition to such tremendous benefits, the public acceptability or attitude toward the use of PMVs is also positive (Ando & Li, 2012). Thus, PMVs are likely to become more common in urban spaces in the near future.
PMVs are more stable than bicycles and scooters at lower speeds. However, it is not practical to provide a separate space (e.g., separate lanes) for such vehicles. Thus, the feasibility of permitting PMVs in the existing infrastructure for vehicles, bicycles, or pedestrians should be examined (Landis et al. 2004, Litman, 2006). With certain restrictions and requirements, PMVs are permitted on sidewalks or roads in numerous cities in Europe and the United States (Litman, 2006). Meanwhile, Japan and other Asian countries currently have a few legal restrictions for riding PMVs in all public spaces apart from certain areas such as airports and large parks with special permission. PMVs do not satisfy the standards of current safety regulations for conventional vehicles as they incorporate alternative control mechanisms such as self-balancing and inverted pendulum type control. Nevertheless, discussions and proposals are underway to amend policies and legislations to permit PMVs on sidewalks in Asian cities, where pedestrian and cyclist demand is relatively high, as a versatile and eco-friendly alternative transport mode (Hashimoto et al. 2015). Before permitting PMVs in shared environments, it is important to understand their impacts on other shared space users (e.g., drivers, cyclists, and pedestrians), particularly from a safety perspective. Although the impacts of PMVs toward all types of shared space users need to be examined, this research focuses on the impacts on pedestrians because pedestrians are the most vulnerable road users.
The safety of shared space users can be mainly classified into two categories: objective or physical safety and subjective or psychological safety. The major focus is on the objective safety, such as prevention and mitigation of accidents. Previous studies on objective safety have focused on operational or performance (Landis et al. 2004, Litman, 2006), behavioral (Miller et al. 2008), and accident analytical (Boniface et al. 2011, Roider et al. 2016) aspects. However, considering the acceptability of new types of vehicles such as PMVs on shared spaces, conventional concepts for objective safety are necessary albeit inadequate to estimate safety. Thus, subjective safety measurement concepts should be explored because of the following three reasons: First, unlike lane-based vehicular traffic, PMVs and other shared space users are anticipated to interact in two-dimension space such as on sidewalks. In such situations, it is challenging to construct objective and straightforward safety indexes such as time-to-collision (TTC). Subjective safety measures can overcome the limitations of objective safety measures, particularly when those are applied to pedestrian traffic, and estimate the preferable safe or dangerous situation by combining objective and subjective safety indexes (A in Table 1). Secondly, the gap between objective and subjective safety is likely to cause the hazardous situations. If shared space users notice danger from PMVs (subjective danger), they can prepare for evading accidents. In contrast, they are unlikely to evade accidents if they are not aware of the danger approaching them (subjective safe and objective dangerous situation, i.e., B in Table 1). That is, objective safety can detect only situations B and D in Table 1
4
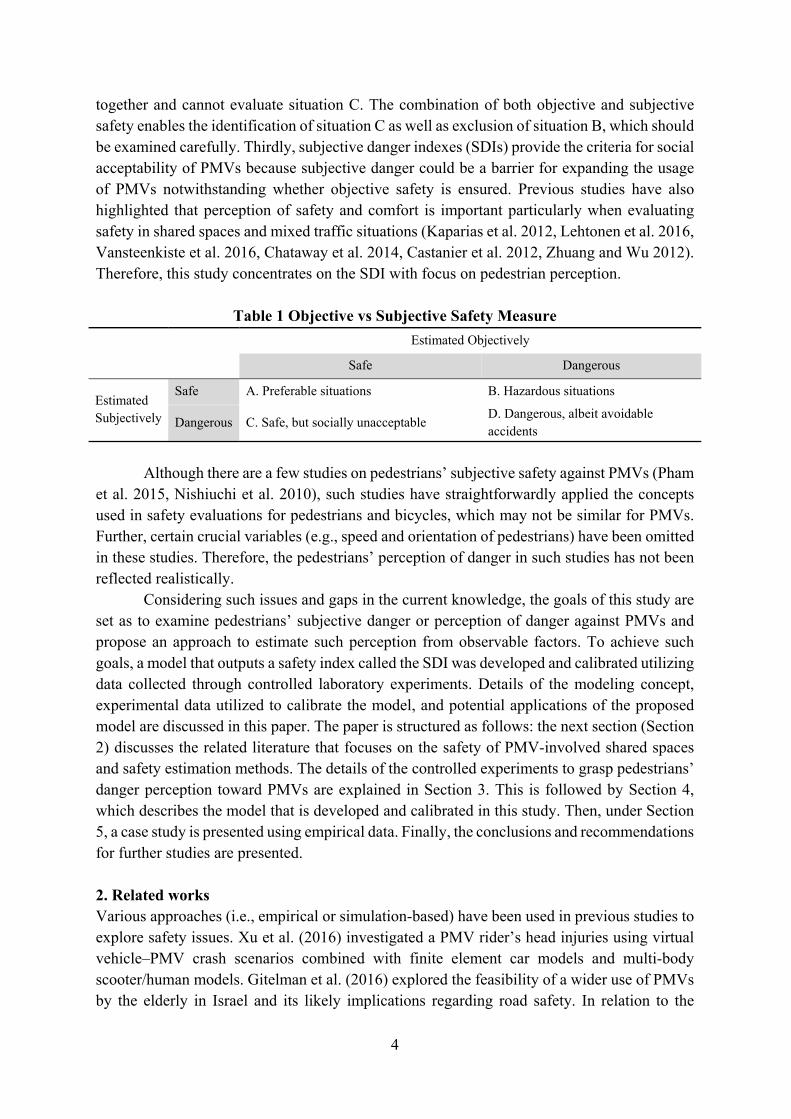
together and cannot evaluate situation C. The combination of both objective and subjective safety enables the identification of situation C as well as exclusion of situation B, which should be examined carefully. Thirdly, subjective danger indexes (SDIs) provide the criteria for social acceptability of PMVs because subjective danger could be a barrier for expanding the usage of PMVs notwithstanding whether objective safety is ensured. Previous studies have also highlighted that perception of safety and comfort is important particularly when evaluating safety in shared spaces and mixed traffic situations (Kaparias et al. 2012, Lehtonen et al. 2016, Vansteenkiste et al. 2016, Chataway et al. 2014, Castanier et al. 2012, Zhuang and Wu 2012). Therefore, this study concentrates on the SDI with focus on pedestrian perception.
Table 1 Objective vs Subjective Safety Measure
Estimated Objectively
Safe Dangerous
Estimated Subjectively
Safe A. Preferable situations B. Hazardous situations
Dangerous C. Safe, but socially unacceptable D. Dangerous, albeit avoidable accidents
Although there are a few studies on pedestrians’ subjective safety against PMVs (Pham
et al. 2015, Nishiuchi et al. 2010), such studies have straightforwardly applied the concepts used in safety evaluations for pedestrians and bicycles, which may not be similar for PMVs. Further, certain crucial variables (e.g., speed and orientation of pedestrians) have been omitted in these studies. Therefore, the pedestrians’ perception of danger in such studies has not been reflected realistically.
Considering such issues and gaps in the current knowledge, the goals of this study are set as to examine pedestrians’ subjective danger or perception of danger against PMVs and propose an approach to estimate such perception from observable factors. To achieve such goals, a model that outputs a safety index called the SDI was developed and calibrated utilizing data collected through controlled laboratory experiments. Details of the modeling concept, experimental data utilized to calibrate the model, and potential applications of the proposed model are discussed in this paper. The paper is structured as follows: the next section (Section 2) discusses the related literature that focuses on the safety of PMV-involved shared spaces and safety estimation methods. The details of the controlled experiments to grasp pedestrians’ danger perception toward PMVs are explained in Section 3. This is followed by Section 4, which describes the model that is developed and calibrated in this study. Then, under Section 5, a case study is presented using empirical data. Finally, the conclusions and recommendations for further studies are presented. 2. Related works Various approaches (i.e., empirical or simulation-based) have been used in previous studies to explore safety issues. Xu et al. (2016) investigated a PMV rider’s head injuries using virtual vehicle–PMV crash scenarios combined with finite element car models and multi-body scooter/human models. Gitelman et al. (2016) explored the feasibility of a wider use of PMVs by the elderly in Israel and its likely implications regarding road safety. In relation to the
5
interaction between pedestrians and PMVs, Pham et al. (2015) applied the concepts of personal space, which considers the psychological influence of the spatial position of an individual, in an analysis of PMV behaviors. This study also reported that pedestrians feel uncomfortable when the pedestrian density and speed of PMVs become high. Nishiuchi et al. (2010) conducted experiments in which a PMV runs approaching the participants, and the pedestrians evaded the PMV when they perceived it as dangerous. They calculated functions of the safety distance between pedestrians and PMVs using probability ellipse concepts. Dias et al. (2017a) utilized a social-force-based microscopic simulation model, which was modified and calibrated for use with Segway and pedestrian mixed traffic (Dias et al. 2017b), to evaluate the safe avoidance of pedestrians walking at different speeds when confronting an approaching PMV at different speeds. Additionally, Litman (2006) reported on the conditions for PMV use in non-motorized facilities and listed their legal and legislative status in 12 states and five major cities in the US. The conditions for PMV use on sidewalks, including age limit and helmet requirements, which vary according to the state, are discussed in that study.
Previous studies explored numerous types of risk indicators for road traffic, cyclists, and pedestrians. There are numerous objective indices for estimating the driver’s risk, such as the time-to-collision (TTC), performance index for approach and alienation (KdB), time-headway (THW), and risk feeling (RF) (Kitajima et al. 2009). Ito et al. (2011) evaluated the safety of low-speed vehicle driving in pedestrian spaces from the pedestrians’ perspective and proposed a risk evaluation index called the ellipse mapped relative risk (EMRR) based on TTC and harm-of-collision concepts. On the other hand, there are relatively limited studies of subjective indices for risk estimation. Li et al. (2013) applied the subjective workload indices of drivers, such as the coefficient of variation of r-r intervals (CVRR), focus time (FT), and NASA task load index (NASA-TLX) (Sun & Yang, 2008), to the subjective safety index and compared them to the objective safety index on an expressway. Nakagawa et al. (2012a) proposed a simulation model to evaluate the affinity level between PMVs and pedestrians. Carter et al. (2006) developed macrolevel pedestrian and bicycle intersection safety indices (Ped ISI and Bike ISI) using empirical data. Sayed et al. (2013) provided an automated safety diagnosis approach for evaluating vehicle–bicycle conflicts, using video analysis and TTC concepts.
The focus of this study is to evaluate and model the subjective safety perception of pedestrians toward PMVs. Details of the controlled experiments conducted to collect data and the proposed modeling concept are discussed in the following sections. 3. Experiments 3.1 Experiment Design and Scenarios A series of controlled experiments were conducted to gain insights into the trend of pedestrians’ perception and subjective feelings (i.e., danger and comfort) toward PMVs. The data collected from this experiment were also used for model estimation as described in Section 4. The experiment was conducted at the Institute of Industrial Science of the University of Tokyo on several weekdays in February and March 2017. The number of participants, who played the role of pedestrians, was 32 (23 males and nine females). They were mainly undergraduate or graduate students, and their age ranged from approximately 19 to 26 years. In addition to the experiment participants, four experienced PMV riders were also hired.
6
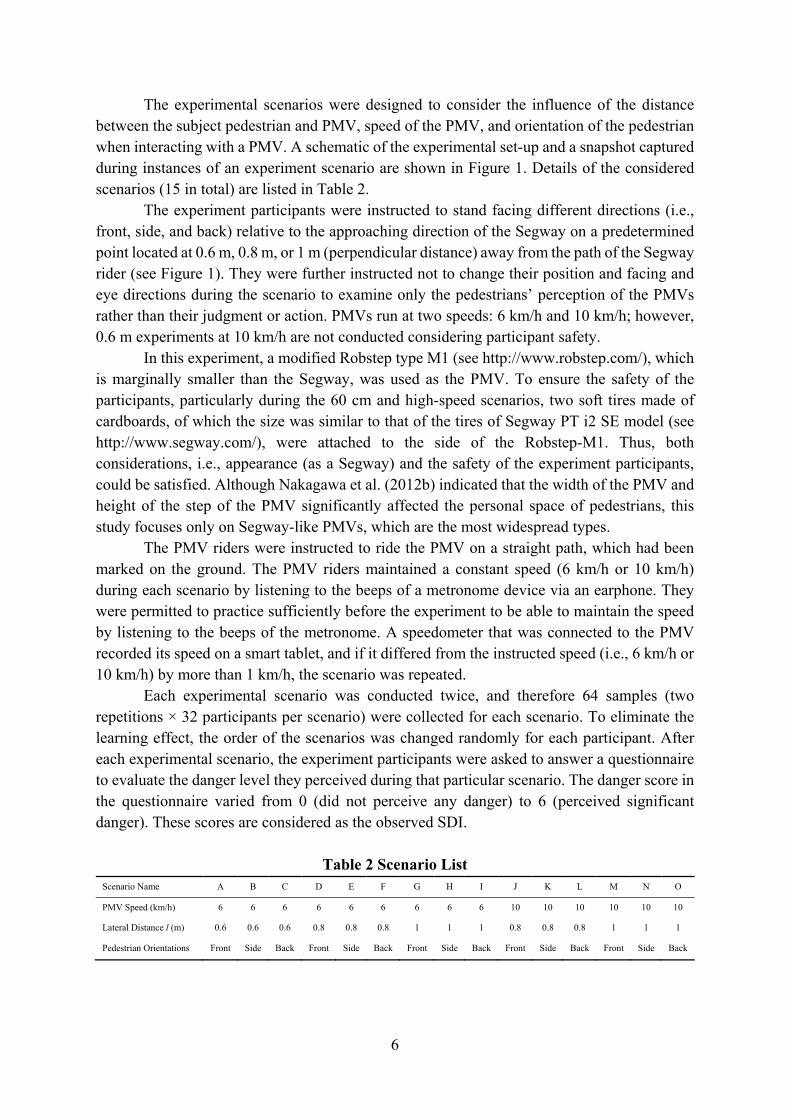
The experimental scenarios were designed to consider the influence of the distance between the subject pedestrian and PMV, speed of the PMV, and orientation of the pedestrian when interacting with a PMV. A schematic of the experimental set-up and a snapshot captured during instances of an experiment scenario are shown in Figure 1. Details of the considered scenarios (15 in total) are listed in Table 2.
The experiment participants were instructed to stand facing different directions (i.e., front, side, and back) relative to the approaching direction of the Segway on a predetermined point located at 0.6 m, 0.8 m, or 1 m (perpendicular distance) away from the path of the Segway rider (see Figure 1). They were further instructed not to change their position and facing and eye directions during the scenario to examine only the pedestrians’ perception of the PMVs rather than their judgment or action. PMVs run at two speeds: 6 km/h and 10 km/h; however, 0.6 m experiments at 10 km/h are not conducted considering participant safety.
In this experiment, a modified Robstep type M1 (see http://www.robstep.com/), which is marginally smaller than the Segway, was used as the PMV. To ensure the safety of the participants, particularly during the 60 cm and high-speed scenarios, two soft tires made of cardboards, of which the size was similar to that of the tires of Segway PT i2 SE model (see http://www.segway.com/), were attached to the side of the Robstep-M1. Thus, both considerations, i.e., appearance (as a Segway) and the safety of the experiment participants, could be satisfied. Although Nakagawa et al. (2012b) indicated that the width of the PMV and height of the step of the PMV significantly affected the personal space of pedestrians, this study focuses only on Segway-like PMVs, which are the most widespread types.
The PMV riders were instructed to ride the PMV on a straight path, which had been marked on the ground. The PMV riders maintained a constant speed (6 km/h or 10 km/h) during each scenario by listening to the beeps of a metronome device via an earphone. They were permitted to practice sufficiently before the experiment to be able to maintain the speed by listening to the beeps of the metronome. A speedometer that was connected to the PMV recorded its speed on a smart tablet, and if it differed from the instructed speed (i.e., 6 km/h or 10 km/h) by more than 1 km/h, the scenario was repeated.
Each experimental scenario was conducted twice, and therefore 64 samples (two repetitions × 32 participants per scenario) were collected for each scenario. To eliminate the learning effect, the order of the scenarios was changed randomly for each participant. After each experimental scenario, the experiment participants were asked to answer a questionnaire to evaluate the danger level they perceived during that particular scenario. The danger score in the questionnaire varied from 0 (did not perceive any danger) to 6 (perceived significant danger). These scores are considered as the observed SDI.
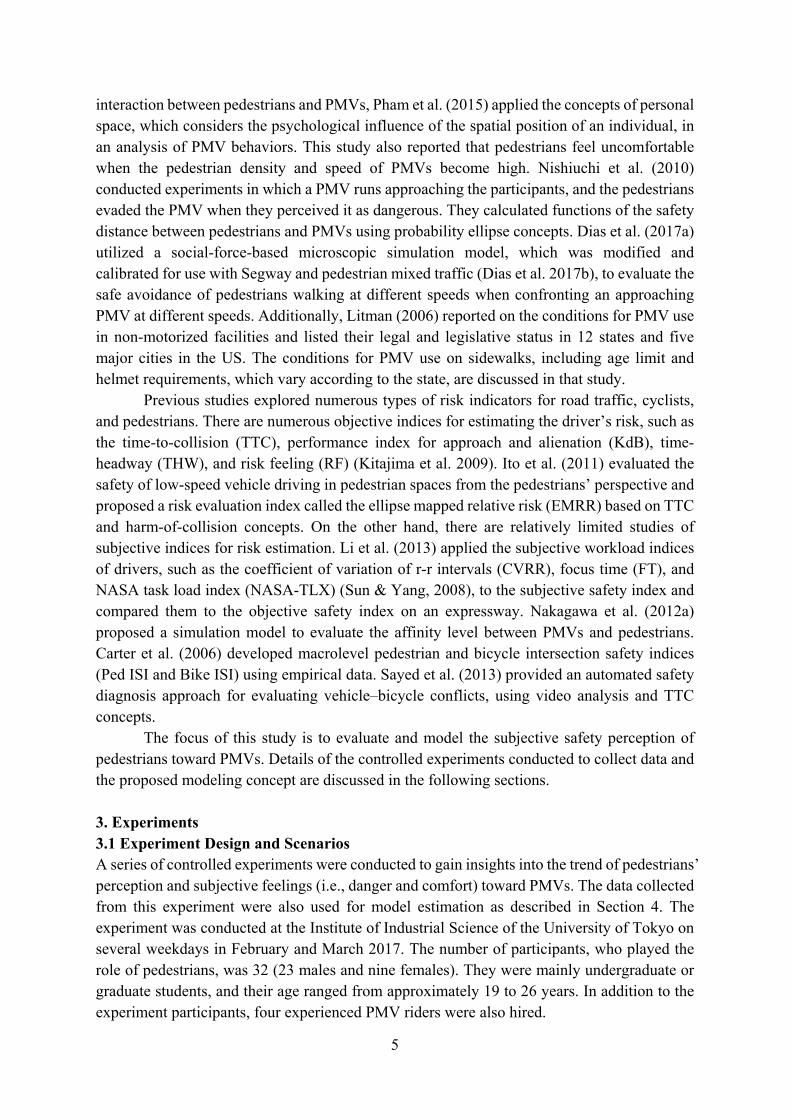
Table 2 Scenario List Scenario Name A B C D E F G H I J K L M N O
PMV Speed (km/h) 6 6 6 6 6 6 6 6 6 10 10 10 10 10 10
Lateral Distance l (m) 0.6 0.6 0.6 0.8 0.8 0.8 1 1 1 0.8 0.8 0.8 1 1 1
Pedestrian Orientations Front Side Back Front Side Back Front Side Back Front Side Back Front Side Back
7
Fig. 1. Explanation of scenario components and snapshots during experiments: (a)
Lateral distance between pedestrians and PMVs; (b) Pedestrians’ orientations; (c) A snapshot during a “front” scenario; (d) A snapshot during a “back” scenario.
3.2 Experimental Results and Data
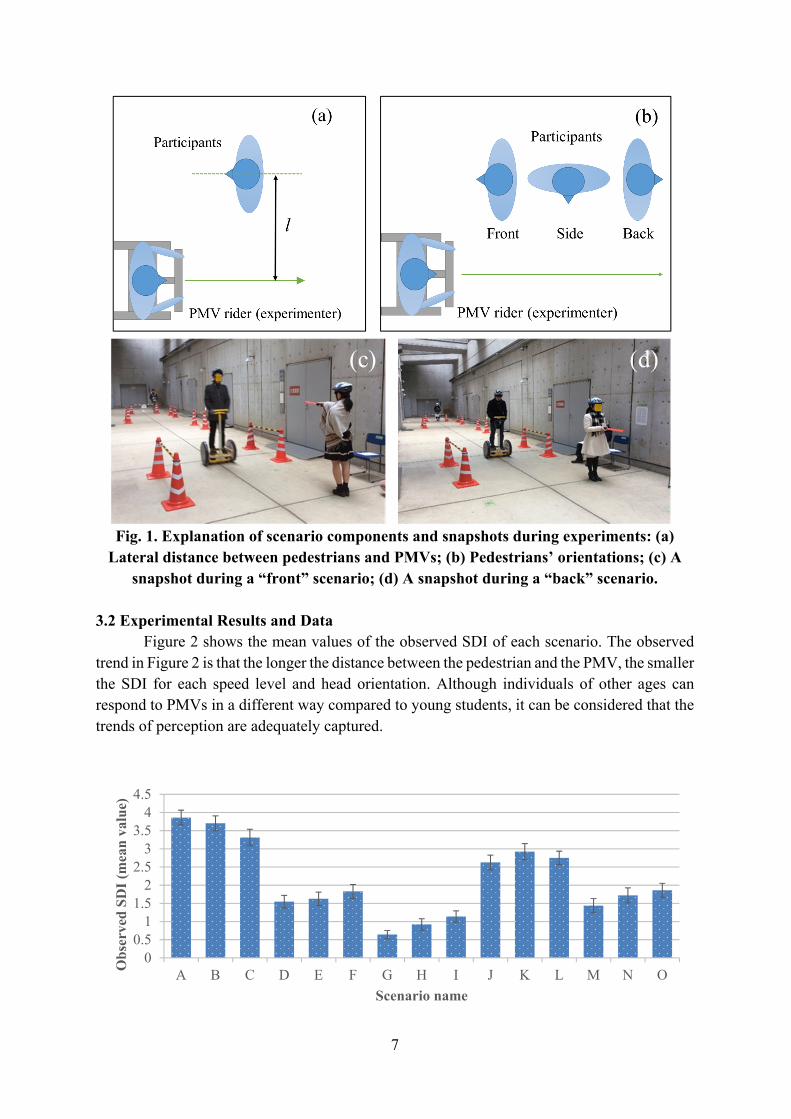
Figure 2 shows the mean values of the observed SDI of each scenario. The observed trend in Figure 2 is that the longer the distance between the pedestrian and the PMV, the smaller the SDI for each speed level and head orientation. Although individuals of other ages can respond to PMVs in a different way compared to young students, it can be considered that the trends of perception are adequately captured.
00.5
11.5
22.5
33.5
44.5
A B C D E F G H I J K L M N O
Ob
serv
ed S
DI
(mea
n v
alu
e)
Scenario name
8
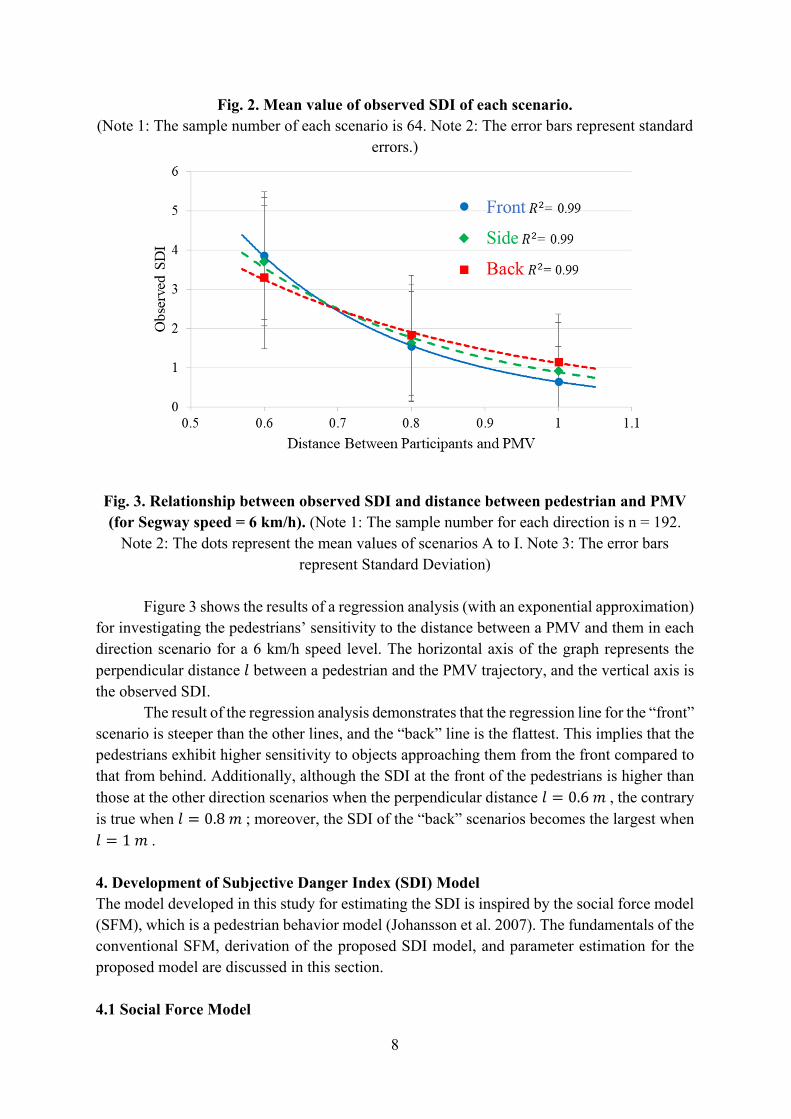
Fig. 2. Mean value of observed SDI of each scenario. (Note 1: The sample number of each scenario is 64. Note 2: The error bars represent standard
errors.)
Fig. 3. Relationship between observed SDI and distance between pedestrian and PMV (for Segway speed = 6 km/h). (Note 1: The sample number for each direction is n = 192.
Note 2: The dots represent the mean values of scenarios A to I. Note 3: The error bars represent Standard Deviation)
Figure 3 shows the results of a regression analysis (with an exponential approximation)
for investigating the pedestrians’ sensitivity to the distance between a PMV and them in each direction scenario for a 6 km/h speed level. The horizontal axis of the graph represents the perpendicular distance 𝑙 between a pedestrian and the PMV trajectory, and the vertical axis is the observed SDI.
The result of the regression analysis demonstrates that the regression line for the “front” scenario is steeper than the other lines, and the “back” line is the flattest. This implies that the pedestrians exhibit higher sensitivity to objects approaching them from the front compared to that from behind. Additionally, although the SDI at the front of the pedestrians is higher than those at the other direction scenarios when the perpendicular distance 𝑙 0.6 𝑚 , the contrary is true when 𝑙 0.8 𝑚 ; moreover, the SDI of the “back” scenarios becomes the largest when 𝑙 1 𝑚 . 4. Development of Subjective Danger Index (SDI) Model The model developed in this study for estimating the SDI is inspired by the social force model (SFM), which is a pedestrian behavior model (Johansson et al. 2007). The fundamentals of the conventional SFM, derivation of the proposed SDI model, and parameter estimation for the proposed model are discussed in this section. 4.1 Social Force Model
9
The SFM assumes that the pedestrians are subjected to physical and psychological forces. Thus, the acceleration (or deceleration) of individual 𝑖 at time 𝑡 owing to those forces can be described as follows:
𝑑�� 𝑡
𝑑𝑡
1𝜏
𝑣 𝑒 �� 𝑓 𝑡 𝑓 𝑡 𝜉 𝑡 (1)
The desired force component (the first term in the right-hand side of Equation 1) of the
SFM describes that each individual moves in the desired direction 𝑒 with a desired speed 𝑣 and that it adapts the actual velocity �� to the desired one within a certain time duration, which
is characterized by the relaxation time 𝜏 . The terms 𝑓 𝑡 and 𝑓 𝑡 represent the repulsive
forces, describing the attempts to maintain a certain distance from the surrounding pedestrians
𝑗 and obstacles 𝑙. The term 𝜉 𝑡 represents the fluctuations caused by the randomness.
The term 𝑓 𝑡 in Equation 1 explains the psychological force acting on a particular
pedestrian from the surrounding pedestrians, which causes individuals to evade other pedestrians. If it can be assumed that individual 𝑖 changes his/her trajectory to prevent dangerous or uncomfortable situations, this term can be considered as a representative index
for the level of danger or discomfort. Thus, in this study, the component 𝑓 𝑡 is modified to
obtain an index for subjective danger.
In conventional SFM formulation, 𝑓 𝑡 is described as a product of two independent
terms as
𝑓 𝑡 �� 𝑑 𝑡 , �� 𝑡 , 𝑏 𝑡 𝑤 𝜑 𝑡 , 𝜆 , (2)
where �� describes the distance and relative velocity effect (expanded in Equation 3) and 𝑤 is
the anisotropy effect (expanded in equation (5)).
�� 𝑑 𝑡 , 𝑏 𝑡 , �� 𝑡 𝐴 𝑒𝑥𝑝 .
.
, (3)
where 𝐴 and 𝐵 are constants, which reflect the strength of the interaction intensity and the
range, respectively; 𝑑 𝑡 𝑟 𝑡 𝑟 𝑡 is the distance vector pointing from individual 𝑗 to
𝑖 ; 𝑟 𝑡 and 𝑟 𝑡 are the location vectors of individuals 𝑖 and 𝑗 , respectively; �� 𝑡
�� t �� t Δt represents the anticipation distance considering the relative speed between
individuals 𝑖 and 𝑗 ; �� t and �� t are the velocities of individuals 𝑖 and 𝑗, respectively; Δt is the anticipation time.
Additionally, 𝑏 𝑡 represents the semi-minor axis of the ellipse-shaped potential of
individual 𝑗 to 𝑖, determined as
2𝑏 𝑡 𝑑 𝑡 𝑑 𝑡 𝑦 t 𝑦 t . (4)
10
Equations (3) and (4) explain that the repulsive force is derived from an ellipse-shaped
potential with the semi-major axis in the movement direction of individual 𝑗. The anisotropy effect term 𝑤 in Equation (2) is determined as
𝑤 𝜑 𝑡 𝜆 1 𝜆
, (5)
where 𝜑 𝑡 0 𝜑 𝜋 represents the angle between the inverse of the distance vector
𝑑 𝑡 and a desired direction 𝑒 and 𝜆 is a parameter that represents the intensity of the
anisotropy effect. 4.2 Deriving the SDI Model The conventional SFM described in Section 4.1 explains that parameter 𝐵 in equation (3), which represents a range of effects between the pedestrians, is a constant. Further, the anisotropy effect (Equation 5) is independent of the distance and relative velocity effect. Such a formulation cannot explain the trend of pedestrians’ SDI observed in data collected from experiments as discussed in Section 3.2 mainly because of the following reasons:
(a) First, the constant 𝐵 implies that a pedestrian can perceive the distance between him/her and a PMV with identical sensitivity regardless of the approaching direction of the PMV. However, actual pedestrians exhibit high sensitivity for the perception of distance in front of them and low sensitivity for the distance behind them, as explained by the results of the experiments. Additionally, pedestrians can perceive the presence of objects in front of them by both their visual and auditory senses, whereas, they must depend only on the auditory sense to recognize objects behind them. This implies that although both the visual and auditory senses can gather significant information from the front of the pedestrians, the resolution becomes lower when the information is gathered from behind. Such characteristics of the pedestrians’ perception indicate that their sensitivity to distance is changed when the interaction angle 𝜑 𝑡 is changed.
(b) Second, the independent anisotropy term implies that a pedestrian always receives a higher effect from PMVs approaching from the front of them than from PMVs approaching from behind them, regardless of the distance between them. However, the effect of the angle exhibits a certain relationship with the distance, as explained by the results of the experiments. The assumption that the reaction of the pedestrians to what occurs in front of them is significantly stronger than to what occurs behind may be appropriate in pedestrian behavior models, which determine the trajectory of a forward moving pedestrian from the location and velocity information of that pedestrian and surrounding pedestrians. However, the most significant difference between pedestrians and PMVs, concerning the perception of the others, is the sound. While pedestrians do not produce any sound while they walk, PMVs produce considerable noise when they run. It is a well-known fact that the noise of a vehicle can play an important role as pedestrians can recognize the
11
approach of the vehicle from the noise. It can be considered that this applies to PMVs as well. Therefore, the PMVs’ effect (i.e., the psychological force) on the pedestrians cannot be always higher when the PMV is approaching in front of them than from behind them, for an identical distance between them, as the conventional model describes.
Considering points (a) and (b) above, the interaction force component of the conventional SFM was modified to obtain a new model to estimate the instantaneous SDI(t), as follows:
𝑆𝐷𝐼 𝑡 𝐴 𝜑 𝑡 𝑒𝑥𝑝𝑏
𝐵 𝜑 𝑡 (6)
Note that the anisotropy effect term is eliminated, and the strength of the intention
parameter 𝐴 and interaction range parameter 𝐵 , which were constant values in the conventional SFM, are now modified as functions of 𝜑 . The function 𝐵 𝜑 can explain the
pedestrians' sensitivity to the distance between them and PMV as the angle 𝜑 changes and
therefore, can solve (a). Additionally, the elimination of the anisotropy term and the addition of the modified functions for 𝐴 𝜑 and 𝐵 𝜑 explain that the anisotropy effect is actually
dependent on the distance and relative velocity terms. Therefore, such modifications can solve (b).
Now, 𝐵 𝜑 is a function of 𝜑 and can express the differences in pedestrians’
sensitivity to a PMV traversing at a relatively far distance from them, and 𝐴 𝜑 can be
regarded as an index that represents the effect of a PMV near the pedestrian. Therefore, a monotonically decreasing function of 𝜑 is suitable for 𝐴 𝜑 , which can be formulated as
𝐴 𝜑 𝐶 𝜆 cos 𝜑 𝜆 0 , (7)
where 𝐶 and 𝜆 are parameters to be estimated.
𝐵 𝜑 should be able to explain the pedestrians’ high sensitivity to a PMV in front of
them compared to a PMV behind them, to resolve Point 1. Therefore, 𝐵 𝜑 should be a
monotonically increasing function of 𝜑 , which can be formulated as
𝐵 𝜑 𝐶 𝜆 cos 𝜑 (𝜆 0 , (8)
where 𝐶 and 𝜆 are parameters to be estimated. Additionally, the estimated SDI is defined as the maximum value of the instantaneous
SDI(t) shown in Equation (6), assuming the situation in which only one PMV reaches a pedestrian. This SDI model outputs a value equal to the observed SDI, which will be zero when the pedestrian does not perceive any danger in the scenario and six when he/she experiences the maximum danger.
𝑆𝐷𝐼 max‖𝑆𝐷𝐼 𝑡 ‖ (9)
12
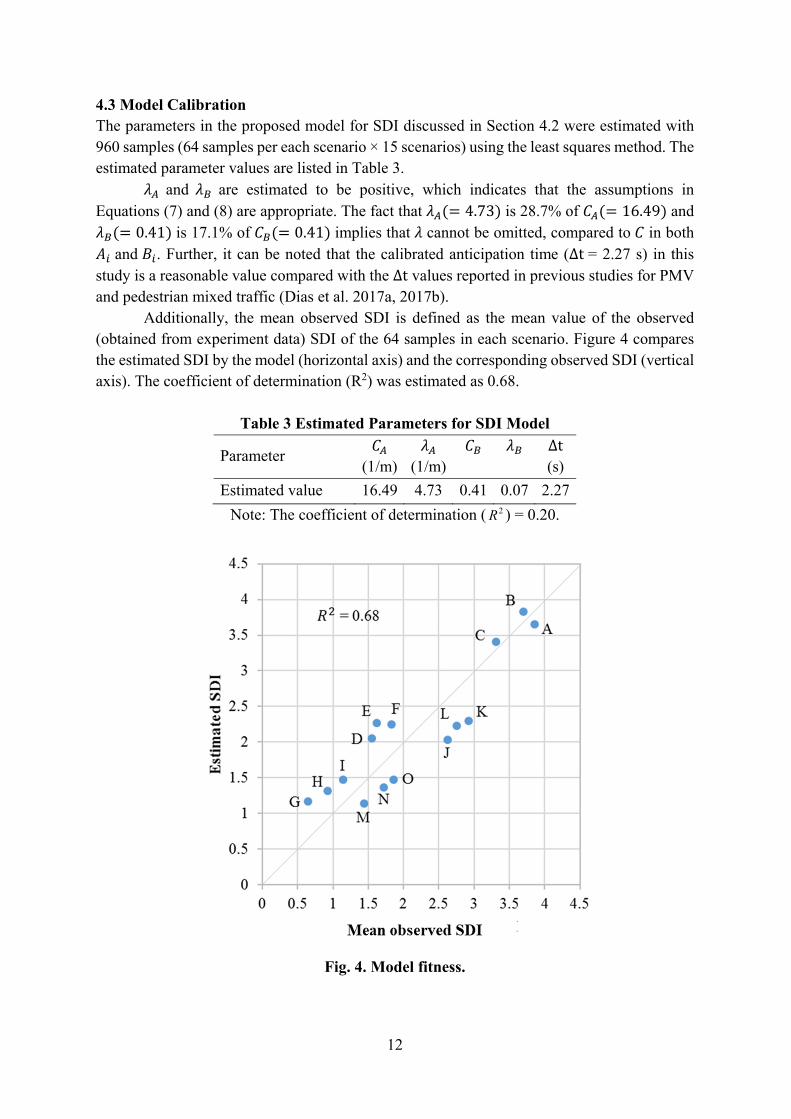
4.3 Model Calibration The parameters in the proposed model for SDI discussed in Section 4.2 were estimated with 960 samples (64 samples per each scenario × 15 scenarios) using the least squares method. The estimated parameter values are listed in Table 3.
𝜆 and 𝜆 are estimated to be positive, which indicates that the assumptions in Equations (7) and (8) are appropriate. The fact that 𝜆 4.73 is 28.7% of 𝐶 16.49 and 𝜆 0.41 is 17.1% of 𝐶 0.41 implies that 𝜆 cannot be omitted, compared to 𝐶 in both 𝐴 and 𝐵 . Further, it can be noted that the calibrated anticipation time (Δt = 2.27 s) in this study is a reasonable value compared with the Δt values reported in previous studies for PMV and pedestrian mixed traffic (Dias et al. 2017a, 2017b).
Additionally, the mean observed SDI is defined as the mean value of the observed (obtained from experiment data) SDI of the 64 samples in each scenario. Figure 4 compares the estimated SDI by the model (horizontal axis) and the corresponding observed SDI (vertical axis). The coefficient of determination (R2) was estimated as 0.68.
Table 3 Estimated Parameters for SDI Model
Parameter 𝐶
(1/m) 𝜆
(1/m) 𝐶 𝜆 Δt
(s)
Estimated value 16.49 4.73 0.41 0.07 2.27
Note: The coefficient of determination ( 2R ) = 0.20.
Fig. 4. Model fitness.
13
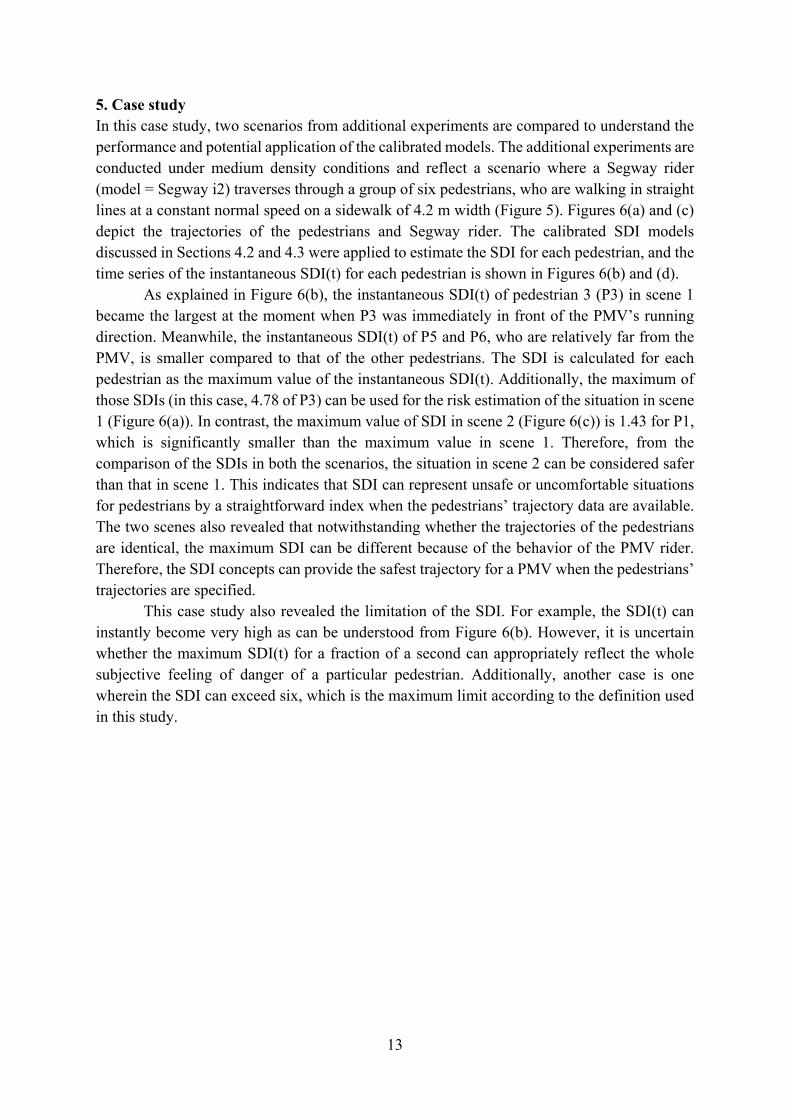
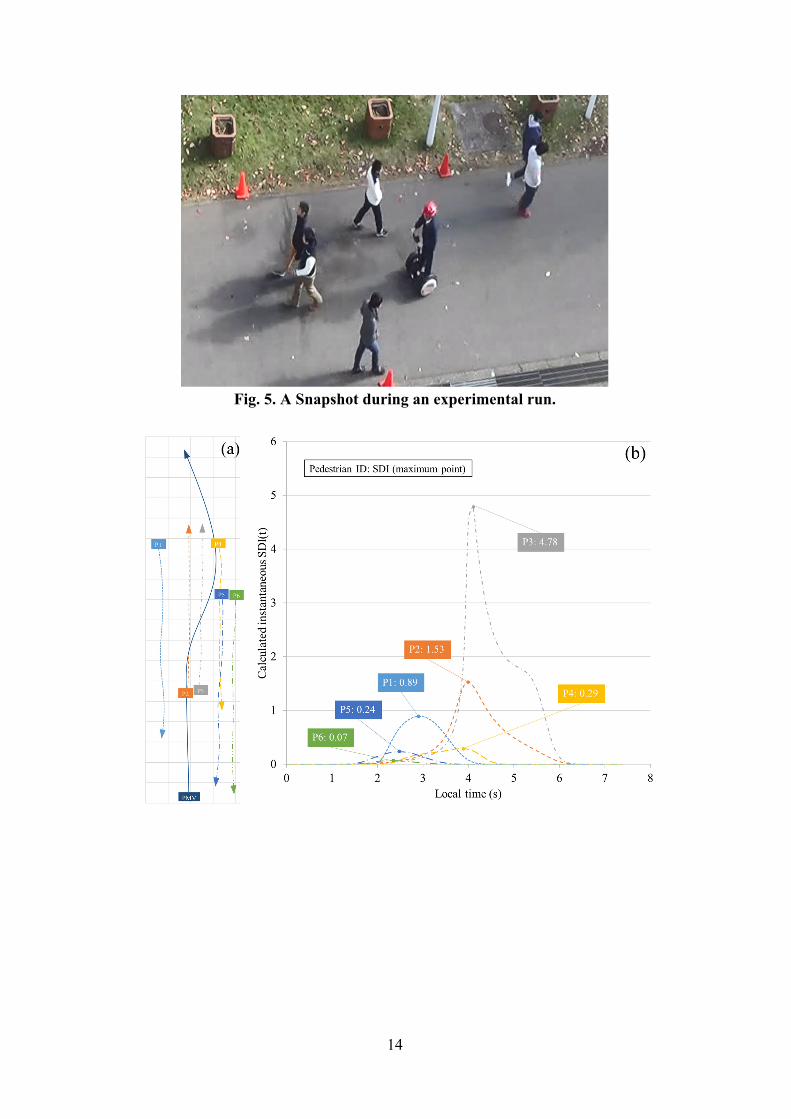
5. Case study In this case study, two scenarios from additional experiments are compared to understand the performance and potential application of the calibrated models. The additional experiments are conducted under medium density conditions and reflect a scenario where a Segway rider (model = Segway i2) traverses through a group of six pedestrians, who are walking in straight lines at a constant normal speed on a sidewalk of 4.2 m width (Figure 5). Figures 6(a) and (c) depict the trajectories of the pedestrians and Segway rider. The calibrated SDI models discussed in Sections 4.2 and 4.3 were applied to estimate the SDI for each pedestrian, and the time series of the instantaneous SDI(t) for each pedestrian is shown in Figures 6(b) and (d).
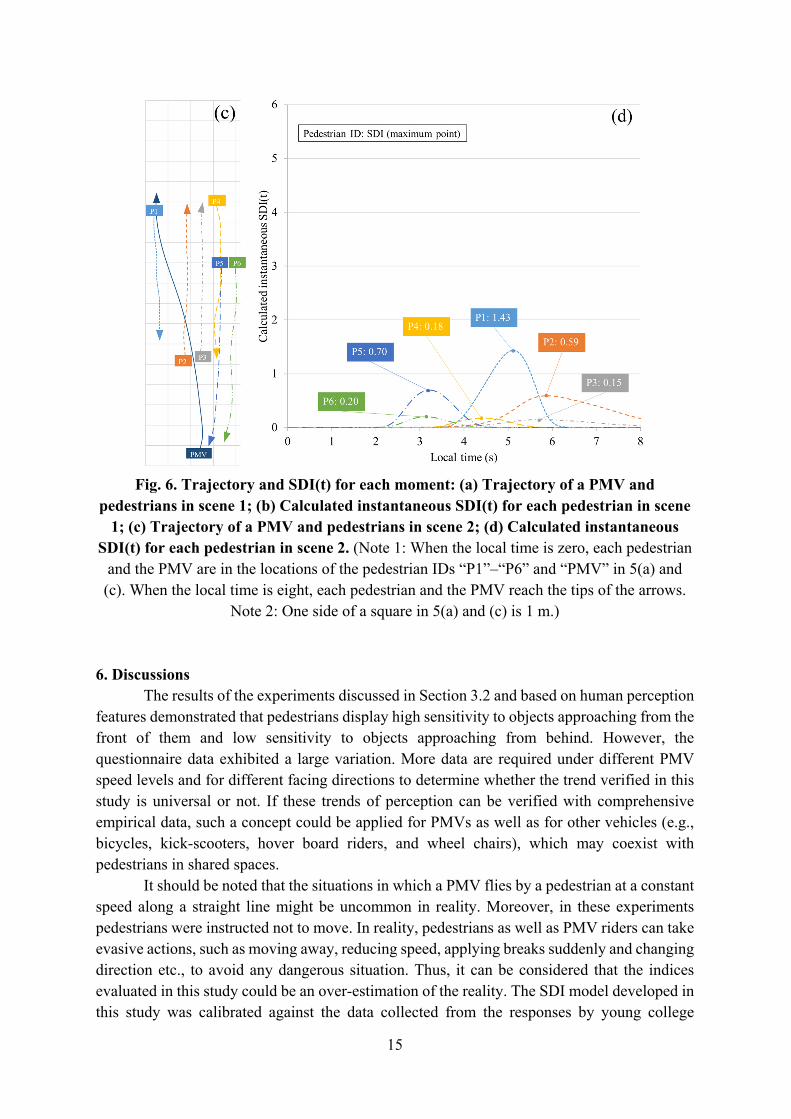
As explained in Figure 6(b), the instantaneous SDI(t) of pedestrian 3 (P3) in scene 1 became the largest at the moment when P3 was immediately in front of the PMV’s running direction. Meanwhile, the instantaneous SDI(t) of P5 and P6, who are relatively far from the PMV, is smaller compared to that of the other pedestrians. The SDI is calculated for each pedestrian as the maximum value of the instantaneous SDI(t). Additionally, the maximum of those SDIs (in this case, 4.78 of P3) can be used for the risk estimation of the situation in scene 1 (Figure 6(a)). In contrast, the maximum value of SDI in scene 2 (Figure 6(c)) is 1.43 for P1, which is significantly smaller than the maximum value in scene 1. Therefore, from the comparison of the SDIs in both the scenarios, the situation in scene 2 can be considered safer than that in scene 1. This indicates that SDI can represent unsafe or uncomfortable situations for pedestrians by a straightforward index when the pedestrians’ trajectory data are available. The two scenes also revealed that notwithstanding whether the trajectories of the pedestrians are identical, the maximum SDI can be different because of the behavior of the PMV rider. Therefore, the SDI concepts can provide the safest trajectory for a PMV when the pedestrians’ trajectories are specified.
This case study also revealed the limitation of the SDI. For example, the SDI(t) can instantly become very high as can be understood from Figure 6(b). However, it is uncertain whether the maximum SDI(t) for a fraction of a second can appropriately reflect the whole subjective feeling of danger of a particular pedestrian. Additionally, another case is one wherein the SDI can exceed six, which is the maximum limit according to the definition used in this study.
14
Fig. 5. A Snapshot during an experimental run.
15
Fig. 6. Trajectory and SDI(t) for each moment: (a) Trajectory of a PMV and
pedestrians in scene 1; (b) Calculated instantaneous SDI(t) for each pedestrian in scene 1; (c) Trajectory of a PMV and pedestrians in scene 2; (d) Calculated instantaneous
SDI(t) for each pedestrian in scene 2. (Note 1: When the local time is zero, each pedestrian and the PMV are in the locations of the pedestrian IDs “P1”–“P6” and “PMV” in 5(a) and (c). When the local time is eight, each pedestrian and the PMV reach the tips of the arrows.
Note 2: One side of a square in 5(a) and (c) is 1 m.)
6. Discussions
The results of the experiments discussed in Section 3.2 and based on human perception features demonstrated that pedestrians display high sensitivity to objects approaching from the front of them and low sensitivity to objects approaching from behind. However, the questionnaire data exhibited a large variation. More data are required under different PMV speed levels and for different facing directions to determine whether the trend verified in this study is universal or not. If these trends of perception can be verified with comprehensive empirical data, such a concept could be applied for PMVs as well as for other vehicles (e.g., bicycles, kick-scooters, hover board riders, and wheel chairs), which may coexist with pedestrians in shared spaces.
It should be noted that the situations in which a PMV flies by a pedestrian at a constant speed along a straight line might be uncommon in reality. Moreover, in these experiments pedestrians were instructed not to move. In reality, pedestrians as well as PMV riders can take evasive actions, such as moving away, reducing speed, applying breaks suddenly and changing direction etc., to avoid any dangerous situation. Thus, it can be considered that the indices evaluated in this study could be an over-estimation of the reality. The SDI model developed in this study was calibrated against the data collected from the responses by young college
16
students. It should be noted that elderly and disabled pedestrians may perceive the danger differently compared to young students. Furthermore, the size of the PMV may also have significant impacts on pedestrians’ comfort in shared spaces (Nakagawa et al. 2012b). Therefore, such factors should also be carefully considered in future improvements to the model.
As explained in Section 4.3, the coefficient of determination (R2) between the representative observed SDI and estimated SDI is approximately 0.68. However, it is evident that the R2 for the calibrated model was relatively low (i.e., 0.20, as shown in Table 3). This implies that the concept of SDI can be derived from the repulsive force component in the social-force model and that the calibrated model can explain the average tendency of the observed data. Further, as the scatter diagram shows, the 15 scenarios can be classified into low-speed clusters (scenarios A to I) and high-speed clusters (scenarios J to O, see Figure 4). Those two clusters appear to have different regression lines. This can be considered a limitation of the SDI model. Further, this observation describes that the assumption of anticipation distance �� 𝑡 �� t �� t Δt in the SDI model may not be appropriate. At this stage,
�� 𝑡 was not modified for convenience. Even with such approximations and assumptions,
the SDI model proposed and tested in this study estimates the safety perception adequately, particularly when the danger level is high.
In Section 5, the calculation results of the case study demonstrated the applicability of the SDI model. However, it was noted that the SDI of a few pedestrians could be over six, which is the theoretical maximum value of SDI (defined in the questionnaire). The likely reason is that the participants determine the range of evaluation based only on the experiments. Therefore, the estimated model is valid within the range of the observed scenarios in the experiments. Further, the pedestrians’ anticipation time (∆t) and distance could be varied under different situations, i.e., when they are not moving and when they walk at different speeds. In addition to such factors, the cultural differences (Nordfjærn and Rundmo 2009, Chataway et al. 2014) and age (Vansteenkiste et al. 2014) are also likely to exert influences on the traffic risk perception. Such aspects were not considered in this study, and additional studies are required to address such issues.
The SDI model developed in this study could be used as a valuable tool to estimate safety and comfort on PMV-involved shared spaces, particularly by planners and facility managers. The calibrated model can calculate the PMV’s speeds that do not cause pedestrians to perceive danger or experience uneasiness. For example, the speeds can be a theoretical norm for the speed limit and/or the automated speed reducing function of PMVs on city sidewalks. 7. Conclusions and further studies In this study, a model that estimates pedestrians’ SDI toward PMVs was developed. This model is inspired by the original SFM and uses distance, relative speed, and relative orientation between the pedestrians and PMVs. To calibrate the model, data were collected through a controlled experiment. This experiment revealed the following two features of the pedestrians’ perceptions toward PMVs: (a) Sensitivity difference: The experimental results revealed that pedestrians exhibit high
sensitivity when a PMV is approaching from the front and low sensitivity when a PMV is
17
approaching from behind. Accordingly, the subjective danger perception toward PMVs depends on the direction when they and PMVs interact.
(b) Reversal perception: Pedestrians perceive a PMV in front of them as more dangerous compared to a PMV behind them when they are near the PMV. In contrast, they perceive higher danger when a PMV is behind them than when it is in front of them when they are relatively far from the PMV.
It should be noted that it is challenging to capture the reversal perception using objective danger indexes, which establishes the importance of the SDI proposed in this study. Moreover, it was demonstrated that such experimentally verified observations are accurately reflected in the enhanced and calibrated model in this study. Moreover, the case study demonstrated the usefulness of the SDI in practical applications.
Although the trends are accurately captured, it was observed that the SDI is marginally overestimated for low PMV speed levels and underestimated for high PMV speed levels. Such deviations could be owing to the incompatibility of anticipation distance, which was kept unmodified at this stage. To make the model more robust, such points should be further examined with additional empirical data in future studies. Moreover, this model could be enhanced, with suitable modifications to consider other likely shared space users (e.g., bicycles and other PMV users). With such enhancements and by integrating additional empirical data, the SDI model developed in this study could be used as a valuable tool to estimate safety on PMV-involved shared spaces. ACKNOWLEDGEMENTS This research is supported by the Japan Society for the Promotion of Science (JSPS) KAKENHI Grant Number 16K14317. The authors are grateful to the participants in the experiments. Furthermore, the authors wish to thank Professor Tomoyuki Todoroki at Nihon University, Japan for providing the video data used in the case study. REFERENCES 1. Ando, R., & Li, A. (2012, September). An analysis on users' evaluation for self-balancing
two-wheeled personal mobility vehicles. In Intelligent Transportation Systems (ITSC), 2012 15th International IEEE Conference on (pp. 1525-1530). IEEE.
2. Boniface, K., McKay, M. P., Lucas, R., Shaffer, A., & Sikka, N. (2011). Serious injuries related to the Segway® personal transporter: a case series. Annals of emergency medicine, 57(4), 370-374.
3. Carter, D. L., Hunter, W. W., Zegeer, C. V., Stewart, J. R., & Huang, H. F. (2006). Pedestrian and bicyclist intersection safety indices, (No. FHWA-HRT-06-125).
4. Castanier, C., Paran, F., & Delhomme, P. (2012). Risk of crashing with a tram: Perceptions of pedestrians, cyclists, and motorists. Transportation research part F: traffic psychology and behaviour, 15(4), 387-394.
5. Chataway, E. S., Kaplan, S., Nielsen, T. A. S., & Prato, C. G. (2014). Safety perceptions and reported behavior related to cycling in mixed traffic: A comparison between Brisbane and Copenhagen. Transportation research part F: traffic psychology and behaviour, 23, 32-43.
18
6. Dias, C., Iryo-Asano, M., & Nishiuchi, H. (2017). Evaluation of safe avoidance distance for pedestrians in personal mobility vehicles and pedestrian mixed traffic: A simulation based study. 12th International Conference of Eastern Asia Society for Transportation Studies, Ho Chi Minh City, Vietnam.
7. Dias, C., Iryo-Asano, M., Shimono, K., & Nakano. K. (2017). Calibration of a social force-based shared space model for personal mobility vehicle and pedestrian mixed traffic. TRB Annual Meeting 2017. Transportation Research Board.
8. DTV Shredder, http://dtvshredderuk.com/, Accessed July 18, 2017. 9. Gitelman, V., Pesahov, F., Carmel, R., & Chen, S. (2016). The use of mobility scooters by
the elderly–a feasibility study in Israel. Transportation Research Procedia, 14, 2324-2333. 10. Hashimoto N., Tomita K., Boyli A., Matsumoto O., Smirnov A., Kashevnik A., & Lashkov
I. (2015), Operational evaluation of new transportation methods for smart city: Use of personal mobility vehicles under three different scenarios, Proceedings of the Fourth International Conference on Smart Systems, Devices and Technologies, Brussels, Belgium, 1–6.
11. Honda|UNI-CUB, http://www.honda.co.jp/UNI-CUB/, Accessed July 20, 2017.
12. Hyundai E4U_ Are eggmobile personal transports the solution to urban sprawl_ - ExtremeTech, https://www.extremetech.com/extreme/152317-hyundai-e4u-are-eggmobiles-the-solution-to-urban-sprawl, Accessed July 18, 2017.
13. Ito, T., Shino, M., & Kamata, M. (2011). Risk Evaluation Index of Low-Speed Vehicle Driving on Pedestrian Spaces. Journal of Mechanical Systems for Transportation and Logistics, 4(1), 24-38.
14. Johansson, A., Helbing, D., & Shukla, P. K. (2007). Specification of the social force pedestrian model by evolutionary adjustment to video tracking data. Advances in complex systems, 10(supp02), 271-288.
15. Kaparias, I., Bell, M. G., Miri, A., Chan, C., & Mount, B. (2012). Analysing the perceptions of pedestrians and drivers to shared space. Transportation research part F: traffic psychology and behaviour, 15(3), 297-310.
16. Kitajima, S., Marumo, Y., Hiraoka, T., & Itoh, M. (2009). Comparison of Evaluation Indices concerning Estimation of Driver's Risk Perception. Review of Automotive Engineering, 30(2), 191-198.
17. Landis, B., Petritsch, T., Huang, H., & Do, A. (2004). Characteristics of emerging road and trail users and their safety. Transportation Research Record: Journal of the Transportation Research Board, (1878), 131-139.
18. Lehtonen, E., Havia, V., Kovanen, A., Leminen, M., & Saure, E. (2016). Evaluating bicyclists’ risk perception using video clips: comparison of frequent and infrequent city cyclists. Transportation research part F: traffic psychology and behaviour, 41, 195-203.
19. Li, Z., Zhou, X., Wang, X., & Guo, Z. (2013). Study on Subjective and Objective Safety and Application of Expressway. Procedia-Social and Behavioral Sciences, 96, 1622-1630.
20. Litman, T. (2006). Managing diverse modes and activities on nonmotorized facilities: guidance for practitioners. Institute of Transportation Engineers. ITE Journal, 76(6), 20.
19
21. Liu, R., & Parthasarathy, R. (2003, July). Urban street: Is there a room for Segway™ human transporter (HT)?. In 2nd Urban Street Symposium: Uptown, Downtown, or Small Town: Designing Urban Streets That Work.
22. Miller, S., Molino, J., Kennedy, J., Emo, A., & Do, A. (2008). Segway rider behavior: speed and clearance distance in passing sidewalk objects. Transportation Research Record: Journal of the Transportation Research Board, (2073), 125-132.
23. Nakagawa, C., Imamura, K., Shintani, A., & Ito, T. (2012-A). Simulations of the relationship between a personal mobility vehicle and pedestrians. In Systems Conference (SysCon), 2012 IEEE International. IEEE,1-6.
24. Nakagawa, C., Imamura, K., Shintani, A., & Ito, T. (2012-B). Influence of the size of a personal mobility vehicle on the affinity with a pedestrian. In ASME 2012 5th Annual Dynamic Systems and Control Conference joint with the JSME 2012 11th Motion and Vibration Conference (pp. 795-802). American Society of Mechanical Engineers.
25. Ninebot personal transportation robot, http://www.ninebot.com/Japan, Accessed July 20, 2017.
26. Nishiuchi, H., Sato, T., Aratani, T., & Todoroki, T. (2010). An analysis of Segway behavior focusing on safety distance for pedestrians and gaze of riders. In 17th ITS World Congress, Busan, Korea.
27. Nordfjærn, T., & Rundmo, T. (2009). Perceptions of traffic risk in an industrialised and a developing country. Transportation research part F: traffic psychology and behaviour, 12(1), 91-98.
28. Personal transportation that simply moves you _ Segway, http://www.segway.com/, Accessed July 18, 2017.
29. Pham, T. Q., Nakagawa, C., Shintani, A., & Ito, T. (2015). Evaluation of the effects of a personal mobility vehicle on multiple pedestrians using personal space. IEEE Transactions on Intelligent Transportation Systems, 16(4), 2028-2037.
30. Robstep. Robstep, Robstep technology, Robstep robot, balance car, thinking car, scooter., http://www.robstep.com/, Accessed July 18, 2017.
31. Roider, D., Busch, C., Spitaler, R., & Hertz, H. (2016). Segway® related injuries in Vienna: report from the Lorenz Böhler Trauma Centre. European journal of trauma and emergency surgery, 42(2), 203-205.
32. Sayed, T., Zaki, M. H., & Autey, J. (2013). Automated safety diagnosis of vehicle–bicycle interactions using computer vision analysis. Safety science, 59, 163-172.
33. Sawatzky, B., Denison, I., Langrish, S., Richardson, S., Hiller, K., & Slobogean, B. (2007). The Segway personal transporter as an alternative mobility device for people with disabilities: A pilot study. Archives of physical medicine and rehabilitation, 88(11), 1423-1428.
34. Shaheen, S.A. & Finson, R. (2003). Bridging the last mile: a study of the behavioral, institutional, and economic potential of the Segway human transporter. Transportation Research Board.
35. Sun, X. H., & Yang, F. (2008). A new method to measure drivers’ mental workload—a field study in China. Chinese Journal of Ergonomics, 14(3), pp.27-31.
36. TOYOTA personal mobility winglet, http://www.toyota.co.jp/jpn/tech/personal_mobility/winglet.html, Accessed July 18, 2017.
20
37. Ulrich, K. T. (2005). Estimating the technology frontier for personal electric vehicles. Transportation research part C: Emerging technologies, 13(5), 448-462.
38. Vansteenkiste, P., Zeuwts, L., Cardon, G., & Lenoir, M. (2016). A hazard-perception test for cycling children: an exploratory study. Transportation research part F: traffic psychology and behaviour, 41, 182-194.
39. WHILL _ intelligent personal EVs - The future of power wheelchairs, http://whill.us/, Accessed July 18, 2017.
40. Xu, J., Shang, S., Qi, H., Yu, G., Wang, Y., & Chen, P. (2016). Simulative investigation on head injuries of electric self-balancing scooter riders subject to ground impact. Accident Analysis & Prevention, 89, 128-141.
41. Zhuang, X., & Wu, C. (2012). The safety margin and perceived safety of pedestrians at unmarked roadway. Transportation research part F: traffic psychology and behaviour, 15(2), 119-131.


![Physics - Non Commutative Geometry for Pedestrians - [Jnl Article] Madore (1999) WW](https://img.pdfslide.tips/doc/110x75/5527f8315503467a588b45a5/physics-non-commutative-geometry-for-pedestrians-jnl-article-madore-1999-ww.jpg)