Embed Size (px)
Citation preview

Modeling the Delta Smelt Population
of the San Francisco Estuary
Wim KimmererRomberg Tiburon Center for Environmental Studies
San Francisco State University

Modeling Team
• Particle tracking model– Steve Monismith, Derek Fong, Jim Hench
• Matrix models– Bill Bennett
• Individual-based model– Kenny Rose– Wim Kimmerer– Post-doc to be named later

Topics to cover
• Some basic factoids about delta smelt• Current understanding• Recent concerns• The three models
World’s biggest delta smelt (Hypomesus transpacificus)

Delta Smelt
• Endemic, threatened species• Annual life cycle• Limited habitat
– Salinity from fresh to ~10– Close to the export pumps in the Delta
• Declining abundance

Fall MidwaterTrawl:90%
confidence limits of mean catch per trawl
Source: Kimmerer & Nobriga
IEP Newsletter
Abundance pattern of delta smelt
1970 1980 1990 2000
0.1
1
10
100
1000
Cat
ch p
er T
raw
l
YearA
bund
ance
Inde
x

Sudden public interest in estuarine foodwebs
Source:Mike Taugher, CC Times

J
F
AM
JJ
M
N
SA
O
D
Kodiak
20-mm
Midwater
Townet
Spawning;Temperature
Effects
Food limitation;Density dependence?
2-year-oldSpawners?
Life history and sampling

Delta Smelt Distribution in 1999
Data Source:20 mm surveys
Mid-May
Mid-July
A M J J A S O N D0
1
2
3
20
40
60
Wei
ghte
d M
ean
Sal
inity
MonthM
ean
Leng
th, m
m
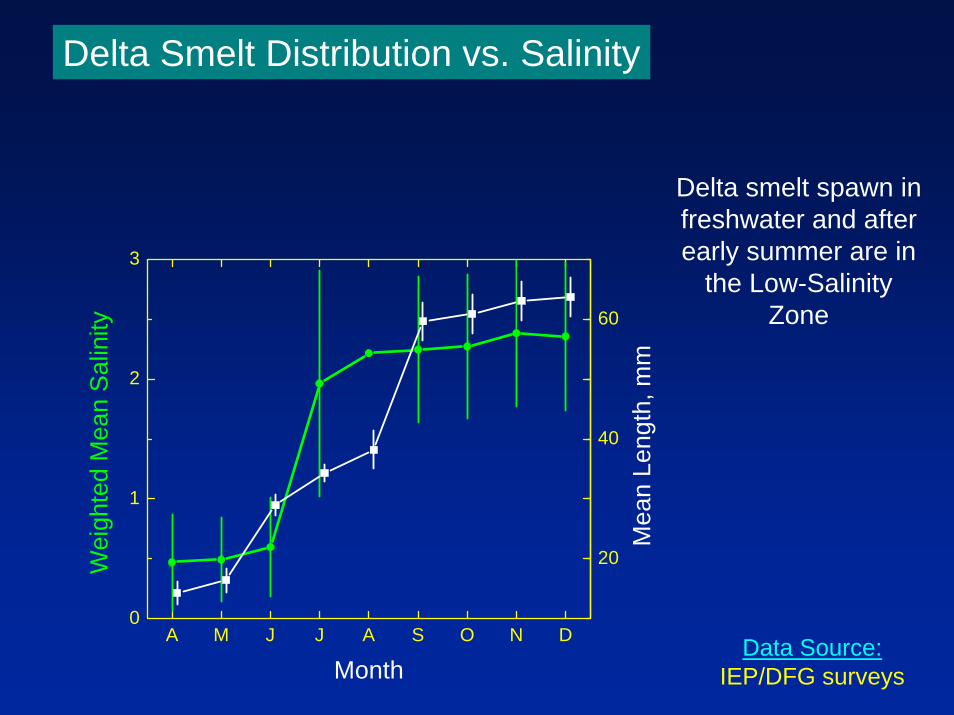
Delta Smelt Distribution vs. Salinity
Data Source:IEP/DFG surveys
Delta smelt spawn in freshwater and after early summer are in
the Low-Salinity Zone

82
8384
8586
8788
8990
91
92
93
94
95
96
9798
9900
01
02
69
70
717273
75
7677
78
80
81
0 3 6 9 12 150
450
900
1350
Adu
lts
Juveniles
0 15 30 45 600
450
900
1350
1800
0 15 30 45 600
450
900
1350
1800
0 15 30 45 600
450
900
1350
1800
Juveniles
Adu
lts
Post-decline
Curved line suggests a limited carrying capacity
Source: Bennett 2005
Pre-decline
Potential Density Dependence

Spring Fall0
10
20
30
40
50
60
70N = 61
N = 153
Perc
ent o
f Ind
ivid
uals
Season
Toxic damage Undernourishment
Evidence of food limitation, not much
toxic damage(how much is too
much?)
Source: Bennett 2005
Food Shortages vs. Toxic Chemicals: 1999

Limnoithona spp.: Percent in plankton and in delta smelt diets
Zooplankton abundance:IEP Zooplankton Survey
(Low-Salinity Zone)
Diet data:Lott 1998
IEP Newsletter 11 (1):14-18M J J A S O N D
0
20
40
60
80
100
Diet: 1993-1996
1995
1994
19961993
Month
Per
cent

1975 1980 1985 1990 1995 200050
60
70
80
50
60
70
80
Leng
th, m
m
Year
Length distributions of delta smelt
Data Source:IEP/DFG surveys
Delta smelt have become ~10%
smaller
Fall Midwater Trawl SurveySept-Dec
San Francisco Bay StudyAug-May

Percent of population lost to export pumping during spring
1996 1998 2000 2002 20040
5
10
15
20
Ann
ual L
oss
(%)
Year
Source: DFG 20mm survey
Delta Smelt Loss Rates to Export Pumping

Environmental Water Account
EWA Expenditures: 2000 - 2004
Graph from Jerry Johns

Key questions
• Movement patterns– Entrainment (EWA)
• Probability of extinction– Management options– Uncontrolled factors
• Basic ecology (relevant to management)– Importance of density dependence– Importance of Age-1+ adults– Growth and survival

Why model?
• Figure out movement patterns– Particle tracking model
• Examine probability of extinction– Matrix models
• Investigate ecology– Individual-based model

Low High
Low
High Low
High
Interpretationand
Analysis
Indiv.-BasedModels
Particle-TrackingModels
Biological DetailSi
mpl
icity
and
Spe
ed
Spatial Detail
MatrixModels
Differences among models

Connections among models
Interactions among models
are implicit:Models are not
formally connected
External Data
Individual-basedmodels
Matrix models Particle-trackingmodels
Transition matrix
Vital Rates
Scen
arios
,
compa
rison
sVital
Rate
s,
Compa
rison
s
Entrainment losses
Scenarios to run

N
Suisun Bay
Pumping PlantsState Federal
Sacramento-San
JoaquinDelta
Napa River
NorthDelta
SouthDelta
South Suisun
North Suisun CentralDelta
Napa
Model Domains
PTM NodesIBM Regions

Particle-tracking model
• Based on DSM-2 hydrodynamic model– Calibrated for Delta– Fast– Separate PTM
• Suitable for early life stages• Large numbers of particles• Use observed spatial distributions

Particle-tracking model
• Conditions modeled:– Six water year types (examples)– Two barrier configurations– To VAMP or not– Alternative export management (EWA)
• Synthesis– Entrainment probabilities– Transition probabilities– Effect of alternative behaviors

Release point:Mossdale
Release point: Hood
Particle Tracking Results
LowProbability of entrainment
High
90-day runs: time series of particle fate

Q = 12
, X =
10
Q = 12, X = 6
Q = 21, X = 10
Q = 21, X = 6
0.00 0.25 0.50 0.75 1.000.00
0.25
0.50
0.75
1.000.00
0.25
0.50
0.75
1.00
Flow Export 12 10 12 6 12 2 38 10 120 10
Export Pumps
Rem
ain
in D
elta
Chipps Island
HoodParticle Tracking Results
Release point: Hood
Inflow, Export (cfs)

Q = 120, X = 10
Q = 120, X = 6Q = 38, X = 2
Q = 120 X = 2Q = 67, X = 2
0.00 0.25 0.50 0.75 1.000.00
0.25
0.50
0.75
1.000.00
0.25
0.50
0.75
1.00
Flow Export 12 10 12 6 12 2 38 10 120 10
Export Pumps
Rem
ain
in D
elta
Chipps Island
MossdaleParticle Tracking Results
Release point:Mossdale
Inflow, Export (cfs)

Matrix (stage-based) models
• Rapid computation• Uncertainty explicit• Examine sensitivity to parameters• Purposes:
– Extinction probability– Importance of age structure– Alternative management (as mortality)

Periodic Stage-Based with 1+ Adults
Spring Fall Winter
LateCohort
EarlyCohort
SmallLarvae
LargeLarvae
LargeJuveniles
SmallJuveniles
LargeAdults
SmallAdults
as11
as21 af21
as22
af11
af22
SmallLarvae
LargeLarvae
Following Spring
aw11
aw22
aw21aw12
Yr. 1+Adults
Yr. 1+Adults
Yr. 1+Adults
Yr. 1+Adults
af11 0 0
af21 af22 0
0 0 af33
aw11 aw12 0
aw21 aw22 aw23
aw31 0 0
as11 0 0
as21 as22 0
0 0 as33
• •
aw31aw23
as33 af331+
Adults

Age 0 Age 1+
-0.50
-0.25
0.00
0.25
0.50
Rat
e of
incr
ease
, rModel
Without Exports With Exports
Age 1+ Spawner and Export Effectson Population Growth
Parameters
Probability of 1+ adult surviving into summer
as33 = 0.95
Probability of 1+ adult surviving into winter
af33 = 0.80
Number of small adults surviving into spring
aw31 = 12 (approx. 1%)
Number of large larvae produced by 1+ adults
aw23 = fecundity/2 * 0.01 * 0.6 = 42
1+ are larger fish = higher survival
Less than ≈ 10% of population
Lab fecundity data

Individual-based model
• Tracks “representatives” through life cycle• Management interventions = mortality
– Not explicit– Burden is on investigator to supply mortality
• Alternative formulations– Density dependence– Importance of Age-1+

Individual-based modelSet up geometry
Initialize environment
Initialize population
Years
Determine hydrological year type
Spawning
Days
Individuals
Egg development, mortality
New individuals
GrowthMortality
Movement
HydrodynamicModel;
EnvironmentalConditionsLoop
Loop
Loop

Related Projects• Delta Smelt Foodweb (CALFED funded)
– Basis of the foodweb– Sources and processing of organic carbon
• Delta Smelt Monitoring (CALFED: submitted)– Histopathology (Food limitation, toxicity)– Growth rate, origin– Feeding (gut contents)
• POD (Pelagic Organism Decline)– Delta smelt abundance, distribution, entrainment– Copepod population dynamics– Clam salinity tolerance
• Ongoing studies– Delta smelt culture– X2 investigations

Schedule
Current status of delta smelt
Spring 2006 Hire post-doc
Fall 2006 Initial workshop – adjust scope
Fall 2006 CALFED Science Conference
2006 - 2007 Model development
Spring 2008 Complete model development
January 2009 Final reporting