Embed Size (px)
Citation preview
Modeling Web Quality-of-Experience
on Cellular Networks
Athula Balachandran, Vaneet Aggarwal, Emir Halepovic, Jeffrey Pang, Srinivasan Seshan, Shobha Venkataraman, He Yan
Carnegie Mellon University, AT&T Labs Research
MobiCom 2014
Presented byNawanol Theera-Ampornpunt
11 February, 2015
Motivation
� Cellular network characteristics affect users’ Quality-of-Experience (QoE)
� Signal strength
� Handovers
� Load of cell tower
� Network operators want to optimize network for QoE
� They cannot directly measure QoE
� Need to rely on model of relationship between network characteristics and QoE
� Goal: Model QoE metrics from network traces
� Application: web browsing
2 / 25
Uses of the Model
� Determine when network degradation actually affects user experience
� Give operators information about trade-offs among potential solutions
� Troubleshooting a problem
� Tweaking a network element
� Expanding the network
3 / 25
Previous Work
4 / 25
� Relies on client-side or server-side instrumentation
� Discovers how web QoE is affected by
� website designs
� web browsers
� network protocols
� This paper takes a “cellular operator view” of web QoE
� No detailed client-side or server-side logs
� Estimate QoE metrics using only network measurements
Contributions
5 / 25
� Develops a technique to reconstruct mobile web sessions and user clicks from HTTP traces
� Quantifies individual impact of network characteristics on mobile web QoE
� Develops machine-learning models for predicting web QoE from radio network characteristics
Data Sources
6 / 25
� Radio statistics� RSSI (received signal strength indicator)
� Handovers
� End-to-end throughput
� Latency
� HTTP flows� HTTP headers
� TCP flow duration, flags
� Anonymized device identifier
� Location: a major metropolitan area in western U.S.
� Duration: one month in 2012
� All data sets are anonymized
Websites Analyzed
7 / 25
� Analysis focuses on three leading mobile websites in top 100
� News
� Social
� Wiki
� HTTP trace contains (only visits to 3 websites above)
� 2 million web sessions
� 70 million HTTP requests
� 1 million unique devices
� Radio trace contains complete information about 100,000 of the HTTP sessions
QoE Metrics
8 / 25
� User engagement identified as key measure
� Session length
� Number of pages a user clicks through
� Abandonment rate
� Percentage of users who leave the website after visiting the landing page
� Both require identification of user clicks
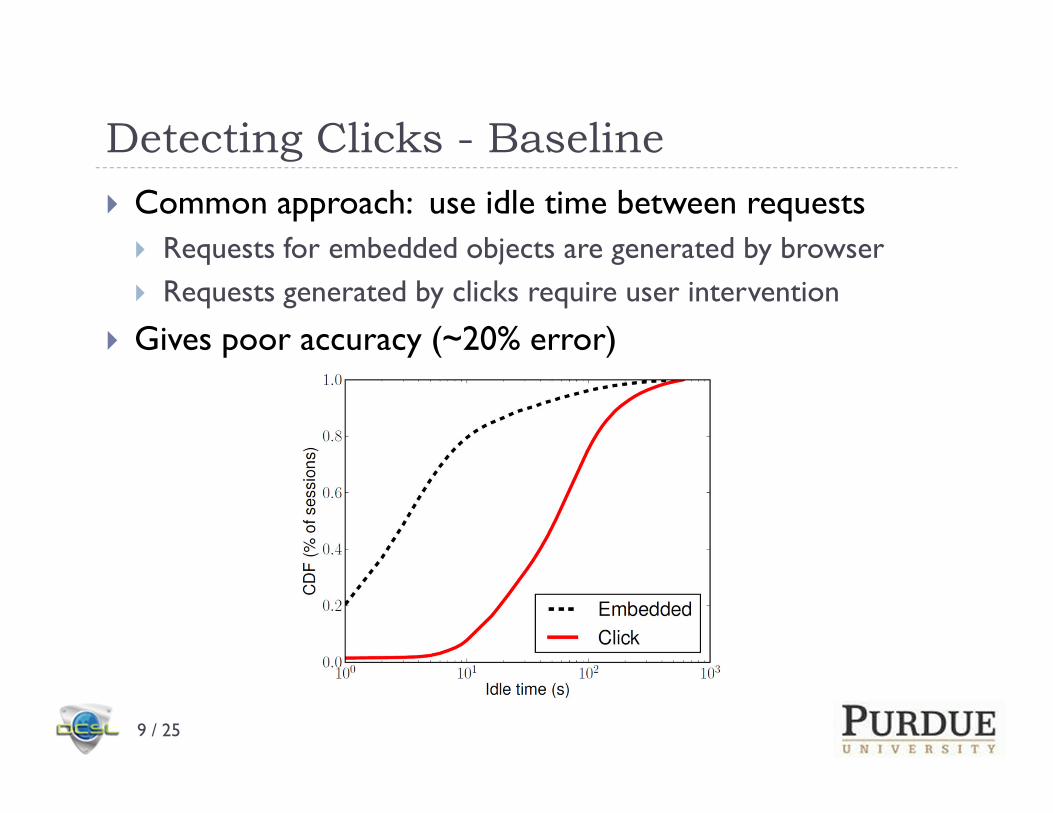
Detecting Clicks - Baseline
9 / 25
� Common approach: use idle time between requests
� Requests for embedded objects are generated by browser
� Requests generated by clicks require user intervention
� Gives poor accuracy (~20% error)
Detecting Clicks - Approach
10 / 25
� Most embedded objects are hosted by third party
� Advertising agency
� Content Distribution Networks (CDNs)
� Analytics services
� Classify requests based on URLs
� Models trained separately for each website
Detecting Clicks – Steps 1-2
11 / 25
1. Group sessions
� based on Referrer header and IMEI hash
2. Extract features
� bag of words from domain name
� bag of words from URN
� type of content
� Example: www.blog.xyz.com/my/blog/abc.html
� Domain = <blog, xyz, com>
� URN =<my, blog, abc.html>
� Type = html
Detecting Clicks – Steps 3-4
12 / 25
3. Label data points
� Only include requests in the first 10 seconds of each session
� First request from a click
� Other requests for embedded objects
4. Running classification algorithm
� Naïve Bayes performs best
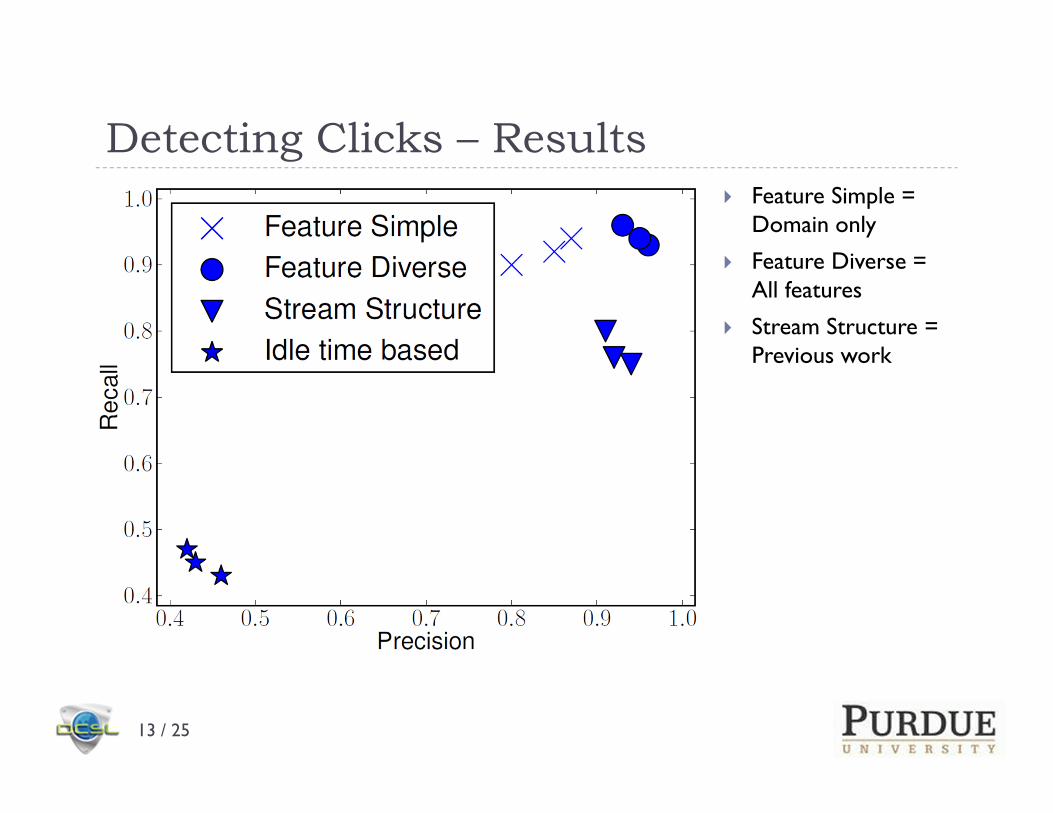
Detecting Clicks – Results
13 / 25
� Feature Simple = Domain only
� Feature Diverse = All features
� Stream Structure = Previous work
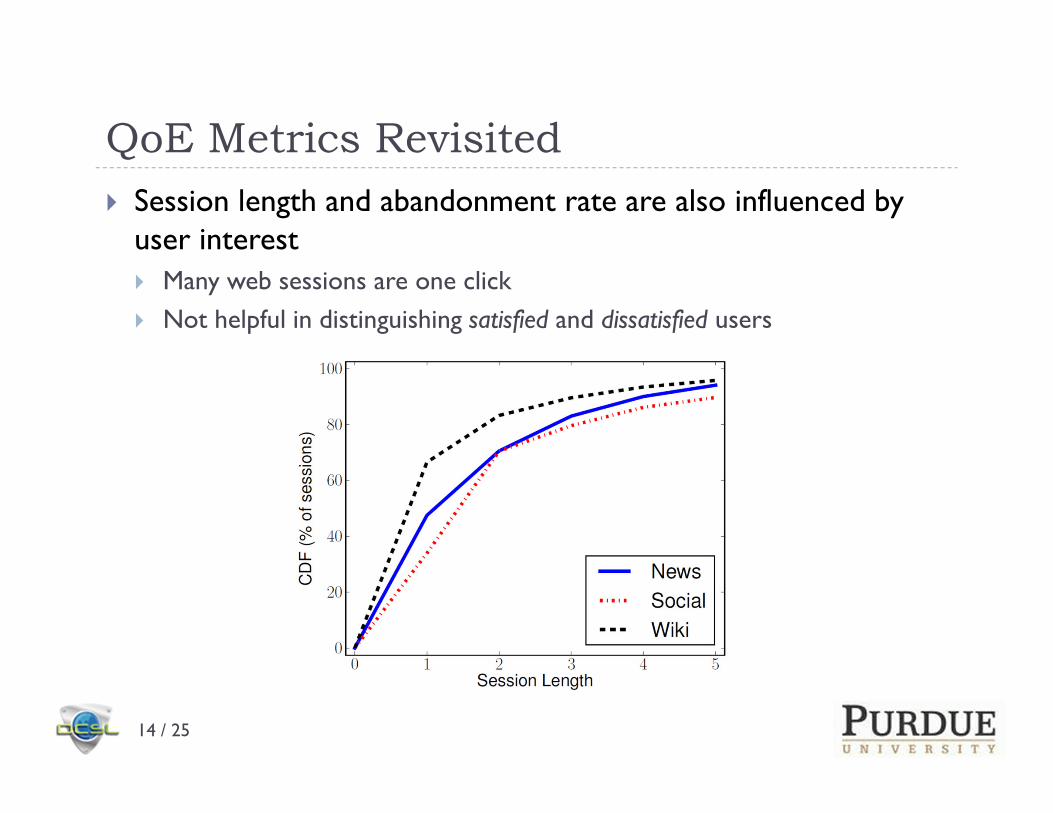
QoE Metrics Revisited
14 / 25
� Session length and abandonment rate are also influenced by user interest
� Many web sessions are one click
� Not helpful in distinguishing satisfied and dissatisfied users
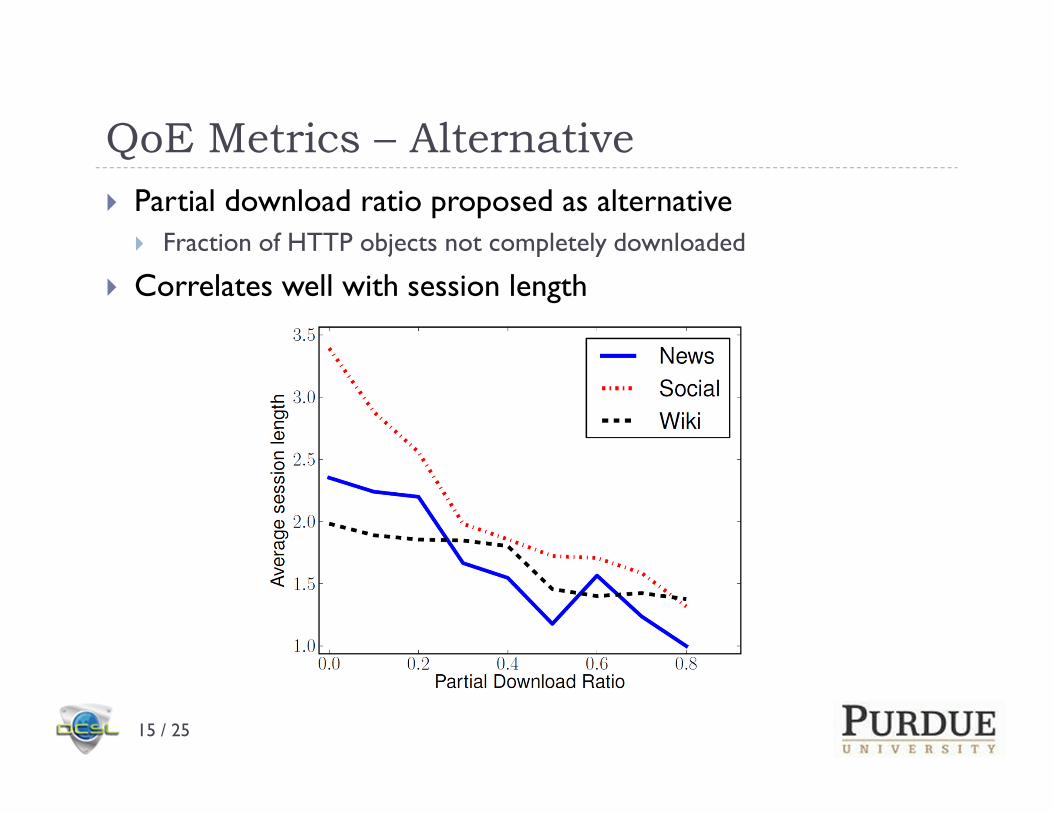
QoE Metrics – Alternative
15 / 25
� Partial download ratio proposed as alternative
� Fraction of HTTP objects not completely downloaded
� Correlates well with session length
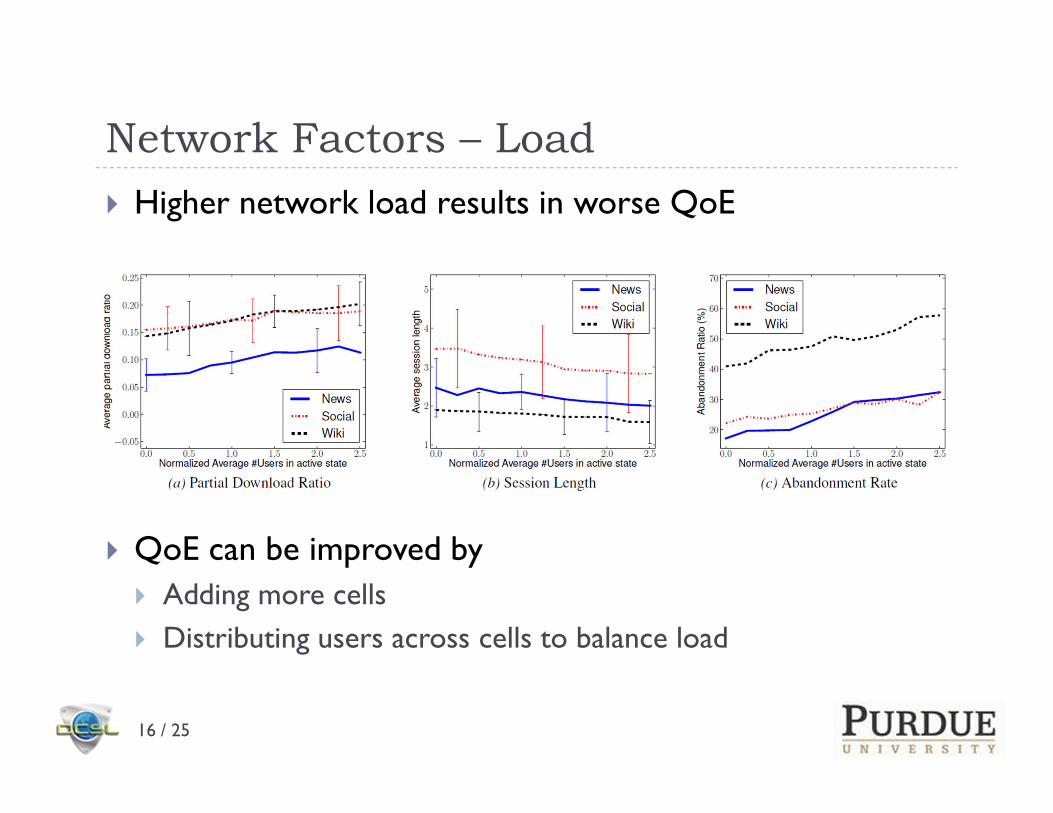
Network Factors – Load
16 / 25
� Higher network load results in worse QoE
� QoE can be improved by
� Adding more cells
� Distributing users across cells to balance load
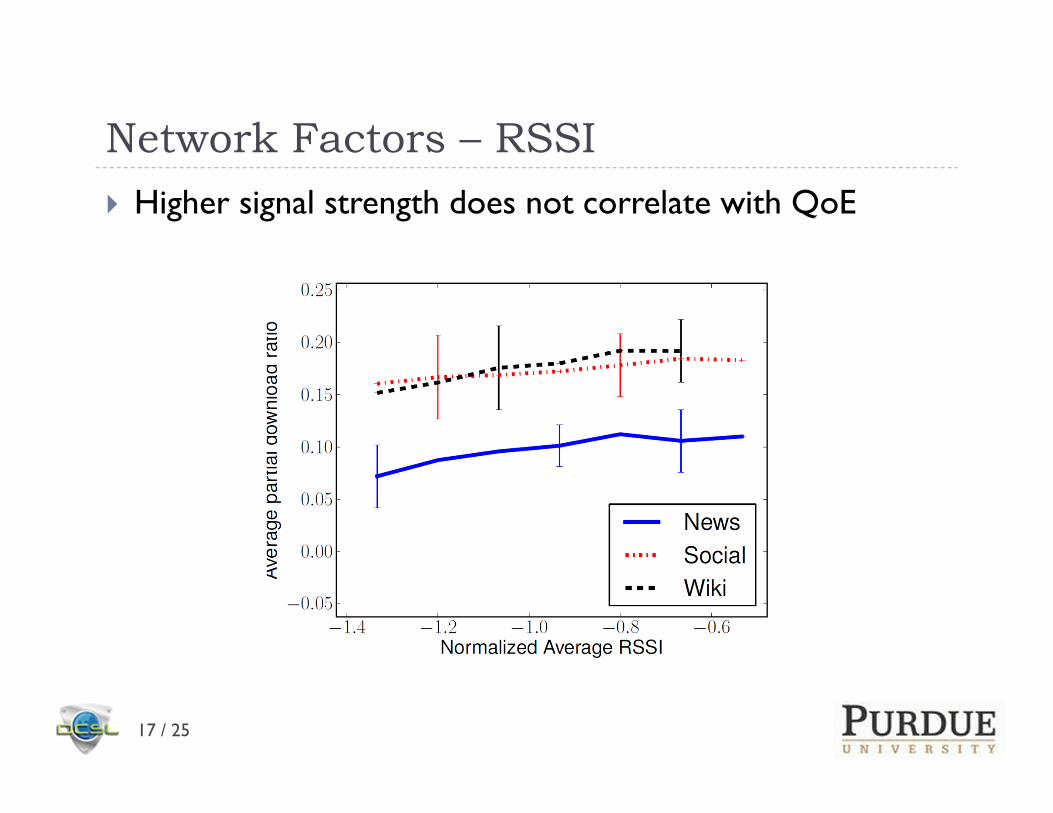
Network Factors – RSSI
17 / 25
� Higher signal strength does not correlate with QoE
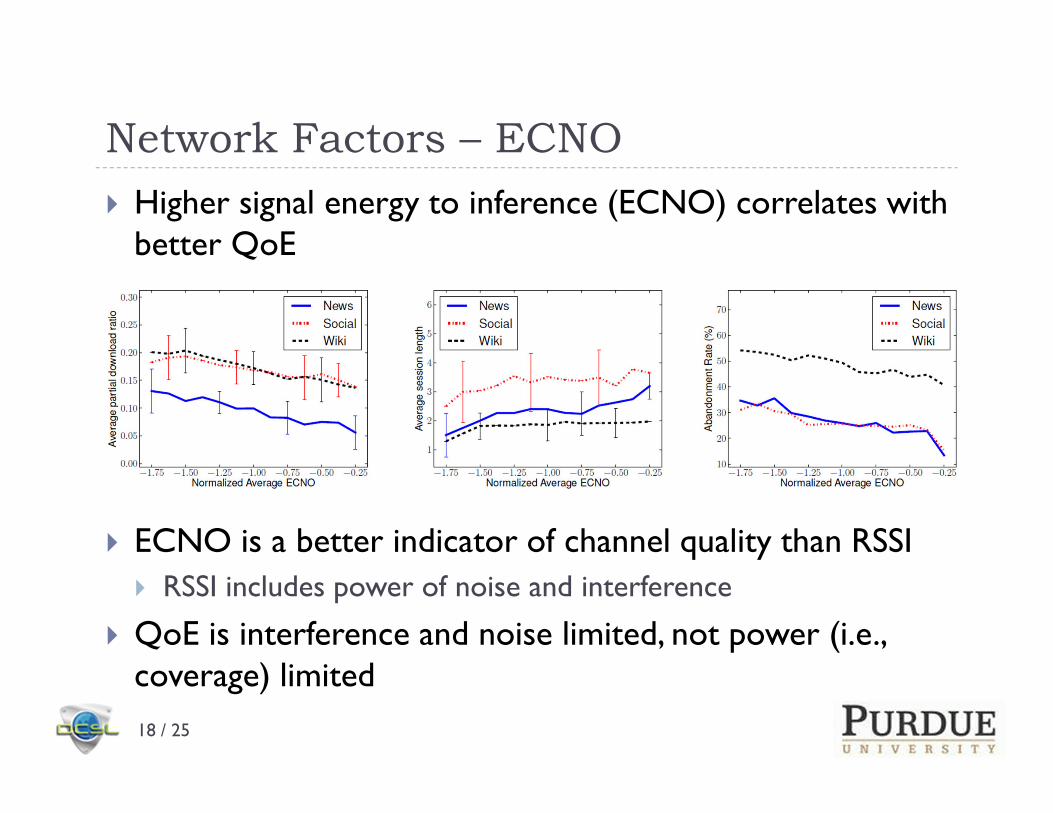
Network Factors – ECNO
18 / 25
� Higher signal energy to inference (ECNO) correlates with better QoE
� ECNO is a better indicator of channel quality than RSSI
� RSSI includes power of noise and interference
� QoE is interference and noise limited, not power (i.e., coverage) limited
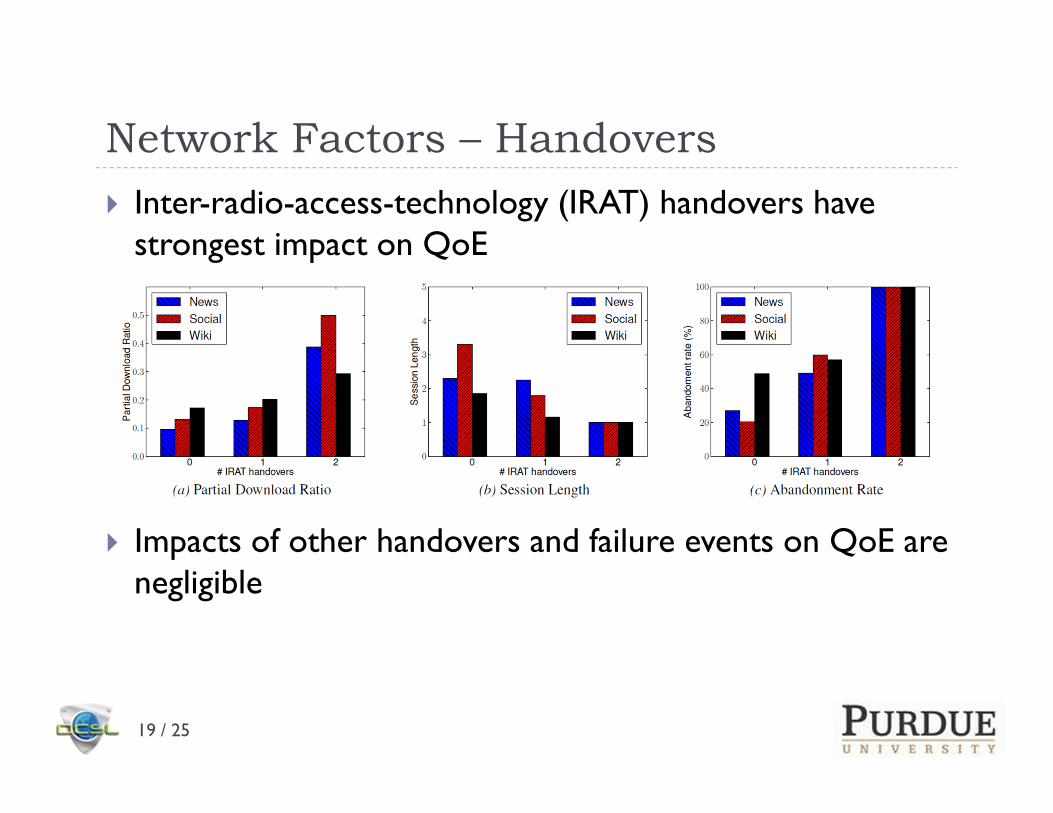
Network Factors – Handovers
19 / 25
� Inter-radio-access-technology (IRAT) handovers have strongest impact on QoE
� Impacts of other handovers and failure events on QoE are negligible
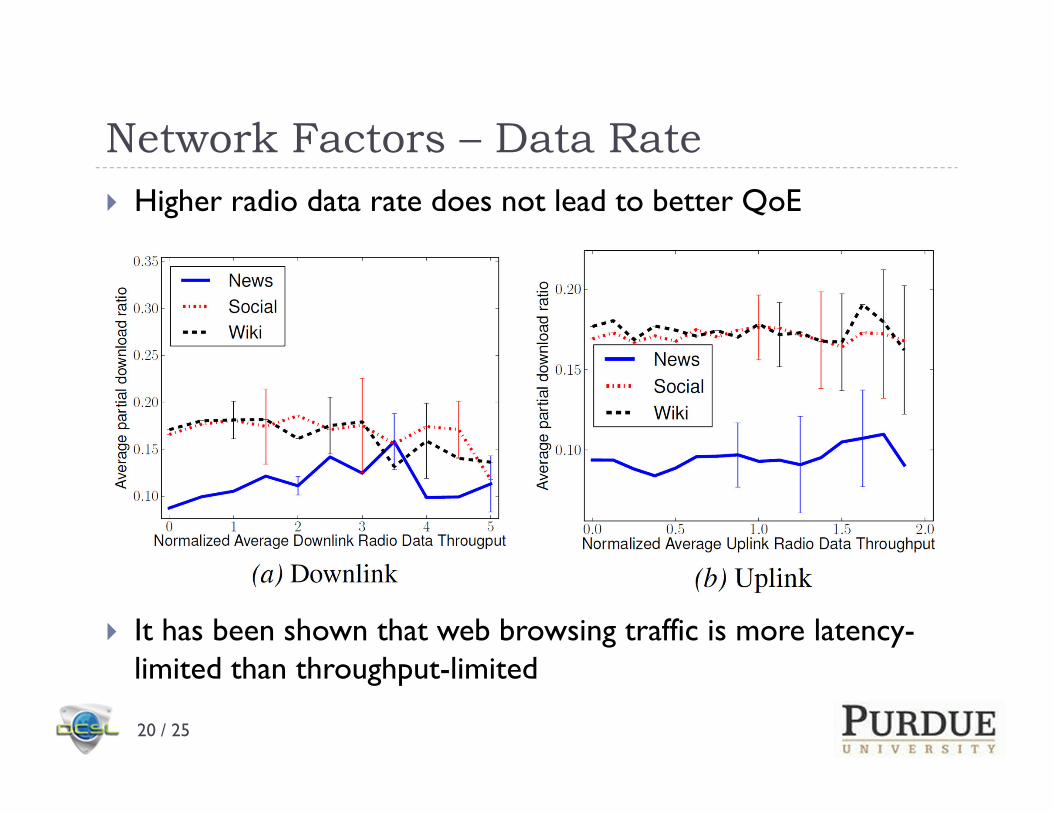
Network Factors – Data Rate
20 / 25
� Higher radio data rate does not lead to better QoE
� It has been shown that web browsing traffic is more latency-limited than throughput-limited
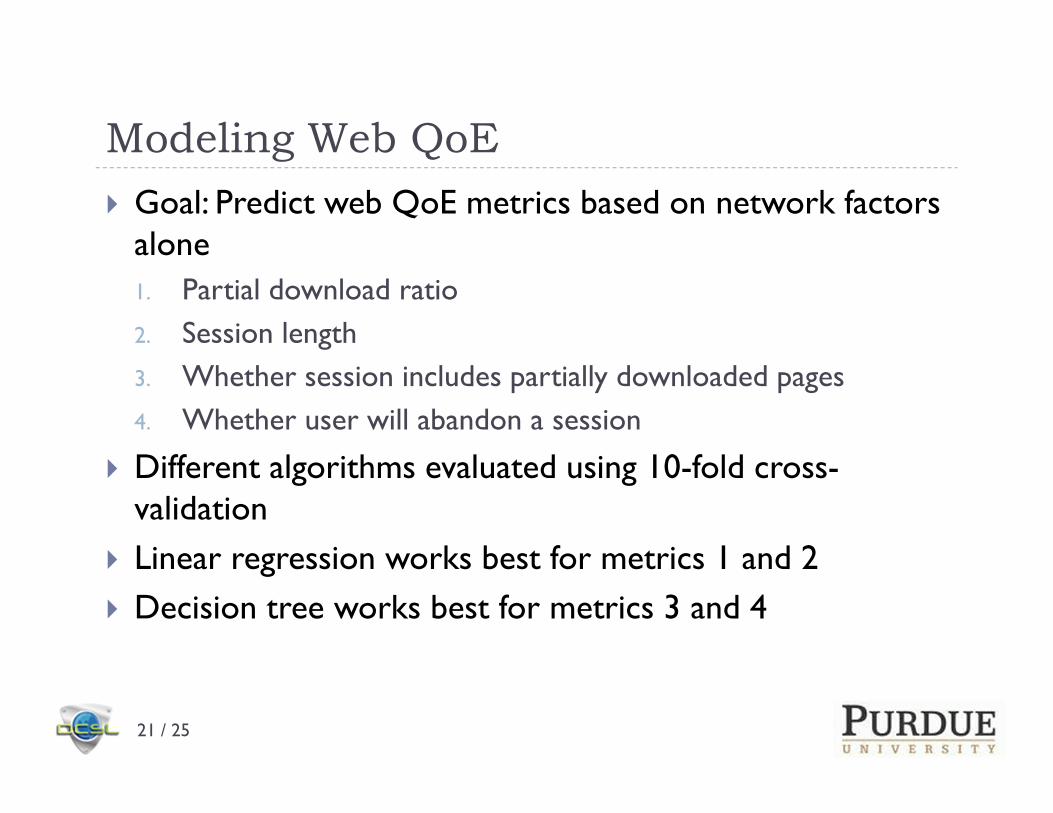
Modeling Web QoE
21 / 25
� Goal: Predict web QoE metrics based on network factors alone
1. Partial download ratio
2. Session length
3. Whether session includes partially downloaded pages
4. Whether user will abandon a session
� Different algorithms evaluated using 10-fold cross-validation
� Linear regression works best for metrics 1 and 2
� Decision tree works best for metrics 3 and 4
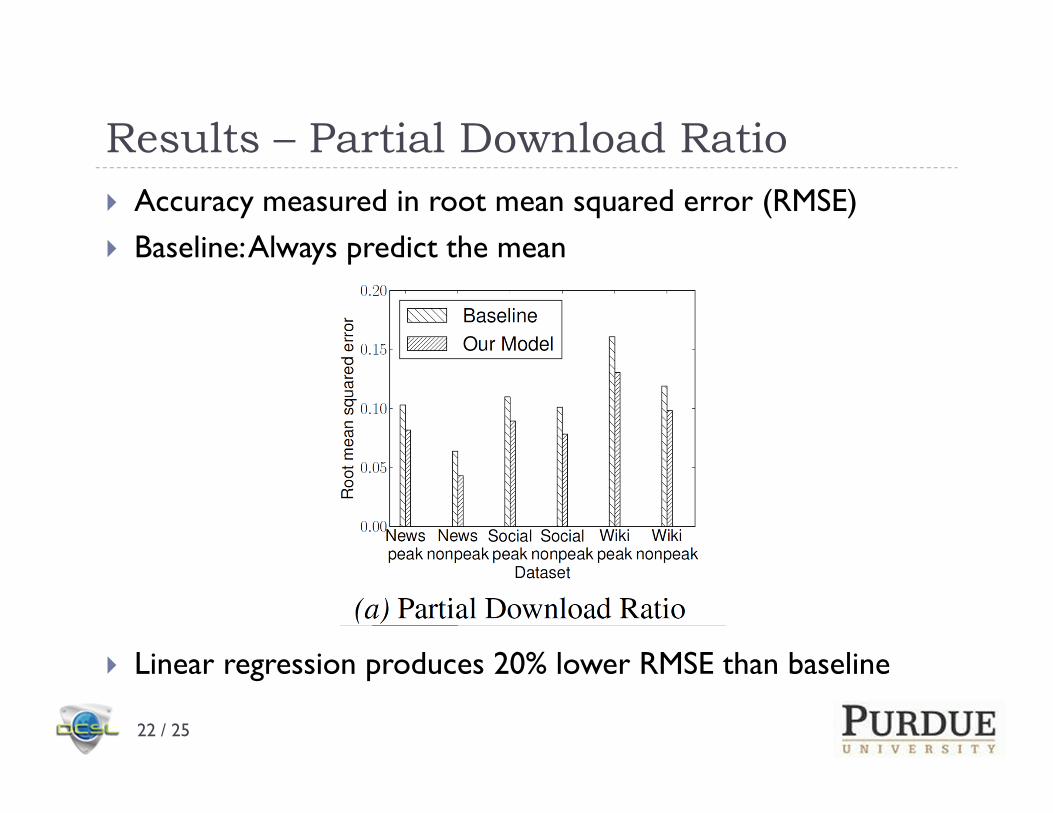
Results – Partial Download Ratio
22 / 25
� Accuracy measured in root mean squared error (RMSE)
� Baseline: Always predict the mean
� Linear regression produces 20% lower RMSE than baseline
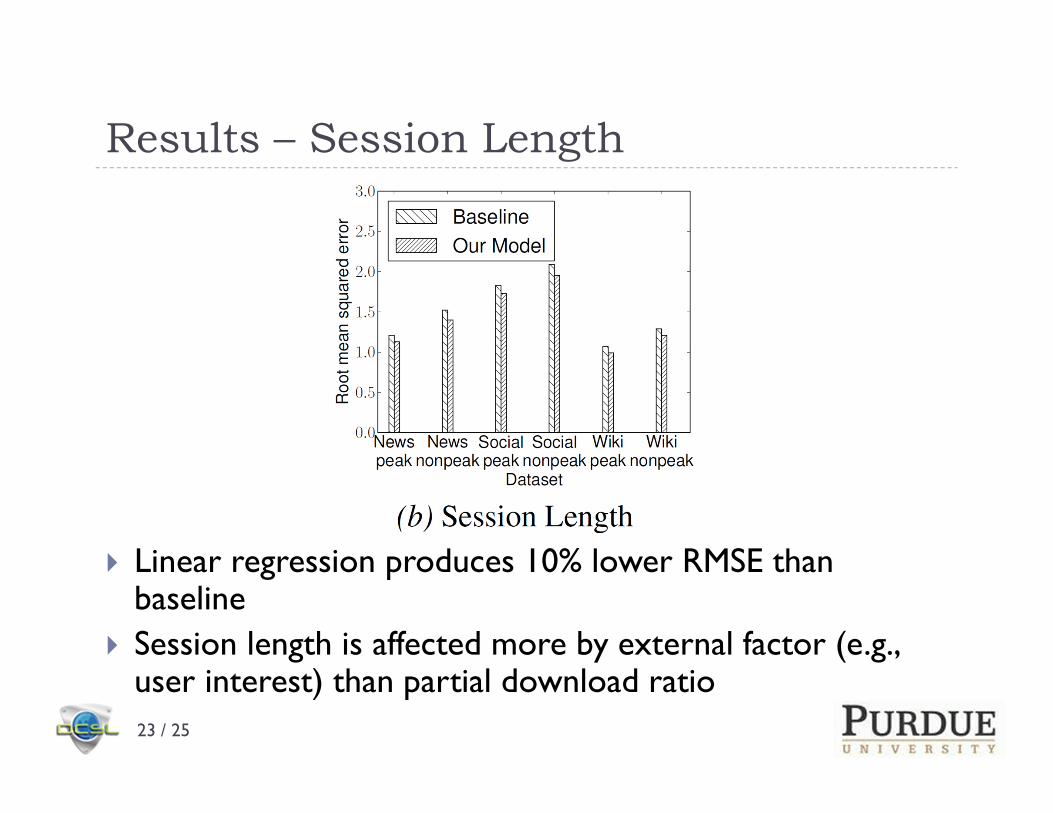
Results – Session Length
23 / 25
� Linear regression produces 10% lower RMSE than baseline
� Session length is affected more by external factor (e.g., user interest) than partial download ratio
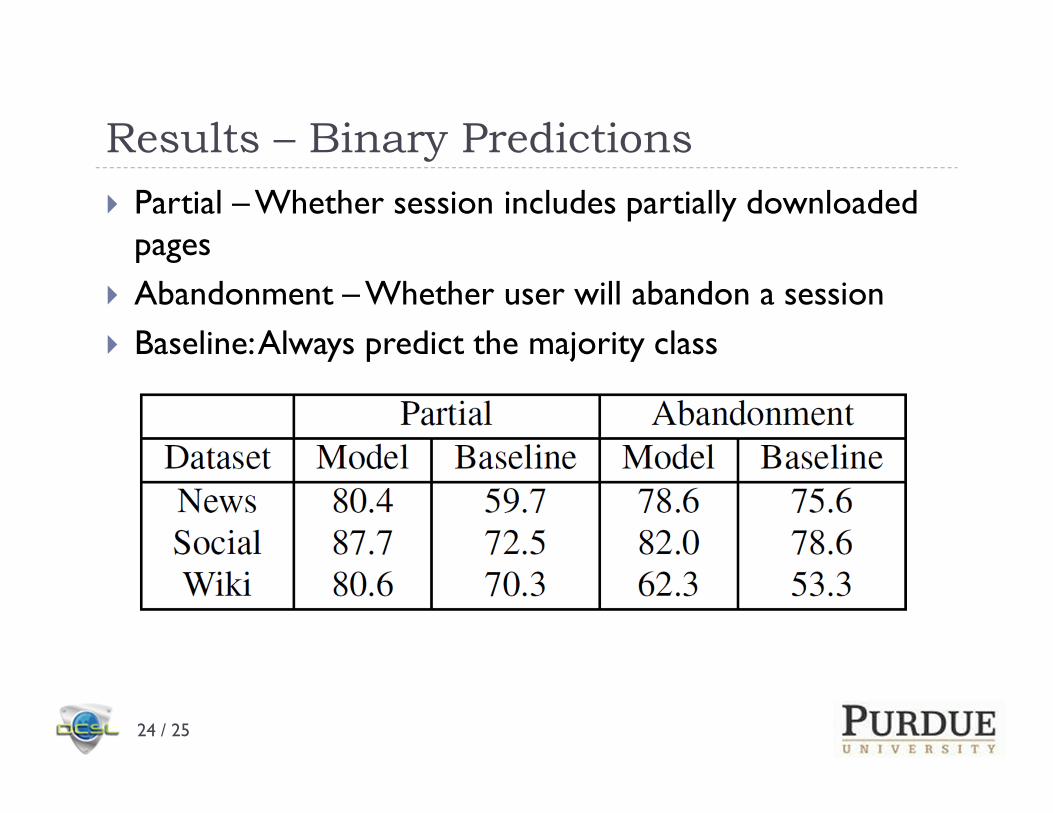
Results – Binary Predictions
24 / 25
� Partial – Whether session includes partially downloaded pages
� Abandonment – Whether user will abandon a session
� Baseline: Always predict the majority class
Insights
25 / 25
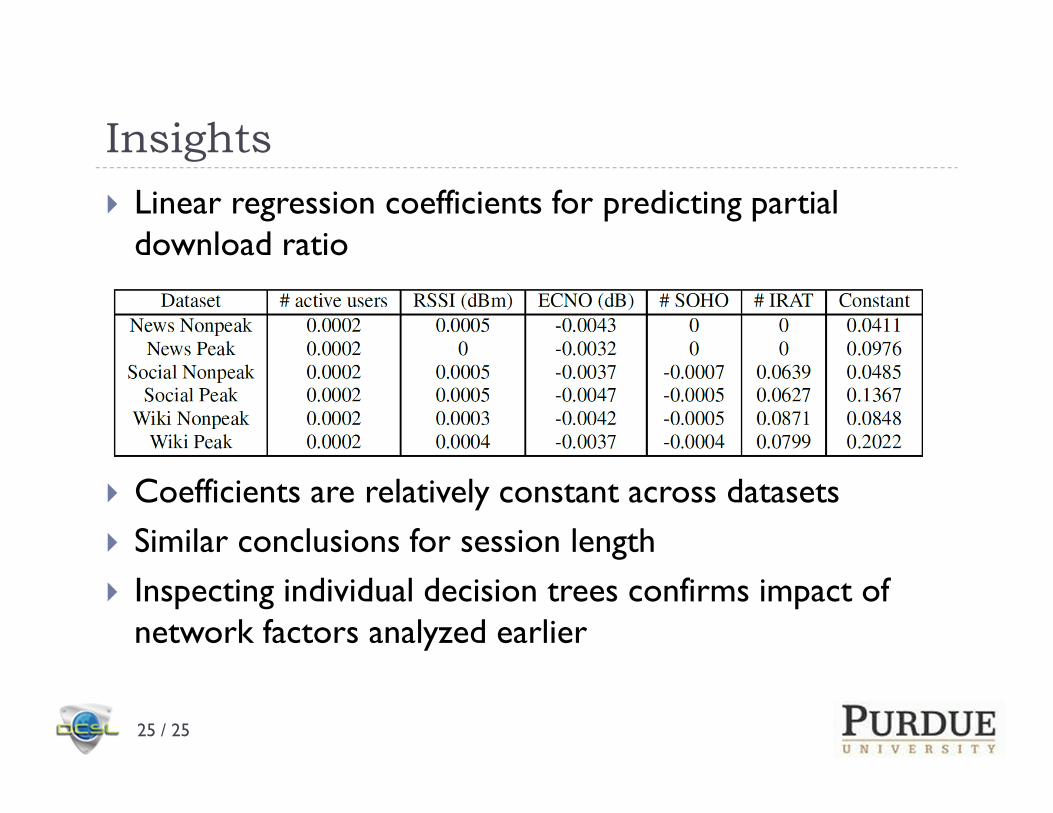
� Linear regression coefficients for predicting partial download ratio
� Coefficients are relatively constant across datasets
� Similar conclusions for session length
� Inspecting individual decision trees confirms impact of network factors analyzed earlier
Questions?