Embed Size (px)
Citation preview
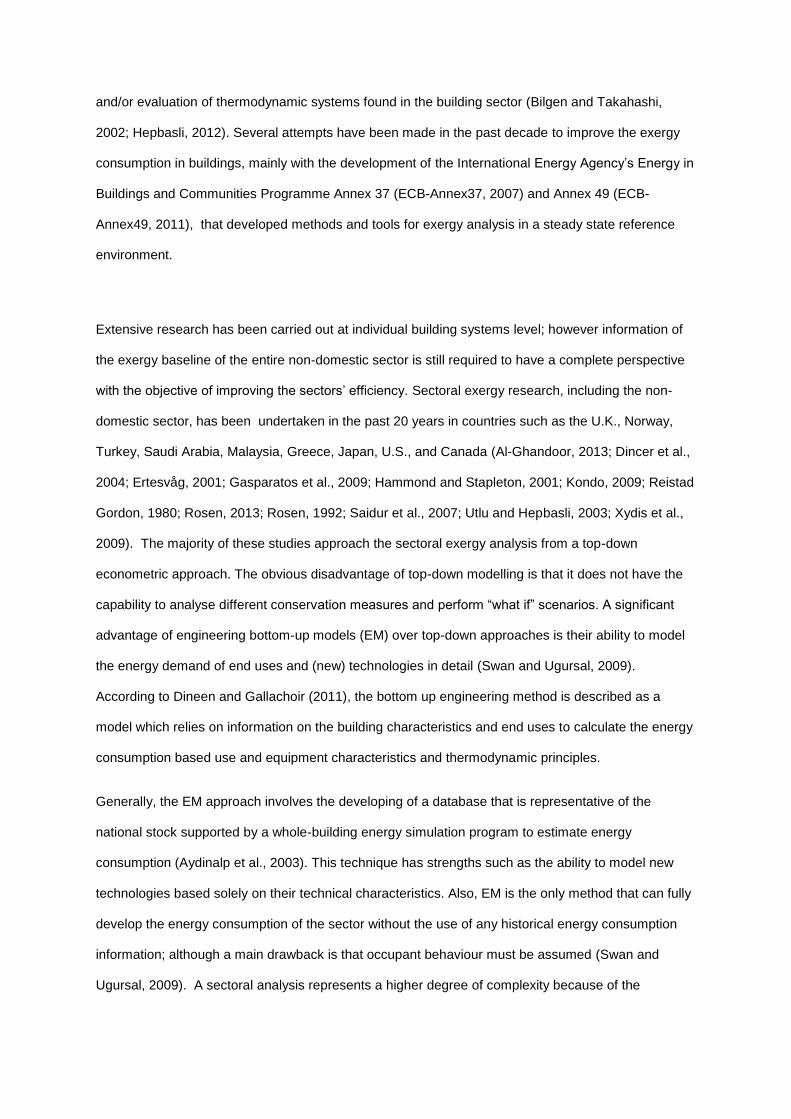
Modelling the energy and exergy utilisation of the Mexican non-domestic sector: A study by climatic regions
Iván García Kerdana,*, David Morillón Gálvezb, Rokia Raslanc, Paul Ruyssevelta
a Energy Institute, University College London, 14 Upper Woburn Place, London WC1H 0NN, UK b Departamento de Mecánica y Energía, Instituto de Ingeniería, Universidad Nacional Autónoma de México, México c Bartlett School of Graduate Studies, University College London, 14 Upper Woburn Place, London WC1H 0NN, UK
Abstract
This paper presents the development of a bottom-up stock model to perform a holistic energy study of
the Mexican non-domestic sector. The current energy and exergy flows are shown with a
categorisation by climatic regions to understand the impact of local characteristics on regional
efficiencies. Due to limited data currently available, the study is supported with the development of a
detailed archetype-based stock model using EnergyPlus as a first law analysis tool combined with an
exergy analysis method developed by Dincer et al. (2004). Twenty-one reference models were
created to estimate the electric and gas utilisation in the sector. The results showed a sectoral energy
and exergy annual input of 95.37 PJ and 94.28 PJ respectively. Regional exergy efficiencies were
found to be 17.80%, 16.56% and 23.17% for the hot-dry, hot-humid and temperate climates
respectively, with a national exergy efficiency of 19.70%. It is concluded that great potential for
improvements still exist, especially in the cases of space conditioning, lighting, refrigeration, and
cooking where most exergy destructions occur. This method could serve to study the impact of large-
scale refurbishments and promote national regulations and standards for sustainable buildings in the
country taking into consideration energy and exergy indicators.
Keywords: Energy analysis, Exergy analysis, Bottom-up model, Stock modelling, Non-
domestic sector, Mexico.
*Corresponding author at: Energy Institute, University College London, United Kingdom. Tel: +44 (0) 7867798730
Research started at: Departamento de Mecánica y Energía, Instituto de Ingeniería, Universidad Nacional Autónoma de México, México
E-mail address: [email protected] (I. Garcia Kerdan)

1. Introduction
The constant development of “middle-income” countries represents a high environmental risk for
achieving world sustainability. Emerging markets, mainly represented by the BRICS Group (Brazil,
Russia, India, China, and South Africa) and the MITSK Group (Mexico, Indonesia, Turkey and South
Korea), constitute a main concern in terms of future energy supply security (Asif and Muneer, 2007;
Sadorsky, 2009). The current rates of economic development indicates increased energy demand at
all sectoral levels and could therefore represent a threat to achieving the global reduction objectives
for 2050 (IPCC, 2007). One of the most important sectors in terms of energy use and emissions is
the building sector. Worldwide, buildings account for 40% of the annual primary energy consumption
and up to 30% of all greenhouse gas (GHG) emissions related to energy use (UNEP-SBCI, 2009).
The thermodynamic analyses commonly undertaken in most common process found in the built
environment are still only based on the first law that states that energy neither can be created nor
consumed but only transformed. This represents both a challenge and a limitation to identifying
process’ inefficiencies for further improvements. The concept of energy efficiency through first law
analysis does not provide a real indicator on how nearly a system or a process approaches ideality as
this only identifies the losses of work and the effective use of a resource. In support of this concept,
the second law of thermodynamics states that every process where energy or matter is dispersed,
entropy is inevitable generated. This means that exergy (a measure of quality of energy or useful
work potential of energy) actually can be lost because of irreversibilities of a process. An exergy
analysis reveals the losses of available energy and thus represents the real inefficiencies of any
system. For this reason, the concept of exergy can be an essential method for policy making and
national standard design activities (Dincer, 2002). Initially, exergy analysis was only performed for
thermal plants, diesel engines, combined cycle operation, and combustion processes, and still it is a
fundamental tool in locating inefficiencies in industrial processes. But building systems operate also
as an exergy-entropy process; a building and its systems basically feeds on exergy, consumes
exergy, generates entropy and finally the generated entropy is disposed. Disposing of the generated
entropy from the system makes new room for feeding on new exergy and consuming it again, thus the
process cycles (Shukuya, 1994). Even though the 2nd law concept is well described in scientific
books, engineers and researchers still tend to neglect the use of this principle in the design, test
and/or evaluation of thermodynamic systems found in the building sector (Bilgen and Takahashi,
2002; Hepbasli, 2012). Several attempts have been made in the past decade to improve the exergy
consumption in buildings, mainly with the development of the International Energy Agency’s Energy in
Buildings and Communities Programme Annex 37 (ECB-Annex37, 2007) and Annex 49 (ECB-
Annex49, 2011), that developed methods and tools for exergy analysis in a steady state reference
environment.
Extensive research has been carried out at individual building systems level; however information of
the exergy baseline of the entire non-domestic sector is still required to have a complete perspective
with the objective of improving the sectors’ efficiency. Sectoral exergy research, including the non-
domestic sector, has been undertaken in the past 20 years in countries such as the U.K., Norway,
Turkey, Saudi Arabia, Malaysia, Greece, Japan, U.S., and Canada (Al-Ghandoor, 2013; Dincer et al.,
2004; Ertesvåg, 2001; Gasparatos et al., 2009; Hammond and Stapleton, 2001; Kondo, 2009; Reistad
Gordon, 1980; Rosen, 2013; Rosen, 1992; Saidur et al., 2007; Utlu and Hepbasli, 2003; Xydis et al.,
2009). The majority of these studies approach the sectoral exergy analysis from a top-down
econometric approach. The obvious disadvantage of top-down modelling is that it does not have the
capability to analyse different conservation measures and perform “what if” scenarios. A significant
advantage of engineering bottom-up models (EM) over top-down approaches is their ability to model
the energy demand of end uses and (new) technologies in detail (Swan and Ugursal, 2009).
According to Dineen and Gallachoir (2011), the bottom up engineering method is described as a
model which relies on information on the building characteristics and end uses to calculate the energy
consumption based use and equipment characteristics and thermodynamic principles.
Generally, the EM approach involves the developing of a database that is representative of the
national stock supported by a whole-building energy simulation program to estimate energy
consumption (Aydinalp et al., 2003). This technique has strengths such as the ability to model new
technologies based solely on their technical characteristics. Also, EM is the only method that can fully
develop the energy consumption of the sector without the use of any historical energy consumption
information; although a main drawback is that occupant behaviour must be assumed (Swan and
Ugursal, 2009). A sectoral analysis represents a higher degree of complexity because of the
necessity of illustrate an entire stock in a few representative models. Single building modelling is
useful in assessing the performance of a particular building; on the other hand, stock models are
essential in informing national and regional policy addressing climate change, energy savings and the
reduction of carbon emissions. From a review of related literature in the field, it can be noted that so
far no study on sectoral energy/exergy analysis in Mexico has been developed. In addition, a large
gap of data and information about the energy consumption in buildings, especially in the non-
domestic sector exists in Mexico. To address this gap, the objective of this study is to provide
information of end use energy use data and exergy indicators of the current situation (2014) of the
non-domestic sector. These outputs could, in theory, lead to programs focused on energy efficiency
under an energetic and exergetic approach. In this study, energy and exergy performance by end use
in several climatic regions of Mexico are presented with the aim to analyze the impact of local climate
on energy use and exergy destruction of the sector (Dovjak et al., 2010).
Nomenclature
Symbol Description Units
EUI Energy Use Intensity [kWh/m²-year]
T0 Reference temperature [K]
Tp Product temperature [K]
Qp Heat product [J]
We Work (electric) [J]
COP Coefficient of Performance [J]/[J]
η Energy efficiency or first law efficiency [%]
ψ Exergy efficiency or second law efficiency [%]
qfuel quality factor of an energy source [ - ]
fi fraction of total utilization of an end-use [%]
2. Case study: Mexico and its non-domestic sector
Mexico is located between the 32° and 14° north latitudes and 86° and 118° west longitudes
comprising a total surface of almost 2 million km². The country has a very diverse climate, where hot
climate predominates with several types of sub-climates. Basically Mexico can be divided into a

tropical and a temperate zone; but the relief characteristics of the territory together with the large
oceans that surround the country it greatly influence the configuration map of the climates. In this
study the country has been segregated into 3 main climates: hot-dry, hot-humid and temperate (Fig.
1).
[Fig. 1. about here]
Fig. 1. Main climatic regions in Mexico
Mexican buildings are responsible for 19% of the national energy utilization and 12% of the total
emissions of the country (de Buen, 2009). In particular, the consumption of electricity and gas
represents 31% and 38% respectively of the national consumption. According to the National Energy
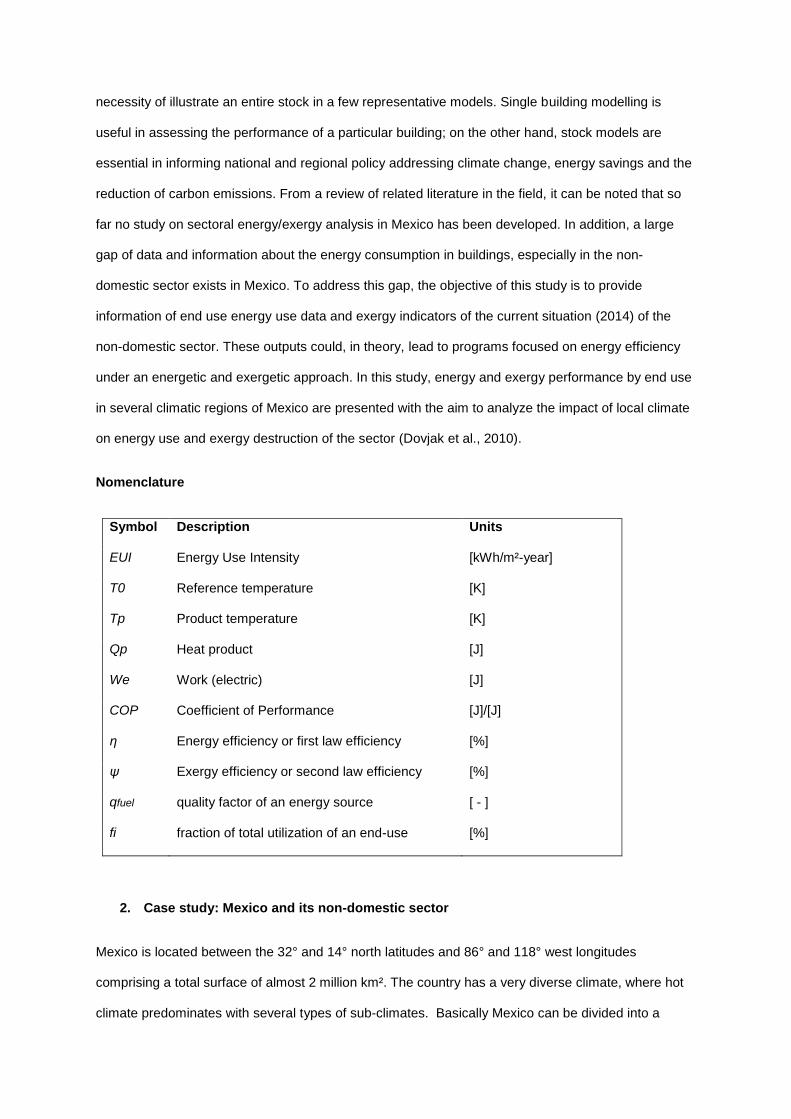
Balance (SENER, 2013), the “commercial and service” sector mainly uses gas and electricity to meet
its end use demands, representing 95% of the total use of resources in the sector (Fig.2).
[Fig. 2. about here]
Fig. 2. Share of fuel supply of the Mexican non-domestic sector
2.1 An overview of the Mexican non-domestic sector energy use
Recent studies show that the National Energy Balance highly underestimates the non-domestic sector
energy use as it does not reflect an accurate energy utilisation of the sector. The main problem is in
the inappropriate tariff allocations done by the public electric company, where all buildings above100
kW of power installed are considered as industrial buildings (de Buen, 2009). Also, data on floor area,
number of buildings, and energy use by building or by end use is very limited and dispersed. The only
detailed information on energy use (only electricity) by building type that does exist originates from
energy audits undertaken by the Mexican Electric Energy Saving Trust (Fideicomiso para el Ahorro
de Energía Eléctrica) (FIDE, 2011). These audits are related to energy efficiency projects undertaken
by the organization in the past 20 years. Based on these audits, seven different types of non-domestic
buildings and seven types of end uses can be identified (Table 1).
[Table 1 about here]
Table 1 Characterization of the Mexican non-domestic buildings
Types of buildings Types of end-uses
Hotels HVAC
Offices Lighting
Solar2%
LGP47%
Diesel3%
Natural Gas8%
Electricity 40%
Schools Refrigeration
Hospitals Lifts and Pumps
Restaurants Internal Equipment
Shopping Centres Cooking
Supermarkets Water Heating
The use of the abovementioned classification in this study will allow the presentation of more complex
outcomes than those presented in previous investigations of this nature in Mexico.
3. Methodology and data sources
Despite the limited availability of data on energy use by type of building in the country, a limited but
highly detailed database of end-use information for each type of building was compiled. This
information was derived from the audits carried out by FIDE in the last decade and is the only
information available in the country. It is important to note that while these cases might not be
considered statistically representative of the sector, this limitation was overcome by performing a
detailed building physics simulation. The aim was of estimating a baseline on electric and gas
demand of each type of non-domestic building located in the three different climates of the country.
Sector modelling requires a great deal of information on the built form, construction materials,
installed building services and the activities carried out in buildings and premises, as well as an in-
depth understanding of the dynamics of non-domestic building energy use (Bruhns, 2007). The
following section presents the development of the modelling framework and discusses its limitations.
3.1 Development of the Mexican non-domestic energy/exergy (MEN-DEEX) model
3.1.1 Archetypes development and assumptions
In developing the MEN-DEEX model, an archetypal simulation model approach was utilised. This
approach generalises the characteristics of a particular building type, and represents variability in the
building stock by parameterising construction elements, components, design features, and
occupancy/usage patterns (Korolija et al., 2013). It is important to note that the main objective of this
exercise was not to simulate each building in the sector, but to create archetypes that capture the
most common characteristics of each subsector with the intention of obtaining average energy
consumption patterns. The basis of the bottom-up archetype approach is to calculate the energy
consumption of a set of archetype buildings using the engineering method, i.e. based on technical
factors like the floor area, glazing area, U-value of walls, etc., and then using statistical methods (e.g.
extrapolation) to give the consumption for the sector as a whole (Dineen and Gallachoir, 2011). Also,
there are particularly helpful in stock aggregation, and can be used to make future energy projections
at a sectoral level (Famuyibo et al., 2012). The method used to determine the consumption patterns
of the different types of buildings is similar to that described in Huang and Broderick (2000) and
Griffith and Crawley (2006), however minor changes were introduced in order to adapt MEN-DEEX
model to the limitations of current data available for the Mexican stock.
a) Data Sources
To develop the archetypes, key variables that impact energy use were identified from the literature
(Famuyibo et al., 2012). These were then combined with data on installed power by facility and
installed power by end-use surveyed from the 120 FIDE case studies representing almost 1.75 million
m² of constructed surface. Also, additional data on number of floors, schedules, number of people,
activities and technical information about internal equipment was extracted from these cases. For
missing data, information from current national and international energy standards for energy
efficiency in buildings such as standards related to the envelope, HVAC systems, motors, and lighting
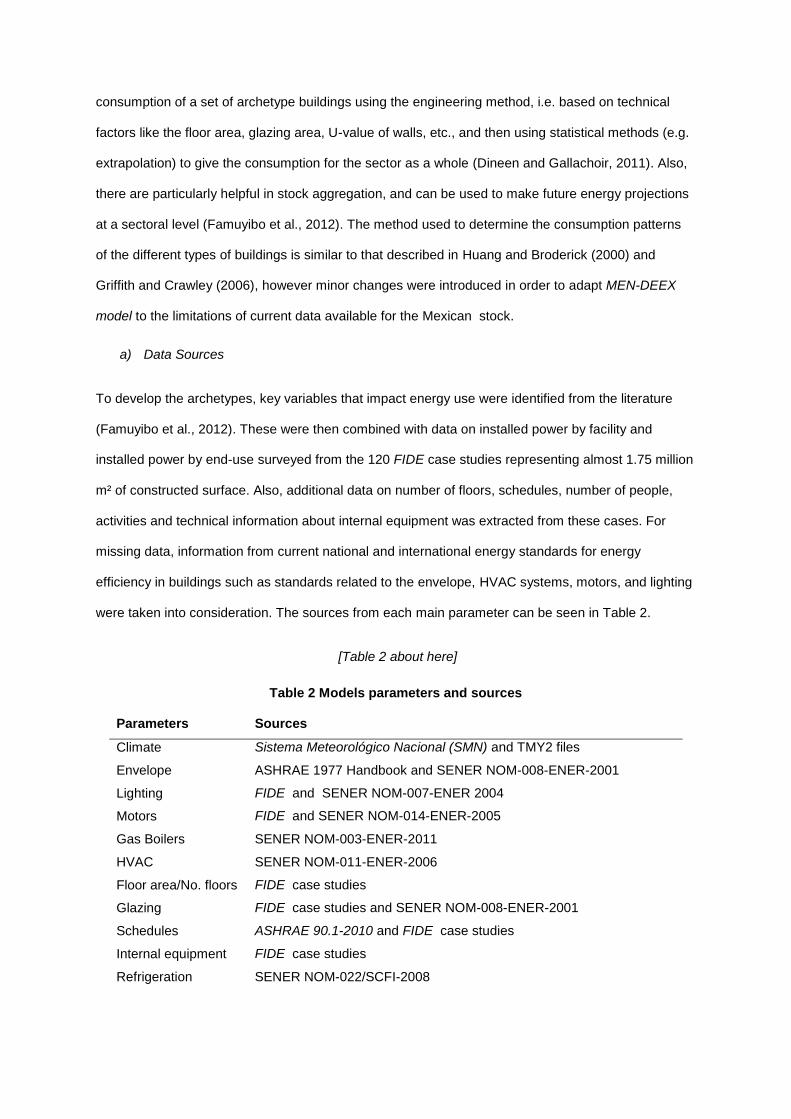
were taken into consideration. The sources from each main parameter can be seen in Table 2.
[Table 2 about here]
Table 2 Models parameters and sources
Parameters Sources
Climate Sistema Meteorológico Nacional (SMN) and TMY2 files
Envelope ASHRAE 1977 Handbook and SENER NOM-008-ENER-2001
Lighting FIDE and SENER NOM-007-ENER 2004
Motors FIDE and SENER NOM-014-ENER-2005
Gas Boilers SENER NOM-003-ENER-2011
HVAC SENER NOM-011-ENER-2006
Floor area/No. floors FIDE case studies
Glazing FIDE case studies and SENER NOM-008-ENER-2001
Schedules ASHRAE 90.1-2010 and FIDE case studies
Internal equipment FIDE case studies
Refrigeration SENER NOM-022/SCFI-2008

b) Building size, form, and fenestration
The 120 buildings from the FIDE Cases were virtually surveyed by using a Google Maps Area
Calculator Tool (Daft Logic, 2014) with the intention to calculate the buildings footprint average. Also,
Google Street View (Google, 2014) was used to obtain characteristics such as floor to floor height and
fenestration percentage. In the case of the buildings geometry and to simplify the modelling exercise,
the models are represented by rectangular forms.
c) Envelope characteristics
Assuming that a large part of current buildings were constructed in the last two decades of the last
century, the fabric values were taken from a former ASHRAE Guide (ASHRAE, 1977) and supported
with the national building regulation NOM-008-ENER-2011. It was considered that all models façades
characteristics have the same levels of U-values, infiltration, type of glazing (single) and G-values
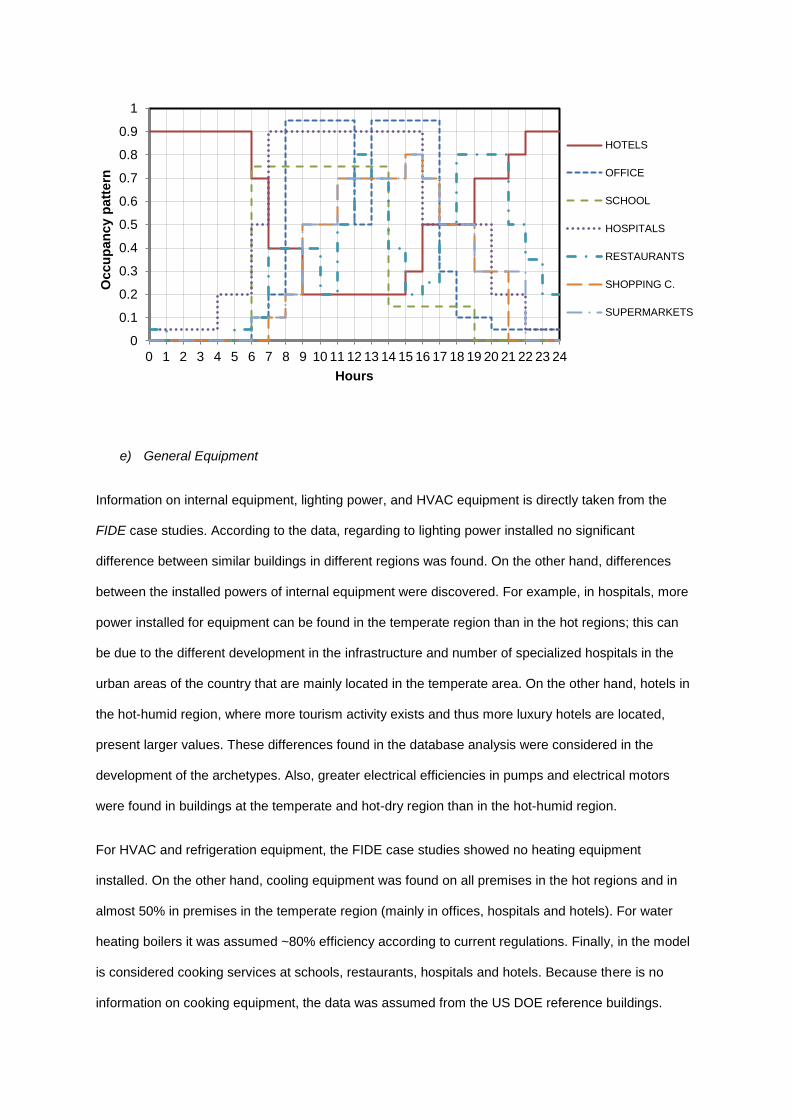
d) Schedules, Occupancy and Internal Gains
Schedules, occupancy patterns, and internal gains from people have a large effect on the modelling
outputs. For this study we referred to the ASHRAE 90.1-2010 (ASHRAE, 2010) which includes
standardized occupancy diversity factors for different building types. Also, the models were supported
with information taken from the U.S. Department of Energy (DOE) commercial reference buildings
(Deru et al., 2011). As an example of the diversity of the models, a typical weekday occupancy from
the studied buildings can be seen Fig.3.
[Fig. 3. about here]
Fig. 3. Weekday typical occupancy patterns in non-domestic buildings
e) General Equipment
Information on internal equipment, lighting power, and HVAC equipment is directly taken from the
FIDE case studies. According to the data, regarding to lighting power installed no significant
difference between similar buildings in different regions was found. On the other hand, differences
between the installed powers of internal equipment were discovered. For example, in hospitals, more
power installed for equipment can be found in the temperate region than in the hot regions; this can
be due to the different development in the infrastructure and number of specialized hospitals in the
urban areas of the country that are mainly located in the temperate area. On the other hand, hotels in
the hot-humid region, where more tourism activity exists and thus more luxury hotels are located,
present larger values. These differences found in the database analysis were considered in the
development of the archetypes. Also, greater electrical efficiencies in pumps and electrical motors
were found in buildings at the temperate and hot-dry region than in the hot-humid region.
For HVAC and refrigeration equipment, the FIDE case studies showed no heating equipment
installed. On the other hand, cooling equipment was found on all premises in the hot regions and in
almost 50% in premises in the temperate region (mainly in offices, hospitals and hotels). For water
heating boilers it was assumed ~80% efficiency according to current regulations. Finally, in the model
is considered cooking services at schools, restaurants, hospitals and hotels. Because there is no
information on cooking equipment, the data was assumed from the US DOE reference buildings.
0
0.1
0.2
0.3
0.4
0.5
0.6
0.7
0.8
0.9
1
0 1 2 3 4 5 6 7 8 9 10 11 12 13 14 15 16 17 18 19 20 21 22 23 24
Occu
pan
cy p
att
ern
Hours
HOTELS
OFFICE
SCHOOL
HOSPITALS
RESTAURANTS
SHOPPING C.
SUPERMARKETS
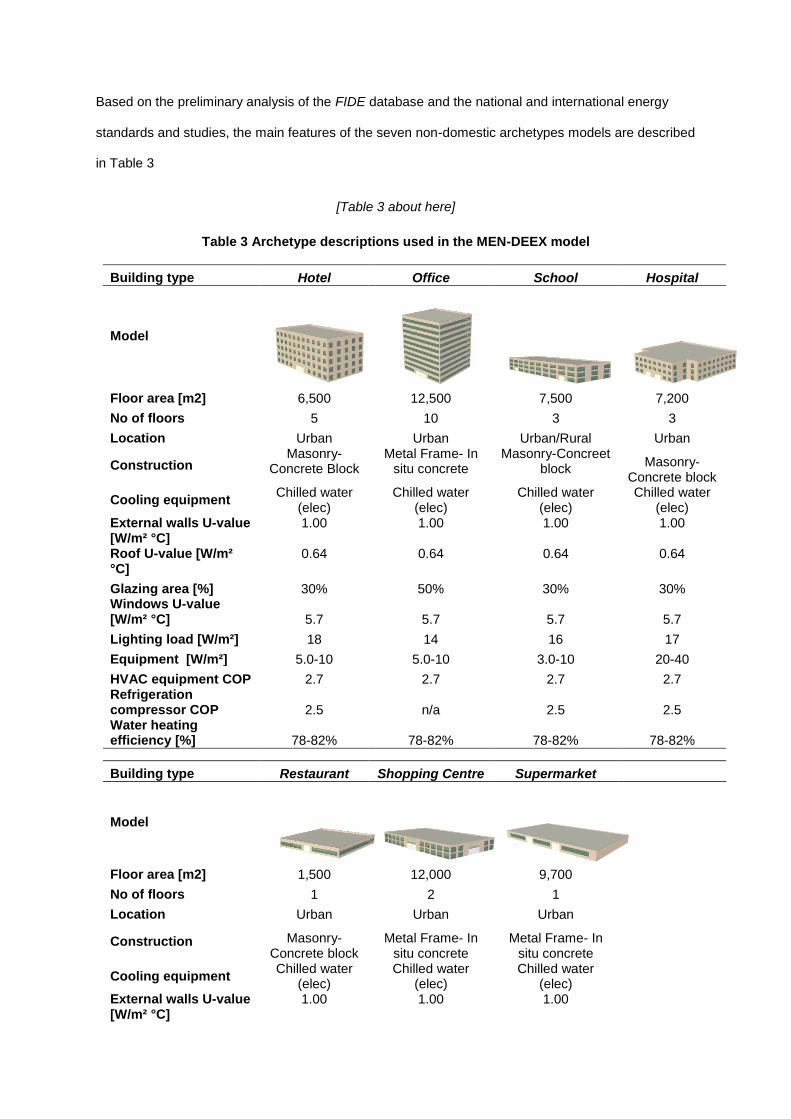
Based on the preliminary analysis of the FIDE database and the national and international energy
standards and studies, the main features of the seven non-domestic archetypes models are described
in Table 3
[Table 3 about here]
Table 3 Archetype descriptions used in the MEN-DEEX model
Building type Hotel Office School Hospital
Model
Floor area [m2] 6,500 12,500 7,500 7,200
No of floors 5 10 3 3
Location Urban Urban Urban/Rural Urban
Construction Masonry-
Concrete Block Metal Frame- In
situ concrete Masonry-Concreet
block Masonry-
Concrete block
Cooling equipment Chilled water
(elec) Chilled water
(elec) Chilled water
(elec) Chilled water
(elec) External walls U-value [W/m² °C]
1.00 1.00 1.00 1.00
Roof U-value [W/m² °C]
0.64 0.64 0.64 0.64
Glazing area [%] 30% 50% 30% 30% Windows U-value [W/m² °C] 5.7 5.7 5.7 5.7
Lighting load [W/m²] 18 14 16 17
Equipment [W/m²] 5.0-10 5.0-10 3.0-10 20-40
HVAC equipment COP 2.7 2.7 2.7 2.7 Refrigeration compressor COP 2.5 n/a 2.5 2.5 Water heating efficiency [%] 78-82% 78-82% 78-82% 78-82%
Building type Restaurant Shopping Centre Supermarket
Model
Floor area [m2] 1,500 12,000 9,700
No of floors 1 2 1
Location Urban Urban Urban
Construction Masonry-Concrete block
Metal Frame- In situ concrete
Metal Frame- In situ concrete
Cooling equipment Chilled water
(elec) Chilled water
(elec) Chilled water
(elec) External walls U-value [W/m² °C]
1.00 1.00 1.00

Roof U-value [W/m² °C]
0.64 0.64 0.64
Glazing area [%] 30% 50% 10% Windows U-value [W/m² °C] 5.7 5.7 5.7
Lighting load [W/m²] 16 20 20
Equipment [W/m²] 5 8 8
HVAC equipment COP 2.7 2.7 2.7 Refrigeration compressor COP 2.5 n/a 2.5 Water heating efficiency [%] 78-82% 78-82% 78-82%
To simulate the energy use of the archetypes developed for this study, EnergyPlus (EnergyPlus,
2012) was selected as the calculation tool for first law (energy) analysis. This software is a dynamic
simulation tool based on a number of modules that work together to calculate the energy
requirements of a building with the potential to model a variety of systems and energy sources. It
implements this by simulating the building and associated energy systems when they are exposed to
different environmental and operating conditions. EnergyPlus calculated the cooling loads necessary
to maintain thermal control setpoint as well as the total electric and thermal energy use by building
type and by end use. To model the HVAC, refrigeration and, water heating equipment the function
“Autosize” was applied. As stated before the COPs and efficiencies were taken from national
regulations.
3.1.2 Weather data and other regional assumptions
The weather data was taken from the TMY2 format weather files used in the energy simulation
process and validated against the national average from climatic data from CONAGUA-SMN
(CONAGUA, Accessed: 26 April 2014). These files allowed us to perform hourly simulations
considering all the dynamic interactions between the building and the outside weather throughout the
year. The representative cities chosen for this study were Mexico City (temperate climate), Acapulco
(hot-humid climate), and Monterrey (hot-dry climate) (Fig. 4).
[Fig. 4. about here]
Fig. 4. Daily Average Temperature for Mexico City, Acapulco, and Monterrey (TMY2 weather
files)
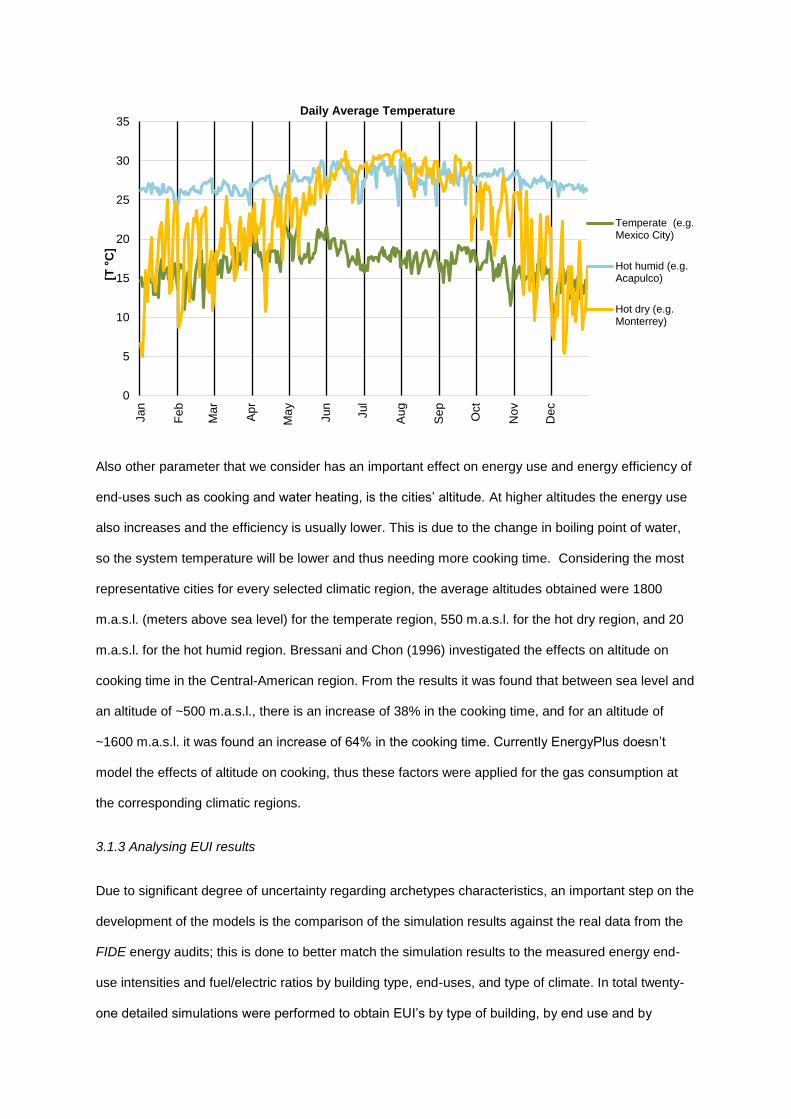
Also other parameter that we consider has an important effect on energy use and energy efficiency of
end-uses such as cooking and water heating, is the cities’ altitude. At higher altitudes the energy use
also increases and the efficiency is usually lower. This is due to the change in boiling point of water,
so the system temperature will be lower and thus needing more cooking time. Considering the most
representative cities for every selected climatic region, the average altitudes obtained were 1800
m.a.s.l. (meters above sea level) for the temperate region, 550 m.a.s.l. for the hot dry region, and 20
m.a.s.l. for the hot humid region. Bressani and Chon (1996) investigated the effects on altitude on
cooking time in the Central-American region. From the results it was found that between sea level and
an altitude of ~500 m.a.s.l., there is an increase of 38% in the cooking time, and for an altitude of
~1600 m.a.s.l. it was found an increase of 64% in the cooking time. Currently EnergyPlus doesn’t
model the effects of altitude on cooking, thus these factors were applied for the gas consumption at
the corresponding climatic regions.
3.1.3 Analysing EUI results
Due to significant degree of uncertainty regarding archetypes characteristics, an important step on the
development of the models is the comparison of the simulation results against the real data from the
FIDE energy audits; this is done to better match the simulation results to the measured energy end-
use intensities and fuel/electric ratios by building type, end-uses, and type of climate. In total twenty-
one detailed simulations were performed to obtain EUI’s by type of building, by end use and by
0
5
10
15
20
25
30
35
Jan
Fe
b
Ma
r
Ap
r
Ma
y
Jun
Jul
Au
g
Se
p
Oct
No
v
De
c
[T °
C]
Daily Average Temperature
Temperate (e.g.Mexico City)
Hot humid (e.g.Acapulco)
Hot dry (e.g.Monterrey)
climatic region. Because a comprehensive dynamical simulation was performed, hourly results were
obtained from the simulation process. The normalized energy uses from the first law analysis are
shown in Table 4 and Fig. 5. These disaggregated results represent the first instance that such
outputs have been produced for Mexican non-domestic stock.
[Table 4 about here]
Table 4 EUI [kWh/m2-year] by type of building, end-use and climatic region
ELECTRICITY GAS
Climate Type of buildings
HVAC Lightin
g Refrigeratio
n Lifts and Pumps
Equipment Cooking Water
Heating
EUI [kWh/m²-year]
Temperate
hotels 83.6 48.2 3.0 5.0 15.5 32.1 35.1 222.5
offices 27.3 58.9 0.0 13.6 9.8 0.0 2.4 112.0
schools 2.4 27.6 0.8 1.2 8.5 15.5 6.0 61.9
hospitals 53.8 42.2 40.2 13.5 68.8 27.6 7.6 253.8
restaurants 41.8 83.7 64.7 0.0 20.1 218.1 47.8 476.1
shopping c. 24.3 53.8 0.0 15.4 22.4 0.0 1.2 117.1
supermarkets 18.2 64.7 213.9 0.0 38.0 21.8 1.5 358.0 hotels 170.3 47.7 11.7 28.8 22.5 19.6 21.5 322.1
Hot-humid
offices 130.4 44.0 0.0 16.8 8.5 0.0 0.7 200.4
schools 49.2 40.3 0.8 5.0 2.9 9.5 4.0 111.7
hospitals 238.7 41.0 43.5 34.9 35.3 16.8 5.2 415.5
restaurants 164.4 77.5 76.9 0.0 17.5 133.0 33.9 503.1
shopping c. 135.0 57.9 0.0 18.2 18.2 0.0 1.2 230.4
supermarkets 45.6 64.6 294.9 0.0 38.0 13.3 1.5 457.9
hotels 179.7 62.3 15.0 31.9 36.5 27.0 26.9 379.4 offices 103.0 39.4 0.0 18.6 6.8 0.0 0.9 168.7
Hot-dry
schools 85.2 53.7 0.8 14.9 15.2 13.1 4.9 187.7
hospitals 327.2 39.0 47.2 22.9 24.0 23.2 6.2 489.7
restaurants 161.2 77.5 71.8 0.0 16.2 183.5 39.3 549.5
shopping c. 97.2 59.2 0.0 6.3 19.2 0.0 1.2 183.1
supermarkets 36.5 64.6 264.1 0.0 38.0 18.4 1.3 422.9
[Fig.5. about here]
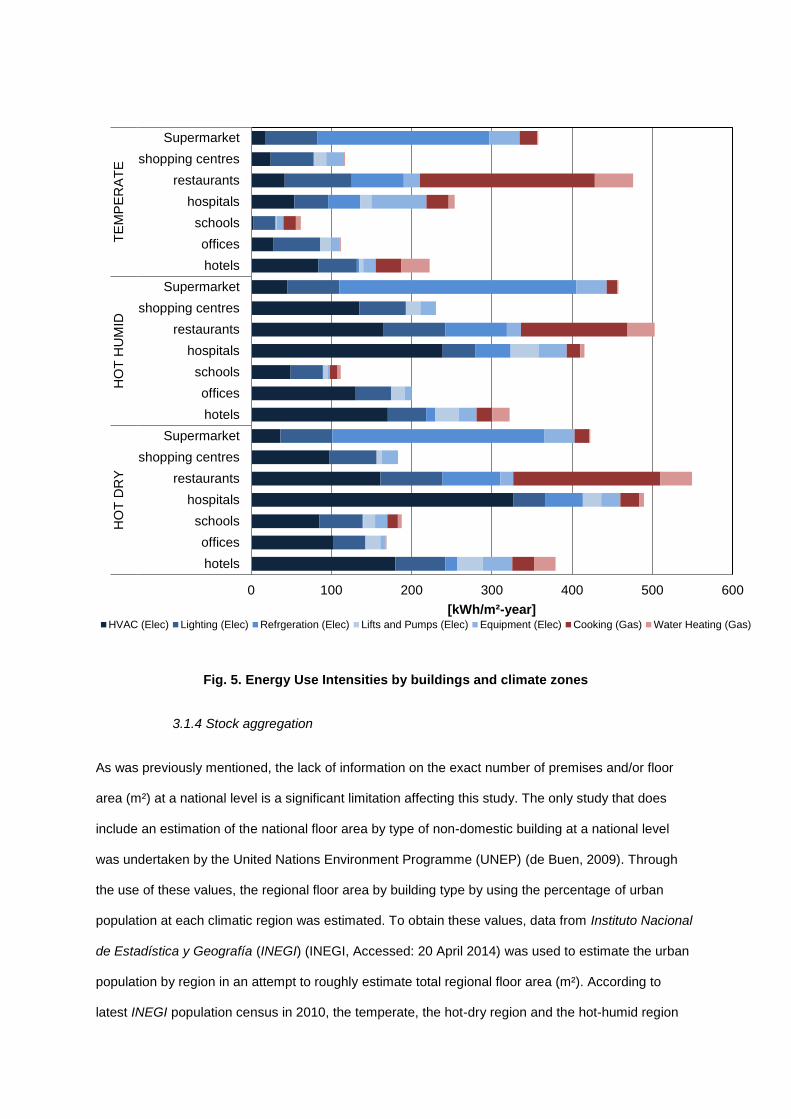
Fig. 5. Energy Use Intensities by buildings and climate zones
3.1.4 Stock aggregation
As was previously mentioned, the lack of information on the exact number of premises and/or floor
area (m²) at a national level is a significant limitation affecting this study. The only study that does
include an estimation of the national floor area by type of non-domestic building at a national level
was undertaken by the United Nations Environment Programme (UNEP) (de Buen, 2009). Through
the use of these values, the regional floor area by building type by using the percentage of urban
population at each climatic region was estimated. To obtain these values, data from Instituto Nacional
de Estadística y Geografía (INEGI) (INEGI, Accessed: 20 April 2014) was used to estimate the urban
population by region in an attempt to roughly estimate total regional floor area (m²). According to
latest INEGI population census in 2010, the temperate, the hot-dry region and the hot-humid region
0 100 200 300 400 500 600
hotels
offices
schools
hospitals
restaurants
shopping centres
Supermarket
hotels
offices
schools
hospitals
restaurants
shopping centres
Supermarket
hotels
offices
schools
hospitals
restaurants
shopping centres
Supermarket
HO
T D
RY
HO
T H
UM
IDT
EM
PE
RA
TE
[kWh/m²-year]HVAC (Elec) Lighting (Elec) Refrgeration (Elec) Lifts and Pumps (Elec) Equipment (Elec) Cooking (Gas) Water Heating (Gas)
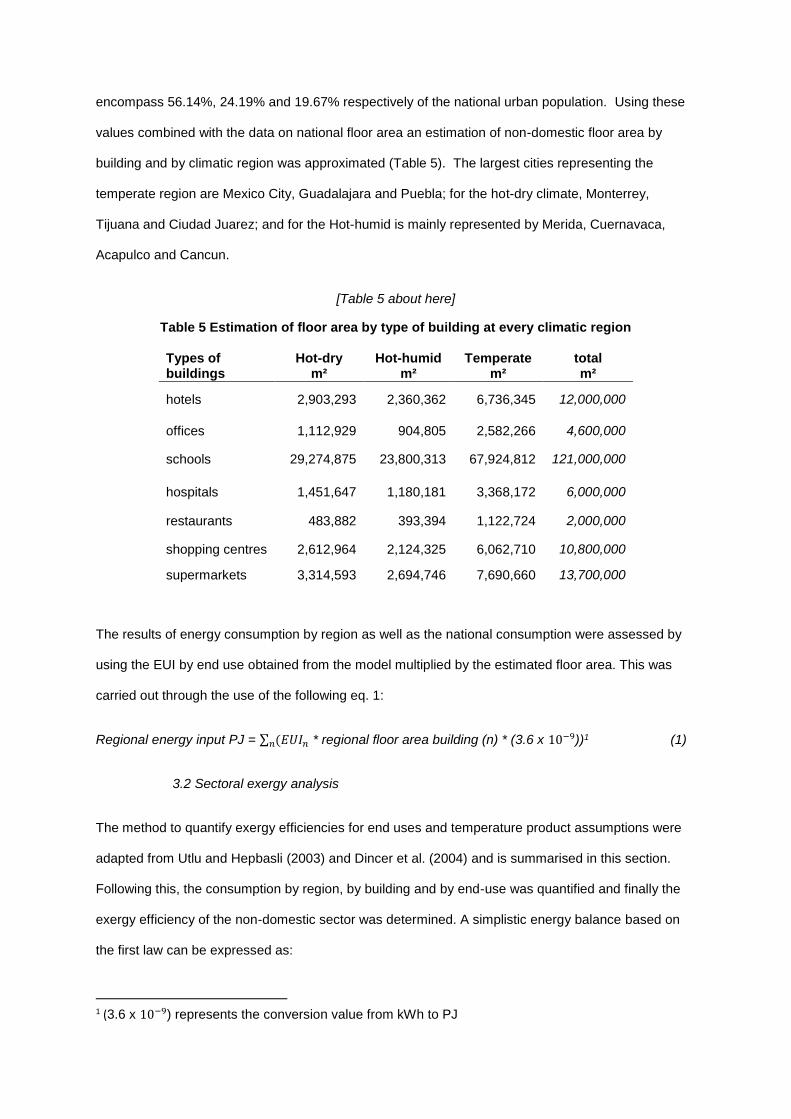
encompass 56.14%, 24.19% and 19.67% respectively of the national urban population. Using these
values combined with the data on national floor area an estimation of non-domestic floor area by
building and by climatic region was approximated (Table 5). The largest cities representing the
temperate region are Mexico City, Guadalajara and Puebla; for the hot-dry climate, Monterrey,
Tijuana and Ciudad Juarez; and for the Hot-humid is mainly represented by Merida, Cuernavaca,
Acapulco and Cancun.
[Table 5 about here]
Table 5 Estimation of floor area by type of building at every climatic region
Types of buildings
Hot-dry m²
Hot-humid m²
Temperate m²
total m²
hotels 2,903,293 2,360,362 6,736,345 12,000,000
offices 1,112,929 904,805 2,582,266 4,600,000
schools 29,274,875 23,800,313 67,924,812 121,000,000
hospitals 1,451,647 1,180,181 3,368,172 6,000,000
restaurants 483,882 393,394 1,122,724 2,000,000
shopping centres 2,612,964 2,124,325 6,062,710 10,800,000
supermarkets 3,314,593 2,694,746 7,690,660 13,700,000
The results of energy consumption by region as well as the national consumption were assessed by
using the EUI by end use obtained from the model multiplied by the estimated floor area. This was
carried out through the use of the following eq. 1:
Regional energy input PJ = ∑ (𝐸𝑈𝐼𝑛𝑛 * regional floor area building (n) * (3.6 x 10⁻⁹))1 (1)
3.2 Sectoral exergy analysis
The method to quantify exergy efficiencies for end uses and temperature product assumptions were
adapted from Utlu and Hepbasli (2003) and Dincer et al. (2004) and is summarised in this section.
Following this, the consumption by region, by building and by end-use was quantified and finally the
exergy efficiency of the non-domestic sector was determined. A simplistic energy balance based on
the first law can be expressed as:
1 (3.6 x 10⁻⁹) represents the conversion value from kWh to PJ
Energy input – Energy output = Energy accumulation (2)
Conversely, exergy is the part of energy that has the potential to be fully converted into mechanical
work due to interactions with the environment, and this will occur until the system and the
environment reach a “dead-state”. If a reversible process takes place then exergy is conserved, but
exergy is always degraded in an irreversible process. This concept can be expressed as:
Exergy input – Exergy output – Exergy consumption = Exergy accumulation (3)
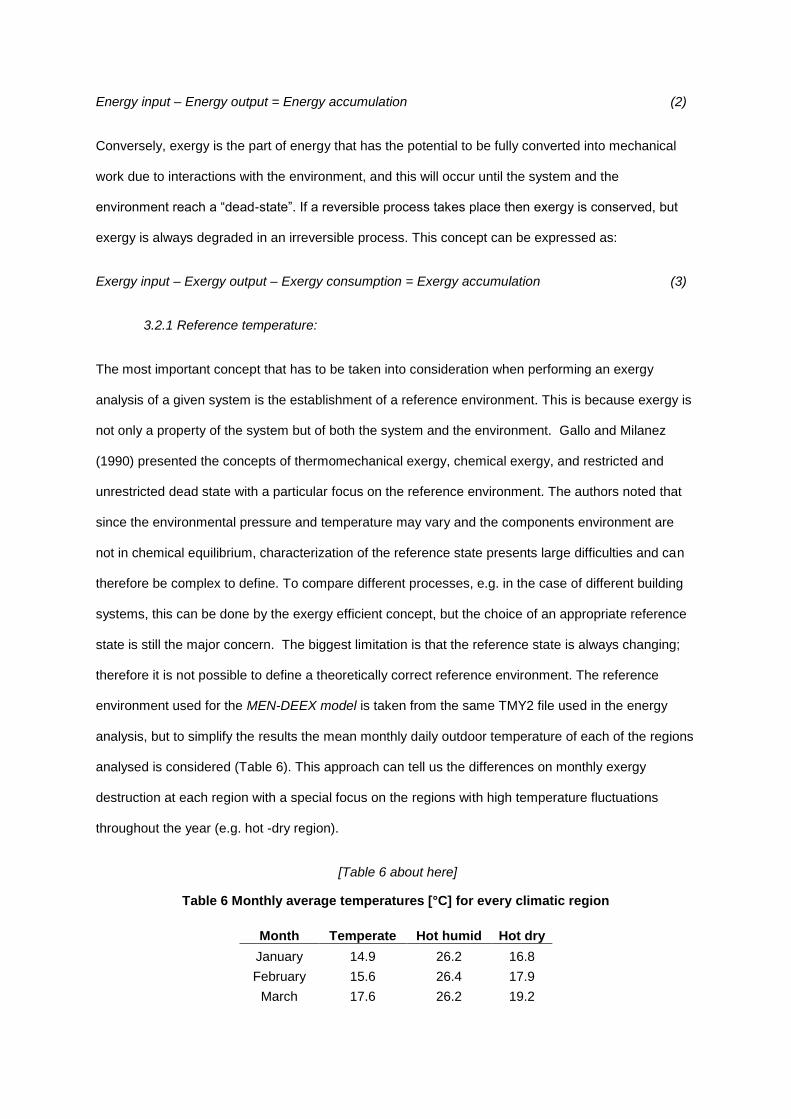
3.2.1 Reference temperature:
The most important concept that has to be taken into consideration when performing an exergy
analysis of a given system is the establishment of a reference environment. This is because exergy is
not only a property of the system but of both the system and the environment. Gallo and Milanez
(1990) presented the concepts of thermomechanical exergy, chemical exergy, and restricted and
unrestricted dead state with a particular focus on the reference environment. The authors noted that
since the environmental pressure and temperature may vary and the components environment are
not in chemical equilibrium, characterization of the reference state presents large difficulties and can
therefore be complex to define. To compare different processes, e.g. in the case of different building
systems, this can be done by the exergy efficient concept, but the choice of an appropriate reference
state is still the major concern. The biggest limitation is that the reference state is always changing;
therefore it is not possible to define a theoretically correct reference environment. The reference
environment used for the MEN-DEEX model is taken from the same TMY2 file used in the energy
analysis, but to simplify the results the mean monthly daily outdoor temperature of each of the regions
analysed is considered (Table 6). This approach can tell us the differences on monthly exergy
destruction at each region with a special focus on the regions with high temperature fluctuations
throughout the year (e.g. hot -dry region).
[Table 6 about here]
Table 6 Monthly average temperatures [°C] for every climatic region
Month Temperate Hot humid Hot dry
January 14.9 26.2 16.8
February 15.6 26.4 17.9
March 17.6 26.2 19.2
April 18.6 26.9 20.9
May 19.1 28.1 25.1
June 18.6 28.3 28.4
July 17.6 28.4 30.2
August 17.4 28.1 29.0
September 17.5 28.0 27.7
October 16.3 28.1 23.9
November 15.6 27.4 19.5
December 13.6 26.7 12.9
For the exergy analysis, apart from the aforementioned reference temperatures (𝑇0) it was also
necessary to know the product temperature (𝑇𝑝) of all the processes (presented in the next section),
and the quality of the main energy sources (qfuel). The exergy values or quality from the energy
sources analysed were assumed to be 0.92 for gas (natural gas and LPG) and 1.0 for electricity.
3.2.2. Energy and exergy efficiencies
As said in the last section, the exergy analysis was broken by month by using the monthly daily
average temperature. The energy and exergy efficiencies for the main end uses identified in the
Mexican non-domestic sector are based in the following definitions:
η = energy in products / total energy input (4)
ψ = exergy in products / total exergy input (5)
If the energy quality factor of fuels are assumed to be 1.0 (like in the case of electricity), exergy
efficiencies can be defined as a function of energy efficiency (Dincer et al., 2004). The following
section presents the exergy efficiency formulas used for electrical-based and gas-based end-uses.
3.2.2.1 Efficiencies for electric-based end uses
Space conditioning (Cooling)
Based on the audits performed by FIDE and the results from the energy modelling it is assumed that
the energy use for heating is 0; hence cooling represents the total demand for space conditioning.
The first law modelling results showed that the energy use at a regional level from space conditioning
represents 42.1%, 40.6% and 12.1% for the hot-dry, hot-humid and temperate climate respectively of
the regional energy demand. Nationally, cooling in the non-domestic sector represents 29.5% of the
total energy input. Although theoretically the energy efficiency is described in equation 6, the energy
efficiency values were obtained from EnergyPlus outputs.
𝜂𝑐𝑜𝑜𝑙𝑖𝑛𝑔 =𝑄𝑝
𝑊𝑒 (6)
The second law efficiency was calculated using the following equation:
𝜓𝑐𝑜𝑜𝑙𝑖𝑛𝑔(𝑡𝑘) = (1 − 𝑇0(𝑡𝑘)
𝑇𝑝𝑐𝑜𝑜𝑙𝑖𝑛𝑔(𝑡𝑘)
) ∗ 𝜂𝑐𝑜𝑜𝑙𝑖𝑛𝑔(𝑡𝑘) = (1 − 𝑇0(𝑡𝑘)
𝑇𝑝_𝑐𝑜𝑜𝑙𝑖𝑛𝑔(𝑡𝑘) ) ∗ 𝐶𝑂𝑃(𝑡𝑘) (7)
The reference temperatures (𝑇0) represent the regional monthly average (Table 6). 𝑇𝑝_𝑐𝑜𝑜𝑙𝑖𝑛𝑔 was
considered to be 23 °C (296.15 K) for all regions. The average COP or 𝜂𝑐𝑜𝑜𝑙𝑖𝑛𝑔 taken from the
simulation outputs and the results for monthly exergy efficiency can be seen in Table 7.
[Table 7 about here]
Table 7 Monthly average COP and exergy efficiency of cooling processes for every climatic
region
Temperate Hot-humid Hot-dry
Month Average
COP ψ
Average COP
ψ Average
COP ψ
January 3.4 9.3% 3.2 3.4% 2.5 5.2%
February 3.3 8.4% 3.2 3.7% 2.5 4.2%
March 3.3 6.0% 3.2 3.4% 2.4 3.1%
April 3.2 4.8% 3.2 4.1% 2.4 1.7%
May 3.2 4.2% 3.2 5.4% 2.3 1.6%
June 3.2 4.8% 3.1 5.6% 2.2 4.1%
July 3.3 5.9% 3.1 5.8% 2.2 5.3%
August 3.3 6.2% 3.2 5.5% 2.2 4.6%
September 3.3 6.1% 3.2 5.3% 2.3 3.6%
October 3.3 7.5% 3.2 5.5% 2.3 0.7%
November 3.3 8.4% 3.2 4.8% 2.5 2.9%
December 3.4 10.7% 3.2 4.0% 2.6 9.0%
In may seem that in months where the setpoint temperature is above the outdoor temperature (e.g. all
year for the temperate region, and 6 months for the hot dry region) the buildings will not require
cooling. But because a dynamic energy analysis was performed, hourly temperature fluctuations are
considered in the simulation where in some particular hours the outdoor temperature exceeds the
reference setpoint. Also, the model is considering the heat gains by people activity, lighting and
electrical equipment. Therefore, the energy analysis showed that in some moments when cooling
demand is presented even though the outside temperature is lower than the setpoint is because of
the internal gains. In this case, loads will mainly be covered by ventilation, infiltration, transmission
and to a lesser extent by the artificial cooling; on the other hand, when outside is warmer than the
inside, the demand is mainly covered by the artificial cooling process. Hence, internal gains is the
main reason why cooling is needed almost every day of the year in the temperate region and in winter
season in the hot-dry region. To illustrate this, a comparison of monthly cooling demands between
regions for a typical office building is shown in Figure 6.
[Fig. 6. about here]
Fig. 6 Regional monthly cooling demand for typical office building in Mexico
In energy terms when a cooling demand is presented a required energy output from the system is
required. But In exergy terms a cooling load can represent a demanded exergy input or exergy output,
depending on the reference temperature. When the outside temperature is higher (e.g. hot humid),
0
100
200
300
400
500
600
700
800
[GJ]
Temperate
Hot-Humid
Hot-Dry
input exergy is required to remove the heat. On the other hand, when outside is cooler and still a
cooling demand exist, the building has an unwanted warm exergy inside the building and thus it has
to be removed (ECB-Annex 49, 2009). In Table 7 this is represented by the underlined exergy
efficiency results. The interesting part of this analysis is to show that in some regions in Mexico is
common to have cooling loads in both situations. This is a clear advantage of exergy analysis over
energy analysis, since it gives more insight and information about the energy processes.
Refrigeration
Refrigeration is not as representative as space conditioning but also has a large impact on total
energy use. Of the total energy use by region, this end use represents 10.8%, 15.3% and 17.7% for
the hot-dry, hot-humid and temperate climate respectively. Nationally, represents 14.7% of the total
energy input for the sector. The second law efficiency was calculated using equation 8.
𝜓𝑟𝑒𝑓(𝑡𝑘) = 𝜂𝑟𝑒𝑓(𝑡𝑘) ∗ ( 𝑇0(𝑡𝑘)
𝑇𝑝_𝑟𝑒𝑓𝑟(𝑡𝑘)− 1) = 𝐶𝑂𝑃𝑟𝑒𝑓(𝑡𝑘) ∗ (
𝑇0(𝑡𝑘)
𝑇𝑝_𝑟𝑒𝑓𝑟(𝑡𝑘)− 1) (8)
Both 𝐶𝑂𝑃𝑟𝑒𝑓 (or 𝜂𝑟𝑒𝑓) and the monthly reference temperatures represented by the internal
environment of buildings are taken from the simulation outputs. Meanwhile 𝑇𝑝_𝑟𝑒𝑓𝑟 was considered to
be -8 °C (265.15 K) for all regions. The considered reference temperatures and monthly exergy
efficiency results for refrigeration can be seen in Table 8.
[Table 8 about here]
Table 8 Average internal temperature, monthly average COP and exergy efficiency of
refrigeration processes for every climatic region
Temperate Hot-humid Hot-dry
Month
Avg. Int.
Temp. [ºC]
Average COP ψ
Avg. Int.
Temp. [ºC]
Average COP ψ
Avg. Int.
Temp. [ºC]
Average COP ψ
January 19.5 1.9 20.1% 21.7 1.6 17.7% 20.0 1.9 19.6%
February 19.7 1.9 19.9% 21.7 1.6 17.6% 20.0 1.8 19.4%
March 20.0 1.8 19.5% 21.7 1.6 17.7% 20.3 1.8 19.2%
April 20.1 1.8 19.2% 21.8 1.6 17.5% 20.7 1.7 18.7%
May 20.4 1.8 19.2% 22.1 1.5 17.4% 21.7 1.6 18.0%
June 20.9 1.8 19.7% 22.5 1.5 17.6% 22.5 1.5 17.6%
July 21.0 1.8 20.1% 22.8 1.5 17.7% 22.8 1.5 17.4%
August 21.0 1.9 20.2% 22.7 1.5 17.7% 22.8 1.5 17.5%
September 20.6 1.8 19.9% 22.4 1.5 17.6% 22.4 1.5 17.7%
October 19.9 1.9 19.8% 22.1 1.5 17.4% 21.5 1.6 18.3%
November 19.6 1.9 19.9% 21.9 1.6 17.5% 20.5 1.8 19.2%
December 19.3 2.0 20.2% 21.8 1.6 17.6% 19.3 2.0 20.4%
Electrical equipment (Lighting, lifts and pumps, and internal equipment)
Not only does lighting consume a significant amount of energy in the country, it is also extremely
energy inefficient (𝜂𝑙𝑖𝑔ℎ𝑡≈ 20%). Of the total energy use by region, lighting represents 23.4%, 24.7%
and 31.4% for the hot-dry, hot-humid and temperate climate respectively. Nationally represents 27.0%
of the total energy input for the sector. As the electromagnetic radiation has similar energy and exergy
contents, the energy and exergy efficiencies of lighting are almost similar (Rosen and Bulucea, 2009).
Other electric end-uses such as motors and pumps, and miscellaneous equipment represent 4.4%
and 9.4% respectively of the national energy use in the non-domestic sector. Also, it is considered
that energy and exergy efficiency are similar to the conversion of electricity into high quality work.
The second law efficiency for electric-based equipment is defined as:
𝜓𝑒𝑙𝑒𝑐 ≈ 𝜂𝑒𝑙𝑒𝑐 (9)
For the analysis, lighting it is considered to have a constant monthly exergy efficiency of 18.1%. For
lift and pumps is considered 50%, and for internal equipment 70%.
3.2.2.2 Efficiencies for gas-based end uses
Water heating
The modelling results indicate that regional energy use for water heating from gas consumption
represents 2.7%, 2.9% and 6.9% for the hot-dry, hot-humid and temperate climates respectively. The
national energy use is estimated to be 4.4% of the total energy input. In this study it is assumed that
100% of water heating is produced by gas boilers with an efficiency (𝜂𝑊𝐻) of 78-82% according to
national regulations (SENER, 2011). Because of the higher altitudes, lower efficiencies are assumed
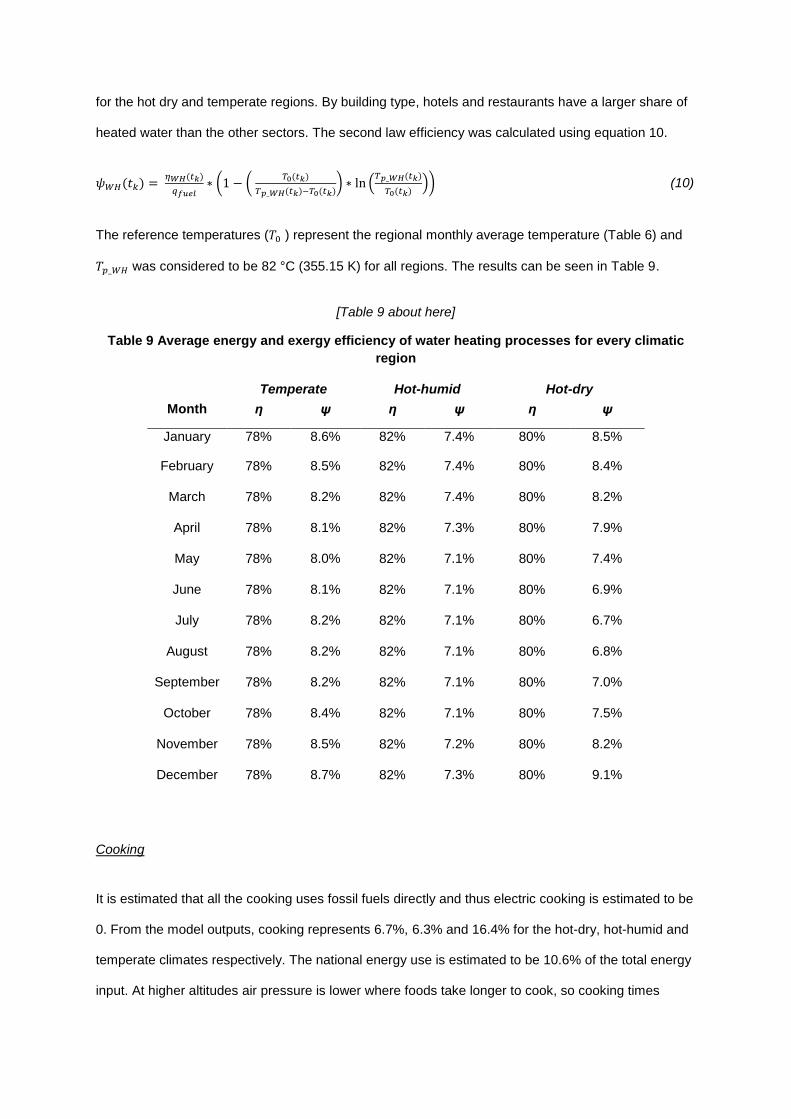
for the hot dry and temperate regions. By building type, hotels and restaurants have a larger share of
heated water than the other sectors. The second law efficiency was calculated using equation 10.
𝜓𝑊𝐻(𝑡𝑘) = 𝜂𝑊𝐻(𝑡𝑘)
𝑞𝑓𝑢𝑒𝑙∗ (1 − (
𝑇0(𝑡𝑘)
𝑇𝑝_𝑊𝐻(𝑡𝑘)−𝑇0(𝑡𝑘)) ∗ ln (
𝑇𝑝_𝑊𝐻(𝑡𝑘)
𝑇0(𝑡𝑘))) (10)
The reference temperatures (𝑇0 ) represent the regional monthly average temperature (Table 6) and
𝑇𝑝_𝑊𝐻 was considered to be 82 °C (355.15 K) for all regions. The results can be seen in Table 9.
[Table 9 about here]
Table 9 Average energy and exergy efficiency of water heating processes for every climatic
region
Temperate Hot-humid Hot-dry
Month η ψ η ψ η ψ
January 78% 8.6% 82% 7.4% 80% 8.5%
February 78% 8.5% 82% 7.4% 80% 8.4%
March 78% 8.2% 82% 7.4% 80% 8.2%
April 78% 8.1% 82% 7.3% 80% 7.9%
May 78% 8.0% 82% 7.1% 80% 7.4%
June 78% 8.1% 82% 7.1% 80% 6.9%
July 78% 8.2% 82% 7.1% 80% 6.7%
August 78% 8.2% 82% 7.1% 80% 6.8%
September 78% 8.2% 82% 7.1% 80% 7.0%
October 78% 8.4% 82% 7.1% 80% 7.5%
November 78% 8.5% 82% 7.2% 80% 8.2%
December 78% 8.7% 82% 7.3% 80% 9.1%
Cooking
It is estimated that all the cooking uses fossil fuels directly and thus electric cooking is estimated to be
0. From the model outputs, cooking represents 6.7%, 6.3% and 16.4% for the hot-dry, hot-humid and
temperate climates respectively. The national energy use is estimated to be 10.6% of the total energy
input. At higher altitudes air pressure is lower where foods take longer to cook, so cooking times
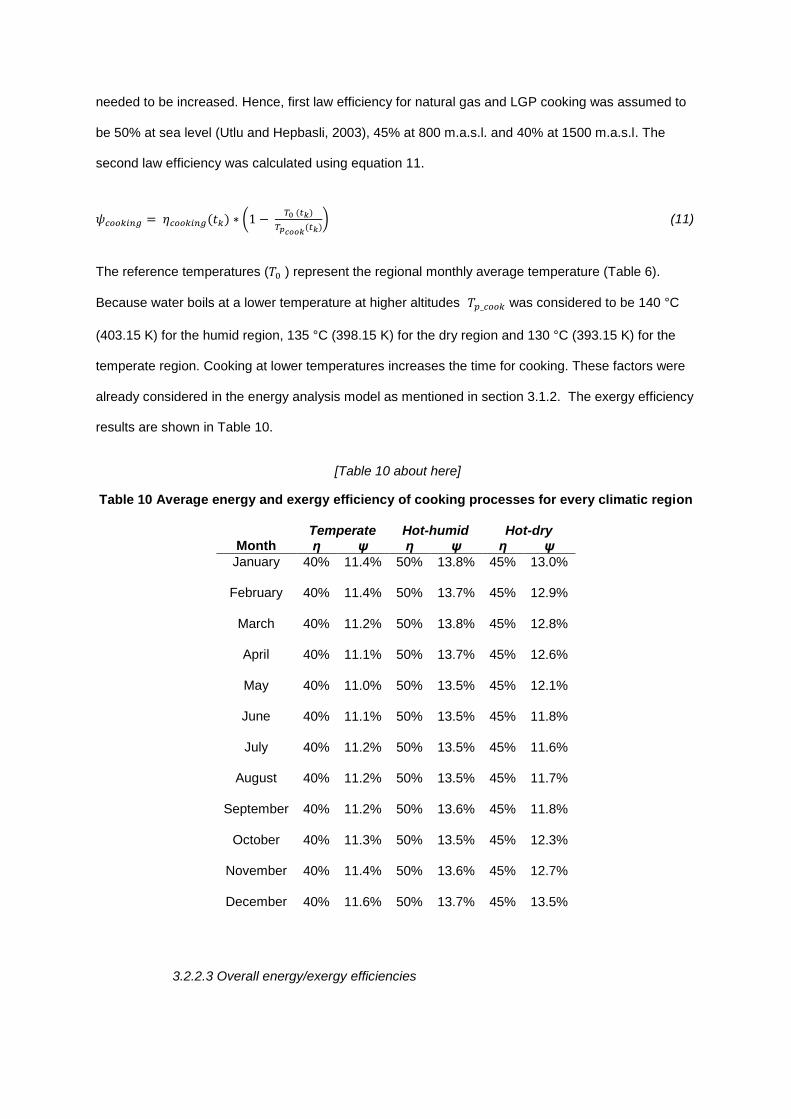
needed to be increased. Hence, first law efficiency for natural gas and LGP cooking was assumed to
be 50% at sea level (Utlu and Hepbasli, 2003), 45% at 800 m.a.s.l. and 40% at 1500 m.a.s.l. The
second law efficiency was calculated using equation 11.
𝜓𝑐𝑜𝑜𝑘𝑖𝑛𝑔 = 𝜂𝑐𝑜𝑜𝑘𝑖𝑛𝑔(𝑡𝑘) ∗ (1 − 𝑇0 (𝑡𝑘)
𝑇𝑝𝑐𝑜𝑜𝑘(𝑡𝑘)
) (11)
The reference temperatures (𝑇0 ) represent the regional monthly average temperature (Table 6).
Because water boils at a lower temperature at higher altitudes 𝑇𝑝_𝑐𝑜𝑜𝑘 was considered to be 140 °C
(403.15 K) for the humid region, 135 °C (398.15 K) for the dry region and 130 °C (393.15 K) for the
temperate region. Cooking at lower temperatures increases the time for cooking. These factors were
already considered in the energy analysis model as mentioned in section 3.1.2. The exergy efficiency
results are shown in Table 10.
[Table 10 about here]
Table 10 Average energy and exergy efficiency of cooking processes for every climatic region
Temperate Hot-humid Hot-dry
Month η ψ η ψ η ψ
January 40% 11.4% 50% 13.8% 45% 13.0%
February 40% 11.4% 50% 13.7% 45% 12.9%
March 40% 11.2% 50% 13.8% 45% 12.8%
April 40% 11.1% 50% 13.7% 45% 12.6%
May 40% 11.0% 50% 13.5% 45% 12.1%
June 40% 11.1% 50% 13.5% 45% 11.8%
July 40% 11.2% 50% 13.5% 45% 11.6%
August 40% 11.2% 50% 13.5% 45% 11.7%
September 40% 11.2% 50% 13.6% 45% 11.8%
October 40% 11.3% 50% 13.5% 45% 12.3%
November 40% 11.4% 50% 13.6% 45% 12.7%
December 40% 11.6% 50% 13.7% 45% 13.5%
3.2.2.3 Overall energy/exergy efficiencies

The classification presented in this paper allows us for a deeper understanding of the energy and
exergy utilisation of the sector. Efficiencies at the building, regional and national level can be
calculated using the obtained exergy efficiencies and multiplying them by the calculated exergy input
by end-use. Later, to obtain the regional energy and exergy efficiency we aggregate the energy data
obtained from the energy analysis; for this purpose we use equations 12 and 13. Finally, a national
energy/exergy efficiency of the sector is obtained using the similar equations to known the efficiency
of the sector as a whole and to make direct comparison with other international studies.
𝜂𝑡𝑜𝑡 = ∑ 𝑓𝑖∗ 𝜂𝑖
∑ 𝑓𝑖 (12)
𝜓𝑡𝑜𝑡 = ∑ 𝑓𝑖∗ 𝜓𝑖
∑ 𝑓𝑖 (13)
𝑓𝑖 refers to the fraction of the total energy/exergy utilisation of a specific end-use, 𝜂𝑖 to the energy
efficiency, and 𝜓𝑖 to the exergy efficiency of each end-use.
4. Results and Discussion.
4.1 Energy utilisation in the non-domestic sector
The model output showed a total energy input of 95.43 PJ; 81.10 PJ in form of electricity and 14.32
PJ in for of gas (LNG and Natural Gas). Although schools are the type of building with the lowest EUI
of all analysed buildings, nationwide the constructed surface of schools represents 71% of the total
non-domestic sector floor area, thus schools comprise 46.6% of the total yearly energy input (44.49
PJ) in the sector. Schools in the hot-dry climate are the major consumers with an utilisation of 19.78
PJ of energy. Of that amount, 8.97 PJ are used to cover the energy demand for space conditioning.
This individual end-use represents 9.41% of the total sectoral energy input. Also, schools in the hot-
humid and temperate climates are large consumers with a total utilisation of 9.57 PJ and 15.14 PJ
respectively. Other large nationwide energy users are supermarkets and hotels representing 20.3%
and 12.7% respectively.
By end use at a national level, HVAC and Lighting are the dominant end-users, representing 29.5%
and 27.0% of the total energy input. From a first law perspective special attention has to be put on
these end-uses to minimize the energy demand. The overall energy efficiency of the sector was found
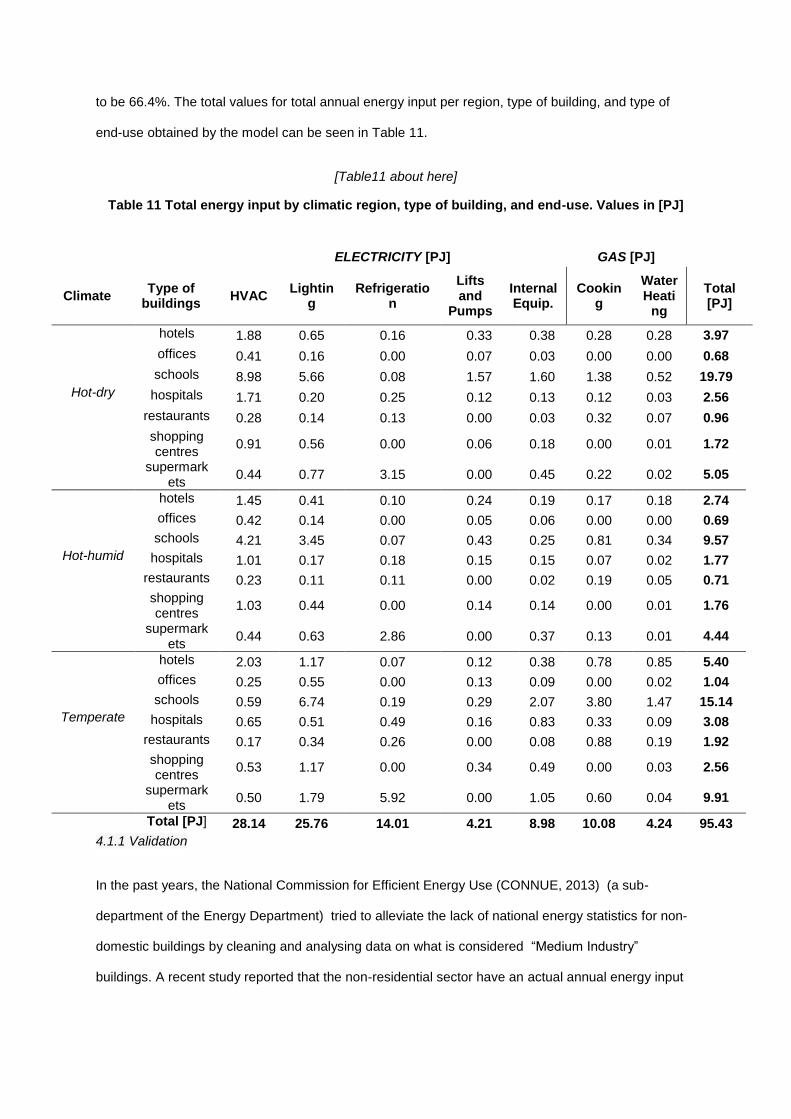
to be 66.4%. The total values for total annual energy input per region, type of building, and type of
end-use obtained by the model can be seen in Table 11.
[Table11 about here]
Table 11 Total energy input by climatic region, type of building, and end-use. Values in [PJ]
4.1.1 Validation
In the past years, the National Commission for Efficient Energy Use (CONNUE, 2013) (a sub-
department of the Energy Department) tried to alleviate the lack of national energy statistics for non-
domestic buildings by cleaning and analysing data on what is considered “Medium Industry”
buildings. A recent study reported that the non-residential sector have an actual annual energy input
ELECTRICITY [PJ] GAS [PJ]
Climate Type of
buildings HVAC
Lighting
Refrigeration
Lifts and
Pumps
Internal Equip.
Cooking
Water Heati
ng
Total [PJ]
Hot-dry
hotels 1.88 0.65 0.16 0.33 0.38 0.28 0.28 3.97
offices 0.41 0.16 0.00 0.07 0.03 0.00 0.00 0.68
schools 8.98 5.66 0.08 1.57 1.60 1.38 0.52 19.79
hospitals 1.71 0.20 0.25 0.12 0.13 0.12 0.03 2.56
restaurants 0.28 0.14 0.13 0.00 0.03 0.32 0.07 0.96
shopping centres
0.91 0.56 0.00 0.06 0.18 0.00 0.01 1.72
supermark
ets 0.44 0.77 3.15 0.00 0.45 0.22 0.02 5.05
Hot-humid
hotels 1.45 0.41 0.10 0.24 0.19 0.17 0.18 2.74
offices 0.42 0.14 0.00 0.05 0.06 0.00 0.00 0.69
schools 4.21 3.45 0.07 0.43 0.25 0.81 0.34 9.57
hospitals 1.01 0.17 0.18 0.15 0.15 0.07 0.02 1.77
restaurants 0.23 0.11 0.11 0.00 0.02 0.19 0.05 0.71
shopping centres
1.03 0.44 0.00 0.14 0.14 0.00 0.01 1.76
supermark
ets 0.44 0.63 2.86 0.00 0.37 0.13 0.01 4.44
Temperate
hotels 2.03 1.17 0.07 0.12 0.38 0.78 0.85 5.40
offices 0.25 0.55 0.00 0.13 0.09 0.00 0.02 1.04
schools 0.59 6.74 0.19 0.29 2.07 3.80 1.47 15.14
hospitals 0.65 0.51 0.49 0.16 0.83 0.33 0.09 3.08
restaurants 0.17 0.34 0.26 0.00 0.08 0.88 0.19 1.92
shopping centres
0.53 1.17 0.00 0.34 0.49 0.00 0.03 2.56
supermark
ets 0.50 1.79 5.92 0.00 1.05 0.60 0.04 9.91
Total [PJ] 28.14 25.76 14.01 4.21 8.98 10.08 4.24 95.43

of 25,220 GWh (90.79 PJ). The results for energy use from the simulation model were found to be in
strong agreement with those published by CONNUE with a prediction error of 4.86%.
4.2 Exergy utilisation of the Mexican non-domestic sector
As a result of the high quality of the sources used in the non-domestic sector (electricity =1 and gas =
0.92) the exergy input values look similar to those listed in table 11. The total exergy input for the
Mexican non-domestic sector was calculated to be 94.28 PJ (81.10 PJ for electricity and 13.18 PJ for
gas). However the values of interest to this study are the total exergy output with the intention to
obtain building, regional, and national exergy destructions and exergy efficiencies. Based on the
aforementioned exergy analysis methodology described these values are presented in Table 12.
[Table 12 about here]
Table 12 Total exergy output by climatic region, type of building, and end-use. Values in [PJ]
ELECTRICITY [PJ] GAS [PJ]
Climate Type of
buildings HVAC
Lighting
Refrigeration
Lifts and
Pumps
Internal Equip.
Cooking
Water Heati
ng
Total [PJ]
Hot-dry
hotels 0.07 0.12 0.03 0.17 0.27 0.03 0.02 0.71
offices 0.01 0.03 0.00 0.04 0.02 0.00 0.00 0.10
schools 0.33 1.07 0.01 0.78 1.12 0.16 0.04 3.51
hospitals 0.06 0.04 0.05 0.06 0.09 0.01 0.00 0.31
restaurants 0.01 0.03 0.02 0.00 0.02 0.04 0.00 0.12
shopping centres
0.03 0.10 0.00 0.03 0.13 0.00 0.00 0.30
supermark
ets 0.02 0.15 0.58 0.00 0.32 0.02 0.00 1.09
Hot-humid
hotels 0.07 0.08 0.02 0.12 0.13 0.02 0.01 0.45
offices 0.02 0.03 0.00 0.03 0.04 0.00 0.00 0.12
schools 0.20 0.65 0.01 0.22 0.18 0.10 0.02 1.38
hospitals 0.05 0.03 0.03 0.07 0.11 0.01 0.00 0.30
restaurants 0.01 0.02 0.02 0.00 0.02 0.02 0.00 0.10
shopping centres
0.05 0.08 0.00 0.07 0.10 0.00 0.00 0.30
supermark
ets 0.02 0.12 0.50 0.00 0.26 0.02 0.00 0.92
Temperate
hotels 0.14 0.22 0.01 0.06 0.26 0.08 0.07 0.84
offices 0.02 0.10 0.00 0.06 0.06 0.00 0.00 0.25
schools 0.04 1.27 0.04 0.15 1.45 0.39 0.11 3.44
hospitals 0.04 0.10 0.10 0.08 0.58 0.03 0.01 0.94
restaurants 0.01 0.06 0.05 0.00 0.06 0.09 0.01 0.29

4.3 Irreversibilities/Exergy destructions
Exergy losses or irreversibilities by regions, end-uses and types of buildings were also estimated.
These values represent the true thermodynamic inefficiencies of the sector. This occurs mainly
because electricity (a high grade source) is used in low-grade demands such as space conditioning or
refrigeration; and gas in the case of water heating. Therefore these end-uses will naturally have low
exergy efficiency values and high exergy destructions. Overall, the national exergy destruction is
calculated to be in the order of 75.87 PJ annually.
4.3.1 By building
At a national level, the largest destructions by type of building occur in schools, accounting for 46.8%
of the total irreversibilities (35.48 PJ). Supermarkets and Hotels have a share of 20.0% (15.16 PJ)
and 13.0% (9.89 PJ) respectively. This is due to the fact that these buildings represent the largest
percentage of floor area in the country. Fig 7 show the total exergy destruction percentage by
building.
[Fig. 7. about here]
shopping centres
0.04 0.22 0.00 0.17 0.34 0.00 0.00 0.77
supermark
ets 0.03 0.34 1.17 0.00 0.74 0.06 0.00 2.35
Total [PJ] 1.28 4.85 2.65 2.11 6.28 1.10 0.31 18.57
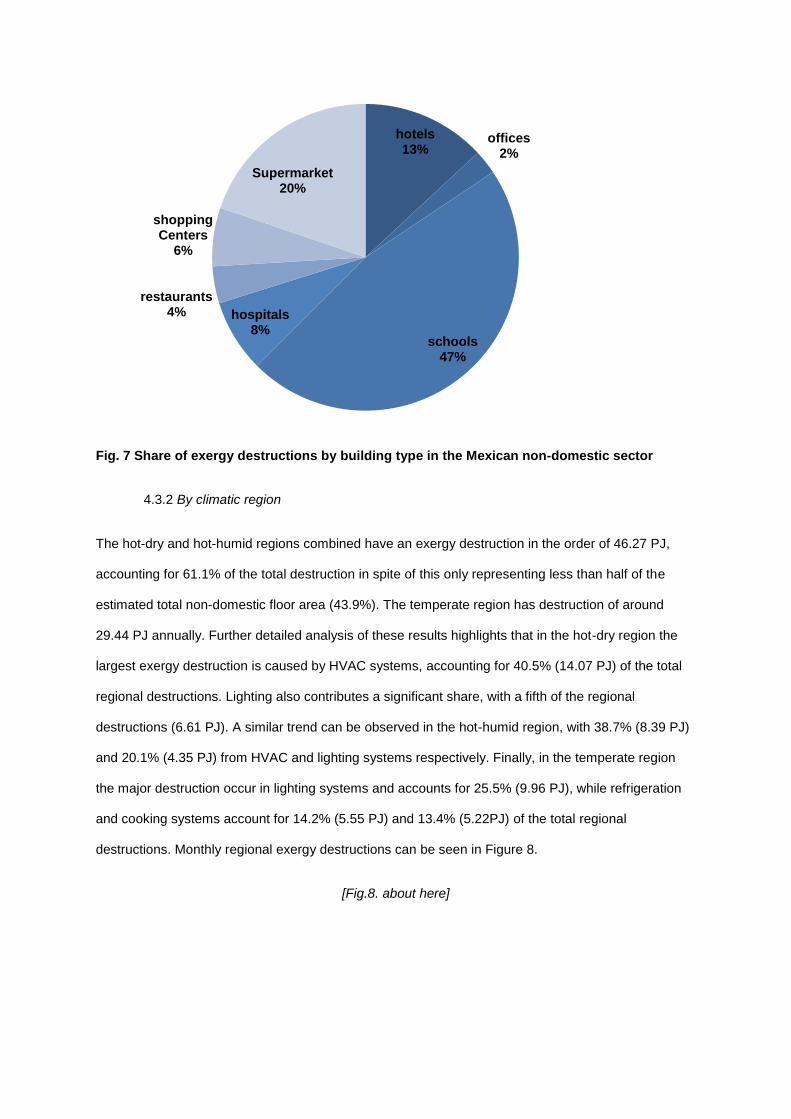
Fig. 7 Share of exergy destructions by building type in the Mexican non-domestic sector
4.3.2 By climatic region
The hot-dry and hot-humid regions combined have an exergy destruction in the order of 46.27 PJ,
accounting for 61.1% of the total destruction in spite of this only representing less than half of the
estimated total non-domestic floor area (43.9%). The temperate region has destruction of around
29.44 PJ annually. Further detailed analysis of these results highlights that in the hot-dry region the
largest exergy destruction is caused by HVAC systems, accounting for 40.5% (14.07 PJ) of the total
regional destructions. Lighting also contributes a significant share, with a fifth of the regional
destructions (6.61 PJ). A similar trend can be observed in the hot-humid region, with 38.7% (8.39 PJ)
and 20.1% (4.35 PJ) from HVAC and lighting systems respectively. Finally, in the temperate region
the major destruction occur in lighting systems and accounts for 25.5% (9.96 PJ), while refrigeration
and cooking systems account for 14.2% (5.55 PJ) and 13.4% (5.22PJ) of the total regional
destructions. Monthly regional exergy destructions can be seen in Figure 8.
[Fig.8. about here]
hotels13%
offices2%
schools47%
hospitals8%
restaurants4%
shopping Centers
6%
Supermarket20%
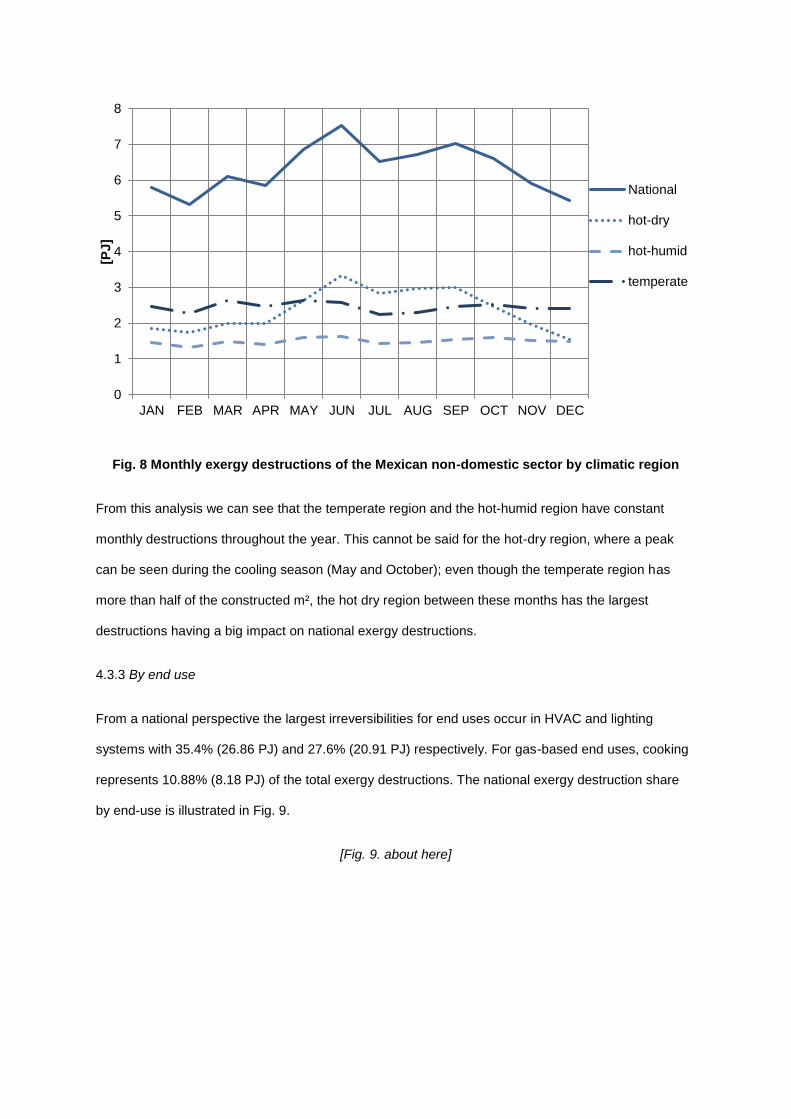
Fig. 8 Monthly exergy destructions of the Mexican non-domestic sector by climatic region
From this analysis we can see that the temperate region and the hot-humid region have constant
monthly destructions throughout the year. This cannot be said for the hot-dry region, where a peak
can be seen during the cooling season (May and October); even though the temperate region has
more than half of the constructed m², the hot dry region between these months has the largest
destructions having a big impact on national exergy destructions.
4.3.3 By end use
From a national perspective the largest irreversibilities for end uses occur in HVAC and lighting
systems with 35.4% (26.86 PJ) and 27.6% (20.91 PJ) respectively. For gas-based end uses, cooking
represents 10.88% (8.18 PJ) of the total exergy destructions. The national exergy destruction share
by end-use is illustrated in Fig. 9.
[Fig. 9. about here]
0
1
2
3
4
5
6
7
8
JAN FEB MAR APR MAY JUN JUL AUG SEP OCT NOV DEC
[PJ]
National
hot-dry
hot-humid
temperate
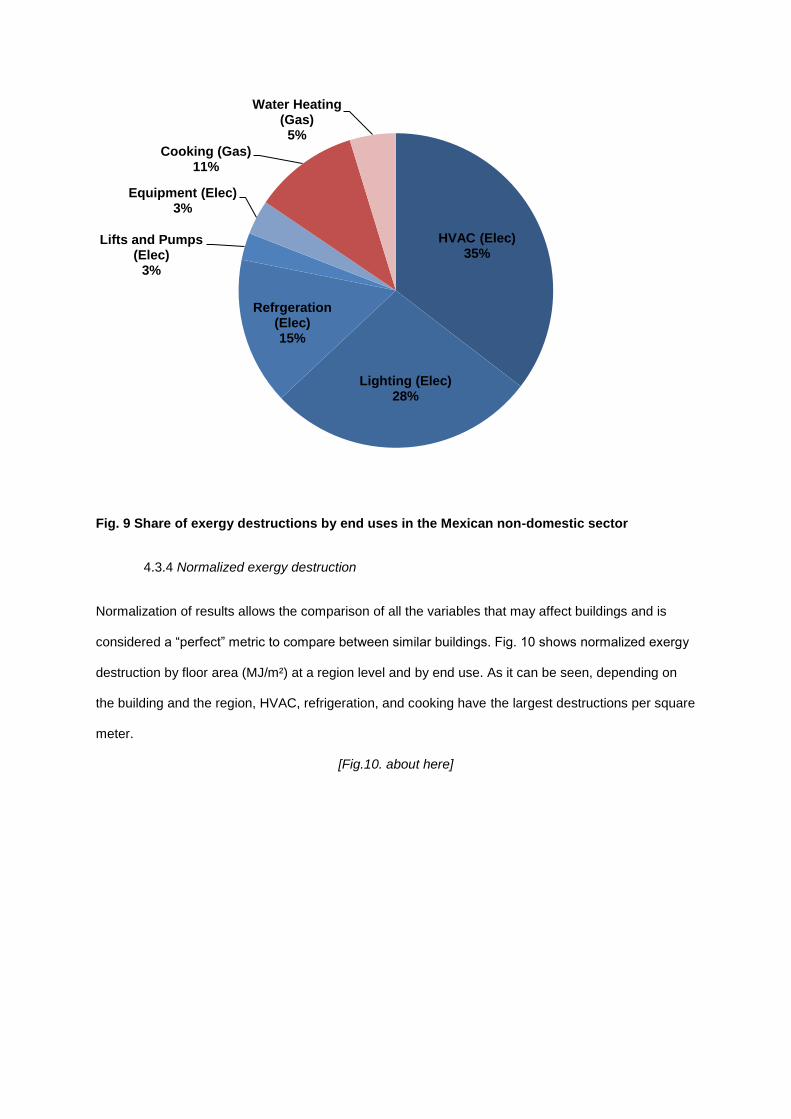
Fig. 9 Share of exergy destructions by end uses in the Mexican non-domestic sector
4.3.4 Normalized exergy destruction
Normalization of results allows the comparison of all the variables that may affect buildings and is
considered a “perfect” metric to compare between similar buildings. Fig. 10 shows normalized exergy
destruction by floor area (MJ/m²) at a region level and by end use. As it can be seen, depending on
the building and the region, HVAC, refrigeration, and cooking have the largest destructions per square
meter.
[Fig.10. about here]
HVAC (Elec)35%
Lighting (Elec)28%
Refrgeration (Elec)15%
Lifts and Pumps (Elec)
3%
Equipment (Elec)3%
Cooking (Gas)11%
Water Heating (Gas)
5%
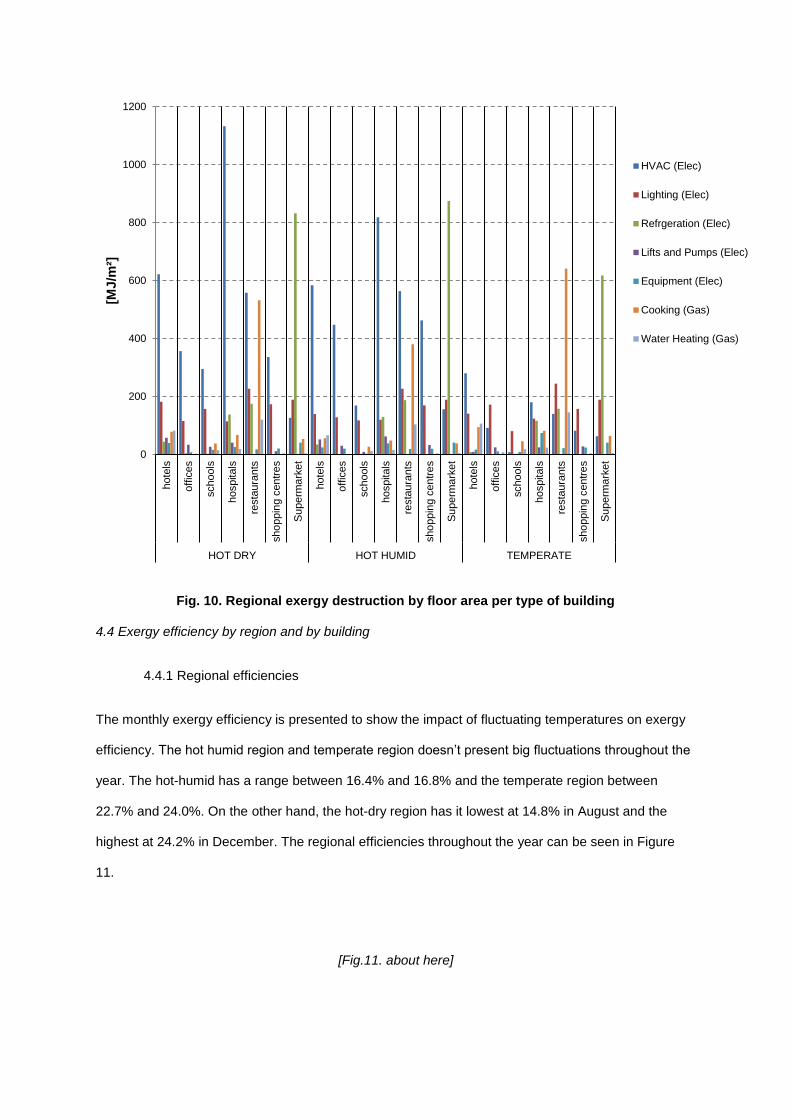
Fig. 10. Regional exergy destruction by floor area per type of building
4.4 Exergy efficiency by region and by building
4.4.1 Regional efficiencies
The monthly exergy efficiency is presented to show the impact of fluctuating temperatures on exergy
efficiency. The hot humid region and temperate region doesn’t present big fluctuations throughout the
year. The hot-humid has a range between 16.4% and 16.8% and the temperate region between
22.7% and 24.0%. On the other hand, the hot-dry region has it lowest at 14.8% in August and the
highest at 24.2% in December. The regional efficiencies throughout the year can be seen in Figure
11.
[Fig.11. about here]
0
200
400
600
800
1000
1200
hote
ls
offic
es
schools
hospitals
resta
ura
nts
sho
ppin
g c
entr
es
Su
perm
ark
et
hote
ls
offic
es
schools
hospitals
resta
ura
nts
sho
ppin
g c
entr
es
Su
perm
ark
et
hote
ls
offic
es
schools
hospitals
resta
ura
nts
sho
ppin
g c
entr
es
Su
perm
ark
et
HOT DRY HOT HUMID TEMPERATE
[MJ/m
²]
HVAC (Elec)
Lighting (Elec)
Refrgeration (Elec)
Lifts and Pumps (Elec)
Equipment (Elec)
Cooking (Gas)
Water Heating (Gas)

Fig. 11. Monthly exergy efficiency of the Mexican non-domestic sector by regions
4.4.2. Efficiencies by building
The highest exergy efficient building types highlighted by the model are hospitals and shopping
centres located in the temperate climate with annual efficiencies of almost 30%. This is due to the
small share of space conditioning that this type of building uses in the temperate region; the great
majority of buildings rely on natural ventilation unless the areas have high heat gains due to people
and/or internal equipment. In the same region, hotels and restaurants exhibit low exergy efficiencies
due to a larger demand of space conditioning, where thermal comfort standards are higher than in the
other types of buildings analysed by the model. Therefore an intensive use of a high grade use to
cover a low exergy demand (e.g. use of electricity for cooling) causes lower efficiencies. This
behaviour is more noticeable by the buildings located in the hot-dry and hot-humid region, with exergy
efficiencies no more than 18%. Overall, these regions have lower efficiencies than the temperate
region due to the high needs of cooling throughout the year where hospitals and restaurants have the
lowest efficiencies of all analysed buildings, thus the largest irreversibilities by m². The exergy
efficiency by all types of buildings located in the analysed regions can be seen in Fig. 12.
[Fig. 12. about here]
0%
5%
10%
15%
20%
25%
30%
JAN FEB MAR APR MAY JUN JUL AUG SEP OCT NOV DEC
ψ
HOT DRY
HOT HUMID
TEMPERATE
national
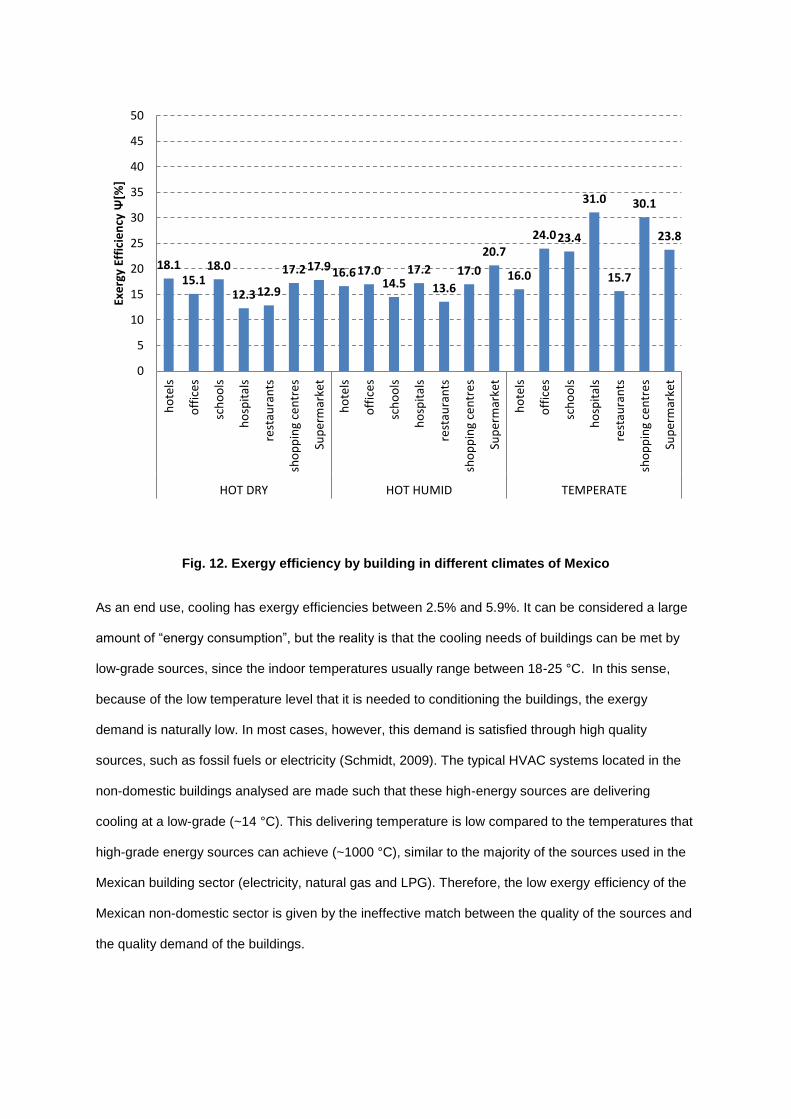
Fig. 12. Exergy efficiency by building in different climates of Mexico
As an end use, cooling has exergy efficiencies between 2.5% and 5.9%. It can be considered a large
amount of “energy consumption”, but the reality is that the cooling needs of buildings can be met by
low-grade sources, since the indoor temperatures usually range between 18-25 °C. In this sense,
because of the low temperature level that it is needed to conditioning the buildings, the exergy
demand is naturally low. In most cases, however, this demand is satisfied through high quality
sources, such as fossil fuels or electricity (Schmidt, 2009). The typical HVAC systems located in the
non-domestic buildings analysed are made such that these high-energy sources are delivering
cooling at a low-grade (~14 °C). This delivering temperature is low compared to the temperatures that
high-grade energy sources can achieve (~1000 °C), similar to the majority of the sources used in the
Mexican building sector (electricity, natural gas and LPG). Therefore, the low exergy efficiency of the
Mexican non-domestic sector is given by the ineffective match between the quality of the sources and
the quality demand of the buildings.
18.115.1
18.0
12.312.9
17.217.916.617.014.5
17.2
13.6
17.0
20.7
16.0
24.023.4
31.0
15.7
30.1
23.8
0
5
10
15
20
25
30
35
40
45
50
ho
tels
off
ice
s
sch
oo
ls
ho
spit
als
rest
aura
nts
sho
pp
ing
cen
tre
s
Sup
erm
arke
t
ho
tels
off
ice
s
sch
oo
ls
ho
spit
als
rest
aura
nts
sho
pp
ing
cen
tre
s
Sup
erm
arke
t
ho
tels
off
ice
s
sch
oo
ls
ho
spit
als
rest
aura
nts
sho
pp
ing
cen
tre
s
Sup
erm
arke
t
HOT DRY HOT HUMID TEMPERATE
Exe
rgy
Effi
cie
ncy
Ѱ[%
]
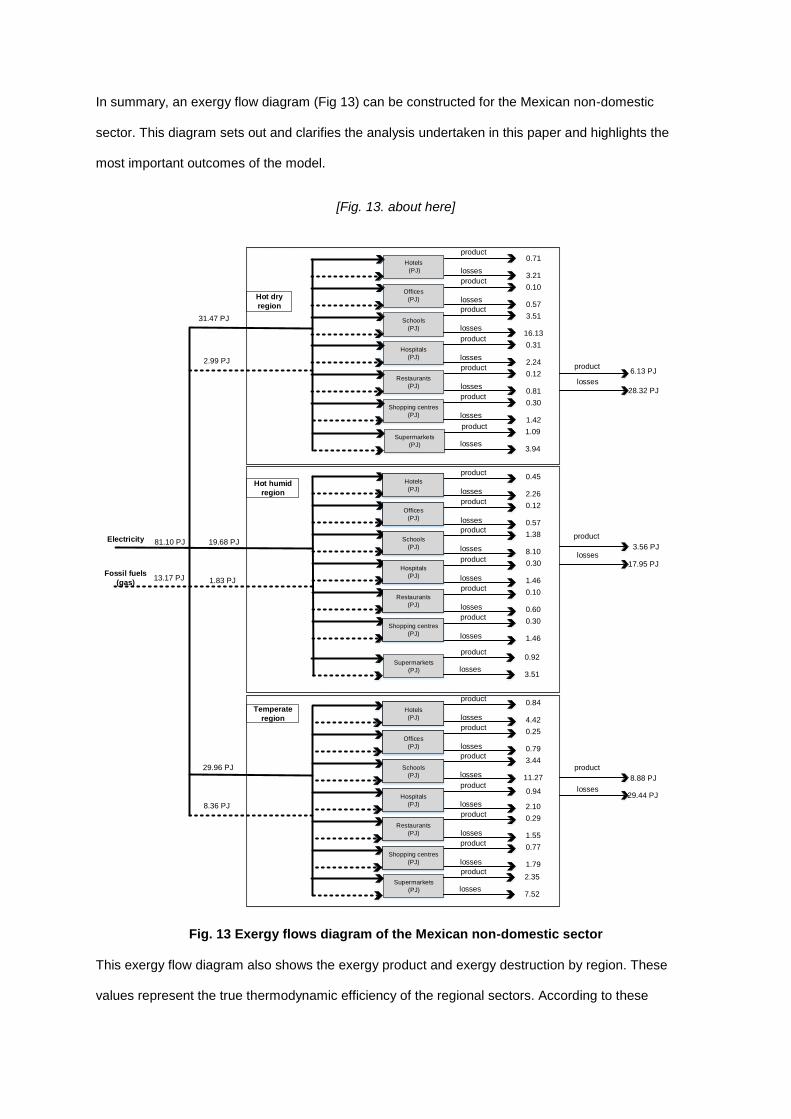
In summary, an exergy flow diagram (Fig 13) can be constructed for the Mexican non-domestic
sector. This diagram sets out and clarifies the analysis undertaken in this paper and highlights the
most important outcomes of the model.
[Fig. 13. about here]
Hotels
(PJ)
Offices
(PJ)
Schools
(PJ)
Hospitals
(PJ)
Restaurants
(PJ)
Shopping centres
(PJ)
Fossil fuels
(gas)
Electricity
product
losses
product
losses
product
losses
product
losses
product
losses
product
losses
product
losses
product
losses
product
losses
product
losses
product
losses
product
losses
product
losses
product
losses
product
losses
product
losses
product
losses
product
losses
Hotels
(PJ)
Offices
(PJ)
Schools
(PJ)
Hospitals
(PJ)
Restaurants
(PJ)
Shopping centres
(PJ)
Hotels
(PJ)
Offices
(PJ)
Schools
(PJ)
Hospitals
(PJ)
Restaurants
(PJ)
Shopping centres
(PJ)
81.10 PJ
13.17 PJ
0.71
3.21
0.10
0.57
3.51
16.13
0.31
2.24
0.12
0.81
0.30
1.42
0.45
2.26
0.12
0.57
1.38
8.10
1.46
0.10
0.60
0.30
1.46
0.84
4.42
0.25
0.79
3.44
11.27
2.10
0.29
1.55
0.77
1.79
0.30
0.94
Hot dry
region
losses
6.13 PJ
28.32 PJ
product
Hot humid
region
losses3.56 PJ
17.95 PJ
product
Temperate
region
losses
8.88 PJ
29.44 PJ
product
31.47 PJ
2.99 PJ
19.68 PJ
1.83 PJ
29.96 PJ
8.36 PJ
Supermarkets
(PJ)
product
losses
1.09
3.94
Supermarkets
(PJ)
product
losses
0.92
3.51
Supermarkets
(PJ)
product
losses
2.35
7.52
Fig. 13 Exergy flows diagram of the Mexican non-domestic sector
This exergy flow diagram also shows the exergy product and exergy destruction by region. These
values represent the true thermodynamic efficiency of the regional sectors. According to these

outputs, the non-domestic sector has an efficiency of 17.80% in the hot-dry region and 16.56% in the
hot-humid region. These low efficiencies are caused by the extensive use of electricity for cooling.
The non-domestic sector in the temperate region has an efficiency of 23.17%, a very low value
considering the bioclimatic benefits of this region where the potential to utilize passive systems such
as natural ventilation and natural lighting is very high. Finally, the Mexican non-domestic as a whole
has an exergy efficiency of 19.70%.
4.5 Comparison with other countries
The national exergy indicators obtained were compared against some similar international indicators
to analyze the main factors that influence the energy performance of buildings from several regions.
From Table 13 it can be seen outputs from other sectoral exergy studies. The results for Mexico
appear to have much higher efficiencies but this is due to two main reasons: a) the indicators from
other studies are from past years (up to 30 years like in the case for Finland), and b) the mild climate
located in Mexico has a high potential to use passive techniques such as natural ventilation and
natural light, thus reducing exergy destructions. If the main analysis is based on the latter, it can be
concluded that the exergy efficiency of the Mexican non-domestic sector is actually very low. Because
of the colder climates in countries such as Japan, Canada, Sweden, US and the UK, high energy
inputs for heating is required, an end-use with typical low exergy efficiency due to the use of high
grade sources like natural gas or electricity to cover this demand. Countries with higher indicators are
due to the utilization of low carbon sources such as the implementation of heat waste district systems,
as in the case of Norway and Canada. In hot countries such as Brazil, Malaysia, Indonesia and
Singapore, present lower efficiencies than Mexico because space conditioning represents more than
half of the total energy use in the sector (in Mexico, space conditioning only represents 29.5% of the
total energy utilisation). Higher efficiencies in these countries could be achieved from two approaches:
a) passive improvements by using natural ventilation and/or b) a more extensive use “low carbon”
technologies such as heat pumps, CHP, and/or district cooling networks.
[Table 13 about here]
Table 13 International non-domestic sector exergy efficiencies
Country ψ year Source
Mexico 19.7% 2014 Mexico hot-dry 17.8% 2014
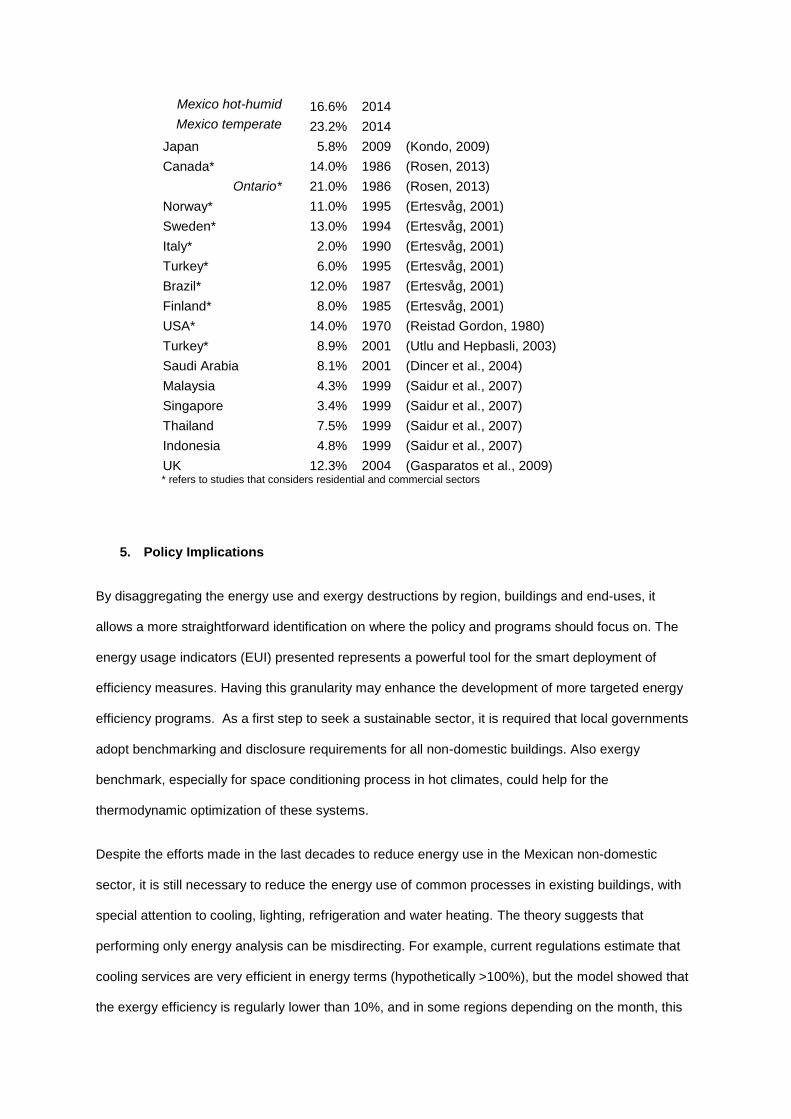
Mexico hot-humid 16.6% 2014 Mexico temperate 23.2% 2014
Japan 5.8% 2009 (Kondo, 2009)
Canada* 14.0% 1986 (Rosen, 2013)
Ontario* 21.0% 1986 (Rosen, 2013)
Norway* 11.0% 1995 (Ertesvåg, 2001)
Sweden* 13.0% 1994 (Ertesvåg, 2001)
Italy* 2.0% 1990 (Ertesvåg, 2001)
Turkey* 6.0% 1995 (Ertesvåg, 2001)
Brazil* 12.0% 1987 (Ertesvåg, 2001)
Finland* 8.0% 1985 (Ertesvåg, 2001)
USA* 14.0% 1970 (Reistad Gordon, 1980)
Turkey* 8.9% 2001 (Utlu and Hepbasli, 2003)
Saudi Arabia 8.1% 2001 (Dincer et al., 2004)
Malaysia 4.3% 1999 (Saidur et al., 2007)
Singapore 3.4% 1999 (Saidur et al., 2007)
Thailand 7.5% 1999 (Saidur et al., 2007)
Indonesia 4.8% 1999 (Saidur et al., 2007)
UK 12.3% 2004 (Gasparatos et al., 2009) * refers to studies that considers residential and commercial sectors
5. Policy Implications
By disaggregating the energy use and exergy destructions by region, buildings and end-uses, it
allows a more straightforward identification on where the policy and programs should focus on. The
energy usage indicators (EUI) presented represents a powerful tool for the smart deployment of
efficiency measures. Having this granularity may enhance the development of more targeted energy
efficiency programs. As a first step to seek a sustainable sector, it is required that local governments
adopt benchmarking and disclosure requirements for all non-domestic buildings. Also exergy
benchmark, especially for space conditioning process in hot climates, could help for the
thermodynamic optimization of these systems.
Despite the efforts made in the last decades to reduce energy use in the Mexican non-domestic
sector, it is still necessary to reduce the energy use of common processes in existing buildings, with
special attention to cooling, lighting, refrigeration and water heating. The theory suggests that
performing only energy analysis can be misdirecting. For example, current regulations estimate that
cooling services are very efficient in energy terms (hypothetically >100%), but the model showed that
the exergy efficiency is regularly lower than 10%, and in some regions depending on the month, this

can get closer to 1%. The same behavior can be found on water heating processes. A limitation of
current regulations is that they are based only on the first law of thermodynamics, so adding exergy to
the policy-making process could be an effective tool to improve resource utilisation, energy
conservation, and energy security in the country. Exergy could become a key indicator for more
sustainable buildings leading to a smarter deployment of resources and having a focus on more
optimized energy building systems.
Public programs should focus in areas where more potential for improvements can be achieved.
Resulting from the monthly analysis of exergy destructions and exergy efficiency the main focus has
to be put on buildings in the hot-dry climate, where total irreversibilities account for the same amount
as in the temperate region in spite of having less than half of the constructed surface. Furthermore,
some potential does exist for the implementation of a mixed approach between active and passive
systems refurbishments such as mechanical/natural ventilation systems. Added to this, urban areas in
this region have high development rates thanks to the closeness with the U.S.A. border. Therefore,
cities like Monterrey and Tijuana are expected to have higher growing rates than any other cities in
the country, so preventive policies should be applied to new buildings. The constant behavior of
thermodynamic processes in the hot-humid region and temperate region makes the development of
the strategies not as complex. For the temperate region the deployment of passive strategies such as
natural ventilation, natural lighting and solar water heating can greatly improve the regional efficiency
and should be the focus of local programs. The hot-humid region presents a great challenge,
especially for the constant cooling demand of the buildings. In order to bring closer the quality of the
fuels with the quality demanded of some end-uses, more policies and incentives are needed to
support technologies that work with low-quality sources. Consequently, to increase the exergy
efficiency in cooling in all regions, it can be recommended the creation of programs that could
encourage the deployment of low carbon technologies such as heat pumps, CHP with absorption
chillers, and the development of district cooling networks combined with bioclimatic strategies. Also
the developments of codes to set minimum envelope requirements are needed to lower the space
cooling demands.
Finally, we recommend the development and implementation of an energy/exergy directive applied to
Mexican buildings. We think that exergy indicators should be mandatory when reduction strategies
are assessed to gain a clearer picture of the potential improvements. Although more research is
needed on the subject, exergy indicators can be also used to apply penalties to buildings with low
efficiencies.
6. Conclusion
This study presented the development of an archetype-based bottom-up building energy model
supported with an exergy method developed by Dincer et al. (2004) to assess the energy/exergy
utilization of the Mexican non-domestic sector. The analysis was undertaken based on very detailed
database of 120 non-domestic buildings located in different regions of the country. First law or energy
analysis was implemented to give a first insight into a sector that lacks detailed energy information.
The methodology for the development of a stock model implemented for this study could serve as a
basis for other similar studies, especially those were data is limited and several assumptions have to
be made. On the other hand, the exergy approach was included in the model to identify locations and
magnitudes of exergy destructions. It is the first time that energy and exergy stock model is developed
by using archetype buildings and building physics modelling. The advantage of this study over the
others of similar research is that it has the advantage to model future refurbishment programs based
on exergy improvements. Also, the exergy model developed in this research can be an essential
method for policy making and national standard design activities
According to the Mexican model, the non-domestic sector demands 95.43 PJ of energy and 94.28 PJ
of exergy. These inputs are mainly used for space conditioning, lighting, refrigeration, and cooking.
Also, it was possible to quantify the impact of local climate at end-uses, buildings, and regions. It is
concluded that Mexican climatic conditions have a large impact on the exergy efficiency in the sector.
Regionally, the exergy efficiencies found was in the order of 17.32%, 16.5%, and 23.29% for the hot-
dry, hot-humid, and temperate climate respectively. The national exergy efficiency of the sector was
found to be 19.52% with an output of 18.41 PJ and exergy destructions of 75.87 PJ. On the other
hand, the overall energy efficiency of the sector was calculated at 66.37%. A large difference exists
because of the use of high quality sources for low quality demands. The use of high-grade sources for
low-grade demands in buildings is still a constant in our societies and should be a major concern for
the world energy security. Until today, all Mexican sectors are highly dependent on high-grade fuels.

The classification by end-use presented in this paper allows us for a deeper understanding of the
energy and exergy utilization of the sector. A high potential of decarbonizing the Mexican building
sector exist, especially in hot climates. This outcomes will help the policy makers to identify where the
main destructions occur and what kind of policies should be focus on reduce this inefficiencies. The
model showed that the main irreversibilities occur at the HVAC systems; therefore special attention
has to be put in this area. By following the exergy concept, the total CO₂ emissions for the building
stock can be substantially reduced as a result of the use of more efficient energy conversion
processes. Exergy have the benefit of utilizing resources in a smarter way, and try to put more
attention in the efficient use of renewable energy and the development of bioclimatic design strategies
for buildings that eventually would lead to an increase of the energy/exergy efficiency of the Mexican
building sectors.
7. Future work
It is important to note that since the modelling methodology presented is still under development and
further improvements are intended, this includes:
Undertaking of in-depth analysis to ground the archetype models in more robust data: This
will include the collection of more defined data on a number of buildings, floor area and
installed energy systems to improve the model.
Extension of building types covered: More detailed specification of non-domestic building
subtypes.
Development of a retrofit module: This will be included to explore the future technical potential
of different refurbishment strategies and identify the impact on national building sustainability
under energetic and exergetic indicators.
Further research to quantify the benefits of passive measures and low exergy systems at a
regional level in Mexico.
As this model is considered to be useful in the evaluation of a single subsector or a whole building
sector energy and exergy performance, the application of the modelling framework to other countries
is currently being investigated. An analysis of the UK non-domestic sector is currently under way with
the intention of investigating the current performance of the sector and modelling the impact of
different refurbishment measures based on exergetic terms.
Acknowledgments
The author of this paper acknowledges support from The Mexican National Council for Science and
Technology (CONACyT) through a scholarship to pursue graduate studies. Also, we want to thank FIDE
for sharing information and data from audit case studies in Mexican non-domestic buildings. Finally, we
would like to thank the reviewers for their insightful comments on the paper, as these comments led us
to an improvement of the work.
References
Al-Ghandoor, A., 2013. Evaluation of energy use in Jordan using energy and exergy analyses. Energy
and Buildings 59, 1-10.
ASHRAE. (1977). ASHRAE 1977 Handbook: Fundamentals, U.S.A.
ASHRAE. (2010). ASHRAE 90.1 Appendix G: Building Performance Rating Method, U.S.A.
Asif, M., Muneer, T., 2007. Energy supply, its demand and security issues for developed and
emerging economies. Renewable and Sustainable Energy Reviews 11, 1388-1413.
Aydinalp, M., Ugursal, V.I., Fung, A.S., 2003. Modelling of residential energy consumption at the
national level. INTERNATIONAL JOURNAL OF ENERGY RESEARCH 27, 441-453.
Bilgen, E., Takahashi, H., 2002. Exergy analysis and experimental study of heat pump systems.
Exergy, An International Journal 2, 259-265.
Bressani, R., Chon, C., 1996. Effects of altitude above sea level on the cooking time and nutritional
value of common beans. Plant foods for human nutrition (Dordrecht, Netherlands) 49, 53-61.
Bruhns, H., 2007. Identifying Determinants of Energy Use in the UK nondomestic Stock. Bartlett
School of Graduate Studies, University College London, London, United Kingdom.
CONAGUA. 2014., Normales Climatológicas por Estación . Accessed: 26 April 2014, url:
http://smn.cna.gob.mx/.
CONNUE, 2013. La importancia de los edificios del sector comercial y de servicios como usuarios de
electricidad y las estrategias para la eficiencia energética, Presentation by Odon de Buen, March
2013.
Daft Logic. (2014). Google Maps Area Calculator Tool [Online]. Map of Mexico, retrieved on Jan 20th,
2014. url: http://www.daftlogic.com/projects-google-maps-area-calculator-tool.htm
de Buen, O., 2009. Greenhouse Gas Emission Baselines and Reduction Potentials from Buildings in
Mexico: A Discussion Document, in: SBCI, U. (Ed.), France.
Deru, M., Field, K., Studer, D., Benne, K., Griffith, B., Torcellini, P., Liu, B., 2011. U.S. Department of
Energy Commercial Reference Building Models of the National Building Stock. Technical Report
NREL/TP-5500-46861, 118.
Dincer, I., 2002. The role of exergy in energy policy making. Energy Policy 30, 137-149.
Dincer, I., Hussain, M.M., Al-Zaharnah, I., 2004. Analysis of sectoral energy and exergy use of Saudi
Arabia. International Journal of Energy Research 28, 205-243.
Dineen, D., Gallachoir, B.P.O., 2011. Modelling the impacts of building regulations and a property
bubble on residential space and water heating. Energy and Buildings 43, 166-178.
Dovjak, M., Shukuya, M., Olesen, B.W., Krainer, A., 2010. Analysis on exergy consumption patterns
for space heating in Slovenian buildings. Energy Policy 38, 2998-3007.
ECB-Annex37, 2007. Technical Synthesis Report: Low Exergy Systems for Heating and Cooling of
Buildings, IEA ECBCS, in: Jagpal, R. (Ed.), UK.
ECB-Annex49, 2011. Detailed Exergy Assessment Guidebook for the Built Environment, IEA ECBCS,
in: Torio, H., Schmidt, D. (Eds.). Fraunhofer IBP.
EnergyPlus, 2012. Getting Started with EnergyPlus. BasicConcepts Manual - Essential Information
You Need about Running EnergyPlus. The Board of Trustees of the University of Illinois and the
Regents of the University of California through the Ernest Orlando Lawrence Berkeley National
Laboratory., 73.
Ertesvåg, I.S., 2001. Society exergy analysis: a comparison of different societies. Energy 26, 253-
270.
Famuyibo, A.A., Duffy, A., Strachan, P., 2012. Developing archetypes for domestic dwellings—An
Irish case study. Energy and Buildings 50, 150-157.
FIDE, 2011. Proyectos de Ahorro de Energia. Casos de Estudio. Fideicomiso para el Ahorro de
Energia Electrica, Mexico, D.F.
Gallo, W.L.R., Milanez, L.F., 1990. Choice of a reference state for exergetic analysis. Energy 15, 113-
121.
Gasparatos, A., El-Haram, M., Horner, M., 2009. Assessing the sustainability of the UK society using
thermodynamic concepts: Part 2. Renewable and Sustainable Energy Reviews 13, 956-970.
Griffith, B., Crawley, D., 2006. Methodology for Analyzing the Technical Potential for Energy
Performance in the U.S. Commercial Buildings Sector with Detailed Energy Modeling. Conference
Paper NREL/CP-550-40124, 10.
Google. (2014). Google Maps. [Online], Map of Mexico, retrieved on Feb 2nd, 2014, url:
http://maps.google.com.mx
Hammond, G.P., Stapleton, A.J., 2001. Exergy analysis of the United Kingdom energy system.
Proceedings of the Institution of Mechanical Engineers, Part A: Journal of Power and Energy 215,
141-162.
Hepbasli, A., 2012. Low exergy (LowEx) heating and cooling systems for sustainable buildings and
societies. Renewable and Sustainable Energy Reviews 16, 73-104.
Huang, Y.J., Broderick, J., 2000. A Bottom-Up Engineering Estimate of the Aggregate Heating and
Cooling Loads of the Entire U.S. Building Stock. ACEEE Summer Study on Energy Efficiency in
Buildings, 135-148.
INEGI, Accessed: 20 April 2014. Poblacion, Hogares y Vivienda, url:
http://www3.inegi.org.mx/sistemas/temas/default.aspx?s=est&c=17484.
IPCC, 2007. Climate Change 2007: Mitigation of Climate Change. Contribution of Working Group III to
the Fourth Assessment Report of the Intergovernmental Panel on Climate Change.
Kondo, K., 2009. Energy and exergy utilization efficiencies in the Japanese residential/commercial
sectors. Energy Policy 37, 3475-3483.
Korolija, I., Marjanovic-Halburd, L., Zhang, Y., Hanby, V.I., 2013. UK office buildings archetypal model
as methodological approach in development of regression models for predicting building energy
consumption from heating and cooling demands. Energy and Buildings 60, 152-162.
Reistad Gordon, M., 1980. Available-Energy Utilization in the United States, Thermodynamics:
Second Law Analysis. AMERICAN CHEMICAL SOCIETY, pp. 93-109.
Rosen, M., 2013. Using Exergy to Assess Regional and National Energy Utilization: A Comparative
Review. Arab J Sci Eng 38, 251-261.
Rosen, M., Bulucea, C.A., 2009. Using Exergy to Understand and Improve the Efficiency of Electrical
Power Technologies. Entropy 11, 820-835.
Rosen, M.A., 1992. Evaluation of energy utilization efficiency in Canada using energy and exergy
analyses. Energy 17, 339-350.
Sadorsky, P., 2009. Renewable energy consumption and income in emerging economies. Energy
Policy 37, 4021-4028.
Saidur, R., Sattar, M.A., Masjuki, H.H., Abdessalam, H., Shahruan, B.S., 2007. Energy and exergy
analysis at the utility and commercial sectors of Malaysia. Energy Policy 35, 1956-1966.
Schmidt, D., 2009. Low exergy systems for high-performance buildings and communities. Energy and
Buildings 41, 331-336.
SENER, 2001. NOM-008-ENER-2001, Eficiencia energética en edificaciones, envolventes de
edificios no residenciales., Mexico, D.F.
SENER, 2005a. NOM-007-ENER-2004, Eficiencia energética en sistemas de alumbrado en edificios
no residenciales., Mexico, D.F.
SENER, 2005b. NOM-014-ENER-2005, Eficiencia energética de motores de corriente alterna,
monofásicos, de inducción, tipo jaula de ardilla, enfriados con aire, en potencia nominal de 0,180 a
1,500 KW. Límites, método de prueba y marcado., Mexico, D.F.
SENER, 2007. NOM-011-ENER-2006, Eficiencia energética en acondicionadores de aire tipo central
paquete o dividido. Límite, métodos de prueba y etiquetado., Mexico, D.F.
SENER, 2008. NOM-022-ENER/SCFI-2008, Eficiencia energética y requisitos de seguridad al
usuario para aparatos de refrigeración comercial autocontenidos. Límites, métodos de prueba y
etiquetado., Mexico, D.F.
SENER, 2011. NOM-003-ENER-2011, Eficiencia térmica de calentadores de agua para uso
doméstico y comercial. Límites, método de prueba y etiquetado., Mexico, D.F.
SENER, 2013. Balance Nacional de Energía 2012, Mexico, D.F.
Shukuya, M., 1994. Energy, Entropy, Exergy and Space Heating Systems, in: Bánhidi, L. (Ed.),
Healthy Buildings '94: proceedings of the 3rd international conference. Technical University of
Budapest, pp. 369-374.
Swan, L.G., Ugursal, V.I., 2009. Modeling of end-use energy consumption in the residential sector: A
review of modeling techniques. Renewable and Sustainable Energy Reviews 13, 1819-1835.
UNEP-SBCI, 2009. Buildings and Climate Change Summary for Decision-Makers. UNEP Sustainable
Buildings & Climate Initiative.
Utlu, Z., Hepbasli, A., 2003. A study on the evaluation of energy utilization efficiency in the Turkish
residential-commercial sector using energy and exergy analyses. Energy and Buildings 35, 1145-
1153.
Xydis, G., Koroneos, C., Polyzakis, A., 2009. Energy and exergy analysis of the Greek hotel sector:
An application. Energy and Buildings 41, 402-406.


![Uses of Exergy in Systems Engineering - NASA · performance of Brayton cycle engine[18], as well as hypersonic aircraft[19]. Doty[20] showed that exergy based methods can aid in the](https://img.pdfslide.tips/doc/110x75/5f04cf747e708231d40fd20f/uses-of-exergy-in-systems-engineering-nasa-performance-of-brayton-cycle-engine18.jpg)

![PLAGIAT MERUPAKAN TINDAKAN TIDAK TERPUJIrepository.usd.ac.id/30659/2/125214099_full[1].pdf · 2018-07-19 · i ANALISIS LAJU KERUSAKAN EXERGY DAN EFISIENSI EXERGY MESIN PLTGU PT](https://img.pdfslide.tips/doc/110x75/5f5b91e582d19f4cb64ef62d/plagiat-merupakan-tindakan-tidak-1pdf-2018-07-19-i-analisis-laju-kerusakan.jpg)