Embed Size (px)
Citation preview

Tiago Filipe Mota Coelho
Modelo Integral de Fragilidade do Idoso
(do constructo à avaliação - Tilburg Frailty Indicator)
Tese de Candidatura ao grau de Doutor em Gerontologia e Geriatria. Especialidade em Gerontologia. Programa Doutoral da Universidade do Porto (Instituto de Ciências Biomédicas Abel Salazar) e da Universidade de Aveiro.
Orientadora: Professora Doutora Lia Fernandes
Professora Associada da Faculdade de Medicina da Universidade do Porto.
Co-orientadora: Professora Doutora Constança Paúl
Professora Catedrática do Instituto de Ciências Biomédicas Abel Salazar da Universidade do Porto.


Este trabalho foi financiado pelo Instituto Politécnico do Porto e pela Escola
Superior de Tecnologia da Saúde do Porto, ao abrigo do Programa de Formação
Avançada de Docentes.


Agradecimentos
A presente tese de doutoramento resulta do contributo de um conjunto de pessoas e não
apenas de um trabalho individual. Por essa razão, desejo expressar os meus sinceros
agradecimentos:
À Professora Doutora Lia Fernandes pelo apoio ininterrupto, incondicional e valiosíssimo
que prestou durante todos os passos da investigação, assim como pelo facto de ter sido
sempre exigente comigo, promovendo a minha motivação e a qualidade do meu trabalho.
À Professora Doutora Constança Paúl, em primeiro lugar, por me ter dado a conhecer o
tema da fragilidade em idosos, mas também pela paciência, pela motivação e por todas as
observações que fez relativamente ao trabalho, que muito valorizo.
À Professora Doutora Carolina Silva pela admirável e inigualável disponibilidade em
colaborar não só na análise estatística, mas também na reflexão sobre muitas das opções
inerentes à investigação.
Ao Professor Doutor Robbert J. J. Gobbens por ter autorizado a utilização do Tilburg Frailty
Indicator (TFI) e por todas as sugestões fornecidas ao longo da investigação.
Ao Professor Doutor Rubim Santos por ter autorizado a utilização de equipamento
específico do Centro de Estudos do Movimento e Atividade Humana e pela colaboração na
análise dos dados recolhidos.
Ao Professor Doutor Ignacio Martín por ter feito parte do painel de peritos que analisou a
versão portuguesa do TFI e pelas sugestões que forneceu relativamente ao planeamento
da investigação.
À Professora Doutora Mafalda Duarte por ter feito parte do painel de peritos que analisou
a versão portuguesa do TFI, pelo apoio constante e pelo interesse que me incutiu
relativamente ao estudo de fragilidade em idosos.
À Professora Doutora Maria Vilar e ao Professor Doutor Mário Simões por terem autorizado
a utilização da versão experimental do WHOQOL-OLD.

Ao Professor Peter Blackburn por ter colaborado no desenvolvimento da versão portuguesa
do TFI, particularmente ao nível da retroversão.
Às diversas instituições e respetivos profissionais pela disponibilidade em colaborar com a
investigação, facilitando o contacto com as pessoas idosas e a realização das avaliações.
Neste sentido, agradece-se particularmente:
À Academia Sénior de Gaia – Dr.ª Tatiana Costa e Dr. Gonçalo Cruz
À Câmara Municipal da Maia – Dr.ª Luísa Guimarães, Dr.ª Liliana Moutinho e Dr.ª
Cristina Pires
Ao Centro de Convívio da Delegação de Vila Nova de Gaia da Cruz Vermelha
Portuguesa – Dr.ª Carina Pinto
Ao Centro de Convívio/Centro de Dia do Centro Social da Arrábida – Dr.ª Helena
Mendes
Ao Centro de Dia Bom Pastor da Delegação do Porto da Cruz Vermelha Portuguesa
– Dr.ª Daniela Esteves e Dr.ª Ana Margarida Beça
Ao Centro de Dia da Terceira Idade da Associação de Solidariedade Social O
Amanhã da Criança – Dr. Joaquim Espírito Santo
Ao Centro de Dia do Lar de Santo António – Dr.ª Ana Cortez
Ao Centro Paroquial de Nossa Senhora da Natividade de Pedrouços – Dr.ª Odete
Ribeiro
Ao Centro Social das Antas – Dr.ª Maria José Monteiro
Ao Centro Social do Bom Pastor e ao Centro Social do Salvador do Mundo – Dr.ª
Sónia Vasconcelos e Dr.ª Rute Serronha
Ao Centro Social do Exército da Salvação – Dr.ª Sílvia Morais e Dr.ª Raquel Morais
Ao Centro Social Paroquial da Igreja do Senhor da Vera Cruz do Candal – Dr.ª Tânia
Teixeira
Ao Centro Social Paroquial da Nossa Senhora da Vitória – Dr.ª Manuela Santos e Dr.
António Miranda
Ao Centro Social Paroquial de Águas Santas – Dr.ª Virgínia Rodrigues
Ao Centro Social Paroquial de S. Cristóvão de Mafamude – Dr.ª Andreia Silva
À Fundação Porto Social - Dr.ª Carmo Lopes e Dr. Daniel Coelho
Aos Serviços de Assistência Organizações de Maria (SAOM) – Dr.ª Marta Oliveira e
Dr.ª Sara Machado
Às estudantes do Curso de Terapia Ocupacional por terem colaborado na recolha dos
dados: Alice Rocha, Joana Oliveira, Libânia Silva, Nicole Câmara, Rute Ferreira, Sara
Santos, Stefanie Morais e Sylvie Abreu.

Aos idosos pela disponibilidade em participar no estudo, pela sua admirável paciência e
amabilidade.
Aos meus colegas de trabalho por me auxiliarem sempre que necessário e por me
motivarem incondicionalmente.
Ao Instituto Politécnico do Porto e à Escola Superior de Tecnologia da Saúde do Porto pelo
apoio concedido no âmbito do Programa de Formação Avançada de Docentes.
Aos meus familiares e amigos não irei agradecer através de palavras, mas sim através de
ações. Contudo, dedico este trabalho especialmente aos meus pais, Maria Francelina Mota
Soares Coelho e José Maria Silva Coelho, assim como à minha irmã, Marta Alexandra
Mota Coelho.


Resumo
Introdução: Fragilidade trata-se de uma síndrome clínica que se refere a um estado de
vulnerabilidade aumentada, em que o mínimo fator de stresse pode levar a resultados
adversos como incapacidade, institucionalização e morte. Apesar de, ao longo das últimas
três décadas, o constructo de fragilidade ter assumido uma crescente relevância ao nível
do estudo do envelhecimento, não há consenso sobre a sua caracterização e,
consequentemente, sobre a sua avaliação em contexto clínico. Neste sentido, com o intuito
de agregar conceptualizações recentes da síndrome, foi desenvolvido o modelo integral de
fragilidade. Este modelo afasta-se das visões tradicionais de fragilidade, na medida em que
a define como um estado de pré-incapacidade, resultante de perdas em um ou mais
domínios do funcionamento humano (físico, psicológico e social).
Objetivo: O presente trabalho visou estudar o modelo integral de fragilidade no contexto
português, recorrendo ao instrumento estandardizado que o operacionaliza: o Tilburg
Frailty Indicator (TFI). Assim, procedeu-se à validação da versão portuguesa do TFI.
Posteriormente, como objetivo específico, analisou-se de que forma os determinantes de
fragilidade previstos no modelo integral se relacionavam com a manifestação da síndrome
nos seus múltiplos domínios. Concomitantemente, para melhor compreender a variância
de fragilidade, estudou-se a sua associação independente com outras variáveis
clinicamente significativas (medicação e dor). Por fim, comparou-se o TFI e outras duas
medidas de fragilidade relativamente à predição de resultados adversos a curto prazo.
Paralelamente, adotando a perspetiva multidimensional inerente ao modelo integral e ao
TFI, compararam-se os diferentes domínios de fragilidade quanto à predição dos mesmos
resultados.
Métodos: Esta investigação iniciou-se com a realização de uma revisão da literatura, de
artigos publicados entre Maio de 2004 a 2014. Foram incluídos estudos que descreviam e
testavam instrumentos especificamente desenvolvidos para a avaliação/identificação de
fragilidade, e que incluíam na sua amostra pessoas com idade ≥65 anos. Em seguida,
procedeu-se à tradução e adaptação cultural do TFI. Neste processo, de forma a assegurar
a sua validade facial e de conteúdo, a versão portuguesa do instrumento foi revista por um
painel de peritos. Por sua vez, para se estudar a fiabilidade (consistência interna e
fiabilidade teste reteste), validade de constructo (convergente e divergente) e validade de
critério da versão portuguesa do TFI, realizou-se um estudo transversal com uma amostra
não-probabilística de 252 idosos residentes na comunidade. Paralelamente, foi analisado,
na mesma amostra, o contributo independente dos determinantes de fragilidade, do
número de medicamentos consumidos diariamente e do nível e impacto da dor para a

explicação da variância de fragilidade. Por fim, numa sub-amostra (com 95 dos
participantes), foi feita uma reavaliação dez meses depois, especificamente em relação à
utilização de cuidados de saúde, dependência/incapacidade e qualidade de vida.
Resultados: Através da revisão da literatura, foi possível observar que um número
considerável de medidas resulta da conceptualização da síndrome como um estado
exclusivo ou predominantemente físico e que o TFI foi o único instrumento multidimensional
identificado em que a incapacidade e as comorbilidades não são incluídas como
componentes de fragilidade. No estudo transversal, a amostra (n=252) apresentou uma
média de idades de 79.2 (±7.3) anos, sendo a maior parte dos participantes do sexo
feminino (75.8%). A versão portuguesa do TFI apresentou boa consistência interna (KR-
20=0.78), boa fiabilidade teste-reteste (r=0.91) e concordância substancial para a maioria
dos itens. Os domínios físicos e social do TFI correlacionaram-se com as medidas
concorrentes expectáveis, enquanto o domínio psicológico com as medidas físicas e
psicológicas. O TFI demonstrou uma capacidade de discriminação entre boa a excelente
em relação ao critério de fragilidade (AUC 0.75 a 0.89) e entre razoável e boa relativamente
à dependência e utilização de cuidados de saúde (AUC 0.56 a 0.72). Por sua vez, os
determinantes explicaram 46% da variância de fragilidade total, assim como 39.8%, 25.3%
e 27.7% de fragilidade física, psicológica e social, respetivamente. Idade, sexo, rendimento,
morte recente de uma pessoa querida, estilo de vida, satisfação com o ambiente
habitacional e comorbilidade foram as variáveis associadas a fragilidade total, enquanto
cada um dos domínios se relacionou de forma particular com um conjunto diferente de
determinantes. Independentemente do efeito destas variáveis, o número de medicamentos
consumidos diariamente relacionou-se com a fragilidade total e física, enquanto a dor se
associou a fragilidade total, física e psicológica. Por fim, analisando longitudinalmente a
predição de resultados adversos, o TFI destacou-se das restantes medidas de fragilidade
por se associar a um maior número de contactos com o médico de família e por contribuir
de forma mais significativa para a predição do declínio da qualidade de vida. Por outro lado,
comparando os domínios do TFI, verificou-se que a fragilidade física contribuiu mais
significativamente para a predição da maioria dos resultados adversos.
Conclusão: O presente trabalho surge como um contributo para o reforço da importância
da abordagem holística e biopsicossocial de fragilidade, subjacente ao modelo integral.
Além disso, a versão portuguesa do TFI revelou boas propriedades psicométricas, podendo
ser utilizada como um instrumento de deteção, particularmente a nível comunitário e dos
cuidados de saúde primários. Torna-se, no entanto, necessário levar a cabo mais estudos,
dada a importância da prevenção e identificação destas situações de fragilidade,
salientando-se a necessidade de se testar diferentes modelos conceptuais, bem como a
sua operacionalização em contextos distintos.

Abstract
Introduction: Frailty is a clinical syndrome characterized by an increased vulnerability to
minor stressful events, which can lead to adverse outcomes such as disability,
institutionalization and death. Over the past three decades, the relevance of the construct
of frailty has increased significantly in the study of aging. Nonetheless, there is still no
consensus regarding its clinical presentation and assessment. In this regard, in order to
aggregate recent conceptualizations of the syndrome, the integral model of frailty was
developed. This model departs from the traditional views of the syndrome by defining frailty
as a state of pre-disability, resulting from losses in one or more domains of human
functioning (physical, psychological and social).
Objective: To study the integral model of frailty in the Portuguese setting, by using its
operationalization, the standardized instrument Tilburg Frailty Indicator (TFI). Therefore, the
Portuguese version was validated. Subsequently, as a specific goal, the relationship
between the determinants of frailty, considered in the integral model, and the manifestation
of the syndrome in its multiple domains was examined. Concomitantly, to better understand
the variance of frailty, its independent association with other clinically significant variables
(medication and pain) was studied. Finally, the TFI and other two measures of frailty were
compared regarding the prediction of short-term adverse outcomes. Meanwhile, adopting
the multidimensional approach subjacent to the integral model and to the TFI, the different
domains of frailty were compared with regard to the prediction of the outcomes.
Methods: This research began with a literature review of articles published between May
2004 and 2014. Studies that described and tested instruments specifically developed to
assess/identify frailty, and that comprised in their sample individuals with ages ≥65 years,
were included. Afterwards, the translation and cultural adaptation of TFI was performed. In
this process, in order to ensure its face and content validity, the Portuguese version was
revised by an expert committee. Subsequently, a cross-sectional study was performed,
using a non-probability sample of 252 community-dwelling elderly, in order to examine the
reliability (internal consistency and test–retest reliability), construct validity
(convergent/divergent) and criterion validity of the Portuguese version of TFI. Meanwhile,
the independent contribution of the determinants of frailty, of the amount of daily-consumed
medications and of the degree and impact of pain to the explanation of the variance of frailty
was analyzed in the same sample. Finally, a sub-sample (95 of the participants) was
reassessed 10 months later, specifically regarding healthcare utilization, disability and
quality of life.

Results: Through literature review, it was possible to observe that a significant number of
measures resulted from the conceptualization of frailty as an exclusive or predominantly
physical state. TFI was the only identified multidimensional instrument in which disability
and comorbidity were not included as components of frailty. In the cross-sectional study,
the mean sample age (n=252) was 79.2 (±7.3) years, and most of the participants were
women (75.8%). The Portuguese version of TFI showed good internal consistency (KR-
20=0.78), good test-retest reliability (r=0.91) and substantial agreement for most items. TFI
physical and social domains correlated as expected with concurrent measures, and the TFI
psychological domain showed similar correlations with other psychological and physical
measures. The TFI showed good to excellent discrimination ability in regard to frailty criteria
(AUC: 0.75-0.89), and fair to good ability to predict disability and healthcare utilization (AUC:
0.56-0.72). In turn, determinants explained 46% of the variance of total frailty, and 39.8%,
25.3%, and 27.7% of physical, psychological, and social frailty respectively. Age, gender,
income, death of a loved one in the past year, lifestyle, satisfaction with living environment
and self-reported comorbidity predicted total frailty, while each frailty domain was
associated with a different set of determinants. Independently of the effect of these
variables, the number of medications was associated with total and physical frailty, while
pain was correlated with total, physical and psychological frailty. Finally, examining the
longitudinal prediction of adverse outcomes, TFI stood out from the other measures of frailty
because of its association with a greater amount of contacts with a general practitioner and
its higher contribution to the prediction of the decline of quality of life. On the other hand,
when comparing TFI domains, physical frailty was the most significant predictor of the
outcomes.
Conclusion: The present paper comes across as a contribution to strengthening the
importance of the holistic and biopsychosocial approach to frailty, subjacent to the integral
model. Furthermore, the Portuguese version of TFI showed good psychometric properties,
and it can be used as a screening instrument, particularly in community and primary
healthcare settings. It is, however, necessary to carry out further studies, given the
importance of prevention and identification of these frailty situations, with emphasis on the
need to test different conceptual models, as well as their operationalization, in different
contexts.

Índice
1. Introdução ..................................................................................................................15
2. Enquadramento teórico .............................................................................................23
2.1. Avaliação de fragilidade em pessoas idosas. Coelho T, Paúl C, Fernandes L.
Revista Portuguesa de Enfermagem de Saúde Mental (submetido) ............................ 24
3. Investigação empírica ...............................................................................................45
3.1. Portuguese version of the Tilburg Frailty Indicator: Transcultural adaptation
and psychometric validation. Coelho T, Santos R, Paúl C, Gobbens RJJ, Fernandes
L. Geriatrics & Gerontology International, 2014 ......................................................... . 46
3.2. Determinants of frailty: the added value of assessing medication. Coelho T,
Paúl C, Gobbens RJJ, Fernandes L. Frontiers in Aging Neuroscience (submetido) ..... 57
3.3. Multidimensional frailty and pain in community dwelling elderly. Coelho T, Paúl
C, Gobbens RJJ, Fernandes L. Pain Medicine (submetido) ......................................... 72
3.4. Frailty as a predictor of short-term adverse outcomes. Coelho T, Paúl C,
Gobbens RJJ, Fernandes L. Journal of Nutrition, Health and Aging (submetido) ......... 85
4. Discussão e conclusão ........................................................................................... 103
5. Bibliografia ............................................................................................................... 105
Anexos.......................................................................................................................... 109
Description of the additional measures used to examine the construct and criterion
validity of the Portuguese version of the Tilburg Frailty Indicator ................................ 110
English version of Tilburg Frailty Indicator .................................................................. 113
Versão portuguesa do Tilburg Frailty Indicator .......................................................... 116


15
1. Introdução
O envelhecimento populacional é um fenómeno global, resultante do declínio
progressivo da mortalidade e da fecundidade na maior parte dos países do mundo (United
Nations, 2013; World Health Organization, 2012). Este aumento da proporção de pessoas
mais velhas na população total tornou-se evidente e exponencial desde meados do século
XX (United Nations, 2013). Enquanto que em 2013 se estimava que cerca de 11% da
população mundial tivesse 60 ou mais anos de idade, em menos de 40 anos, calcula-se
que este valor atinja os 21% (United Nations, 2013). Adicionalmente, espera-se que em
2050 haja 392 milhões de pessoas com 80 ou mais anos de idade, aproximadamente o
triplo do que se verifica na atualidade (United Nations, 2013).
Portugal não é exceção a esta tendência global. Para além de possuir uma das mais
elevadas proporções de idosos da União Europeia (aproximadamente 19%) (Eurostat,
2014), segundo projeções do Instituto Nacional de Estatística (2014) prevê-se que até 2060
o índice de envelhecimento aumente de 131 para 307 idosos por cada 100 jovens. Estima-
se, ainda, que a progressão do envelhecimento demográfico seja uma realidade nos
próximos 50 anos (independentemente da recuperação de saldos migratórios positivos e
do aumento dos níveis de fecundidade), particularmente devido ao aumento contínuo da
esperança média de vida (Instituto Nacional de Estatística, 2009, 2014).
O aumento da longevidade é uma das grandes conquistas da humanidade (Fried,
Hogan, & Rowe, 2011; World Health Organization, 2002), no entanto, colocam-se desafios
ao nível do planeamento e prestação de cuidados de saúde e sociais, devido à maior
prevalência de doenças crónicas e de condições clínicas especificas da velhice (Martín &
Brandão, 2012; Olshansky, Beard, & Börsch-Supan, 2011; Ribeiro, Fernandes, Firmino,
Simões, & Paúl, 2010). Neste conjunto, a fragilidade merece particular destaque, pelo facto
de colocar em risco a manutenção da independência, da qualidade e da dignidade de vida
das pessoas mais velhas (Clegg, Young, Iliffe, Rikkert, & Rockwood, 2013; Fried, Walston,
& Ferrucci, 2009).
A fragilidade trata-se de uma síndrome clínica que se refere a um estado de
vulnerabilidade exacerbada, em que o mínimo fator de stresse pode levar a resultados
adversos clinicamente significativos, tais como quedas, delirium, incapacidade,
institucionalização, hospitalização e morte (Abellan van Kan et al., 2008; Morley et al.,
2013; Rockwood & Mitnitski, 2007). Um indivíduo frágil tem menor quantidade de recursos
do que uma pessoa não-frágil/robusta e, consequentemente, maior dificuldade em lidar
com elementos stressantes, internos ou externos (Avila-Funes et al., 2008; Rodriguez-
Manas et al., 2013; Zaslavsky et al., 2013). Neste sentido, enquanto um indivíduo idoso

16
robusto se torna dependente nas atividades diárias em resultado de um fator de stresse
major (ex.: acidente vascular cerebral, fratura do colo do fémur ou depressão), um idoso
frágil pode ficar dependente em consequência de uma perturbação minor da sua
homeostasia (ex.: mudança de temperatura, alteração da medicação ou infeção urinária)
(Bergman et al., 2007; Clegg et al., 2013; Provencher, Demers, & Gelinas, 2012).
Adicionalmente, tal como descreve Clegg et al. (2013), uma pessoa frágil tem maior
dificuldade em recuperar o seu estado de saúde e funcional após ser confrontado com um
fator de stresse, havendo uma grande probabilidade de não se verificar uma recuperação
total (ver Figura 1).
Figura 1: Impacto de um fator de stresse minor ao nível da funcionalidade de idosos não frágeis/robustos (linha
verde) e de idosos frágeis (linha amarela) – adaptado de Clegg et al. (2013).
A condição de fragilidade não se insere num processo de envelhecimento normal.
Contudo, na sua base está uma intensificação do declínio da reserva fisiológica, que
normalmente acompanha o envelhecimento (Fried et al., 2009; Walston et al., 2006). Por
outras palavras, a capacidade funcional de múltiplos sistemas orgânicos, necessária para
compensar eficazmente perdas e outros elementos stressantes, está exageradamente
diminuída, colocando em causa mecanismos homeostáticos (Fried, Ferrucci, Darer,
Williamson, & Anderson, 2004). Esta deterioração resulta de alterações graduais a nível
molecular e celular, em função de fatores genéticos, epigenéticos, ambientais e
relacionados com o estilo de vida (Clegg et al., 2013; Fried et al., 2009).
Concomitantemente, a presença de doença pode precipitar uma situação de fragilidade,
na medida em que pode requerer ao organismo que mobilize os recursos disponíveis para
dar resposta a essa condição, esgotando a capacidade fisiológica em reserva e, por isso,
aumentando a vulnerabilidade do indivíduo (Bergman et al., 2007).
A fragilidade trata-se, portanto, de uma condição específica da população mais
envelhecida, particularmente comum em pessoas com 80 ou mais anos de idade (Collard,
Boter, Schoevers, & Oude Voshaar, 2012; Morley et al., 2013). Da mesma forma, é mais
prevalente no sexo feminino uma vez que, para além da influência de fatores
Fu
ncio
nalid
ad
e
Independência
Dependência
Fator de stresse minor

17
neuroendócrinos, hormonais e relacionados com o sistema músculo-esquelético, as
mulheres sobrevivem mais tempo e com maiores níveis de morbilidade (Puts, Lips, & Deeg,
2005; Rockwood, 2005; Song, Mitnitski, & Rockwood, 2010). Todavia, a prevalência exata
de fragilidade na população idosa permanece por determinar, devido ao facto de existirem
diferentes perspetivas relativamente aos seus componentes (Collard et al., 2012;
Sternberg, Wershof Schwartz, Karunananthan, Bergman, & Mark Clarfield, 2011).
Efetivamente, apesar do constructo de fragilidade ter assumido uma crescente relevância
ao nível do estudo do envelhecimento e da prestação de cuidados de saúde a pessoas
mais velhas ao longo das últimas três décadas, a sua definição e enquadramento clínico
não são consensuais (Markle-Reid & Browne, 2003; Sternberg et al., 2011). Existem
diversos modelos conceptuais sobre fragilidade, com implicações distintas no que se refere
à identificação da síndrome na prática clínica (Abellan van Kan et al., 2008; Hogan,
MacKnight, & Bergman, 2003). Não obstante, existem duas conceptualizações geradoras
de maior consenso na comunidade científica: o modelo biológico e o modelo de
acumulação de défices (Cesari, Gambassi, van Kan, & Vellas, 2014; Morley et al., 2013).
De acordo com o modelo biológico, desenvolvido por Fried et al. (2001), a fragilidade
expressa-se a nível físico, através da conjugação de uma série de componentes
específicos que constituem o fenótipo de fragilidade: fraqueza muscular, lentidão,
exaustão, perda de peso involuntária e baixos níveis de atividade física. Nesta perspetiva,
a ênfase é colocada na deterioração da capacidade funcional dos sistemas músculo-
esquelético, imunológico, hormonal, metabólico e do sistema nervoso central e autónomo,
assim como nas suas manifestações corporais, com destaque para a sarcopenia.
Por outro lado, no modelo de acumulação de défices, proposto inicialmente por
Mitnitski, Mogilner, MacKnight, e Rockwood (2002), fragilidade é definida como um estado
não específico, resultante do efeito cumulativo da conjugação de défices multidimensionais
relacionados com o envelhecimento. Nesta linha de pensamento, o pressuposto é que
quanto maior a quantidade de problemas, independentemente da sua natureza, maior a
probabilidade de estar frágil (Rockwood & Mitnitski, 2007). Assim, em oposição ao modelo
de Fried et al. (2001), conceptualiza-se que existem diferentes mecanismos que podem
aumentar a vulnerabilidade do indivíduo e levar a situações de fragilidade. Segundo este
modelo, em alternativa à classificação de um indivíduo como frágil com base na presença
de um fenótipo em particular, cabe ao avaliador calcular o índice de fragilidade, que se
refere à razão entre os défices presentes e o total de défices considerados numa avaliação
clínica. Estes défices referem-se usualmente a doenças e alterações funcionais ao nível
das atividades diárias, mas também podem ser sinais e sintomas específicos (Cesari et al.,
2014; Rockwood & Mitnitski, 2007; Searle, Mitnitski, Gahbauer, Gill, & Rockwood, 2008).

18
Apesar da sua predominância na literatura – especialmente em relação à perspetiva
biológica (Bouillon et al., 2013) – vários autores colocam objeções a estes modelos
(Abellan van Kan et al., 2008; Levers, Estabrooks, & Ross Kerr, 2006; Markle-Reid &
Browne, 2003). Efetivamente, para além da sua aplicabilidade prática ser frequentemente
discutida (Cesari et al., 2014; Malmstrom, Miller, & Morley, 2014), existem divergências
teóricas profundas relativamente a pressupostos basilares de ambas as
conceptualizações. Em primeiro lugar, a definição de fragilidade como uma síndrome
exclusivamente física é frequentemente criticada, sendo que cada vez mais investigadores
defendem a sua natureza multidimensional e biopsicossocial (Bergman et al., 2007; Levers
et al., 2006; Markle-Reid & Browne, 2003). A argumentação, nesta perspetiva, relaciona-
se com o facto de uma caracterização demasiado estreita de fragilidade não corresponder
a uma visão holística do indivíduo e se afastar da conceptualização de saúde enquanto
bem-estar físico, psicológico e social (Gobbens, Luijkx, Wijnen-Sponselee, & Schols,
2010a; Markle-Reid & Browne, 2003). Em segundo lugar, a caracterização de fragilidade
como o resultado da simples combinação de uma série de condições patológicas e défices
funcionais é usualmente contestada (Cesari et al., 2014; Provencher et al., 2012). Com
efeito, visões contemporâneas de fragilidade procuram cada vez mais distingui-la de
comorbilidade e de incapacidade, reconhecendo, contudo, que existe uma associação
entre as diferentes condições (Abellan van Kan et al., 2008; Fried et al., 2004; Sternberg et
al., 2011).
Neste contexto, com o intuito de organizar uma conceptualização de fragilidade que
traduzisse uma mudança de paradigma relativamente às definições tradicionais da
síndrome, foi desenvolvido por Gobbens, Luijkx, Wijnen-Sponselee, e Schols (2010c) o
modelo integral de fragilidade. Neste modelo conceptual – apresentado recentemente no
seguimento de uma revisão exaustiva da literatura (Gobbens, Luijkx, Wijnen-Sponselee, &
Schols, 2010b) e da consulta de peritos (Gobbens, Luijkx, et al., 2010a) – fragilidade é
definida como um estado de pré-incapacidade resultante de perdas em um ou mais
domínios do funcionamento humano (físico, psicológico e social), sendo causado pela
influência de uma gama de variáveis (determinantes do curso de vida, doença(s) e declínio
da reserva fisiológica), aumentando o risco de resultados adversos/outcomes
(incapacidade, utilização de cuidados de saúde e morte). Para além de traduzir uma
abordagem holística da pessoa e de definir claramente incapacidade como um potencial
resultado de fragilidade, esta conceptualização destaca-se paralelamente pelo facto de
pressupor que variáveis como eventos de vida (ex.: morte do cônjuge) ou condições do
ambiente habitacional (ex.: mudança para lar) podem influenciar diretamente o estado de
fragilidade, além de estarem potencialmente na base de doenças que podem de igual

19
forma fomentar a vulnerabilidade do indivíduo (Gobbens, van Assen, Luijkx, & Schols,
2012; Gobbens, van Assen, Luijkx, Wijnen-Sponselee, & Schols, 2010a) (ver Figura 2).
Figura 2: Modelo integral de fragilidade de Gobbens, Luijkx, et al. (2010c).
Independentemente da conceptualização de fragilidade, parece consensual na
literatura que, na ausência de intervenção, o estado de saúde e funcional de um indivíduo
frágil tende a piorar com o tempo (Clegg et al., 2013; Morley et al., 2013). Porém, há
evidência de que a vulnerabilidade associada à síndrome pode ser prevenida, atenuada ou
revertida, destacando-se, assim, a importância da sua deteção atempada, particularmente
nos contextos dos cuidados de saúde primários e comunitários (Bergman et al., 2007;
Sternberg et al., 2011). Com efeito, a diminuição da severidade e prevalência de fragilidade
terão indubitavelmente claros benefícios não só a nível individual e familiar, mas também
ao nível da sociedade (Clegg et al., 2013; Vermeulen, Neyens, van Rossum,
Spreeuwenberg, & de Witte, 2011). Todavia, para que se possam desenvolver programas
de prevenção/intervenção eficazes, torna-se necessário compreender qual a definição de
fragilidade mais apropriada a diferentes contextos, e qual a forma mais eficiente de a avaliar
(Bergman et al., 2007; Clegg et al., 2013; Pialoux, Goyard, & Lesourd, 2012). Por outras
palavras, é fundamental perceber quais os modelos conceptuais de fragilidade cuja
operacionalização permita identificar adequadamente as pessoas idosas em risco, em
diferentes contextos e situações.
Idade
Determinantes do curso de vida
- idade - educação - rendimento - sexo - etnia - estado civil - ambiente residencial - estilo de vida - eventos de vida - biológicos (incluindo genéticos)
Doença(s) Declínio na reserva fisiológica
Resultados adversos
(outcomes) - Incapacidade - Utilização de cuidados de saúde - Morte
Fragilidade física Declínio: - nutrição - mobilidade - atividade física - força - resistência - equilíbrio - funções sensoriais
Fragilidade psicológica Declínio: - cognição - humor - coping
Fragilidade social
Declínio: - relações sociais - suporte social
Promoção de saúde e prevenção
Prevenir/atrasar fragilidade
FRAGILIDADE
Diminuir fragilidade Prevenir/atrasar resultados adversos

20
Neste âmbito, o presente trabalho teve como principal objetivo estudar a
aplicabilidade e pertinência do modelo integral de fragilidade no contexto português. Desta
forma, analisou-se essencialmente a relação entre determinantes, fragilidade (física,
psicológica e social) e resultados adversos, num grupo de idosos residentes na
comunidade. Para tal, recorreu-se ao instrumento estandardizado Tilburg Frailty Indicator
(TFI) (Gobbens, van Assen, Luijkx, Wijnen-Sponselee, & Schols, 2010b), que permite a
operacionalização clínica do modelo de Gobbens, Luijkx, et al. (2010c). Procedeu-se,
assim, ao processo de validação do TFI para a população portuguesa, com o estudo das
respetivas propriedades psicométricas. Paralelamente, foi estudada a associação entre
fragilidade e outras variáveis clinicamente relevantes (medicação e dor), de modo a melhor
compreender esta síndrome na população idosa.
Consequentemente, este trabalho é composto pelos seguintes artigos científicos:
1. Avaliação de fragilidade em pessoas idosas. Coelho T, Paúl C, Fernandes L.
Revista Portuguesa de Enfermagem de Saúde Mental (submetido).
Objetivo: Identificar os instrumentos de avaliação de fragilidade em idosos
desenvolvidos nos últimos dez anos, para analisar como diferentes autores
operacionalizam a medição da síndrome.
2. Portuguese version of the Tilburg Frailty Indicator: Transcultural adaptation
and psychometric validation. Coelho T, Santos R, Paúl C, Gobbens RJJ,
Fernandes L. Geriatrics & Gerontology International, 2014.
Objetivo: Desenvolver a versão portuguesa do TFI e estudar as suas propriedades
psicométricas (inclui a análise da associação de fragilidade com medidas
alternativas dos seus componentes e com indicadores de resultados adversos).
3. Determinants of frailty: the added value of assessing medication. Coelho T,
Paúl C, Gobbens RJJ, Fernandes L. Frontiers in Aging Neuroscience
(submetido).
Objetivos: (1) Analisar como os determinantes previstos no modelo integral se
relacionam com fragilidade; (2) Estudar a associação entre o número de
medicamentos consumidos diariamente e fragilidade, independentemente do efeito
dos determinantes.
4. Multidimensional frailty and pain in community dwelling elderly. Coelho T,
Paúl C, Gobbens RJJ, Fernandes L. Pain Medicine (submetido).
Objetivo: Investigar de que forma a presença de dor permite explicar a variância de
fragilidade, independentemente do efeito dos determinantes previstos no modelo
de Gobbens, Luijkx, et al. (2010c).
21
5. Frailty as a predictor of short-term adverse outcomes. Coelho T, Paúl C,
Gobbens RJJ, Fernandes L. Journal of Nutrition, Health and Aging
(submetido).
Objetivos: (1) Comparar o TFI e outras duas medidas de fragilidade relativamente
à associação com resultados adversos numa reavaliação dez meses depois; (2)
Comparar fragilidade física, psicológica e social relativamente à predição dos
outcomes.

22

23
2. Enquadramento teórico

24
2.1. Avaliação de fragilidade em pessoas idosas
Autores: Tiago Coelho, Constança Paúl, Lia Fernandes
Revista Portuguesa de Enfermagem de Saúde Mental (em processo de revisão)
Indexação: CINAHL Complete; Consejo Iberoamericano de Editores de Revistas de
Enfermería y Afines (CIBERE); EBSCO Discovery Service; Latindex; REV@Enf - Biblioteca
Virtual em Saúde – Enfermagem; SciELO Citation Index - Thomson Reuters; SciELO
Portugal;

25
Resumo
Contexto: Fragilidade refere-se a um estado de vulnerabilidade aumentada que se traduz
num elevado risco de incapacidade, institucionalização e morte. Trata-se de uma síndrome
sobre a qual não há consenso, nomeadamente em relação à sua conceptualização e
operacionalização.
Objetivo: Analisar os instrumentos de avaliação de fragilidade em idosos, desenvolvidos
nos últimos dez anos.
Metodologia: Revisão não-sistemática da literatura, de artigos publicados entre Maio de
2004 a 2014, disponíveis na PubMed. Foram incluídos estudos que descreviam e testavam
instrumentos especificamente desenvolvidos para a avaliação/identificação de fragilidade,
e que incluíam na sua amostra pessoas com idade ≥65 anos. Artigos não escritos em inglês
e/ou português foram excluídos.
Resultados: Foram analisados 14 artigos. Verificou-se um crescente interesse a nível
europeu para o desenvolvimento de medidas de avaliação de fragilidade. A administração
de oito dos instrumentos identificados envolvia a realização de uma avaliação clínica,
enquanto os restantes se baseavam maioritariamente na autoavaliação. Um número
significativo de instrumentos resulta da conceptualização de fragilidade como um estado
exclusivo ou predominantemente físico. Os componentes mais comuns relacionavam-se
com a mobilidade/desempenho motor, a nutrição e a exaustão/fadiga, seguidos de fatores
relacionados com a cognição e com o suporte e rede social do idoso. A prevalência de
fragilidade variou entre 5% e 51%.
Conclusões: A importância da deteção atempada de situações de fragilidade salienta a
necessidade de se testar a aplicabilidade, a fiabilidade e a validade dos instrumentos
existentes, particularmente em Portugal, com poucos estudos, ainda, sobre esta temática.
PALAVRAS-CHAVE: fragilidade; idosos; avaliação; instrumentos
Resumen
Introducción: Fragilidad se refiere a un estado de mayor vulnerabilidad que se traduce en
un mayor riesgo de discapacidad, de institucionalización y de muerte. Es un síndrome para
el cual no existe un consenso, sobre todo cuanto a su conceptualización y
operacionalización.
Objetivo: Analizar los instrumentos de evaluación de fragilidad en los ancianos,
desarrollado en los últimos diez años.

26
Metodología: Revisión no sistemática de la literatura de artículos publicados entre mayo
2004-2014, disponible en PubMed. Se incluyeron los estudios que describían y estaban
probando instrumentos desarrollados específicamente para la evaluación/identificación de
fragilidad, y que se incluyen en su muestra personas de edad ≥65 años. Se excluyeron los
artículos no escritos en inglés y/o portugués.
Resultados: Fueron analizados 14 artículos. Hubo un creciente interés europeo en el
desarrollo de medidas de evaluación de fragilidad. La administración de ocho de los
instrumentos identificados involucró la realización de una evaluación clínica, mientras que
los restantes se basaron en gran medida en la autoevaluación. Un número significativo de
instrumentos resulta de la conceptualización de fragilidad como un estado exclusivo o
predominantemente físico. Los componentes más comunes estaban relacionados con la
movilidad/desempeño motor, la nutrición y el cansancio/fatiga, seguido de los factores
relacionados con la cognición y el soporte y red social de los ancianos. La prevalencia de
fragilidad varió entre 5% y 51%.
Conclusiones: La importancia de la detección temprana de las situaciones de fragilidad
hace hincapié en la necesidad de probar la factibilidad, fiabilidad y validez de los
instrumentos existentes, en particular en Portugal, donde aún hay pocos estudios sobre
este tema.
DESCRIPTORES: fragilidad; ancianos; evaluación; instrumentos
Abstract
Background: Frailty is a state of increased vulnerability that entails a high risk of disability,
institutionalization and death. It is a syndrome about which there is no consensus,
particularly regarding its conceptualization and operationalization.
Aim: To analyze the assessment instruments of frailty in the elderly, developed in the last
ten years.
Methods: Non-systematic literature review of articles published between May of 2004 to
2014, available on PubMed. Studies that described and tested instruments specifically
developed to assess/identify frailty, and that comprised in their sample individuals with ages
≥65 years, were included. Articles not written in English and/or Portuguese were excluded.
Results: In the present study, 14 articles were analyzed. A growing European interest in
the development of frailty assessment measures was found. The administration of eight of
the identified instruments involved conducting a clinical evaluation, while the remaining
were based largely on self-report. A significant number of instruments results from the

27
conceptualization of frailty as an exclusive or predominantly physical state. The most
common components were related to mobility/motor performance, nutrition, and
exhaustion/fatigue, followed by factors related to cognition and social support/network of
the elderly. The prevalence of frailty varied between 5% and 51%.
Conclusions: The importance of early detection of frailty situations stresses the need to
test the feasibility, reliability and validity of existing instruments, particularly in Portugal,
where few studies on this topic exist.
KEY-WORDS: frailty; elderly; assessment; instruments

28
Introdução
O aumento da longevidade é uma das grandes conquistas da humanidade. No
entanto, o crescimento do número de pessoas idosas é acompanhado pelo incremento de
situações de fragilidade (Collard, Boter, Schoevers, & Oude Voshaar, 2012).
A fragilidade trata-se de uma síndrome clínica que se refere a um estado de
vulnerabilidade aumentada, em que o mínimo fator de stresse pode levar a resultados
adversos clinicamente significativos, tais como quedas, incapacidade, institucionalização,
hospitalização e morte (Morley et al., 2013). É uma condição específica da população mais
envelhecida – particularmente comum em pessoas com 80 ou mais anos de idade – mas
que não se insere num processo de envelhecimento normal, podendo ser prevenida,
atenuada ou revertida (Abellan van Kan et al., 2008). Neste sentido, destaca-se a
importância da sua deteção atempada, particularmente nos contextos dos cuidados de
saúde primários e comunitários.
Apesar de, ao longo das últimas três décadas, o constructo de fragilidade ter
assumido uma crescente relevância ao nível do estudo do envelhecimento e da prestação
de cuidados de saúde a pessoas mais velhas, a sua definição e enquadramento clínico
não são consensuais (Sternberg, Wershof Schwartz, Karunananthan, Bergman, & Mark
Clarfield, 2011). Efetivamente, existem diversos modelos conceptuais sobre fragilidade,
com implicações distintas no que se refere à identificação da síndrome na prática clínica.
O modelo biológico e o modelo de acumulação de défices são as conceptualizações
geradoras de maior consenso na comunidade científica (Morley et al., 2013).
De acordo com o modelo biológico, desenvolvido por Fried et al. (2001), a fragilidade
trata-se de uma condição exclusivamente física, resultante essencialmente de um declínio
exacerbado da reserva fisiológica a nível multi-sistémico (músculo-esquelético,
imunológico, hormonal, inflamatório, metabólico e do sistema nervoso central e autónomo)
e das suas manifestações corporais, com destaque para a sarcopenia. Nesta linha de
pensamento, é proposta uma apresentação clínica da síndrome – designada como o
Fenótipo de Fragilidade – e que inclui: fraqueza, lentidão, exaustão, perda de peso
involuntária e baixos níveis de atividade física. A operacionalização deste modelo –
também identificado na Cardiovascular Health Study (CHS) Scale, em referência ao estudo
em que foi desenvolvido – implica a avaliação dos componentes do Fenótipo, sendo a
presença de três ou mais elementos, indicativa de um estado de fragilidade, e, de um a
dois, de pré-fragilidade.
Por sua vez, no modelo de acumulação de défices, proposto por Mitnitski, Mogilner,
MacKnight, e Rockwood (2002), fragilidade é definida como uma síndrome

29
multidimensional, resultante da conjugação de défices relacionados com o envelhecimento,
cujo incremento implica uma diminuição das reservas e um aumento da vulnerabilidade.
Estes défices podem ser sinais, sintomas, doenças e alterações funcionais ao nível das
atividades diárias. No entanto, a natureza e quantidade exatas destes fatores não são pré-
definidas no modelo. Em alternativa, os autores sugerem o cálculo do Índice de Fragilidade,
que se refere à razão entre os défices presentes e o total de défices considerados numa
avaliação clínica. Tradicionalmente, são tidos em conta entre 20 a 70 défices, incluindo na
sua maioria comorbilidades e dificuldades ao nível do desempenho de atividades de vida
diária.
Apesar da sua predominância, vários autores colocam objeções a estes modelos,
seja a nível conceptual, seja a nível operacional (Abellan van Kan et al., 2008; Sternberg
et al., 2011). Em primeiro lugar, a definição da síndrome como exclusivamente física é
frequentemente criticada, sendo que cada vez mais investigadores defendem a sua
natureza multidimensional e biopsicossocial. A argumentação, nesta perspetiva, relaciona-
se com o facto de uma caracterização demasiado estreita de fragilidade não corresponder
a uma visão holística do indivíduo e se afastar da conceptualização de saúde enquanto
bem-estar físico, psicológico e social. Em segundo lugar, a ênfase excessiva dada às
comorbilidades e à incapacidade, no modelo de Mitnitski et al. (2002), é usualmente
contestada, uma vez que visões contemporâneas de fragilidade procuram cada vez mais
distingui-la como uma síndrome específica, mais complexa do que o resultado da
combinação de condições patológicas e défices funcionais. De facto, vários autores
preferem considerar estes dois aspetos, respetivamente, como potenciais causas e
resultados de um estado de fragilidade. Por outro lado, é possível identificar limitações ao
nível da aplicabilidade clínica da avaliação do Fenótipo de Fragilidade e do cálculo do
Índice de Fragilidade. Com efeito, se refletirmos que a CHS scale envolve a realização de
medições (força manual/fraqueza e velocidade da marcha/lentidão) e que a elaboração do
Índice envolve uma avaliação clínica detalhada que permita a identificação de uma grande
quantidade de défices, será fácil de compreender a dificuldade em implementar a avaliação
de fragilidade ao nível dos cuidados de saúde. Para além disso, muitos autores questionam
se estas ferramentas são suficientemente sensíveis e específicas para identificar os
indivíduos verdadeiramente frágeis.
Neste sentido, considerando a falta de consenso em torno da conceptualização e
subsequentemente da avaliação de fragilidade, o presente estudo tem como objetivo
identificar e analisar os instrumentos de avaliação de fragilidade em idosos, desenvolvidos
nos últimos dez anos.

30
Metodologia
No presente estudo procede-se a uma revisão de artigos publicados entre Maio de
2004 e Maio de 2014, disponíveis na base de dados eletrónica PubMed, combinando os
termos “elderly”, “older” ou “aged”, com “frailty” ou “frail”, e com “assessment”, “screening”,
“tool”, “instrument”, “scale”, “measure” ou “diagnosis”. Foram incluídos estudos empíricos
que descreviam e testavam a operacionalização de instrumentos (ex.: questionários,
escalas, índices) especificamente desenvolvidos para a avaliação/identificação da
síndrome de fragilidade, e que incluíssem na sua amostra (na baseline) pessoas com idade
igual ou superior a 65 anos. Por sua vez, foram excluídos artigos não escritos em inglês
e/ou português, estudos de caso, artigos referentes a utilizações subsequentes de
instrumentos de avaliação de fragilidade previamente aplicados a pessoas idosas e
estudos em que a fragilidade é medida através da avaliação de diversos fatores não
integrados num instrumento com uma designação específica.
A pesquisa inicial envolveu a avaliação dos resumos dos artigos identificados por
parte de dois dos autores do presente estudo, de forma independente e cega, obedecendo
rigorosamente aos critérios de inclusão e exclusão previamente definidos. A análise dos
artigos na íntegra foi realizada nos casos em que os resumos não eram suficientemente
esclarecedores. Os estudos foram examinados considerando as seguintes características:
objetivo, desenho de estudo, amostra, contexto, critérios de inclusão e exclusão, medidas
recrutadas para a avaliação de fragilidade e principais resultados.
Por fim, foi efetuada uma análise da bibliografia dos artigos selecionados com o
objetivo de potencialmente identificar outros estudos a incluir na presente revisão.
Resultados
A pesquisa inicial permitiu identificar 4079 artigos, dos quais 14 foram selecionados
e incluídos na análise. Não foram identificados estudos adicionais com base na análise
bibliográfica dos artigos selecionados. Os principais dados relativos aos estudos
selecionados e aos instrumentos utilizados estão sumariados na tabela 1.

31
Tabela 1: Descrição dos estudos analisados
Instrumento e
referência
Descrição do instrumento e
componentes de fragilidade
Desenho
de
estudo
Contexto e
amostra
%
fragilidade
*
Frailty Index -
Comprehensive
Geriatric
Assessment (FI-
CGA)
Jones, Song, &
Rockwood, 2004
Índice constituído por 11
défices/componentes de fragilidade e
pontuado com base numa avaliação
clínica:
Défices a nível da cognição, da
mobilidade, do equilíbrio, da
comunicação (incluindo visão e audição),
da nutrição, da função intestinal e da
função vesical, perturbação do humor,
dependência nas atividades diárias,
necessidade de apoio social e presença
de comorbilidades.
Pontuação total obtida através da soma
de cada item (pontuado de 0 a 2
consoante a gravidade) com metade do
número total de comorbilidades.
0-7 = fragilidade ligeira.
7-13 = fragilidade moderada.
>13 = fragilidade severa.
Lo
ng
itu
din
al
Canadá
(Mobile
Geriatric
Assessment
Team trial)
n = 182
(≥65 anos;
residentes na
comunidade;
previamente
identificados
como frágeis)
Ligeira:
17%
Moderada:
58%
Severa:
25%
Clinical Global
Impression of
Change in
Physical Frailty
instrument
(CGIC-PF
instrument)
Studenski et al.,
2004
Escala constituída por 6 componentes e
7 consequências de fragilidade, pontuada
com base em avaliações clínicas
sucessivas:
Componentes – limitações da
mobilidade, força, equilíbrio, resistência,
nutrição e desempenho neuromotor;
Consequências – utilização de cuidados
de saúde, dependência nas atividades
diárias, complexidade clínica e alterações
ao nível da aparência, auto-perceção da
saúde, interação social e do estado
emocional.
Cada item pontuado de 1 (declínio
evidente) a 7 (melhoria evidente) com
base na mudança verificada entre
avaliações.
Tra
nsve
rsa
l
Estados
Unidos da
América
n = 24
(≥70 anos)
Não
aplicável
(NA)

32
Clinical Frailty
Scale (CFS)
Rockwood et al.,
2005
Escala classificada de 1 a 7 com base
numa apreciação clínica:
1 – Completamente em forma, robusto e
pratica atividade física com frequência;
2 – Saudável mas numa forma menor do
que na categoria 1;
3 – Em bom estado, com comorbilidades
mas com sintomas bem controlados;
4 – Aparentemente vulnerável e com
alguns sintomas de doenças;
5 – Ligeiramente frágil, dependendo de
outros ao nível das atividades de vida
diária instrumentais;
6 – Moderadamente frágil, necessitando
de ajuda em atividades instrumentais e
básicas;
7 – Severamente frágil, sendo
completamente dependente de outros
nas atividades diárias. L
on
gitu
din
al
Canadá
(Canadian
Study of Heath
and Aging)
n = 2305
(≥65 anos)
43%
Edmonton Frail
Scale (EFS)
Rolfson,
Majumdar,
Tsuyuki, Tahir, &
Rockwood, 2006
Escala com 9 componentes de
fragilidade, pontuada com base no auto-
reporte do participante e na realização de
testes:
Défice cognitivo (teste do relógio),
limitações da mobilidade funcional (teste
Timed Up and Go), humor depressivo,
dependência nas atividades diárias,
perda de peso, necessidade de apoio
social, consumo de ≥5 medicamentos,
incontinência, pobre estado de saúde.
Pontuação total obtida através da soma
de cada item (pontuado de 0 a 1 ou de 0
a 2 consoante a gravidade).
Tra
nsve
rsa
l Canadá
n = 158
(≥65 anos)
NA
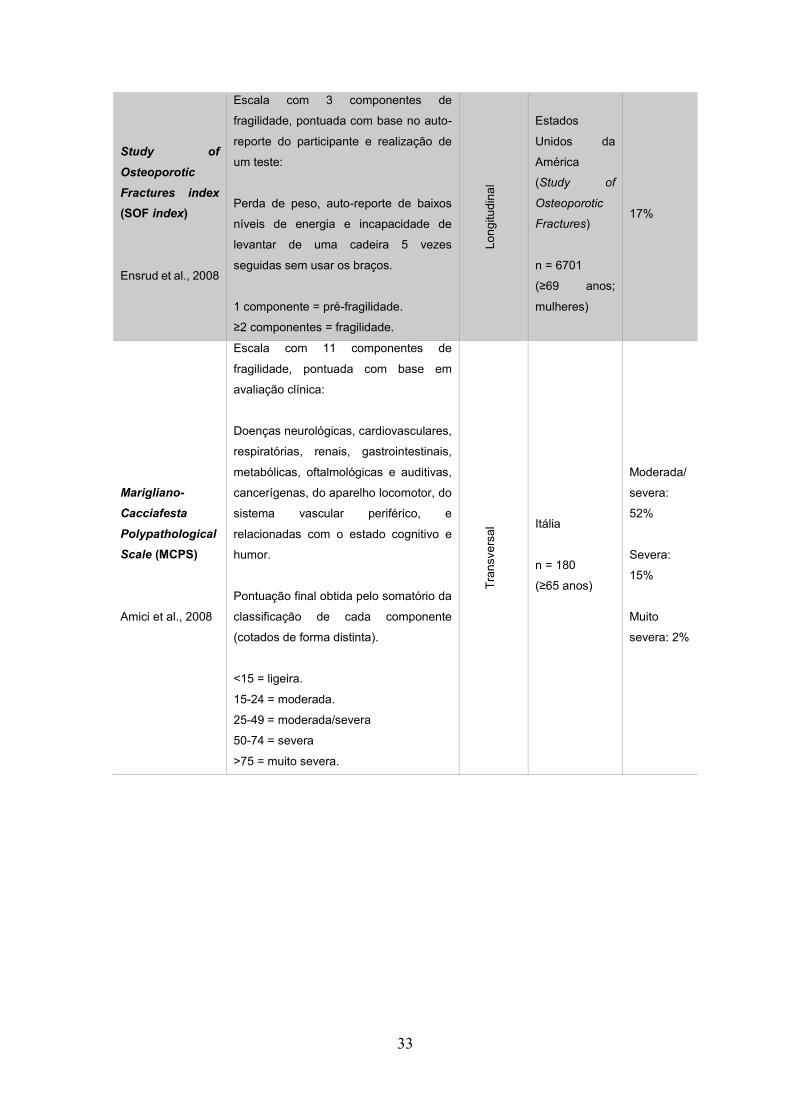
33
Study of
Osteoporotic
Fractures index
(SOF index)
Ensrud et al., 2008
Escala com 3 componentes de
fragilidade, pontuada com base no auto-
reporte do participante e realização de
um teste:
Perda de peso, auto-reporte de baixos
níveis de energia e incapacidade de
levantar de uma cadeira 5 vezes
seguidas sem usar os braços.
1 componente = pré-fragilidade.
≥2 componentes = fragilidade.
Lo
ng
itu
din
al
Estados
Unidos da
América
(Study of
Osteoporotic
Fractures)
n = 6701
(≥69 anos;
mulheres)
17%
Marigliano-
Cacciafesta
Polypathological
Scale (MCPS)
Amici et al., 2008
Escala com 11 componentes de
fragilidade, pontuada com base em
avaliação clínica:
Doenças neurológicas, cardiovasculares,
respiratórias, renais, gastrointestinais,
metabólicas, oftalmológicas e auditivas,
cancerígenas, do aparelho locomotor, do
sistema vascular periférico, e
relacionadas com o estado cognitivo e
humor.
Pontuação final obtida pelo somatório da
classificação de cada componente
(cotados de forma distinta).
<15 = ligeira.
15-24 = moderada.
25-49 = moderada/severa
50-74 = severa
>75 = muito severa.
Tra
nsve
rsa
l Itália
n = 180
(≥65 anos)
Moderada/
severa:
52%
Severa:
15%
Muito
severa: 2%

34
Tilburg Frailty
Indicator (TFI)
Gobbens, van
Assen, Luijkx,
Wijnen-
Sponselee, &
Schols, 2010
Questionário destinado ao auto-reporte
constituído por 10 determinantes de
fragilidade (características
sociodemográficas, eventos de vida no
último ano, estilo de vida, satisfação com
o ambiente habitacional e
comorbilidades) e 15 componentes de
fragilidade, divididos em 3 domínios:
Domínio físico – pobre saúde física,
perda de peso involuntária, dificuldade
em andar e em manter o equilíbrio,
problemas de audição e de visão, falta de
força nas mãos e fadiga;
Domínio psicológico – problemas de
memória, sintomatologia depressiva e
ansiosa, e dificuldades em lidar com os
problemas (coping);
Domínio social – viver sozinho,
insatisfação com relações e suporte
social.
≥5 componentes = fragilidade.
Tra
nsve
rsa
l
Holanda
n = 479
(≥75 anos;
residentes na
comunidade)
47%
SHARE Frailty
Instrument
(SHARE-FI)
Romero-Ortuno,
Walsh, Lawlor, &
Kenny, 2010
Escala com 5 componentes de
fragilidade, pontuada com base no auto-
reporte do participante e realização de
uma medição:
Diminuição do apetite, limitação da
mobilidade, exaustão, baixos níveis de
atividade física e fraqueza muscular
(medida com dinamómetro).
Pontuação calculada com base em
fórmulas ajustadas ao sexo e baseadas
na predição de mortalidade na população
estudada.
Lo
ng
itu
din
al
Alemanha,
Áustria,
Bélgica,
Dinamarca,
Espanha,
França,
Grécia, Israel,
Itália, Holanda,
Suécia, Suíça
(Survey of
Health, Aging
and
Retirement in
Europe)
n = 28361
(≥50 anos;
residentes na
comunidade)
Pré-frágil:
21%
Frágil: 5%

35
Comprehensive
Assessment of
Frailty test (CAF
test)
Sundermann et
al., 2011
Escala com 11 componentes de
fragilidade, pontuada com base numa
avaliação clínica (incluindo a realização
de testes laboratoriais e aplicação de
outros instrumentos estandardizados):
Fraqueza muscular, exaustão auto-
reportada, lentidão de marcha, baixos
níveis de atividade física, défices
nutritivos, problemas de equilíbrio,
dificuldades na execução motora de
tarefas simples, défices ao nível da
função respiratória, cardíaca, renal e
hepática.
Cada item é pontuado entre 0 a 1 ou 0 a
4, com base na gravidade do défice.
Pontuação final produzida através do
somatório da cotação de cada item e da
pontuação obtida na aplicação paralela
da CFS.
1-10 = não frágil.
11-25 = moderadamente frágil.
≥26 = severamente frágil.
Lo
ng
itu
din
al
Estados
Unidos da
América
n = 400
(≥74 anos;
hospitalizados
a aguardar
cirurgia
cardíaca)
Moderada
mente
frágil: 43%
Severame
nte frágil:
8%
FRAIL scale
Hyde et al., 2010
Questionário destinado ao auto-reporte
constituído por 5 componentes de
fragilidade:
Fadiga, baixa resistência, dificuldade em
caminhar, ter ≥5 doenças e perda de
peso.
1-2 componentes = pré-fragilidade.
≥3 componentes = fragilidade.
Lo
ng
itu
din
al
Austrália
(Health in Men
Study)
n = 3616
(≥70 anos;
homens,
residentes na
comunidade)
Pré-frágil:
46.2%
Frágil:
15.2%

36
Comprehensive
Frailty
Assessment
Instrument
(CFAI)
De Witte et al.,
2013
Questionário destinado ao auto-reporte
constituído por 23 componentes de
fragilidade, divididos em 4 domínios:
Domínio físico – limitações funcionais em
atividades diárias pouco exigentes,
dificuldade em levantar objetos, em subir
escadas e em fazer caminhadas;
Domínio psicológico – sentimento geral
de infelicidade, pressão, vazio, falta de
valor e falta de autoconfiança,
incapacidade de lidar com problemas,
sentir falta de pessoas à sua volta, sentir-
se rejeitado;
Domínio social – reduzida quantidade de
pessoas próximas, de confiança e que
ajudem a resolver problemas, assim
como número reduzido de pessoas em 3
níveis da rede de suporte social.
Domínio ambiental – más condições
gerais da habitação, problemas ao nível
do aquecimento da habitação, falta ou
inexistência de conforto na habitação e
má vizinhança.
Pontuação final obtida pelo somatório da
classificação de cada componente
(cotados de forma distinta).
Tra
nsve
rsa
l
Bélgica
(Belgian
Ageing
Studies)
n = 33629
(≥60 anos;
residentes na
comunidade)
NA

37
Easycare Two-
step Older
persons
Screening
(Easycare-TOS)
van Kempen et al.,
2013
Inventário que constitui o 1º passo da
avaliação é formado por 14 componentes
de fragilidade a serem considerados
numa avaliação clínica:
Número de comorbilidades e
medicamentos, défices cognitivos,
visuais e auditivos, dependência em
atividades diárias, limitações da
mobilidade, historial de quedas,
necessidade de cuidado pessoal, solidão,
rede social reduzida, sintomatologia
depressiva e ansiosa, queixas somáticas
e outras perturbações psiquiátricas.
Com base no estado geral do indivíduo,
considerando os componentes do 1º
passo, o clínico geral é responsável por
classificar o indivíduo como não frágil ou
frágil. Em caso de dúvida ou de ser
identificada uma situação de fragilidade,
o indivíduo é encaminhado para o 2º
passo, que consiste de uma avaliação
detalhada com o instrumento EASY-
Care.
Tra
nsve
rsa
l
Holanda
n = 151
(≥70 anos;
residentes na
comunidade)
24%
Gerontopole
Frailty Screening
Tool (GFST)
Vellas et al., 2013
Inventário formado por 6 componentes de
fragilidade a serem considerados numa
avaliação clínica:
Perda de peso involuntária, fadiga, viver
sozinho, problemas de memória, lentidão
da marcha, dificuldades na mobilidade.
Com base no estado geral do indivíduo,
considerando os componentes de
fragilidade, o clínico geral é responsável
por classificar o indivíduo como não frágil
ou frágil
Tra
nsve
rsa
l
França
n = 442
(≥65 anos;
residentes na
comunidade)
NA

38
Frailty Trait Scale
(FTS)
Garcia-Garcia et
al., 2014
Escala com 7 componentes de
fragilidade, pontuada com base numa
avaliação clínica (incluindo a realização
de testes laboratoriais e aplicação de
outros instrumentos estandardizados):
Reduzida atividade física, desequilíbrio
energético e défices nutritivos, fraqueza
muscular, baixa resistência, lentidão,
défices no funcionamento do sistema
nervoso (equilíbrio e cognição) e do
sistema vascular.
Cada item é pontuado entre 0 a 4 ou 0 a
5, com base na gravidade do défice.
Pontuação final produzida através do
rácio entre somatório da cotação de cada
item e cotação máxima da escala.
Lo
ng
itu
din
al
Espanha
(Toledo Study
for Healthy
Aging)
n = 1972
(≥64 anos)
NA
* No caso dos estudos longitudinais a prevalência de fragilidade é relativa à baseline.
Incluíram-se sete estudos transversais (Amici et al., 2008; De Witte et al., 2013;
Gobbens et al., 2010; Rolfson et al., 2006; Studenski et al., 2004; van Kempen et al., 2013;
Vellas et al., 2013) e sete estudos longitudinais (Ensrud et al., 2008; Garcia-Garcia et al.,
2014; Hyde et al., 2010; Jones et al., 2004; Rockwood et al., 2005; Romero-Ortuno et al.,
2010; Sundermann et al., 2011). Sete estudos foram realizados a nível europeu (Amici et
al., 2008; De Witte et al., 2013; Garcia-Garcia et al., 2014; Gobbens et al., 2010; Romero-
Ortuno et al., 2010; van Kempen et al., 2013; Vellas et al., 2013), seis estudos na América
do Norte (Ensrud et al., 2008; Jones et al., 2004; Rockwood et al., 2005; Rolfson et al.,
2006; Studenski et al., 2004; Sundermann et al., 2011) e um estudo na Oceânia (Hyde et
al., 2010). Na globalidade, verificou-se que os estudos europeus eram mais recentes que
os norte-americanos.
Relativamente à administração dos instrumentos de avaliação identificados, três
baseiam-se exclusivamente na autoaplicação (TFI, FRAIL scale e CFAI), três na
autoaplicação e na realização de medições/testes (EFS, SOF index e SHARE-FI),
enquanto os restantes se baseiam em avaliações clínicas. Deste último grupo destaca-se
a eventual necessidade de complementar o Easycare-TOS com a administração de outro
instrumento estandardizado, assim como a obrigatoriedade de realização de testes
laboratoriais e aplicação de outras medidas estandardizadas para pontuar o CAF test e a
FTS.

39
Por sua vez, quanto aos componentes de fragilidade avaliados, os instrumentos
CGIC-PF instrument, SOF index, SHARE-FI e o CAF test incluem apenas fatores
físicos/biológicos. A esses aspetos biocomportamentais, o GFST e a FTS acrescentam um
componente cognitivo, enquanto a FRAIL scale acrescenta um componente relacionado
com a presença de comorbilidades. Por outro lado, o MCPS avalia fragilidade
exclusivamente como a conjugação de uma série de doenças, e a CFS classifica indivíduos
como frágeis essencialmente com base em défices funcionais e comorbilidades. As
restantes medidas podem ser consideradas como multidimensionais, destacando-se o TFI
por ser a única ferramenta a não incluir componentes diretamente relacionados com
dificuldades no desempenho de tarefas diárias/incapacidade e com condições patológicas.
Os fatores mais frequentemente identificados como componentes de fragilidade
foram os relacionados com a mobilidade/desempenho motor, nutrição e exaustão/fadiga.
A frequência dos diferentes componentes encontra-se sumarizada no gráfico 1.
* Incluídos apenas os componentes presentes em mais de 25% (≥4) dos instrumentos.
Por fim, considerando apenas os instrumentos com pontos de corte que permitissem
distinguir indivíduos frágeis de não-frágeis, verificou-se que a prevalência de fragilidade
variava entre 5% (Romero-Ortuno et al., 2010) e 51% (Sundermann et al., 2011).
Discussão
A presente revisão permitiu identificar e analisar uma quantidade considerável de
instrumentos de avaliação de fragilidade. Estas ferramentas foram desenvolvidas em
0 2 4 6 8 10 12 14
Humor
Níveis de atividade fisica
Equilíbrio
Dependência em atividades diárias
Comorbilidades
Força
Cognição
Suporte e rede social
Exaustão/fadiga/energia
Nutrição/perda de peso ou apetite
Mobilidade/desempenho motor
Gráfico 1: Frequência absoluta dos componentes de fragilidade incluídos na totalidade dos instrumentos analisados*

40
contextos diferentes e representam definições distintas de fragilidade. Os autores dos
artigos selecionados e incluídos correspondem aos autores dos instrumentos, à exceção
da FRAIL scale que, apesar da sua aplicação ter sido testada pela primeira vez em pessoas
idosas no estudo de Hyde et al. (2010), foi originalmente proposta por Abellan van Kan et
al. (2008).
Verificou-se que os instrumentos mais recentemente desenvolvidos eram
maioritariamente europeus, o que poderá resultar de um incremento do interesse da
comunidade científica destes países relativamente ao tema de fragilidade e à validação de
medidas para os respetivos grupos populacionais (Romero-Ortuno et al., 2010).
Por sua vez, a prevalência de fragilidade reportada nos estudos apresentou uma
grande variabilidade. Este aspeto estará forçosamente relacionado com os componentes
de fragilidade avaliados, assim como com as características das amostras analisadas
(Collard et al., 2012). Efetivamente, estudos recentes demonstram que indivíduos mais
velhos, do sexo feminino e com doença crónica, têm maior probabilidade de se tornarem
frágeis (Collard et al., 2012; Morley et al., 2013). Em concordância, verificou-se que a
prevalência mais baixa foi detetada numa amostra de indivíduos com 50 ou mais anos de
idade e residentes na comunidade (Romero-Ortuno et al., 2010), enquanto que a
prevalência mais elevada se verificou numa amostra de indivíduos com 74 ou mais anos e
com doença cardiovascular grave (a aguardar cirurgia) (Sundermann et al., 2011).
A heterogeneidade entre os componentes de fragilidade avaliados espelha a falta de
consenso em torno desta temática (Sternberg et al., 2011). Contudo, um número
considerável de instrumentos focou-se exclusivamente em aspetos físicos/biológicos do
funcionamento humano. Para além disso, fatores relacionados com o Fenótipo de
Fragilidade (Fried et al., 2001) foram dos componentes mais incluídos nas medidas
analisadas, referindo-se, inclusivamente, aos três mais utilizados (lentidão/mobilidade,
perda de peso/nutrição e exaustão/fadiga). Estas constatações traduzem a tendência da
maior parte dos autores para desenvolver a sua definição de fragilidade baseada no
modelo biológico (Collard et al., 2012; Sternberg et al., 2011). Neste sentido, as novas
propostas de avaliação da síndrome surgem com os objetivos de facilitar a sua execução
na prática clínica, de desenvolver medidas com maior poder preditivo e/ou para superar
divergências teóricas. Por exemplo, no caso do SOF index (Ensrud et al., 2008), a intenção
dos autores foi essencialmente simplificar a avaliação de fragilidade e promover a deteção
da síndrome em vários contextos, tendo selecionado e adaptado os três itens do Fenótipo
que apresentaram maior validade preditiva em estudos anteriores. Por sua vez, o SHARE-
FI (Romero-Ortuno et al., 2010) resultou de uma subtil alteração na avaliação do Fenótipo
para tornar a sua aplicação mais rápida, destaca-se por apresentar uma pontuação
específica, baseada em fórmulas ajustadas ao sexo e à predição de mortalidade na

41
amostra estudada (representativa de vários países europeus). Por outro lado, o TFI
(Gobbens et al., 2010) espelha uma diferente conceptualização teórica de fragilidade
(modelo integral de fragilidade) e, apesar de incluir quatro componentes do Fenótipo,
distancia-se das visões tradicionais da síndrome uma vez que inclui fatores psicológicos e
sociais.
Concomitantemente, alguns instrumentos [ex.: FI-CGA (Jones et al., 2004), CFS
(Rockwood et al., 2005) e MCPS (Amici et al., 2008)] aproximam-se mais do Índice de
Fragilidade (Mitnitski et al., 2002), pela valorização de fatores relacionados com doenças
e défices funcionais em atividades diárias. De facto, apesar da maioria dos autores
concordar que fragilidade, comorbilidade e incapacidade são condições relacionadas mas
distintas (Morley et al., 2013; Sternberg et al., 2011), algumas das medidas analisadas não
fazem essa diferenciação.
Verificou-se, porém, que os componentes mais frequentemente incluídos nas
medidas analisadas foram relativamente semelhantes aos identificados como mais
prevalentes numa revisão recente (Sternberg et al., 2011), sobre as diferentes definições
de fragilidade propostas entre 1997 e 2009. Efetivamente, se analisarmos as principais
diferenças nos dados obtidos, é possível afirmar que houve uma maior frequência de
componentes relacionados com a fadiga/exaustão/energia e com o suporte e rede social
do idoso, tendo-se verificado uma menor proporção de fatores relacionados com os níveis
de atividade física.
Conclusões
A presente revisão surge como um contributo para uma melhor compreensão do
estado da arte sobre fragilidade e a sua avaliação, na medida em que existem, ainda,
poucas publicações em Portugal sobre o tema. No entanto, deve salientar-se que os
resultados apresentados devem ser analisados tendo em consideração os critérios de
inclusão e exclusão pré-definidos. Como principal limitação desta revisão destaca-se a não
inclusão de artigos relativos a constructos intrinsecamente associados a fragilidade, como
por exemplo a vulnerabilidade.
A escolha do instrumento de avaliação de fragilidade deve ter em conta o modelo
conceptual na sua base, a sua forma de administração, a adequabilidade ao contexto e,
entre outras propriedades, a sua capacidade preditiva. Neste sentido, justifica-se a
realização de estudos – idealmente longitudinais – para determinar quais as medidas que
mais se ajustam às características da população idosa e dos cuidados de saúde e sociais.

42
A fragilidade deve ser encarada como uma questão de saúde pública, sendo a sua
deteção atempada fundamental para a manutenção da qualidade de vida dos mais velhos.
Referências bibliográficas
Abellan van Kan, G., Rolland, Y., Bergman, H., Morley, J. E., Kritchevsky, S. B., & Vellas,
B. (2008). The I.A.N.A Task Force on frailty assessment of older people in clinical
practice. J Nutr Health Aging, 12(1), 29-37.
Amici, A., Baratta, A., Linguanti, A., Giudice, G., Servello, A., Scalise, C., . . . Cacciafesta,
M. (2008). The Marigliano-Cacciafesta polypathological scale: a tool for assessing
fragility. Arch Gerontol Geriatr, 46(3), 327-334. doi: 10.1016/j.archger.2007.05.007
Collard, R. M., Boter, H., Schoevers, R. A., & Oude Voshaar, R. C. (2012). Prevalence of
frailty in community-dwelling older persons: a systematic review. J Am Geriatr Soc,
60(8), 1487-1492. doi: 10.1111/j.1532-5415.2012.04054.x
De Witte, N., Gobbens, R., De Donder, L., Dury, S., Buffel, T., Schols, J., & Verte, D. (2013).
The comprehensive frailty assessment instrument: development, validity and
reliability. Geriatr Nurs, 34(4), 274-281. doi: 10.1016/j.gerinurse.2013.03.002
Ensrud, K. E., Ewing, S. K., Taylor, B. C., Fink, H. A., Cawthon, P. M., Stone, K. L., . . .
Cummings, S. R. (2008). Comparison of 2 frailty indexes for prediction of falls,
disability, fractures, and death in older women. Arch Intern Med, 168(4), 382-389.
doi: 10.1001/archinternmed.2007.113
Fried, L. P., Tangen, C. M., Walston, J., Newman, A. B., Hirsch, C., Gottdiener, J., . . .
Cardiovascular Health Study Collaborative Research, G. (2001). Frailty in older
adults: evidence for a phenotype. J Gerontol A Biol Sci Med Sci, 56(3), M146-156.
Garcia-Garcia, F. J., Carcaillon, L., Fernandez-Tresguerres, J., Alfaro, A., Larrion, J. L.,
Castillo, C., & Rodriguez-Manas, L. (2014). A new operational definition of frailty:
the frailty trait scale. J Am Med Dir Assoc, 15(5), 371.e377-371.e313. doi:
10.1016/j.jamda.2014.01.004
Gobbens, R. J., van Assen, M. A., Luijkx, K. G., Wijnen-Sponselee, M. T., & Schols, J. M.
(2010). The Tilburg Frailty Indicator: psychometric properties. J Am Med Dir Assoc,
11(5), 344-355. doi: 10.1016/j.jamda.2009.11.003
Hyde, Z., Flicker, L., Almeida, O. P., Hankey, G. J., McCaul, K. A., Chubb, S. A., & Yeap,
B. B. (2010). Low free testosterone predicts frailty in older men: the health in men
study. J Clin Endocrinol Metab, 95(7), 3165-3172. doi: 10.1210/jc.2009-2754

43
Jones, D. M., Song, X., & Rockwood, K. (2004). Operationalizing a frailty index from a
standardized comprehensive geriatric assessment. J Am Geriatr Soc, 52(11), 1929-
1933. doi: 10.1111/j.1532-5415.2004.52521.x
Mitnitski, A. B., Mogilner, A. J., MacKnight, C., & Rockwood, K. (2002). The mortality rate
as a function of accumulated deficits in a frailty index. Mech Ageing Dev, 123(11),
1457-1460. doi: Pii S0047-6374(02)00082-9. Doi 10.1016/S0047-6374(02)00082-9
Morley, J. E., Vellas, B., van Kan, G. A., Anker, S. D., Bauer, J. M., Bernabei, R., . . .
Walston, J. (2013). Frailty consensus: a call to action. J Am Med Dir Assoc, 14(6),
392-397. doi: 10.1016/j.jamda.2013.03.022
Rockwood, K., Song, X., MacKnight, C., Bergman, H., Hogan, D. B., McDowell, I., &
Mitnitski, A. (2005). A global clinical measure of fitness and frailty in elderly people.
CMAJ, 173(5), 489-495. doi: 10.1503/cmaj.050051
Rolfson, D. B., Majumdar, S. R., Tsuyuki, R. T., Tahir, A., & Rockwood, K. (2006). Validity
and reliability of the Edmonton Frail Scale. Age Ageing, 35(5), 526-529. doi:
10.1093/ageing/afl041
Romero-Ortuno, R., Walsh, C. D., Lawlor, B. A., & Kenny, R. A. (2010). A frailty instrument
for primary care: findings from the Survey of Health, Ageing and Retirement in
Europe (SHARE). BMC Geriatr, 10, 57. doi: 10.1186/1471-2318-10-57
Sternberg, S. A., Wershof Schwartz, A., Karunananthan, S., Bergman, H., & Mark Clarfield,
A. (2011). The identification of frailty: a systematic literature review. J Am Geriatr
Soc, 59(11), 2129-2138. doi: 10.1111/j.1532-5415.2011.03597.x
Studenski, S., Hayes, R. P., Leibowitz, R. Q., Bode, R., Lavery, L., Walston, J., . . . Perera,
S. (2004). Clinical Global Impression of Change in Physical Frailty: development of
a measure based on clinical judgment. J Am Geriatr Soc, 52(9), 1560-1566. doi:
10.1111/j.1532-5415.2004.52423.x
Sundermann, S., Dademasch, A., Praetorius, J., Kempfert, J., Dewey, T., Falk, V., . . .
Walther, T. (2011). Comprehensive assessment of frailty for elderly high-risk
patients undergoing cardiac surgery. Eur J Cardiothorac Surg, 39(1), 33-37. doi:
10.1016/j.ejcts.2010.04.013
van Kempen, J. A., Schers, H. J., Jacobs, A., Zuidema, S. U., Ruikes, F., Robben, S. H., .
. . Olde Rikkert, M. G. (2013). Development of an instrument for the identification of
frail older people as a target population for integrated care. Br J Gen Pract, 63(608),
e225-231. doi: 10.3399/bjgp13X664289
Vellas, B., Balardy, L., Gillette-Guyonnet, S., Abellan Van Kan, G., Ghisolfi-Marque, A.,
Subra, J., . . . Cesari, M. (2013). Looking for frailty in community-dwelling older
persons: the Gerontopole Frailty Screening Tool (GFST). J Nutr Health Aging, 17(7),
629-631. doi: 10.1007/s12603-013-0363-6

44

45
3. Investigação empírica

46
3.1. Portuguese version of the Tilburg Frailty Indicator:
Transcultural adaptation and psychometric validation
Autores: Tiago Coelho, Rubim Santos, Constança Paúl, Robbert J. J. Gobbens, Lia
Fernandes
Geriatrics & Gerontology International, 2014 (Article first published online 26 Sept. 2014)
DOI: 10.1111/ggi.12373
Fator de Impacto (2013): 1.575
Indexação: Abstracts in Social Gerontology (EBSCO Publishing); Abstracts on Hygiene &
Communicable Diseases (CABI); Academic Search (EBSCO Publishing); Academic Search
Alumni Edition (EBSCO Publishing); Academic Search Premier (EBSCO Publishing);
AgBiotech News & Information (CABI); AgBiotechNet (CABI); CAB Abstracts® (CABI);
CABDirect (CABI); CSA Biological Sciences Database (ProQuest); CSA Environmental
Sciences & Pollution Management Database (ProQuest); Dairy Science Abstracts (CABI);
Ecology Abstracts (ProQuest); Embase (Elsevier); Forest Products Abstracts (CABI);
Forestry Abstracts (CABI); Global Health (CABI); Journal Citation Reports/Science Edition
(Thomson Reuters); Journal Citation Reports/Social Science Edition (Thomson Reuters);
Leisure, Recreation & Tourism Abstracts (CABI); MEDLINE/PubMed (NLM); Nematological
Abstracts (CABI); Nutrition Abstracts & Reviews Series A: Human & Experimental (CABI);
Postharvest News & Information (CABI); Poultry Abstracts (CABI); ProQuest Central
(ProQuest); ProQuest Health & Medical Complete (ProQuest); ProQuest Research Library
(ProQuest); PsycINFO/Psychological Abstracts (APA); Review of Aromatic & Medicinal
Plants (CABI); Rural Development Abstracts (CABI); Science Citation Index Expanded
(Thomson Reuters); SCOPUS (Elsevier); Social Sciences Citation Index (Thomson
Reuters); Soybean Abstracts Online (CABI); Tropical Diseases Bulletin (CABI); VINITI (All-
Russian Institute of Science & Technological Information); World Agricultural Economics &
Rural Sociology Abstracts (CABI)

ORIGINAL ARTICLE: EPIDEMIOLOGY,CLINICAL PRACTICE AND HEALTH
Portuguese version of the Tilburg Frailty Indicator:Transcultural adaptation and psychometric validation
Tiago Coelho,1,2 Rubim Santos,3 Constança Paúl,2 Robbert JJ Gobbens4 and Lia Fernandes5
1School of Allied Health Sciences, Porto Polytechnic Institute, 3Activity and Human Movement Study Center, School of Allied HealthSciences, Porto Polytechnic Institute, Vila Nova de Gaia, 2UNIFAI/ICBAS, University of Porto, 5UNIFAI/CINTESIS – Faculty ofMedicine, University of Porto, Porto, Portugal; and 4Research & Development Center Innovations in Care, Rotterdam University of AppliedSciences, Rotterdam, the Netherlands
Aim: To present the translation and validation process of the Portuguese version of the Tilburg Frailty Indicator(TFI).
Methods: A cross-sectional study was designed using a non-probability sample of 252 community-dwelling olderadults. Preliminary studies were carried out for face and content validity assessment. Internal consistency, test–retestreliability, construct (convergent/divergent) and criterion validity were subsequently analyzed.
Results: The sample was mainly women (75.8%), with a mean age of 79.2 ± 7.3 years. TFI internal consistency wasgood (KR-20 = 0.78). Test–retest reliability for the total was also good (r = 0.91), with kappa coefficients showingsubstantial agreement for most items. TFI physical and social domains correlated as expected with concurrentmeasures, whereas the TFI psychological domain showed similar correlations with other psychological and physicalmeasures. The TFI showed a good to excellent discrimination ability in regard to frailty criteria, and fair to good abilityto predict adverse outcomes.
Conclusions: The psychometric properties of the TFI seem to be consistently good. These findings provide initialevidence that the Portuguese version is a valid and reliable measure for assessing frailty in the elderly. GeriatrGerontol Int 2014; ••: ••–••.
Keywords: elderly, frailty, Tilburg Frailty Indicator, validation study.
Introduction
Portugal is no exception to the worldwide trend ofpopulation aging, with one of the highest proportions(19%) of elderly in the European Union.1 As life expec-tancy increases, so does the need to maintain health andindependence during a longer life. Despite the hetero-geneity of functional decline with chronological age,frailty is considered to be highly prevalent in elderlyindividuals.2,3
Over the past three decades, the relevance of theconcept of frailty has increased significantly in the studyof aging and the clinical care of older adults.4–6 Frailty is
generally recognized as a state of increased vulnerabilitythat entails a high risk of clinically significant adverseoutcomes, such as falls, disability, hospitalization, insti-tutionalization and mortality.7–9 However, there is noagreed definition.2,10,11 Although frailty is commonlyaccepted as a clinically observable syndrome that resultsfrom a significantly diminished physiological reserveand its interplay with life course determinants and/ordisease(s), which affect the individual’s ability to main-tain homeostasis when facing stressors, the same cannotbe said about its outcomes and, especially, itscomponents.12–14 A recent literature review shows thatdespite some factors, there has been a greater number indiffering approaches regarding the components and theadverse outcomes of frailty (e.g. physical function anddeath), over which there is still a lot of controversy.15
Nevertheless, two major trends in the conceptualizationof frailty have been identified. An increasing number ofauthors state that disability is an outcome of frailtyrather than a component of the syndrome. Disability,
Accepted for publication 18 July 2014.
Correspondence: Dr Tiago Coelho OTR MSc, School of AlliedHealth Sciences, Porto Polytechnic Institute, OccupationalTherapy Department, Rua Valente Perfeito, 322, 4400-330, VilaNova de Gaia, Portugal. Email: [email protected]
Geriatr Gerontol Int 2014
bs_bs_banner
© 2014 Japan Geriatrics Society doi: 10.1111/ggi.12373 | 1

such as morbidity and the normal process of aging, isnot synonymous with frailty.4,5,16,17 Progressively morestudies emphasize the need for including psychosocialfactors in the definition of frailty, instead of concep-tualizing it as consisting of exclusively physicalconditions.6,7,15,18
Traditional approaches of frailty emphasize physicallosses that result from functional decline across mul-tiple physiological systems (e.g. musculoskeletal,immune, hormonal, inflammatory, autonomic/centralnervous system) and its physical manifestations (e.g.sarcopenia).13,19–21 From these approaches, a consensushas been reached on the operationalization of frailty thatis known as the frailty phenotype, in which the clinicalpresentation of the syndrome refers to the presence ofthree or more of the following components: uninten-tional weight loss, low physical activity, exhaustion,slow walking speed and weakness.3 However, there is anincreasing number of researchers with a more integra-tive, multidimensional and health-based perspective,avoiding the fragmentation of care for olderadults.2,6,22–27 In order to make sense of a multidimen-sional approach to frailty and, at the same time, toclearly differentiate frailty from disability, an integralconceptual model has been developed, resulting froman exhaustive literature review and expert consulta-tion.5,18,26,28 The need to identify frailty according to thisconceptualization has led to the development of theTilburg Frailty Indicator (TFI).29
Considering that most researchers agree that frailtyand its adverse outcomes can be prevented, the ability toeffectively assess frailty should be of great relevance,from a social and public health perspective.2 In thiscontext, TFI allows the screening of frailty incommunity-dwelling older people, according to themore recent approaches.29 Taking into account thatthere is no Portuguese version of TFI, the present studyaimed to translate and validate this instrument.
Methods
Sample
From May to September 2013, a non-probability sampleof 252 elderly volunteers from three northern Portu-guese cities (Maia, Porto, Vila Nova de Gaia) wasrecruited. These persons, users of institutions, such associal, recreation and day care centers, and senior acad-emies, were interviewed. The inclusion criteria wascommunity dwellers aged ≥65 years. Individuals withsevere cognitive impairment or unable to speak Portu-guese were excluded. Data collection was carried out bynine trained researchers. For test–retest reliability, thefirst 74 available participants were assessed twice withTFI within a 12–16-day period (mean 14 days). The
study was approved by institutional review boards, andall participants gave their written informed consent.
Description of TFI
TFI is a brief self-report questionnaire for screening frailcommunity-dwelling older adults with two subscales:part A-10 items about determinants of frailty (e.g. age,sex, education and income); and part B-15 questionsdivided into three domains (physical, psychological andsocial), and focuses exclusively on components offrailty. The part B set of items inform frailty total andeach domain score as follows. A total of 11 items havetwo response categories (yes/no), while four items havethree (yes/no/sometimes). Nevertheless, all items arescored zero or one. The TFI physical domain includeseight questions about physical health, unexplainedweight loss, difficulty in walking, difficulty in maintain-ing balance, hearing problems, vision problems, lack ofstrength in hands and physical tiredness. The psycho-logical domain comprises four items related to cogni-tion, depressive/anxiety symptoms and copingmechanisms. The social domain includes three items:living alone, social relations and social support. Theoriginally proposed cut-off for frailty was 5.29
For screening purposes, TFI can be administeredalone, without supplementary assessment tools. Thispossibility is supported by the observed association ofTFI domains with concurrent measures.29 Furthermore,previous studies have shown that TFI is sufficient topredict healthcare utilization, 1 and 2 years later.30 Nev-ertheless, to better predict disability, the use of both TFIand the Timed Up and Go test (TUG)31 is recom-mended.30 Also, a previous screening of severe cognitivedeficit might be advised, because of the self-reportingnature of TFI.
TFI was recently developed with tested psychometricproperties in the Netherlands.29 An English version waspromptly made available by the authors, resulting froma translation and back-translation process. Since then, avalid and cross-culturally adapted version was preparedin Brazil32,33 and Denmark.34 Furthermore, studiescarried out by different researchers35,36 highlighted TFIpsychometric properties in comparison with otherfrailty measures.
Translation and cultural adaptation process
This process was carried out according to the guidelinesof the International Society for Pharmacoeconomicsand Outcomes Research, beginning with permission touse the TFI and inviting the main author of the ques-tionnaire to be involved in the research.37 Forwardtranslation from English into Portuguese was carriedout by three authors of this research, who are fluent inEnglish. After the forward translations had been
T Coelho et al.
2 | © 2014 Japan Geriatrics Society
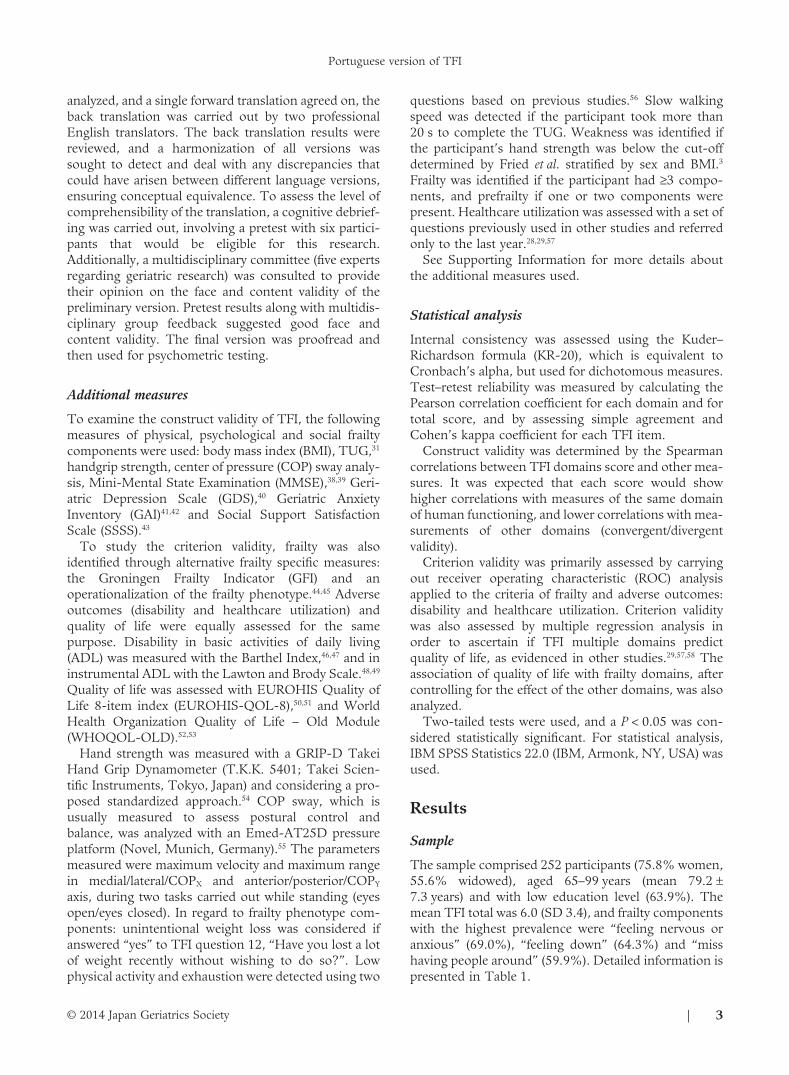
analyzed, and a single forward translation agreed on, theback translation was carried out by two professionalEnglish translators. The back translation results werereviewed, and a harmonization of all versions wassought to detect and deal with any discrepancies thatcould have arisen between different language versions,ensuring conceptual equivalence. To assess the level ofcomprehensibility of the translation, a cognitive debrief-ing was carried out, involving a pretest with six partici-pants that would be eligible for this research.Additionally, a multidisciplinary committee (five expertsregarding geriatric research) was consulted to providetheir opinion on the face and content validity of thepreliminary version. Pretest results along with multidis-ciplinary group feedback suggested good face andcontent validity. The final version was proofread andthen used for psychometric testing.
Additional measures
To examine the construct validity of TFI, the followingmeasures of physical, psychological and social frailtycomponents were used: body mass index (BMI), TUG,31
handgrip strength, center of pressure (COP) sway analy-sis, Mini-Mental State Examination (MMSE),38,39 Geri-atric Depression Scale (GDS),40 Geriatric AnxietyInventory (GAI)41,42 and Social Support SatisfactionScale (SSSS).43
To study the criterion validity, frailty was alsoidentified through alternative frailty specific measures:the Groningen Frailty Indicator (GFI) and anoperationalization of the frailty phenotype.44,45 Adverseoutcomes (disability and healthcare utilization) andquality of life were equally assessed for the samepurpose. Disability in basic activities of daily living(ADL) was measured with the Barthel Index,46,47 and ininstrumental ADL with the Lawton and Brody Scale.48,49
Quality of life was assessed with EUROHIS Quality ofLife 8-item index (EUROHIS-QOL-8),50,51 and WorldHealth Organization Quality of Life – Old Module(WHOQOL-OLD).52,53
Hand strength was measured with a GRIP-D TakeiHand Grip Dynamometer (T.K.K. 5401; Takei Scien-tific Instruments, Tokyo, Japan) and considering a pro-posed standardized approach.54 COP sway, which isusually measured to assess postural control andbalance, was analyzed with an Emed-AT25D pressureplatform (Novel, Munich, Germany).55 The parametersmeasured were maximum velocity and maximum rangein medial/lateral/COPX and anterior/posterior/COPY
axis, during two tasks carried out while standing (eyesopen/eyes closed). In regard to frailty phenotype com-ponents: unintentional weight loss was considered ifanswered “yes” to TFI question 12, “Have you lost a lotof weight recently without wishing to do so?”. Lowphysical activity and exhaustion were detected using two
questions based on previous studies.56 Slow walkingspeed was detected if the participant took more than20 s to complete the TUG. Weakness was identified ifthe participant’s hand strength was below the cut-offdetermined by Fried et al. stratified by sex and BMI.3
Frailty was identified if the participant had ≥3 compo-nents, and prefrailty if one or two components werepresent. Healthcare utilization was assessed with a set ofquestions previously used in other studies and referredonly to the last year.28,29,57
See Supporting Information for more details aboutthe additional measures used.
Statistical analysis
Internal consistency was assessed using the Kuder–Richardson formula (KR-20), which is equivalent toCronbach’s alpha, but used for dichotomous measures.Test–retest reliability was measured by calculating thePearson correlation coefficient for each domain and fortotal score, and by assessing simple agreement andCohen’s kappa coefficient for each TFI item.
Construct validity was determined by the Spearmancorrelations between TFI domains score and other mea-sures. It was expected that each score would showhigher correlations with measures of the same domainof human functioning, and lower correlations with mea-surements of other domains (convergent/divergentvalidity).
Criterion validity was primarily assessed by carryingout receiver operating characteristic (ROC) analysisapplied to the criteria of frailty and adverse outcomes:disability and healthcare utilization. Criterion validitywas also assessed by multiple regression analysis inorder to ascertain if TFI multiple domains predictquality of life, as evidenced in other studies.29,57,58 Theassociation of quality of life with frailty domains, aftercontrolling for the effect of the other domains, was alsoanalyzed.
Two-tailed tests were used, and a P < 0.05 was con-sidered statistically significant. For statistical analysis,IBM SPSS Statistics 22.0 (IBM, Armonk, NY, USA) wasused.
Results
Sample
The sample comprised 252 participants (75.8% women,55.6% widowed), aged 65–99 years (mean 79.2 ±7.3 years) and with low education level (63.9%). Themean TFI total was 6.0 (SD 3.4), and frailty componentswith the highest prevalence were “feeling nervous oranxious” (69.0%), “feeling down” (64.3%) and “misshaving people around” (59.9%). Detailed information ispresented in Table 1.
Portuguese version of TFI
© 2014 Japan Geriatrics Society | 3

Table 1 Participant characteristics
Characteristic n (%)
Sociodemographic characteristicsMean age (years) 79.2 ± 7.3
65–74 68 (27.0)75–84 116 (46.0)≥85 68 (27.0)
Sex (women) 191 (75.8)Marital status
Married/living with partner 49 (19.4)Unmarried 24 (9.5)Separated/divorced 39 (15.5)Widow/widower 140 (55.6)
Mean education (years) 4.4 ± 3.60 36 (14.3)1–4 161 (63.9)≥5 55 (21.9)
Monthly household income (EUR)≤500 103 (40.9)≥501 149 (59.1)
Frailty assessed with TFIMean TFI total score (0–15) 6.0 ± 3.4Mean TFI physical domain score (0–8) 2.9 ± 2.2
TFI Q11: Poor physical health 98 (38.9)TFI Q12: Unintentional weight loss 40 (15.9)TFI Q13: Difficulty in walking 126 (50.0)TFI Q14: Difficulty in maintaining
balance105 (41.7)
TFI Q15: Poor hearing 69 (27.4)TFI Q16: Poor vision 81 (32.1)TFI Q17: Lack in hand strength 68 (27.0)TFI Q18: Physical tiredness 141 (56.0)
Mean TFI psychological domain score (0–4) 1.7 ± 1.1TFI Q19: Problems with memory 61 (24.2)TFI Q20: Feeling down 162 (64.3)TFI Q21: Feeling nervous or anxious 174 (69.0)TFI Q22: Unable to cope with problems 36 (14.3)
Mean TFI social domain score (0–3) 1.4 ± 1.0TFI Q23: Living alone 131 (52.0)TFI Q24: Miss having people around 151 (59.9)TFI Q25: Not receiving enough support 68 (27.0)
Alternative measurements of frailtyMean BMI (kg/m2) 28.6 ± 5.4
<18.5 (underweight) 1 (0.4)18.5–24.9 (normal) 64 (25.4)25–29.9 (overweight) 99 (39.3)>30 (obese) 88 (34.9)
Mean TUG test (s)† 15.8 ± 8.8Mean handgrip strength (kg) 19.9 ± 8.4COP sway (eyes open)‡
Mean COPX maximum velocity (cm/s) 2.4 ± 1.5Mean COPY maximum velocity (cm/s) 3.0 ± 1.5Mean COPX maximum range (cm) 1.8 ± 0.9Mean COPY maximum range (cm) 1.9 ± 0.7
Characteristic n (%)
COP sway (eyes closed)‡
Mean COPX maximum velocity (cm/s) 3.1 ± 2.0Mean COPY maximum velocity (cm/s) 4.0 ± 2.5Mean COPX maximum range (cm) 2.0 ± 1.1Mean COPY maximum range (cm) 2.3 ± 0.9
Mean MMSE (0–30) 23.6 ± 4.9Cognitive deficit 132 (52.4)
Mean GDS (0–15) 5.4 ± 3.9Depression 113 (44.8)
Mean GAI (0–20) 9.5 ± 6.3Severe anxiety symptoms 130 (51.6)
Mean SSSS (15–75) 53.0 ± 11.2Mean GFI (0–12) 4.6 ± 2.7
Frailty 132 (52.4)Frailty phenotype components
Weight loss 40 (15.9)Low physical activity 109 (43.3)Exhaustion 130 (51.6)Slowed performance 58 (23.0)Weakness 161 (63.9)
Mean frailty phenotype 2.0 ± 1.40 (non-frail/robust) 39 (15.5)1–2 (prefrail) 121 (48.0)3–5 (frail) 92 (36.5)
Adverse outcomesMean Barthel Index (0–20) 19.0 ± 1.5Mean Lawton and Brody Scale (0–23) 17.5 ± 5.6Healthcare utilization
Contact with general practitioner0 11 (4.4)1–2 115 (45.6)3–4 83 (32.9)5–6 23 (9.1)≥7 20 (7.9)
Contact with healthcare professionals 180 (71.4)Hospitalization 62 (24.6)Professional personal care 17 (6.7)Nursing care 70 (27.8)Informal care 48 (19.0)Other healthcare or residential
care institutions28 (11.1)
Quality of lifeMean EUROHIS-QOL-8 (8–40) 27.9 ± 5.0Mean WHOQOL-OLD (28–140) 98.4 ± 15.7
Mean sensory abilities 15.4 ± 4.0Mean autonomy 14.0 ± 3.0Mean past, present and future activities 13.4 ± 3.0Mean social participation 14.9 ± 2.8Mean death and dying 13.0 ± 4.3Mean intimacy 13.2 ± 3.9Mean family/family life 14.5 ± 4.2
n = 252. †Two cases were missing. ‡Three cases were missing. BMI, body mass index; COP, center of pressure; EUROHIS-QOL, EUROHISQuality of Life 8-item index; GAI, Geriatric Anxiety Inventory; GDS, Geriatric Depression Scale; GFI, Groningen Frailty Indicator; MMSE,Mini-Mental State Examination; SSSS, Social Support Satisfaction Scale; TFI, Tilburg Frailty Indicator; WHOQOL-OLD, World HealthOrganization Quality of Life – Old Module.
T Coelho et al.
4 | © 2014 Japan Geriatrics Society

Feasibility
The researchers’ training process was easy, and theadministration of TFI was remarkably quick and simple.Completing TFI took on average 10 min (SD 4.1). Allpart B items were easily understood by the elderly indi-viduals. In regard to part A, some participants with alower educational level required a brief explanationabout the description of a healthy lifestyle (includingamong other aspects, eating a prudent diet, exercisingfrequently and not drinking excessively or smoking).
Reliability
The KR-20 was 0.78 for frailty, and 0.75, 0.48, 0.49 forphysical, psychological and social domains, respectively.The test–retest reliability was 0.91 (95% CI 0.86–0.94)for TFI total, 0.87 (95% CI 0.80–0.91) for physical, 0.75(95% CI 0.62–0.83) for psychological and 0.87 (95% CI0.80–0.91) for social domains. Simple agreement wasobserved for all items (78–97%), and regarding kappacoefficients, values ranged from 0.52 to 0.95 (Table 2).No statistically significant differences were found,between the total and the subsample for retest, in regardto sociodemographic characteristics and components offrailty.
Construct validity
The TFI physical domain score showed the highestcorrelations with BMI, TUG test, handgrip strength and
most parameters regarding COP sway, whereas TFIsocial domain score correlated better with SSSS. In con-trast, similar correlations were obtained between GDSand TFI physical and psychological domains, whereasMMSE and GAI showed the highest correlations withTFI physical domain, although not very different fromthe correlations obtained with the psychological domain(Table 3).
Criterion validity
To examine the criterion validity of TFI total, the areaunder the curve (AUC) with 95% CI for adverseoutcome and alternative frailty measures was calculated,as well as the sensitivity and specificity for one or twocut-off points that gave the best results. The AUCobtained by using the GFI and the frailty phenotype ascriteria was 0.89 and 0.75, respectively. In regard to theadverse outcomes, the AUC ranged from 0.56 to 0.72(Table 4). In the absence of an optimal cut-off point, 6was chosen, because it showed better sensitivity andspecificity.
TFI domains predicted 38.7% of quality of life vari-ance, measured by EUROHIS-QOL-8 and 42.1% byWHOQOL-OLD. Although each domain contributedto the prediction of quality of life, TFI physical had thelargest contribution (R2 = 13.7% EUROHIS-QOL-8,R2 = 11.6% WHOQOL-OLD). After controlling for theeffect of the other two TFI domains, each one hadhigher correlations than the others in regard to at leasttwo WHOQOL-OLD facets: the TFI physical domainunique contribution was stronger for “sensory abilities”,“social participation” and “death and dying”; psycho-logical domain for “autonomy” and “past, present andfuture activities”; whereas social domain’s contributionwas higher for “intimacy” and “family/family life”(Table 5).
Discussion
The present study developed a culturally adaptedversion of the TFI, which showed good reliability andvalidity when applied to a Portuguese community-dwelling sample. This sample’s sociodemographic char-acteristics approximately resemble those of the elderlypopulation in Portugal, in which there is an increasinglylarger proportion of women, low education levels andwidows in older groups.59
Internal consistency was good for frailty and for thephysical domain, but rather low for psychological andsocial domains. These results approximately resemblethe values obtained in the original and Brazilianstudies.29,32 The low values can be explained by thereduced number of items in the psychological and socialdomains (four and three, respectively). Gobbens et al.
Table 2 Simple agreement and Cohen’s kappacoefficients of Tilburg Frailty Indicator items
TFI items Agreement Kappa (95% CI)
Physical domainPhysical health 0.81 0.61 (0.43–0.79)Nutrition 0.95 0.69 (0.39–0.99)Mobility 0.85 0.70 (0.54–0.86)Balance 0.87 0.72 (0.56–0.88)Hearing 0.91 0.76 (0.60–0.93)Vision 0.88 0.71 (0.52–0.89)Strength 0.83 0.57 (0.36–0.78)Endurance 0.81 0.62 (0.44–0.80)
Psychological domainCognition 0.84 0.52 (0.28–0.77)Mood 0.78 0.54 (0.34–0.74)Anxiety 0.78 0.53 (0.33–0.74)Coping 0.93 0.76 (0.56–0.96)
Social domainLiving alone 0.97 0.95 (0.87–1.00)Social relations 0.84 0.66 (0.49–0.84)Social support 0.88 0.73 (0.56–0.89)
TFI, Tilburg Frailty Indicator.
Portuguese version of TFI
© 2014 Japan Geriatrics Society | 5

Table 3 Spearman correlations between Tilburg Frailty Indicator domains and alternative frailty measurements
Alternative measurements of frailty TFI physicaldomain
TFI psychologicaldomain
TFI socialdomain
Physical domainBMI 0.16* 0.07 0.00TUG test 0.48*** 0.21*** 0.12Hand grip strength −0.34*** −0.28*** −0.19**COP sway (eyes open)
COPX maximum velocity 0.17** 0.02 0.03COPY maximum velocity 0.13* −0.06 −0.08COPX maximum range 0.17** 0.03 0.08COPY maximum range 0.15* 0.00 −0.07
COP sway (eyes closed)COPX maximum velocity 0.09 −0.02 0.01COPY maximum velocity 0.07 0.01 −0.02COPX maximum range 0.18** 0.06 0.04COPY maximum range 0.07 0.10 0.02
Psychological domainMMSE −0.26*** −0.22*** −0.06GDS 0.58*** 0.58*** 0.41***GAI 0.58*** 0.56*** 0.29***
Social domainSSSS −0.35*** −0.37*** −0.43***
*P < 0.05. **P < 0.01. ***P < 0.001. Highest significant correlation of each row printed in bold. BMI, body mass index; COP,center of pressure; GAI, Geriatric Anxiety Inventory; GDS, Geriatric Depression Scale; MMSE, Mini-Mental State Examination;SSSS, Social Support Satisfaction Scale; TFI, Tilburg Frailty Indicator.
Table 4 Receiver operating characteristic analysis of Tilburg Frailty Indicator total score in regard to criteria offrailty and adverse outcomes
Measure/criterion TFI cut-point Sensitivity Specificity AUC (95%CI)
Alternative frailty measuresGFI ≥5 0.84 0.78 0.89 (0.85–0.93)
≥6 0.74 0.86Frailty phenotype ≥5 0.78 0.59 0.75 (0.68–0.81)
≥6 0.71 0.69Disability
Barthel Index ≥5 0.70 0.60 0.72 (0.66–0.78)≥6 0.64 0.73
Lawton and Brody Scale ≥4 0.65 0.56 0.63 (0.53–0.72)≥5 0.58 0.58
Healthcare utilizationContact with general practitioner ≥6 0.63 0.58 0.64 (0.56–0.73)
≥7 0.54 0.67Contact with healthcare professionals ≥5 0.58 0.54 0.57 (0.49–0.65)Hospitalization ≥6 0.57 0.58 0.60 (0.51–0.68)Professional personal care ≥6 0.65 0.56 0.63 (0.49–0.77)
≥7 0.59 0.64Nursing care ≥6 0.51 0.57 0.56 (0.49–0.64)Informal care ≥6 0.58 0.58 0.60 (0.52–0.68)Other healthcare or residential care institutions ≥6 0.57 0.56 0.59 (0.48–0.69)
≥7 0.50 0.64
Optimal cut-points of each criterion printed in bold. GFI, Groningen Frailty Indicator; TFI, Tilburg Frailty Indicator.
T Coelho et al.
6 | © 2014 Japan Geriatrics Society

recognized this, but preferred to value the benefitsof assessing these domains with the fewest possiblequestions.29
Regarding kappa coefficients, it was observed thatfour items showed moderate agreement (0.41–0.60), 10showed substantial agreement (0.61–0.80) and oneshowed nearly perfect agreement (0.81–1.00) accordingto the Landis and Koch classification.60 The TFI totaland each domain score obtained in both assessmentswere also found to be highly correlated. In accordancewith other TFI validation studies, these results showed agood test–retest reliability.29,32
TFI also showed good construct validity(convergent/divergent) in regard to its physical andsocial domains, as each correlated as expected withalternative physical and social measures. The samecannot be said regarding TFI psychological domain’sdivergent validity, as other psychological measures cor-related equally or slightly better with the physicaldomain than with the psychological one. Gobbenset al.29 had already drawn similar results regardingMMSE, whereas Santiago et al.32 also struggled to findalternative psychological measures that correlatedbetter with the TFI psychological domain. Theseresults can be explained by the well-documented rela-tionship between cognitive and physical performance,61
and between depression62 and anxiety63 and self-reported physical function.
ROC analysis used to assess TFI criterion validityshowed that its discrimination ability was excellentregarding the identification of those classified as frail byGFI, and good for frailty detected by the frailty pheno-type. The prediction of disability in ADL was good andfair for the remaining adverse outcomes (dependence oninstrumental ADL and healthcare utilization). Choosing6 as a cut-off for frailty, 54.8% of the participants wereidentified as frail. This prevalence is remarkably similarto the proportion of frail participants identified in oursample by GFI (52.4%), larger than the prevalence offrailty detected by this operationalization of its pheno-type (36.5%), and higher than observed in other studiesthat used the TFI in a community setting. Values from31.7%32 to 47.1%29 have been reported. One possibleexplanation for the substantial difference observedbetween the Brazilian study32 and this research could bethe age of participants (significantly younger in the firstone).
The good criterion validity of the TFI was also sup-ported by its ability to predict quality of life. Besidesassuming a primary role in predicting EUROHIS-QOL-8 and WHOQOL-OLD totals, the TFI physicaldomain also had the highest correlation of the threedomains with the largest number of WHOQOL-OLDfacets. The highest contribution of the physical domainfor the explanation of quality of life emphasizes itsimportance in the conceptualization of frailty, but theT
able
5Pr
edic
tion
ofqu
ality
oflif
ew
ithT
ilbur
gFr
ailty
Indi
cato
rdo
mai
ns
Qua
lity
oflif
em
easu
res
TFI
phys
ical
dom
ain
TFI
psyc
holo
gica
ldom
ain
TFI
soci
aldo
mai
nT
FIβ
rP-
valu
eβ
rP-
valu
eβ
rP-
valu
er
R2
(%)
P-va
lue
EU
RO
HIS
-QO
L-8
−0.4
3−0
.37
<0.0
01−0
.22
−0.1
8<0
.001
−0.1
1−0
.10
<0.0
5−0
.62
38.7
<0.0
01W
HO
QO
L-O
LD
−0.4
0−0
.34
<0.0
01−0
.26
−0.2
2<0
.001
−0.1
4−0
.13
<0.0
1−0
.65
42.1
<0.0
01Se
nsor
yab
ilitie
s−0
.58
−0.4
9<0
.001
−0.1
6−0
.13
<0.0
10.
070.
060.
12−0
.65
42.5
<0.0
01A
uton
omy
−0.2
6−0
.22
<0.0
01−0
.31
−0.2
6<0
.001
0.03
0.03
0.59
−0.4
923
.5<0
.001
Past
,pre
sent
and
futu
reac
tiviti
es−0
.21
−0.1
8<0
.01
−0.2
4−0
.20
<0.0
01−0
.08
−0.0
70.
20−0
.43
18.4
<0.0
01
Soci
alpa
rtic
ipat
ion
−0.2
8−0
.24
<0.0
01−0
.19
−0.1
6<0
.01
−0.0
8−0
.08
0.18
−0.4
520
.6<0
.001
Dea
than
ddy
ing
−0.1
7−0
.14
<0.0
5−0
.12
−0.1
00.
12−0
.05
−0.0
50.
460.
277.
2<0
.001
Intim
acy
−0.1
3−0
.11
0.07
−0.0
7−0
.06
0.36
−0.2
2−0
.20
<0.0
010.
3210
.5<0
.001
Fam
ily/fa
mily
life
−0.1
4−0
.12
<0.0
5−0
.13
−0.1
10.
07−0
.26
−0.2
4<0
.001
0.41
17.0
<0.0
01
Stan
dard
ized
regr
essi
onco
effic
ient
(β),
sem
i-pa
rtia
lcor
rela
tion
coef
ficie
nt(r
)an
dP-
valu
efo
rea
chT
ilbur
gFr
ailty
Indi
cato
r(T
FI)
dom
ain
(hig
hest
rpr
inte
din
bold
),an
dco
rrel
atio
nco
effic
ient
(r),
coef
ficie
ntof
dete
rmin
atio
n(R
2 )an
dP-
valu
efo
ral
lthr
eedo
mai
nsin
sert
edin
the
regr
essi
onm
odel
.EU
RO
HIS
-QO
L,E
UR
OH
ISQ
ualit
yof
Life
8-ite
min
dex;
WH
OQ
OL
-OL
D,W
orld
Hea
lthO
rgan
izat
ion
Qua
lity
ofL
ife–
Old
Mod
ule.
Portuguese version of TFI
© 2014 Japan Geriatrics Society | 7

value added by the other domains provides robust evi-dence for an integral definition of the syndrome.
The rigorous process of translation and culturaladaptation, and thorough study of several psychometricproperties were the main strengths of this research.Nevertheless, some limitations should be highlighted.First, test–retest reliability reported only on a secondapplication of TFI 2 weeks after the first inquiry, andthat difference could provide different results. Second,the correlations between each TFI item and correspon-dent other validated measures were not examined,which could provide additional evidence about con-struct validity. The cross-sectional nature of the presentstudy can also be considered as a limitation, as it doesnot allow understanding of the temporal continuumbetween frailty and adverse outcomes. Finally, the non-probability sampling method could have limited thesefindings regarding the generalization of results. Never-theless, considering that the psychometric properties ofthis version resemble those obtained in other validationstudies, these results are promising.
Longitudinal studies should be carried out to betterexamine how frailty, and each domain, predicts adverseoutcomes in the short, medium and long term. Like-wise, understanding which variables/determinants (e.g.sociodemographic characteristics, life events, lifestyle)can effectively predict frailty in general, and eachdomain in particular, is essential to implement timelyand targeted interventions in order to prevent the syn-drome and its adverse outcomes. Although benefits canbe drawn by measuring frailty with the multidimen-sional TFI, further research should be carried out tobetter understand which frailty definition andoperationalization concept should be chosen. Also,further research about the TFI cut-off for frailty and itsapplication in other contexts (e.g. hospital, primary care,nursing home) should be carried out.
In conclusion, this research provides robust evidencethat this TFI version is a valid and reliable measure forassessing frailty in Portuguese older adults. Conse-quently, it provided a simple, but invaluable, tool forhealth/social care providers and for researchers thateffectively identifies highly vulnerable older persons in amultidimensional perspective, allowing more focusedand efficient interventions to prevent adverse outcomes.
Acknowledgments
The authors thank all the elderly participants, and allprofessionals who assisted and made the data collectionpossible, particularly occupational therapy students(Alice Rocha, Joana Oliveira, Libânia Silva, NicoleCâmara, Rute Ferreira, Sara Santos, Stefanie Morais andSylvie Abreu) for partial data collecting. The authorsthank Carolina Silva, Ignácio Martin and MafaldaDuarte for being part of the expert committee, as well as
Maria Vilar and Mário Simões for allowing the use ofthe WHOQOL-OLD experimental Portuguese version;also Carolina Silva for assistance with the statisticalanalysis and Peter Blackburn for the back-translationprocedure.
Disclosure statement
No potential conflicts of interest were disclosed.
References
1 Proportion of population aged 65 and over [Internet]. 2014[Cited 23 Jan 2014.] Available from URL: http://epp.eurostat.ec.europa.eu/tgm/table.do?tab=table&init=1&plugin=1&language=en&pcode=tps00028.
2 Bergman H, Ferrucci L, Guralnik J et al. Frailty: an emerg-ing research and clinical paradigm–issues and controver-sies. J Gerontol A Biol Sci Med Sci 2007; 62: 731–737.
3 Fried LP, Tangen CM, Walston J et al. Frailty in olderadults: evidence for a phenotype. J Gerontol A Biol Sci MedSci 2001; 56 (3): M146–M156.
4 Hogan DB, MacKnight C, Bergman H. Models, defini-tions, and criteria of frailty. Aging Clin Exp Res 2003; 15 (3Suppl): 1–29.
5 Gobbens RJ, Luijkx KG, Wijnen-Sponselee MT, ScholsJM. Towards an integral conceptual model of frailty. J NutrHealth Aging 2010; 14: 175–181.
6 Markle-Reid M, Browne G. Conceptualizations of frailty inrelation to older adults. J Adv Nurs 2003; 44: 58–68.
7 Abellan van Kan G, Rolland Y, Bergman H, Morley JE,Kritchevsky SB, Vellas B. The I.A.N.A Task Force onfrailty assessment of older people in clinical practice. J NutrHealth Aging 2008; 12 (1): 29–37.
8 Rockwood K, Mitnitski A. Frailty in relation to the accu-mulation of deficits. J Gerontol A Biol Sci Med Sci 2007; 62:722–727.
9 Fried LP, Ferrucci L, Darer J, Williamson JD, Anderson G.Untangling the concepts of disability, frailty, andcomorbidity: implications for improved targeting and care.J Gerontol A Biol Sci Med Sci 2004; 59: 255–263.
10 Rockwood K, Song X, MacKnight C et al. A global clinicalmeasure of fitness and frailty in elderly people. CMAJ 2005;173: 489–495.
11 Puts MT, Lips P, Deeg DJ. Static and dynamic measures offrailty predicted decline in performance-based and self-reported physical functioning. J Clin Epidemiol 2005; 58:1188–1198.
12 Zaslavsky O, Cochrane BB, Thompson HJ, Woods NF,Herting JR, LaCroix A. Frailty: a review of the first decadeof research. Biol Res Nurs 2013; 15: 422–432.
13 Fried LP, Walston J, Ferrucci L. Frailty. In: Halter JB,Ouslander JG, Tinetti ME, Studenski S, High KP, AsthanaS, eds. Hazzard’s Geriatric Medicine and Gerontology, 6th edn.New York: McGraw-Hill, 2009; 631–646.
14 Avila-Funes JA, Helmer C, Amieva H et al. Frailty amongcommunity-dwelling elderly people in France: the three-city study. J Gerontol A Biol Sci Med Sci 2008; 63: 1089–1096.
15 Sternberg SA, Wershof Schwartz A, Karunananthan S,Bergman H, Mark Clarfield A. The identification of frailty:a systematic literature review. J Am Geriatr Soc 2011; 59:2129–2138.
16 Bergman H, Béland F, Karunananthan S, Hummel S,Hogan D, Wolfson C. English translation of article
T Coelho et al.
8 | © 2014 Japan Geriatrics Society

published in “Gerontologie et société”. Dévelopment d’uncadre de travail pour compendre et étudier la fragilité.Gerontol Soc 2004; 109: 15–29.
17 Walston J, Hadley EC, Ferrucci L et al. Research agenda forfrailty in older adults: toward a better understanding ofphysiology and etiology: summary from the AmericanGeriatrics Society/National Institute on Aging ResearchConference on Frailty in Older Adults. J Am Geriatr Soc2006; 54: 991–1001.
18 Gobbens RJ, Luijkx KG, Wijnen-Sponselee MT, ScholsJM. Toward a conceptual definition of frail communitydwelling older people. Nurs Outlook 2010; 58: 76–86.
19 Bortz WM, 2nd. A conceptual framework of frailty: areview. J Gerontol A Biol Sci Med Sci 2002; 57 (5): M283–M288.
20 Campbell AJ, Buchner DM. Unstable disability and thefluctuations of frailty. Age Ageing 1997; 26: 315–318.
21 Ahmed N, Mandel R, Fain MJ. Frailty: an emerging geri-atric syndrome. Am J Med 2007; 120: 748–753.
22 Rothman MD, Leo-Summers L, Gill TM. Prognostic sig-nificance of potential frailty criteria. J Am Geriatr Soc 2008;56: 2211–2216.
23 Levers MJ, Estabrooks CA, Ross Kerr JC. Factors contrib-uting to frailty: literature review. J Adv Nurs 2006; 56:282–291.
24 Ravaglia G, Forti P, Lucicesare A, Pisacane N, Rietti E,Patterson C. Development of an easy prognostic score forfrailty outcomes in the aged. Age Ageing 2008; 37: 161–166.
25 Rolfson DB, Majumdar SR, Tsuyuki RT, Tahir A,Rockwood K. Validity and reliability of the Edmonton FrailScale. Age Ageing 2006; 35: 526–529.
26 Gobbens RJ, Luijkx KG, Wijnen-Sponselee MT, ScholsJM. In search of an integral conceptual definition of frailty:opinions of experts. J Am Med Dir Assoc 2010; 11: 338–343.
27 Sourial N, Wolfson C, Bergman H et al. A correspondenceanalysis revealed frailty deficits aggregate and are multidi-mensional. J Clin Epidemiol 2010; 63: 647–654.
28 Gobbens RJ, van Assen MA, Luijkx KG, Schols JM.Testing an integral conceptual model of frailty. J Adv Nurs2012; 68: 2047–2060.
29 Gobbens RJ, van Assen MA, Luijkx KG, Wijnen-SponseleeMT, Schols JM. The Tilburg Frailty Indicator: psychomet-ric properties. J Am Med Dir Assoc 2010; 11: 344–355.
30 Gobbens RJ, van Assen MA. Frailty and its prediction ofdisability and health care utilization: the added value ofinterviews and physical measures following a self-reportquestionnaire. Arch Gerontol Geriatr 2012; 55: 369–379.
31 Podsiadlo D, Richardson S. The timed “Up & Go”: a test ofbasic functional mobility for frail elderly persons. J AmGeriatr Soc 1991; 39: 142–148.
32 Santiago LM, Luz LL, Mattos IE, Gobbens RJ, van AssenMA. Psychometric properties of the Brazilian version of theTilburg frailty indicator (TFI). Arch Gerontol Geriatr 2013;57: 39–45.
33 Santiago LM, Luz LL, Mattos IE, Gobbens RJ. Cross-cultural adaptation of the Tilburg Frailty Indicator (TFI) foruse in the Brazilian population. Cad Saúde Pública 2012; 28:1795–1801.
34 Andreasen J, Sørensen EE, Gobbens RJJ, Lund H, AadahlM. Danish version of the Tilburg Frailty Indicator – Trans-lation, Cross-cultural Adaption and Validity Pretest byCognitive Interviewing. Arch Gerontol Geriatr 2014; 59:32–38.
35 Pialoux T, Goyard J, Lesourd B. Screening tools for frailtyin primary health care: a systematic review. Geriatr GerontolInt 2012; 12: 189–197.
36 Metzelthin SF, Daniels R, van Rossum E, de Witte L, vanden Heuvel WJ, Kempen GI. The psychometric propertiesof three self-report screening instruments for identifyingfrail older people in the community. BMC Public Health2010; 10: 176.
37 Wild D, Grove A, Martin M et al. Principles of Good Prac-tice for the Translation and Cultural Adaptation Processfor Patient-Reported Outcomes (PRO) Measures: report ofthe ISPOR Task Force for Translation and Cultural Adap-tation. Value Health 2005; 8: 94–104.
38 Folstein MF, Folstein SE, McHugh PR. “Mini-mentalstate”. A practical method for grading the cognitive state ofpatients for the clinician. J Psychiatr Res 1975; 12: 189–198.
39 Morgado J, Rocha CS, Maruta C, Guerreiro M, Martins IP.New normative values of mini-mental state examination.Sinapse 2009; 9 (2): 19–25.
40 Sheikh JI, Yesavage JA. Geriatric Depression Scale (GDS).Recent evidence and development of a shorter version. ClinGerontol 1986; 5 (1-2): 165–173.
41 Pachana NA, Byrne GJ, Siddle H, Koloski N, Harley E,Arnold E. Development and validation of the GeriatricAnxiety Inventory. Int Psychogeriatr 2007; 19: 103–114.
42 Ribeiro O, Paul C, Simoes MR, Firmino H. Portugueseversion of the Geriatric Anxiety Inventory: transculturaladaptation and psychometric validation. Aging Ment Health2011; 15: 742–748.
43 Pais-Ribeiro JL. Escala de Satisfação com o Suporte Social(ESSS). Anál Psicol 1999; 3 (XVII): 547–558.
44 Schuurmans H, Steverink N, Lindenberg S, Frieswijk N,Slaets JP. Old or frail: what tells us more? J Gerontol A BiolSci Med Sci 2004; 59 (9): M962–M965.
45 Duarte M. Fragilidade nas pessoas idosas [Frailty in ElderlyPeople]. Porto: Institute of Biomedical Sciences Abel Salazarof University of Porto, 2013.
46 Mahoney FI, Barthel DW. Functional evaluation: theBarthel Index. Md State Med J 1965; 14: 61–65.
47 Araújo F, Ribeiro JLP, Oliveira A, Pinto C. Validação doÍndice de Barthel numa amostra de idosos nãoinstitucionalizados. Rev Port Saúde Pública 2007; 25 (2):59–66.
48 Araújo F, Pais Ribeiro J, Oliveira A, Pinto C, Martins T.Validação da escala de Lawton e Brody numa amostra deidosos não institucionalizados [Lawton and Brody scalevalidation in a sample of non-institutionalized elderly]. In:Leal I, Pais-Ribeiro J, Silva I, Marques S, eds. Actas do 7°congresso nacional de psicologia da saúde. Lisboa: ISPA, 2008;217–220.
49 Lawton MP, Brody EM. Assessment of older people: self-maintaining and instrumental activities of daily living. Ger-ontologist 1969; 9: 179–186.
50 Pereira M, Melo C, Gameiro S, Canavarro MC. Estudospsicométricos da versão em Português Europeu do índicede qualidade de vida EUROHIS-QOL-8. Lab Psicol 2011; 9:109–123.
51 Schmidt S, Muhlan H, Power M. The EUROHIS-QOL8-item index: psychometric results of a cross-cultural fieldstudy. Eur J Public Health 2006; 16: 420–428.
52 Vilar M, Simões MR, Sousa LB, Firmino H, Paredes T,Lima MP. Avaliação da Qualidade de Vida em AdultosIdosos: Notas em torno do processo de adaptação evalidação do WHOQOL-OLD para a populaçãoportuguesa [Quality of life assessment in older adults.Notes of the adaptation and validation process ofWHOQOL-OLD for the Portuguese population]. In:Canavarro MC, Serra AV, eds. qualidade de vida e saúde: Umaabordagem na perspectiva da Organização Mundial De Saúde.Lisboa: F. C. Gulbenkian, 2010; 229–250.
Portuguese version of TFI
© 2014 Japan Geriatrics Society | 9
53 Power M, Quinn K, Schmidt S, Group W-O. Developmentof the WHOQOL-old module. Qual Life Res 2005; 14:2197–2214.
54 Roberts HC, Denison HJ, Martin HJ et al. A review of themeasurement of grip strength in clinical and epidemiologi-cal studies: towards a standardised approach. Age Ageing2011; 40: 423–429.
55 Palmieri RM, Ingersoll CD, Stone MB, Krause BA. Center-of-pressure parameters used in the assessment of posturalcontrol. J Sport Rehabil 2002; 11: 51–66.
56 Santos-Eggimann B, Cuenoud P, Spagnoli J, Junod J.Prevalence of frailty in middle-aged and older community-dwelling Europeans living in 10 countries. J Gerontol A BiolSci Med Sci 2009; 64: 675–681.
57 Gobbens RJ, van Assen MA, Luijkx KG, Schols JM. Thepredictive validity of the Tilburg frailty indicator: disability,health care utilization, and quality of life in a population atrisk. Gerontologist 2012; 52: 619–631.
58 Gobbens RJ, Luijkx KG, van Assen MA. Explaining qualityof life of older people in the Netherlands using a multidi-mensional assessment of frailty. Qual Life Res 2012; 22:2051–2061.
59 INE. Censos 2011 Resultados Definitivos – Portugal [2011Census Final Results – Portugal]. Lisboa: Instituto Nacionalde Estatística (INE), I. P., 2012.
60 Landis JR, Koch GG. The measurement of observer agree-ment for categorical data. Biometrics 1977; 33: 159–174.
61 Fitzpatrick AL, Buchanan CK, Nahin RL et al. Associationsof gait speed and other measures of physical function withcognition in a healthy cohort of elderly persons. J GerontolA Biol Sci Med Sci 2007; 62: 1244–1251.
62 Stegenga BT, Nazareth I, Torres-Gonzalez F et al. Depres-sion, anxiety and physical function: exploring the strengthof causality. J Epidemiol Community Health 2012; 66 (7): e25.
63 Mehta KM, Yaffe K, Brenes GA et al. Anxiety symptomsand decline in physical function over 5 years in the health,aging and body composition study. J Am Geriatr Soc 2007;55: 265–270.
Supporting Information
Additional Supporting Information may be found in theonline version of this article at the publisher’s web-site:
Description of the additional measures.English and Portuguese versions of the Tilburg FrailtyIndicator.
T Coelho et al.
10 | © 2014 Japan Geriatrics Society

57
3.2. Determinants of frailty: the added value of assessing
medication
Autores: Tiago Coelho, Constança Paúl, Robbert J. J. Gobbens, Lia Fernandes
Frontiers in Aging Neuroscience (em processo de revisão)
Fator de Impacto (2013): 2.843
Indexação: Chemical Abstracts Service (CAS); CrossRef; DOAJ; EMBASE; Google
Scholar; PsycINFO; PubMed Central; PubMed; Scopus

58
Abstract
This study aims to analyze which determinants predict frailty in general and each frailty
domain (physical, psychological, and social), considering the integral conceptual model of
frailty, and particularly to examine the contribution of medication in this prediction. A cross-
sectional study was designed using a non-probabilistic sample of 252 community-dwelling
elderly from three Portuguese cities. Frailty and determinants of frailty were assessed with
the Tilburg Frailty Indicator. The amount of different daily-consumed medicines was also
examined. Hierarchical regression analysis were conducted. The mean age of the
participants was 79.2 years (±7.3), and most of them were women (75.8%), widowed
(55.6%) and with a low educational level (0-4 years: 63.9%). In this study, determinants
explained 46% of the variance of total frailty, and 39.8%, 25.3%, and 27.7% of physical,
psychological, and social frailty respectively. Age, gender, income, death of a loved one in
the past year, lifestyle, satisfaction with living environment and self-reported comorbidity
predicted total frailty, while each frailty domain was associated with a different set of
determinants. The number of medications independently predicted an additional 2.5% of
total frailty and 5.3% of physical frailty. The adverse effects of polymedication and its direct
link with the amount of comorbidities could explain the independent contribution of this
variable to frailty prediction. In the present study, a significant part of frailty was predicted,
and the different contributions of each determinant to frailty domains provided additional
evidence of the integral model of frailty’s relevance. The added value of a simple
assessment of medication was considerable, and it should be taken into account for
effective identification of frailty.
Keywords: elderly, frailty, determinants, comorbidity, medication.

59
Introduction
As age increases, physiological reserves inevitably decrease in multiple systems, and
comorbidities become more prevalent (WHO, 1999). Nonetheless, chronological age is not
a precise indicator of functional decline (Bergman et al., 2007). The changes that
accompany aging depend on genetic and environmental factors, and are lifestyle and life
event related (WHO, 1999). Therefore, while some may remain healthy and resilient in later
life, others may become increasingly vulnerable to internal and external stressors. The latter
refers to a state of frailty.
Frail individuals are at greater risk of clinically significant adverse outcomes such as
hospitalization, institutionalization and mortality (Abellan van Kan et al., 2008; Fried,
Ferrucci, Darer, Williamson, & Anderson, 2004; Fried, Walston, & Ferrucci, 2009). Although
frailty is generally considered a clinical syndrome separate from the normal aging process,
there are different perspectives about its definition (Bergman et al., 2007; Hogan,
MacKnight, & Bergman, 2003; Markle-Reid & Browne, 2003; Sternberg, Wershof Schwartz,
Karunananthan, Bergman, & Mark Clarfield, 2011). More traditional approaches to the
concept describe frailty as an exclusively physical condition (presence of three or more of
the following components: weight loss, low physical activity, exhaustion, slowed
performance and weakness) (Fried et al., 2001), or as a result of the accumulation of
multidimensional deficits (e. g. disabilities, symptoms, signs, diseases) (Rockwood &
Mitnitski, 2007). On the other hand, following the more current trends in frailty definition, the
recently described integral conceptual model specified frailty as dynamic pre-disability state
that includes losses in physical, psychological and/or social domains (Gobbens, Luijkx,
Wijnen-Sponselee, & Schols, 2010a, 2010b, 2010c).
A broader definition of frailty also involves that the factors considered as underlying a
state of increased vulnerability are beyond the decline of physiological reserve and
comorbidity. In fact, according to the integral conceptual model of frailty, life course
determinants such as sociodemographic characteristics and lifestyle, life event and
environment-related factors can influence frailty directly, besides influencing the onset of
diseases which can also lead to frailty (Gobbens, Luijkx, et al., 2010c; Gobbens, van Assen,
Luijkx, & Schols, 2012; Gobbens, van Assen, Luijkx, Wijnen-Sponselee, & Schols, 2010a).
From this standpoint, as multiple circumstances may impact the onset of frailty in older
persons, researchers should focus on ascertaining which elements are associated with
frailty in different contexts.
This study’s main objective was to analyze which determinants – described in the
integral conceptual model of frailty – contribute to the prediction of frailty in general and of

60
each frailty domain (physical, psychological, and social), in a sample of Portuguese
community dwelling individuals aged 65 years and over. Furthermore, the present study
examined if a simple and objective measurement, such as assessing the number of daily-
consumed medications, could help to explain frailty variance, after controlling for the effect
of the determinants. It is hypothesized that a higher medication consumption is
independently associated with increased frailty levels.
Materials and methods
Study Design and Participants
A cross-sectional study was designed with a non-probabilistic sample of 252
community dwelling elderly (aged 65 years and over), in three northern Portuguese cities
(Maia, Porto and Vila Nova de Gaia).
Exclusion criteria were severe cognitive impairment (screened with Mini Mental State
Examination (Folstein, Folstein, & McHugh, 1975)) and being unable to speak Portuguese.
Participants were interviewed in 16 local community institutions, such as social,
recreation and day care centers, as well as universities of the third age. Trained researchers
conducted the personal interviews from May to September 2013, using structured
questionnaires. The study was approved by institutional review boards and written informed
consent was obtained.
Measurements
Frailty and determinants of frailty were assessed with the Tilburg Frailty Indicator (TFI)
(Gobbens, van Assen, Luijkx, Wijnen-Sponselee, & Schols, 2010b), which is an
operationalization of the integral conceptual model of frailty. This brief self-report
questionnaire comprises two subscales (parts A and B). Part A is composed of 10 questions
about determinants of frailty: sociodemographic characteristics (age, sex, marital status,
nationality, level of education, income); life events in the last year (death of a loved one,
serious illness, serious illness in a loved one, divorce or end of an important relationship,
traffic accident, crime); assessment of how healthy the respondent’s lifestyle is; satisfaction
with home living environment; and presence of two or more chronic diseases. Part B
measures frailty in three domains: physical (physical health, unexplained weight loss,
difficulty in walking, difficulty in maintaining balance, hearing problems, vision problems,
lack of strength in hands, and physical tiredness), psychological (cognition, depression and
anxiety symptoms, and coping), and social (living alone, social relations and support). All

61
items are rated dichotomously (0-1), with higher scores meaning higher frailty. Scores for
each frailty domain and a total frailty score (0-15) are produced. The Portuguese version
of TFI (Coelho, Santos, Paúl, Gobbens, & Fernandes, 2014) was used. This tool has a good
internal consistency (KR-20=0.78) and test-retest reliability (r=0.91) for total frailty, and
there is encouraging evidence in regard to its construct and criterion validity (Coelho et al.,
2014).
Medication was assessed in terms of the number of different daily-consumed drugs.
In order to prevent recall bias during the interview, participants were previously asked to
bring their medication or prescriptions to the interview.
Statistical Analysis
Descriptive statistical analysis was performed using proportions and measures of
central tendency and dispersion, according to the nature of the variables.
Linear regressions were conducted to ascertain how each determinant predicts frailty
total score/each domain. Multiple regression analysis were hierarchical, consisting of four
steps: in the first one, sociodemographic characteristics and life events were entered as
predictors; second, assessment of lifestyle and satisfaction with living environment; third,
self-reported comorbidity; and fourth, number of daily-consumed medicines.
As in previous studies (Gobbens et al., 2012; Gobbens, van Assen, et al., 2010a), life
event “serious illness in the last year” was excluded from the analysis because it overlaps
with comorbidity. Likewise, marital status was not considered for the prediction of total frailty
and social frailty because it is closely linked with the TFI item “living alone”. Variables that
revealed low frequencies (<5%) in the descriptive analysis were excluded in the regression
models.
Two-tailed tests were used throughout all analysis and a p-value<0.05 was
considered statistically significant. All statistical analysis were conducted using IBM SPSS
Statistics 22.0 (SPSS, Inc., Chicago, IL, USA).
Results
Descriptive Analysis
The mean age of the participants was 79.2 years (±7.3), mostly women (75.8%),
widowed (55.6%), and low education level (63.9%). The most common monthly household
income was 251 to 500 euros (32.9%). The most shared life event (28.2%) was serious
illness in a loved one, most described their lifestyle as healthy (54.4%), and were satisfied
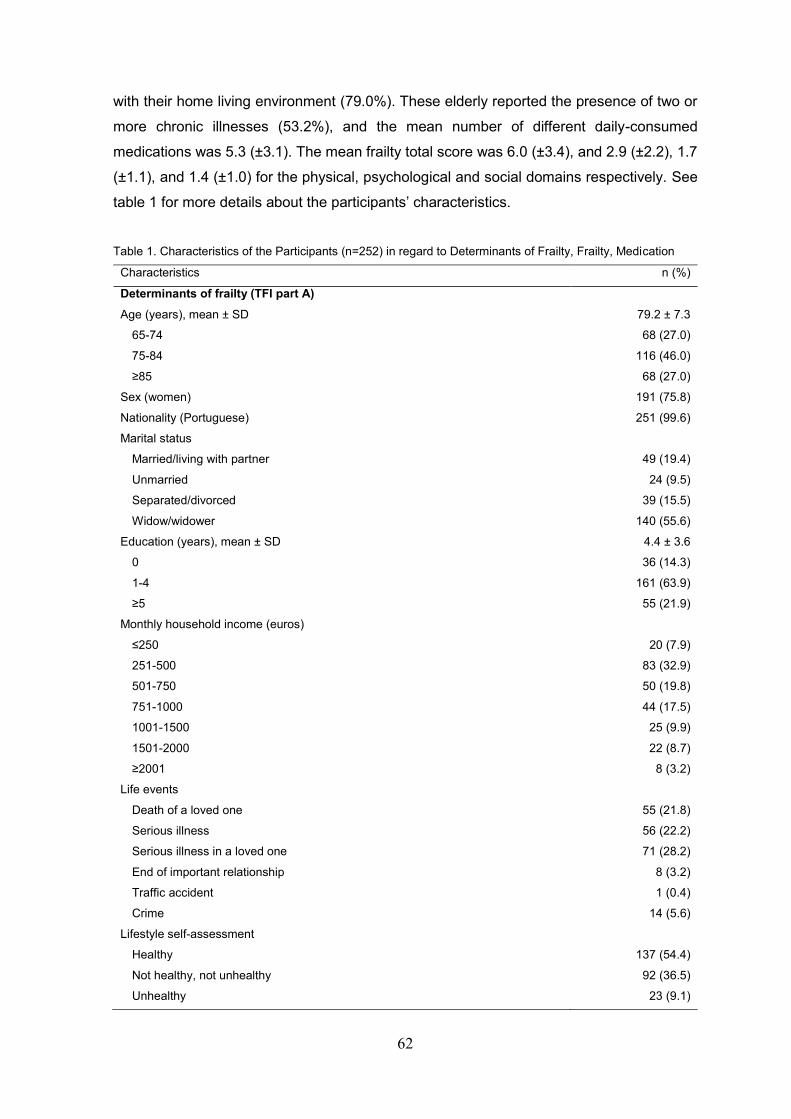
62
with their home living environment (79.0%). These elderly reported the presence of two or
more chronic illnesses (53.2%), and the mean number of different daily-consumed
medications was 5.3 (±3.1). The mean frailty total score was 6.0 (±3.4), and 2.9 (±2.2), 1.7
(±1.1), and 1.4 (±1.0) for the physical, psychological and social domains respectively. See
table 1 for more details about the participants’ characteristics.
Table 1. Characteristics of the Participants (n=252) in regard to Determinants of Frailty, Frailty, Medication
Characteristics n (%)
Determinants of frailty (TFI part A)
Age (years), mean ± SD 79.2 ± 7.3
65-74 68 (27.0)
75-84 116 (46.0)
≥85 68 (27.0)
Sex (women) 191 (75.8)
Nationality (Portuguese) 251 (99.6)
Marital status
Married/living with partner 49 (19.4)
Unmarried 24 (9.5)
Separated/divorced 39 (15.5)
Widow/widower 140 (55.6)
Education (years), mean ± SD 4.4 ± 3.6
0 36 (14.3)
1-4 161 (63.9)
≥5 55 (21.9)
Monthly household income (euros)
≤250 20 (7.9)
251-500 83 (32.9)
501-750 50 (19.8)
751-1000 44 (17.5)
1001-1500 25 (9.9)
1501-2000 22 (8.7)
≥2001 8 (3.2)
Life events
Death of a loved one 55 (21.8)
Serious illness 56 (22.2)
Serious illness in a loved one 71 (28.2)
End of important relationship 8 (3.2)
Traffic accident 1 (0.4)
Crime 14 (5.6)
Lifestyle self-assessment
Healthy 137 (54.4)
Not healthy, not unhealthy 92 (36.5)
Unhealthy 23 (9.1)

63
Satisfaction with living environment 199 (79.0)
Self-reported comorbidity 134 (53.2)
Frailty (TFI part B)
TFI total score (0-15), mean ± SD 6.0 ± 3.4
TFI physical domain score (0-8), mean ± SD 2.9 ± 2.2
TFI psychological domain score (0-4), mean ± SD 1.7 ± 1.1
TFI social domain score (0-3), mean ± SD 1.4 ± 1.0
Medication
Number of daily-consumed medication, mean ± SD 5.3 ± 3.1
Regression Analysis
First, due to the low percentage of non-Portuguese individuals, nationality was
excluded from the regression analysis. Likewise, life events “divorce or end of important
relationship” and “traffic accident” were left out. Also resulting from the descriptive analysis,
the last two categories of income “1501-2000” and “≥2001” were regrouped in the single
category “≥1501” before inclusion in the regression models. On the other hand, a dummy
variable “cohabit” (“1” for married/living with partner and “0” for unmarried,
separated/divorced and widow/widower) was created as an alternative to marital status. A
dummy variable for sex was also created (“1” for women and “0” for men), and lifestyle was
rated “1” for “healthy”, “2” for “not healthy, not unhealthy”, and “3” for “Unhealthy”.
Preliminary analysis showed that the effects of education, income and lifestyle were linear,
whereas the effects of age were both linear and quadratic. Consequently, age was squared
and centered to allow the analysis of both effects on the regression models.
Table 2 presents the effects of the determinants on TFI total score and their
significance in the four steps of the hierarchical regression. The first one showed that age
had a quadratic effect on frailty, with the youngest and oldest participants having less frailty.
Women were, on average, frailer than men, as well as those who experienced the death of
a loved one in the last year. On the other hand, as monthly income increases, the degree
of frailty decreases. Education and life events “serious illness in a loved one” and “crime”
had no effect on frailty. A total of 17.2% of frailty was predicted in the first step. In the second
step, an additional 22.9% was predicted. Unhealthy lifestyle and dissatisfaction with living
environment were associated with higher frailty. By including self-reported comorbidity in
the third step, 5.9% of the variance of frailty was further predicted, with the presence of
comorbidity being associated with a higher degree of frailty. Finally, by adding the amount
of daily-consumed medication, an additional 2.5% of frailty was predicted, while the effect
of age on frailty was no longer significant. As hypothesized, a higher number of medications
was associated with higher frailty levels.

64
Table 2. Results of Hierarchical Regression Analysis on Frailty
Determinants
Model 1 Model 2 Model 3 Model 4
b 95%CI r b 95%CI r b 95%CI r b 95%CI r
Age
Linear effect 0.02 -0.04; 0.08 0.03 0.02 -0.03; 0.07 0.05 0.04 -0.01; 0.09 0.08 0.04 -0.01; 0.09 0.07
Quadratic effect -0.01** -0.02; 0.00 0.16 -0.01* -0.01; 0.00 -0.13 -0.01* -0.01; 0.00 -0.10 -0.01 -0.01; 0.00 -0.08
Sex (women vs. men) 1.41** 0.46; 2.35 0.17 1.25** 0.43; 2.06 0.16 0.95* 0.17; 1.74 0.11 1.03** 0.26; 1.80 0.12
Education --0.11 -0.24; 0.01 -0.10 -0.09 -0.20; 0.02 -0.09 -0.06 -0.16; 0.04 -0.05 -0.03 -0.14; 0.07 -0.03
Monthly household income -0.43** -0.71; -0.15 -0.18 -0.35** -0.59; -0.11 -0.15 -0.31** -0.54; -0.08 -0.13 -0.32** -0.55; -0.10 -0.13
Life events
Death of a loved one 1.15* 0.15; 2.14 0.13 1.01* 0.16; 1.86 0.12 1.08** 0.27; 1.90 0.13 1.05** 0.26; 1.85 0.12
Serious illness in a loved one 0.30 -0.61; 1.22 0.04 0.20 -0.58; 0.99 0.03 0.15 -0.60; 0.89 0.02 0.07 -0.66; 0.80 0.01
Crime 0.25 -1.49; 2.00 0.02 0.31 -1.18; 1.80 0.02 0.06 -1.36; 1.48 0.00 -0.02 -1.41; 1.37 -0.00
Lifestyle 1.73*** 1.18; 2.28 0.31 1.48*** 0.95; 2.01 0.26 1.41*** 0.90; 1.93 0.25
Satisfaction living environment -2.35*** -3.22; -1.49 -0.27 -1.96*** -2.80; -1.12 -0.22 -2.01*** -2.83; -1.19 -0.22
Self-reported comorbidity 1.82*** 1.11; 2.52 0.24 1.39*** 0.66; 2.12 0.17
Medication 0.20*** 0.08; 0.31 0.16
ΔR2 (%) (p-value) 17.2 (<0.001) 22.9 (<0.001) 5.9 (<0.001) 2.5 (<0.001)
Regression coefficient (b), semi-partial correlation coefficient (r) and p-value for each determinant, and coefficient of determination change (ΔR2) and p-value for each model.
* p<0.05. ** p<0.01. ***p<0.001.

65
In regard to physical frailty, a total of 45.1% of TFI physical domain score was
predicted (step 1: ΔR2=14.2%; step 2: ΔR2=19.7%; step 3: ΔR2=5.9%; step 4: ΔR2=5.3%).
In the last model, physical frailty was associated with age (positive linear effect), death of a
loved one in the last year, unhealthy lifestyle, dissatisfaction with living environment, self-
reported comorbidity and a higher amount of medication. The quadratic effect of age was
no longer significant after adding lifestyle and satisfaction with living environment, whereas
sex and education no longer contributed to frailty prediction after adding self-reported
comorbidity. Income, serious illness in a loved one, crime and cohabitation had no effect on
physical frailty.
Psychological frailty was significantly higher in women, in participants who had
experienced the death of a loved one in the last year, had unhealthy lifestyle, weren’t
satisfied with living environment and reported comorbidity. The effect of education was only
significant in the first step, whereas the contribution of age, income, cohabitation, the
remainder life events and number of medications was always non-significant. A total of
25.3% of TFI psychological domain score was predicted in the first three models (step 1:
ΔR2=10.8%; step 2: ΔR2=11.9%; step 3: ΔR2=2.6%).
Likewise, the amount of daily-consumed medication did not contribute to the
prediction of social frailty. Remarkably, neither did self-reported comorbidity. A total of
27.7% was predicted in the first two steps (step 1: ΔR2=19.3%; step 2: ΔR2=8.4%). Social
frailty was associated with age (quadratic effect), being female, higher levels of education,
lower income, lifestyle and satisfaction with living environment.
Discussion
A significant proportion of frailty was predicted by life course determinants and by
comorbidity. It was also possible to ascertain that each determinant played a different role
in the prediction of frailty in general and in each domain. This provides robust evidence to
support the integral conceptual model of frailty. The number of daily-consumed drugs was
independently associated with total and physical frailty.
The observed effect of age on frailty was complex. As in other studies (Avila-Funes
et al., 2008; Collard, Boter, Schoevers, & Oude Voshaar, 2012; Gobbens, van Assen, et al.,
2010a), physical frailty was associated with an increase in age. This result was expected
considering the physical toll of aging (Fried et al., 2009). However, total frailty was highest
in participants aged between 75 and 84 years old, mainly because of the higher social frailty
observed in this group. In fact, most of the participants who lived alone were included in this

66
age group, possibly due to the fact that most of the younger participants still lived with their
spouses, and that many older and widowed individuals lived with younger family members
in order to receive the support needed to overcome their physical impairments.
Nonetheless, the fact that age was no longer significant in frailty prediction after adding
medication to the regression analysis, indicates that other determinants, including
comorbidity, better explain the variance of frailty.
Similarly to previous research (Collard et al., 2012; Puts, Lips, & Deeg, 2005; Song,
Mitnitski, & Rockwood, 2010), women were frailer than men. It has been shown that elderly
men have a greater likelihood of dying suddenly, while women more often show a steady
progressive decline, associated with an increase in morbidity (Puts et al., 2005). This fact
can explain the present findings, including why the sex-based difference in physical frailty
disappeared after controlling for comorbidity.
As expected (Avila-Funes et al., 2008; Fried et al., 2001; Woo, Goggins, Sham, & Ho,
2005), frailty was also associated with lower income. On the other hand, education had a
remarkably positive linear effect on the social frailty domain. This result was surprising
considering that in previous research the association of education with frailty was either
non-significant (Garcia-Garcia et al., 2011; Gobbens, van Assen, et al., 2010a), or negative
(Barreto Pde, Greig, & Ferrandez, 2012; Fried et al., 2001; Woo et al., 2005), with lower
education levels predicting higher frailty. The present finding may be explained by different
views and expectations of social support and relationship quality, from individuals with
distinct education levels.
Death of a loved one was the only life event associated with frailty. Considering the
well-documented physical and psychological impact of bereavement (Stroebe, Schut, &
Stroebe, 2007), it is understandable that this event could lead to frailty. Concomitantly,
unhealthier lifestyle and dissatisfaction with living environment predicted frailty in general
and in each domain. This provides further evidence of the previously described importance
of health-related behavior (Avila-Funes et al., 2008; Fried et al., 2009; Gobbens, van Assen,
et al., 2010a) and environmental factors (Bergman et al., 2007; Hogan et al., 2003; Markle-
Reid & Browne, 2003) in precipitating frailty.
Self-reported comorbidity, as in previous research (Gobbens, van Assen, et al.,
2010a), predicted frailty in general, as well as physical and psychological frailty. Most
authors agree that comorbidity can lead to the onset of frailty (Bergman et al., 2007; Fried
et al., 2009; Morley et al., 2013). Nonetheless, as described in other studies (Kriegsman,
Penninx, van Eijk, Boeke, & Deeg, 1996), assessing comorbidity trough self-report may be
susceptible to bias, mainly because of its dependence on the participants’ insight regarding
chronic disease. Consequently, as it is directly linked with the amount of comorbidities, the
assessment of the number of daily-consumed drugs might have been a more precise

67
indicator of the participants’ health status. Moreover considering that self-reported
comorbidity was rated dichotomously (yes/no), to assess the amount of consumed
medicines leads to a more accurate view of the heterogeneity of the participants’
comorbidity burden.
In fact, as hypothesized, the assessment of medication allowed the prediction of an
additional variance of frailty, mainly because of the higher physical frailty of individuals who
take greater levels of medication. It can be discussed that assessing medication, a less
subjective measure than self-reported comorbidity, was associated with the less subjective
domain of frailty. Nonetheless, one should consider that these findings may also be linked
with the adverse outcomes of polymedication and its association with frailty (Gnjidic, Hilmer,
Blyth, Naganathan, Cumming, et al., 2012; Gnjidic, Hilmer, Blyth, Naganathan, Waite, et
al., 2012).
The main strengths of the present study are the statistical procedures used, the
reinforcement of the current evidence supporting the multidimensional definition of frailty
and of its predictors, and the findings in regard to increasing the prediction of frailty with an
objective, easy to execute, assessment of medication. It is also the first study to analyze
the determinants considered in the integral conceptual model of frailty in elderly individuals
from a southern European country. Some limitations of this study should be noted. First, the
non-probabilistic sampling method could have limited these findings namely in regard to
generalization. Furthermore, correlation coefficient values were somewhat low, possibly
due to the small sample size. Also, the cross-sectional design does not allow the
examination of the temporal continuum between determinants, comorbidity and frailty, in
order to conclude causality. Finally, the self-report nature of TFI can be considered a
limitation because of the inherent subjectivity. Nonetheless, TFI items correlated as
expected with corresponding standardized measures in previous research (Coelho et al.,
2014; Gobbens, van Assen, et al., 2010b).
Several directions for future research can be suggested. Longitudinal studies should
be conducted to better examine how life course determinants and comorbidity predict frailty
in the short, medium and long term. Also, further studies should focus on the association of
comorbidity and medications with the psychological and social domains of frailty. Likewise,
the association between level of education and each frailty domain should be thoroughly
analyzed, especially considering the findings of this study in regard to social frailty.
In conclusion, this research provides important information about which factors may
precipitate states of high vulnerability in the present elderly sample. Furthermore, the added
value of a brief assessment of medication was significant, and should be considered as
supplementary to TFI. These findings should be taken into account for more effective

68
identification of frailty, and to implement timely and targeted interventions in order to treat
this syndrome and prevent adverse outcomes.
Acknowledgements
The authors thank all the elderly participants, and all professionals who assisted and
made the data collection possible. Particularly, we thank occupational therapy students
(Alice Rocha, Joana Oliveira, Libânia Silva, Nicole Câmara, Rute Ferreira, Sara Santos,
Stefanie Morais and Sylvie Abreu) for partial data collecting. The authors also thank
Carolina Silva for the assistance with the statistical analysis.
Conflict of interest statement
Authors declare no conflict of interest.
Author contributions
TC, CP and LF designed the study. TC was responsible for data collection, carried
out the statistical analysis, and drafted the paper. CP and LF supervised the whole research
and assisted with interpreting data and writing the article. RG provided advice and aided in
the preparation of the final manuscript. All authors reviewed and provided valuable
contributions to the whole manuscript.
References
Abellan van Kan, G., Rolland, Y., Bergman, H., Morley, J. E., Kritchevsky, S. B., & Vellas,
B. (2008). The I.A.N.A Task Force on frailty assessment of older people in clinical
practice. J Nutr Health Aging, 12(1), 29-37.
Avila-Funes, J. A., Helmer, C., Amieva, H., Barberger-Gateau, P., Le Goff, M., Ritchie, K.,
. . . Dartigues, J. F. (2008). Frailty among community-dwelling elderly people in
France: the three-city study. J Gerontol A Biol Sci Med Sci, 63(10), 1089-1096.

69
Barreto Pde, S., Greig, C., & Ferrandez, A. M. (2012). Detecting and categorizing frailty
status in older adults using a self-report screening instrument. Arch Gerontol Geriatr,
54(3), e249-254. doi: 10.1016/j.archger.2011.08.003
Bergman, H., Ferrucci, L., Guralnik, J., Hogan, D. B., Hummel, S., Karunananthan, S., &
Wolfson, C. (2007). Frailty: an emerging research and clinical paradigm--issues and
controversies. J Gerontol A Biol Sci Med Sci, 62(7), 731-737.
Coelho, T., Santos, R., Paúl, C., Gobbens, R. J. J., & Fernandes, L. (2014). Portuguese
version of the Tilburg Frailty Indicator: Transcultural adaptation and psychometric
validation. Geriatr Gerontol Int, n/a-n/a. doi: 10.1111/ggi.12373
Collard, R. M., Boter, H., Schoevers, R. A., & Oude Voshaar, R. C. (2012). Prevalence of
frailty in community-dwelling older persons: a systematic review. J Am Geriatr Soc,
60(8), 1487-1492. doi: 10.1111/j.1532-5415.2012.04054.x
Folstein, M. F., Folstein, S. E., & McHugh, P. R. (1975). "Mini-mental state". A practical
method for grading the cognitive state of patients for the clinician. J Psychiatr Res,
12(3), 189-198.
Fried, L. P., Ferrucci, L., Darer, J., Williamson, J. D., & Anderson, G. (2004). Untangling the
concepts of disability, frailty, and comorbidity: implications for improved targeting
and care. J Gerontol A Biol Sci Med Sci, 59(3), 255-263.
Fried, L. P., Tangen, C. M., Walston, J., Newman, A. B., Hirsch, C., Gottdiener, J., . . .
Cardiovascular Health Study Collaborative Research, G. (2001). Frailty in older
adults: evidence for a phenotype. J Gerontol A Biol Sci Med Sci, 56(3), M146-156.
Fried, L. P., Walston, J., & Ferrucci, L. (2009). Frailty. In J. B. Halter, J. G. Ouslander, M.
E. Tinetti, S. Studenski, K. P. High & S. Asthana (Eds.), Hazzard’s geriatric medicine
and gerontology (6ª ed., pp. 631-646). New York: McGraw-Hill.
Garcia-Garcia, F. J., Gutierrez Avila, G., Alfaro-Acha, A., Amor Andres, M. S., De Los
Angeles De La Torre Lanza, M., Escribano Aparicio, M. V., . . . Toledo Study, G.
(2011). The prevalence of frailty syndrome in an older population from Spain. The
Toledo Study for Healthy Aging. J Nutr Health Aging, 15(10), 852-856.
Gnjidic, D., Hilmer, S. N., Blyth, F. M., Naganathan, V., Cumming, R. G., Handelsman, D.
J., . . . Le Couteur, D. G. (2012). High-risk prescribing and incidence of frailty among
older community-dwelling men. Clin Pharmacol Ther, 91(3), 521-528. doi:
10.1038/clpt.2011.258
Gnjidic, D., Hilmer, S. N., Blyth, F. M., Naganathan, V., Waite, L., Seibel, M. J., . . . Le
Couteur, D. G. (2012). Polypharmacy cutoff and outcomes: five or more medicines
were used to identify community-dwelling older men at risk of different adverse
outcomes. J Clin Epidemiol, 65(9), 989-995. doi: 10.1016/j.jclinepi.2012.02.018

70
Gobbens, R. J., Luijkx, K. G., Wijnen-Sponselee, M. T., & Schols, J. M. (2010a). In search
of an integral conceptual definition of frailty: opinions of experts. J Am Med Dir
Assoc, 11(5), 338-343. doi: 10.1016/j.jamda.2009.09.015
Gobbens, R. J., Luijkx, K. G., Wijnen-Sponselee, M. T., & Schols, J. M. (2010b). Toward a
conceptual definition of frail community dwelling older people. Nurs Outlook, 58(2),
76-86. doi: 10.1016/j.outlook.2009.09.005
Gobbens, R. J., Luijkx, K. G., Wijnen-Sponselee, M. T., & Schols, J. M. (2010c). Towards
an integral conceptual model of frailty. J Nutr Health Aging, 14(3), 175-181.
Gobbens, R. J., van Assen, M. A., Luijkx, K. G., & Schols, J. M. (2012). Testing an integral
conceptual model of frailty. J Adv Nurs, 68(9), 2047-2060. doi: 10.1111/j.1365-
2648.2011.05896.x
Gobbens, R. J., van Assen, M. A., Luijkx, K. G., Wijnen-Sponselee, M. T., & Schols, J. M.
(2010a). Determinants of frailty. J Am Med Dir Assoc, 11(5), 356-364. doi:
10.1016/j.jamda.2009.11.008
Gobbens, R. J., van Assen, M. A., Luijkx, K. G., Wijnen-Sponselee, M. T., & Schols, J. M.
(2010b). The Tilburg Frailty Indicator: psychometric properties. J Am Med Dir Assoc,
11(5), 344-355. doi: 10.1016/j.jamda.2009.11.003
Hogan, D. B., MacKnight, C., & Bergman, H. (2003). Models, definitions, and criteria of
frailty. Aging Clin Exp Res, 15(3 Suppl), 1-29.
Kriegsman, D. M., Penninx, B. W., van Eijk, J. T., Boeke, A. J., & Deeg, D. J. (1996). Self-
reports and general practitioner information on the presence of chronic diseases in
community dwelling elderly. A study on the accuracy of patients' self-reports and on
determinants of inaccuracy. J Clin Epidemiol, 49(12), 1407-1417.
Markle-Reid, M., & Browne, G. (2003). Conceptualizations of frailty in relation to older
adults. Journal of Advanced Nursing, 44(1), 58-68.
Morley, J. E., Vellas, B., van Kan, G. A., Anker, S. D., Bauer, J. M., Bernabei, R., . . .
Walston, J. (2013). Frailty consensus: a call to action. J Am Med Dir Assoc, 14(6),
392-397. doi: 10.1016/j.jamda.2013.03.022
Puts, M. T., Lips, P., & Deeg, D. J. (2005). Sex differences in the risk of frailty for mortality
independent of disability and chronic diseases. J Am Geriatr Soc, 53(1), 40-47. doi:
10.1111/j.1532-5415.2005.53008.x
Rockwood, K., & Mitnitski, A. (2007). Frailty in relation to the accumulation of deficits. J
Gerontol A Biol Sci Med Sci, 62(7), 722-727.
Song, X. W., Mitnitski, A., & Rockwood, K. (2010). Prevalence and 10-Year Outcomes of
Frailty in Older Adults in Relation to Deficit Accumulation. J Am Geriatr Soc, 58(4),
681-687. doi: DOI 10.1111/j.1532-5415.2010.02764.x

71
Sternberg, S. A., Wershof Schwartz, A., Karunananthan, S., Bergman, H., & Mark Clarfield,
A. (2011). The identification of frailty: a systematic literature review. J Am Geriatr
Soc, 59(11), 2129-2138. doi: 10.1111/j.1532-5415.2011.03597.x
Stroebe, M., Schut, H., & Stroebe, W. (2007). Health outcomes of bereavement. Lancet,
370(9603), 1960-1973. doi: 10.1016/S0140-6736(07)61816-9
WHO. (1999). A life course perspective of maintaining independence in older age. Geneva:
World Health Organization - WHO.
Woo, J., Goggins, W., Sham, A., & Ho, S. C. (2005). Social determinants of frailty.
Gerontology, 51(6), 402-408. doi: 10.1159/000088705

72
3.3. Multidimensional frailty and pain in community dwelling
elderly
Autores: Tiago Coelho, Constança Paúl, Robbert J. J. Gobbens, Lia Fernandes
Pain Medicine (em processo de revisão)
Fator de Impacto (2013): 2.243
Indexação: Academic Search (EBSCO Publishing); Academic Search Alumni Edition
(EBSCO Publishing); Academic Search Premier (EBSCO Publishing); CSA Biological
Sciences Database (ProQuest); CSA Environmental Sciences & Pollution Management
Database (ProQuest); Current Contents: Clinical Medicine (Thomson Reuters)
Embase (Elsevier); HEED: Health Economic Evaluations Database (Wiley-Blackwell);
Index Medicus/MEDLINE (NLM); Journal Citation Reports/Science Edition (Thomson
Reuters); MEDLINE/PubMed (NLM); PsycINFO/Psychological Abstracts (APA); Science
Citation Index Expanded (Thomson Reuters); The RECAL Legacy (National Centre for
Prosthetics & Orthodontics)

73
Abstract
Objective. To examine the relationship between frailty and pain, particularly to analyze
whether pain predicts physical, psychological and social frailty, after controlling for the
effects of life-course determinants and comorbidity.
Design. Cross-sectional.
Methods. A non-probabilistic sample of 252 community dwelling elderly was recruited.
Frailty and determinants of frailty were assessed with the Tilburg Frailty Indicator and pain
was measured with the Pain Impact Questionnaire. Hierarchical regression analysis was
conducted.
Results. In this study, 52.4% of the participants were aged 80 years and over, and 75.8%
were women. Pain and frailty were higher in women, and physical frailty was higher in those
aged ≥80 years. Greater pain was associated with higher frailty levels. After controlling for
the effects of the determinants and comorbidity, pain predicted 5.8% of the variance of
frailty, 5.9% of the variance of physical frailty, and 4.0% of the variance of psychological
frailty, while the prediction of social frailty was non-significant.
Conclusion. Frailty was independently predicted by pain, emphasizing the importance of
its treatment, contributing for the prevention of vulnerability, dependency and mortality.
Nonetheless, longitudinal studies are required in order to better understand the association
between pain and frailty.
Key words: Elderly, frailty, pain.

74
Introduction
Frailty is the term used in geriatrics to describe a clinical syndrome in which the
individual is in a state of increased vulnerability to stressors, which entails a high risk of
adverse outcomes, such as functional deterioration, hospitalization, institutionalization and
death [1-5]. Although it is generally recognized that the prevalence of frailty increases with
age, particularly affecting persons older than 80 years, the precise prevalence rates depend
of the definition of frailty [4, 6]. In fact, there are different approaches regarding the specific
components of frailty [7-10]. The presence of exclusively physical manifestations (weight
loss, low physical activity, exhaustion, slowed performance and weakness) that constitute
the Frailty Phenotype [11], and the accumulation of various deficits (e. g. disabilities,
symptoms, signs, diseases) that create a Frailty Index [2], are the most popular approaches.
Currently, some definitions of frailty tend to include psychological and social components in
addition to physical components, and exclude disability as part of frailty [1, 7, 8, 12, 13].
Frailty can occur as the result of the interplay between a significantly diminished
physiological capacity, life-course determinants and medical conditions [5, 14, 15]. These
conditions, particularly chronic illnesses such as cancer and osteoarticular diseases, are
likewise documented as an evident source of pain in the elderly [16, 17]. In fact, pain is also
highly prevalent in older populations, and its interference with everyday life increases
significantly with age [18-20]. Furthermore, if untreated, pain may have a severe impact on
the physical, psychological and social domains of functioning [17, 21-24]. Therefore, it
seems reasonable to hypothesize that pain and frailty may be linked, particularly that pain,
in older individuals who most likely already suffer from chronic illness, can expand their
vulnerability and lead to frailty situations.
To our knowledge, Blyth et al. [25] published the first study focused on specifically
examining the relationship between frailty and pain, and found that those already frail (with
≥3 components of the Frailty Phenotype) were more likely to report pain. Since then, several
studies have corroborated the hypothesis of frailty being positively associated with pain [26-
29]. Although the direction of the association has not yet been established, the hypothesis
of pain diminishing the physiological reserves needed to maintain homeostasis when faced
with biological, psychological or social stressors, and precipitating frailty, proposed by
Shega et al. [29] based on the concept of pain homeostenosis [30], seems to be well
supported.
Considering the conceptualized relationship between pain and frailty, and that in
previous research, frailty has only been measured according to more traditional approaches
to the concept (as a physical syndrome/Frailty Phenotype or as a result of the accumulation

75
of deficits/Frailty Index), undervaluing the importance of psychosocial components, the
present study aims to examine whether pain predicts multidimensional frailty (physical,
psychological and social) in a sample of community dwelling elderly individuals.
Methods
Study design and sample
A cross-sectional study was designed using a non-probabilistic sample of 252 elderly
persons from the district of Porto, Portugal. The participants were community dwellers aged
65 years and over. Individuals who were unable to speak Portuguese, or with severe
cognitive impairment (screened with the Mini Mental State Examination [31]), were excluded
due to the self-report nature of the measures used.
Participants were interviewed in 16 local community institutions, such as social,
recreation and day care centers, as well as universities of the third age. Data collection was
carried out from May to September 2013 by trained researchers. The study was approved
by the institutional reviewer board and all participants gave their written informed consent.
Measures
Frailty and determinants of frailty were assessed with the Tilburg Frailty Indicator (TFI)
[32]. The TFI is an operationalization of the Integral Conceptual Model of Frailty [12, 33-35],
which defines it as a dynamic pre-disability state resulting from losses in physical,
psychological and/or social domains. It consists of a brief self-report screening
questionnaire divided in two subscales. The first subscale (10 items) assesses the
determinants of frailty proposed in the model: sociodemographic characteristics (age,
gender, marital status, ethnicity, level of education, income); life events in the last year
(death of a loved one, serious illness, serious illness in a loved one, divorce or end of an
important relationship, traffic accident, crime); assessment of how healthy the respondent’s
lifestyle is; satisfaction with their home environment; and the presence of two or more
chronic diseases. The second subscale (15 items) measures physical frailty (physical
health, unexplained weight loss, difficulty in walking, difficulty in maintaining balance,
hearing problems, vision problems, lack of strength in hands, and physical tiredness),
psychological frailty (cognition, depression and anxiety symptoms and coping), and social
frailty (living alone, social relations and social support). All items are rated dichotomously
(0-1), and scores for each frailty domain and a total frailty score are produced. Higher scores

76
refer to higher frailty. In the present study, the Portuguese version of TFI [36] was used
(internal consistency = 0.78).
Pain was measured with the Pain Impact Questionnaire (PIQ-6) [37]. PIQ-6 is a brief
(6-item) self-report questionnaire, rated with 6 or 5 point Likert scales. It measures the
presence/severity of pain (1 item), and its impact on functional status (3 items) and
emotional well-being (2 items), within a 4-week recall period. The total score is calculated
by a conversion of the scores of each item and by the sum of the weighted responses,
ranging from 40-78 points. A higher impact of pain translates into higher scores. The
Portuguese version of PIQ-6 [38] was used (internal consistency = 0.92).
Statistical analysis
Descriptive statistical analysis was performed using proportions and measures of
central tendency and dispersion, according to the variables’ nature. Independent sample t-
tests were performed to compare frailty and pain, according to age and gender. Hierarchical
regression analysis were conducted in order to ascertain whether pain (independent
variable) predicted frailty in general and each frailty domain (dependent variables), after
controlling for the effect of determinants of frailty (covariates) in frailty variance. Age,
gender, marital status, ethnicity, level of education, income, life events, lifestyle, living
environment and comorbidity were included in the first step of the regression, and pain in
the second, for each frailty score. As in previous studies [35, 39], life event “serious illness
in the last year” was excluded from the analysis because it overlaps with comorbidity.
Likewise, marital status was not considered for the prediction of total frailty and social frailty
because it is closely linked with the TFI item “living alone”. Two-tailed tests were used
throughout all analysis and a p-value <0.05 was considered statistically significant. All
statistical analysis were conducted using IBM SPSS Statistics 22.0 (SPSS, Inc., Chicago,
IL, USA).
Results
In the present study, 52.4% of the participants were aged 80 years and over
(mean=79.2±7.3), and 75.8% were women. Most of the individuals were Portuguese
(99.6%), widowed (55.6%), and had ≤4 years of education (78.2%) and low (≤500 euros)
household income (40.9%). Serious illness of a loved one, serious illness and death of a
loved one were the most often reported life events (28.2%, 22.2% and 21.8%, respectively).
In the sample, 54.4% described their lifestyle as healthy, 79.0% were satisfied with their

77
living environment, and 53.2% reported the presence of two or more chronic illnesses. The
mean pain impact score was 53.8 (±10.7). The mean frailty total score was 6.0 (±3.4), and
2.9 (±2.2), 1.7 (±1.1), and 1.4 (±1.0) for physical, psychological and social frailty
respectively.
There were statistically significant differences between participants aged 65-79 years
and those aged ≥80 years in physical frailty scores, although not in psychological, social
and total frailty, and in pain. On the other hand, there were significant differences between
men and women in regard to total frailty, physical frailty, psychological frailty, social frailty,
and pain. Frailty and pain impact was higher in women. See Table 1 for additional details
regarding t-test results.
Table 1: Results of t-tests and descriptive statistics of frailty and pain scores by age group and gender
Measure
Age group
95%CI for Mean Difference t df 65-79 years ≥80 years
M SD M SD
Frailty 5.6 3.6 6.4 3.3 -1.7, 0.0 -1.94 250
Physical frailty 2.5 2.3 3.2 2.2 -1.3, -0.2 -2.55* 250
Psychological frailty 1.6 1.1 1.8 1.1 -0.4, 0.1 -1.07 250
Social frailty 1.4 1.0 1.4 1.0 -0.2, 0.3 0.16 250
Pain impact 53.1 11.0 54.4 10.5 -4.0, 1.3 -1.01 250
Gender
Men Women
Frailty 4.8 3.2 6.4 3.4 -2.6, -0.7 -3.30** 250
Physical frailty 2.3 2.1 3.1 2.2 -1.4, -0.1 -2.34* 250
Psychological frailty 1.4 1.1 1.8 1.1 -0.8, -0.2 -3.01** 250
Social frailty 1.1 1.0 1.5 1.0 -0.7, -0.1 -2.76** 250
Pain impact 48.1 9.1 55.6 10.6 -10.4, -4.5 -4.95*** 250
* p<0.05. ** p<0.01. ***p<0.001.
Regarding the regression analysis, variables that revealed low frequencies (<5%)
were excluded: ethnicity (due to the low percentage of non-Portuguese individuals) and life
events “divorce or end of important relationship” and “traffic accident”. A dummy variable
“cohabit” (“1” for married/living with partner and “0” for unmarried, separated/divorced and
widow/widower) was created as an alternative to marital status. Gender was rated “1” for
women and “0” for men, while lifestyle was rated “1” for “healthy”, “2” for “not healthy, not
unhealthy”, and “3” for “Unhealthy”.
The results of the regression indicated that after controlling for the effects of
determinants of frailty, pain predicted 5.8% of the variance of frailty, 5.9% of the variance
of physical frailty, and 4.0% of the variance of psychological frailty, while the prediction of

78
social frailty was non-significant. Regression coefficients indicate that an increase in pain
impact would imply an increase in frailty scores. See Table 2 for additional details regarding
the regression analysis.
Table 2: Hierarchical regression of life-course determinants and comorbidity (step 1), and pain (step 2),
predicting total frailty, physical frailty, psychological frailty, and social frailty.
Step Frailty
ΔR2 ΔF df b 95%CI
Step 1: determinants a 0.460 18.59*** (11, 240) - -
Step 2: pain 0.058 28.92*** (1, 239) 0.09 0.06; 0.13
Physical frailty
Step 1: determinants b 0.398 13.15*** (12, 239) - -
Step 2: pain 0.059 25.77*** (1, 238) 0.06 0.04; 0.09
Psychological frailty
Step 1: determinants b 0.253 6.76*** (12, 239) - -
Step 2: pain 0.040 13.32*** (1, 238) 0.02 0.01; 0.04
Social frailty
Step 1: determinants a 0.287 8.78*** (11, 240) - -
Step 2: pain 0.005 1.59 (1, 239) 0.01 0.00; 0.02
a Age, gender, education, income, life events (death of a loved one, serious illness in a loved one and crime),
lifestyle, living environment and comorbidity.
b Age, gender, cohabitation, education, income, life events (death of a loved one, serious illness in a loved one
and crime), lifestyle, living environment and comorbidity.
* p<0.05. ** p<0.01. ***p<0.001.
Discussion
More severe pain with interference in daily life and well-being was independently
associated with higher frailty, particularly with physical and psychological frailty. Although
the present study cannot explain the causal direction of this association, these findings
provide important evidence to support the hypothesis that pain can precipitate and/or
worsen frailty in elderly populations.
The present study strengthens the current body of evidence regarding the relationship
between frailty and pain, for two major reasons: first, a well-validated 6-item tool, the PIQ-
6 [37], was used to measure the severity of pain and its impact within a 4-week recall period,
while in previous studies a single question was used to assess either the severity of pain
(e.g. “How much bodily pain have you had during the past 4 weeks?” [26, 29]), or its
interference with function (e.g. ‘‘During the past 4 weeks, how much did pain interfere with
your normal work (including both work outside the home and housework)”? [25]). The

79
second reason underlined that in previous studies frailty was assessed as a whole (with
individuals being categorized as frail, pre-frail and not frail), and considered exclusively as
a physical condition [25, 27, 28] or as an accumulation of deficits mainly related to function
and comorbidity [26, 29], in this study it was shown that pain has a different association with
the overall scores of distinct domains of frailty: physical, psychological and social.
Particularly, the present study showed that pain could predict physical frailty. This can
be explained by the well-documented impact of pain on physical function. In fact, pain has
been connected with mobility limitations, fatigue, and decreased nutritional intake [24, 40-
42], which are components of physical frailty, or directly linked to them. Evidence also shows
that pain can lead to sleep disturbances [17, 23, 24, 42], which in turn have been associated
with higher physical frailty [43, 44].
This study also demonstrated that pain independently predicts psychological frailty.
This was expected considering the robust evidence supporting the complex bi-directional
relationship between psychological factors and pain [22, 45, 46]. Previous research
provides evidence of fewer complaints of pain in elderly individuals with good coping
strategies and without depression [22]. On the other hand, some authors highlight that
persistent pain can precipitate anxiety and depressive symptoms, as well as cognitive
dysfunction [17, 18, 22, 47].
Finally, the present study found no association between pain and the components of
social frailty (living alone, missing having people around, and not receiving enough social
support), although some authors state that persistent pain can have a negative effect on
socialization [22]. The social impact of pain, while certainly related to its physical and
psychological consequences, seems therefore less evident. In fact, a previous study shows
that there are no significant differences in the social networks of elderly whether or not they
are in pain [42].
The evidence provided by this study highlights the importance of the effective
treatment of pain in order to prevent, attenuate or reverse frailty in the elderly. There is a
vast array of pharmacological and nonpharmacological strategies that contribute to the relief
of pain, particularly when individually tailored after a comprehensive assessment of the
patient [22, 48]. The most common strategy employed is the prescription of analgesic drugs
(nonopioids, opioids and adjuvant drugs) [22]. There is some evidence of the usefulness of
other medications in pain management, such as vitamin D supplement [17, 21], which is
also considered to have a positive effect on physical frailty [4]. On the other hand, effective
nonpharmacological approaches are reckoned to be adequate, including physical and
occupational therapy, cognitive behavioral therapy and patient and caregiver education
programs [21, 22, 29].

80
The main strengths of the present study are the robust statistical procedures
performed, and the bolstering of the current evidence supporting the association between
pain and frailty, especially by analyzing its relationship to each domain of frailty and
measuring it precisely. Nonetheless, some limitations should be noted. First, the non-
probabilistic sampling method could limit the generalization of the findings. Second, the
cross-sectional design does not allow the examination of the causality between frailty and
pain. Third, pain was not categorized as persistent or acute, since it was measured only
over a 4-week recall period (persistent pain is only present when the painful sensation lasts
for at least 3 months [21]). Considering the potentially cumulative impact of persistent pain
over time, the association with frailty could have been different.
Future research including longitudinal studies will be needed in order to determine the
causality between frailty and pain. The influence of the duration of the painful experience
on frailty and each domain, its social impact as well as its association with the physical and
psychological consequences of persistent pain, should also be examined.
In conclusion, this research provides significant evidence to support the importance
of the assessment and management of pain to prevent frailty in the elderly.
Acknowledgements
The authors thank all the elderly participants and professionals who assisted and
made the data collection possible. They particularly thank occupational therapy students
(Alice Rocha, Joana Oliveira, Libânia Silva, Nicole Câmara, Rute Ferreira, Sara Santos,
Stefanie Morais and Sylvie Abreu) for collecting partial data. The authors also thank
Carolina Silva for her assistance with the statistical analysis.
References
1. Abellan van Kan G, Rolland Y, Bergman H, Morley JE, Kritchevsky SB, Vellas B.
The I.A.N.A Task Force on frailty assessment of older people in clinical practice. J Nutr
Health Aging. 2008;12(1):29-37.
2. Rockwood K, Mitnitski A. Frailty in relation to the accumulation of deficits. J Gerontol
A Biol Sci Med Sci. 2007;62(7):722-7.

81
3. Fried LP, Ferrucci L, Darer J, Williamson JD, Anderson G. Untangling the concepts
of disability, frailty, and comorbidity: implications for improved targeting and care. J Gerontol
A Biol Sci Med Sci. 2004;59(3):255-63.
4. Morley JE, Vellas B, van Kan GA, Anker SD, Bauer JM, Bernabei R, et al. Frailty
consensus: a call to action. J Am Med Dir Assoc. 2013;14(6):392-7.
5. Fried LP, Walston J, Ferrucci L. Frailty. In: Halter JB, Ouslander JG, Tinetti ME,
Studenski S, High KP, Asthana S, editors. Hazzard’s geriatric medicine and gerontology. 6ª
ed. New York: McGraw-Hill; 2009. p. 631-46.
6. Collard RM, Boter H, Schoevers RA, Oude Voshaar RC. Prevalence of frailty in
community-dwelling older persons: a systematic review. J Am Geriatr Soc.
2012;60(8):1487-92.
7. Markle-Reid M, Browne G. Conceptualizations of frailty in relation to older adults.
Journal of Advanced Nursing. 2003;44(1):58-68.
8. Sternberg SA, Wershof Schwartz A, Karunananthan S, Bergman H, Mark Clarfield
A. The identification of frailty: a systematic literature review. J Am Geriatr Soc.
2011;59(11):2129-38.
9. Bergman H, Ferrucci L, Guralnik J, Hogan DB, Hummel S, Karunananthan S, et al.
Frailty: an emerging research and clinical paradigm--issues and controversies. J Gerontol
A Biol Sci Med Sci. 2007;62(7):731-7.
10. Hogan DB, MacKnight C, Bergman H. Models, definitions, and criteria of frailty.
Aging Clin Exp Res. 2003;15(3 Suppl):1-29.
11. Fried LP, Tangen CM, Walston J, Newman AB, Hirsch C, Gottdiener J, et al. Frailty
in older adults: evidence for a phenotype. J Gerontol A Biol Sci Med Sci. 2001;56(3):M146-
56.
12. Gobbens RJ, Luijkx KG, Wijnen-Sponselee MT, Schols JM. Toward a conceptual
definition of frail community dwelling older people. Nurs Outlook. 2010;58(2):76-86.
13. Levers MJ, Estabrooks CA, Ross Kerr JC. Factors contributing to frailty: literature
review. J Adv Nurs. 2006;56(3):282-91.
14. Zaslavsky O, Cochrane BB, Thompson HJ, Woods NF, Herting JR, LaCroix A.
Frailty: a review of the first decade of research. Biological research for nursing.
2013;15(4):422-32.
15. Avila-Funes JA, Helmer C, Amieva H, Barberger-Gateau P, Le Goff M, Ritchie K, et
al. Frailty among community-dwelling elderly people in France: the three-city study. J
Gerontol A Biol Sci Med Sci. 2008;63(10):1089-96.
16. Becquemont L, Benattar-Zibi L, Bertin P, Berrut G, Corruble E, Danchin N, et al.
National observatory on the therapeutic management in ambulatory care patients aged 65

82
and over, with type 2 diabetes, chronic pain or atrial fibrillation. Therapie. 2013;68(4):265-
83.
17. Davis MP, Srivastava M. Demographics, assessment and management of pain in
the elderly. Drugs Aging. 2003;20(1):23-57.
18. Bruckenthal P, Reid MC, Reisner L. Special issues in the management of chronic
pain in older adults. Pain Med. 2009;10 Suppl 2:S67-78.
19. Thomas E, Peat G, Harris L, Wilkie R, Croft PR. The prevalence of pain and pain
interference in a general population of older adults: cross-sectional findings from the North
Staffordshire Osteoarthritis Project (NorStOP). Pain. 2004;110(1-2):361-8.
20. Thomas E, Mottram S, Peat G, Wilkie R, Croft P. The effect of age on the onset of
pain interference in a general population of older adults: prospective findings from the North
Staffordshire Osteoarthritis Project (NorStOP). Pain. 2007;129(1-2):21-7.
21. American Geriatrics Society Panel on Pharmacological Management of Persistent
Pain in Older P. Pharmacological management of persistent pain in older persons. J Am
Geriatr Soc. 2009;57(8):1331-46.
22. A. G. S. Panel on Persistent Pain in Older Persons. The management of persistent
pain in older persons. J Am Geriatr Soc. 2002;50(6 Suppl):S205-24.
23. Scudds RJ, Ostbye T. Pain and pain-related interference with function in older
Canadians: the Canadian study of health and aging. Disability and Rehabilitation.
2001;23(15):654-64.
24. Rudy TE, Weiner DK, Lieber SJ, Slaboda J, Boston JR. The impact of chronic low
back pain on older adults: a comparative study of patients and controls. Pain.
2007;131(3):293-301.
25. Blyth FM, Rochat S, Cumming RG, Creasey H, Handelsman DJ, Le Couteur DG, et
al. Pain, frailty and comorbidity on older men: The CHAMP study. Pain. 2008;140(1):224-
30.
26. Shega JW, Andrew M, Kotwal A, Lau DT, Herr K, Ersek M, et al. Relationship
Between Persistent Pain and 5-Year Mortality: A Population-Based Prospective Cohort
Study. Journal of the American Geriatrics Society. 2013;61(12):2135-41.
27. Koponen MPH, Bell JS, Karttunen NM, Nykanen IA, Desplenter FAM, Hartikainen
SA. Analgesic Use and Frailty among Community-Dwelling Older People A Population-
Based Study. Drug Aging. 2013;30(2):129-36.
28. Chen CY, Wu SC, Chen LJ, Lue BH. The prevalence of subjective frailty and factors
associated with frailty in Taiwan. Arch Gerontol Geriatr. 2010;50 Suppl 1:S43-7.
29. Shega JW, Dale W, Andrew M, Paice J, Rockwood K, Weiner DK. Persistent Pain
and Frailty: A Case for Homeostenosis. Journal of the American Geriatrics Society.
2012;60(1):113-7.

83
30. Karp JF, Shega JW, Morone NE, Weiner DK. Advances in understanding the
mechanisms and management of persistent pain in older adults. Br J Anaesth.
2008;101(1):111-20.
31. Folstein MF, Folstein SE, McHugh PR. "Mini-mental state". A practical method for
grading the cognitive state of patients for the clinician. J Psychiatr Res. 1975;12(3):189-98.
32. Gobbens RJ, van Assen MA, Luijkx KG, Wijnen-Sponselee MT, Schols JM. The
Tilburg Frailty Indicator: psychometric properties. J Am Med Dir Assoc. 2010;11(5):344-55.
33. Gobbens RJ, Luijkx KG, Wijnen-Sponselee MT, Schols JM. In search of an integral
conceptual definition of frailty: opinions of experts. J Am Med Dir Assoc. 2010;11(5):338-
43.
34. Gobbens RJ, Luijkx KG, Wijnen-Sponselee MT, Schols JM. Towards an integral
conceptual model of frailty. J Nutr Health Aging. 2010;14(3):175-81.
35. Gobbens RJ, van Assen MA, Luijkx KG, Schols JM. Testing an integral conceptual
model of frailty. J Adv Nurs. 2012;68(9):2047-60.
36. Coelho T, Santos R, Paúl C, Gobbens RJJ, Fernandes L. Portuguese version of the
Tilburg Frailty Indicator: Transcultural adaptation and psychometric validation. Geriatrics &
gerontology international. 2014:n/a-n/a.
37. Becker J, Schwartz C, Saris-Baglama RN, Kosinski M, Bjorner JB. Using Item
Response Theory (IRT) for Developing and Evaluating the Pain Impact Questionnaire (PIQ-
6?). Pain Medicine. 2007;8(s3 Computer and):S129-S44.
38. Cavalheiro LM, Gil JA, Goncalves RS, Pacheco MP, Ferreira PL, Fa L. Measuring
the pain impact in adults with a chronic pain condition: adaptation and validation of the Pain
Impact Questionnaire (PIQ-6) to the Portuguese culture. Pain Med. 2011;12(10):1538-43.
39. Gobbens RJ, van Assen MA, Luijkx KG, Wijnen-Sponselee MT, Schols JM.
Determinants of frailty. J Am Med Dir Assoc. 2010;11(5):356-64.
40. Hairi NN, Cumming RG, Blyth FM, Naganathan V. Chronic pain, impact of pain and
pain severity with physical disability in older people--is there a gender difference? Maturitas.
2013;74(1):68-73.
41. Pereira LS, Sherrington C, Ferreira ML, Tiedemann A, Ferreira PH, Blyth FM, et al.
Self-reported chronic pain is associated with physical performance in older people leaving
aged care rehabilitation. Clin Interv Aging. 2014;9:259-65.
42. Jakobsson U, Klevsgård R, Westergren A, Hallberg IR. Old people in pain: A
comparative study. Journal of Pain and Symptom Management. 2003;26(1):625-36.
43. Ensrud KE, Blackwell TL, Redline S, Ancoli-Israel S, Paudel ML, Cawthon PM, et al.
Sleep disturbances and frailty status in older community-dwelling men. J Am Geriatr Soc.
2009;57(11):2085-93.

84
44. Ensrud KE, Blackwell TL, Ancoli-Israel S, Redline S, Cawthon PM, Paudel ML, et al.
Sleep disturbances and risk of frailty and mortality in older men. Sleep Med.
2012;13(10):1217-25.
45. Weiner DK, Hanlon JT. Pain in nursing home residents: management strategies.
Drugs Aging. 2001;18(1):13-29.
46. van Hecke O, Torrance N, Smith BH. Chronic pain epidemiology and its clinical
relevance. Br J Anaesth. 2013;111(1):13-8.
47. Landro NI, Fors EA, Vapenstad LL, Holthe O, Stiles TC, Borchgrevink PC. The
extent of neurocognitive dysfunction in a multidisciplinary pain centre population. Is there a
relation between reported and tested neuropsychological functioning? Pain.
2013;154(7):972-7.
48. Rastogi R, Meek BD. Management of chronic pain in elderly, frail patients: finding a
suitable, personalized method of control. Clin Interv Aging. 2013;8:37-46.

85
3.4. Frailty as a predictor of short-term adverse outcomes
Autores: Tiago Coelho, Constança Paúl, Robbert J. J. Gobbens, Lia Fernandes
Journal of Nutrition, Health and Aging (em processo de revisão)
Fator de Impacto (2013): 2.659
Indexação: Academic OneFile; AgeLine; CAB Abstracts; CAB International; Chemical
Abstracts Service (CAS); CSA Environmental Sciences; Current Contents/Clinical
Medicine; EBSCO; Elsevier Biobase; EMBASE; EMCare; Food Science and Technology
Abstracts; Global Health; Google Scholar; Journal Citation Reports/Science Edition; OCLC;
PASCAL; PubMed/Medline; Science Citation Index Expanded (SciSearch); SCImago;
SCOPUS; Summon by ProQuest

86
Abstract
Objectives: To compare how different frailty measures (Frailty Phenotype/FP, Groningen
Frailty Indicator/GFI and Tilburg Frailty Indicator/TFI) predict short-term adverse outcomes.
Secondarily, adopting a multidimensional approach to frailty (integral conceptual model –
TFI), this study aims to compare how physical, psychological and social frailty predict the
outcomes. Design: Longitudinal study. Setting: Community. Participants: 95 elderly
individuals (≥65 years). Measurements: Participants were assessed at baseline for frailty,
determinants of frailty, and adverse outcomes (healthcare utilization, quality of life, disability
in basic and instrumental activities of daily living/ADL and IADL). Ten months later the
outcomes were assessed again. Results: The participants’ mean age was 78.5±6.2 years,
and most were women (67.4%). Frailty was associated with specific healthcare utilization
indicators: the FP with a greater utilization of informal care; GFI with an increased contact
with healthcare professionals; and TFI with a higher amount of contacts with a general
practitioner. After controlling for the effect of life-course determinants, comorbidity and
adverse outcome at baseline, GFI predicted IADL disability and TFI predicted quality of life.
The effect of the FP on the outcomes was not significant, when compared with the other
measures. However, when comparing TFI’s domains, the physical domain was the most
significant predictor of the outcomes, even explaining part of the variance of ADL disability.
Conclusions: Frailty at baseline was associated with adverse outcomes at follow-up.
However, the relationship of each frailty measure (FP, GFI and TFI) with the outcomes was
different. In spite of the role of psychological frailty, TFI’s physical domain was the
determinant factor for predicting disability and most of the quality of life.
Key words: Frailty; Adverse outcomes; Frailty Phenotype; Groningen Frailty Indicator;
Tilburg Frailty Indicator.

87
Introduction
As the number of elderly people increases worldwide, so does the prevalence of
frailty.1, 2 This geriatric syndrome, particularly common in individuals older than 80 years,
entails an increased risk of clinically significant adverse outcomes.3-5 Frail individuals are
highly vulnerable, and minor stressful events can cause disability, institutionalization,
hospitalization or even death.2-4, 6 Therefore, screening for frailty in the contexts of primary
and community healthcare is fundamental to ensure the dignity and quality of life of older
persons.2, 3
There are different approaches regarding the conceptualization and
operationalization of frailty.3, 6-8 The assessment based on the presence of the components
that make up the Frailty Phenotype/FP9 (unintentional weight loss, low physical activity,
exhaustion, slow walking speed and weakness) has gained wide attention in the scientific
community.8, 10-12 This approach stems from a biological model, in which frailty is defined as
an exclusively physical condition, caused by energy dysregulation and functional decline
across multiple physiological systems.9, 13
On the other hand, some authors argue that psychosocial factors can also increment
vulnerability and lead to frailty.4, 10, 14, 15 Furthermore, a biopsychosocial approach of a
clinical syndrome such as frailty is more in line with the definition of health as physical,
psychological and social well-being.6, 14, 16 Consequently, multidimensional measures, such
as the Groningen Frailty Indicator/GFI17, 18 and the Tilburg Frailty Indicator/TFI,19 have been
developed as alternatives to the traditional physical operationalization. However, GFI and
TFI present different pictures of frailty. In fact, while GFI includes functional
performance/disability as components of the syndrome, in the integral conceptual model16,
20-22 (on which TFI is based) disability is regarded as a potential outcome of frailty. The clear
distinction between frailty and disability is in consonance with a growing consensus in
regard to frailty conceptualization.10, 23, 24
Considering that there are different frailty measures, and that the prevention of frailty
and its’ adverse effects is of the utmost importance from a social and public health
perspective, research should focus on ascertaining which measures are most effective in
detecting the syndrome and predicting outcomes in different populations.2, 6, 25, 26 Therefore,
the present study aims to compare how three well-known3 tools (the FP, GFI and TFI)
predict short-term adverse outcomes in a sample of community-dwelling elderly, particularly
by analyzing whether the measures are associated with greater healthcare utilization and
disability, and lower quality of life, in a 10-month follow-up. Additionally, assuming a
multidimensional approach to frailty inherent to Gobbens et al.21 integral conceptual model,

88
the secondary objective of this study is to examine which TFI’s domain (physical,
psychological or social) is the most significant predictor of disability and quality of life. This
model was chosen to assess frailty domains because it results from a recent and an
exhaustive research16, 21, 22. Furthermore, studies have shown that TFI has a good predictive
validity,20, 27, 28 and better psychometric properties than other multidimensional frailty
questionnaires.25, 29
Methods
Sample
From May to September 2013, a non-probabilistic sample of 252 community-dwelling
elderly individuals (aged 65 years and over) was recruited from three northern Portuguese
cities (Maia, Porto, V.N. Gaia). Exclusion criteria were severe cognitive impairment
(screened with Mini Mental State Examination30) and inability to speak Portuguese, due to
the self-report nature of most measures. The participants, users of local community
institutions (e.g. social, recreation and day care centers), were interviewed by nine trained
researchers. Among other measurements, the individuals were assessed for life-course
determinants of frailty, comorbidity, frailty and adverse outcomes (disability, quality of life
and healthcare utilization). In 2014, 10 months later, the first 118 participants (47%), who
lived in V.N. Gaia, were selected for a follow-up assessment, regarding the same adverse
outcomes. From this group, only 95 individuals (38%) were included in the present study.
After the first assessment, two participants died, five were admitted to a nursing home, two
were hospitalized, one was ineligible due to severe cognitive impairment (severe dementia),
nine could not be contacted, and four refused to participate. The follow-up interviews were
conducted by three of the researchers that performed the first assessment. The study was
approved by institutional review boards and written informed consent was obtained.
Measures
Part A of TFI19, 31 was used to assess life-course determinants of frailty and
comorbidity, while the FP,9 GFI17, 18, 32 and part B of TFI19, 31 were used to measure frailty.
Disability in activities of daily living/ADL and in instrumental activities of daily living/IADL
were measured with the Barthel Index33, 34 and with the Lawton and Brody Scale,35, 36
respectively. Finally, quality of life was evaluated with EUROHIS-QOL-837, 38 and WHOQOL-
OLD,39, 40 whereas healthcare utilization was assessed with a set of questions previously
used in other studies.19, 20, 27, 28, 31

89
TFI consists of a self-report questionnaire divided into two parts. Part A (10 items)
assesses determinants of frailty: sociodemographic characteristics (age, gender, marital
status, ethnicity/nationality, education, income); life events in the last year (death of a loved
one, serious illness, serious illness in a loved one, divorce or end of an important
relationship, traffic accident, crime); assessment of how healthy the respondent’s lifestyle
is; satisfaction with home living environment; and presence of two or more chronic diseases.
Part B (15 items) measures physical frailty (physical health, unexplained weight loss,
difficulty in walking, difficulty in maintaining balance, hearing problems, vision problems,
lack of strength in hands, and physical tiredness), psychological frailty (cognition/memory,
depression and anxiety symptoms, and coping), and social frailty (living alone, social
relations and support). All items are rated dichotomously (0-1), and scores for each frailty
domain and a total frailty score are produced. Higher scores refer to higher frailty, and the
Portuguese version31 has a cut-off of 6.
GFi is also a questionnaire that aims to measure frailty in different domains: physical
(difficulties in shopping, walking around outside, dressing and undressing, and going to the
toilet, vision problems, and consumption of four or more medicines), cognition (complaints
about memory), psychological (depressed mood and feelings of anxiety), and social (three
items about emotional isolation). The Portuguese version32 has only 12 items, excluding
three items from the original (physical fitness, hearing problems and weight loss). As for
TFI, all items are rated dichotomously and scores refer to higher frailty. A cut-off point of 5
was considered.32
In regard to the assessment of the FP, unintentional weight loss was considered if the
participant answered “yes” to TFI’s question 12 “Have you lost a lot of weight recently
without wishing to do so?”. Low physical activity and exhaustion were detected using two
questions based on previous studies.41 Slow walking speed was detected if the participant
took more than 20 seconds to complete the Timed Up and Go/TUG test.42 Weakness was
identified if the participant’s hand strength was below the cut-off determined by Fried et al.9
stratified by gender and BMI. In this regard, a GRIP-D Takei Hand Grip Dynamometer was
used and a standardized approach for assessing hand strength was considered.43 Frailty
was identified if the participant had ≥3 components, and pre-frailty if one or two components
were present.
The Barthel Index (10 items) and the Lawton and Brody Scale (8 items) are measures
widely used to assess ADL and IADL disability, respectively, and, in both cases, lower
scores refer to higher dependence. Regarding quality of life, the EUROHIS-QOL-8 is an 8-
item generic assessment instrument and the WHOQOL-OLD is a more extensive tool, of
which the Portuguese version39 has 28 items distributed by 7 facets: sensory abilities;
autonomy; past, present and future activities; social participation; death and dying; intimacy;

90
family/family life. In both measures, higher scores indicate better quality of life. Finally,
healthcare utilization was assessed in regard to the last year and with items regarding:
contact with a general practitioner and with other healthcare professionals, hospitalization
and different care support (professional personal, nursing, informal and in other healthcare
or residential institutions). All answers were dichotomous (yes/no), except for contact with
a general practitioner (0, 1-2, 3-4, 5-6 or ≥7 contacts). This item was later dichotomized for
statistical analysis, and only ≥5 contacts were considered.
Statistical Analysis
Data is described using proportions, mean values and standard deviations, according
to the nature of the variables. Independent samples t-test, chi-square test and Fisher’s exact
test were used to compare the baseline characteristics (determinants of frailty, frailty,
disability, quality of life, and healthcare utilization) of participants interviewed in the follow-
up with those not reassessed. The comparison of the adverse outcomes at baseline and 10
months later was performed using paired samples t-test and McNemar test. The association
between healthcare utilization reported at follow-up with frailty at baseline was examined
with chi-square test or Fisher’s exact test. Hierarchical regressions were conducted to
analyze whether frailty at baseline predicted quality of life and disability in ADL and IADL at
the 10-month reassessment, while controlling for the effect of life-course determinants,
comorbidity and the same adverse outcome at baseline. Life-course determinants and
comorbidity were included in the first step of the regression, and the same adverse outcome
at baseline in the second. For these steps, the “enter” method was used. Variables that
revealed low frequencies (<5%) were not included, neither was the life event serious illness
because it overlaps comorbidity.27, 44 Dummy variables were created for gender, marital
status and life events. Lifestyle was classified as healthy (1), not healthy, not unhealthy (2)
and unhealthy (3). The baseline scores of each frailty measure were included in the third
step (step 3a). The “stepwise” method was used in order to ascertain which frailty measure
improved prediction of the outcomes. The same procedure was used to examine which
frailty domain improved the prediction of adverse outcomes at follow-up. In this case, while
the first two steps were similar to the previous analysis, the third step (step 3b) consisted of
including the scores obtained by TFI regarding physical, psychological and social frailty.
Two-tailed tests were used throughout all analysis and a p-value<0.05 was considered
statistically significant. All statistical analysis were conducted using IBM SPSS Statistics
22.0 (SPSS, Inc., Chicago, IL, USA).
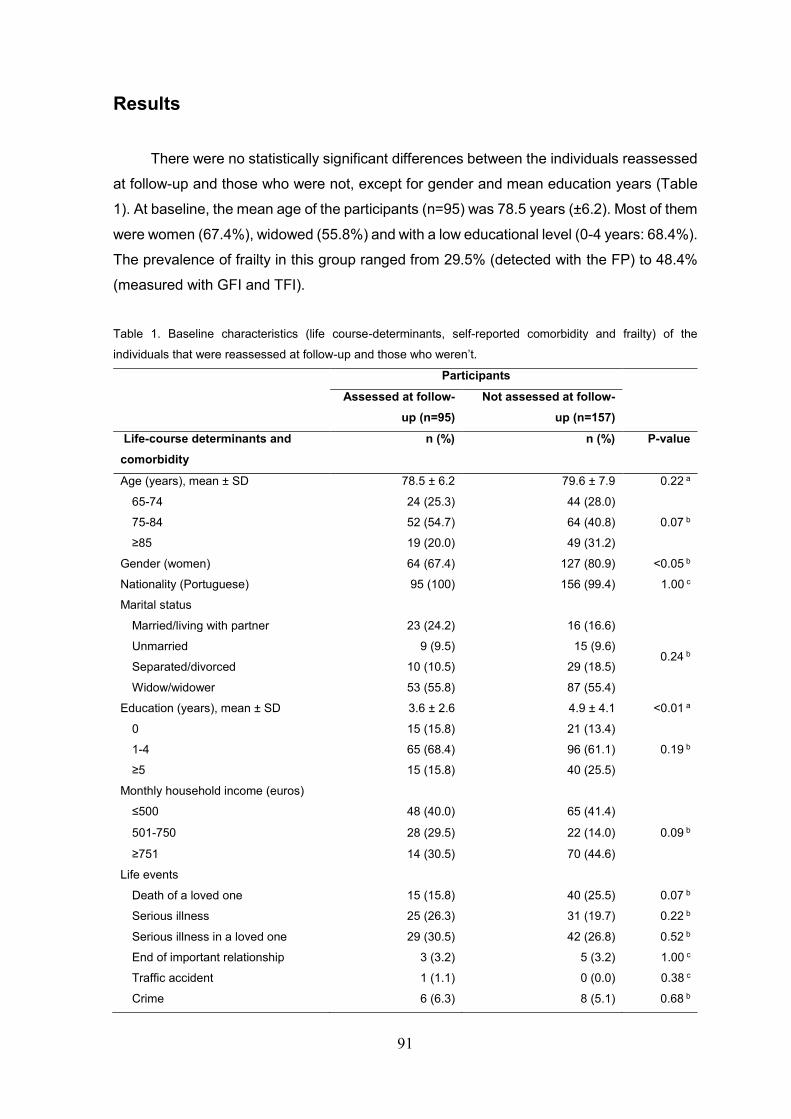
91
Results
There were no statistically significant differences between the individuals reassessed
at follow-up and those who were not, except for gender and mean education years (Table
1). At baseline, the mean age of the participants (n=95) was 78.5 years (±6.2). Most of them
were women (67.4%), widowed (55.8%) and with a low educational level (0-4 years: 68.4%).
The prevalence of frailty in this group ranged from 29.5% (detected with the FP) to 48.4%
(measured with GFI and TFI).
Table 1. Baseline characteristics (life course-determinants, self-reported comorbidity and frailty) of the
individuals that were reassessed at follow-up and those who weren’t.
Participants
Assessed at follow-
up (n=95)
Not assessed at follow-
up (n=157)
Life-course determinants and
comorbidity
n (%) n (%) P-value
Age (years), mean ± SD 78.5 ± 6.2 79.6 ± 7.9 0.22 a
65-74 24 (25.3) 44 (28.0)
75-84 52 (54.7) 64 (40.8) 0.07 b
≥85 19 (20.0) 49 (31.2)
Gender (women) 64 (67.4) 127 (80.9) <0.05 b
Nationality (Portuguese) 95 (100) 156 (99.4) 1.00 c
Marital status
Married/living with partner 23 (24.2) 16 (16.6)
0.24 b Unmarried 9 (9.5) 15 (9.6)
Separated/divorced 10 (10.5) 29 (18.5)
Widow/widower 53 (55.8) 87 (55.4)
Education (years), mean ± SD 3.6 ± 2.6 4.9 ± 4.1 <0.01 a
0 15 (15.8) 21 (13.4)
1-4 65 (68.4) 96 (61.1) 0.19 b
≥5 15 (15.8) 40 (25.5)
Monthly household income (euros)
≤500 48 (40.0) 65 (41.4)
0.09 b 501-750 28 (29.5) 22 (14.0)
≥751 14 (30.5) 70 (44.6)
Life events
Death of a loved one 15 (15.8) 40 (25.5) 0.07 b
Serious illness 25 (26.3) 31 (19.7) 0.22 b
Serious illness in a loved one 29 (30.5) 42 (26.8) 0.52 b
End of important relationship 3 (3.2) 5 (3.2) 1.00 c
Traffic accident 1 (1.1) 0 (0.0) 0.38 c
Crime 6 (6.3) 8 (5.1) 0.68 b

92
Lifestyle self-assessment
Healthy 59 (62.1) 78 (49.7)
0.13 b Not healthy, not unhealthy 30 (31.6) 62 (39.5)
Unhealthy 6 (6.3) 17 (10.8)
Satisfaction with living environment 78 (82.1) 121 (77.1) 0.34 b
Self-reported comorbidity 49 (51.6) 85 (54.1) 0.69 b
Frailty
TFI total score (0-15), mean ± SD 5.6 ± 3.5 6.2 ± 3.4 0.18 a
≥6 (Frailty) 46 (48.4) 92 (58.6) 0.12 b
TFI physical domain score (0-8), mean
± SD
2.7 ± 2.2 3.0 ± 2.2 0.19 a
TFI psychological domain score (0-4),
mean ± SD
1.6 ± 1.1 1.8 ± 1.1 0.14 a
TFI social domain score (0-3), mean ±
SD
1.4 ± 1.1 1.4 ± 1.0 0.90 a
GFI (0-12), mean ± SD 4.4 ± 2.4 4.7 ± 2.8 0.31 a
≥5 (Frailty) 46 (48.4) 86 (54.8) 0.33 b
FP, mean ± SD 1.8 ± 1.3 2.1 ± 1.4 0.09 a
0 (Non-frailty/robustness) 15 (15.8) 24 (15.3)
1-2 (Pre-frailty) 52 (54.7) 69 (43.9) 0.17 b
≥3 (Frailty) 28 (29.5) 64 (40.8)
a Independent samples t-test; b Chi-square test; c Fisher’s exact test.
Regarding the comparison of the outcomes at baseline and at follow-up, only IADL
disability, the autonomy facet of quality of life and three indicators of healthcare utilization
(contact with healthcare professionals, hospitalization and nursing care) showed significant
differences (Table 2).
Table 2. Adverse outcomes at baseline and 10 months after
Outcome Baseline Follow-up Δ (difference)
P-valuea
M SD M SD M SD
Quality of life
EUROHIS-QOL-8 27.7 4.8 27.4 4.7 -0.4 4.1 0.40
WHOQOL-OLD 99.2 16.1 99.2 15.3 0.0 9.4 1.00
Sensory Abilities 15.6 4.0 16.1 3.6 0.5 3.3 0.12
Autonomy 14.1 3.2 14.9 3.0 0.8 2.9 <0.05
Past, Present and Future Activities 13.5 3.9 13.2 2.7 -0.2 2.7 0.42
Social Participation 15.0 2.9 14.8 2.8 -0.3 2.5 0.27
Death and Dying 12.6 4.5 13.1 4.1 0.4 3.9 0.31
Intimacy 13.4 4.0 12.6 4.1 -0.8 4.2 0.08
Family/Family life 15.0 4.0 14.5 3.5 -0.4 2.6 0.10
ADL disability
Barthel Index 19.2 1.3 19.0 1.4 -0.2 1.4 0.23

93
IADL disability
Lawton and Brody Scale 18.0 5.2 15.1 6.4 -2.9 3.7 <0.001
n % n % % P-valueb
Healthcare utilization
Contact with general practitioner (≥5) 17 17.9 11 11.6 -6.3 0.21
Contact with healthcare professionals 69 72.6 55 57.9 -14.7 <0.05
Hospitalization 24 25.3 11 11.6 -13.6 <0.01
Professional personal care 9 9.5 6 6.3 -3.2 0.55
Nursing care 29 30.5 10 10.5 -20.0 <0.001
Informal care 19 20.0 19 20.0 0.0 1.00
Other healthcare/residential institutions 10 10.5 4 4.2 -6.3 0.11
a Paired samples t-test; b McNemar test.
There was a significant relationship between being classified as frail at baseline and
indicators of healthcare utilization at follow-up (Table 3). Each measure of frailty was
associated with one specific indicator: the FP with a greater utilization of informal care; GFI
with increased contact with healthcare professionals; and TFI with a greater contact with a
general practitioner.
Table 3. Frailty and healthcare utilization.
Healthcare utilization
FP
P-
value
GFI
P-
value*
TFI
P-
value
Non-
frail Frail
Non-
frail Frail
Non-
frail Frail
n
(%)
n
(%)
n
(%)
n
(%)
n
(%)
n
(%)
Contact with
general
practitioner (≥5)
Yes 8
(72.7)
3
(27.3) 1.00b
4
(36.4)
7
(63.6) 0.28a
2
(18.2)
9
(81.8) <0.05a
No 59
(70.2)
25
(29.8)
45
(53.6)
39
(46.4)
47
(56.0)
37
(44.0)
Contact with
healthcare
professionals
Yes 39
(70.9)
16
(29.1) 0.92a
22
(40.0)
33
(60.0) <0.01a
24
(43.6)
31
(56.4) 0.07a
No 28
(70.0)
12
(30.0)
27
(67.5)
13
(32.5)
25
(62.5)
15
(37.5)
Hospitalization
Yes 6
(54.5)
5
(45.5) 0.29b
3
(27.3)
8
(72.7) 0.08a
3
(27.3)
8
(72.7) 0.09a
No 61
(72.6)
23
(27.4)
46
(54.8)
38
(45.2)
46
(54.8)
38
(45.2)
Professional
personal care
Yes 3
(50.0)
3
(50.0) 0.36b
2
(33.3)
4
(66.7) 0.43b
2
(33.3)
4
(66.7) 0.36b
No 64
(71.9)
25
(28.1)
47
(52.8)
42
(47.2)
47
(52.8)
42
(47.2)
Nursing care
Yes 6
(60.0)
4
(40.0) 0.47b
6
(60.0)
4
(40.0) 0.74b
4
(40.0)
6
(60.0) 0.52b
No 61
(71.8)
24
(28.2)
43
(50.6)
42
(49.4)
45
(52.9)
40
(47.1)
Informal care
Yes 7
(36.8)
12
(63.2) <0.001a
7
(36.8)
12
(63.2) 0.15a
7
(36.8)
12
(63.2) 0.15a
No 60
(78.9)
16
(21.1)
42
(55.3)
34
(44.7)
42
(55.3)
34
(44.7)

94
Other
healthcare/
residential
institutions
Yes 2
(50.0)
2
(50.0) 0.58b
2
(50.0)
2
(50.0) 1.00b
1
(25.0)
3
(75.0) 0.35b
No 65
(71.4)
26
(28.6)
47
(51.6)
44
(48.4)
48
(52.7)
43
(47.3) a Chi-square test; b Fisher’s exact test.
Regarding the regression analysis (Table 4) ethnicity/nationality was not included
because all participants were Portuguese. Life events: divorce or end of an important
relationship and traffic accidents, were also excluded because of their low frequency.
Frailty measures explained from 29.3% to 73.4% of the variances of the disability and
quality of life scores. After controlling for the effect of life-course determinants, comorbidity
and the same adverse outcome at baseline, the TFI was most often selected as the
measure that better predicted the outcomes. After the TFI was inserted in the regression
models, an additional 4.4% of quality of life variance (measured by EUROHIS-QOL-8) and
2.4% (measured by WHOQOL-OLD), was explained. The TFI also predicted three quality
of life (WHOQO-OLD) facets: sensory abilities (3.3%), intimacy (4.4%) and family/family life
(4.4%). On the other hand, GFI was the measure that most significantly increased the
prediction of IADL disability (1.4%) and two quality of life facets: past, present and future
activities (8.6%) and social participation (7.2%). The effect of the FP on the outcomes was
not significant, when compared to the other measures. Concomitantly, neither of the frailty
measures predicted ADL disability and quality of life facets: autonomy, and death and dying.
In summary, an increment in frailty was associated with a decrease in quality of life and an
increase in disability.
When comparing TFI’s frailty domains, physical frailty contributed to the prediction of
most of the adverse outcomes: ADL disability (3.3%), IADL disability (2.2%), global quality
of life (EUROHIS-QOL-8: 4.7%; WHOQOL-OLD: 2.9%) and quality of life facets: sensory
abilities (4.5%), social participation (5.6%), death and dying (3.0%) and family/family life
(2.8%). On the other hand, TFI’s psychological domain predicted past, present and future
activities (7.2%) and intimacy (4.0%), whereas the effect of social frailty was not significant.

95
Table 4. Prediction of outcomes (disability and quality of life) in a 10-month follow-up by life-course determinants and comorbidity (step 1), by the same outcome at baseline (step 2), by the Frailty
Phenotype/FP, Groningen Frailty Indicator/GFI and the Tilburg Frailty Indicator/TFI (step 3a), and by physical, psychological and social frailty measured by TFI (step 3b).
Predictors Barthel
Index
Lawton
and Brody
Scale
EUROHIS-
QOL-8
WHOQOL-OLD
Total Sensory
Abilities Autonomy
Past, Present
and Future
Activities
Social
Participation
Death
and
Dying
Intimacy Family/Family
life
Step 1 (enter)
Age (years) -0.06* -0.26* 0.12 0.17 -0.05 0.00 0.08 0.04 -0.12 0.07 0.16*
Gender (women/men) -0.41 -0.67 0.68 0.49 0.25 -0.11 0.45 0.22 -0.56 -0.68 0.92
Education (years) -0.05 0.05 0.25 0.15 0.16 0.16 -0.02 -0.12 -0.09 -0.05 0.10
Marital status
(married/unmarried) a -0.21 -2.65 -0.01 1.64 0.08 -1.01 0.09 0.03 -1.11 2.85* 0.76
Household income 0.12 -0.53 -0.33 0.29 0.27 0.06 0.16 0.05 0.04 -0.19 -0.09
Life events (yes/no) b -0.13 0.00 -0.84 -1.34 -0.20 -0.68 -0.38 -0.34 -0.54 -0.09 0.89
Lifestyle self-
assessment -0.08 -1.01 -2.15** -9.24*** -0.88 -1.99*** -1.01* -1.21* -1.79* -0.74 -1.64**
Satisfaction living
environment (yes/no) -0.33 -2.35 1.52 8.80* 1.36 0.27 1.60* 1.01 1.00 2.47* 1.04
Self-reported
comorbidity (yes/no) -0.18 1.45 -2.33* -0.03 -0.13 0.60 0.06 0.19 -1.35 0.51 0.08
ΔR2 (%) 9.8 17.0 24.9** 22.0** 8.5 17.3 18.7* 13.7 15.7 18.2* 21.5*
Step 2 (enter)
Outcome at baseline 0.51*** 1.00*** 0.53*** 0.82*** 0.58*** 0.51*** 0.43*** 0.62*** 0.49*** 0.41*** 0.70***
ΔR2 19.5*** 55.0*** 21.4*** 47.2*** 33.9*** 22.8*** 17.1*** 28.6*** 22.7*** 12.5*** 41.1***
Step 3a (stepwise)
FP - - - - - - - - - - -
GFI - -0.39* - - - - -0.39*** -0.39*** - - -
TFI - - -0.42** -1.09** -0.29* - - - - -0.32* -0.27**
ΔR2 (%) - 1.4* 4.4** 2.4** 3.3* - 8.6*** 7.2*** - 4.4* 4.4**
R2 (%) total 29.3*** 73.4*** 50.7*** 71.5*** 45.7*** 40.1*** 44.4*** 49.5*** 38.4*** 35.2*** 66.9***
Step 3b (stepwise)
Physical frailty -0.15* -0.55** -0.60** -1.65** -0.49 - - -0.38** -0.39* - -0.32*
Psychological frailty - - - - - - -0.79** - - -0.87* -
Social frailty - - - - - - - - - - -
ΔR2 (%) 3.3* 2.2** 4.7** 2.9** 4.5** - 7.2** 5.6** 3.0* 4.0* 2.8*
R2 (%) total 32.6*** 74.2*** 51.0*** 72.1*** 46.9*** 40.1*** 42.9*** 47.8*** 41.4*** 34.8*** 65.4*** a Marital status (“1” for married/living with partner and “0” for unmarried, separated/divorced and widow/widower); b Life events (“1” for death and/or serious illness in a loved one, and “0” for absence
of these life events).
Regression coefficients (b) are displayed. * p<0.05. ** p<0.01. ***p<0.001.

96
Discussion
In general, frailty at baseline was associated with the adverse outcomes at follow-up.
The TFI predicted global quality of life, the GFI predicted disability, while the FP was not
relevant after controlling for comorbidity and the remaining frailty measures. On the other
hand, when comparing TFI’s frailty domains, physical frailty was the most significant
predictor of the outcomes, even explaining part of the variance of ADL disability.
As described by Rockwood45, a successful operationalization of frailty, among other
factors, implies that it is easy to use in a busy clinical setting, and allows the prediction of
adverse outcomes. From this standpoint, the assessment of the FP is immediately at
disadvantage, as it seems less practical than administering GFI or TFI, due to requiring the
measurement of grip strength and gait speed.7, 11 Furthermore, in the present study, despite
being associated with increased utilization of informal care, the FP’s contribution to the
prediction of disability and quality of life was inferior when compared with the other
measures. This does not mean that the FP would not be able to predict outcomes in different
time periods (i.e. medium and-long term), or other adverse outcomes. In fact, several
studies9, 46-49 have shown that it predicts outcomes such as falls, disability, hospitalization
and mortality, in different time frames. The present study shows that multidimensional
measures of frailty assessment were better predictors of the selected outcomes in a 10-
month follow-up than an exclusively physical one. This may be related not only to the
components of the GFI and the TFI, but also to the amplitude of their scores, since
measures with continuous scores seem to discriminate better between frail and non-frail
individuals.2, 11, 50
Indeed, besides being associated with increased contact with healthcare
professionals, the GFI explained the variance of IADL disability. However, the fact that its
contribution to the prediction of disability is greater than the other measures (which is
consistent with another study51) may simply be justified by the inclusion of four disability
related questions in the GFI itself. Nevertheless, there is some evidence7 that by including
the assessment of comorbidity there is a relevant increase in the prediction of disability.
Moreover the GFI comprises a question about the consumption of four or more medicines,
which is directly related to the presence of multiple diseases. On the other hand, the TFI
was associated with a greater contact with a general practitioner and independently
predicted global quality of life, which is consistent with previous studies.20, 27, 28, 52, 53 The
prediction of an intricate concept such as quality of life emphasizes the relevance of a
holistic definition of frailty and of the TFI’s components.52, 53

97
In regard to the comparison of TFI’s frailty domains, similarly to prior research,20, 27, 28,
52, 53 the physical domain provided the most important contribution for the explanation of the
variance of the adverse outcomes. Nevertheless, while it has been previously observed20,
28, 52, 53 that the TFI’s psychological and social domains also predicted disability and quality
of life, in the present study, only the contribution of psychological frailty was significant, as
it was independently associated with two quality of life facets. These results highlight the
relevance of physical factors, but also the importance of including at least psychological
components in the definition of frailty.
On the other hand, it should be emphasized that the TFI’s physical domain explained
ADL disability and the death and dying facet of quality of life, whereas other global frailty
measures were unable to do so. First, this may suggest that the components of the TFI’s
physical domain circumscribed physical frailty more precisely than the FP’s components
(i.e. the components of the FP might have been insufficient to predict the outcomes).
Second, it may indicate that the TFI’s psychological and/or social domains include items
that were detrimental to the prediction of these specific outcomes. Nonetheless, the fact
that, in some cases, the contribution of the TFI’s psychological domain was more important
than the physical one, and that in previous studies20, 28, 52, 53 the social domain explained
some of the outcomes’ variance, justify TFI’s multidimensional structure.
The main strengths of the present study are related to its longitudinal design and to
the fact that the prediction of disability and quality of life was examined after controlling for
the effect of life-course determinants, comorbidity and the same adverse outcome at
baseline. Nonetheless, some limitations should be noted. First, the non-probabilistic
sampling method could limit the generalization of results. Second, the relatively small
sample size limited the analysis of the prediction of dichotomous variables such as the
healthcare utilization indicators, after adjusting for baseline characteristics, as it was done
for scale scores (disability and quality of life). Third, outcomes were only assessed through
self-report, which in part might explain why they were mainly associated with the exclusively
self-report measures (to the detriment of the FP, which included objective measurements).
Finally, the selected operationalization of the FP was different from other studies7, 9, 41, which
limits the comparability of the results. Furthermore, the hand strength cut-off points used
were based on the original study regarding the FP.
Several directions for future research can be suggested. Studies should focus on
examining the prediction of outcomes in different time frames (medium and long-term).
Other outcomes such as falls, institutionalization and mortality should also be analyzed.
Likewise, the association between physical, psychological and social frailty components
and different adverse outcomes should be better examined in order to improve the
understanding of the multidimensional nature of frailty.

98
Acknowledgements
The authors thank all the elderly participants and professionals who assisted and made the
data collection possible. They particularly thank occupational therapy students (Alice
Rocha, Joana Oliveira, Libânia Silva, Nicole Câmara, Rute Ferreira, Sara Santos, Stefanie
Morais and Sylvie Abreu) for collecting partial data. The authors also thank Carolina Silva
for her assistance with the statistical analysis.
Disclosure statement
No potential conflicts of interest were disclosed.
References
1. Collard RM, Boter H, Schoevers RA, Oude Voshaar RC. Prevalence of frailty in
community-dwelling older persons: a systematic review. J Am Geriatr Soc.
2012;60(8):1487-92.
2. Clegg A, Young J, Iliffe S, Rikkert MO, Rockwood K. Frailty in elderly people. Lancet.
2013;381(9868):752-62.
3. Morley JE, Vellas B, van Kan GA, Anker SD, Bauer JM, Bernabei R, et al. Frailty
consensus: a call to action. J Am Med Dir Assoc. 2013;14(6):392-7.
4. Abellan van Kan G, Rolland Y, Bergman H, Morley JE, Kritchevsky SB, Vellas B.
The I.A.N.A Task Force on frailty assessment of older people in clinical practice. J Nutr
Health Aging. 2008;12(1):29-37.
5. Rockwood K, Mitnitski A. Frailty in relation to the accumulation of deficits. J Gerontol
A Biol Sci Med Sci. 2007;62(7):722-7.
6. Bergman H, Ferrucci L, Guralnik J, Hogan DB, Hummel S, Karunananthan S, et al.
Frailty: an emerging research and clinical paradigm--issues and controversies. J Gerontol
A Biol Sci Med Sci. 2007;62(7):731-7.
7. Malmstrom TK, Miller DK, Morley JE. A comparison of four frailty models. J Am
Geriatr Soc. 2014;62(4):721-6.
8. Rodriguez-Manas L, Feart C, Mann G, Vina J, Chatterji S, Chodzko-Zajko W, et al.
Searching for an operational definition of frailty: a Delphi method based consensus

99
statement: the frailty operative definition-consensus conference project. J Gerontol A Biol
Sci Med Sci. 2013;68(1):62-7.
9. Fried LP, Tangen CM, Walston J, Newman AB, Hirsch C, Gottdiener J, et al. Frailty
in older adults: evidence for a phenotype. J Gerontol A Biol Sci Med Sci. 2001;56(3):M146-
56.
10. Sternberg SA, Wershof Schwartz A, Karunananthan S, Bergman H, Mark Clarfield
A. The identification of frailty: a systematic literature review. J Am Geriatr Soc.
2011;59(11):2129-38.
11. Cesari M, Gambassi G, van Kan GA, Vellas B. The frailty phenotype and the frailty
index: different instruments for different purposes. Age Ageing. 2014;43(1):10-2.
12. Bouillon K, Kivimaki M, Hamer M, Sabia S, Fransson EI, Singh-Manoux A, et al.
Measures of frailty in population-based studies: an overview. BMC Geriatr. 2013;13:64.
13. Fried LP, Walston J, Ferrucci L. Frailty. In: Halter JB, Ouslander JG, Tinetti ME,
Studenski S, High KP, Asthana S, editors. Hazzard’s geriatric medicine and gerontology. 6ª
ed. New York: McGraw-Hill; 2009. p. 631-46.
14. Markle-Reid M, Browne G. Conceptualizations of frailty in relation to older adults.
Journal of Advanced Nursing. 2003;44(1):58-68.
15. Levers MJ, Estabrooks CA, Ross Kerr JC. Factors contributing to frailty: literature
review. J Adv Nurs. 2006;56(3):282-91.
16. Gobbens RJ, Luijkx KG, Wijnen-Sponselee MT, Schols JM. In search of an integral
conceptual definition of frailty: opinions of experts. J Am Med Dir Assoc. 2010;11(5):338-
43.
17. Steverink N, Slaets J, Schuurmans H, Van Lis M. Measuring frailty: developing and
testing the GFI (Groningen Frailty Indicator). Gerontologist. 2001;41(Special Issue 1):236-
7.
18. Schuurmans H, Steverink N, Lindenberg S, Frieswijk N, Slaets JP. Old or frail: what
tells us more? J Gerontol A Biol Sci Med Sci. 2004;59(9):M962-5.
19. Gobbens RJ, van Assen MA, Luijkx KG, Wijnen-Sponselee MT, Schols JM. The
Tilburg Frailty Indicator: psychometric properties. J Am Med Dir Assoc. 2010;11(5):344-55.
20. Gobbens RJ, van Assen MA, Luijkx KG, Schols JM. Testing an integral conceptual
model of frailty. J Adv Nurs. 2012;68(9):2047-60.
21. Gobbens RJ, Luijkx KG, Wijnen-Sponselee MT, Schols JM. Towards an integral
conceptual model of frailty. J Nutr Health Aging. 2010;14(3):175-81.
22. Gobbens RJ, Luijkx KG, Wijnen-Sponselee MT, Schols JM. Toward a conceptual
definition of frail community dwelling older people. Nurs Outlook. 2010;58(2):76-86.
23. Hogan DB, MacKnight C, Bergman H. Models, definitions, and criteria of frailty.
Aging Clin Exp Res. 2003;15(3 Suppl):1-29.

100
24. Walston J, Hadley EC, Ferrucci L, Guralnik JM, Newman AB, Studenski SA, et al.
Research agenda for frailty in older adults: toward a better understanding of physiology and
etiology: summary from the American Geriatrics Society/National Institute on Aging
Research Conference on Frailty in Older Adults. J Am Geriatr Soc. 2006;54(6):991-1001.
25. Pialoux T, Goyard J, Lesourd B. Screening tools for frailty in primary health care: a
systematic review. Geriatr Gerontol Int. 2012;12(2):189-97.
26. Vermeulen J, Neyens JC, van Rossum E, Spreeuwenberg MD, de Witte LP.
Predicting ADL disability in community-dwelling elderly people using physical frailty
indicators: a systematic review. BMC Geriatr. 2011;11:33.
27. Gobbens RJ, van Assen MA, Luijkx KG, Schols JM. The Predictive Validity of the
Tilburg Frailty Indicator: Disability, Health Care Utilization, and Quality of Life in a Population
at Risk. Gerontologist. 2012;52(5):619-31.
28. Gobbens RJ, van Assen MA. Frailty and its prediction of disability and health care
utilization: The added value of interviews and physical measures following a self-report
questionnaire. Arch Gerontol Geriatr. 2012;55(2):369-79.
29. Metzelthin SF, Daniels R, van Rossum E, de Witte L, van den Heuvel WJ, Kempen
GI. The psychometric properties of three self-report screening instruments for identifying
frail older people in the community. BMC Public Health. 2010;10:176.
30. Folstein MF, Folstein SE, McHugh PR. "Mini-mental state". A practical method for
grading the cognitive state of patients for the clinician. J Psychiatr Res. 1975;12(3):189-98.
31. Coelho T, Santos R, Paúl C, Gobbens RJJ, Fernandes L. Portuguese version of the
Tilburg Frailty Indicator: Transcultural adaptation and psychometric validation. Geriatrics &
gerontology international. 2014:n/a-n/a.
32. Duarte M. Fragilidade nas pessoas idosas [Frailty in elderly people]. Porto: Institute
of Biomedical Sciences Abel Salazar of University of Porto; 2013.
33. Mahoney FI, Barthel DW. Functional Evaluation: The Barthel Index. Maryland state
medical journal. 1965;14:61-5.
34. Araújo F, Ribeiro JLP, Oliveira A, Pinto C. Validação do Índice de Barthel numa
amostra de idosos não institucionalizados [Barthel Index validation in a sample of non-
institutionalized elderly]. Revista Portuguesa de Saúde Pública. 2007;25(2):59-66.
35. Araújo F, Pais Ribeiro J, Oliveira A, Pinto C, Martins T. Validação da escala de
Lawton e Brody numa amostra de idosos não institucionalizados [Lawton and Brody scale
validation in a sample of non-institutionalized elderly]. In: Leal I, Pais-Ribeiro J, Silva I,
Marques S, editors. Actas do 7º congresso nacional de psicologia da saúde. Lisboa: ISPA;
2008. p. 217-20.
36. Lawton MP, Brody EM. Assessment of older people: self-maintaining and
instrumental activities of daily living. Gerontologist. 1969;9(3):179-86.
101
37. Pereira M, Melo C, Gameiro S, Canavarro MC. Estudos psicométricos da versão
em Português Europeu do índice de qualidade de vida EUROHIS-QOL-8. Laboratório de
Psicologia. 2011;9(2):109-23.
38. Schmidt S, Muhlan H, Power M. The EUROHIS-QOL 8-item index: psychometric
results of a cross-cultural field study. European journal of public health. 2006;16(4):420-8.
39. Vilar M, Simões MR, Sousa LB, Firmino H, Paredes T, Lima MP. Avaliação da
Qualidade de Vida em Adultos Idosos: Notas em torno do processo de adaptação e
validação do WHOQOL-OLD para a população portuguesa [Quality of life assessment in
older adults. Notes of the adaptation and validation process of WHOQOL-OLD for the
Portuguese population]. In: Canavarro MC, Serra AV, editors. Qualidade de vida e saúde:
Uma abordagem na perspectiva da Organização Mundial de Saúde. Lisboa: F. C.
Gulbenkian; 2010. p. 229-50.
40. Power M, Quinn K, Schmidt S, Whoqol-Old Group. Development of the WHOQOL-
old module. Quality of life research : an international journal of quality of life aspects of
treatment, care and rehabilitation. 2005;14(10):2197-214.
41. Santos-Eggimann B, Cuenoud P, Spagnoli J, Junod J. Prevalence of frailty in
middle-aged and older community-dwelling Europeans living in 10 countries. J Gerontol A
Biol Sci Med Sci. 2009;64(6):675-81.
42. Podsiadlo D, Richardson S. The timed "Up & Go": a test of basic functional mobility
for frail elderly persons. J Am Geriatr Soc. 1991;39(2):142-8.
43. Roberts HC, Denison HJ, Martin HJ, Patel HP, Syddall H, Cooper C, et al. A review
of the measurement of grip strength in clinical and epidemiological studies: towards a
standardised approach. Age Ageing. 2011;40(4):423-9.
44. Gobbens RJ, van Assen MA, Luijkx KG, Wijnen-Sponselee MT, Schols JM.
Determinants of frailty. J Am Med Dir Assoc. 2010;11(5):356-64.
45. Rockwood K. What would make a definition of frailty successful? Age and Ageing.
2005;34(5):432-4.
46. Woo J, Leung J, Morley JE. Comparison of frailty indicators based on clinical
phenotype and the multiple deficit approach in predicting mortality and physical limitation. J
Am Geriatr Soc. 2012;60(8):1478-86.
47. Theou O, Brothers TD, Mitnitski A, Rockwood K. Operationalization of frailty using
eight commonly used scales and comparison of their ability to predict all-cause mortality. J
Am Geriatr Soc. 2013;61(9):1537-51.
48. Kulmala J, Nykanen I, Hartikainen S. Frailty as a predictor of all-cause mortality in
older men and women. Geriatr Gerontol Int. 2014.

102
49. Ravindrarajah R, Lee DM, Pye SR, Gielen E, Boonen S, Vanderschueren D, et al.
The ability of three different models of frailty to predict all-cause mortality: results from the
European Male Aging Study (EMAS). Arch Gerontol Geriatr. 2013;57(3):360-8.
50. Kulminski AM, Ukraintseva SV, Kulminskaya IV, Arbeev KG, Land K, Yashin AI.
Cumulative deficits better characterize susceptibility to death in elderly people than
phenotypic frailty: lessons from the Cardiovascular Health Study. J Am Geriatr Soc.
2008;56(5):898-903.
51. Daniels R, van Rossum E, Beurskens A, van den Heuvel W, de Witte L. The
predictive validity of three self-report screening instruments for identifying frail older people
in the community. BMC Public Health. 2012;12:69.
52. Gobbens RJ, Luijkx KG, van Assen MA. Explaining quality of life of older people in
the Netherlands using a multidimensional assessment of frailty. Quality of life research : an
international journal of quality of life aspects of treatment, care and rehabilitation.
2012;22(8):2051-61.
53. Gobbens RJ, van Assen MA. The prediction of quality of life by physical,
psychological and social components of frailty in community-dwelling older people. Quality
of life research : an international journal of quality of life aspects of treatment, care and
rehabilitation. 2014.

103
4. Discussão e conclusão
O presente estudo visou analisar a aplicabilidade e pertinência do modelo integral de
fragilidade no contexto português, procurando, acima de tudo, contribuir para a
compreensão do constructo de fragilidade e das suas implicações clínicas.
Em Portugal, a fragilidade não faz parte do vocabulário de muitos prestadores de
cuidados de saúde/sociais a idosos, existindo ainda, poucas publicações sobre o tema.
Para além disso, não há planos de ação especificamente estruturados para a identificação
de fragilidade a nível comunitário e dos cuidados de saúde primários, nem programas de
prevenção e intervenção estruturados com base em conceptualizações contemporâneas
de fragilidade. Assim, a importância deste trabalho é salientada, especialmente por ter
permitido a adaptação e validação do TFI, de forma estandardizada e obedecendo às
linhas orientadoras internacionalmente definidas para a investigação neste âmbito.
O facto de a versão portuguesa do TFI ser fiável, válida e de fácil aplicação,
evidencia, por sua vez, a possibilidade de operacionalizar o modelo integral de fragilidade
neste contexto. Contudo, enquanto se pode apontar como limitação a esta ferramenta a
não avaliação dos resultados adversos de fragilidade, existem vários instrumentos
estandardizados e validados – igualmente de fácil utilização – que permitem complementar
o TFI neste âmbito. Adicionalmente, a aplicabilidade deste modelo conceptual no contexto
português é reforçada pelo facto de se terem observado as relações principais previstas
no modelo, entre determinantes, fragilidade e outcomes. Com efeito, foi possível verificar
que os determinantes explicaram uma parcela significativa da fragilidade exibida pelos
idosos, enquanto níveis superiores de fragilidade foram responsáveis por piores outcomes.
Concomitantemente, a pertinência desta conceptualização e consequente
operacionalização de fragilidade não reside apenas no pressuposto teórico de uma
avaliação biopsicossocial corresponder a uma abordagem mais holística, permitindo que
sejam desenvolvidas intervenções focadas no(s) domínio(s) do funcionamento humano
onde se verificam perdas que aumentam a vulnerabilidade individual. Tal como foi possível
observar através do presente estudo, a importância deste modelo é igualmente destacada
através de dados empíricos, que devem ser tidos em consideração para o planeamento de
cuidados de saúde e sociais. Neste âmbito destaca-se, especialmente, a particular
associação de fragilidade, medida através do TFI, com o declínio da qualidade de vida e
com um maior número de contactos com o médico de família.
Por outro lado, considerando o papel principal do domínio físico do TFI para a
predição de resultados adversos, seria possível colocar em causa a relevância da divisão
de fragilidade em três domínios. Contudo, tendo em conta que as variáveis que podem

104
estar na base de um aumento da vulnerabilidade física, psicológica e social são distintas,
o cariz multidimensional desta definição de fragilidade é justificado. Efetivamente, a
compreensão dos fatores que podem precipitar situações de risco a diferentes níveis é
fundamental para o desenvolvimento de programas preventivos.
Finalmente, importa salientar que o presente trabalho teve pontos fortes e fracos,
devidamente identificados em cada um dos estudos que o constitui. Destes, merecem
particular destaque, respetivamente, o cariz inovador do estudo (por ser a primeira
investigação em Portugal a estudar o modelo integral de fragilidade e a utilizar o TFI) e o
reduzido tamanho amostral (que impossibilita a generalização dos resultados obtidos à
população idosa portuguesa).
Paralelamente, são sugeridos trabalhos futuros, especialmente relacionados com o
estudo da natureza psicológica e social da síndrome de fragilidade, assim como com o
acompanhamento longitudinal dos idosos. A continuação da investigação relacionada com
a fragilidade será fundamental para definir com precisão as medidas necessárias para
promover a sua prevenção e dos seus resultados adversos, nos mais variados contextos.
Este aspeto será fundamental para garantir que o aumento da longevidade é acompanhado
pelo incremento do número de anos em que é possível viver com dignidade e qualidade de
vida.

105
5. Bibliografia
Abellan van Kan, G., Rolland, Y., Bergman, H., Morley, J. E., Kritchevsky, S. B., & Vellas,
B. (2008). The I.A.N.A Task Force on frailty assessment of older people in clinical
practice. J Nutr Health Aging, 12(1), 29-37.
Avila-Funes, J. A., Helmer, C., Amieva, H., Barberger-Gateau, P., Le Goff, M., Ritchie, K.,
. . . Dartigues, J. F. (2008). Frailty among community-dwelling elderly people in
France: the three-city study. J Gerontol A Biol Sci Med Sci, 63(10), 1089-1096.
Bergman, H., Ferrucci, L., Guralnik, J., Hogan, D. B., Hummel, S., Karunananthan, S., &
Wolfson, C. (2007). Frailty: an emerging research and clinical paradigm--issues and
controversies. J Gerontol A Biol Sci Med Sci, 62(7), 731-737.
Bouillon, K., Kivimaki, M., Hamer, M., Sabia, S., Fransson, E. I., Singh-Manoux, A., . . .
Batty, G. D. (2013). Measures of frailty in population-based studies: an overview.
BMC Geriatr, 13, 64. doi: 10.1186/1471-2318-13-64
Cesari, M., Gambassi, G., van Kan, G. A., & Vellas, B. (2014). The frailty phenotype and
the frailty index: different instruments for different purposes. Age Ageing, 43(1), 10-
12. doi: 10.1093/ageing/aft160
Clegg, A., Young, J., Iliffe, S., Rikkert, M. O., & Rockwood, K. (2013). Frailty in elderly
people. Lancet, 381(9868), 752-762. doi: 10.1016/S0140-6736(12)62167-9
Collard, R. M., Boter, H., Schoevers, R. A., & Oude Voshaar, R. C. (2012). Prevalence of
frailty in community-dwelling older persons: a systematic review. J Am Geriatr Soc,
60(8), 1487-1492. doi: 10.1111/j.1532-5415.2012.04054.x
Eurostat. (2014). Proportion of population aged 65 and over. Acedido a 23 Jan 2014
http://epp.eurostat.ec.europa.eu/tgm/table.do?tab=table&init=1&plugin=1&languag
e=en&pcode=tps00028
Fried, L. P., Ferrucci, L., Darer, J., Williamson, J. D., & Anderson, G. (2004). Untangling the
concepts of disability, frailty, and comorbidity: implications for improved targeting
and care. J Gerontol A Biol Sci Med Sci, 59(3), 255-263.
Fried, L. P., Hogan, P., & Rowe, J. (2011). Design and Operation of Health Systems in
Wealthy Industrial Countries. In J. R. Beard, S. Biggs, D. E. Bloom, L. P. Fried, P.
Hogan, A. Kalache & S. J. Olshansky (Eds.), Global Population Ageing: Peril or
Promise. Geneva: World Economic Forum.
Fried, L. P., Tangen, C. M., Walston, J., Newman, A. B., Hirsch, C., Gottdiener, J., . . .
Cardiovascular Health Study Collaborative Research Group. (2001). Frailty in older
adults: evidence for a phenotype. J Gerontol A Biol Sci Med Sci, 56(3), M146-156.

106
Fried, L. P., Walston, J., & Ferrucci, L. (2009). Frailty. In J. B. Halter, J. G. Ouslander, M.
E. Tinetti, S. Studenski, K. P. High & S. Asthana (Eds.), Hazzard’s geriatric medicine
and gerontology (6ª ed., pp. 631-646). New York: McGraw-Hill.
Gobbens, R. J., Luijkx, K. G., Wijnen-Sponselee, M. T., & Schols, J. M. (2010a). In search
of an integral conceptual definition of frailty: opinions of experts. J Am Med Dir
Assoc, 11(5), 338-343. doi: 10.1016/j.jamda.2009.09.015
Gobbens, R. J., Luijkx, K. G., Wijnen-Sponselee, M. T., & Schols, J. M. (2010b). Toward a
conceptual definition of frail community dwelling older people. Nurs Outlook, 58(2),
76-86. doi: 10.1016/j.outlook.2009.09.005
Gobbens, R. J., Luijkx, K. G., Wijnen-Sponselee, M. T., & Schols, J. M. (2010c). Towards
an integral conceptual model of frailty. J Nutr Health Aging, 14(3), 175-181.
Gobbens, R. J., van Assen, M. A., Luijkx, K. G., & Schols, J. M. (2012). Testing an integral
conceptual model of frailty. J Adv Nurs, 68(9), 2047-2060. doi: 10.1111/j.1365-
2648.2011.05896.x
Gobbens, R. J., van Assen, M. A., Luijkx, K. G., Wijnen-Sponselee, M. T., & Schols, J. M.
(2010a). Determinants of frailty. J Am Med Dir Assoc, 11(5), 356-364. doi:
10.1016/j.jamda.2009.11.008
Gobbens, R. J., van Assen, M. A., Luijkx, K. G., Wijnen-Sponselee, M. T., & Schols, J. M.
(2010b). The Tilburg Frailty Indicator: psychometric properties. J Am Med Dir Assoc,
11(5), 344-355. doi: 10.1016/j.jamda.2009.11.003
Hogan, D. B., MacKnight, C., & Bergman, H. (2003). Models, definitions, and criteria of
frailty. Aging Clin Exp Res, 15(3 Suppl), 1-29.
Instituto Nacional de Estatística. (2009). Projecções de população residente em Portugal
2008-2060. Lisboa: Instituto Nacional de Estatística.
Instituto Nacional de Estatística. (2014). Projeções de População Residente – 2012-2060.
Lisboa: Instituto Nacional de Estatística.
Levers, M. J., Estabrooks, C. A., & Ross Kerr, J. C. (2006). Factors contributing to frailty:
literature review. J Adv Nurs, 56(3), 282-291. doi: 10.1111/j.1365-
2648.2006.04021.x
Malmstrom, T. K., Miller, D. K., & Morley, J. E. (2014). A comparison of four frailty models.
J Am Geriatr Soc, 62(4), 721-726. doi: 10.1111/jgs.12735
Markle-Reid, M., & Browne, G. (2003). Conceptualizations of frailty in relation to older
adults. J Adv Nurs, 44(1), 58-68.
Martín, I., & Brandão, D. (2012). Políticas para a terceira idade. In Ó. Ribeiro & C. Paúl
(Eds.), Manual de Gerontologia (pp. 273-287). Lisboa: Lidel.

107
Mitnitski, A., Mogilner, A. J., MacKnight, C., & Rockwood, K. (2002). The mortality rate as
a function of accumulated deficits in a frailty index. Mech Ageing Dev, 123(11),
1457-1460. doi: 10.1016/s0047-6374(02)00082-9
Morley, J. E., Vellas, B., van Kan, G. A., Anker, S. D., Bauer, J. M., Bernabei, R., . . .
Walston, J. (2013). Frailty consensus: a call to action. J Am Med Dir Assoc, 14(6),
392-397. doi: 10.1016/j.jamda.2013.03.022
Olshansky, S. J., Beard, J., & Börsch-Supan, A. (2011). The Longevity Dividend: Health as
an Investment. In J. R. Beard, S. Biggs, D. E. Bloom, L. P. Fried, P. Hogan, A.
Kalache & S. J. Olshansky (Eds.), Global Population Ageing: Peril or Promise.
Geneva: World Economic Forum.
Pialoux, T., Goyard, J., & Lesourd, B. (2012). Screening tools for frailty in primary health
care: a systematic review. Geriatr Gerontol Int, 12(2), 189-197. doi: 10.1111/j.1447-
0594.2011.00797.x
Provencher, V., Demers, L., & Gelinas, I. (2012). Frailty: a concept under-utilised by
occupational therapists. Aust Occup Ther J, 59(4), 328-331. doi: 10.1111/j.1440-
1630.2012.01030.x
Puts, M. T., Lips, P., & Deeg, D. J. (2005). Sex differences in the risk of frailty for mortality
independent of disability and chronic diseases. J Am Geriatr Soc, 53(1), 40-47. doi:
10.1111/j.1532-5415.2005.53008.x
Ribeiro, O., Fernandes, L., Firmino, H., Simões, M. R., & Paúl, C. (2010). Geropsychology
and psychogeriatrics in Portugal: research, education and clinical training.
International Psychogeriatrics, 22(Special Issue 06), 854-863. doi:
doi:10.1017/S1041610210000347
Rockwood, K. (2005). What would make a definition of frailty successful? Age Ageing,
34(5), 432-434. doi: 10.1093/ageing/afi146
Rockwood, K., & Mitnitski, A. (2007). Frailty in relation to the accumulation of deficits. J
Gerontol A Biol Sci Med Sci, 62(7), 722-727.
Rodriguez-Manas, L., Feart, C., Mann, G., Vina, J., Chatterji, S., Chodzko-Zajko, W., . . .
Fod-Cc group. (2013). Searching for an operational definition of frailty: a Delphi
method based consensus statement: the frailty operative definition-consensus
conference project. J Gerontol A Biol Sci Med Sci, 68(1), 62-67. doi:
10.1093/gerona/gls119
Searle, S. D., Mitnitski, A., Gahbauer, E. A., Gill, T. M., & Rockwood, K. (2008). A standard
procedure for creating a frailty index. BMC Geriatr, 8, 24. doi: 10.1186/1471-2318-
8-24

108
Song, X., Mitnitski, A., & Rockwood, K. (2010). Prevalence and 10-year outcomes of frailty
in older adults in relation to deficit accumulation. J Am Geriatr Soc, 58(4), 681-687.
doi: 10.1111/j.1532-5415.2010.02764.x
Sternberg, S. A., Wershof Schwartz, A., Karunananthan, S., Bergman, H., & Mark Clarfield,
A. (2011). The identification of frailty: a systematic literature review. J Am Geriatr
Soc, 59(11), 2129-2138. doi: 10.1111/j.1532-5415.2011.03597.x
United Nations. (2013). World Population Ageing. New York: United Nations, Department
of Economic and Social Affairs, Population Division.
Vermeulen, J., Neyens, J. C., van Rossum, E., Spreeuwenberg, M. D., & de Witte, L. P.
(2011). Predicting ADL disability in community-dwelling elderly people using
physical frailty indicators: a systematic review. BMC Geriatr, 11, 33.
Walston, J., Hadley, E. C., Ferrucci, L., Guralnik, J. M., Newman, A. B., Studenski, S. A., .
. . Fried, L. P. (2006). Research agenda for frailty in older adults: toward a better
understanding of physiology and etiology: summary from the American Geriatrics
Society/National Institute on Aging Research Conference on Frailty in Older Adults.
J Am Geriatr Soc, 54(6), 991-1001. doi: 10.1111/j.1532-5415.2006.00745.x
World Health Organization. (2002). Active ageing: a policy framework. Geneva: World
Health Organization.
World Health Organization. (2012). Good health adds life to years. Global brief for World
Health Day 2012. Geneva: World Health Organization.
Zaslavsky, O., Cochrane, B. B., Thompson, H. J., Woods, N. F., Herting, J. R., & LaCroix,
A. (2013). Frailty: a review of the first decade of research. Biol Res Nurs, 15(4), 422-
432. doi: 10.1177/1099800412462866

109
Anexos
Anexo I: Description of the additional measures used to examine the construct and
criterion validity of the Portuguese version of the Tilburg Frailty Indicator
Anexo II: English version of Tilburg Frailty Indicator
Anexo III: Versão portuguesa do Tilburg Frailty Indicator

110
Description of the additional measures used to examine the
construct and criterion validity of the Portuguese version of the
Tilburg Frailty Indicator (TFI)
To examine the construct validity of the Portuguese version of TFI, other measures of
physical, psychological, and social frailty components were used. Physical measures
included Body Mass Index (BMI), Timed Up and Go (TUG) test, hand grip strength, and
center of pressure (COP) sway analysis, psychological measures encompassed Mini
Mental State Examination (MMSE), Geriatric Depression Scale (GDS), Geriatric Anxiety
Inventory (GAI), while Social Support Satisfaction Scale (SSSS) was used as a social
measure.
The BMI is an indicator of nutritional status and it is calculated by dividing weight in
kilograms by the square of height in meters. The TUG test assesses mobility by measuring
the time it takes a person to get up from a chair, walk three meters at their usual pace and
return to the chair and sit down again. Performances exceeding 10 seconds are usually
considered to indicate some mobility impairment, while performances over 20 seconds
typically show evident mobility limitations and some dependence of gait aids and/or
personal assistance. Hand grip strength was assessed with a GRIP-D Takei Hand Grip
Dynamometer (T.K.K. 5401, Takei Scientific Instruments Co., LTD, Tokyo, Japan),
measuring strength three times per hand, alternating side between measurements, with the
participant sitting comfortably, and using the highest value obtained. COP sway, which
reflects the trajectory of the center of mass and the magnitude of force applied at the support
surface to control body-mass acceleration, is usually measured to assess postural control
and balance. COP sway was analyzed with a pressure platform (Emed-AT25 D, Novel Inc.,
Munich, Germany), which contains 4000 capacitive sensors within a sensing area of
380x240 mm2 (sensor resolution of two sensors/cm2), and has a 25 Hz recording
frequency. Participants were asked to stand 60 seconds on the platform, barefoot and in a
self-selected comfortable upright position. The subjects were asked to execute the task
twice, one with their eyes open, looking directly at a target placed two meters away at the
height of the participants’ eyes, and another with their eyes closed. The order in which the
test was performed was random to avoid possible fatigue and learning effect and,
considering that balance in this position depends on the base of support area, all
parameters correlated with TFI domains were first normalized by a projection of that area,
which was calculated after measuring the distance between the lateral boarders of the feet
and their length, as detected by the platform. The COP sway parameters measured for this
study were maximum sway velocity and maximum sway range in medial/lateral (COPX) and

111
anterior/posterior (COPY) axis, and they were analyzed based on the most stable 30
second period of each test. It was considered that lower values in regard to COP sway
would represent a better ability to maintain balance. MMSE assesses different cognitive
domains (i.e. spatial and time orientation, memory, attention and calculation, and language)
and allows for the detection of cognitive deficit with cut-off for different education levels: ≤22
for 0-2 years of literacy; ≤24 for 3-6 years; and ≤27 for ≥7 years. In regard to GDS, which is
a scale specifically used to identify depression in older persons, the 15-item version was
used, which has a cut-off of 5. GAI is a 20-item scale that measures anxiety in older adults
and the presence of severe anxiety symptoms was considered if the participant scored ≥9.
The SSSS evaluates perception of social support in 15 questions, specifically related with
satisfaction with friends and family, intimacy and social activities. Higher scores translate a
better satisfaction with social support.
To study the criterion validity of this version of TFI, frailty was also identified through
alternative frailty specific measures: the Groningen Frailty Indicator (GFI) and an
operationalization of the frailty phenotype. Adverse outcomes (disability and health care
utilization) and quality of life were equally assessed for the same purpose.
GFI allows for a multidimensional assessment of frailty (including disability), and its
Portuguese version has 12 items and a cut-off point of 5. In regard to frailty phenotype
components: unintentional weight loss was considered if the participant answered “yes” to
TFI question 12 “Have you lost a lot of weight recently without wishing to do so? (‘a lot’ is:
6 kg or more during the last six months, or 3 kg or more during the last month)”. Low
physical activity was detected if the participant answered “one to three times a month” or
“hardly ever or never” to the question “How often do you engage in activities that require a
low or moderate level of energy such as gardening, cleaning the car/house, or going for a
walk?”. Exhaustion was identified if the participant answered “yes” to the question “In the
last month, have you had too little energy to do things you wanted to do?”. Slow walking
speed was detected if the participant took more than 20 seconds to complete the TUG (if
the participant wasn’t able to perform TUG due to mobility limitations, they were considered
to have a slow walking speed). Weakness was identified if the participant’s hand grip
strength was below the previously established cut-off, stratified by sex and BMI. Frailty was
identified if the participant had at least three of the components, and pre-frailty if one or two
components were present.
Disability in activities of daily living was measured with the Barthel Index and in
instrumental activities of daily living with the Lawton and Brody Scale. Higher scores in both
scales reflect total independence, and lower scores show some degree of dependence.
Healthcare utilization was assessed regarding only to the last year. These items comprised:
contact with general practitioner; contact with other healthcare professionals;

112
hospitalization; professional personal care; nursing care; informal care; and receiving care
in other healthcare or residential care institutions. All answers were dichotomous (yes/no),
except for contact with general practitioner, in which the participants could specify if they
had none, 1-2, 3-4, 5-6 or ≥7 contacts. Nonetheless, this item was later dichotomized for
statistical analysis, and only ≥5 contacts were considered.
Quality of life was assessed with EUROHIS-QOL-8, which is an 8-item generic
assessment of quality of life, and WHOQOL-OLD, which is a more extensive instrument
with several facets. The WHOQOL-OLD experimental Portuguese version used in this
research had 28 items and comprised 7 facets: sensory abilities; autonomy; past, present
and future activities; social participation; death and dying; intimacy; family/family life. In both
measures, higher scores indicate better quality of life.

113
English version of Tilburg Frailty Indicator (TFI) *
Gobbens, R. J., van Assen, M. A., Luijkx, K. G., Wijnen-Sponselee, M. T., & Schols, J.
M. (2010). The Tilburg Frailty Indicator: psychometric properties. J Am Med Dir Assoc,
11(5), 344-355. doi: 10.1016/j.jamda.2009.11.003
Part A Determinants of frailty
1. Which sex are you?
0 male 0 female
2. What is your age?
............................ years
3. What is your marital status?
0 married/living with partner
0 unmarried
0 separated/divorced
0 widow/widower
4. In which country were you born?
0 The Netherlands
0 Former Dutch East Indies
0 Suriname
0 Netherlands Antilles
0 Turkey
0 Morocco
0 Other, namely................
5. What is the highest level of education you have completed?
0 none or primary education
0 secondary education
0 higher professional or university education
6. Which category indicates your net monthly household income?
0 €600 or less
0 €601 - €900
0 €901 - €1200
0 €1201 - €1500
0 €1501 - €1800
0 €1801 - €2100
0 €2101 or more

114
7. Overall, how healthy would you say your lifestyle is?
0 healthy
0 not healthy, not unhealthy
0 unhealthy
8. Do you have two or more diseases and/or chronic disorders?
0 yes 0 no
9. Have you experienced one or more of the following events during the past year?
- the death of a loved one 0 yes 0 no
- a serious illness yourself 0 yes 0 no
- a serious illness in a loved one 0 yes 0 no
- a divorce or ending of an important intimate relationship 0 yes 0 no
- a traffic accident 0 yes 0 no
- a crime 0 yes 0 no
10. Are you satisfied with your home living environment?
0 yes 0 no
Part B Components of frailty
B1 Physical components
11. Do you feel physically healthy?
0 yes 0 no
12. Have you lost a lot of weight recently without wishing to do so? (‘a lot’ is: 6 kg or
more during the last six months, or 3 kg or more during the last month)
0 yes 0 no
Do you experience problems in your daily life due to:
13. …........difficulty in walking?
0 yes 0 no
14. ..........difficulty maintaining your balance?
0 yes 0 no
15. ..........poor hearing?
0 yes 0 no
16. ..........poor vision?
0 yes 0 no
17. ...........lack of strength in your hands?
0 yes 0 no

115
18. ...........physical tiredness?
0 yes 0 no
B2 Psychological components
19. Do you have problems with your memory?
0 yes 0 sometimes 0 no
20. Have you felt down during the last month?
0 yes 0 sometimes 0 no
21. Have you felt nervous or anxious during the last month?
0 yes 0 sometimes 0 no
22. Are you able to cope with problems well?
0 yes 0 no
B3 Social components
23. Do you live alone?
0 yes 0 no
24. Do you sometimes miss having people around you?
0 yes 0 sometimes 0 no
25. Do you receive enough support from other people?
0 yes 0 no
* The TFI was translated into English using the method of back-translation
Scoring Part B Components of frailty (range: 0 – 15)
Question 11: yes = 0, no = 1
Question 12 – 18: no = 0, yes = 1
Question 19: no and sometimes = 0, yes = 1
Question 20 and 21: no = 0, yes and sometimes = 1
Question 22: yes = 0, no = 1
Question 23: no = 0, yes = 1
Question 24: no = 0, yes and sometimes = 1
Question 25: yes = 0, no = 1
Cutpoint: 5

116
Versão portuguesa do Tilburg Frailty Indicator (TFI)
Coelho, T., Santos, R., Paúl, C., Gobbens, R. J. J., & Fernandes, L. (2014). Portuguese
version of the Tilburg Frailty Indicator: Transcultural adaptation and psychometric
validation. Geriatr Gerontol Int, n/a-n/a. doi: 10.1111/ggi.12373
Parte A: Determinantes de fragilidade
1. Qual é o seu sexo?
masculino feminino
2. Qual é a sua idade?
_______________ anos
3. Qual é o seu estado civil?
casado(a)/vive com um parceiro(a)
solteiro(a)
separado(a)/divorciado(a)
viúvo(a)
4. Em que país nasceu?
________________________________________
5. Quantos anos de escolaridade completou?
_______________ anos
6. Em que categoria inclui o rendimento mensal do seu agregado familiar?
250€ ou menos
251€ a 500€
501€ a 750€
751€ a 1000€
1001€ a 1500€
1501€ a 2000€
2001€
ou mais
7. Globalmente, em que medida diria que o seu estilo de vida é saudável?
Saudável nem muito nem pouco saudável não saudável
8. Tem duas ou mais doenças e/ou perturbações crónicas?
sim não
9. Aconteceu-lhe uma ou mais das seguintes situações durante o ano passado?
- a morte de uma pessoa querida sim não
- uma doença grave em si próprio sim não
- uma doença grave numa pessoa querida sim não
- um divórcio ou o fim de uma relação intima importante sim não
- um acidente de viação sim não
- um crime sim não
10. Está satisfeito com o ambiente em sua casa?
sim não
Parte B: Componentes de fragilidade
B1: Componentes físicos

117
11. Sente-se fisicamente saudável?
sim não
12. Perdeu muito peso recentemente sem desejar fazê-lo? (‘muito’ é: 6 kg ou mais,
durante os últimos seis meses, ou 3 kg ou mais, durante o último mês)
sim não
Tem problemas na sua vida diária devido a:
13. ...........dificuldade em andar?
sim não
14. ..........dificuldade em manter o seu equilíbrio?
sim não
15. ..........dificuldade de audição?
sim não
16. ..........dificuldade de visão?
sim não
17. ...........falta de força nas suas mãos?
sim não
18. ...........cansaço físico?
sim não
B2: Componentes psicológicos
19. Tem problemas com a sua memória?
sim por vezes não
20. Tem-se sentido em baixo durante o ultimo mês?
sim por vezes não
21. Tem-se sentido nervoso ou ansioso durante o ultimo mês?
sim por vezes não
22. É capaz de lidar bem com os problemas?
sim não
B3: Componentes Sociais
23. Vive sozinho?
sim não
24. Por vezes, sente falta de ter pessoas à sua volta?
sim por vezes não
25. Recebe suficiente apoio de outras pessoas?
sim não

118
Pontuação da Parte B: Componentes de fragilidade (varia: 0 – 15)
Questão 11: sim = 0, não = 1 Questão 22: sim = 0, não = 1
Questão 12 – 18: não = 0, sim = 1 Questão 23: não = 0, sim = 1
Questão 19: não e por vezes = 0, sim = 1 Questão 24: não = 0, sim e por vezes = 1
Questão 20 e 21: não = 0, sim e por
vezes = 1
Questão 25: sim = 0, não = 1
Pontuação final:
_________
Pontuação B1 (domínio físico):
_________
Pontuação B2 (domínio psicológico):
_________
Pontuação B3 (domínio social):
_________
Ponto de corte: 6