Embed Size (px)
Citation preview

1
STA 2023
Module 1 Introduction to
Statistics and Data

��� Learning Objectives
Upon completing this module, you should be able to:��1. Classify a statistical study as either descriptive or inferential.�2. Identify the population and the sample in an inferential study.�3. Explain the difference between an observational study and a
designed experiment.�4. Classify a statistical study as either an observational study or a
designed experiment.�5. Explain what is meant by a representative sample.�6. Describe simple random sampling.�7. Use a table of random numbers to obtain a simple random sample.
2

3
��� Learning Objectives (cont.)
� 8. Describe systematic random sampling, cluster sampling, and
stratified sampling."9. State the four basic principles of experimental design."10. Identify the treatment group and control group in a study."11. Identify the experimental units, response variable, factor(s), levels of
each factor, and treatments in a designed experiment."12. Distinguish between a completely randomized design and a
randomized block design. "

4
What Is (Are?) Statistics?
• Statistics (the discipline) is a way of reasoning, a collection of tools and methods, designed to help us understand the world.
• Statistics (plural) are particular calculations made from data.
• Data are values with a context.

5
What Is (Are?) Statistics? (cont.)

6
What is Statistics Really About?
• Statistics is about variation. • All measurements are imperfect, since there
is variation that we cannot see. • Statistics helps us to understand the real,
imperfect world in which we live.
7
What Are Data?
• Data can be numbers, record names, or other labels.
• Not all data represented by numbers are numerical data (e.g., 1=male, 2=female).
• Data are useless without their context…

8
Let’s Take a Look at the “W’s”
• To provide context we need the W’s – Who – What (and in what units) – When – Where – Why (if possible) – and How of the data.
• Note: the answers to “who” and “what” are essential.

9
Data Tables
• The following data table clearly shows the context of the data presented:
• Notice that this data table tells us the What (column titles) and Who (row titles) for these data.

10
Who The Who of the data tells us the individual cases about which (or whom) we have collected data.
– Individuals who answer a survey are called respondents.
– People on whom we experiment are called subjects or participants.
– Animals, plants, and inanimate subjects are called experimental units.

11
Who (cont.)
• Sometimes people just refer to data values as observations and are not clear about the Who. – But we need to know the Who of the data
so we can learn what the data say.

12
What and Why
• Variables are characteristics recorded about each individual.
• The variables should have a name that identify What has been measured.
• To understand variables, you must Think about what you want to know.

13
What and Why (cont.) • Some variables have units that tell how each
value has been measured and tell the scale of the measurement.

14
What and Why (cont.) • A categorical (or qualitative) variable names
categories and answers questions about how cases fall into those categories. – Categorical examples: sex, race, ethnicity
• A quantitative variable is a measured variable (with units) that answers questions about the quantity of what is being measured. – Quantitative examples: income ($), height
(inches), weight (pounds)

15
What and Why (cont.)
• The questions we ask a variable (the Why of our analysis) shape what we think about and how we treat the variable.

16
What and Why (cont.)
• Example: In a student evaluation of instruction at a large university, one question asks students to evaluate the statement “The instructor was generally interested in teaching” on the following scale:
1 = Disagree Strongly; 2 = Disagree; 3 = Neutral; 4 = Agree; 5 = Agree Strongly. • Question: Is interest in teaching categorical or
quantitative?

17
What and Why (cont.) Question: Is interest in teaching categorical or quantitative? • We sense an order to these ratings, but there
are no natural units for the variable interest in teaching.
• Variables like interest in teaching are often called ordinal variables. – With an ordinal variable, look at the Why of the
study to decide whether to treat it as categorical or quantitative.

18
Counts Count • When we count the cases in each category of a
categorical variable, the counts are not the data, but something we summarize about the data. – The category labels are the What, and – the individuals counted are the Who.

19
Counts Count (cont.)
• When we focus on the amount of something, we use counts differently. For example, Amazon might track the growth in the number of teenage customers each month to forecast CD sales (the Why). – The What is teens,
the Who is months, and the units are number of teenage customers.

20
Identifying Identifiers
• Identifier variables are categorical variables with exactly one individual in each category. – Examples: Social Security Number, ISBN, FedEx
Tracking Number • Don’t be tempted to analyze identifier variables. • Be careful not to consider all variables with one case
per category, like year, as identifier variables. – The Why will help you decide how to treat
identifier variables.

21
Where, When, and How
• We need the Who, What, and Why to analyze data. But, the more we know, the more we understand.
• When and Where give us some nice information about the context. – Example: Values recorded at a large public
university may mean something different than similar values recorded at a small private college.

22
Where, When, and How (cont.)
• How the data are collected can make the difference between insight and nonsense. – Example: results from voluntary Internet surveys
are often useless • The first step of any data analysis should be to
examine the W’s—this is a key part of the Think step of any analysis.
• And, make sure that you know the Why, Who, and What before you proceed with your analysis.

23
What Can Go Wrong?
• Don’t label a variable as categorical or quantitative without thinking about the question you want it to answer.
• Just because your variable’s values are numbers, don’t assume that it’s quantitative.
• Always be skeptical—don’t take data for granted.

24
Descriptive statistics includes the construction of graphs, charts, and tables and the calculation of various descriptive measures such as averages, measures of variation, and percentiles.
The 1948 Baseball Season In 1948, the Washington Senators played 153 games, winning 56 and losing 97. They finished seventh in the American League and were led in hitting by Bud Stewart, whose batting average was .279.
Descriptive Statistics consists of methods for organizing and summarizing information.
What is Descriptive Statistics?

25
What is the difference between Population and Sample?
Political polling provides an example of inferential statistics. Interviewing everyone of voting age in the United States on their voting preferences would be expensive and unrealistic. Statisticians who want to gauge the sentiment of the entire population of U.S. voters can afford to interview only a carefully chosen group of a few thousand voters. This group is called a sample of the population.
Population: The collection of all individuals or items under consideration in a statistical study. Sample: That part of the population from which information is obtained.

26
Look at the relationship between Population and Sample

27
What is Inferential Statistics?
Statisticians analyze the information obtained from a sample of the voting population to make inferences (draw conclusions) about the preferences of the entire voting population. Inferential statistics provides methods for drawing such conclusions.
Inferential statistics: consists of methods for drawing and measuring the reliability of conclusions about a population based on information obtained from a sample of the population.

28
How to obtain a Simple Random Simple?
There are two types of simple random sampling. One is simple random sampling with replacement, whereby a member of the population can be selected more than once; the other is simple random sampling without replacement, whereby a member of the population can be selected at most once. "
Simple random sampling: A sampling procedure for which each possible sample of a given size is equally likely to be the one obtained. Simple random sample: A sample obtained by simple random sampling.

29
""Obtaining a simple random sample by picking slips of paper out of a box is usually impractical, especially when the population is large. Fortunately, we can use several practical procedures to get simple random samples. One common method involves a table of random numbers – a table of randomly chosen digits."
Table of Random Numbers

30
Table Random numbers"Table"
31
What is Random-Number Generators?"
Nowadays, statisticians prefer statistical software packages or graphing calculators, rather than random-number tables, to obtain simple random samples. The built-in programs for doing so are called random-number generators. When using random-number generators, be aware of whether they provide samples with replacement or samples without replacement.

32
How to obtain a Systematic Random Sampling?

33
How to obtain a Cluster Sampling?

34
How to obtain a Stratified Random Sampling?

35
What are Experimental Units?
Folic Acid and Birth Defects For the study, the doctors enrolled 4753 women prior to conception, and divided them randomly into two groups. One group took daily multivitamins containing 0.8 mg of folic acid, whereas the other group received only trace elements.In the language of experimental design, each woman in the folic acid study is an experimental unit, or a subject.
In a designed experiment, the individuals or items on which the experiment is performed are called experimental units. When the experimental units are humans, the term subject is often used in place of experimental unit.

36
Principles of Experimental Design
1. Control: – We control sources of variation other than the
factors we are testing by making conditions as similar as possible for all treatment groups.
2. Randomize: – Randomization allows us to equalize the effects of
unknown or uncontrollable sources of variation. • It does not eliminate the effects of these sources,
but it spreads them out across the treatment levels so that we can see past them.
– Without randomization, you do not have a valid experiment and will not be able to use the powerful methods of Statistics to draw conclusions from your study.

37
Principles of Experimental Design 3. Replicate:
– Repeat the experiment, applying the treatments to a number of subjects. • The outcome of an experiment on a single subject
is an anecdote, not data. – When the experimental group is not a representative
sample of the population of interest, we might want to replicate an entire experiment for different groups, in different situations, etc. • Replication of an entire experiment with the
controlled sources of variation at different levels is an essential step in science.

38
Principles of Experimental Design 4. Block:
– Sometimes, attributes of the experimental units that we are not studying and that we can’t control may nevertheless affect the outcomes of an experiment.
– If we group similar individuals together and then randomize within each of these blocks, we can remove much of the variability due to the difference among the blocks.
– Note: Blocking is an important compromise between randomization and control, but, unlike the first three principles, is not required in an experimental design.

39
Folic Acid and Birth Defects
・ Control: The doctors compared the rate of major birth defects for
the women who took folic acid to that for the women who took only trace elements.
・ Randomization: The women were divided randomly into two
groups to avoid unintentional selection bias. ・ Replication: A large number of women were recruited for the
study to make it likely that the two groups created by randomization would be similar and also to increase the chances of detecting any effect due to the folic acid.

40
Folic Acid and Birth Defects (Cont.)
One of the most common experimental situations involves a specified treatment and placebo, an inert or innocuous medical substance.
Technically, both the specified treatment and placebo are
treatments. The group receiving the specified treatment is called the treatment group, and the group receiving placebo is called the control group. �
� In the folic acid study, the women who took folic acid constituted
the treatment group and those who took only trace elements constituted the control group.

41
Example: Experimental Design Weight Gain of Golden Torch Cacti
The Golden Torch Cactus (Trichocereus spachianus), a cactus native to Argentina, has excellent landscape potential. William Feldman and Frank Crosswhite, two researchers at the Boyce Thompson Southwestern Arboretum, investigated the optimal method for producing these cacti.
The researchers examined, among other things, the effects of a
hydrophilic polymer and irrigation regime on weight gain. Hydrophilic polymers are used as soil additives to keep moisture in the root zone.
For this study, the researchers chose Broadleaf P-4
polyacrylamide, abbreviated P4. The hydrophilic polymer was either used or not used, and five irrigation regimes were employed: none, light, medium, heavy, and very heavy.

42
Example: Experimental Design (Cont.)
�a. The experimental units are the cacti used in the
study.�b. The response variable is weight gain.�c. The factors are hydrophilic polymer and irrigation
regime.�d. Hydrophilic polymer has two levels: with and
without. Irrigation regime has five levels: none, light, medium, heavy, and very heavy.�
e. Each treatment is a combination of a level of hydrophilic polymer and a level of irrigation regime.

43
Table: 10 Treatments In the table, we abbreviated “very heavy” as “Xheavy.”

44
Definitions Response Variable, Factors, Levels, and Treatments Response variable: The characteristic of the experimental outcome that is to be measured or observed. Factor: A variable whose effect on the response variable is of interest in the experiment. Levels: The possible values of a factor. Treatment: Each experimental condition. For one-factor experiments, the treatments are the levels of the single Factor. For multifactor experiments, each treatment is a Combination of levels of the factors.
45
What is a Completely Randomized Design?
Once we have chosen the treatments, we must decide how the experimental units are to be assigned to the treatments (or vice versa). The women in the folic acid study were randomly divided into two groups; one group received folic acid and the other only trace elements. In the cactus study, 40 cacti were divided randomly into 10 groups of four cacti each and then each group was assigned a different treatment from among the 10 depicted in previous Table. Both of these experiments used a completely randomized design.
In a completely randomized design, all the experimental units are assigned randomly among all the treatments.

46
What is a Randomized Block Design?
Although the completely randomized design is commonly used and simple, it is not always the best design. Several alternatives to that design exist. For instance, in a randomized block design, experimental units that are similar in ways that are expected to affect the response variable are grouped in blocks. Then the random assignment of experimental units to the treatments is made block by block.
In a randomized block design, the experimental units are assigned randomly among all the treatments separately within each block.

47
Suppose we want to compare the driving distances for five different brands of golf ball. For 40 golfers, discuss a method of comparison based on�a. a completely randomized design. b. a randomized block design. Solution�Here the experimental units are the golfers, the response variable is driving distance, the factor is brand of golf ball, and the levels (and treatments) are the five brands.�a. For a completely randomized design, we would randomly divide the 40 golfers into five groups of 8 golfers each and then randomly assign each group to drive a different brand of ball,as illustrated in the next slide. �
Example: Statistical Designs

48
Completely Randomized Design

49
b. Because driving distance is affected by gender, using a randomized block design that blocks by gender is probably a better approach. We could do so by using 20 men golfers and 20 women golfers. We would randomly divide the 20 men into five groups of 4 men each and then randomly assign each group to drive a different brand of ball. Likewise, we would randomly divide the 20 women into five groups of 4 women each and then randomly assign each group to drive a different brand of ball. "
Example: Statistical Designs (Cont.)

50
Randomized Block Design

51
By blocking, we can isolate and remove the variation in driving distances between men and women and thereby make it easier to detect any differences in driving distances among the five brands of golf ball. Additionally, blocking permits us to analyze separately the differences in driving distances among the five brands for men and women. As we have seen in this example, blocking can isolate and remove systematic differences among blocks, thereby making any differences among treatments easier to detect. Blocking also makes possible the separate analysis of treatment effects on each block.
What can blocking do for us?

52
Another Example of a Blocked Experiment
53
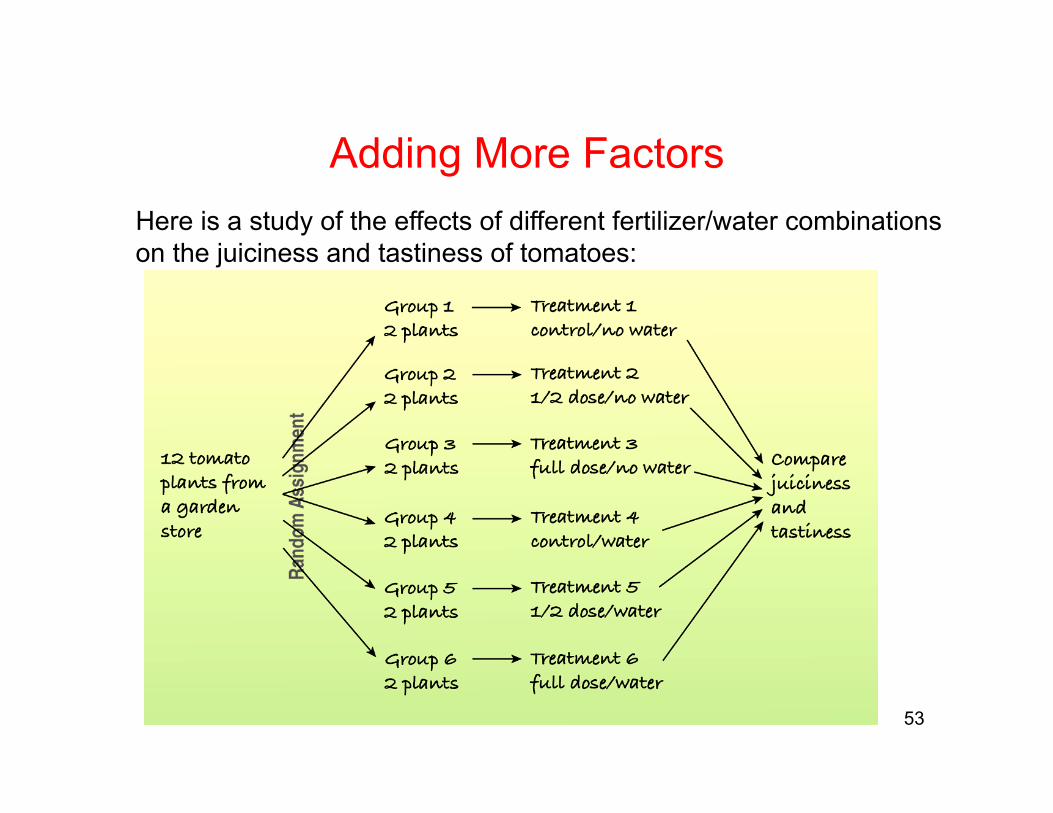
Here is a study of the effects of different fertilizer/water combinations on the juiciness and tastiness of tomatoes:
Adding More Factors

54
What are confounded factors? • When the levels of one factor are associated with
the levels of another factor, we say that these two factors are confounded.
• When we have confounded factors, we cannot
separate out the effects of one factor from the effects of the other factor.
55
Lurking or Confounding? A lurking variable creates an association between two other variables that tempts us to think that one may cause the other.
– This can happen in a regression analysis or an observational study.
– A lurking variable is usually thought of as a prior cause of both y and x that makes it appear that x may be causing y.

56
Lurking or Confounding? (cont.) • Confounding can arise in experiments when some other variables
associated with a factor has an effect on the response variable.
– Since the experimenter assigns treatments (at random) to subjects rather than just observing them, a confounding variable can’t be thought of as causing that assignment.
• A confounding variable, then, is associated in a noncausal way with
a factor and affects the response.
– Because of the confounding, we find that we can’t tell whether any effect we see was caused by our factor or by the confounding factor (or by both working together).

57
What Can Go Wrong?
• Don’t give up just because you can’t run an experiment. – If we can’t perform an experiment, often an observational study is
a good choice. • Beware of confounding.
– Use randomization whenever possible to ensure that the factors not in your experiment are not confounded with your treatment levels.
– Be alert to confounding that cannot be avoided, and report it along with your results.

58
What Can Go Wrong?
• Bad things can happen even to good experiments. – Protect yourself by recording additional information.
• Don’t spend your entire budget on the first run. – Try a small pilot experiment before running the full-scale
experiment. – You may learn some things that will help you make the full-scale
experiment better.

59
What have we learned?
We have learned to: �1. Classify a statistical study as either descriptive or inferential.�2. Identify the population and the sample in an inferential study.�3. Explain the difference between an observational study and a
Designed experiment.�4. Classify a statistical study as either an observational study or
a designed experiment.�5. Explain what is meant by a representative sample.�6. Describe simple random sampling.�7. Use a table of random numbers to obtain a simple random
sample.

60
What have we learned? (cont.) � 8. Describe systematic random sampling, cluster sampling, and
stratified sampling."9. State the four basic principles of experimental design."10. Identify the treatment group and control group in a study."11. Identify the experimental units, response variable, factor(s),
levels of each factor, and treatments in a designed experiment."
12. Distinguish between a completely randomized design and a randomized block design. "

61
Credit
Some of these slides have been adapted/modified in part/whole from the slides of the following textbooks.
• Weiss, Neil A., Introductory Statistics, 8th Edition • Bock, David E., Stats: Data and Models, 3rd Edition