Embed Size (px)
Citation preview
Molecular stochaticity in mammalian cell signaling: Lipid membrane organization
and CaMKII kinetics
by
Il Hyung Lee
A dissertation submitted in partial satisfaction of the
requirements for the degree of
Doctor of Philosophy
in
Chemistry
in the
Graduate Division
of the
University of California, Berkeley
Committee in charge:
Professor Jay T. Groves, Chair Professor Berend Smit
Professor Daniel Fletcher
Fall 2012

1
Abstract
Molecular stochasticity in mammalian cell signaling: Lipid membrane organization
and CaMKII kinetics
by
Il Hyung Lee
Doctor of Philosophy in Chemistry
University of California, Berkeley
Professor Jay T. Groves, Chair
Molecular processes viewed at the single molecule level are stochastic and living cells are full of stochastic processes. Cellular processes frequently occur with a discrete number of molecules and understanding the stochastic behavior of them is of fundamental importance. Here, I studied physical chemistry of two important molecular species in cells: the lipid and the protein.
On the subject of lipids, I studied miscibility phase structure of the live cell membrane. Observations of liquid-liquid miscibility phase transition in ternary mixture membranes with hypothetical existence of heterogeneous membrane domains in mammalian cells caused hypothesis of immiscible domains in live cell membranes. Discussion on the subject is often misleading when the discussion is only focused on the qualitative picture of domain existence, but does not consider the physical principles behind it. The question is where in the phase diagram the living cell membrane is poised. To address this question directly I observed physical parameters of the live cell membrane as a function of temperature and I conclude that the live cell membrane is poised reasonably far from the transition temperature. I also discuss the lack of direct evidence for miscibility phase structures playing an important role in actual signaling and the implication of criticality in membrane reactions.
On the subject of protein, I studied kinetics of CaMKII, a major protein involved in hippocampal synaptic plasticity. CaMKII holoenzyme has a complex structure comprising of twelve subunits and as a molecular component in a neuronal signaling network, this complex structure allows the enzyme to carry out complicated functions. Using a recently solved x-ray crystallographic structure of the CaMKII holoenzyme, I have modeled the relationship between docked-extended states equilibrium and the calcium frequency response of CaMKII. Stochastic kinetics simulations show that CaMKII frequency response can be fine-tuned by adjusting the equilibrium constant. I also show for the first time, activation dependent subunit exchange of CaMKII dodecamer using single molecule TIRF microscopy. This strongly supports the hypothesis that the CaMKII dodecamer, with its continuous turnover of subunits, can serve as a form of molecular memory.

i
For my family
ii
Table of Contents Preface ......................................................................................................................................................... vi
Chapter 1 Linear response of lipid mobility as function of temperature reveals non-existence of discrete miscibility transition in live cell plasma membrane ....................................................................................................... 1
1.1 Abstract ............................................................................................................................................... 1
1.2 Introduction ........................................................................................................................................ 1
1.3 Methods .............................................................................................................................................. 3
Fluorescence Correlation Spectroscopy ............................................................................................... 3
Insertion of fluorescence labeled lipids into the live cell membrane ................................................... 5
Cloning and Cell Culture/Transfection of anchored GFP fusion proteins ............................................. 5
Lifetime measurement .......................................................................................................................... 6
FCS Simulation ...................................................................................................................................... 6
1.4 Result .................................................................................................................................................. 7
Temperature dependent FCS ................................................................................................................ 7
D(T) of membrane anchored proteins .................................................................................................. 8
DiI Lifetime measurement .................................................................................................................... 9
FCS simulation ..................................................................................................................................... 10
1.5 Discussion .......................................................................................................................................... 12
1.6 Conclusion ......................................................................................................................................... 15
1.7 Supporting information..................................................................................................................... 15
Supplementary tables ......................................................................................................................... 15
Supplementary figures ........................................................................................................................ 19
Chapter 2 RBL 2H3 mast cell signaling from antigen recognition doesn’t involve observable change of miscibility phase of the lipid membrane ...................................................................................................................... 22
2.1 Abstract ............................................................................................................................................. 22
2.2 Introduction ...................................................................................................................................... 22
2.4 Result ................................................................................................................................................ 23
2.5 Discussion .......................................................................................................................................... 24
iii
Chapter 3 Near-critical fluctuation is a potential catalytic environment for membrane interprotein reactions: Simulation study ......................................................................................................................................... 25
3.1 Abstract ............................................................................................................................................. 25
3.2 Introduction ...................................................................................................................................... 25
3.3 Methods ............................................................................................................................................ 25
3.4 Result ................................................................................................................................................ 26
3.5 Discussion .......................................................................................................................................... 26
Chapter 4 A Mechanism for Tunable Autoinhibition in the Structure of a Human Ca2+/Calmodulin- Dependent Kinase II Holoenzyme .................................................................................................................................. 28
4.1 Abstract ............................................................................................................................................. 28
4.2 Introduction ...................................................................................................................................... 28
4.3 Result and Discussion ........................................................................................................................ 32
Crystallography and Structure Determination .................................................................................... 32
Architecture of the Holoenzyme ......................................................................................................... 36
Kinase Domain-Central Hub Docking Interactions .............................................................................. 39
Conformational Interconversion in the Human Short-Linker CaMKII ................................................. 42
Linker Length Determines whether the Holoenzyme Occupies a Compact or Extended Autoinhibited Conformation ...................................................................................................................................... 45
The Docking of Kinase Domains onto the Central Hub Is Also Relevant for CaMKII Isoforms with Long Linkers ........................................................................................................................................ 48
Simulation of CaMKII Activation by Ca2+/CaM................................................................................... 48
4.4 Conclusions ....................................................................................................................................... 52
4.5 Experimental Procedures .................................................................................................................. 53
Protein Expression and Purification .................................................................................................... 53
Crystallization of the CaMKII Holoenzyme .......................................................................................... 54
Structure Determination and Refinement .......................................................................................... 54
Small-Angle X-Ray Scattering .............................................................................................................. 54
Enzyme Assays .................................................................................................................................... 55
Stochastic Kinetic Simulations ............................................................................................................ 55
4.6 Acknowledgments ............................................................................................................................. 59
4.7 Supplemental information ................................................................................................................ 60

iv
Chapter 5 Activation dependent subunit exchange kinetics of CaMKII as a potential mechanism for molecular memory ....................................................................................................................................................... 61
5.1 Abstract ............................................................................................................................................. 61
5.2 Introduction ...................................................................................................................................... 61
5.3 Result and Discussion ........................................................................................................................ 62
Single molecule TIRF assay .................................................................................................................. 62
Calcium-Calmodulin binding dependent subunit exchange kinetics of CaMKII ................................. 63
Subunit exchange can result in propagation of autophosphorylation ............................................... 64
Altering docked-extended states equilibrium constant has negligible effect on subunit exchange rate ...................................................................................................................................................... 66
Increase of particle colocalization is not a result of protein oligomerization .................................... 67
Detailed kinetics of CaMKII subunit exchange .................................................................................... 68
5.4 Conclusion ......................................................................................................................................... 70
5.5 Methods ............................................................................................................................................ 70
Expression and purification ................................................................................................................. 70
Labeling ............................................................................................................................................... 70
Mixing reactions .................................................................................................................................. 70
Preparation of PEG coated glass surface for protein immobilization ................................................. 71
Single molecule TIRF imaging .............................................................................................................. 71
Chapter 6 CaMKII does not show localization to the microclusters in Jurkat T cells when activated by anti-CD3 and anti-CD28 presented on supported lipid bilayer ........................................................................................ 72
6.1 Abstract ............................................................................................................................................. 72
6.2 Introduction ...................................................................................................................................... 72
6.3 Methods ............................................................................................................................................ 72
6.4 Result and discussion ........................................................................................................................ 73
Biblography ................................................................................................................................................. 75
Appendix Removing bleed-through correlation in FCCS without TCSPC .................................................................... 83

v
Acknowledgement I would like to thank my collaborators of the projects. I thank Dr. Hector Huang and Prof. Adam Smith for help in lipid organization projects. I thank Dr. Margaret Stratton and Dr. Luke Chao for help in CaMKII projects. I should thank all other Groves Lab members for help and being so nice. I thank Prof. Jay Groves my advisor for being a kind adviser with great insights. I also thank Prof. John Kuriyan for insights on CaMKII projects.
I consider this thesis as continuation of the thesis from Yonsei university “Electrical properties of magnetite-polyethylene composites” by Prof. Sung-Han Lee, my father. He used to be in Berkeley for postdoc in Prof. Somorjai’s Lab. and now I am filing my thesis here. Isn’t it cool? Hahaha.
I also thank all people I met here at Berkeley. You all made my life. I would also say goodbye to those random deer and squirrels I encountered in last few years.
These are arts that inspired me during my time as a graduate student to complete this thesis:
Fountain (Sculpture, SFMOMA) by Marcel Duchamp
Use-theory of meaning (from the book Philosophical Investigations) by Ludwig Wittgenstein
1Q84 (Book, Noble) by Murakami Haruki
Immortal life of Henrietta Lacks (Book, nonfiction) by Rebecca Skloot
Giant steps (Jazz music) by John Coltrane
Bridges in the sky (Rock music) by Dream Theater
Hello (Guitar music) by Depapepe
iPad (Tablet PC) by Apple
I am ggomsu (나는 꼼수다, Podcast on politics) by Ddanzi radio
Dark knight rises (Movie) by Christopher Nolan et al.
Imalnyeon series (이말년 시리즈, web cartoon) by Imalnyeon
League of legends (On-line game) by Riot games
Gag concert (TV show) by KBS
vi
Preface
Living cells are extremely well designed micro-machines that are largely based on liquid phase phenomena, so cellular processes are full of physical chemistry. Considering the spatial scale of the phenomena happening in the cell, it is at the intermediate scale where the collective behavior of many molecules and the stochastic behavior of single molecules are both important and effectively working together. Cells as a group do their jobs with amazing precision and reproducibility as each individual molecule follows the rule of stochasticity, which basically means randomness. This is even more surprising if we pay attention to the fact that living cells should be able to make decisions correctly based on signaling input coming out of quiet amount of environmental noise. So understanding molecular stochasticity in living cell signaling is one of the most interesting subjects today. Scientists already have enough accumulated knowledge in the area of physical chemistry; what we need is to correctly apply it with careful observation.
Chapters one, two, and three of this thesis will discuss the lipid miscibility phase structure of the plasma membranes of mammalian cells. Membrane proteins will do completely two-dimensional random walk if we assume no interaction with the lipid membrane, and only the interprotein interaction will govern any kind of sorting processes happening in the cell membrane. But if we assume the existence of immiscible phases or fluctuation in the plasma membrane, it will introduce bias to the membrane proteins’ random movements as a function of chemical potential difference for the different phases. This hypothesis has significant biological importance as it can potentially govern the sorting processes and collision probability in the membrane. However, when we approach this problem, it is important that we not lose sight of the concept of the physical origin of lipid immiscibility and its phase diagram.
In later chapters, I will discuss the kinetics of CaMKII, the key molecular component of neural signaling. Its unique and complex structure allows CaMKII to switch between many states and pursue complex functions as a signaling component. Viewed at the level of the individual molecule, switching between different states is a probabilistic procedure, and each probability of transition is a function of various factors. Stochastic procedures of individual molecules will eventually give rise to a unique property of the signaling circuit such that CaMKII can be considered a structurally designed and fine-tuned stochastic molecular machine, although whole kinetics and its implication for signaling is an ongoing subject of study.
When I want to raise my right arm, I can immediately do so, but it is interesting that the actual process is governed by a collection of stochastic procedures. That’s probably where physics and metaphysics meet. Because it is beyond the scope of this thesis, I will not discuss it here.
1
Chapter 1
Linear response of lipid mobility as function of temperature reveals non-existence of discrete miscibility transition in live cell plasma membrane
1.1 Abstract
Binary immiscibility and miscibility transition have been well characterized in ternary mixture lipid membrane systems which are considered as model systems mimicking the composition of the general mammalian cell plasma membranes. (1) Observation of same macroscale miscibility transition in live cell membrane bleb confirmed this reversible immiscibility do exists as inherent property of live cell membrane. (2, 3) This behavior is commonly extended to native cell membranes hypothesizing existence of nano-scale heterogeneous domains, (4) although actual evidence of this link has been vague. In this report, we show linear response of physical parameters as function of temperature in live cell membrane with no evidence of discrete phase transition throughout a wide range of temperatures: 14 – 37℃. Temperature dependent fluorescence correlation spectroscopy of labeled lipids and anchored proteins show a consistently linear trend of mobility as a function of temperature. Fluorescence lifetime study with DiI, a local viscosity reporter, (5) confirms this trend, and shows a clear difference in lifetime between living cell membranes and the blebs derived from them. Simulation study suggests we can clearly exclude the possibility of 1st order transition temperature being near physiological temperature while 2nd order transition under small perturbation might effectively quench the discontinuity of parameters while preventing macro-scale phase separation. This suggests live cell membrane composition and environment is tuned that it wouldn’t experience any discrete transition as function of temperature while lipids are still under clear influence of outside temperature as if they are scaled as Einstein Stokes relation.
1.2 Introduction
Phase behavior of lipid membrane has been studied thoroughly which provided insight to understand physical property of the live cell membrane and various phenomena happening within it. One of the subjects that has been obtaining attention of researchers was immiscibility or phase separation in the lipid membrane. (1, 6-8) Miscibility transition is general equilibrium phenomena observed in systems where competition between inter particle interaction energies and entropic contribution from possible configuration states can result in either homogeneous phase or separated phase as function of environmental parameters like temperature, pressure. This could be observed and predicted in two components membrane systems and furthermore, in multicomponent systems. (9) Lipid membrane miscibility should be important since any non-
2
ideal mixing in biological membranes would be directly contributing as heterogeneity of the membrane which also can potentially influence the way membrane organization is regulating the live cell activities. (10)
Giant vesicles with ternary lipid mixtures composed of high melting temperature lipids, low melting temperature lipids and cholesterol have been studied as a model system of the plasma membrane which shows very interesting miscibility transition. (1, 11-13) When the system is lowered below the transition temperature Tm, the lipid membrane is separated into two distinct domains while the system is completely homogeneous above Tm. This miscibility transition is a reversible equilibrium property of the system. (1) Researchers have speculated that lipids play an active role in two dimensional sorting process and from this perspective, the separations of two domains enable the lipid membrane to work as a sorting platform (14-16); other molecules in the membrane may have different chemical potentials for either phase separated domain. These studies suggest the possibility of small scale phase separation as a driving force for molecular sorting in the living cell membrane.
However, phase separation of ternary mixtures does not fully model the compositional complexity of cell membranes and compositional variations may lead to different inter-particle interactions that can result in different collective phase behavior of the system. Despite this, the discovery of a strikingly similar phase separation in living cell membrane blebs have led researchers to conclude that miscibility transition is indeed an inherent property of live cell membrane. (2) Analysis of composition fluctuations of this system near the transition temperature further revealed that membrane blebs exhibit critical behavior. It suggested a possible explanation for the existence of nano-scale heterogeneity by extrapolating the scaling laws for correlation length of two different domains above transition temperature. (3) This hypothesis can explain the connection between living cells being at 37 ℃ while bleb membrane transition occurs mostly at lower temperature based on existence of two distinct domains.
Large scale phase separation has never been observed in native living cell membranes. Researchers have been observing some inhomogeneous lipid interaction in live cell using experimental techniques that can resolve out information which is not visible by conventional techniques. (17-19) Role of actin cytoskeleton as diffusion barrier has been also pointed out. (20) Despite all these, effort to study direct response of physical parameters as function of temperature and possible existence of nano-scale phase transition in living cell membrane have been lacking. If cell membrane has inherent property of miscibility transition, it means existence of discontinuity in physical property of the membrane as function of temperature. Model membrane and GPMV study showed clear discontinuity in mobility coming from miscibility transition measured on macro scale phase separated systems. (21, 22)
In this report, we show experimental evidence that mammalian cell plasma membranes don’t show discontinuous miscibility transition as function of temperature. Temperature dependent fluorescence correlation spectroscopy and lifetime measurements reveal a linear dependence of lipid diffusion, anchored protein diffusion and viscosity as a function of temperature over a wide range of temperatures (14-37 °C) with obvious differences in viscosity between living cell membranes and GPMVs. The linear response to temperature suggests that the cell membrane
3
doesn’t experience any phase transition even below physiological temperature. Different lipids show clearly different diffusion coefficients but all consistently show the universal linear trend.
1.3 Methods
Fluorescence Correlation Spectroscopy
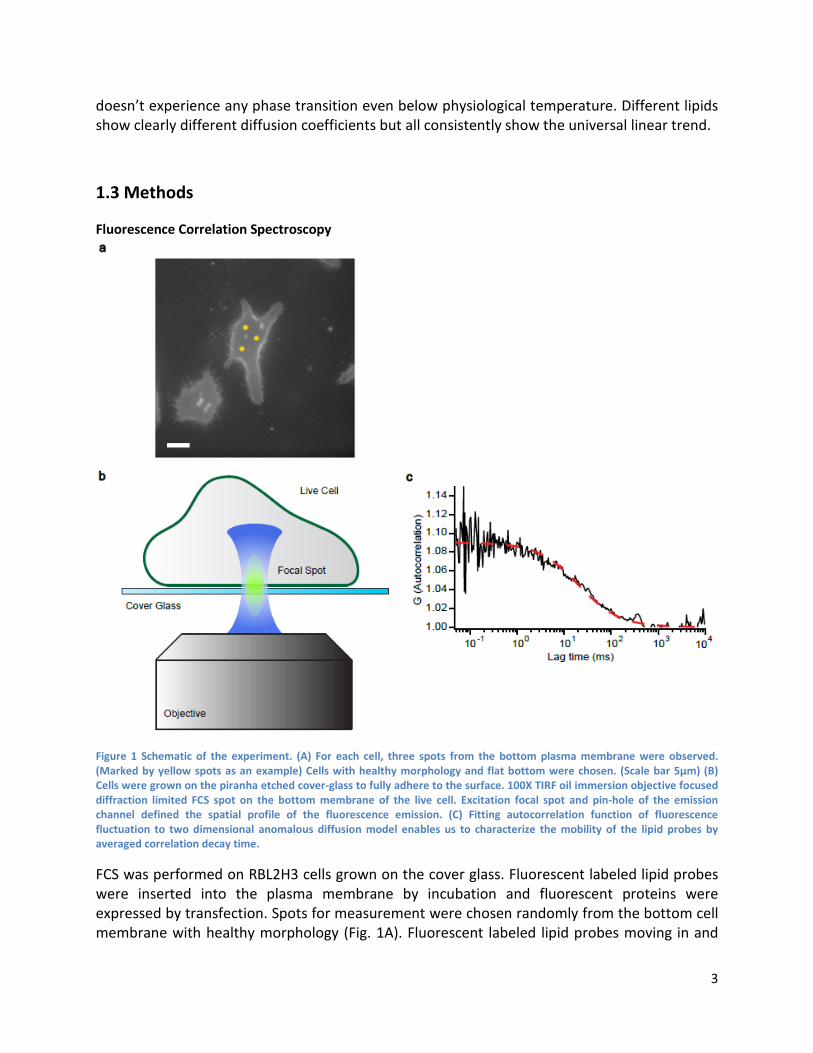
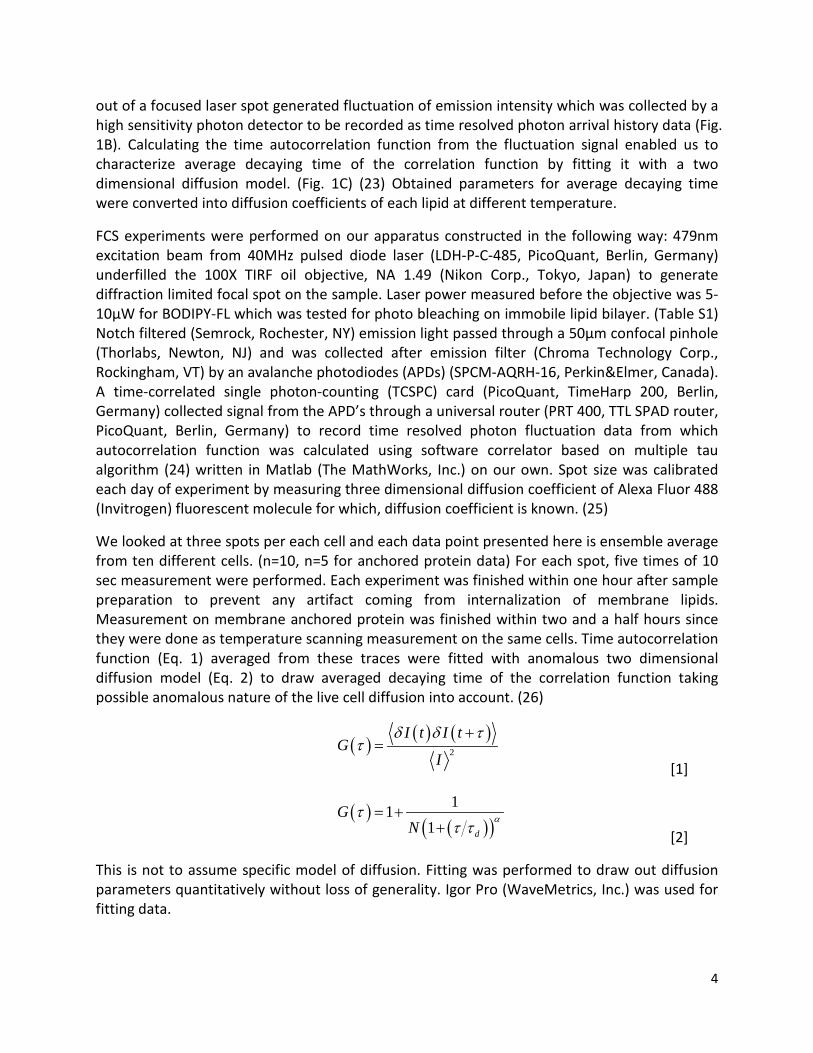
Figure 1 Schematic of the experiment. (A) For each cell, three spots from the bottom plasma membrane were observed. (Marked by yellow spots as an example) Cells with healthy morphology and flat bottom were chosen. (Scale bar 5μm) (B) Cells were grown on the piranha etched cover-glass to fully adhere to the surface. 100X TIRF oil immersion objective focused diffraction limited FCS spot on the bottom membrane of the live cell. Excitation focal spot and pin-hole of the emission channel defined the spatial profile of the fluorescence emission. (C) Fitting autocorrelation function of fluorescence fluctuation to two dimensional anomalous diffusion model enables us to characterize the mobility of the lipid probes by averaged correlation decay time.
FCS was performed on RBL2H3 cells grown on the cover glass. Fluorescent labeled lipid probes were inserted into the plasma membrane by incubation and fluorescent proteins were expressed by transfection. Spots for measurement were chosen randomly from the bottom cell membrane with healthy morphology (Fig. 1A). Fluorescent labeled lipid probes moving in and
4
out of a focused laser spot generated fluctuation of emission intensity which was collected by a high sensitivity photon detector to be recorded as time resolved photon arrival history data (Fig. 1B). Calculating the time autocorrelation function from the fluctuation signal enabled us to characterize average decaying time of the correlation function by fitting it with a two dimensional diffusion model. (Fig. 1C) (23) Obtained parameters for average decaying time were converted into diffusion coefficients of each lipid at different temperature.
FCS experiments were performed on our apparatus constructed in the following way: 479nm excitation beam from 40MHz pulsed diode laser (LDH-P-C-485, PicoQuant, Berlin, Germany) underfilled the 100X TIRF oil objective, NA 1.49 (Nikon Corp., Tokyo, Japan) to generate diffraction limited focal spot on the sample. Laser power measured before the objective was 5-10μW for BODIPY-FL which was tested for photo bleaching on immobile lipid bilayer. (Table S1) Notch filtered (Semrock, Rochester, NY) emission light passed through a 50μm confocal pinhole (Thorlabs, Newton, NJ) and was collected after emission filter (Chroma Technology Corp., Rockingham, VT) by an avalanche photodiodes (APDs) (SPCM-AQRH-16, Perkin&Elmer, Canada). A time-correlated single photon-counting (TCSPC) card (PicoQuant, TimeHarp 200, Berlin, Germany) collected signal from the APD’s through a universal router (PRT 400, TTL SPAD router, PicoQuant, Berlin, Germany) to record time resolved photon fluctuation data from which autocorrelation function was calculated using software correlator based on multiple tau algorithm (24) written in Matlab (The MathWorks, Inc.) on our own. Spot size was calibrated each day of experiment by measuring three dimensional diffusion coefficient of Alexa Fluor 488 (Invitrogen) fluorescent molecule for which, diffusion coefficient is known. (25)
We looked at three spots per each cell and each data point presented here is ensemble average from ten different cells. (n=10, n=5 for anchored protein data) For each spot, five times of 10 sec measurement were performed. Each experiment was finished within one hour after sample preparation to prevent any artifact coming from internalization of membrane lipids. Measurement on membrane anchored protein was finished within two and a half hours since they were done as temperature scanning measurement on the same cells. Time autocorrelation function (Eq. 1) averaged from these traces were fitted with anomalous two dimensional diffusion model (Eq. 2) to draw averaged decaying time of the correlation function taking possible anomalous nature of the live cell diffusion into account. (26)
[1]
[2]
This is not to assume specific model of diffusion. Fitting was performed to draw out diffusion parameters quantitatively without loss of generality. Igor Pro (WaveMetrics, Inc.) was used for fitting data.
( ) ( ) ( )2
I t I tG
I
δ δ ττ
+=
( )( )( )11
1 d
GN
αττ τ
= ++
5
Temperature was controlled by Peltier based temperature controlling device (Physitemp Instruments, Inc., Warner Instruments, LLC) that directly regulate temperature of the sample mounted in the microscope. (Nikon Corp., Tokyo, Japan) Enough time was given for temperature to be stabilized before the measurement.
Supported lipid bilayer for control experiment was prepared following (27). 0.005mol% BODIPY-FL C12HPC in DOPC vesicles were prepared by extrusion. SLB was formed by smack and smear method on piranha etched cover glasses.
Insertion of fluorescence labeled lipids into the live cell membrane Fluorescent labeled lipid probes and DiI lipid analogue were inserted into the cell membrane by incubating cells with BSA coupled labeling solution in buffer as described in (3, 18, 28). All fluorescent labeled lipids were labeled with identical fluorescent probe BODIPY-FL. Fluorescent lipid probes and DiI lipid analogue used are BODIPY FL C12-sphingomyelin, BODIPY FL C5-ganglioside GM1, BODIPY FL DHPE, β-BODIPY FL C12-HPC, DiIC12(3) and DiIC18(3) from Invitrogen.
Cloning and Cell Culture/Transfection of anchored GFP fusion proteins Anchored fluorescent protein constructs were prepared as previously described (Triffo et al, in preparation). Anchored fluorescent protein constructs were subcloned into the pN1 vector with a strong CMVIE promoter. Full-length and truncated CSrc gene was obtained from Addgene (). LCK-NT-GFP and GFP-GPI-CT genes were gifts from Dr. Björn Lillemeier and Dr. Mark Davis (Stanford). All oligonucleotides were synthesized by Elim Bioscience (Fremont, CA) and sequenced by Elim Bioscience.
Jurkat T cells were cultured in RPMI1640 medium (Gibco) supplemented with 1mM sodium pyruvate (Cellgro), 100 µg/mL Penicillin/Streptomycin (Cellgro), and 10% fetal bovine serum (FBS, Atlanta Biologicals). Cells were passaged every two to three days by seeding ~106 cells in 5 mL media in a T-25 cell culture flask and were disposed of after ~15 passages. Cells were transiently transfected 1 day before the experiment by seeding 106 Jurkat cells in 2.5 mL Jurkat media and adding transfection mixture of 2.5 µg plasmid DNA mixed with 250 µl Opti-MEM I and 10 µl Lipofectamine 2000 transfection reagent (Invitrogen) incubated at room temperature for 30 min. Transfected cells were incubated at 37˚ C, 5% CO2 for ~10-16 hours before the FCCS experiment.
To prepare transfected Jurkat cells for data acquisition, cell culture media was exchanged twice with 5 mL PBS, pH 7.4 prewarmed to 37˚ C, by centrifuge (5 min, 250 rcf) and resuspended in 500 µl HEPES buffered saline (pH 7.2) prewarmed to 37˚ C and deposited on poly-L-lysine coated #1 coverglass (P-L-L, Sigma) enclosed in a metal imaging chamber. Cells were allowed at least 15 min in the incubator in order to settle and adhere to the P-L-L coated coverslips.
6
Lifetime measurement Lifetime measurement was performed with same scheme as FCS with two photon excitation. 10 second of data collection from each spot provided enough signal to noise ratio to draw out fluorescence lifetime. 730nm, 80MHz, 100fs pulsed Titanium:Sapphire laser (Mai Tai HP; Newport Corp, Mountain View, CA) was used as excitation source. Power before the objective was less than 3mW which was also checked for photo bleaching with immobile lipid bilayer. Data analysis was done by using the SymphoTime software (SymphoTime 5.1.3, PicoQuant, Berlin, Germany). Fitting with Impulse Response Function (IRF) convoluted lifetime histogram as shown in (Fig. 3) was performed for histogram from each spot. GPMV was prepared following (2, 29).
FCS Simulation Two dimensional Monte-Carlo simulations were performed to obtain FCS data with existence of nano scale miscibility transition. The way data collected and analyzed was same as the real experimental case but the sample in this case was virtual fluorescent particles under the influence of background terrain or dynamic fluctuation of two different phases. Matlab(The MathWorks, Inc.) was used as a software platform for all simulations described here.
1st order miscibility transition simulation was performed following the method from (19). At each unit time step, virtual fluorescent particles performed random walks with step size drawn by Gaussian random number generator. At higher temperature, mean unit step size was increased as linear function of temperature. For phase separated case, particles were given different probability for crossing in and out of the domains which was determined by Boltzmann distribution law. We used exact absolute temperature scaling similar to actual experimental temperature range to calculate Boltzmann relation while temperature used to determine mobility was scaled separately. This is because diffusion in lipid bilayer system doesn’t follow linear scaling that has intercept of zero at absolute zero so using exact absolute scale overestimates the mobility. We scaled mobility in a way that they were comparable to general scaling of actual two dimensional lipid diffusion with negative intercept. Particles were set to move three times faster within the domains. (30) Phase separated terrain was set below the transition temperature of 1.0 then from 1.0 of transition temperature, homogeneous background was assumed. (Fig. 4)
2nd order miscibility transition simulation was performed on general two dimensional Ising model following the Kawasaki dynamics similar to (31). Small fraction of up spins was assumed to be fluorescent particles. Down spin particles are chosen three times more often than up spin particles which effectively slowed down the up spin particles. Systems were equilibrated by randomly exchanging spins from any region for enough number of steps to equilibrate the system then Kawasaki spin exchange of neighbors were started which was considered as time zero. Spatial resolution of Kawasaki dynamics wasn’t as high as the 1st order transition simulation due to heavy calculation amount of Kawasaki dynamics but the mobility could be sampled out reasonably well with correct simulation of binary fluctuation. 1st order case could be reproduced by Kawasaki dynamics as well. Temperature scaling for mobility and inter
7
particle interaction energy was done same as the 1st order transition simulation. Background template was introduced to simulation the near critical fluctuation of the Ising model under the influence of small perturbations. Certain regular positions of the system were assumed to have very favorable interaction with up spin particles so effectively up spin particles occupied those positions. They could still exchange particles with neighboring up spin particles.
Fluorescence intensity fluctuation was collected by assuming virtual two dimensional Gaussian excitation spot. Fluorescent particles generated intensity based on Gaussian profile near the excitation spot position which was randomly determined. Summed overall intensity at a unit time was then collected assuming Poisson distribution of detection intensity. Details on parameters used and more figures on simulated systems are given in supporting information.
1.4 Result
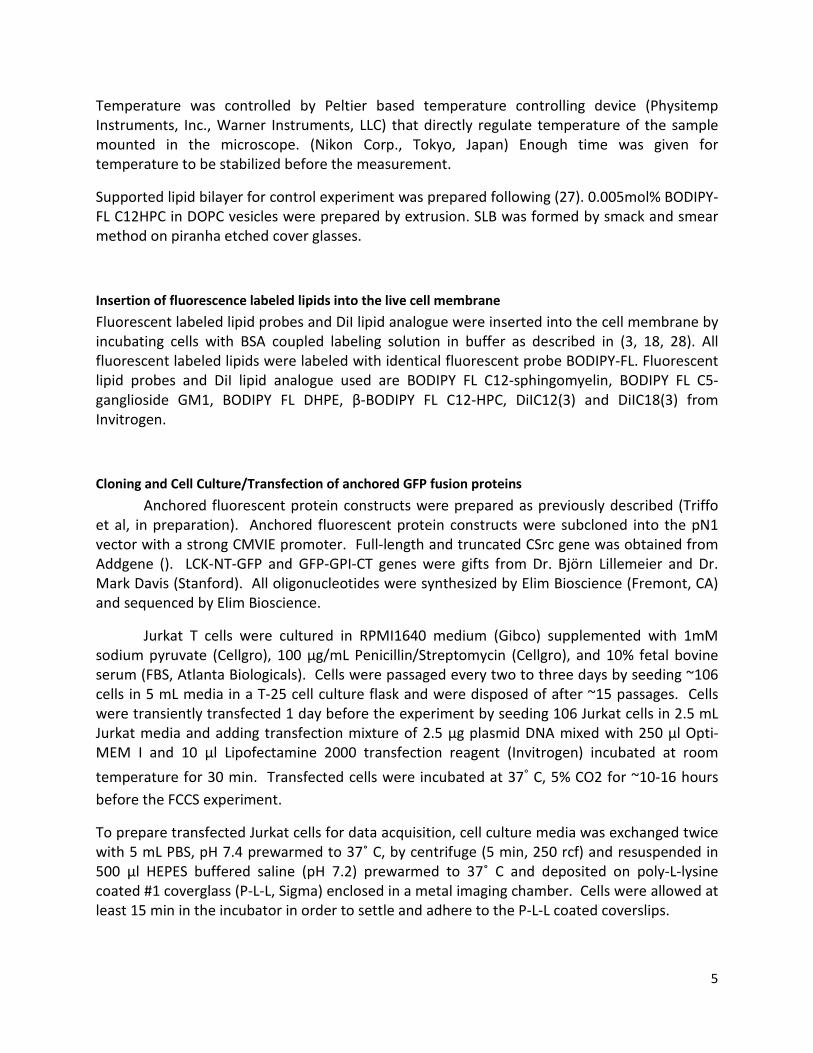
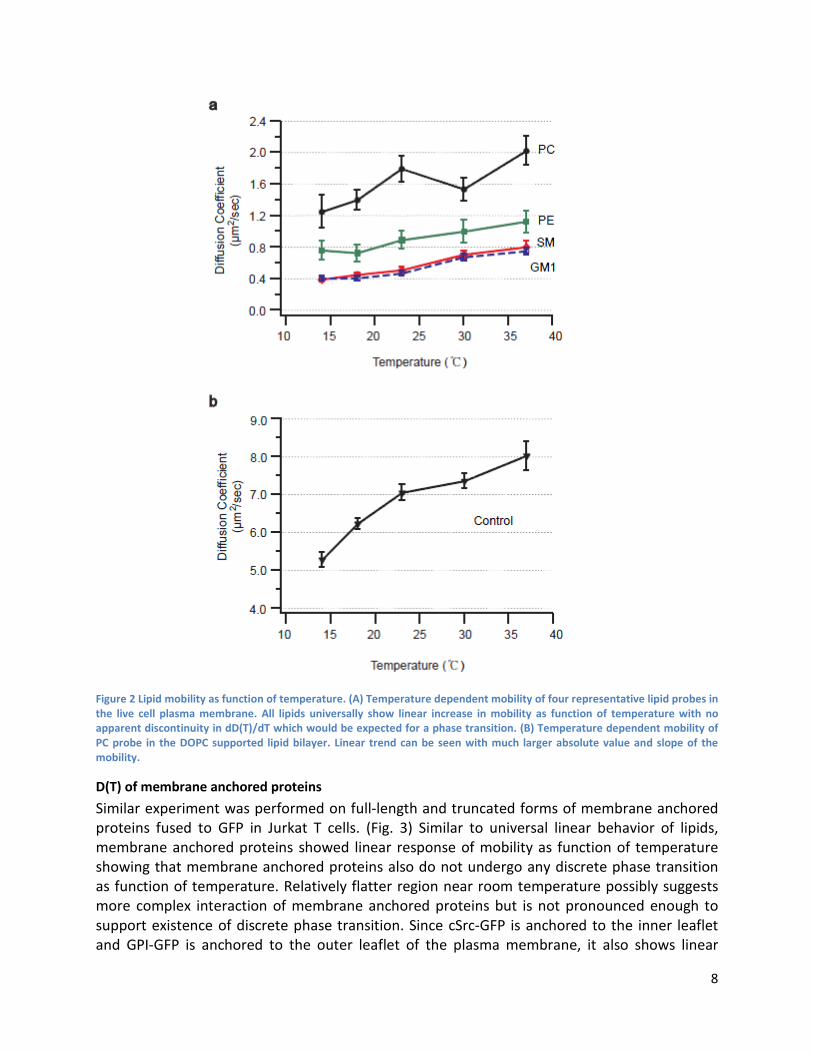
Temperature dependent FCS Diffusion coefficients of four representative lipids as function of temperature measured from ensemble of cells is shown in (Fig. 2A). Distribution of the value is originating from both experimental error and heterogeneous nature of the living cell membrane which is more pronounced in phosphatydilcholine (PC) behavior. (Fig. S4) Complex nature of living cell membrane results in pretty wide distribution of correlation decay time compared with narrow distribution of supported lipid membrane control experiment but ensemble average value is reproducible showing clear trend. Four different lipids show same linear trend with absolute value of diffusion coefficient varying from 0.2 to around 1.0 ㎛ 2/sec. It is clear all membrane species diffuse faster at higher temperature and they behave as it would be expected for general particle systems following Einstein-Stokes type behavior. (32) It should be noted that lipids are experiencing more complicated environment that cannot be fully described by simple Brownian motion noticing clear difference in absolute value of diffusion parameters for different species with similar molecular weight and structure. As it is already known, sphingomyelin (SM) and GM1 show relatively slower diffusion compared to PC and phosphoethanolamine (PE). (18, 19) Fitting this data with linear fit shows that difference in slope is not significant. (Table S2) Rather, systematic offsets between different lipid species stay constant at different temperature. Supplementary information contains similar D(T) measurements performed on different cell line with different fluorescent analogue measured by two photon FCS. (Fig. S1)
Control supported lipid bilayer (SLB) formed on clean glass substrate show expected linear trend with much larger diffusion coefficient. (33) This is correctly capturing the nature of SLB diffusion in which fluorescent lipid probe is undergoing free two dimensional Brownian motion driven by thermal fluctuation without the presence of diffusion barriers. Same setup was used to probe two dimensional diffusion of same fluorescent BODIPY-FL for both SLB control experiment and live cell measurement. From this control experiment we confirm that the temperature dependent FCS is correctly capturing two dimensional mobility with no bias.
8
Figure 2 Lipid mobility as function of temperature. (A) Temperature dependent mobility of four representative lipid probes in the live cell plasma membrane. All lipids universally show linear increase in mobility as function of temperature with no apparent discontinuity in dD(T)/dT which would be expected for a phase transition. (B) Temperature dependent mobility of PC probe in the DOPC supported lipid bilayer. Linear trend can be seen with much larger absolute value and slope of the mobility.
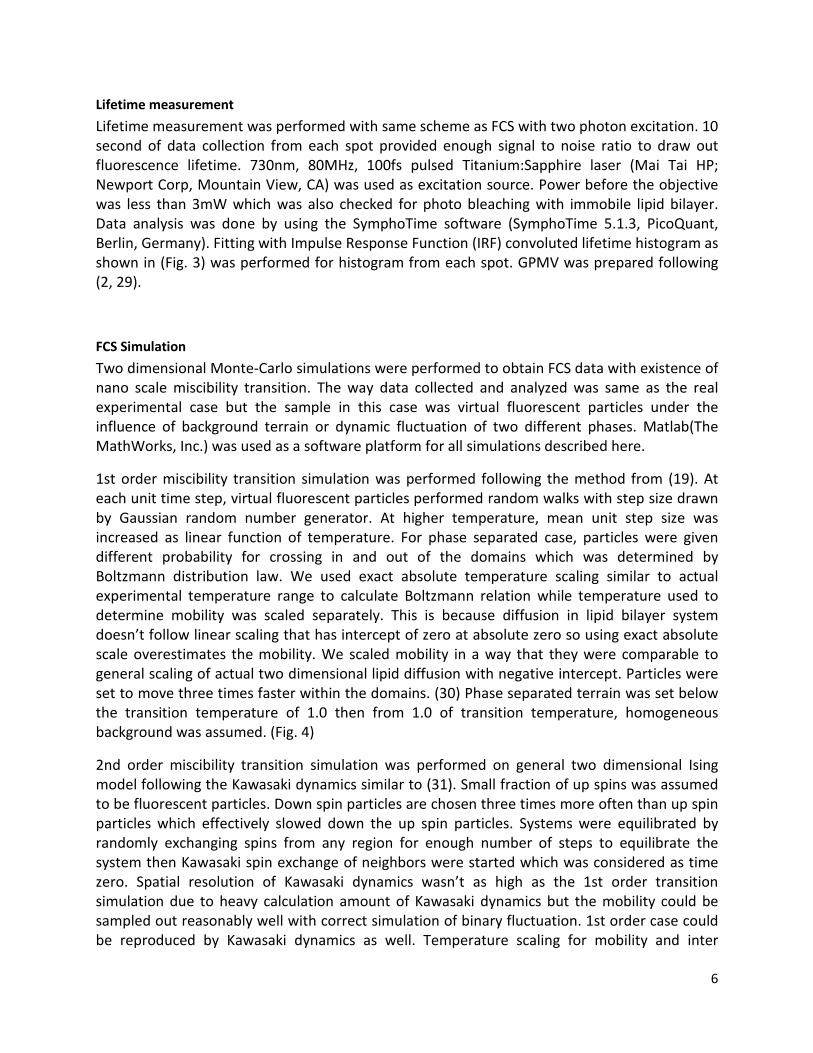
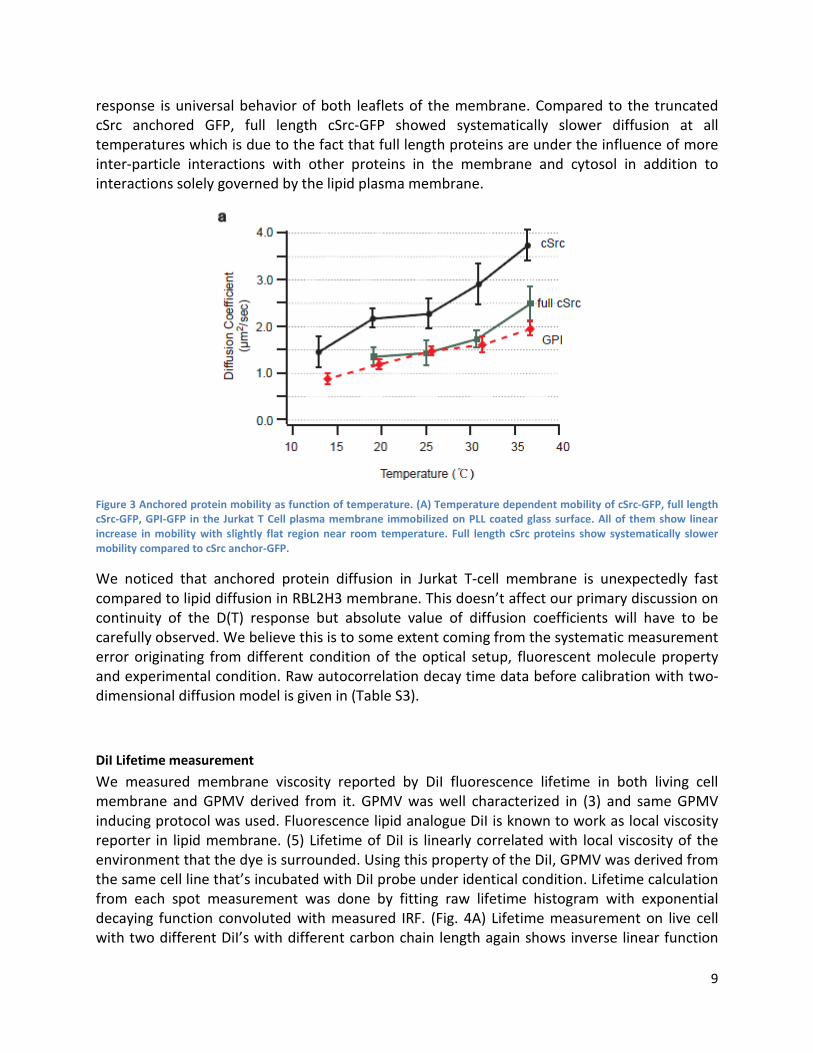
D(T) of membrane anchored proteins Similar experiment was performed on full-length and truncated forms of membrane anchored proteins fused to GFP in Jurkat T cells. (Fig. 3) Similar to universal linear behavior of lipids, membrane anchored proteins showed linear response of mobility as function of temperature showing that membrane anchored proteins also do not undergo any discrete phase transition as function of temperature. Relatively flatter region near room temperature possibly suggests more complex interaction of membrane anchored proteins but is not pronounced enough to support existence of discrete phase transition. Since cSrc-GFP is anchored to the inner leaflet and GPI-GFP is anchored to the outer leaflet of the plasma membrane, it also shows linear
9
response is universal behavior of both leaflets of the membrane. Compared to the truncated cSrc anchored GFP, full length cSrc-GFP showed systematically slower diffusion at all temperatures which is due to the fact that full length proteins are under the influence of more inter-particle interactions with other proteins in the membrane and cytosol in addition to interactions solely governed by the lipid plasma membrane.
Figure 3 Anchored protein mobility as function of temperature. (A) Temperature dependent mobility of cSrc-GFP, full length cSrc-GFP, GPI-GFP in the Jurkat T Cell plasma membrane immobilized on PLL coated glass surface. All of them show linear increase in mobility with slightly flat region near room temperature. Full length cSrc proteins show systematically slower mobility compared to cSrc anchor-GFP.
We noticed that anchored protein diffusion in Jurkat T-cell membrane is unexpectedly fast compared to lipid diffusion in RBL2H3 membrane. This doesn’t affect our primary discussion on continuity of the D(T) response but absolute value of diffusion coefficients will have to be carefully observed. We believe this is to some extent coming from the systematic measurement error originating from different condition of the optical setup, fluorescent molecule property and experimental condition. Raw autocorrelation decay time data before calibration with two-dimensional diffusion model is given in (Table S3).
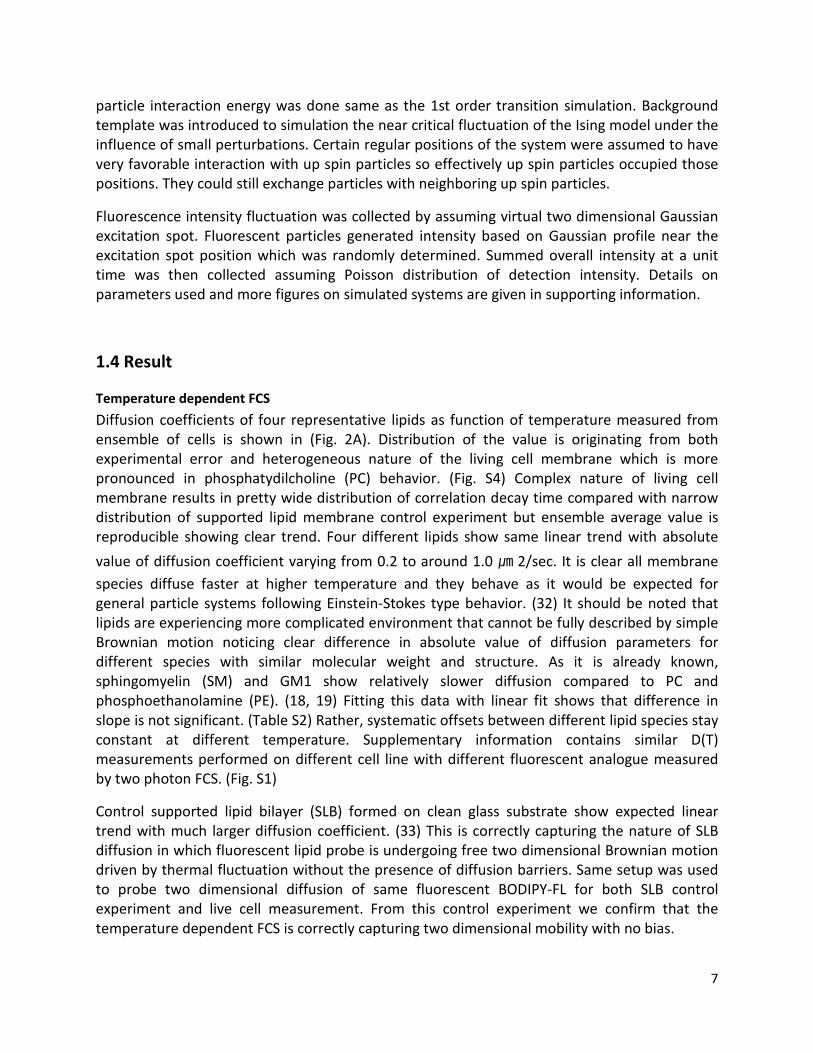
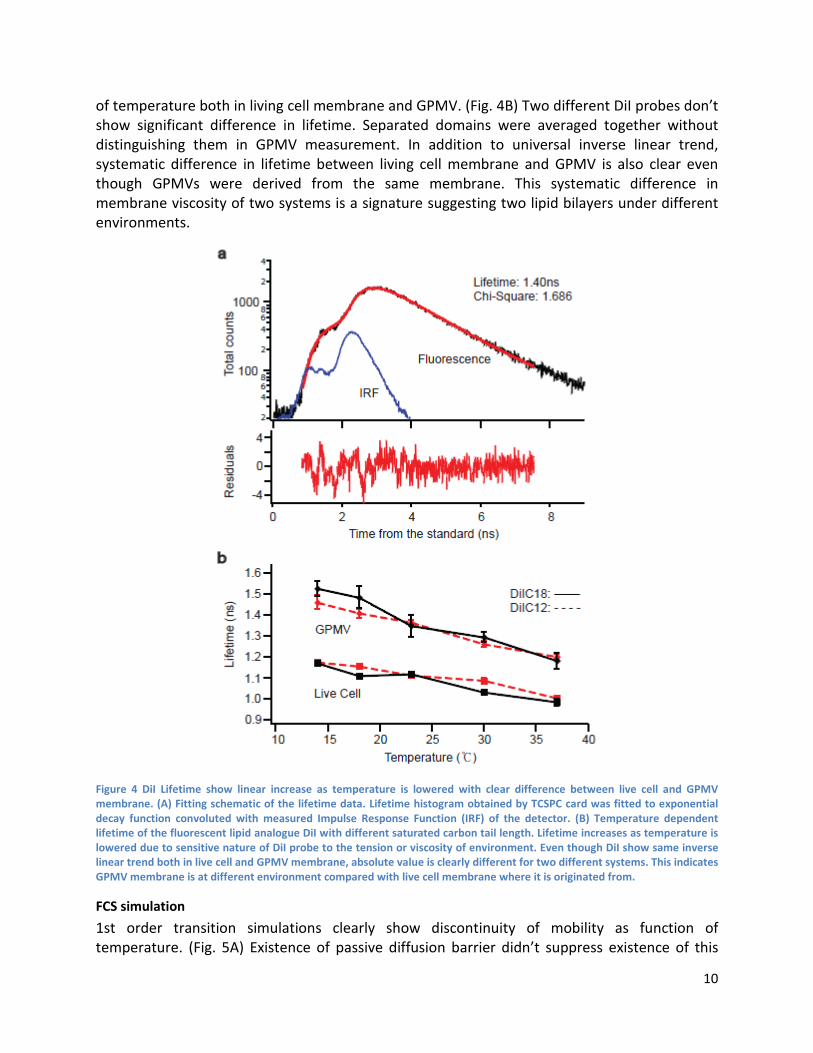
DiI Lifetime measurement We measured membrane viscosity reported by DiI fluorescence lifetime in both living cell membrane and GPMV derived from it. GPMV was well characterized in (3) and same GPMV inducing protocol was used. Fluorescence lipid analogue DiI is known to work as local viscosity reporter in lipid membrane. (5) Lifetime of DiI is linearly correlated with local viscosity of the environment that the dye is surrounded. Using this property of the DiI, GPMV was derived from the same cell line that’s incubated with DiI probe under identical condition. Lifetime calculation from each spot measurement was done by fitting raw lifetime histogram with exponential decaying function convoluted with measured IRF. (Fig. 4A) Lifetime measurement on live cell with two different DiI’s with different carbon chain length again shows inverse linear function
10
of temperature both in living cell membrane and GPMV. (Fig. 4B) Two different DiI probes don’t show significant difference in lifetime. Separated domains were averaged together without distinguishing them in GPMV measurement. In addition to universal inverse linear trend, systematic difference in lifetime between living cell membrane and GPMV is also clear even though GPMVs were derived from the same membrane. This systematic difference in membrane viscosity of two systems is a signature suggesting two lipid bilayers under different environments.
Figure 4 DiI Lifetime show linear increase as temperature is lowered with clear difference between live cell and GPMV membrane. (A) Fitting schematic of the lifetime data. Lifetime histogram obtained by TCSPC card was fitted to exponential decay function convoluted with measured Impulse Response Function (IRF) of the detector. (B) Temperature dependent lifetime of the fluorescent lipid analogue DiI with different saturated carbon tail length. Lifetime increases as temperature is lowered due to sensitive nature of DiI probe to the tension or viscosity of environment. Even though DiI show same inverse linear trend both in live cell and GPMV membrane, absolute value is clearly different for two different systems. This indicates GPMV membrane is at different environment compared with live cell membrane where it is originated from.
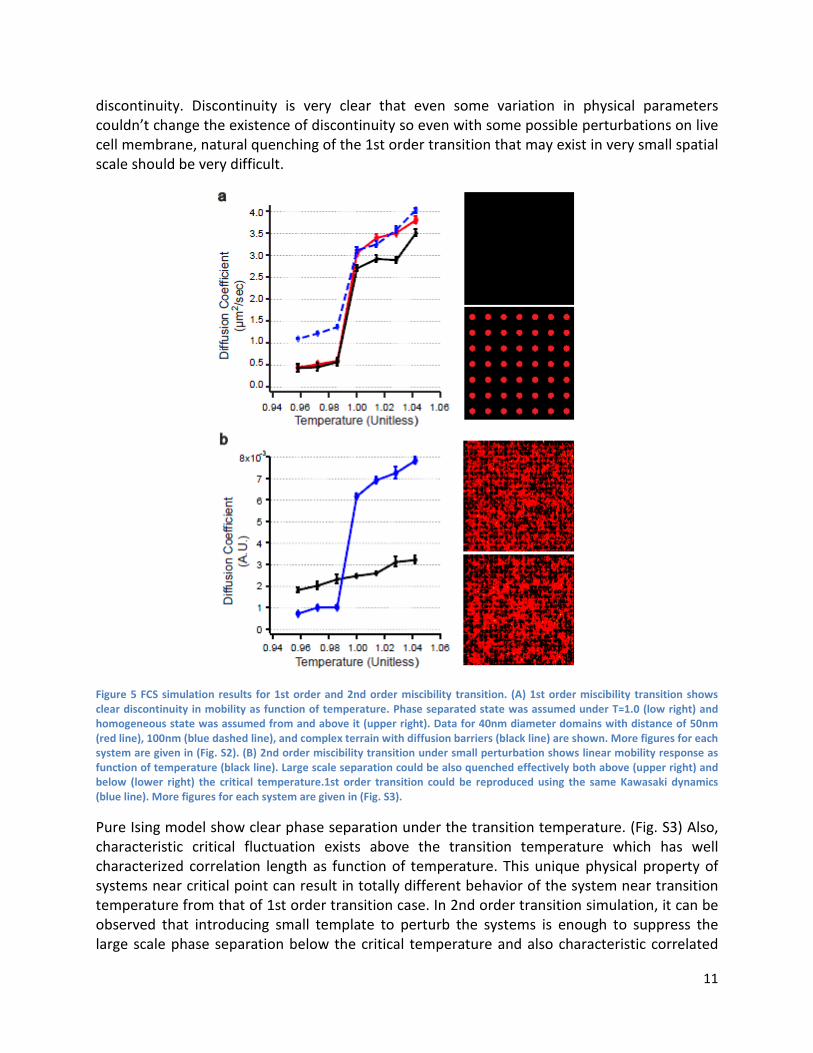
FCS simulation 1st order transition simulations clearly show discontinuity of mobility as function of temperature. (Fig. 5A) Existence of passive diffusion barrier didn’t suppress existence of this
11
discontinuity. Discontinuity is very clear that even some variation in physical parameters couldn’t change the existence of discontinuity so even with some possible perturbations on live cell membrane, natural quenching of the 1st order transition that may exist in very small spatial scale should be very difficult.
Figure 5 FCS simulation results for 1st order and 2nd order miscibility transition. (A) 1st order miscibility transition shows clear discontinuity in mobility as function of temperature. Phase separated state was assumed under T=1.0 (low right) and homogeneous state was assumed from and above it (upper right). Data for 40nm diameter domains with distance of 50nm (red line), 100nm (blue dashed line), and complex terrain with diffusion barriers (black line) are shown. More figures for each system are given in (Fig. S2). (B) 2nd order miscibility transition under small perturbation shows linear mobility response as function of temperature (black line). Large scale separation could be also quenched effectively both above (upper right) and below (lower right) the critical temperature.1st order transition could be reproduced using the same Kawasaki dynamics (blue line). More figures for each system are given in (Fig. S3).
Pure Ising model show clear phase separation under the transition temperature. (Fig. S3) Also, characteristic critical fluctuation exists above the transition temperature which has well characterized correlation length as function of temperature. This unique physical property of systems near critical point can result in totally different behavior of the system near transition temperature from that of 1st order transition case. In 2nd order transition simulation, it can be observed that introducing small template to perturb the systems is enough to suppress the large scale phase separation below the critical temperature and also characteristic correlated
12
fluctuation above the critical temperature. (Fig. S3) This case, mobility of virtual up spin particles shows linear response as function of temperature with no clear discontinuity or change in slope. (Fig. 5B) It means with small perturbation, 2nd order miscibility transition can be quenched down to a nanometer spatial scale while effectively making mobility as function of temperature linear as if they were following the Einstein Stokes relation. This can also be interpreted as small perturbation effectively lowers the miscibility transition temperature by introducing additional component to the total energy of the system since we do observe the system eventually becomes segregated under the range we looked at. 2nd order transition from finely emulsified state to perturbed critical fluctuation would still result in discontinuity following the blue line below temperature of 1.0 then following the black line from 1.0 in (Fig. 5B). It suggests existence of discontinuity in mobility is generally expected for membranes undergoing miscibility transition while 2nd order case can possibly show more complicated behavior.
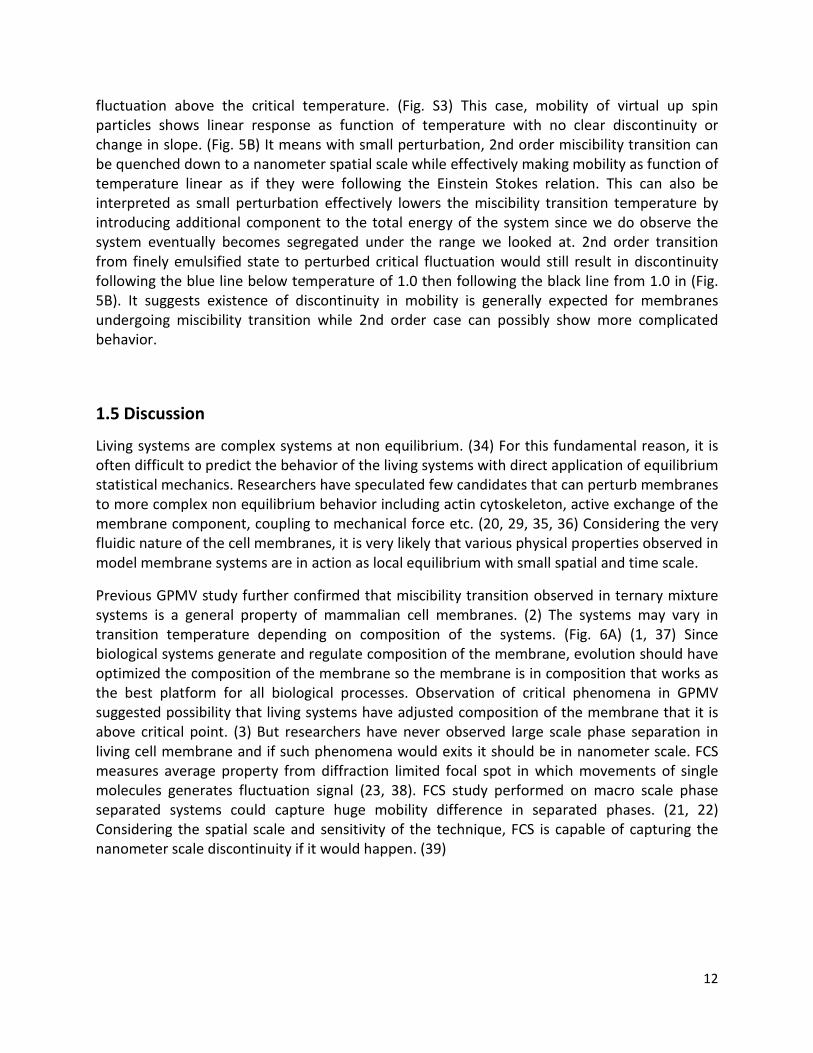
1.5 Discussion
Living systems are complex systems at non equilibrium. (34) For this fundamental reason, it is often difficult to predict the behavior of the living systems with direct application of equilibrium statistical mechanics. Researchers have speculated few candidates that can perturb membranes to more complex non equilibrium behavior including actin cytoskeleton, active exchange of the membrane component, coupling to mechanical force etc. (20, 29, 35, 36) Considering the very fluidic nature of the cell membranes, it is very likely that various physical properties observed in model membrane systems are in action as local equilibrium with small spatial and time scale.
Previous GPMV study further confirmed that miscibility transition observed in ternary mixture systems is a general property of mammalian cell membranes. (2) The systems may vary in transition temperature depending on composition of the systems. (Fig. 6A) (1, 37) Since biological systems generate and regulate composition of the membrane, evolution should have optimized the composition of the membrane so the membrane is in composition that works as the best platform for all biological processes. Observation of critical phenomena in GPMV suggested possibility that living systems have adjusted composition of the membrane that it is above critical point. (3) But researchers have never observed large scale phase separation in living cell membrane and if such phenomena would exits it should be in nanometer scale. FCS measures average property from diffraction limited focal spot in which movements of single molecules generates fluctuation signal (23, 38). FCS study performed on macro scale phase separated systems could capture huge mobility difference in separated phases. (21, 22) Considering the spatial scale and sensitivity of the technique, FCS is capable of capturing the nanometer scale discontinuity if it would happen. (39)
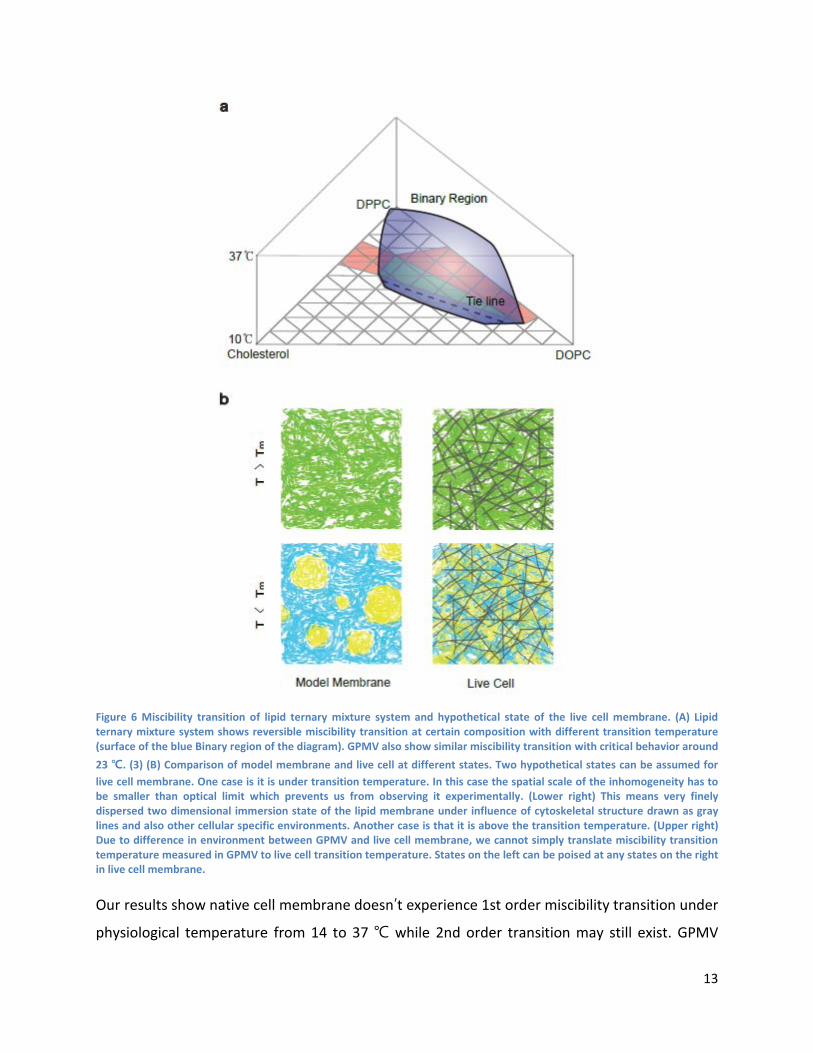
13
Figure 6 Miscibility transition of lipid ternary mixture system and hypothetical state of the live cell membrane. (A) Lipid ternary mixture system shows reversible miscibility transition at certain composition with different transition temperature (surface of the blue Binary region of the diagram). GPMV also show similar miscibility transition with critical behavior around 23 ℃. (3) (B) Comparison of model membrane and live cell at different states. Two hypothetical states can be assumed for live cell membrane. One case is it is under transition temperature. In this case the spatial scale of the inhomogeneity has to be smaller than optical limit which prevents us from observing it experimentally. (Lower right) This means very finely dispersed two dimensional immersion state of the lipid membrane under influence of cytoskeletal structure drawn as gray lines and also other cellular specific environments. Another case is that it is above the transition temperature. (Upper right) Due to difference in environment between GPMV and live cell membrane, we cannot simply translate miscibility transition temperature measured in GPMV to live cell transition temperature. States on the left can be poised at any states on the right in live cell membrane.
Our results show native cell membrane doesn’t experience 1st order miscibility transition under
physiological temperature from 14 to 37 ℃ while 2nd order transition may still exist. GPMV
14
miscibility transition data may not directly be translated into exactly the same transition temperature in live cell since they are in different environments as it was confirmed by DiI lifetime data. Different environments, possibly differential lateral pressure or electrophoretic force applied to the membrane, can alter the physical parameters. (40, 41) This can happen as establishment of new equilibrium just like water under different atmospheric pressure would have different boiling point. Various perturbations can lead cell membrane to different region in the phase diagram (41-45) meaning that active cellular components can regulate the environment so it can lead to any possible phases as depicted in (Fig. 6B)
Then it opens up some possibilities on where the actual live cell membrane is poised in the phase diagram as function of temperature. The most likely case from the observation and previous research is that in the range we looked at, live cell membrane is always above the critical temperature. If we guess by extrapolation of DiI lifetime of live cell, miscibility transition temperature that was near room temperature in GPMV (3) would be positioned near 0 ℃ under the live cell environment. Being always under critical temperature is also possible since it can still result in consistent linear scaling of mobility but the system will have to prevent it to become phase separated in large scale at all physiologically relevant temperature range which can easily be costly. Near critical fluctuation gives some advantage in regulating the membrane organization since near critical fluctuation is very sensitive to outside perturbation. (7, 9, 10) So by various local perturbations the local membrane region can easily move back and forth in the phase diagram to fully use the energetic advantage that can be obtained from existence of binary immiscibility.
Description based on binary phase separation often provides us convenient and plausible way to rationalize clustering processes in the cell membrane which is major source where immiscibility becomes important in signaling studies. (4, 10, 16) But evidence of higher dimensional, orthogonal interactions beyond binary sorting is also emerging. (46) There exist other possible interactions that can lead to effective segregation of certain membrane species. (36, 41, 44, 47) Live cell should be using all these strategies simultaneously and in any case, existence of binary fluctuation should be affecting energetic of membrane molecules and vice versa. (48)
In physiological level, response of the living system to temperature change can be an important issue. (49) Continuous change of membrane property should provide more resistance to environmental temperature fluctuation in cellular level. This is to some extent, expected behavior since existence of discontinuous transition would challenge the cell to maintain regular behavior under change of environment.
Direct characterization of living cell systems is often difficult due to heterogeneous nature of the system. But direct live cell measurements should be very valuable which would provide us data to apply our knowledge obtained from various well controlled in vitro and in silico studies to the living systems which are our ultimate targets of interest. This research suggests systematic approach to obtain certain physical parameters as function of thermodynamic variables is possible in direct live cell measurements if inherent noise distribution can be statistically treated.
15
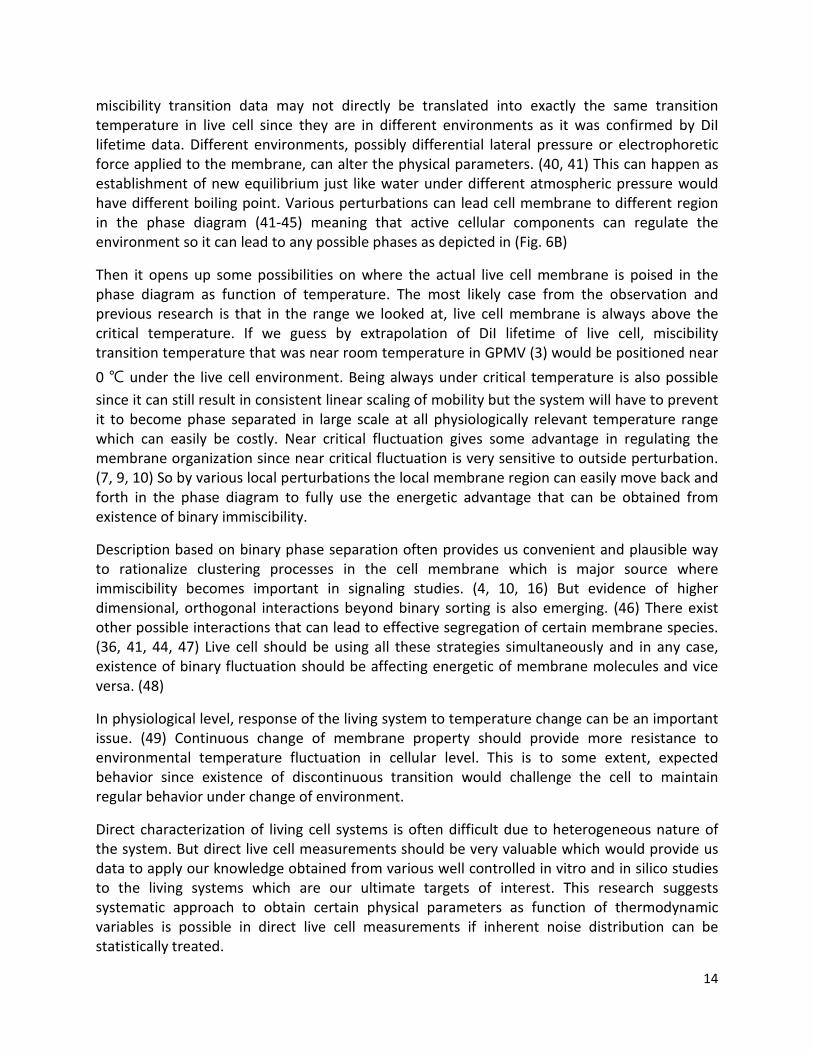
1.6 Conclusion
From these observations, we conclude that the lipids in the live cell membrane respond linearly to temperature change following predictable thermodynamic scaling without experiencing discrete phase transition below the physiological temperature. Anchored proteins also show very similar behavior. Nano scale discontinuity may exist in lower temperature close to 0 ℃ at
which we didn’t perform experiments. We assume 2nd order transition may exist in very special cases in the range we looked at since small perturbation can effectively generate linear response of the mobility quenching the large scale behavior. DiI viscosity suggests that the GPMV and live cell are at different environment and live cell critical temperature could be guessed to be near 0 ℃. It is worth noting that perturbation of homogeneous state resulting in non-equilibrium is enough to cause small and transient demixing which can possibly work as basis for membrane sorting processes. (36) This altering to cause membrane demixing should be even more pronounced in systems near spinoidal region. (9, 10) Large scale phase behavior in temperature region that’s practically not accessible is still meaningful as inherent property of the membrane including critical fluctuation. Proteins also deserve more attention as physical driving force for regulation of heterogeneous fluctuation of the membrane. (50, 51)
1.7 Supporting information
Supplementary tables Laser Wavelength Laser Power Bleaching Time Standard Deviation
BODIPY-FL 480 nm 0.01 mW 688.64 ms 172.25 ms
DiI 730 nm 10.0 mW 1515.45 ms 545.42 ms
Table S1: Photo-bleaching control experiment. Fluorescent dyes were immobilized by making DPPC SLB which is in immobile gel phase at room temperature. Shining the excitation laser generated photo-bleaching traces following exponential decay. Bleaching time is defined as the time the bleaching traces reach intensity that is 1/e of the initial intensity. Since most of the actual fluorescent tagged lipids showed less than 50 ms of autocorrelation decay time to diffuse through the excitation spot, contribution of photo-bleaching to the D(T) data should be negligible.
FL-SM FL-GM1 FL-PE FL-PC
a, intercept 0.0573 ± 0.0225 0.0617 ± 0.0217 0.211 ± 0.0773 0.433 ± 0.110
b, slope 0.00831 ± 0.00113 0.00748 ± 0.0000956 0.00807 ± 0.00319 0.0118 ± 0.00433
Table S2: Linear fit for the Fig. 2. Fitting was done by Igor using the linear equation y = a + bx weighted by the standard errors. Four different fluorescent lipid probes show similar slopes with clearly different intercept. Units are from Fig. 1.
16
Species Temp, (℃) τd (ms) Species Temp. (℃) τd (ms)
FLSM 37 14.4 (±1.40) FLPC 37 5.9(±0.44)
FLSM 30 16.0(±0.87) FLPC 30 10.3(±1.98)
FLSM 23 23.6(±2.07) FLPC 23 7.6(±1.73)
FLSM 18 21.7(±2.22) FLPC 18 12.1(±1.95)
FLSM 14 29.7(±6.18) FLPC 14 6.1(±3.71)
FLGM1 37 19.5(±1.27) FLPE 37 14.3(±2.89)
FLGM1 30 23.7(±1.36) FLPE 30 14.9(±2.96)
FLGM1 23 30.2(±3.89) FLPE 23 14.1(±0.92)
FLGM1 18 34.5(±3.48) FLPE 18 16.8(±2.95)
FLGM1 14 34.1(±1.08) FLPE 14 22.6(±2.99)
cSrc-GFP 37 3.7(±0.33) GPI-GFP 37 8.0(±0.63)
cSrc-GFP 31 4.7(±0.72) GPI-GFP 31 9.7(±0.99)
cSrc-GFP 25 6.0(±0.87) GPI-GFP 26 10.5(±0.72)
cSrc-GFP 19 6.3(±0.60) GPI-GFP 20 13.2(±1.19)
cSrc-GFP 13 9.4(±2.14) GPI-GFP 14 17.8(±2.35)
Full cSrc 37 5.8(±0.84)
Full cSrc 31 8.4(±0.90)
Full cSrc 25 10.1(±1.85)
Full cSrc 19 10.7(±1.53)
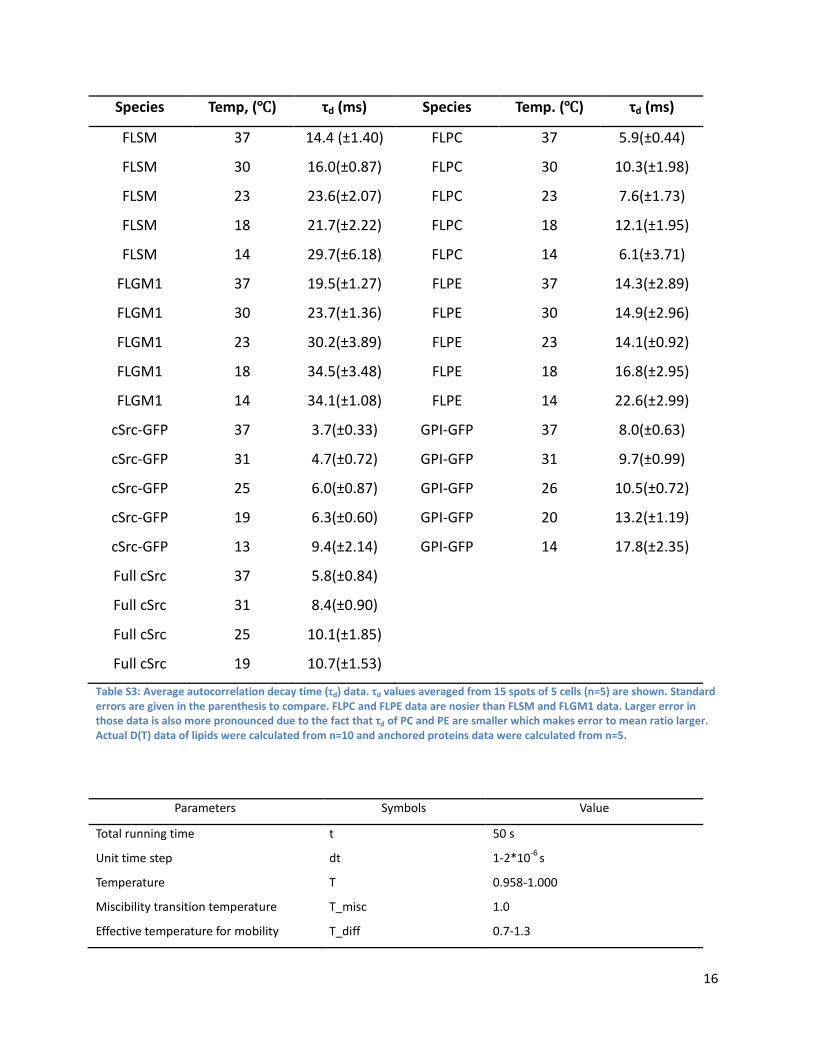
Table S3: Average autocorrelation decay time (τd) data. τd values averaged from 15 spots of 5 cells (n=5) are shown. Standard errors are given in the parenthesis to compare. FLPC and FLPE data are nosier than FLSM and FLGM1 data. Larger error in those data is also more pronounced due to the fact that τd of PC and PE are smaller which makes error to mean ratio larger. Actual D(T) data of lipids were calculated from n=10 and anchored proteins data were calculated from n=5.
Parameters Symbols Value
Total running time t 50 s
Unit time step dt 1-2*10-6 s
Temperature T 0.958-1.000
Miscibility transition temperature T_misc 1.0
Effective temperature for mobility T_diff 0.7-1.3
17
scaling
Number of fluorescent particles N 10
Simulation box side length sideL 5 μm
Macro-scale diffusion coefficient diff 3.0 * T_diff μm2 / s
Mean square displacement, one
dimensional
msd √(4.0 ∗ diff ∗ dt) √2⁄
Mean square displacement, one
dimensional within the domain
msd_d msd/3.0
Probability particles getting into the
domain
P_in 1.0
Probability particles escaping out of the
domain
P_out 1.0 when T ≥ T_misc;
exp(-(1.0-T)/T) when T < T_misc
Gaussian excitation beam waste w 0.5 μm
Intensity from particles at position (xi,yi)
detected by excitation at (x,y)
I � exp �−
2((xi − x)2 + (yi − y)2)w2 4.0⁄ �
i
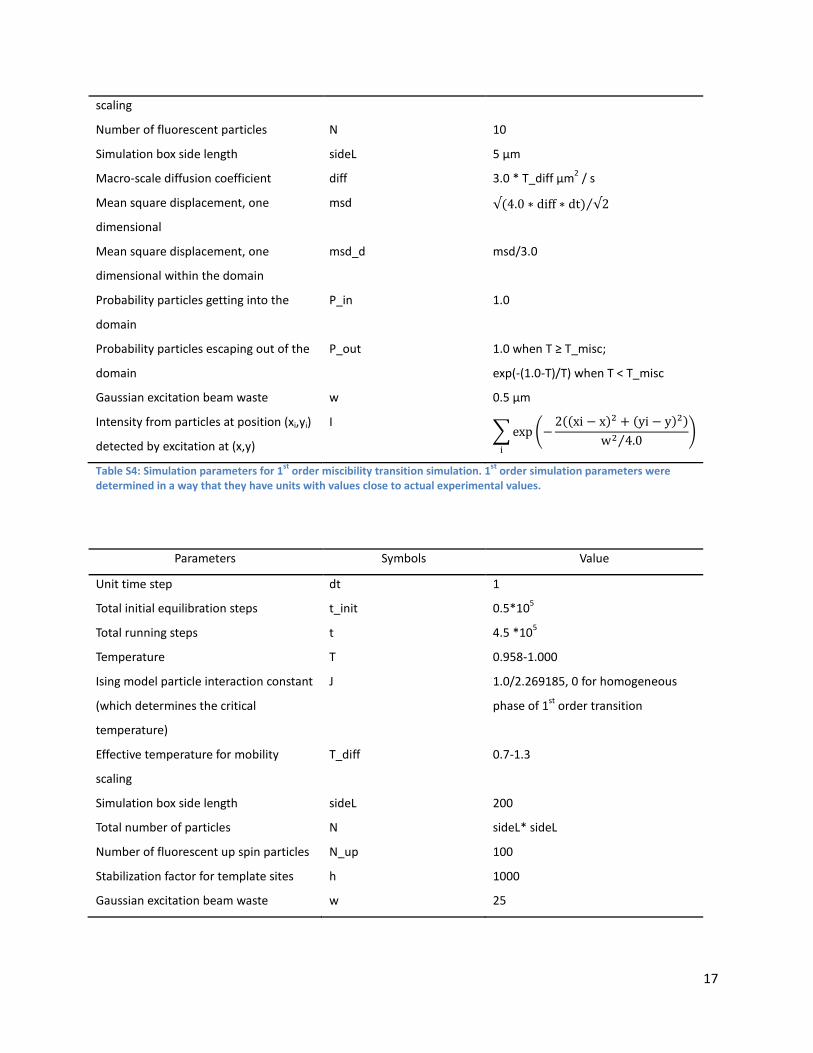
Table S4: Simulation parameters for 1st order miscibility transition simulation. 1st order simulation parameters were determined in a way that they have units with values close to actual experimental values.
Parameters Symbols Value
Unit time step dt 1
Total initial equilibration steps t_init 0.5*105
Total running steps t 4.5 *105
Temperature T 0.958-1.000
Ising model particle interaction constant
(which determines the critical
temperature)
J 1.0/2.269185, 0 for homogeneous
phase of 1st order transition
Effective temperature for mobility
scaling
T_diff 0.7-1.3
Simulation box side length sideL 200
Total number of particles N sideL* sideL
Number of fluorescent up spin particles N_up 100
Stabilization factor for template sites h 1000
Gaussian excitation beam waste w 25
18
Intensity from particles at position (xi,yi)
detected by excitation at (x,y)
I � exp �−
2((xi − x)2 + (yi − y)2)w2 4.0⁄ �
i
Spin of the particle i Si 1, -1
Total energy of the system H −� JSiSj − � hup spins at
template sitesi j
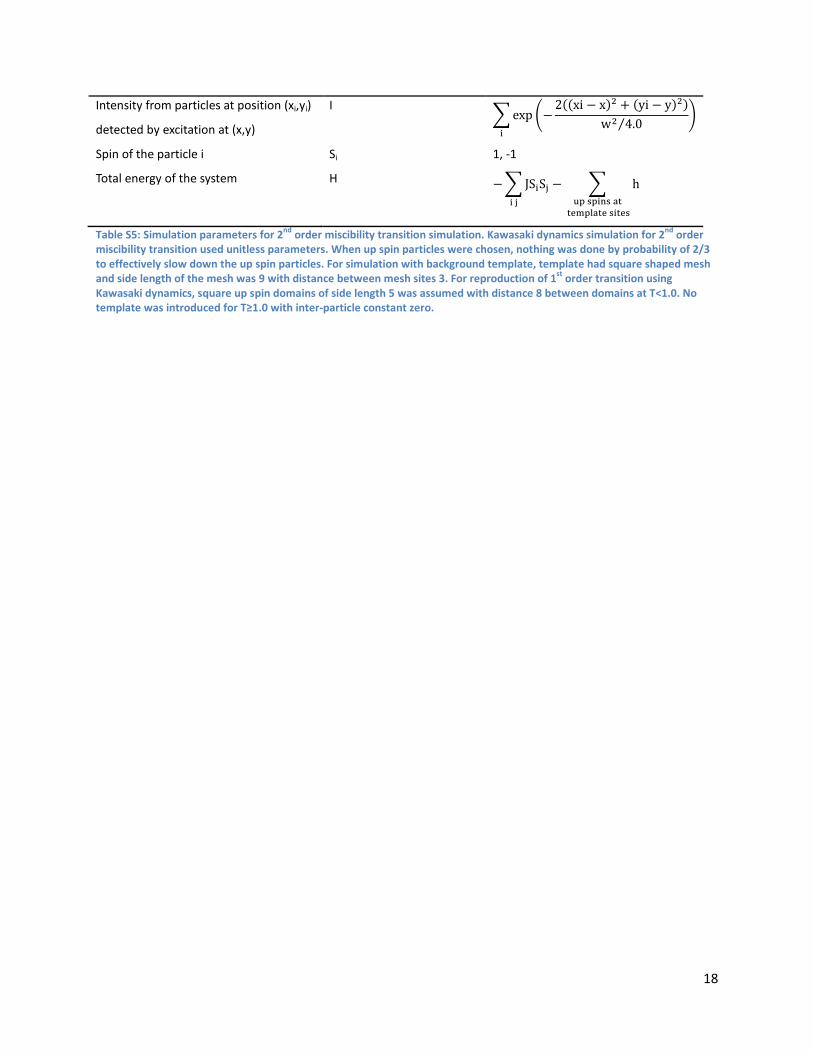
Table S5: Simulation parameters for 2nd order miscibility transition simulation. Kawasaki dynamics simulation for 2nd order miscibility transition used unitless parameters. When up spin particles were chosen, nothing was done by probability of 2/3 to effectively slow down the up spin particles. For simulation with background template, template had square shaped mesh and side length of the mesh was 9 with distance between mesh sites 3. For reproduction of 1st order transition using Kawasaki dynamics, square up spin domains of side length 5 was assumed with distance 8 between domains at T<1.0. No template was introduced for T≥1.0 with inter-particle constant zero.
19
Supplementary figures
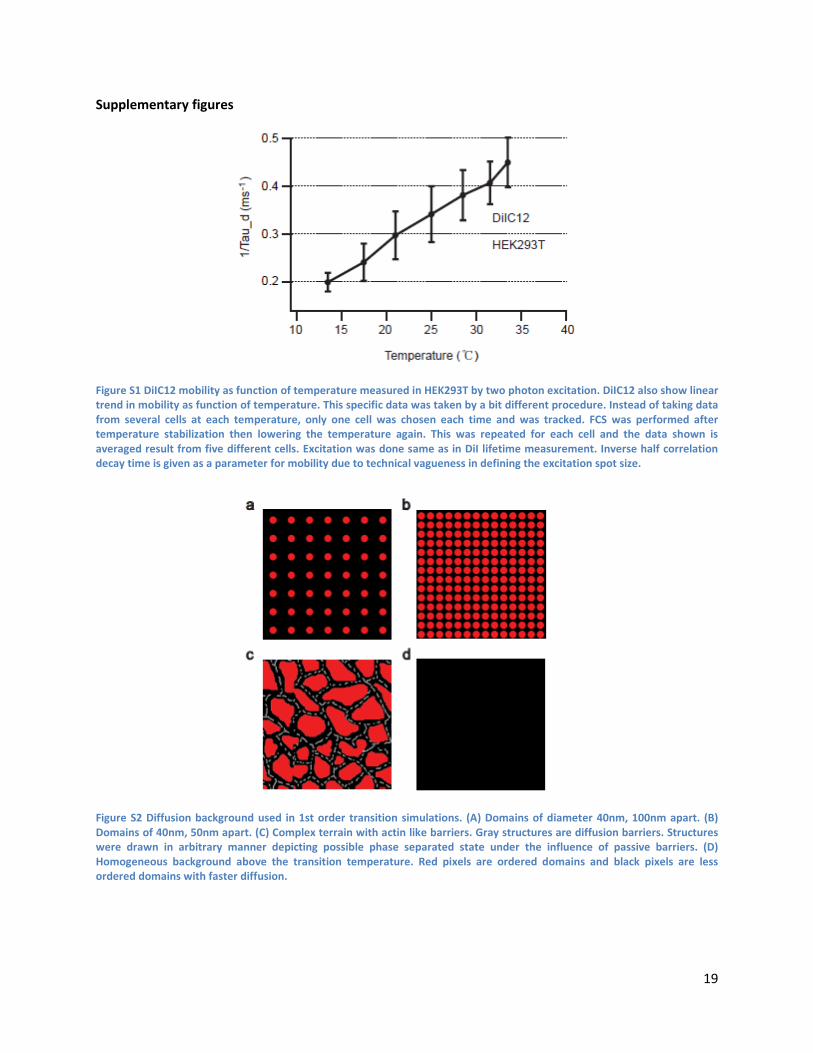
Figure S1 DiIC12 mobility as function of temperature measured in HEK293T by two photon excitation. DiIC12 also show linear trend in mobility as function of temperature. This specific data was taken by a bit different procedure. Instead of taking data from several cells at each temperature, only one cell was chosen each time and was tracked. FCS was performed after temperature stabilization then lowering the temperature again. This was repeated for each cell and the data shown is averaged result from five different cells. Excitation was done same as in DiI lifetime measurement. Inverse half correlation decay time is given as a parameter for mobility due to technical vagueness in defining the excitation spot size.
Figure S2 Diffusion background used in 1st order transition simulations. (A) Domains of diameter 40nm, 100nm apart. (B) Domains of 40nm, 50nm apart. (C) Complex terrain with actin like barriers. Gray structures are diffusion barriers. Structures were drawn in arbitrary manner depicting possible phase separated state under the influence of passive barriers. (D) Homogeneous background above the transition temperature. Red pixels are ordered domains and black pixels are less ordered domains with faster diffusion.
20
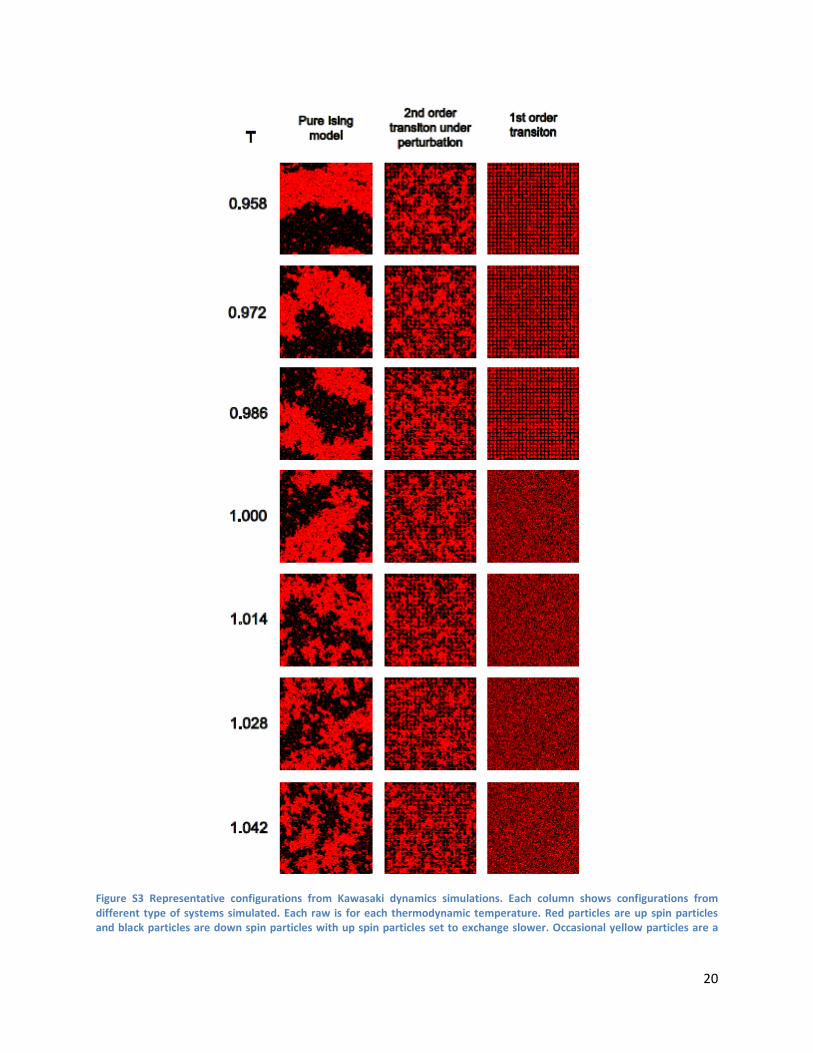
Figure S3 Representative configurations from Kawasaki dynamics simulations. Each column shows configurations from different type of systems simulated. Each raw is for each thermodynamic temperature. Red particles are up spin particles and black particles are down spin particles with up spin particles set to exchange slower. Occasional yellow particles are a
21
subset of up spin particles that are considered as fluorescent particles. All configurations given are 200 by 200 full grids with periodic boundary condition.
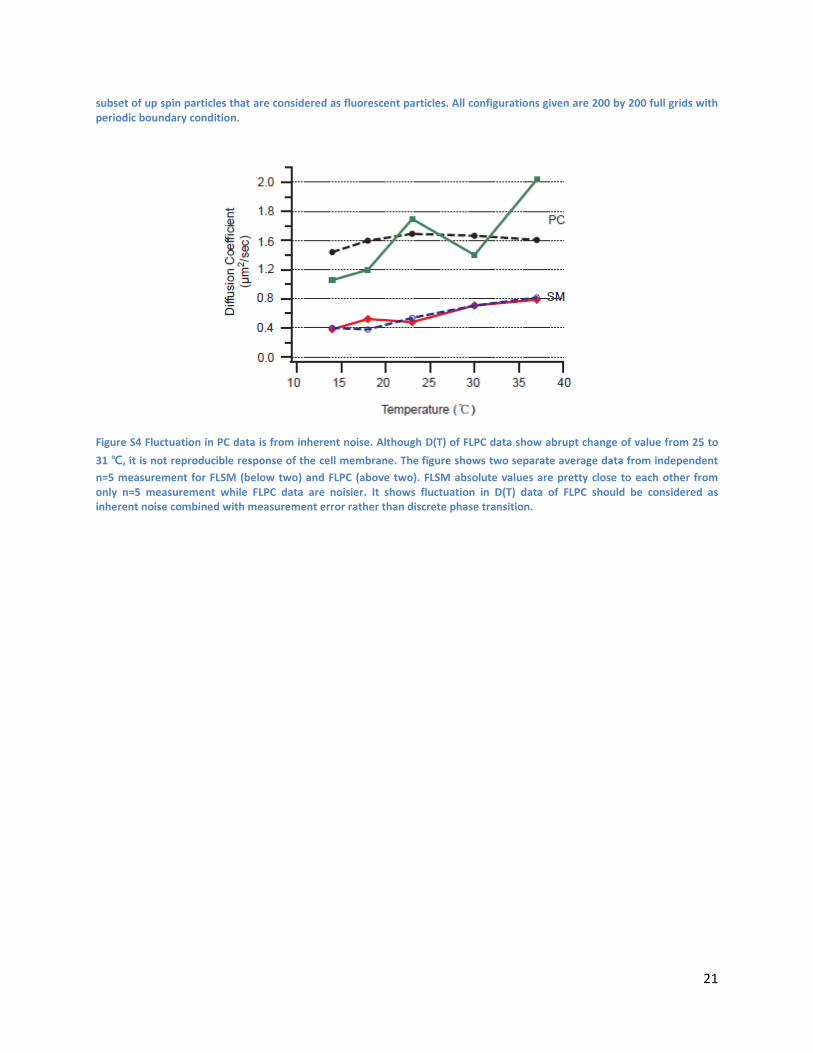
Figure S4 Fluctuation in PC data is from inherent noise. Although D(T) of FLPC data show abrupt change of value from 25 to 31 ℃, it is not reproducible response of the cell membrane. The figure shows two separate average data from independent n=5 measurement for FLSM (below two) and FLPC (above two). FLSM absolute values are pretty close to each other from only n=5 measurement while FLPC data are noisier. It shows fluctuation in D(T) data of FLPC should be considered as inherent noise combined with measurement error rather than discrete phase transition.
22
Chapter 2
RBL 2H3 mast cell signaling from antigen recognition doesn’t involve observable change of miscibility phase of the lipid membrane
2.1 Abstract
Existence of insoluble fractions in mammalian cell membranes in detergent extraction, combined with observation of ordered-disordered immiscibility in ternary mixture membranes, led researchers to hypothesize the existence of heterogeneous domains that take an important role in membrane signaling by governing interprotein interaction. (1) Here we show that RBL 2H3 mast cell membranes do not undergo any change of state in terms of sphingomyelin diffusion measured by FCS before and after initiation of an antigen-recognition-initiated signaling process. Combined with data from recent literatures, our findings allow us to speculate that the role of lipid membrane immiscibility as an active sorting platform is very limited or negligible.
2.2 Introduction
The existence of liquid ordered-disordered immiscibility in mammalian cell membranes could be biologically important because it can potentially work as an active sorting platform in membrane signaling processes. RBL 2H3 signaling initiated by membrane FceRI receptor oligomerization has been one candidate involving sorting from lipid domains. (2) In many hypothetical situations where we assume membrane immiscibility is aiding the sorting of molecules in signaling, we can expect diffusion of lipid species that have differential chemical potential for different phases and would show different diffusion coefficients determined by fluorescence correlation spectroscopy (FCS) as a function of activation because activation would involve change of membrane miscibility phase organization. Here we observed mobility of fluorescent sphingomyelin inserted into the RBL 2H3 cell membrane as a function of signaling initiation by antigen recognition. We see no detectable change as a function of activation, which suggests this specific signaling process doesn’t involve a major change in the miscibility phase structure of the membrane.
2.3 Methods
FCS measurement and analyses were performed as those in chapter 1.3. RBL2H3 cells were pre-sensitized overnight with 1µg/ml of anti FceRI IgE in DMEM media. For simultaneous
23
monitoring of IgE, sometimes IgE labeled with Alexa594 was exchanged with bound IgE for 30 min by 2µg/ml of labeled IgE in the same media. Fluorescent lipid incubation was done right before the experiment but after incubation with the antibody. Existence of colored antibodies didn’t affect the overall result of lipid diffusion as a function of activation (data not shown) or the normal signaling activity of the cell (Fig. 2). Fluorescent lipids were then introduced to the membrane by incubating, following the protocol of chapter 1.3. Antigen DNP-albumin was finally added to initiate the signaling. The final concentration was 1µg/ml. FCS measurement was taken before and after the initiation of signaling. Because FCS itself takes some time to perform, we can only be sure that a certain time has passed after the first signaling initiation, but the data is average of those obtained during total amount of time window that FCS was performed. Experiments were done at physiological temperature.
2.4 Result
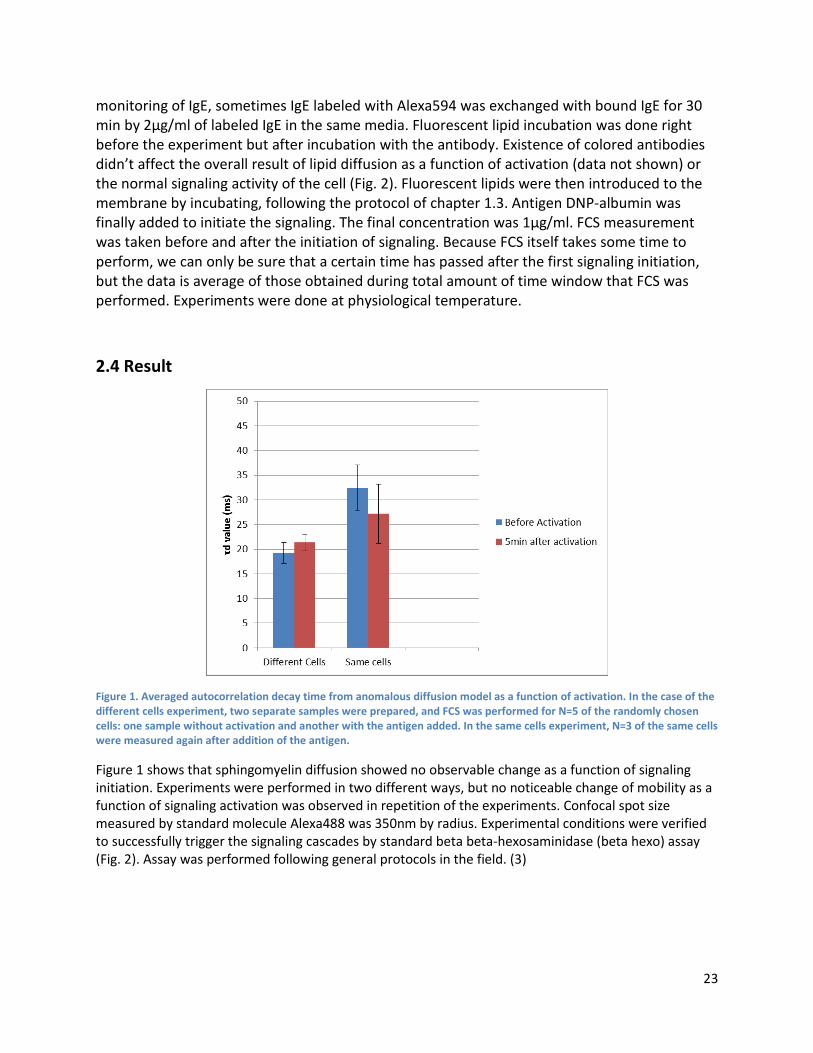
Figure 1. Averaged autocorrelation decay time from anomalous diffusion model as a function of activation. In the case of the different cells experiment, two separate samples were prepared, and FCS was performed for N=5 of the randomly chosen cells: one sample without activation and another with the antigen added. In the same cells experiment, N=3 of the same cells were measured again after addition of the antigen.
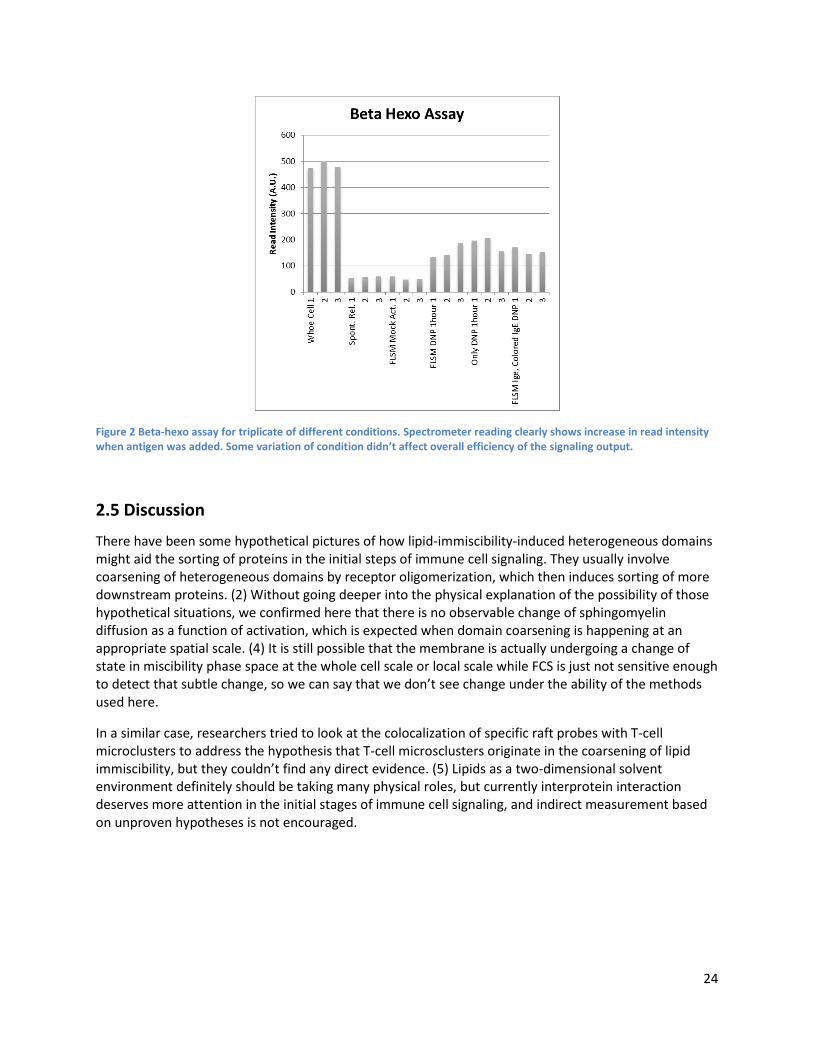
Figure 1 shows that sphingomyelin diffusion showed no observable change as a function of signaling initiation. Experiments were performed in two different ways, but no noticeable change of mobility as a function of signaling activation was observed in repetition of the experiments. Confocal spot size measured by standard molecule Alexa488 was 350nm by radius. Experimental conditions were verified to successfully trigger the signaling cascades by standard beta beta-hexosaminidase (beta hexo) assay (Fig. 2). Assay was performed following general protocols in the field. (3)
24
Figure 2 Beta-hexo assay for triplicate of different conditions. Spectrometer reading clearly shows increase in read intensity when antigen was added. Some variation of condition didn’t affect overall efficiency of the signaling output.
2.5 Discussion
There have been some hypothetical pictures of how lipid-immiscibility-induced heterogeneous domains might aid the sorting of proteins in the initial steps of immune cell signaling. They usually involve coarsening of heterogeneous domains by receptor oligomerization, which then induces sorting of more downstream proteins. (2) Without going deeper into the physical explanation of the possibility of those hypothetical situations, we confirmed here that there is no observable change of sphingomyelin diffusion as a function of activation, which is expected when domain coarsening is happening at an appropriate spatial scale. (4) It is still possible that the membrane is actually undergoing a change of state in miscibility phase space at the whole cell scale or local scale while FCS is just not sensitive enough to detect that subtle change, so we can say that we don’t see change under the ability of the methods used here.
In a similar case, researchers tried to look at the colocalization of specific raft probes with T-cell microclusters to address the hypothesis that T-cell microsclusters originate in the coarsening of lipid immiscibility, but they couldn’t find any direct evidence. (5) Lipids as a two-dimensional solvent environment definitely should be taking many physical roles, but currently interprotein interaction deserves more attention in the initial stages of immune cell signaling, and indirect measurement based on unproven hypotheses is not encouraged.
25
Chapter 3
Near-critical fluctuation is a potential catalytic environment for membrane interprotein reactions: Simulation study
3.1 Abstract
Near-critical fluctuation has been proposed as one possible live cell membrane state. (1) Here we show that near-critical cell membranes can effectively aid membrane reactions by increasing the number of collisions between particles. This suggests the role of near-critical fluctuation as a catalyst, although the degree of contribution remains vague.
3.2 Introduction
After discovery of miscibility transition in live cell membrane blebs (2) and of critical fluctuation near the transition temperature (3), the position of the actual mammalian cell membranes in the phase diagram has been an interesting question. As discussed in chapter 1, the cell membrane is not poised near the critical transition point, but just being near the critical point is an interesting issue because membranes show characteristic correlation in length of fluctuation, which is a general property of all near-critical systems. Because live cell membranes have various nonequilibrium perturbation factors that can induce local differential particle interactions or can even change the composition of the whole membrane, critical fluctuation might be in use in even more complicated manners. Some researchers have noted that criticality in general is an important principle in living systems, so this question also belongs to more general studies of criticality in biology. (4)
In this study, we ran simple Monte-Carlo dynamics simulations of a fundamental chemical reaction under various temperatures of the Ising model near critical temperature. Near-critical fluctuation had a net effect of catalyzing the reaction by increasing the time of effective collision between reacting molecules, which suggests the possibility that living cell membranes are catalyzing membrane reactions by near-critical fluctuation, although the degree of this contribution cannot be determined by this simulation.
3.3 Methods
Kawasaki dynamics of the Ising model were performed following (5,6). The size of the systems was N= 400x400 with a periodic boundary condition. With 2N as a unit step, 100 000 initial equilibrium steps were followed by 10 000 000 actual dynamics steps. 450 molecules of A and 50 molecules of B were positioned randomly after initiation steps and were allowed to react by probability only when A and B were adjacent to each other at certain steps. As a representation of differential chemical potential, reacting particles were only allowed to be positioned as up-spin or down-spin particles. The reaction between A and B was a simple second-order reaction as formulated in [1]. An arbitrary constant of pFor
26
= 200.0 *(1.0/10000000.0) was used as the probability of reactions. Critical temperature was set to 1.0 by defining spin coupling constant as J = 1.0/2.269185. Computation took several days for a PC with a 2.8 GHz quad-core CPU. All programs were made and run by C.
A + B -> 2B [1]
3.4 Result
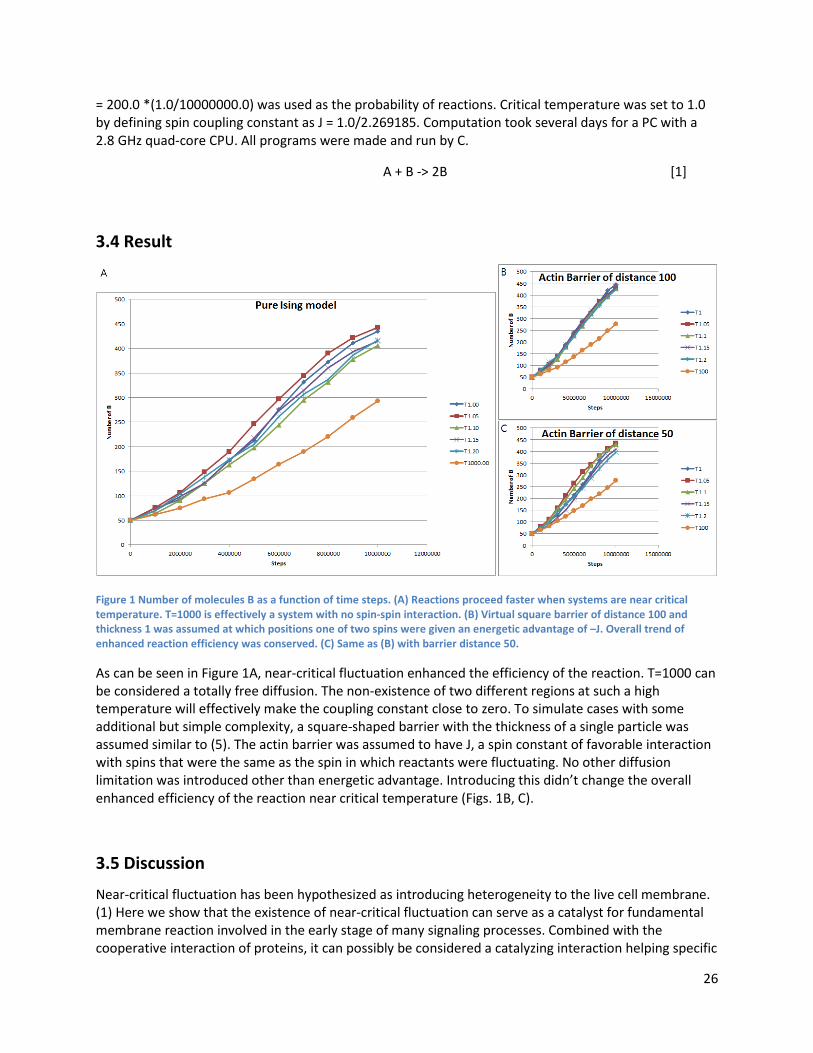
Figure 1 Number of molecules B as a function of time steps. (A) Reactions proceed faster when systems are near critical temperature. T=1000 is effectively a system with no spin-spin interaction. (B) Virtual square barrier of distance 100 and thickness 1 was assumed at which positions one of two spins were given an energetic advantage of –J. Overall trend of enhanced reaction efficiency was conserved. (C) Same as (B) with barrier distance 50.
As can be seen in Figure 1A, near-critical fluctuation enhanced the efficiency of the reaction. T=1000 can be considered a totally free diffusion. The non-existence of two different regions at such a high temperature will effectively make the coupling constant close to zero. To simulate cases with some additional but simple complexity, a square-shaped barrier with the thickness of a single particle was assumed similar to (5). The actin barrier was assumed to have J, a spin constant of favorable interaction with spins that were the same as the spin in which reactants were fluctuating. No other diffusion limitation was introduced other than energetic advantage. Introducing this didn’t change the overall enhanced efficiency of the reaction near critical temperature (Figs. 1B, C).
3.5 Discussion
Near-critical fluctuation has been hypothesized as introducing heterogeneity to the live cell membrane. (1) Here we show that the existence of near-critical fluctuation can serve as a catalyst for fundamental membrane reaction involved in the early stage of many signaling processes. Combined with the cooperative interaction of proteins, it can possibly be considered a catalyzing interaction helping specific

27
collisions more than others. Considering the difference between homogeneous (extremely high temperature) cases and near-critical cases is small, critical fluctuation might be making only a small contribution to membrane reactions, and experimental verification might not be straightforward. We can still learn from this Kawasaki dynamics simulation that the existence of near-critical fluctuation with characteristic correlation length not only introduces heterogeneous fluctuation but also effectively aids interparticle collision to some extent.
28
Chapter 4
A Mechanism for Tunable Autoinhibition in the Structure of a Human Ca2+/Calmodulin- Dependent Kinase II Holoenzyme (This is reprint from Cell, 2011, 146(5), 732-745: "A Mechanism for Tunable Autoinhibition in the Structure of a Human Ca2+/Calmodulin- Dependent Kinase II Holoenzyme.", Luke H. Chao, Margaret M. Stratton, Il-Hyung Lee, Oren S. Rosenberg, Joshua Levitz, Daniel J. Mandell, Tanja Kortemme, Jay T. Groves, Howard Schulman and John Kuriyan. My main contribution to this work is proof of the hypothesis on frequency modulation mechanism by stochastic kinetics simulation)
4.1 Abstract
Calcium/calmodulin-dependent kinase II (CaMKII) forms a highly conserved dodecameric assembly that is sensitive to the frequency of calcium pulse trains. Neither the structure of the dodecameric assembly nor how it regulates CaMKII are known. We present the crystal structure of an autoinhibited full-length human CaMKII holoenzyme, revealing an unexpected compact arrangement of kinase domains docked against a central hub, with the calmodulin-binding sites completely inaccessible. We show that this compact docking is important for the autoinhibition of the kinase domains and for setting the calcium response of the holoenzyme. Comparison of CaMKII isoforms, which differ in the length of the linker between the kinase domain and the hub, demonstrates that these interactions can be strengthened or weakened by changes in linker length. This equilibrium between autoinhibited states provides a simple mechanism for tuning the calcium response without changes in either the hub or the kinase domains.
4.2 Introduction
Calcium/calmodulin-dependent kinase II (CaMKII) is unique among protein kinases because it forms a dodecameric holoenzyme that responds not just to the amplitude but also to the frequency of the activating signal. CaMKII is of central importance in neuronal signaling because it transduces intracellular calcium influx into the phosphorylation of ion channels, resulting in changes that alter synaptic strength ( [Kennedy et al., 1983], [Nairn et al., 1985] and [Schulman and Greengard, 1978]). The activity of CaMKII is switched on by calcium spikes, but the enzyme escapes calcium dependence when the calcium spike frequency exceeds a characteristic threshold.
Calcium/calmodulin (Ca2+/CaM) activates CaMKII by displacing an inhibitory segment that blocks the active site of the enzyme. This segment is phosphorylated in a frequency-dependent manner, and once phosphorylated it no longer blocks the enzyme, even in the absence of Ca2+/CaM ( [De Koninck and Schulman, 1998], [Hanson et al., 1989] and [Miller and Kennedy, 1986]). In this way, the enzyme is capable of storing a molecular “memory” of activating pulse trains, a property responsible for the key role played by CaMKII in the acquisition of long-term potentiation (LTP) (Malenka and Bear, 2004).
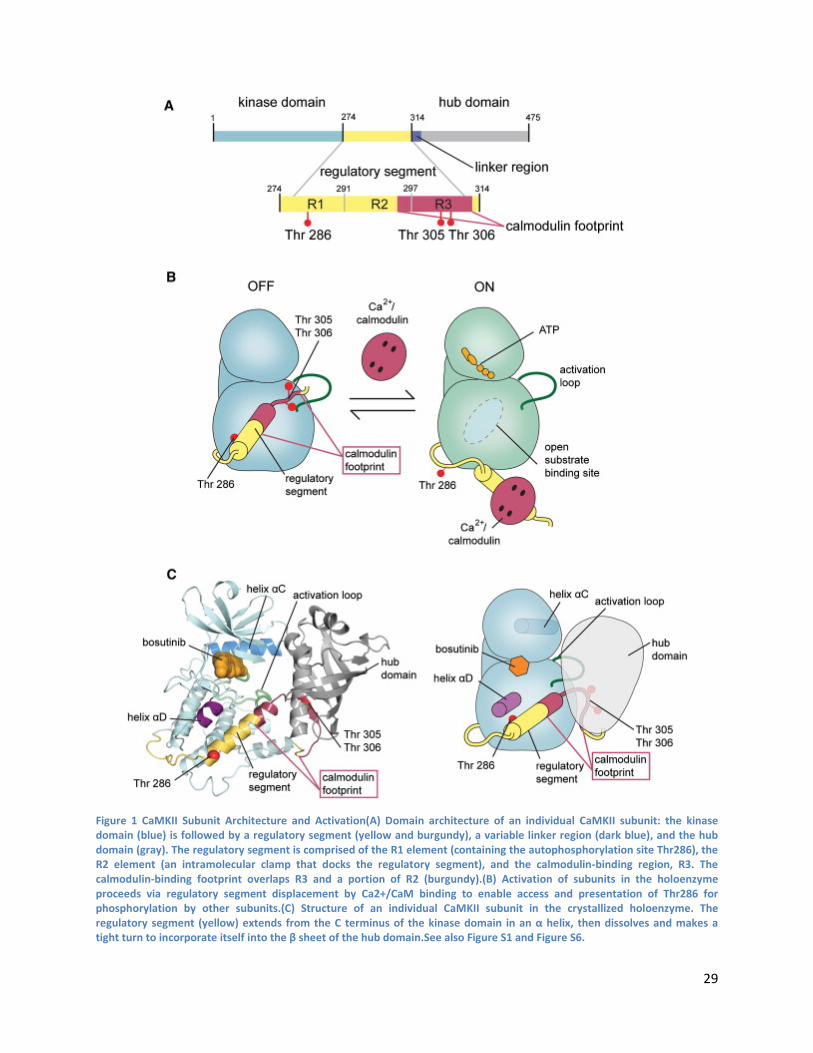
29
Figure 1 CaMKII Subunit Architecture and Activation(A) Domain architecture of an individual CaMKII subunit: the kinase domain (blue) is followed by a regulatory segment (yellow and burgundy), a variable linker region (dark blue), and the hub domain (gray). The regulatory segment is comprised of the R1 element (containing the autophosphorylation site Thr286), the R2 element (an intramolecular clamp that docks the regulatory segment), and the calmodulin-binding region, R3. The calmodulin-binding footprint overlaps R3 and a portion of R2 (burgundy).(B) Activation of subunits in the holoenzyme proceeds via regulatory segment displacement by Ca2+/CaM binding to enable access and presentation of Thr286 for phosphorylation by other subunits.(C) Structure of an individual CaMKII subunit in the crystallized holoenzyme. The regulatory segment (yellow) extends from the C terminus of the kinase domain in an α helix, then dissolves and makes a tight turn to incorporate itself into the β sheet of the hub domain.See also Figure S1 and Figure S6.
30
Each subunit of a CaMKII holoenzyme consists of a Ser/Thr-specific kinase domain followed by a regulatory segment that binds to Ca2+/CaM (Hudmon and Schulman, 2002) (Figure 1). The regulatory segment is followed by a flexible linker of variable length that connects to the hub domain (also referred to as the association domain). The hub domains assemble into two hexameric rings that form the dodecameric holoenzyme ( [Hoelz et al., 2003], [Rellos et al., 2010] and [Shen and Meyer, 1998]).
Several structures of the isolated kinase domain, determined previously, illustrate how the regulatory segment controls kinase activity (Figure S6 available online). Three critical phosphorylation sites (Thr286, Thr305, and Thr306) are located within the regulatory segment, which is divided into three regions denoted R1, R2, and R3 (see Figure 1A). Thr286 (mouse α isoform numbering) is at the base of an α helix formed by the regulatory segment. This α helix blocks substrate binding in the autoinhibited structure by occupying a hydrophobic groove on the kinase domain. Thr305 and Thr306 lie at the heart of the calmodulin-binding region of the regulatory segment (the R3 element). Phosphorylation at Thr286 occurs in trans, between two kinase subunits of the same holoenzyme (Hanson et al., 1994), and disrupts the docking of the R1 and R2 elements of the regulatory segment against the kinase domain (Figure 1B). This releases autoinhibition, even in the absence of calcium, thereby conferring calcium-independent activity to the kinase. Phosphorylation of Thr305 and Thr306 prevents calmodulin binding ( [Colbran, 1993] and [Hanson and Schulman, 1992]). Studies using transgenic mice show that mutation of Thr286, a site of phosphorylation in the regulatory segment, results in impaired learning, whereas mutation of the two other phosphorylation sites (Thr305 and Thr306) results in learning that is less adaptable ( [Elgersma et al., 2002] and [Silva et al., 1992]).
There are four CaMKII genes (α, β, γ, δ) in humans. The enzymes produced by these genes have virtually identical kinase domains (∼95% sequence identity) and very similar hub domains (∼80% identity). The principal difference between these gene products is in the linker connecting the kinase domain to the hub domain, which is variable in both sequence and length. At least 38 distinct mammalian splice variants are generated by lengthening or shortening this region (Tombes et al., 2003), and changes in the linker length are correlated with changes in the frequency response of the enzyme (Bayer et al., 2002). The origin of the coupling between linker length and the frequency response is unclear.
All of the essential features of CaMKII are conserved across metazoans. The regulatory segment and the three phosphorylation sites within it are invariant. The residues that mediate the oligomerization of the hub domain are conserved from representatives of the earliest metazoans, such as hydra and sea urchins, to humans (Figure S1). This conservation in CaMKII dates to the evolutionary stage when the first synapse was thought to have formed (Ryan and Grant, 2009). The linker region between the regulatory segment and hub domain is the only major site of variation over the ∼1200 million year evolution of this enzyme.
Some information about the quaternary structure of the CaMKII holoenzyme assembly has emerged from electron microscopy (EM) and small-angle X-ray scattering (SAXS). In one set of EM reconstructions, individual kinase domains are arranged above and below the midplane of the central hub ( [Kolodziej et al., 2000] and [Woodgett et al., 1984]). In another set of EM reconstructions, the kinase domains occupy radial positions at the midplane of the central hub and are in close proximity to one another (Morris and Török, 2001). The radial arrangement of kinase domains in this set of EM reconstructions is similar to that seen in models of CaMKII based on SAXS (Rosenberg et al., 2005). These disparate views of the holoenzyme structure have not been reconciled.
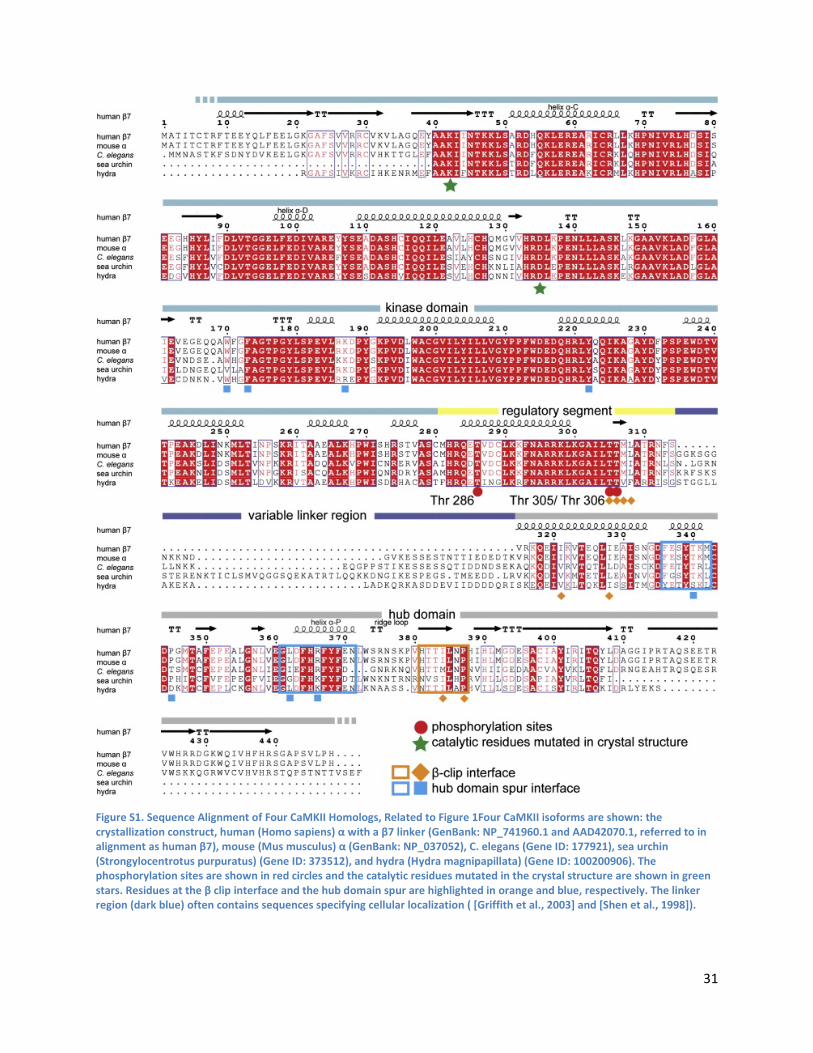
31
Figure S1. Sequence Alignment of Four CaMKII Homologs, Related to Figure 1Four CaMKII isoforms are shown: the crystallization construct, human (Homo sapiens) α with a β7 linker (GenBank: NP_741960.1 and AAD42070.1, referred to in alignment as human β7), mouse (Mus musculus) α (GenBank: NP_037052), C. elegans (Gene ID: 177921), sea urchin (Strongylocentrotus purpuratus) (Gene ID: 373512), and hydra (Hydra magnipapillata) (Gene ID: 100200906). The phosphorylation sites are shown in red circles and the catalytic residues mutated in the crystal structure are shown in green stars. Residues at the β clip interface and the hub domain spur are highlighted in orange and blue, respectively. The linker region (dark blue) often contains sequences specifying cellular localization ( [Griffith et al., 2003] and [Shen et al., 1998]).
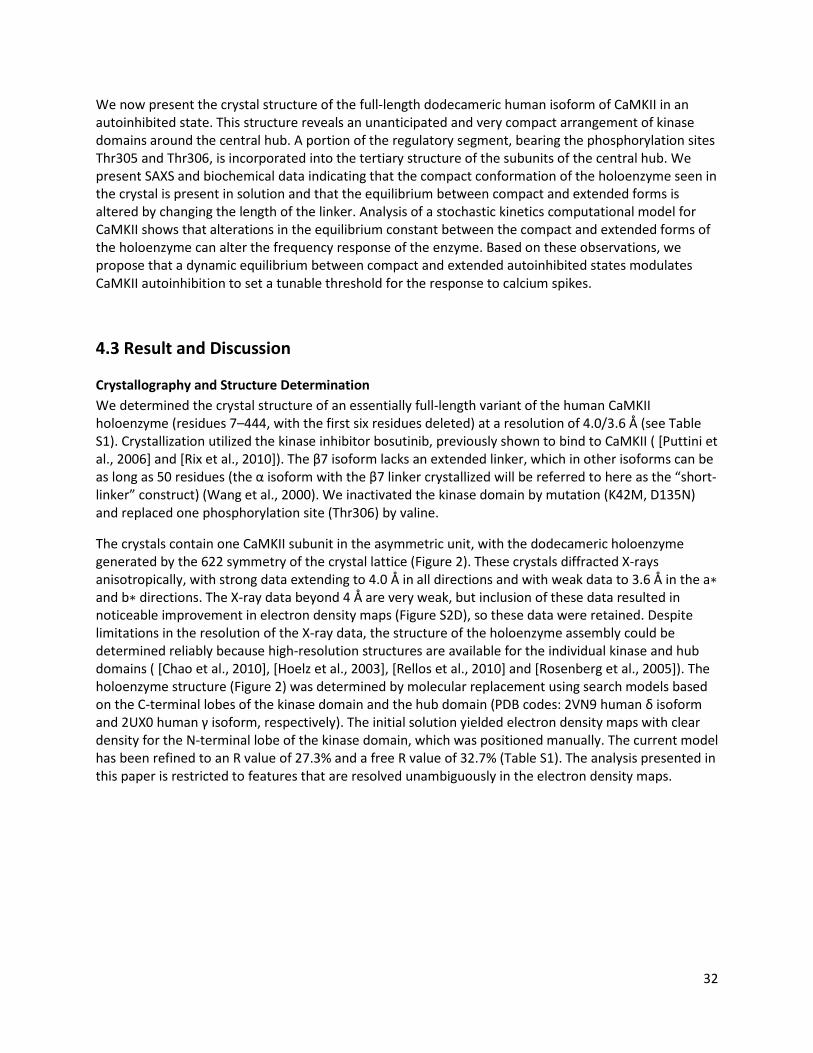
32
We now present the crystal structure of the full-length dodecameric human isoform of CaMKII in an autoinhibited state. This structure reveals an unanticipated and very compact arrangement of kinase domains around the central hub. A portion of the regulatory segment, bearing the phosphorylation sites Thr305 and Thr306, is incorporated into the tertiary structure of the subunits of the central hub. We present SAXS and biochemical data indicating that the compact conformation of the holoenzyme seen in the crystal is present in solution and that the equilibrium between compact and extended forms is altered by changing the length of the linker. Analysis of a stochastic kinetics computational model for CaMKII shows that alterations in the equilibrium constant between the compact and extended forms of the holoenzyme can alter the frequency response of the enzyme. Based on these observations, we propose that a dynamic equilibrium between compact and extended autoinhibited states modulates CaMKII autoinhibition to set a tunable threshold for the response to calcium spikes.
4.3 Result and Discussion
Crystallography and Structure Determination We determined the crystal structure of an essentially full-length variant of the human CaMKII holoenzyme (residues 7–444, with the first six residues deleted) at a resolution of 4.0/3.6 Å (see Table S1). Crystallization utilized the kinase inhibitor bosutinib, previously shown to bind to CaMKII ( [Puttini et al., 2006] and [Rix et al., 2010]). The β7 isoform lacks an extended linker, which in other isoforms can be as long as 50 residues (the α isoform with the β7 linker crystallized will be referred to here as the “short-linker” construct) (Wang et al., 2000). We inactivated the kinase domain by mutation (K42M, D135N) and replaced one phosphorylation site (Thr306) by valine.
The crystals contain one CaMKII subunit in the asymmetric unit, with the dodecameric holoenzyme generated by the 622 symmetry of the crystal lattice (Figure 2). These crystals diffracted X-rays anisotropically, with strong data extending to 4.0 Å in all directions and with weak data to 3.6 Å in the a∗ and b∗ directions. The X-ray data beyond 4 Å are very weak, but inclusion of these data resulted in noticeable improvement in electron density maps (Figure S2D), so these data were retained. Despite limitations in the resolution of the X-ray data, the structure of the holoenzyme assembly could be determined reliably because high-resolution structures are available for the individual kinase and hub domains ( [Chao et al., 2010], [Hoelz et al., 2003], [Rellos et al., 2010] and [Rosenberg et al., 2005]). The holoenzyme structure (Figure 2) was determined by molecular replacement using search models based on the C-terminal lobes of the kinase domain and the hub domain (PDB codes: 2VN9 human δ isoform and 2UX0 human γ isoform, respectively). The initial solution yielded electron density maps with clear density for the N-terminal lobe of the kinase domain, which was positioned manually. The current model has been refined to an R value of 27.3% and a free R value of 32.7% (Table S1). The analysis presented in this paper is restricted to features that are resolved unambiguously in the electron density maps.
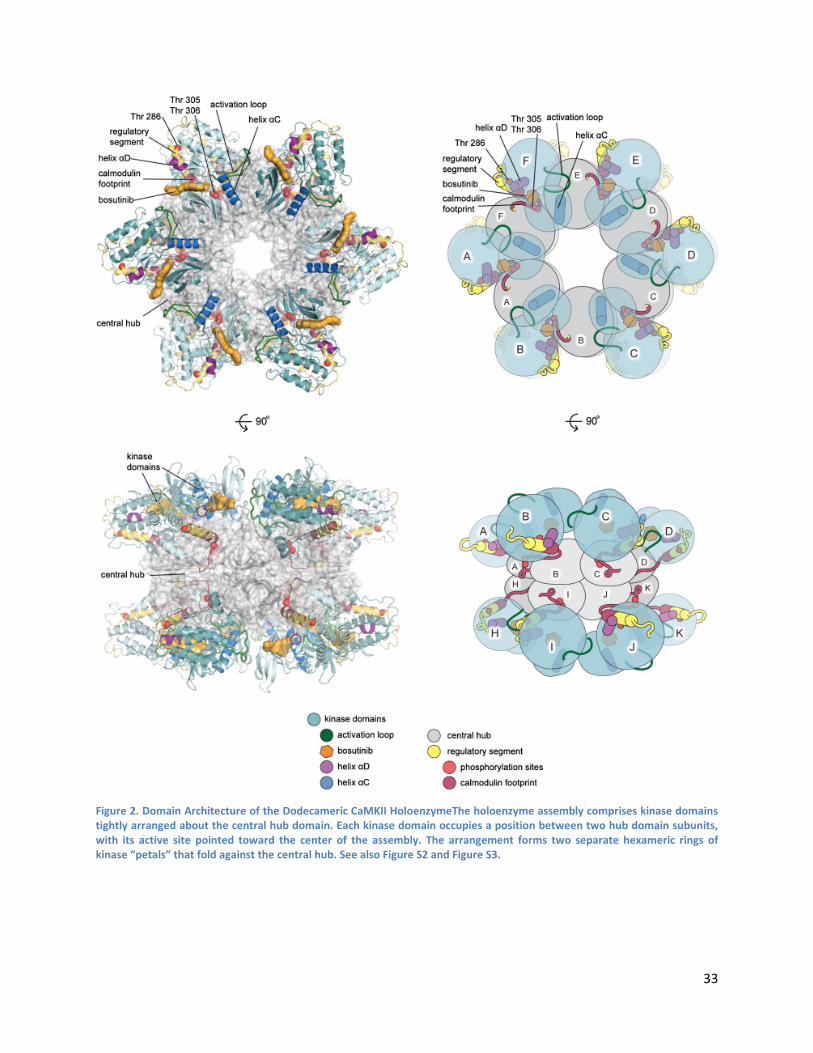
33
Figure 2. Domain Architecture of the Dodecameric CaMKII HoloenzymeThe holoenzyme assembly comprises kinase domains tightly arranged about the central hub domain. Each kinase domain occupies a position between two hub domain subunits, with its active site pointed toward the center of the assembly. The arrangement forms two separate hexameric rings of kinase “petals” that fold against the central hub. See also Figure S2 and Figure S3.
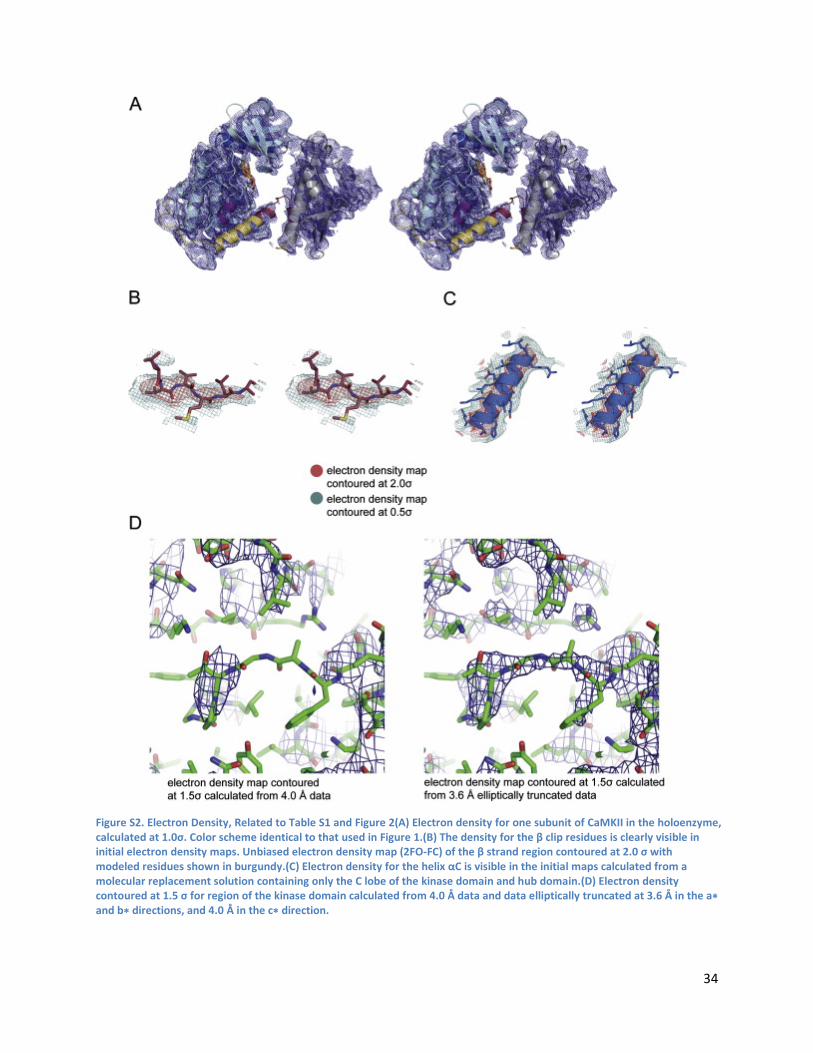
34
Figure S2. Electron Density, Related to Table S1 and Figure 2(A) Electron density for one subunit of CaMKII in the holoenzyme, calculated at 1.0σ. Color scheme identical to that used in Figure 1.(B) The density for the β clip residues is clearly visible in initial electron density maps. Unbiased electron density map (2FO-FC) of the β strand region contoured at 2.0 σ with modeled residues shown in burgundy.(C) Electron density for the helix αC is visible in the initial maps calculated from a molecular replacement solution containing only the C lobe of the kinase domain and hub domain.(D) Electron density contoured at 1.5 σ for region of the kinase domain calculated from 4.0 Å data and data elliptically truncated at 3.6 Å in the a∗ and b∗ directions, and 4.0 Å in the c∗ direction.
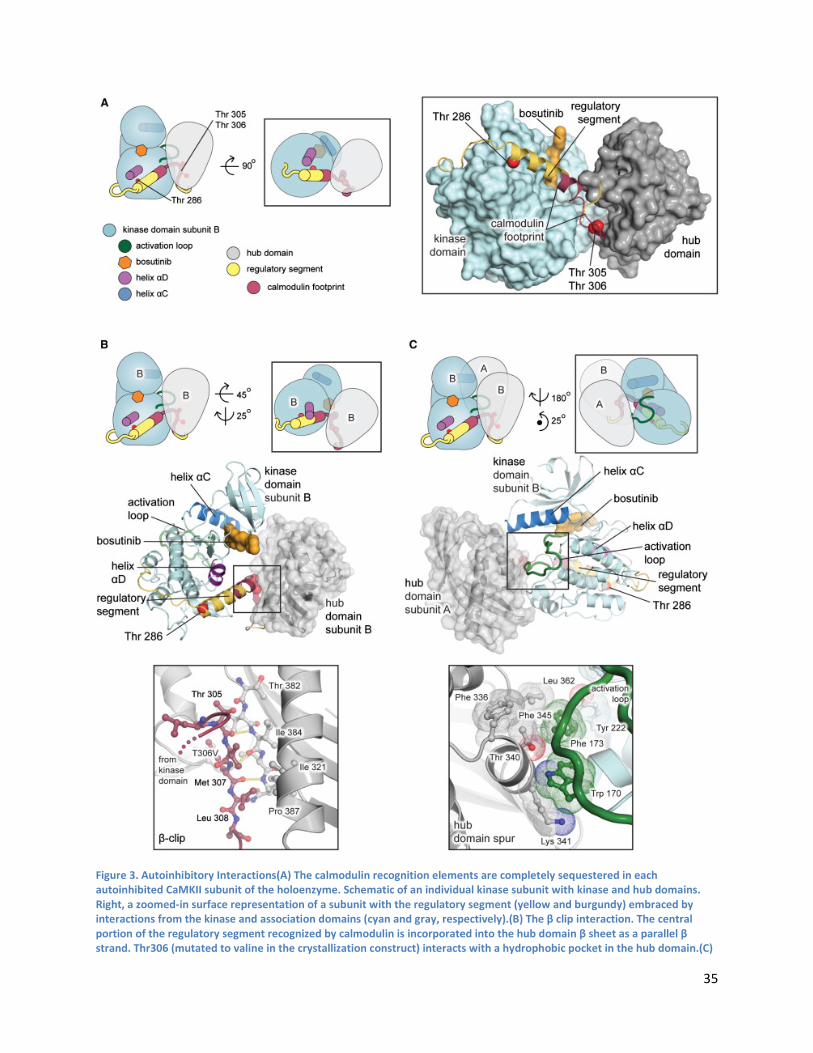
35
Figure 3. Autoinhibitory Interactions(A) The calmodulin recognition elements are completely sequestered in each autoinhibited CaMKII subunit of the holoenzyme. Schematic of an individual kinase subunit with kinase and hub domains. Right, a zoomed-in surface representation of a subunit with the regulatory segment (yellow and burgundy) embraced by interactions from the kinase and association domains (cyan and gray, respectively).(B) The β clip interaction. The central portion of the regulatory segment recognized by calmodulin is incorporated into the hub domain β sheet as a parallel β strand. Thr306 (mutated to valine in the crystallization construct) interacts with a hydrophobic pocket in the hub domain.(C)
36
The hub domain spur. The docking interaction between the kinase domain and the adjacent hub domain subunit is mediated by residues at the base of the activation loop (green) and at a spur in the hub domain.See also Figure S3.
An important and unanticipated aspect of the structure is the incorporation of a portion of the regulatory segment (residues 304–308, including the autophosphorylation sites Thr305 and Thr306) as an additional strand into the central β sheet of the hub domain (Figure 3). This β strand was clearly visible in the initial electron density maps, and the structure of this strand could be modeled unambiguously (Figure S2B). Electron density for the loops that connect this strand to the rest of the regulatory segment was not well resolved initially, so we utilized the kinematic loop closure method (Mandell et al., 2009) to generate models for these regions (residues 299–304 and residues 309–314) of the regulatory segment (see Experimental Procedures). The precise structure of these loops does not enter into the analysis presented here.
Architecture of the Holoenzyme The two stacked hexameric rings of hub domains form the core of the holoenzyme assembly and are arranged essentially as described previously ( [Hoelz et al., 2003] and [Rellos et al., 2010]). Each kinase domain is positioned between two subunits of the central hub, one of which is the hub subunit to which it is connected covalently. The connections are shown in Figure 2, in which the subunits in the upper ring are named A through F in a counterclockwise sense. The kinase domain of subunit B interacts with the hub domains of subunits A and B, and so on around the ring. This arrangement creates two sets of six kinase domain “petals,” one above the hub and one below, that fold against the central hub.
The quaternary assembly of the holoenzyme seen in the crystal structure has some similarity to the EM reconstructions that have kinase domains arranged above and below the midplane of the central hub (Kolodziej et al., 2000). These EM reconstructions have the kinase domains at extended positions, far from each other and from the central hub (these holoenzyme reconstructions have a roughly cylindrical
shape of ∼200 Å height and 140 Å diameter). In contrast, the kinase domains in the crystal structure
pack tightly against the central hub (the assembly in the crystals has a cylindrical height of ∼100 Å and a
diameter of ∼150 Å).
The R3 element of the regulatory segment connects to the hub domain. Although the R3 element is sandwiched between the kinase domain and the hub domain, the point of linkage to the hub domain occurs at the surface of the holoenzyme. This means that the extra residues present in CaMKII isoforms with longer linkers can be readily accommodated without disturbing the architecture of the holoenzyme (Figure S3C). This arrangement projects the linker regions from a central midplane of the holoenzyme, spacing linker extensions 24 and 33 Å apart to create an accessible multivalent interaction surface for binding partners.
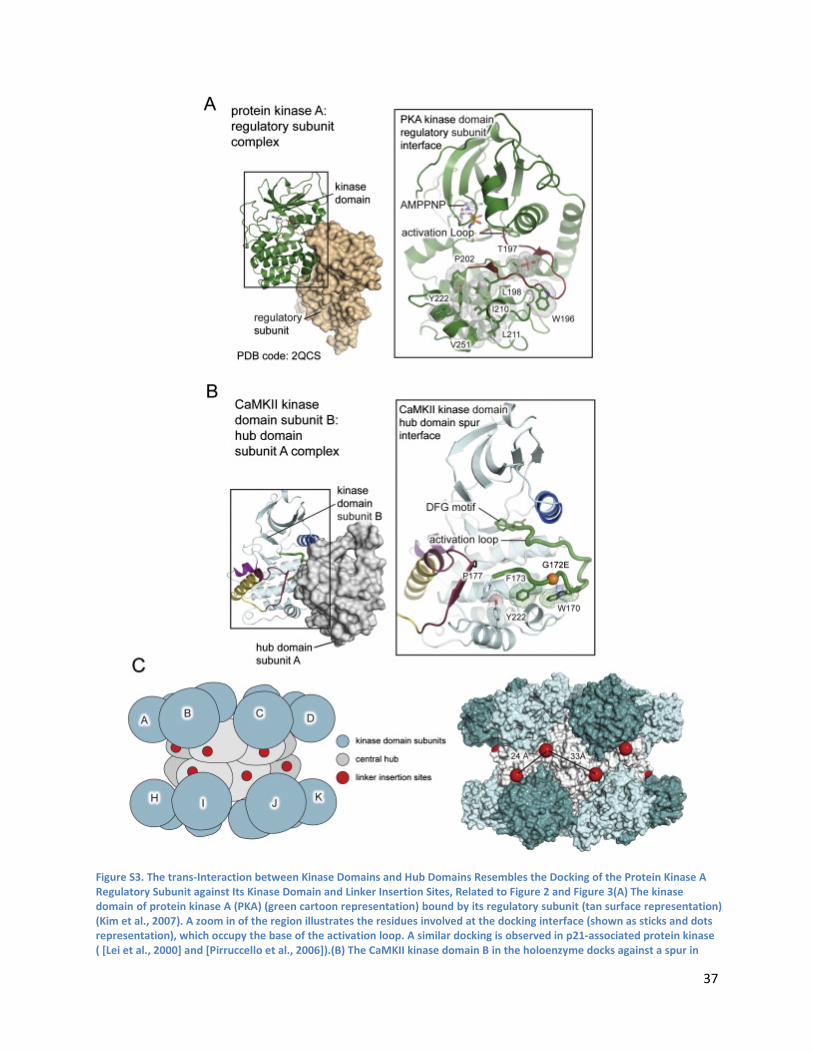
37
Figure S3. The trans-Interaction between Kinase Domains and Hub Domains Resembles the Docking of the Protein Kinase A Regulatory Subunit against Its Kinase Domain and Linker Insertion Sites, Related to Figure 2 and Figure 3(A) The kinase domain of protein kinase A (PKA) (green cartoon representation) bound by its regulatory subunit (tan surface representation) (Kim et al., 2007). A zoom in of the region illustrates the residues involved at the docking interface (shown as sticks and dots representation), which occupy the base of the activation loop. A similar docking is observed in p21-associated protein kinase ( [Lei et al., 2000] and [Pirruccello et al., 2006]).(B) The CaMKII kinase domain B in the holoenzyme docks against a spur in
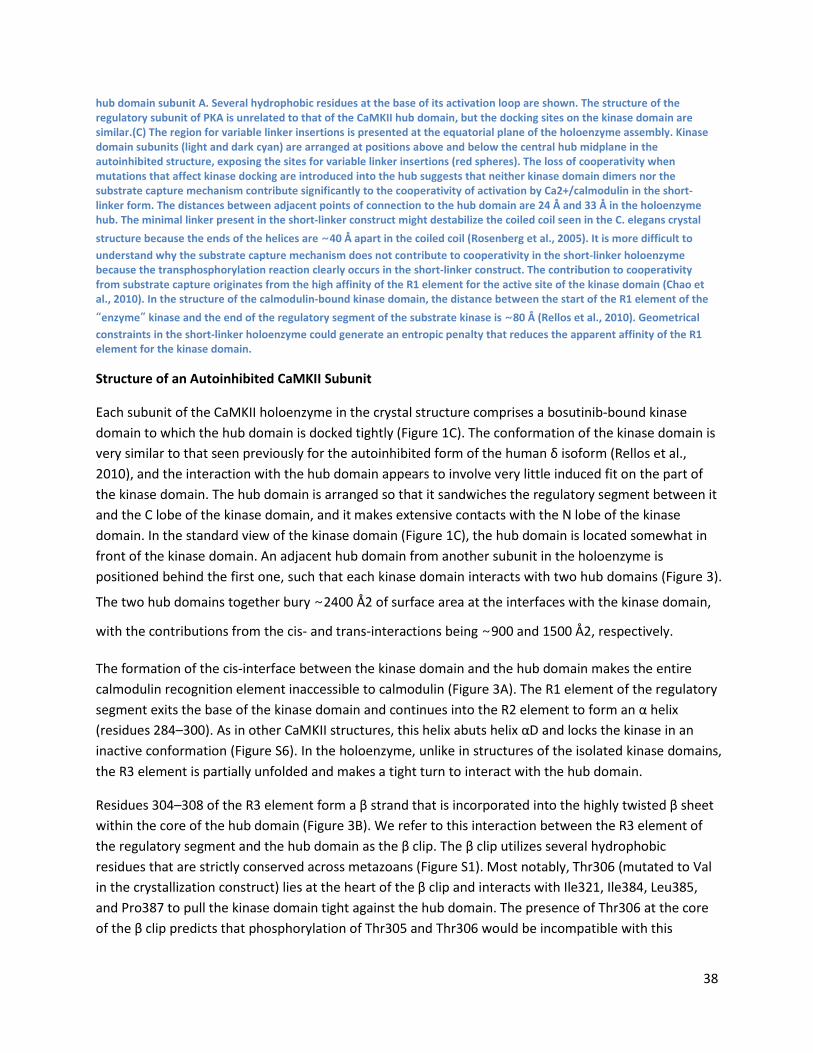
38
hub domain subunit A. Several hydrophobic residues at the base of its activation loop are shown. The structure of the regulatory subunit of PKA is unrelated to that of the CaMKII hub domain, but the docking sites on the kinase domain are similar.(C) The region for variable linker insertions is presented at the equatorial plane of the holoenzyme assembly. Kinase domain subunits (light and dark cyan) are arranged at positions above and below the central hub midplane in the autoinhibited structure, exposing the sites for variable linker insertions (red spheres). The loss of cooperativity when mutations that affect kinase docking are introduced into the hub suggests that neither kinase domain dimers nor the substrate capture mechanism contribute significantly to the cooperativity of activation by Ca2+/calmodulin in the short-linker form. The distances between adjacent points of connection to the hub domain are 24 Å and 33 Å in the holoenzyme hub. The minimal linker present in the short-linker construct might destabilize the coiled coil seen in the C. elegans crystal structure because the ends of the helices are ∼40 Å apart in the coiled coil (Rosenberg et al., 2005). It is more difficult to understand why the substrate capture mechanism does not contribute to cooperativity in the short-linker holoenzyme because the transphosphorylation reaction clearly occurs in the short-linker construct. The contribution to cooperativity from substrate capture originates from the high affinity of the R1 element for the active site of the kinase domain (Chao et al., 2010). In the structure of the calmodulin-bound kinase domain, the distance between the start of the R1 element of the “enzyme” kinase and the end of the regulatory segment of the substrate kinase is ∼80 Å (Rellos et al., 2010). Geometrical constraints in the short-linker holoenzyme could generate an entropic penalty that reduces the apparent affinity of the R1 element for the kinase domain.
Structure of an Autoinhibited CaMKII Subunit
Each subunit of the CaMKII holoenzyme in the crystal structure comprises a bosutinib-bound kinase domain to which the hub domain is docked tightly (Figure 1C). The conformation of the kinase domain is very similar to that seen previously for the autoinhibited form of the human δ isoform (Rellos et al., 2010), and the interaction with the hub domain appears to involve very little induced fit on the part of the kinase domain. The hub domain is arranged so that it sandwiches the regulatory segment between it and the C lobe of the kinase domain, and it makes extensive contacts with the N lobe of the kinase domain. In the standard view of the kinase domain (Figure 1C), the hub domain is located somewhat in front of the kinase domain. An adjacent hub domain from another subunit in the holoenzyme is positioned behind the first one, such that each kinase domain interacts with two hub domains (Figure 3).
The two hub domains together bury ∼2400 Å2 of surface area at the interfaces with the kinase domain,
with the contributions from the cis- and trans-interactions being ∼900 and 1500 Å2, respectively.
The formation of the cis-interface between the kinase domain and the hub domain makes the entire calmodulin recognition element inaccessible to calmodulin (Figure 3A). The R1 element of the regulatory segment exits the base of the kinase domain and continues into the R2 element to form an α helix (residues 284–300). As in other CaMKII structures, this helix abuts helix αD and locks the kinase in an inactive conformation (Figure S6). In the holoenzyme, unlike in structures of the isolated kinase domains, the R3 element is partially unfolded and makes a tight turn to interact with the hub domain.
Residues 304–308 of the R3 element form a β strand that is incorporated into the highly twisted β sheet within the core of the hub domain (Figure 3B). We refer to this interaction between the R3 element of the regulatory segment and the hub domain as the β clip. The β clip utilizes several hydrophobic residues that are strictly conserved across metazoans (Figure S1). Most notably, Thr306 (mutated to Val in the crystallization construct) lies at the heart of the β clip and interacts with Ile321, Ile384, Leu385, and Pro387 to pull the kinase domain tight against the hub domain. The presence of Thr306 at the core of the β clip predicts that phosphorylation of Thr305 and Thr306 would be incompatible with this
39
autoinhibited form of the holoenzyme. Thr305 and Thr306 are within the calmodulin recognition element, and phosphorylation of these residues is known to prevent calmodulin rebinding ( [Colbran, 1993] and [Hanson and Schulman, 1992]). Our structure now indicates that phosphorylation of these sites will also prevent adoption of the closed form of the holoenzyme in the absence of Ca2+/CaM.
Kinase Domain-Central Hub Docking Interactions An unanticipated aspect of the holoenzyme structure are the extensive interactions between the kinase domains and the central hub (Figure 3). In addition to the incorporation of the R3 portion of the regulatory segment into the hub domain, there are interactions between the kinase domain and a “spur” on an adjacent hub domain (Figure 3C and Figure 2). The hub domain spur docks against the activation loop of the adjacent kinase domain, thereby blocking access to the substrate-binding site. This interaction is analogous to the interaction between the catalytic domain of protein kinase A and its regulatory domain (Kim et al., 2007) (Figure S3).
The importance of the trans-interaction for CaMKII regulation is supported by the fact that residues comprising the hub domain spur interface are conserved from hydra to man. A sensitization screen in C. elegans for mutants that suppress seizures identified activating mutations in CaMKII at the base of the activation loop (LeBoeuf et al., 2007). One of these mutations (G172E) maps to the center of the hydrophobic interactions at the hub domain spur interface and would be predicted to destabilize the packing of kinase domains in the autoinhibited holoenzyme arrangement that we observe (Figure S3).
Mutation of Residues at the Kinase-Hub Interfaces Alters the Activation of Human Short-Linker CaMKII
The human short-linker CaMKII construct is activated cooperatively by Ca2+/CaM (Hill coefficient, nH of 2.1) with an EC50 (concentration at half-maximal velocity) value of 6.0 μM (Figure 4A). This EC50 value for the human short-linker construct is much higher than that for isoforms with longer linkers (typically
around ∼25 nM), consistent with a strengthening of autoinhibition due to shortening of the linker.
When the β clip region in the hub domain is mutated in the human short-linker constructs (I321E), the
EC50 value is shifted to ∼30 nM (Figure 4A). We find similar effects with mutations in the hub domain
spur (Figure S4A). In addition, we also observe an elimination of cooperative activation in these mutants,
with nH ∼1.0.
40
Figure 4. Human Short-Linker CaMKII Activation and Conformation(A) Central hub mutation results in a decreased EC50 and a reduced nH. The human short-linker CaMKII shows high cooperativity and a μM EC50 value, whereas a human short-linker CaMKII with central hub mutation shows noncooperative activation and a nM EC50 value. Error bars and ± terms expressed are standard error of the mean (SEM).(B) Autonomous activity of the long-linker CaMKII increases with the frequency of stimuli (100 ms pulse durations). Error bars and ± terms expressed are SEM.(C) Short-linker human CaMKII autonomous activity (red) compared with autonomous activity of short-linker CaMKII with a mutation at the β clip docking interaction
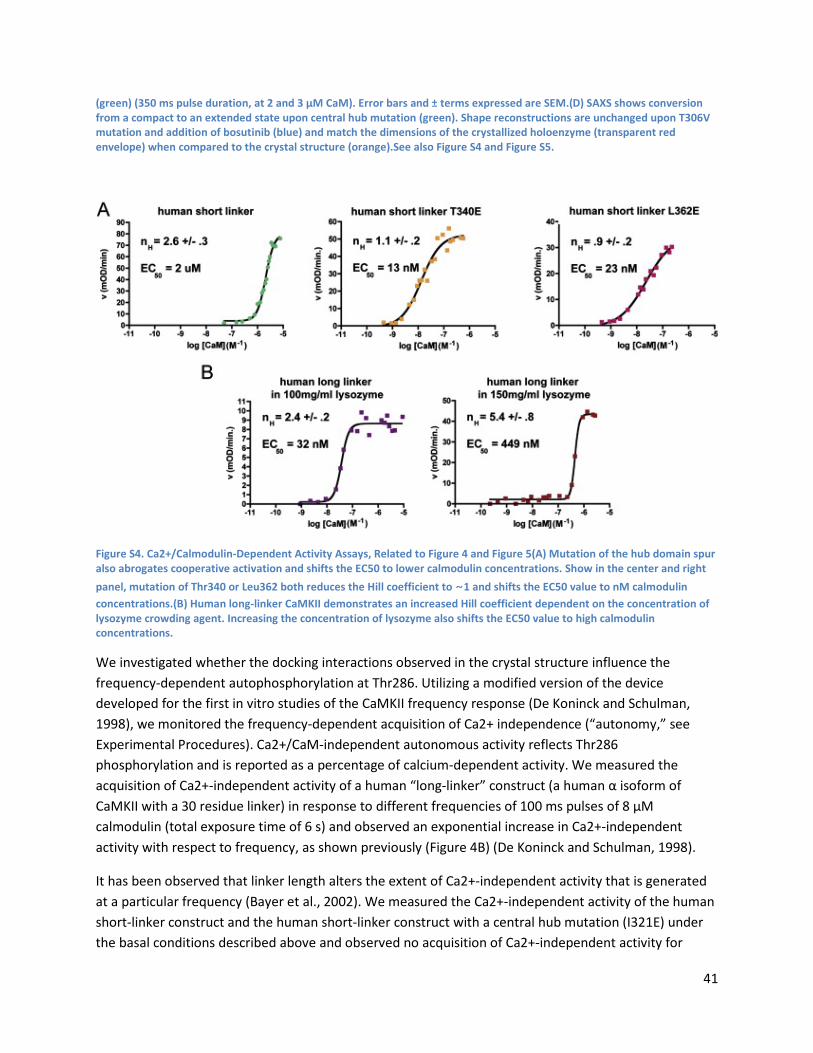
41
(green) (350 ms pulse duration, at 2 and 3 μM CaM). Error bars and ± terms expressed are SEM.(D) SAXS shows conversion from a compact to an extended state upon central hub mutation (green). Shape reconstructions are unchanged upon T306V mutation and addition of bosutinib (blue) and match the dimensions of the crystallized holoenzyme (transparent red envelope) when compared to the crystal structure (orange).See also Figure S4 and Figure S5.
Figure S4. Ca2+/Calmodulin-Dependent Activity Assays, Related to Figure 4 and Figure 5(A) Mutation of the hub domain spur also abrogates cooperative activation and shifts the EC50 to lower calmodulin concentrations. Show in the center and right panel, mutation of Thr340 or Leu362 both reduces the Hill coefficient to ∼1 and shifts the EC50 value to nM calmodulin concentrations.(B) Human long-linker CaMKII demonstrates an increased Hill coefficient dependent on the concentration of lysozyme crowding agent. Increasing the concentration of lysozyme also shifts the EC50 value to high calmodulin concentrations.
We investigated whether the docking interactions observed in the crystal structure influence the frequency-dependent autophosphorylation at Thr286. Utilizing a modified version of the device developed for the first in vitro studies of the CaMKII frequency response (De Koninck and Schulman, 1998), we monitored the frequency-dependent acquisition of Ca2+ independence (“autonomy,” see Experimental Procedures). Ca2+/CaM-independent autonomous activity reflects Thr286 phosphorylation and is reported as a percentage of calcium-dependent activity. We measured the acquisition of Ca2+-independent activity of a human “long-linker” construct (a human α isoform of CaMKII with a 30 residue linker) in response to different frequencies of 100 ms pulses of 8 μM calmodulin (total exposure time of 6 s) and observed an exponential increase in Ca2+-independent activity with respect to frequency, as shown previously (Figure 4B) (De Koninck and Schulman, 1998).
It has been observed that linker length alters the extent of Ca2+-independent activity that is generated at a particular frequency (Bayer et al., 2002). We measured the Ca2+-independent activity of the human short-linker construct and the human short-linker construct with a central hub mutation (I321E) under the basal conditions described above and observed no acquisition of Ca2+-independent activity for
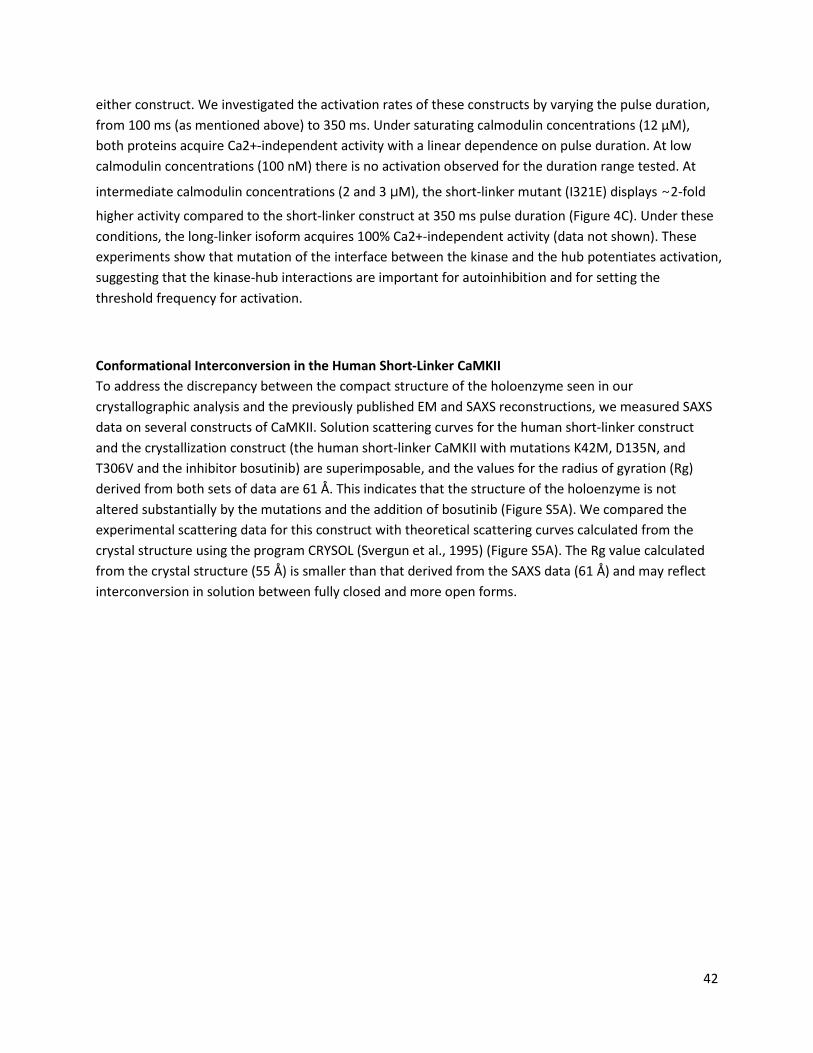
42
either construct. We investigated the activation rates of these constructs by varying the pulse duration, from 100 ms (as mentioned above) to 350 ms. Under saturating calmodulin concentrations (12 μM), both proteins acquire Ca2+-independent activity with a linear dependence on pulse duration. At low calmodulin concentrations (100 nM) there is no activation observed for the duration range tested. At
intermediate calmodulin concentrations (2 and 3 μM), the short-linker mutant (I321E) displays ∼2-fold
higher activity compared to the short-linker construct at 350 ms pulse duration (Figure 4C). Under these conditions, the long-linker isoform acquires 100% Ca2+-independent activity (data not shown). These experiments show that mutation of the interface between the kinase and the hub potentiates activation, suggesting that the kinase-hub interactions are important for autoinhibition and for setting the threshold frequency for activation.
Conformational Interconversion in the Human Short-Linker CaMKII To address the discrepancy between the compact structure of the holoenzyme seen in our crystallographic analysis and the previously published EM and SAXS reconstructions, we measured SAXS data on several constructs of CaMKII. Solution scattering curves for the human short-linker construct and the crystallization construct (the human short-linker CaMKII with mutations K42M, D135N, and T306V and the inhibitor bosutinib) are superimposable, and the values for the radius of gyration (Rg) derived from both sets of data are 61 Å. This indicates that the structure of the holoenzyme is not altered substantially by the mutations and the addition of bosutinib (Figure S5A). We compared the experimental scattering data for this construct with theoretical scattering curves calculated from the crystal structure using the program CRYSOL (Svergun et al., 1995) (Figure S5A). The Rg value calculated from the crystal structure (55 Å) is smaller than that derived from the SAXS data (61 Å) and may reflect interconversion in solution between fully closed and more open forms.
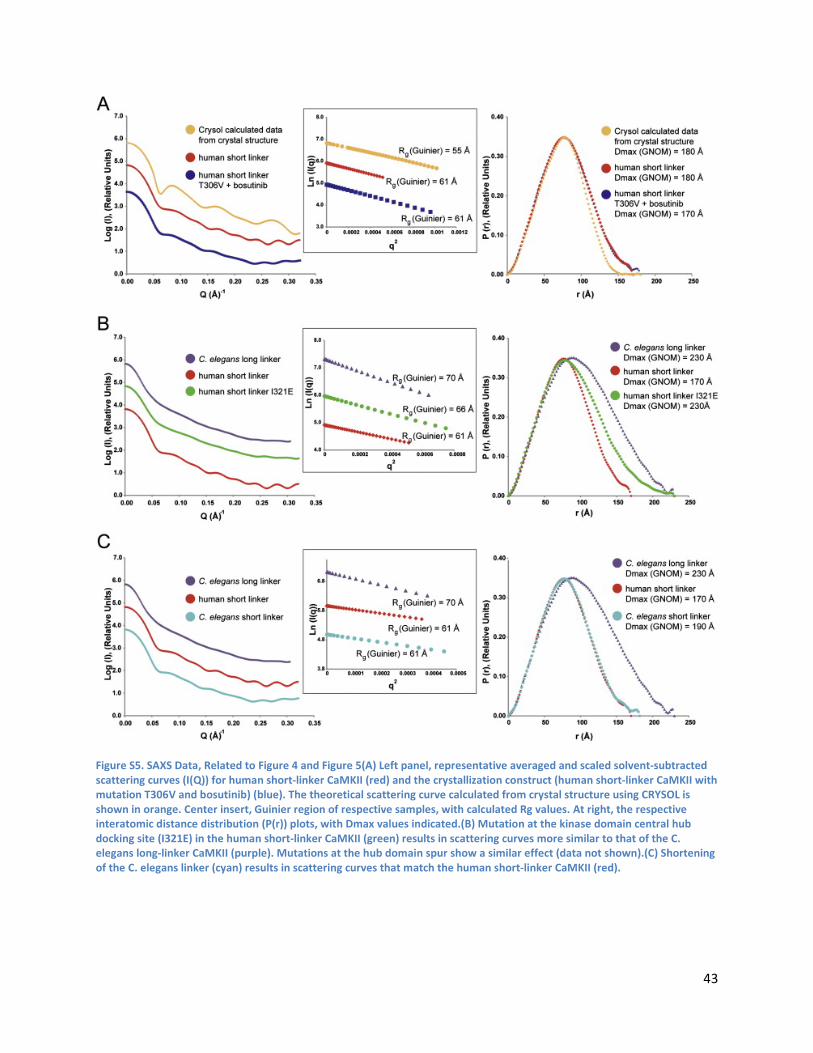
43
Figure S5. SAXS Data, Related to Figure 4 and Figure 5(A) Left panel, representative averaged and scaled solvent-subtracted scattering curves (I(Q)) for human short-linker CaMKII (red) and the crystallization construct (human short-linker CaMKII with mutation T306V and bosutinib) (blue). The theoretical scattering curve calculated from crystal structure using CRYSOL is shown in orange. Center insert, Guinier region of respective samples, with calculated Rg values. At right, the respective interatomic distance distribution (P(r)) plots, with Dmax values indicated.(B) Mutation at the kinase domain central hub docking site (I321E) in the human short-linker CaMKII (green) results in scattering curves more similar to that of the C. elegans long-linker CaMKII (purple). Mutations at the hub domain spur show a similar effect (data not shown).(C) Shortening of the C. elegans linker (cyan) results in scattering curves that match the human short-linker CaMKII (red).
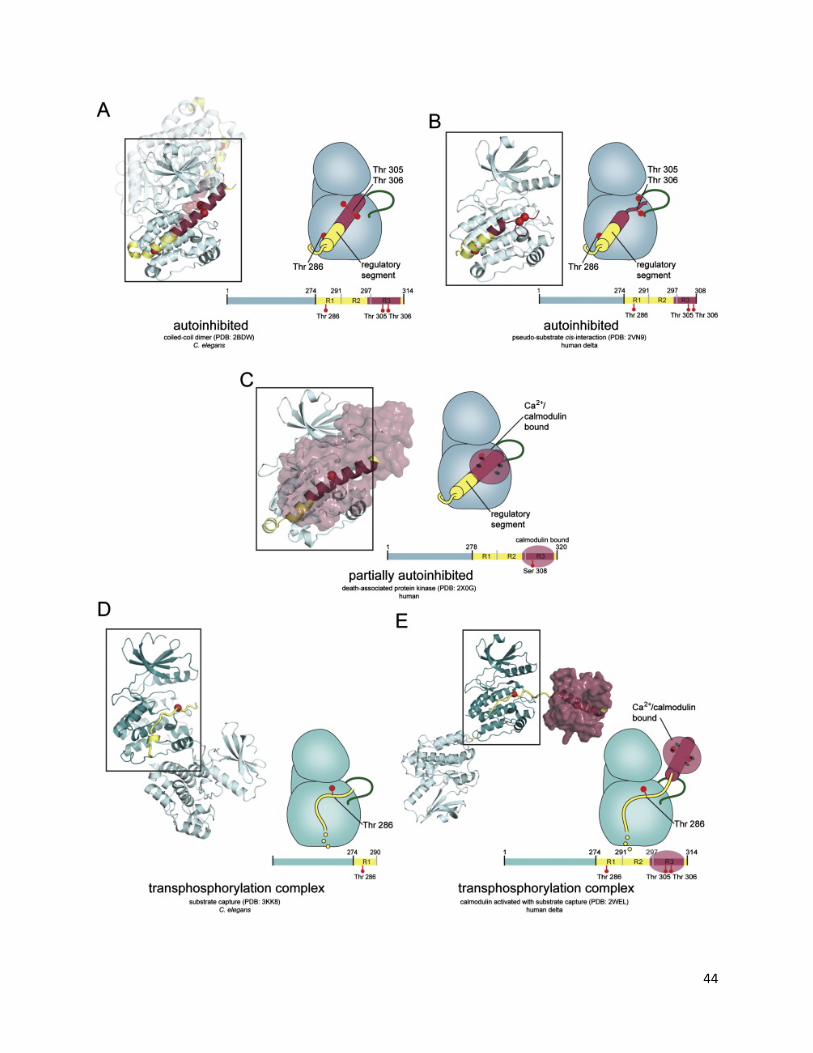
44
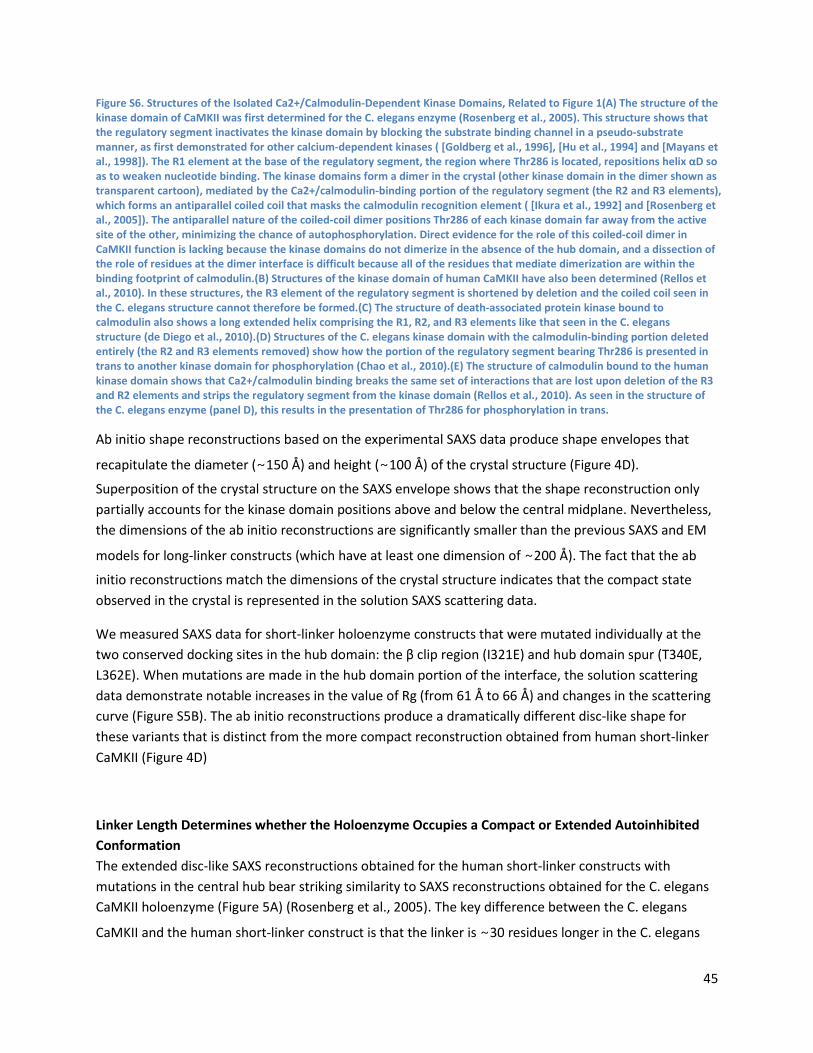
45
Figure S6. Structures of the Isolated Ca2+/Calmodulin-Dependent Kinase Domains, Related to Figure 1(A) The structure of the kinase domain of CaMKII was first determined for the C. elegans enzyme (Rosenberg et al., 2005). This structure shows that the regulatory segment inactivates the kinase domain by blocking the substrate binding channel in a pseudo-substrate manner, as first demonstrated for other calcium-dependent kinases ( [Goldberg et al., 1996], [Hu et al., 1994] and [Mayans et al., 1998]). The R1 element at the base of the regulatory segment, the region where Thr286 is located, repositions helix αD so as to weaken nucleotide binding. The kinase domains form a dimer in the crystal (other kinase domain in the dimer shown as transparent cartoon), mediated by the Ca2+/calmodulin-binding portion of the regulatory segment (the R2 and R3 elements), which forms an antiparallel coiled coil that masks the calmodulin recognition element ( [Ikura et al., 1992] and [Rosenberg et al., 2005]). The antiparallel nature of the coiled-coil dimer positions Thr286 of each kinase domain far away from the active site of the other, minimizing the chance of autophosphorylation. Direct evidence for the role of this coiled-coil dimer in CaMKII function is lacking because the kinase domains do not dimerize in the absence of the hub domain, and a dissection of the role of residues at the dimer interface is difficult because all of the residues that mediate dimerization are within the binding footprint of calmodulin.(B) Structures of the kinase domain of human CaMKII have also been determined (Rellos et al., 2010). In these structures, the R3 element of the regulatory segment is shortened by deletion and the coiled coil seen in the C. elegans structure cannot therefore be formed.(C) The structure of death-associated protein kinase bound to calmodulin also shows a long extended helix comprising the R1, R2, and R3 elements like that seen in the C. elegans structure (de Diego et al., 2010).(D) Structures of the C. elegans kinase domain with the calmodulin-binding portion deleted entirely (the R2 and R3 elements removed) show how the portion of the regulatory segment bearing Thr286 is presented in trans to another kinase domain for phosphorylation (Chao et al., 2010).(E) The structure of calmodulin bound to the human kinase domain shows that Ca2+/calmodulin binding breaks the same set of interactions that are lost upon deletion of the R3 and R2 elements and strips the regulatory segment from the kinase domain (Rellos et al., 2010). As seen in the structure of the C. elegans enzyme (panel D), this results in the presentation of Thr286 for phosphorylation in trans.
Ab initio shape reconstructions based on the experimental SAXS data produce shape envelopes that
recapitulate the diameter (∼150 Å) and height (∼100 Å) of the crystal structure (Figure 4D).
Superposition of the crystal structure on the SAXS envelope shows that the shape reconstruction only partially accounts for the kinase domain positions above and below the central midplane. Nevertheless, the dimensions of the ab initio reconstructions are significantly smaller than the previous SAXS and EM
models for long-linker constructs (which have at least one dimension of ∼200 Å). The fact that the ab
initio reconstructions match the dimensions of the crystal structure indicates that the compact state observed in the crystal is represented in the solution SAXS scattering data.
We measured SAXS data for short-linker holoenzyme constructs that were mutated individually at the two conserved docking sites in the hub domain: the β clip region (I321E) and hub domain spur (T340E, L362E). When mutations are made in the hub domain portion of the interface, the solution scattering data demonstrate notable increases in the value of Rg (from 61 Å to 66 Å) and changes in the scattering curve (Figure S5B). The ab initio reconstructions produce a dramatically different disc-like shape for these variants that is distinct from the more compact reconstruction obtained from human short-linker CaMKII (Figure 4D)
Linker Length Determines whether the Holoenzyme Occupies a Compact or Extended Autoinhibited Conformation The extended disc-like SAXS reconstructions obtained for the human short-linker constructs with mutations in the central hub bear striking similarity to SAXS reconstructions obtained for the C. elegans CaMKII holoenzyme (Figure 5A) (Rosenberg et al., 2005). The key difference between the C. elegans
CaMKII and the human short-linker construct is that the linker is ∼30 residues longer in the C. elegans
46
construct (Figure S1). We collected SAXS data on a sample of C. elegans CaMKII with its linker segment deleted and observed scattering curves corresponding to a reduced Rg value (61 Å) and ab inito shape reconstructions that resemble those for the human short-linker CaMKII. Likewise, when we measure
data from human long-linker CaMKII (the α isoform, which has an ∼30 residue linker), we obtain
scattering curves and extended shape reconstructions similar to those obtained for the C. elegans CaMKII and the mutated human short-linker form. The SAXS data for the C. elegans CaMKII have been interpreted previously in terms of dimers of CaMKII kinase domains arranged around the central hub, but direct evidence for this model is lacking (Rosenberg et al., 2005). Previous SAXS and FRET analyses indicate that the extended autoinhibited assembly unravels further to an even more extended form upon Ca2+/CaM binding ( [Rosenberg et al., 2005] and [Thaler et al., 2009]).
These data suggest that the length of the linker determines the distribution of conformations of the holoenzyme in solution, and that changes in the linker length alter the equilibrium between the compact form observed in the crystal structure and a more extended disc-like form. The ability to interconvert between compact and extended autoinhibited conformations of both human and C. elegans forms of the enzymes suggests that this equilibrium is a general feature of the enzyme.
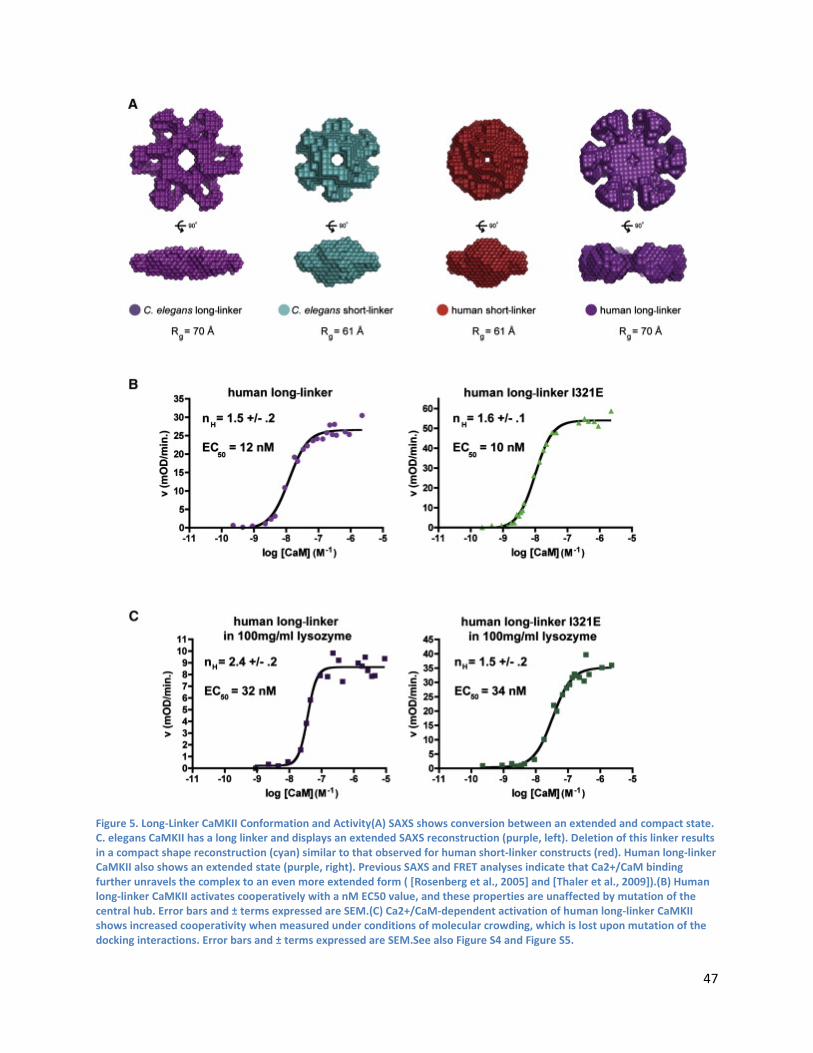
47
Figure 5. Long-Linker CaMKII Conformation and Activity(A) SAXS shows conversion between an extended and compact state. C. elegans CaMKII has a long linker and displays an extended SAXS reconstruction (purple, left). Deletion of this linker results in a compact shape reconstruction (cyan) similar to that observed for human short-linker constructs (red). Human long-linker CaMKII also shows an extended state (purple, right). Previous SAXS and FRET analyses indicate that Ca2+/CaM binding further unravels the complex to an even more extended form ( [Rosenberg et al., 2005] and [Thaler et al., 2009]).(B) Human long-linker CaMKII activates cooperatively with a nM EC50 value, and these properties are unaffected by mutation of the central hub. Error bars and ± terms expressed are SEM.(C) Ca2+/CaM-dependent activation of human long-linker CaMKII shows increased cooperativity when measured under conditions of molecular crowding, which is lost upon mutation of the docking interactions. Error bars and ± terms expressed are SEM.See also Figure S4 and Figure S5.
48
The Docking of Kinase Domains onto the Central Hub Is Also Relevant for CaMKII Isoforms with Long Linkers Considering the high conservation of the kinase and hub domains, we reasoned that the compact holoenzyme assembly may also be relevant for isoforms with longer linkers. We measured the Ca2+/CaM-dependent activation of human long-linker CaMKII and observe a level of cooperativity similar to that observed previously (Chao et al., 2010). When residues important for kinase domain-central hub docking are mutated, the Hill coefficient and the EC50 value for activation are unaffected (Figure 5B).
The SAXS measurements and the activity assays described previously were carried out under standard laboratory assay conditions, where protein concentrations are much lower than those found in the interior of the cell. Because the conversion between the compact and extended forms of the CaMKII holoenzyme involves a particularly large change in molecular dimensions, we expect that this conformational change would be sensitive to the density of macromolecules around the holoenzyme. In crowded cellular environments, the total concentration of protein ranges from 300–400 mg/ml (Ellis, 2001). We measured the activation of human long-linker CaMKII under simulated conditions of macromolecular crowding by using 100 mg/ml lysozyme and observe that the Hill coefficient for this construct increases from 1.4 to 2.4. The increases in the Hill coefficient and EC50 value are dependent on the concentration of crowding agent (Figure 5C; Figure S4B).
When the same measurement is performed with a mutant that disrupts kinase docking against the central hub (I321E), we do not observe an increased Hill coefficient, suggesting that the increase in cooperativity is dependent on the docking interactions observed in the crystal structure.
The similar levels of cooperativity observed for the human long-linker CaMKII with and without central hub mutations suggest that the extended SAXS conformation seen in dilute solution is not dependent on the docking interactions visualized in the crystal structure. Nevertheless, the fact that the Hill coefficient and the EC50 value both respond to the central hub mutations under crowding conditions indicates that CaMKII holoenzymes with long linkers do sample the compact state, but less frequently. Taken together, these data indicate that the linker region modulates an equilibrium between compact and extended autoinhibited states to alter the strength of docking interactions.
Simulation of CaMKII Activation by Ca2+/CaM Several computational analyses of CaMKII have been published previously (see, for example, [Chiba et al., 2008] and [Pepke et al., 2010]) but do not take explicit account of the architecture of the holoenzyme. One conclusion from these studies is that a frequency-dependent response to Ca2+/CaM does not require a multimeric holoenzyme. Sensitivity to the frequency of calcium spikes arises naturally from the association and dissociation rates for the interaction of Ca2+ with calmodulin, the interaction of Ca2+/CaM with CaMKII, and the catalytic rate constant for the phosphorylation of Thr286 on one CaMKII subunit by another. Given these conclusions, we wondered what aspect of the frequency-dependent behavior of CaMKII might be dependent on the dodecameric holoenzyme.
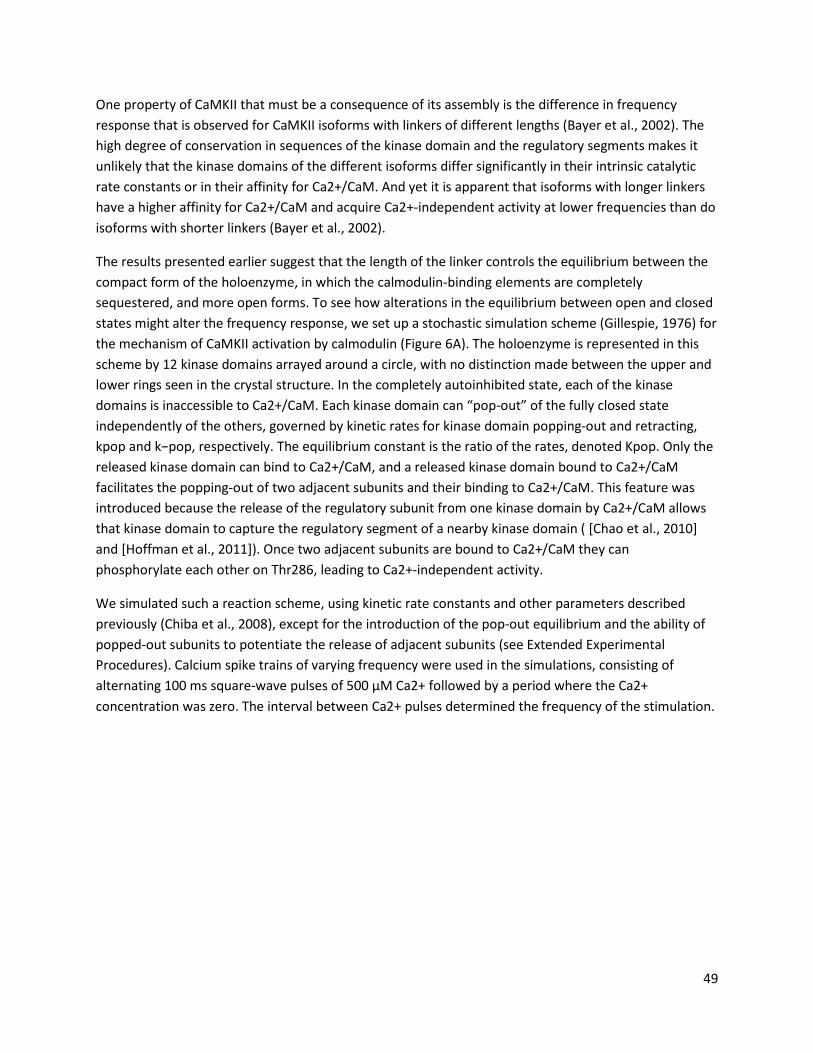
49
One property of CaMKII that must be a consequence of its assembly is the difference in frequency response that is observed for CaMKII isoforms with linkers of different lengths (Bayer et al., 2002). The high degree of conservation in sequences of the kinase domain and the regulatory segments makes it unlikely that the kinase domains of the different isoforms differ significantly in their intrinsic catalytic rate constants or in their affinity for Ca2+/CaM. And yet it is apparent that isoforms with longer linkers have a higher affinity for Ca2+/CaM and acquire Ca2+-independent activity at lower frequencies than do isoforms with shorter linkers (Bayer et al., 2002).
The results presented earlier suggest that the length of the linker controls the equilibrium between the compact form of the holoenzyme, in which the calmodulin-binding elements are completely sequestered, and more open forms. To see how alterations in the equilibrium between open and closed states might alter the frequency response, we set up a stochastic simulation scheme (Gillespie, 1976) for the mechanism of CaMKII activation by calmodulin (Figure 6A). The holoenzyme is represented in this scheme by 12 kinase domains arrayed around a circle, with no distinction made between the upper and lower rings seen in the crystal structure. In the completely autoinhibited state, each of the kinase domains is inaccessible to Ca2+/CaM. Each kinase domain can “pop-out” of the fully closed state independently of the others, governed by kinetic rates for kinase domain popping-out and retracting, kpop and k−pop, respectively. The equilibrium constant is the ratio of the rates, denoted Kpop. Only the released kinase domain can bind to Ca2+/CaM, and a released kinase domain bound to Ca2+/CaM facilitates the popping-out of two adjacent subunits and their binding to Ca2+/CaM. This feature was introduced because the release of the regulatory subunit from one kinase domain by Ca2+/CaM allows that kinase domain to capture the regulatory segment of a nearby kinase domain ( [Chao et al., 2010] and [Hoffman et al., 2011]). Once two adjacent subunits are bound to Ca2+/CaM they can phosphorylate each other on Thr286, leading to Ca2+-independent activity.
We simulated such a reaction scheme, using kinetic rate constants and other parameters described previously (Chiba et al., 2008), except for the introduction of the pop-out equilibrium and the ability of popped-out subunits to potentiate the release of adjacent subunits (see Extended Experimental Procedures). Calcium spike trains of varying frequency were used in the simulations, consisting of alternating 100 ms square-wave pulses of 500 μM Ca2+ followed by a period where the Ca2+ concentration was zero. The interval between Ca2+ pulses determined the frequency of the stimulation.
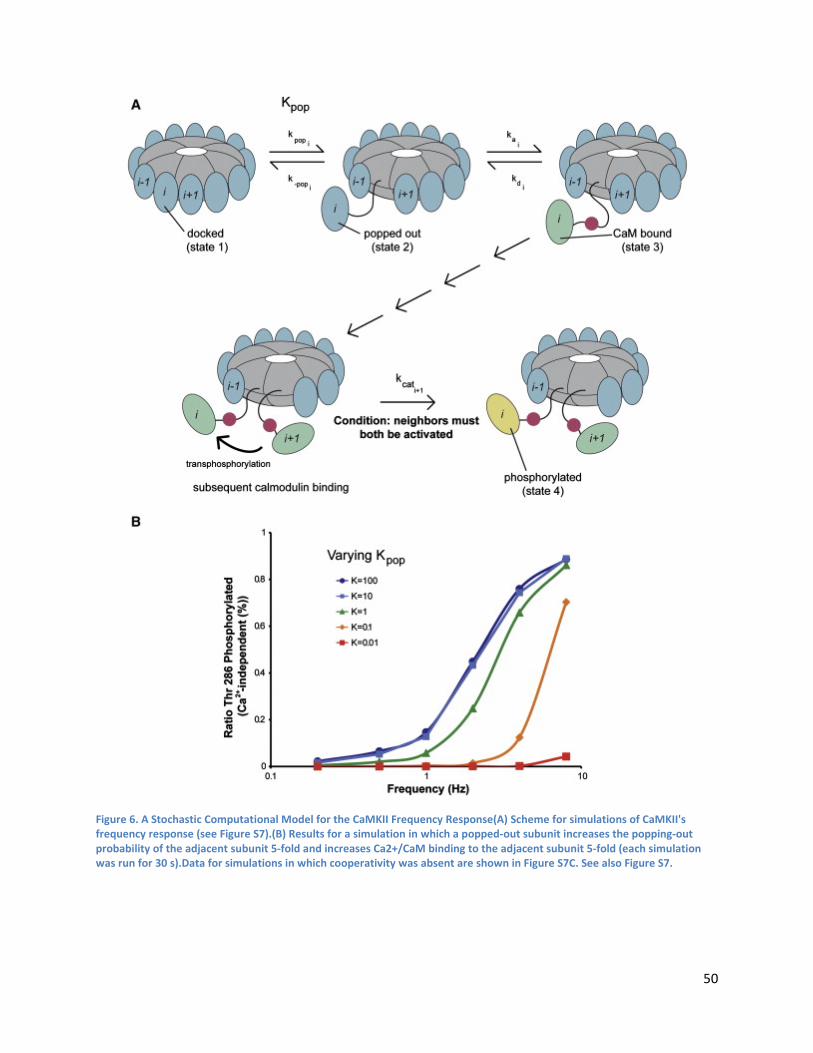
50
Figure 6. A Stochastic Computational Model for the CaMKII Frequency Response(A) Scheme for simulations of CaMKII's frequency response (see Figure S7).(B) Results for a simulation in which a popped-out subunit increases the popping-out probability of the adjacent subunit 5-fold and increases Ca2+/CaM binding to the adjacent subunit 5-fold (each simulation was run for 30 s).Data for simulations in which cooperativity was absent are shown in Figure S7C. See also Figure S7.
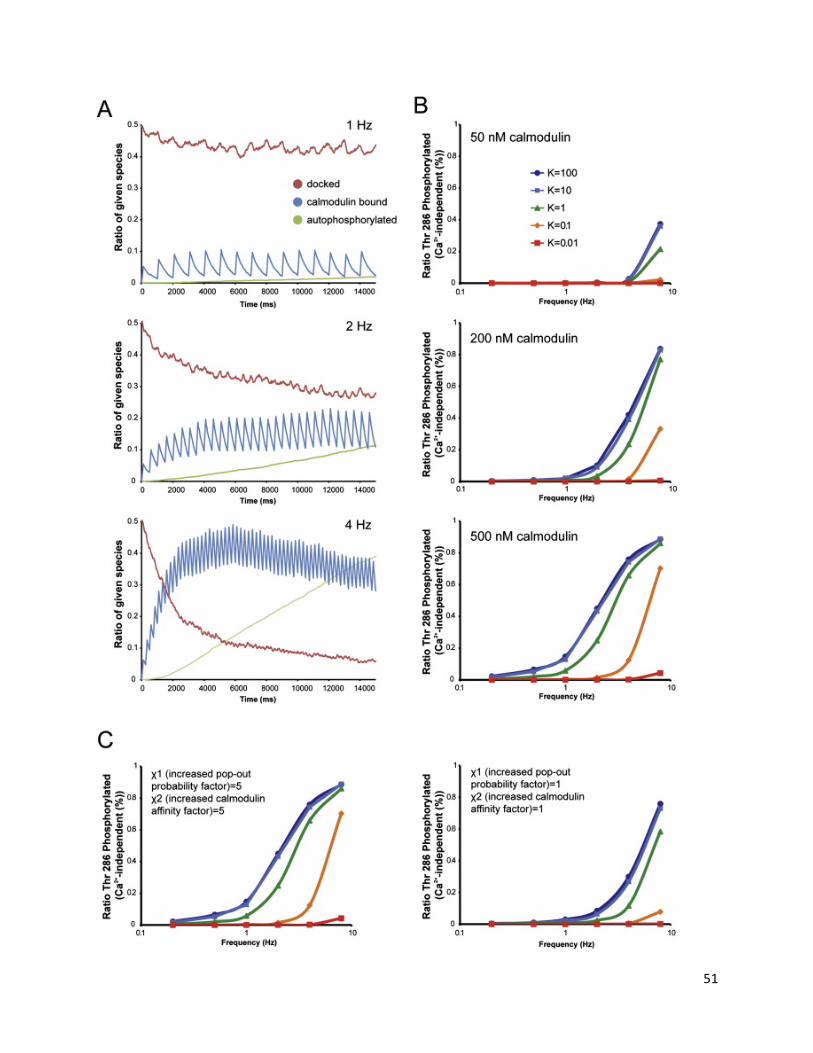
51
52
Figure S7. Results of Stochastic Simulations for the Frequency-Dependent Activation of CaMKII by Ca2+/CaM, Related to Figure 6(A) Plots illustrating the time evolution of different subunit species (docked, calmodulin-bound, and Thr286 phosphorylated) while varying the frequency of calcium stimulation.(B) Accumulation of Thr286 phosphorylation upon varying the values of kpop and k−pop to change the pop-out equilibrium constant, K from 10−2 to 102, at three different calmodulin concentrations.(C) The effect on Thr286 phosphorylation of altering the factor χ1, a coupling factor for pop-out probability for adjacent subunits, and the factor χ2 for increased calmodulin-binding probability to adjacent subunits.
We monitored the accumulation of Thr286 phosphorylation with time in these simulations, while varying the values of kpop and k−pop to change the pop-out equilibrium constant, Kpop, from 10−2 to 102. Results for a calmodulin concentration of 500 nM are shown in Figure 6B (the time evolution of different species and additional calmodulin concentrations are shown in Figure S7). These results show clearly that the stability of the closed form has a strong effect on the frequency response of the holoenzyme. When the holoenzyme is strongly biased toward the open form (Kpop is 10 or higher), it gains substantial Ca2+ independence with pulse trains between 1 and 10 Hz. In contrast, for lower values of Kpop, much less activity is seen for the same range of frequencies. This trend is also maintained in simulations in which a popped-out subunit does not influence the popping-out of an adjacent subunit or its ability to bind to Ca2+/CaM (Figure S7C).
Our simulation results suggest that the interconversion between the open and closed forms provides an additional kinetic step in the activation of CaMKII that is readily varied without changing the catalytic machinery or the regulatory segment. Changes in the linker length might also change the rate at which kinase domains can access each other for the transphosphorylation reaction, but we have not included this in our simulations because there is limited information on this aspect of the reaction.
4.4 Conclusions
We have determined the structure of the CaMKII holoenzyme in an autoinhibited state and shown how the regulation of the enzyme involves the integration of the autoinhibitory elements directly into the central hub that organizes the dodecameric assembly. The structure we have determined presumably corresponds to the most tightly inhibited assembly of the enzyme, and one in which the calmodulin-binding elements cannot be accessed by calmodulin. We have shown that CaMKII undergoes a dynamic equilibrium between this compact form and a more extended form where the kinase domains are released from the tight embrace of the central hub but are still autoinhibited (Figure 7). We surmise that it is this more extended form to which calmodulin binds, and that the response of the enzyme to the frequency of activating calcium spikes is tuned by varying the balance of this equilibrium. Our structure explains how CaMKII variants with different linker lengths are all consistent with adoption of either class of structures while having altered preferences for the set-point of the equilibrium.
A basic function of the holoenzyme architecture early in evolution may have simply been to concentrate CaMKII where it is most needed. Once the enzyme was concentrated in this way, evolutionary pressure to prevent spurious transphosphorylation would have become acute, and the holoenzyme assembly that we describe here is presumably the result. Colocalization into a homomultimeric assembly can provide evolutionary advantages for evolving allosteric control (Kuriyan and Eisenberg, 2007). The structure
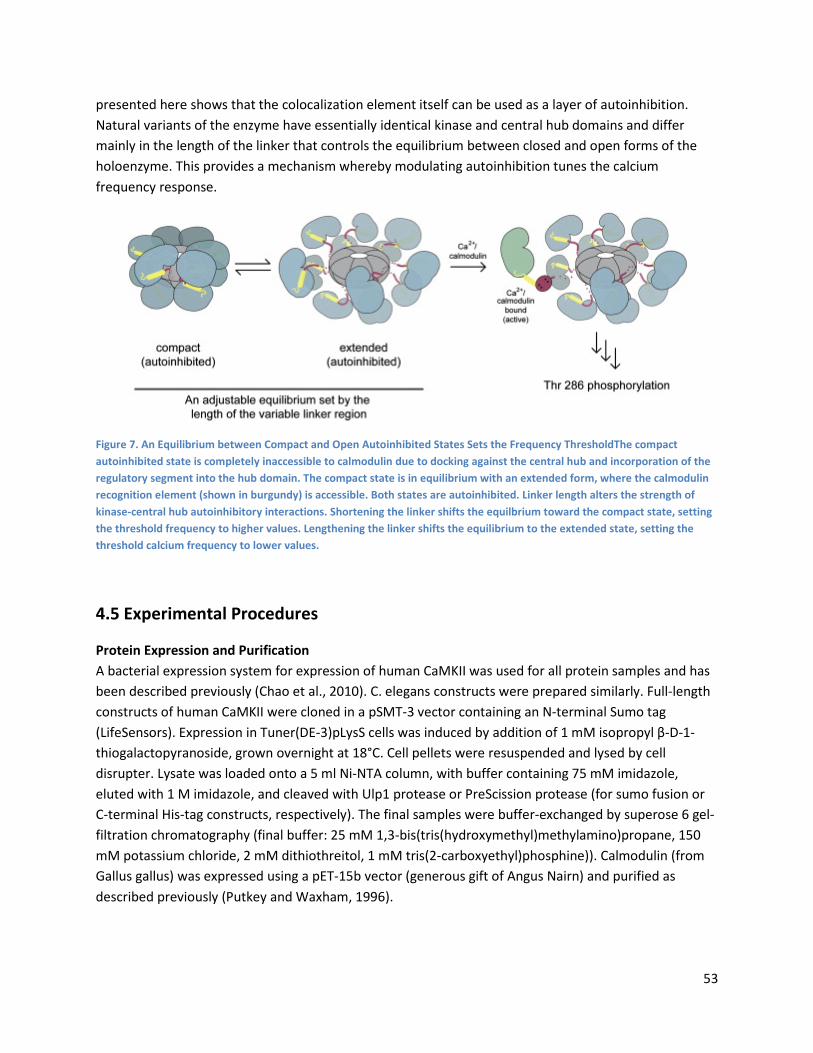
53
presented here shows that the colocalization element itself can be used as a layer of autoinhibition. Natural variants of the enzyme have essentially identical kinase and central hub domains and differ mainly in the length of the linker that controls the equilibrium between closed and open forms of the holoenzyme. This provides a mechanism whereby modulating autoinhibition tunes the calcium frequency response.
Figure 7. An Equilibrium between Compact and Open Autoinhibited States Sets the Frequency ThresholdThe compact autoinhibited state is completely inaccessible to calmodulin due to docking against the central hub and incorporation of the regulatory segment into the hub domain. The compact state is in equilibrium with an extended form, where the calmodulin recognition element (shown in burgundy) is accessible. Both states are autoinhibited. Linker length alters the strength of kinase-central hub autoinhibitory interactions. Shortening the linker shifts the equilbrium toward the compact state, setting the threshold frequency to higher values. Lengthening the linker shifts the equilibrium to the extended state, setting the threshold calcium frequency to lower values.
4.5 Experimental Procedures
Protein Expression and Purification A bacterial expression system for expression of human CaMKII was used for all protein samples and has been described previously (Chao et al., 2010). C. elegans constructs were prepared similarly. Full-length constructs of human CaMKII were cloned in a pSMT-3 vector containing an N-terminal Sumo tag (LifeSensors). Expression in Tuner(DE-3)pLysS cells was induced by addition of 1 mM isopropyl β-D-1-thiogalactopyranoside, grown overnight at 18°C. Cell pellets were resuspended and lysed by cell disrupter. Lysate was loaded onto a 5 ml Ni-NTA column, with buffer containing 75 mM imidazole, eluted with 1 M imidazole, and cleaved with Ulp1 protease or PreScission protease (for sumo fusion or C-terminal His-tag constructs, respectively). The final samples were buffer-exchanged by superose 6 gel-filtration chromatography (final buffer: 25 mM 1,3-bis(tris(hydroxymethyl)methylamino)propane, 150 mM potassium chloride, 2 mM dithiothreitol, 1 mM tris(2-carboxyethyl)phosphine)). Calmodulin (from Gallus gallus) was expressed using a pET-15b vector (generous gift of Angus Nairn) and purified as described previously (Putkey and Waxham, 1996).
54
Crystallization of the CaMKII Holoenzyme The crystallization construct comprised residues 7–444 of human α isoform of CaMKII with the β7 linker with mutations K42M, D135N, and T306V. Protein samples were concentrated in the presence of 2-fold molar excess bosutinib, which was a gift from Giulio Superti-Furga. Crystals were grown by sitting drop vapor diffusion in 1.2 M Ammonium Tartrate, 100 mM bistrispropane (pH 5.5) from repeated seeding. An additive (0.16% w/v 1,4-Diaminobutane, 0.16% w/v 1,8-Diaminooctane, 0.16% w/v Cadaverine, 0.16% w/v Cystamine dihydrochloride, 0.16% w/v Spermidine, 0.16% w/v Spermine, 0.02 M in HEPES sodium, pH 6.8) facilitated growth of crystals in a third dimension. Crystals were cryoprotected in 25% glycerol. X-ray data were collected at the Advanced Light Source beamlines 8.2.1 and 8.2.2 at 100°K, at the wavelength 0.9537 Å.
Structure Determination and Refinement Structures were solved by molecular replacement using Phaser (McCoy et al., 2007). Refinement was performed with CNS (Brünger et al., 1998) and PHENIX (Adams et al., 2002), and model building was performed using O (Jones et al., 1991) and Coot (Emsley and Cowtan, 2004). For residue segments 299–304 and 309–314, the kinematic closure (KIC) method (Mandell et al., 2009) implemented in Rosetta revision 39011 was used to generate large numbers of potential loop models. The KIC refinement protocol was employed as described previously (Mandell et al., 2009) except for keeping the temperature fixed at kBT = 1.2 and sampling non-pivot phi/psi torsions from a Gaussian distribution 3° above and below the value after the previous move. Conformations of all side-chains within 10 Å of either segment were optimized after each kinematic move. Models were clustered by backbone root mean square deviation, and the best scoring models from the five largest clusters were compared against the electron density maps. The refined solution was obtained from the best scoring model from the largest cluster. All modeled residues for these regions (residues 299–304 and 309–314) were included in the final model.
Small-Angle X-Ray Scattering SAXS data were collected at SIBYLS beamline 12.3.1 using a Mar 165 CCD area detector (165 mm diameter). Fifteen microliter samples were loaded in a 1 mm thick chamber with 25 mm mica windows by an automated robotics setup (Hura et al., 2009). Incident X-rays were tuned to a wavelength of 1.0–1.5 Å, and the detector to sample distance was 1.5 m, resulting in scattering vectors ranging from 0.007 to 0.31 Å−1. The SAXS data were measured at three protein concentrations for each sample, with no evidence for aggregation- or concentration-dependent changes in scattering curves. The values of Rg were determined using PRIMUS (Konarev et al., 2003) and GNOM (Svergun, 1992). Eight individual shape reconstructions were generated using GASBOR (Svergun et al., 2001) and represented as average envelopes.
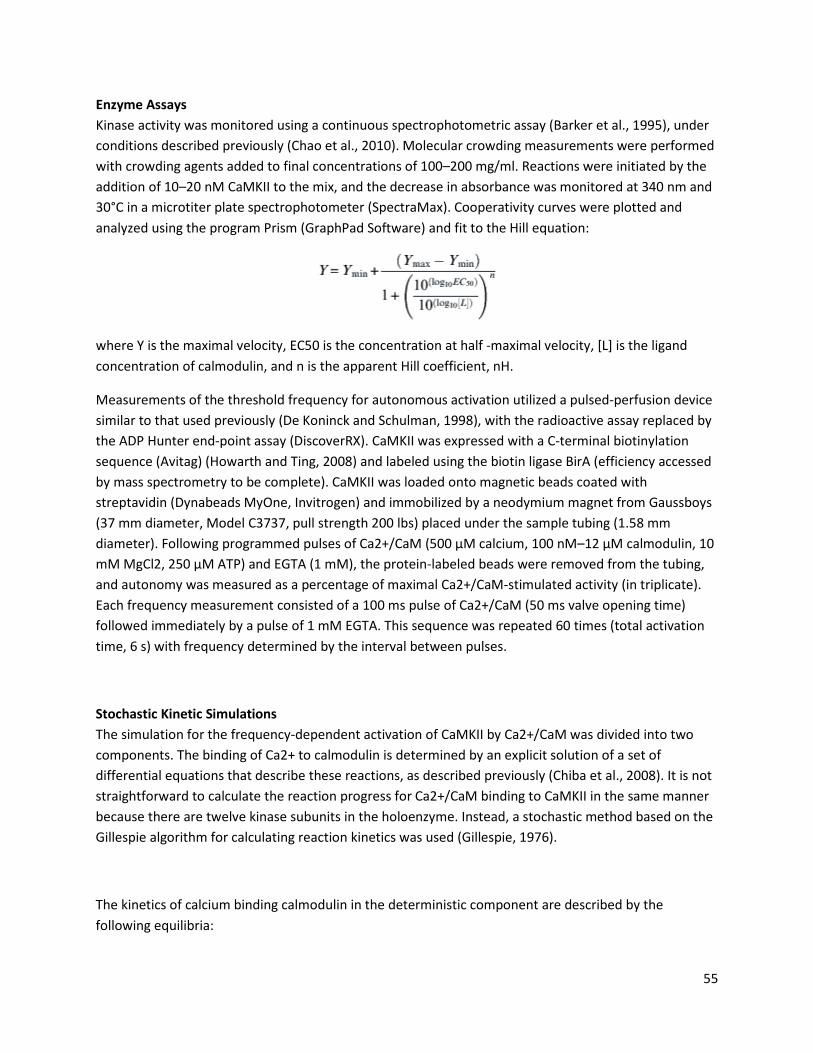
55
Enzyme Assays Kinase activity was monitored using a continuous spectrophotometric assay (Barker et al., 1995), under conditions described previously (Chao et al., 2010). Molecular crowding measurements were performed with crowding agents added to final concentrations of 100–200 mg/ml. Reactions were initiated by the addition of 10–20 nM CaMKII to the mix, and the decrease in absorbance was monitored at 340 nm and 30°C in a microtiter plate spectrophotometer (SpectraMax). Cooperativity curves were plotted and analyzed using the program Prism (GraphPad Software) and fit to the Hill equation:
where Y is the maximal velocity, EC50 is the concentration at half -maximal velocity, [L] is the ligand concentration of calmodulin, and n is the apparent Hill coefficient, nH.
Measurements of the threshold frequency for autonomous activation utilized a pulsed-perfusion device similar to that used previously (De Koninck and Schulman, 1998), with the radioactive assay replaced by the ADP Hunter end-point assay (DiscoverRX). CaMKII was expressed with a C-terminal biotinylation sequence (Avitag) (Howarth and Ting, 2008) and labeled using the biotin ligase BirA (efficiency accessed by mass spectrometry to be complete). CaMKII was loaded onto magnetic beads coated with streptavidin (Dynabeads MyOne, Invitrogen) and immobilized by a neodymium magnet from Gaussboys (37 mm diameter, Model C3737, pull strength 200 lbs) placed under the sample tubing (1.58 mm diameter). Following programmed pulses of Ca2+/CaM (500 μM calcium, 100 nM–12 μM calmodulin, 10 mM MgCl2, 250 μM ATP) and EGTA (1 mM), the protein-labeled beads were removed from the tubing, and autonomy was measured as a percentage of maximal Ca2+/CaM-stimulated activity (in triplicate). Each frequency measurement consisted of a 100 ms pulse of Ca2+/CaM (50 ms valve opening time) followed immediately by a pulse of 1 mM EGTA. This sequence was repeated 60 times (total activation time, 6 s) with frequency determined by the interval between pulses.
Stochastic Kinetic Simulations The simulation for the frequency-dependent activation of CaMKII by Ca2+/CaM was divided into two components. The binding of Ca2+ to calmodulin is determined by an explicit solution of a set of differential equations that describe these reactions, as described previously (Chiba et al., 2008). It is not straightforward to calculate the reaction progress for Ca2+/CaM binding to CaMKII in the same manner because there are twelve kinase subunits in the holoenzyme. Instead, a stochastic method based on the Gillespie algorithm for calculating reaction kinetics was used (Gillespie, 1976).
The kinetics of calcium binding calmodulin in the deterministic component are described by the following equilibria:
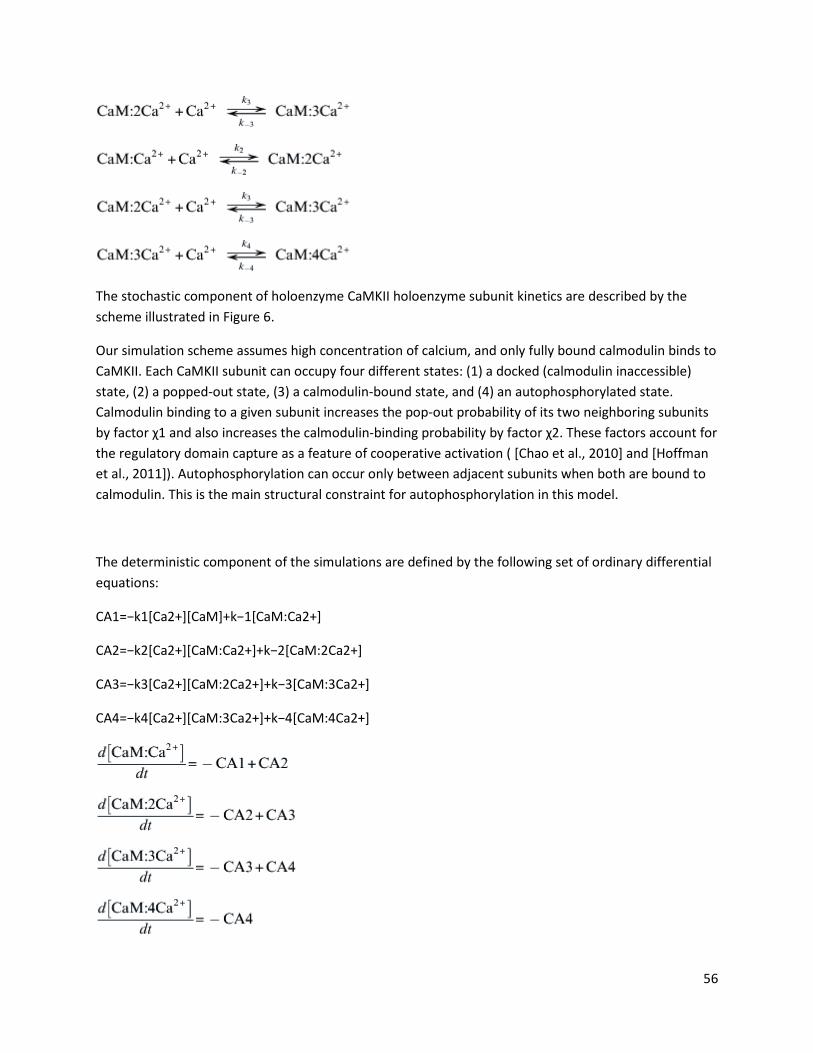
56
The stochastic component of holoenzyme CaMKII holoenzyme subunit kinetics are described by the scheme illustrated in Figure 6.
Our simulation scheme assumes high concentration of calcium, and only fully bound calmodulin binds to CaMKII. Each CaMKII subunit can occupy four different states: (1) a docked (calmodulin inaccessible) state, (2) a popped-out state, (3) a calmodulin-bound state, and (4) an autophosphorylated state. Calmodulin binding to a given subunit increases the pop-out probability of its two neighboring subunits by factor χ1 and also increases the calmodulin-binding probability by factor χ2. These factors account for the regulatory domain capture as a feature of cooperative activation ( [Chao et al., 2010] and [Hoffman et al., 2011]). Autophosphorylation can occur only between adjacent subunits when both are bound to calmodulin. This is the main structural constraint for autophosphorylation in this model.
The deterministic component of the simulations are defined by the following set of ordinary differential equations:
CA1=−k1[Ca2+][CaM]+k−1[CaM:Ca2+]
CA2=−k2[Ca2+][CaM:Ca2+]+k−2[CaM:2Ca2+]
CA3=−k3[Ca2+][CaM:2Ca2+]+k−3[CaM:3Ca2+]
CA4=−k4[Ca2+][CaM:3Ca2+]+k−4[CaM:4Ca2+]
57
[CaM]=[CaMtot]−[CaM:Ca2+]−[CaM:2Ca2+]−[CaM:3Ca2+]−[CaM:4Ca2+],
where the rate constants are:
k1=2.5mM−1ms−1
k−1=0.05ms−1
k2=88.25mM−1ms−1
k−2=0.05ms−1
k3=12.5mM−1ms−1
k−3=1.25ms−1
k4=150mM−1ms−1
k−4=1.25ms−1
[CaMtot] denotes total concentration of calmodulin. Rate constants and basic structure of these reaction pathways are derived from Chiba et al. For each unit time step, initial conditions are provided and a set of these ordinary differential equations is solved to calculate the concentration of each species after unit step time Δt (1 ms). [Ca2+] was kept constant at 500 μM, and [ATP] was fixed at 0.1 mM. The various transitions in the activation of a subunit are as follows:
Because phosphorylation of Thr286 increases the binding affinity for Ca2+/CaM by a factor of 1000, we have ignored the reverse reaction for the last step.
The values of Kpop and kpop, the equilibrium constant and rate constant for the subunits popping-out, were varied. The range for Kpop was 10−2 to 102. The range for kpop was 10−4 ms−1 to 10−2 ms−1. The value of kcat, the catalytic rate constant for the transphosphorylation reaction, was varied from 1.0 × 10⁻³ ms−1 to 1.0 × 10⁻⁵ ms−1, which is comparable to the range of values used by Chiba et al.
The kinetic rate constants for steps involved in CaMKII holoenzyme kinetics are as follows:
ka=2.1mM−1ms−1
kd=1.4·10−4ms−1
58
kd(Ca2+)=1.9·10−3ms−1
KM(CaM)=3.0·10−5mM−1
KM(ATP)=19.1·10−3mM−1
The kinetics of Ca2+/CaM binding to CaMKII were simulated by a stochastic algorithm, based on the method of Gillespie (Gillespie, 1976). In this method, the kinetic rate constants are replaced by a set of transition probabilities, p, which define the probability that a single molecule undergoes a conversion from one state to another. The transition probabilities for each process are given by:
ppop=1−e−kpop·Δt
p−pop=1−e−k−pop·Δt
pa=1−e−ka·[CaM:4Ca2+]·Δt
When Ca2+/CaM is bound to one subunit, the value of ppop is increased by the factor χ1. χ1 is set to either 1.0 or 5.0. Likewise, Ca2+/calmodulin binding increases the binding probability to adjacent subunits by a factor χ2, which is set to 1.0 or 5.0.
The stochastic simulation was carried out by considering 400 independent holoenzyme assemblies and generating trajectories in time by a Monte Carlo procedure, essentially as described by Gillespie (Gillespie, 1976). Each trajectory was initiated by generating a distribution of individual subunits between the docked and popped-out states according to the kinetic rates kpop and k−pop that defined the values for Kpop. After this was done the system was exposed to a calcium pulse train. Each Ca2+ pulse consisted of a square wave of 100 ms duration, during which time the concentration of Ca2+ was fixed at 500 μM. These pulses alternated with periods during which the concentration of Ca2+ was zero. Trajectories were generated using a time step of 1 ms. At each step the probabilities of all the possible transitions occurring were evaluated as shown below. Each possible state of a holoenzyme is denoted by f(s1, …, si, …, s12), where si is the state of the ith subunit in the holoenzyme. The values of si are 1 (docked), 2 (popped-out), 3 (calmodulin bound), and 4 (phosphorylated). Because of the circular symmetry in the holoenzyme we impose the condition that when i = 12, i+1 = 1; also that when i = 1, i-1 = 12.
The system is governed by two sets of transition probabilities, pi+ and pi-. pi+ denotes a forward transition probability (e.g., going from the docked state to the popped-out state):
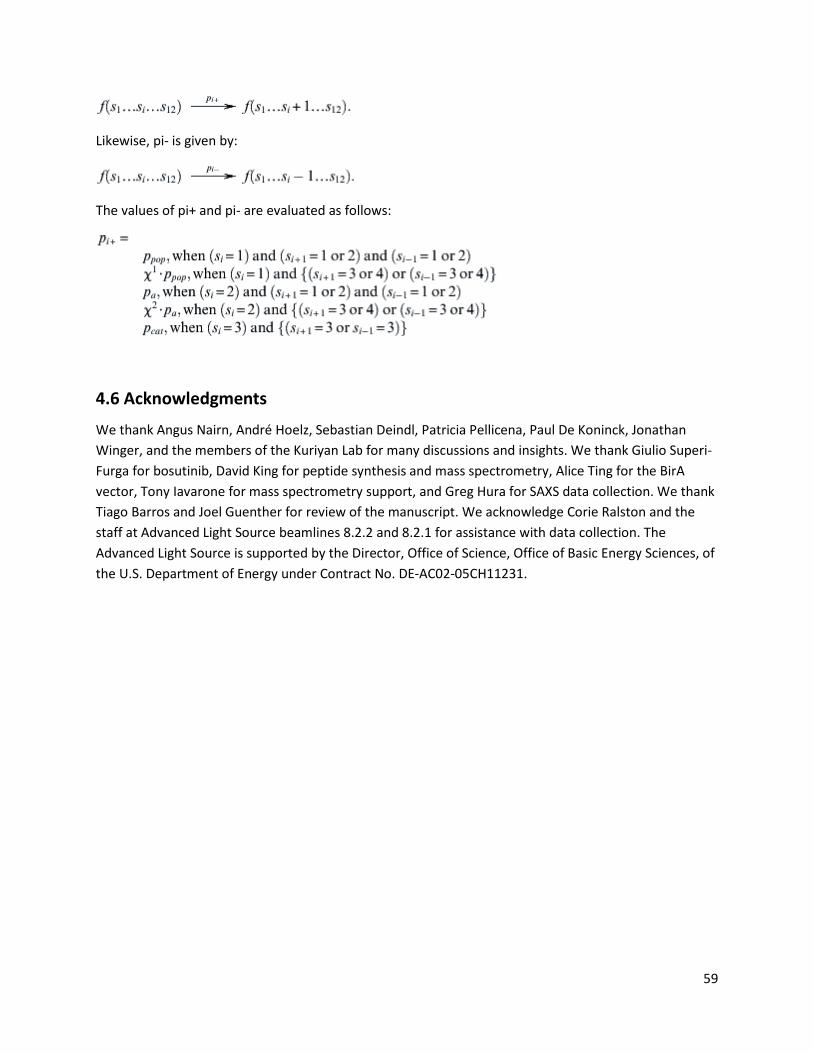
59
Likewise, pi- is given by:
The values of pi+ and pi- are evaluated as follows:
4.6 Acknowledgments
We thank Angus Nairn, André Hoelz, Sebastian Deindl, Patricia Pellicena, Paul De Koninck, Jonathan Winger, and the members of the Kuriyan Lab for many discussions and insights. We thank Giulio Superi-Furga for bosutinib, David King for peptide synthesis and mass spectrometry, Alice Ting for the BirA vector, Tony Iavarone for mass spectrometry support, and Greg Hura for SAXS data collection. We thank Tiago Barros and Joel Guenther for review of the manuscript. We acknowledge Corie Ralston and the staff at Advanced Light Source beamlines 8.2.2 and 8.2.1 for assistance with data collection. The Advanced Light Source is supported by the Director, Office of Science, Office of Basic Energy Sciences, of the U.S. Department of Energy under Contract No. DE-AC02-05CH11231.
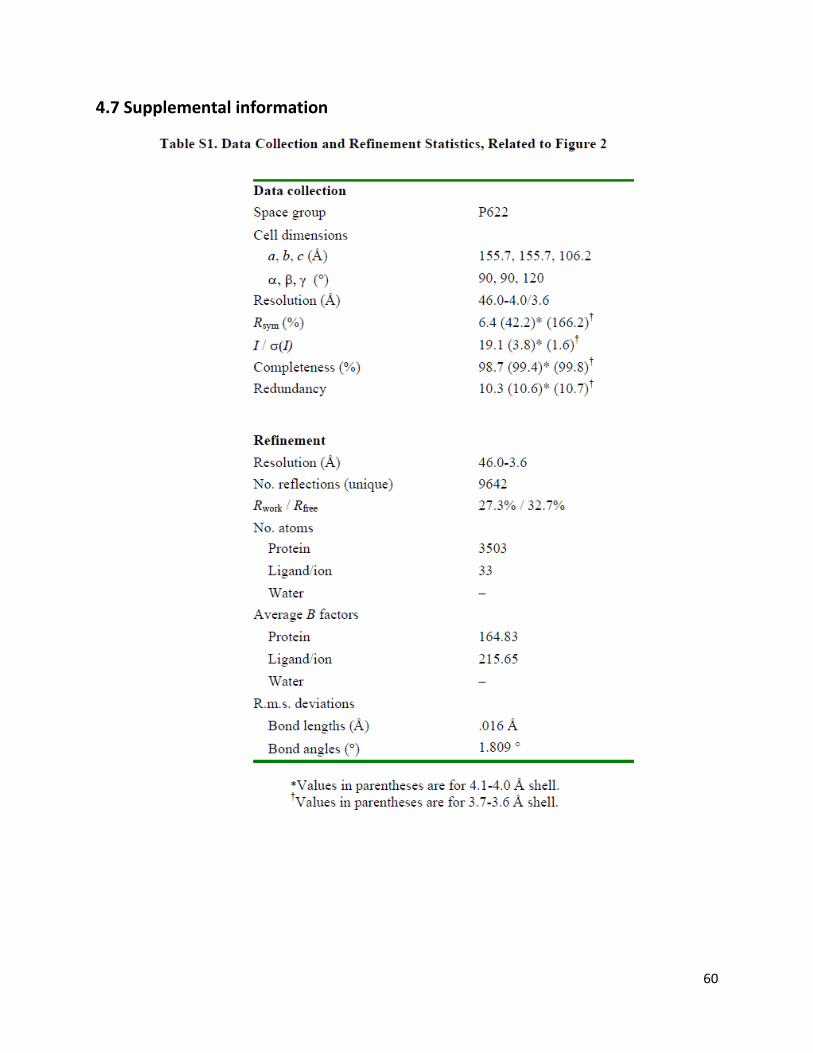
60
4.7 Supplemental information
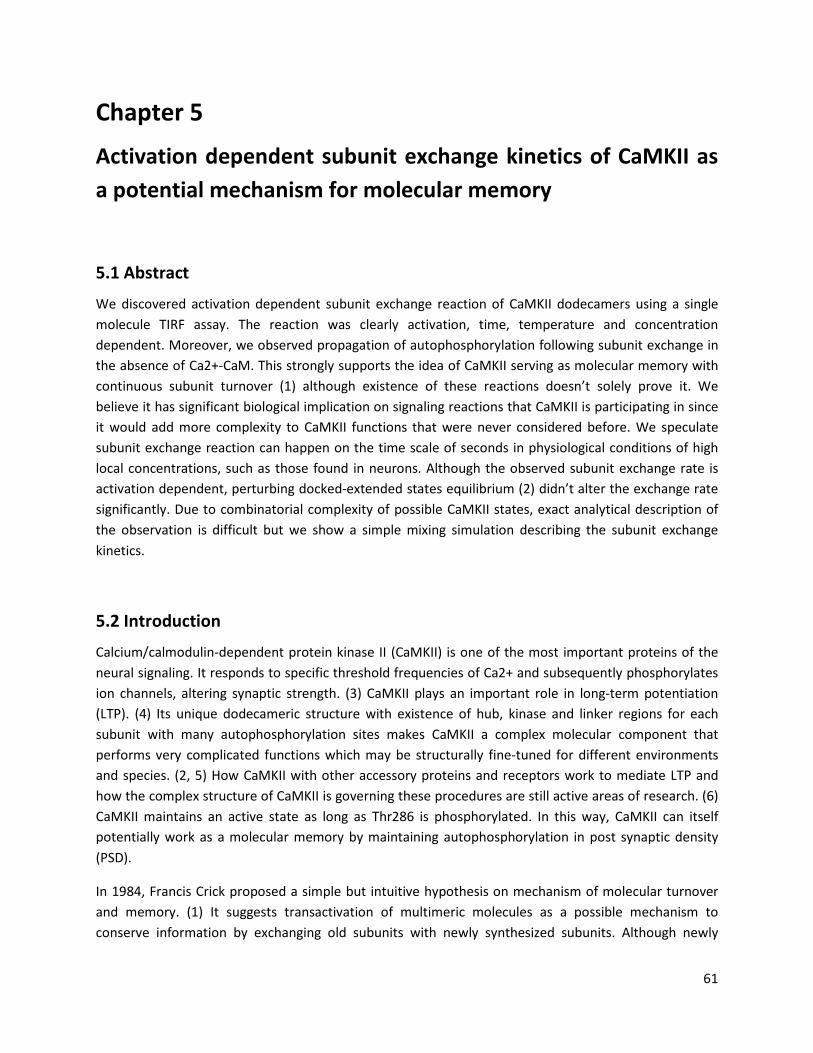
61
Chapter 5
Activation dependent subunit exchange kinetics of CaMKII as a potential mechanism for molecular memory
5.1 Abstract
We discovered activation dependent subunit exchange reaction of CaMKII dodecamers using a single molecule TIRF assay. The reaction was clearly activation, time, temperature and concentration dependent. Moreover, we observed propagation of autophosphorylation following subunit exchange in the absence of Ca2+-CaM. This strongly supports the idea of CaMKII serving as molecular memory with continuous subunit turnover (1) although existence of these reactions doesn’t solely prove it. We believe it has significant biological implication on signaling reactions that CaMKII is participating in since it would add more complexity to CaMKII functions that were never considered before. We speculate subunit exchange reaction can happen on the time scale of seconds in physiological conditions of high local concentrations, such as those found in neurons. Although the observed subunit exchange rate is activation dependent, perturbing docked-extended states equilibrium (2) didn’t alter the exchange rate significantly. Due to combinatorial complexity of possible CaMKII states, exact analytical description of the observation is difficult but we show a simple mixing simulation describing the subunit exchange kinetics.
5.2 Introduction
Calcium/calmodulin-dependent protein kinase II (CaMKII) is one of the most important proteins of the neural signaling. It responds to specific threshold frequencies of Ca2+ and subsequently phosphorylates ion channels, altering synaptic strength. (3) CaMKII plays an important role in long-term potentiation (LTP). (4) Its unique dodecameric structure with existence of hub, kinase and linker regions for each subunit with many autophosphorylation sites makes CaMKII a complex molecular component that performs very complicated functions which may be structurally fine-tuned for different environments and species. (2, 5) How CaMKII with other accessory proteins and receptors work to mediate LTP and how the complex structure of CaMKII is governing these procedures are still active areas of research. (6) CaMKII maintains an active state as long as Thr286 is phosphorylated. In this way, CaMKII can itself potentially work as a molecular memory by maintaining autophosphorylation in post synaptic density (PSD).
In 1984, Francis Crick proposed a simple but intuitive hypothesis on mechanism of molecular turnover and memory. (1) It suggests transactivation of multimeric molecules as a possible mechanism to conserve information by exchanging old subunits with newly synthesized subunits. Although newly
62
synthesized subunits are in inactive forms, once they are exchanged into the multimeric structure, it will be activated by pre-existing activated neighboring subunits and overall information of active state is conserved this way. We found CaMKII a surprisingly good candidate that can potentially perform the proposed turn over mechanism. Previous studies on CaMKII multimeric structure also showed that dodecameric structure might have structural flexibility to some extent as the 12-mer CaMKII structure has been observed to transition to a 14-mer structure under certain conditions. (7)
In this report, we discovered existence of activation-dependent subunit exchange of CaMKII using single molecule TIRF imaging assay. Single molecule assay enabled us to unambiguously detect clear kinetics of subunit exchange at various conditions. We also performed three color antibody assay to monitor propagation of autophosphorylation after subunit exchange which suggests subunit exchange does lead to propagation of autophosphorylation.
5.3 Result and Discussion
Single molecule TIRF assay Since single molecule detection is the most direct and unambiguous way to determine the amount of subunit exchange as function of time by simple chemical labeling of nascent proteins. We designed a TIRF imaging based single molecule assay by which we could very clearly monitor CaMKII subunit exchange kinetics. Before initiating the mixing reaction, samples of interest were prepared at different conditions as needed as two separate fractions with different fluorescent probes labeled for each fraction. We let them mix in the test tubes and small portion of them were taken and immobilized on the clean glass surface by streptavidin biotin binding at each time point. Then positions of particles were determined by automated particle detection program. Amount of colocalization was defined as number of particles in two different channels that are within the distance set as a threshold divided by total number of particles in one of two standard channels. Detailed methods are given in the methods section.
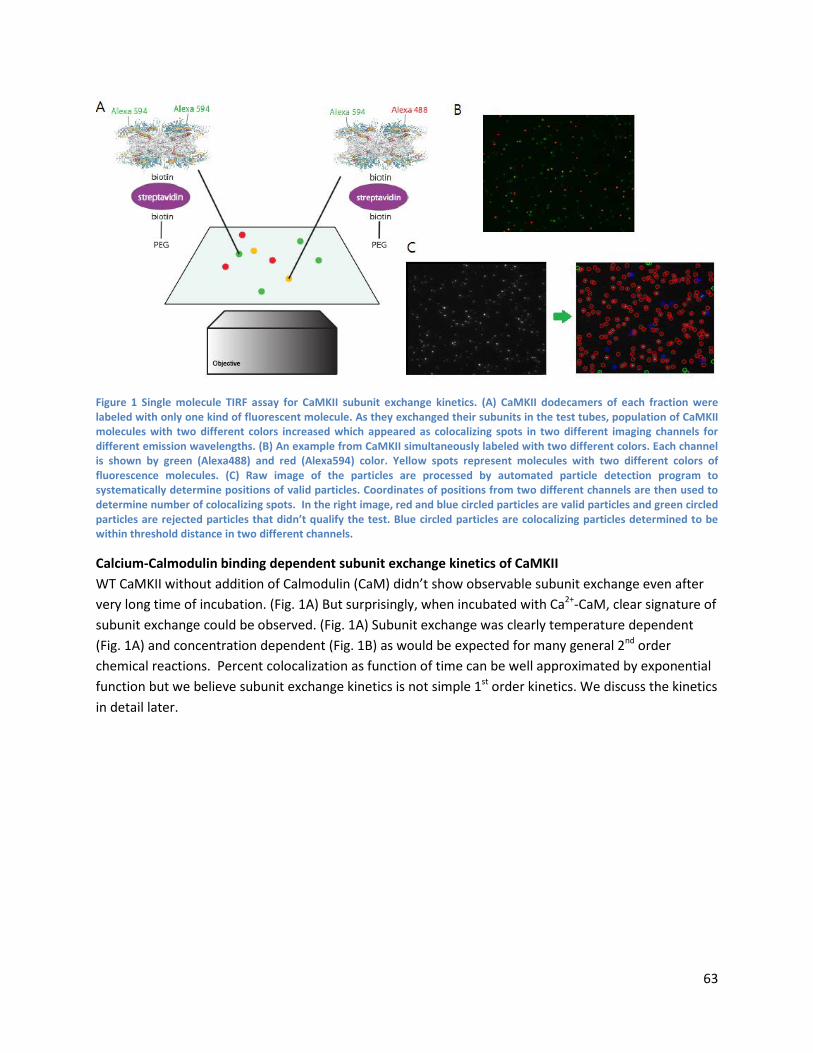
63
Figure 1 Single molecule TIRF assay for CaMKII subunit exchange kinetics. (A) CaMKII dodecamers of each fraction were labeled with only one kind of fluorescent molecule. As they exchanged their subunits in the test tubes, population of CaMKII molecules with two different colors increased which appeared as colocalizing spots in two different imaging channels for different emission wavelengths. (B) An example from CaMKII simultaneously labeled with two different colors. Each channel is shown by green (Alexa488) and red (Alexa594) color. Yellow spots represent molecules with two different colors of fluorescence molecules. (C) Raw image of the particles are processed by automated particle detection program to systematically determine positions of valid particles. Coordinates of positions from two different channels are then used to determine number of colocalizing spots. In the right image, red and blue circled particles are valid particles and green circled particles are rejected particles that didn’t qualify the test. Blue circled particles are colocalizing particles determined to be within threshold distance in two different channels.
Calcium-Calmodulin binding dependent subunit exchange kinetics of CaMKII WT CaMKII without addition of Calmodulin (CaM) didn’t show observable subunit exchange even after very long time of incubation. (Fig. 1A) But surprisingly, when incubated with Ca2+-CaM, clear signature of subunit exchange could be observed. (Fig. 1A) Subunit exchange was clearly temperature dependent (Fig. 1A) and concentration dependent (Fig. 1B) as would be expected for many general 2nd order chemical reactions. Percent colocalization as function of time can be well approximated by exponential function but we believe subunit exchange kinetics is not simple 1st order kinetics. We discuss the kinetics in detail later.
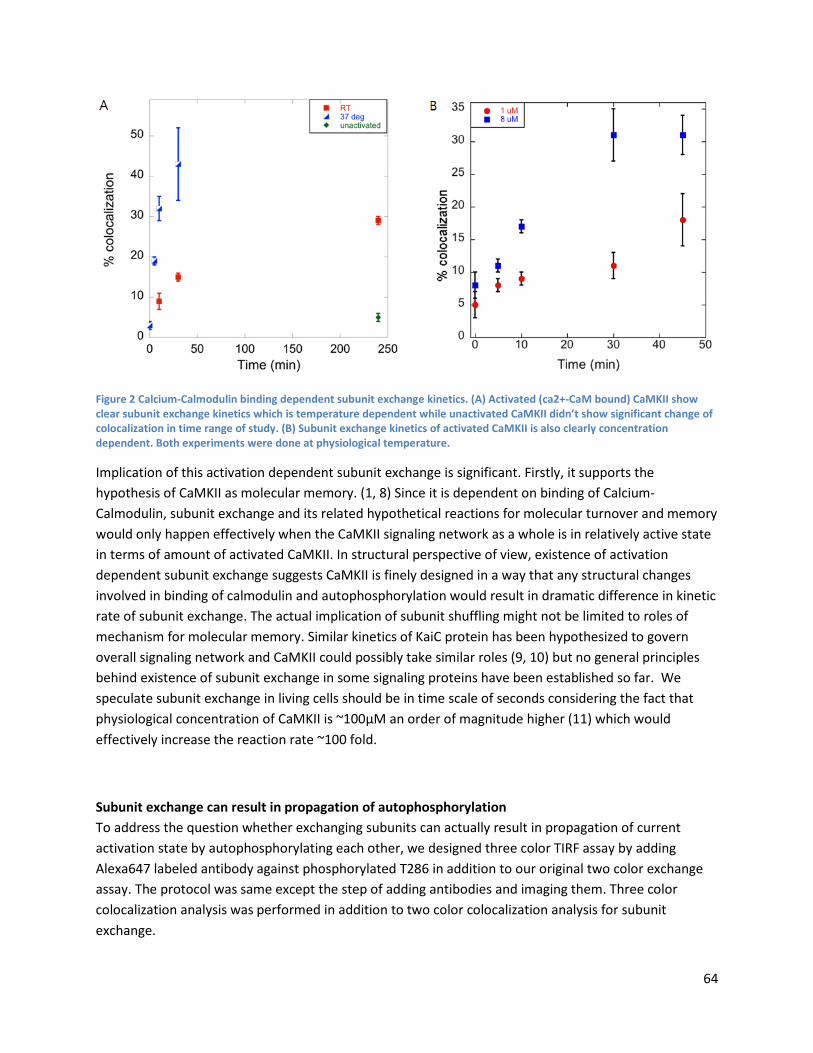
64
Figure 2 Calcium-Calmodulin binding dependent subunit exchange kinetics. (A) Activated (ca2+-CaM bound) CaMKII show clear subunit exchange kinetics which is temperature dependent while unactivated CaMKII didn’t show significant change of colocalization in time range of study. (B) Subunit exchange kinetics of activated CaMKII is also clearly concentration dependent. Both experiments were done at physiological temperature.
Implication of this activation dependent subunit exchange is significant. Firstly, it supports the hypothesis of CaMKII as molecular memory. (1, 8) Since it is dependent on binding of Calcium-Calmodulin, subunit exchange and its related hypothetical reactions for molecular turnover and memory would only happen effectively when the CaMKII signaling network as a whole is in relatively active state in terms of amount of activated CaMKII. In structural perspective of view, existence of activation dependent subunit exchange suggests CaMKII is finely designed in a way that any structural changes involved in binding of calmodulin and autophosphorylation would result in dramatic difference in kinetic rate of subunit exchange. The actual implication of subunit shuffling might not be limited to roles of mechanism for molecular memory. Similar kinetics of KaiC protein has been hypothesized to govern overall signaling network and CaMKII could possibly take similar roles (9, 10) but no general principles behind existence of subunit exchange in some signaling proteins have been established so far. We speculate subunit exchange in living cells should be in time scale of seconds considering the fact that physiological concentration of CaMKII is ~100µM an order of magnitude higher (11) which would effectively increase the reaction rate ~100 fold.
Subunit exchange can result in propagation of autophosphorylation To address the question whether exchanging subunits can actually result in propagation of current activation state by autophosphorylating each other, we designed three color TIRF assay by adding Alexa647 labeled antibody against phosphorylated T286 in addition to our original two color exchange assay. The protocol was same except the step of adding antibodies and imaging them. Three color colocalization analysis was performed in addition to two color colocalization analysis for subunit exchange.
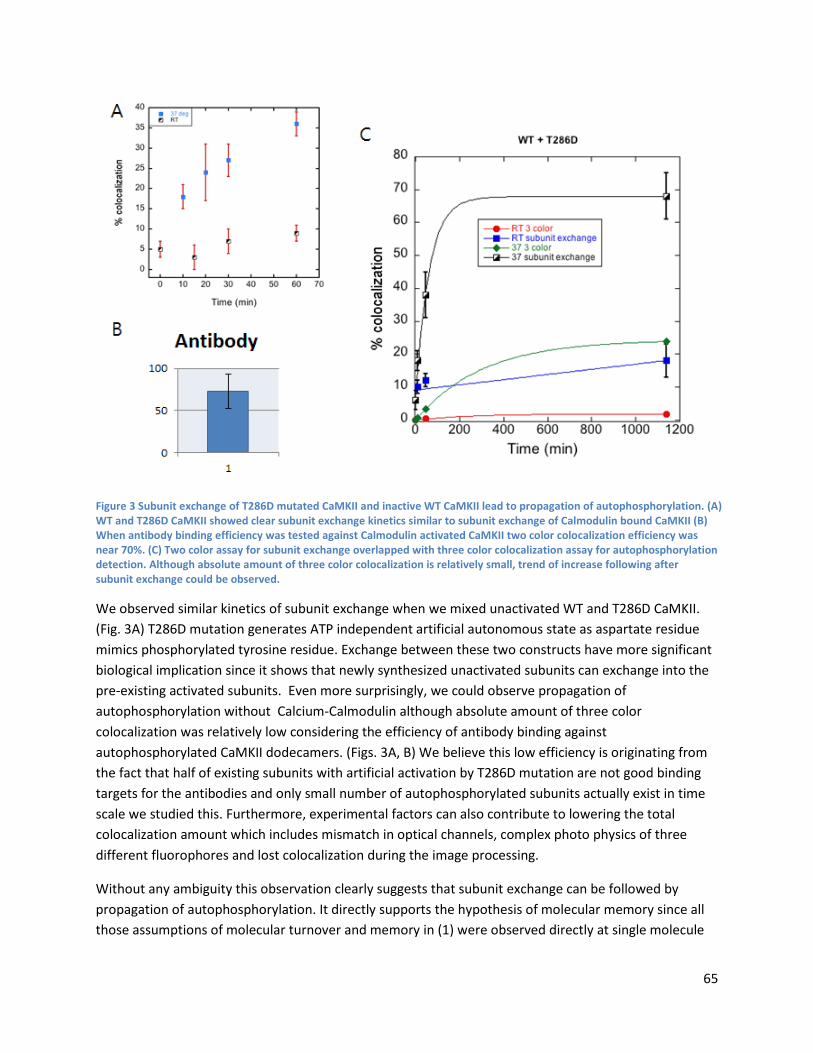
65
Figure 3 Subunit exchange of T286D mutated CaMKII and inactive WT CaMKII lead to propagation of autophosphorylation. (A) WT and T286D CaMKII showed clear subunit exchange kinetics similar to subunit exchange of Calmodulin bound CaMKII (B) When antibody binding efficiency was tested against Calmodulin activated CaMKII two color colocalization efficiency was near 70%. (C) Two color assay for subunit exchange overlapped with three color colocalization assay for autophosphorylation detection. Although absolute amount of three color colocalization is relatively small, trend of increase following after subunit exchange could be observed.
We observed similar kinetics of subunit exchange when we mixed unactivated WT and T286D CaMKII. (Fig. 3A) T286D mutation generates ATP independent artificial autonomous state as aspartate residue mimics phosphorylated tyrosine residue. Exchange between these two constructs have more significant biological implication since it shows that newly synthesized unactivated subunits can exchange into the pre-existing activated subunits. Even more surprisingly, we could observe propagation of autophosphorylation without Calcium-Calmodulin although absolute amount of three color colocalization was relatively low considering the efficiency of antibody binding against autophosphorylated CaMKII dodecamers. (Figs. 3A, B) We believe this low efficiency is originating from the fact that half of existing subunits with artificial activation by T286D mutation are not good binding targets for the antibodies and only small number of autophosphorylated subunits actually exist in time scale we studied this. Furthermore, experimental factors can also contribute to lowering the total colocalization amount which includes mismatch in optical channels, complex photo physics of three different fluorophores and lost colocalization during the image processing.
Without any ambiguity this observation clearly suggests that subunit exchange can be followed by propagation of autophosphorylation. It directly supports the hypothesis of molecular memory since all those assumptions of molecular turnover and memory in (1) were observed directly at single molecule
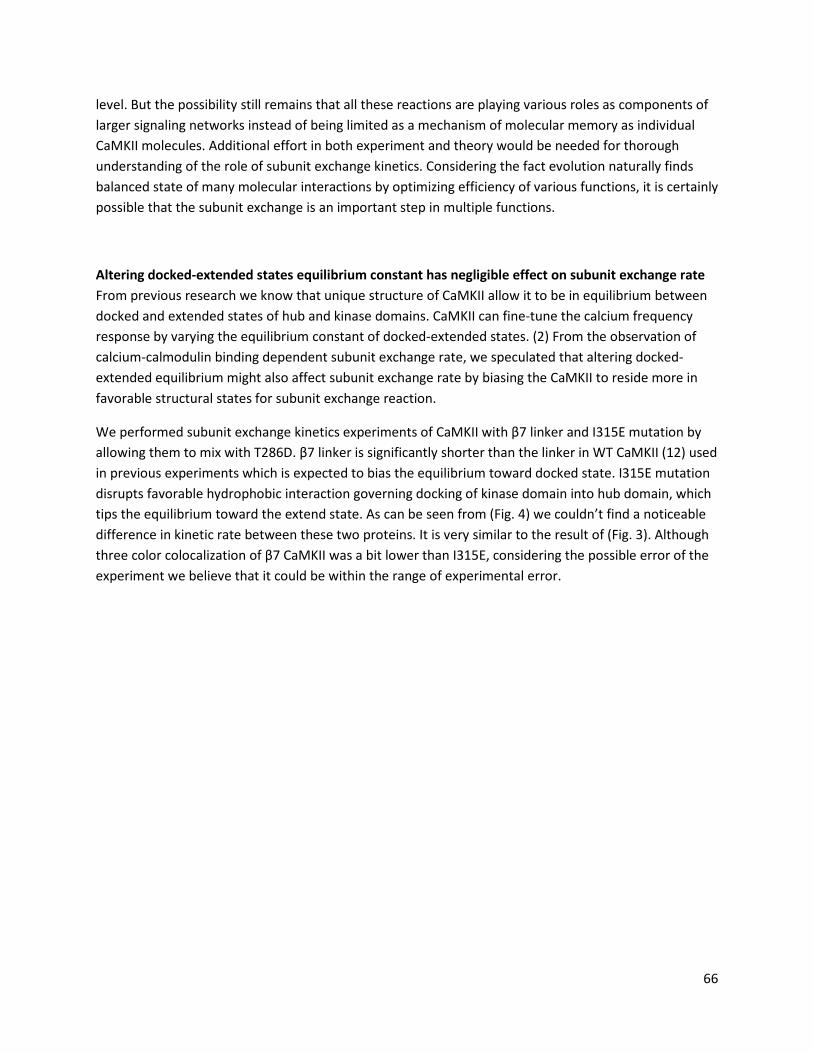
66
level. But the possibility still remains that all these reactions are playing various roles as components of larger signaling networks instead of being limited as a mechanism of molecular memory as individual CaMKII molecules. Additional effort in both experiment and theory would be needed for thorough understanding of the role of subunit exchange kinetics. Considering the fact evolution naturally finds balanced state of many molecular interactions by optimizing efficiency of various functions, it is certainly possible that the subunit exchange is an important step in multiple functions.
Altering docked-extended states equilibrium constant has negligible effect on subunit exchange rate From previous research we know that unique structure of CaMKII allow it to be in equilibrium between docked and extended states of hub and kinase domains. CaMKII can fine-tune the calcium frequency response by varying the equilibrium constant of docked-extended states. (2) From the observation of calcium-calmodulin binding dependent subunit exchange rate, we speculated that altering docked-extended equilibrium might also affect subunit exchange rate by biasing the CaMKII to reside more in favorable structural states for subunit exchange reaction.
We performed subunit exchange kinetics experiments of CaMKII with β7 linker and I315E mutation by allowing them to mix with T286D. β7 linker is significantly shorter than the linker in WT CaMKII (12) used in previous experiments which is expected to bias the equilibrium toward docked state. I315E mutation disrupts favorable hydrophobic interaction governing docking of kinase domain into hub domain, which tips the equilibrium toward the extend state. As can be seen from (Fig. 4) we couldn’t find a noticeable difference in kinetic rate between these two proteins. It is very similar to the result of (Fig. 3). Although three color colocalization of β7 CaMKII was a bit lower than I315E, considering the possible error of the experiment we believe that it could be within the range of experimental error.
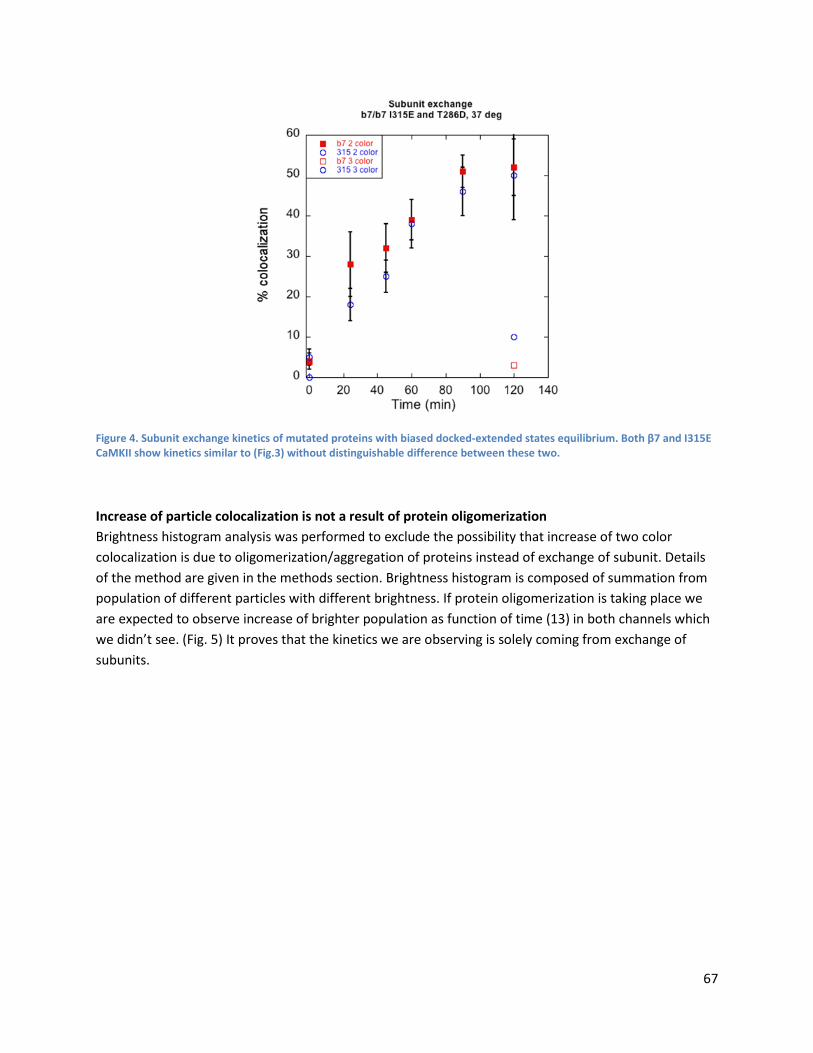
67
Figure 4. Subunit exchange kinetics of mutated proteins with biased docked-extended states equilibrium. Both β7 and I315E CaMKII show kinetics similar to (Fig.3) without distinguishable difference between these two.
Increase of particle colocalization is not a result of protein oligomerization Brightness histogram analysis was performed to exclude the possibility that increase of two color colocalization is due to oligomerization/aggregation of proteins instead of exchange of subunit. Details of the method are given in the methods section. Brightness histogram is composed of summation from population of different particles with different brightness. If protein oligomerization is taking place we are expected to observe increase of brighter population as function of time (13) in both channels which we didn’t see. (Fig. 5) It proves that the kinetics we are observing is solely coming from exchange of subunits.
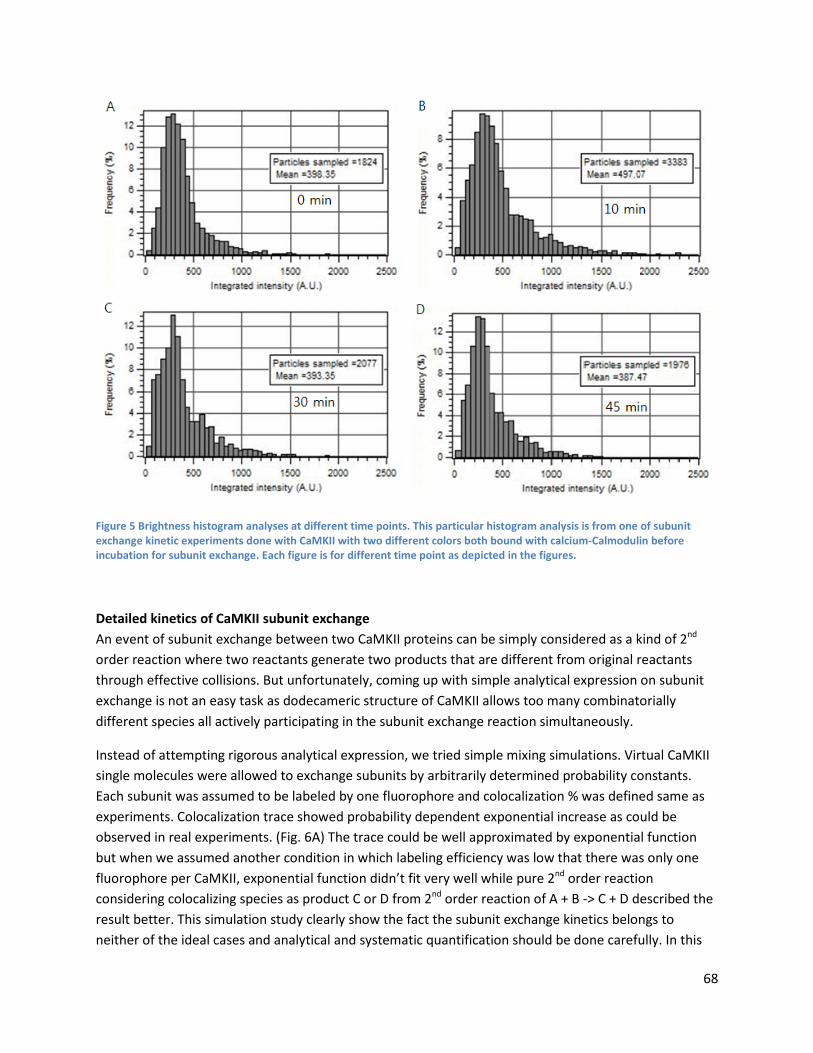
68
Figure 5 Brightness histogram analyses at different time points. This particular histogram analysis is from one of subunit exchange kinetic experiments done with CaMKII with two different colors both bound with calcium-Calmodulin before incubation for subunit exchange. Each figure is for different time point as depicted in the figures.
Detailed kinetics of CaMKII subunit exchange An event of subunit exchange between two CaMKII proteins can be simply considered as a kind of 2nd order reaction where two reactants generate two products that are different from original reactants through effective collisions. But unfortunately, coming up with simple analytical expression on subunit exchange is not an easy task as dodecameric structure of CaMKII allows too many combinatorially different species all actively participating in the subunit exchange reaction simultaneously.
Instead of attempting rigorous analytical expression, we tried simple mixing simulations. Virtual CaMKII single molecules were allowed to exchange subunits by arbitrarily determined probability constants. Each subunit was assumed to be labeled by one fluorophore and colocalization % was defined same as experiments. Colocalization trace showed probability dependent exponential increase as could be observed in real experiments. (Fig. 6A) The trace could be well approximated by exponential function but when we assumed another condition in which labeling efficiency was low that there was only one fluorophore per CaMKII, exponential function didn’t fit very well while pure 2nd order reaction considering colocalizing species as product C or D from 2nd order reaction of A + B -> C + D described the result better. This simulation study clearly show the fact the subunit exchange kinetics belongs to neither of the ideal cases and analytical and systematic quantification should be done carefully. In this
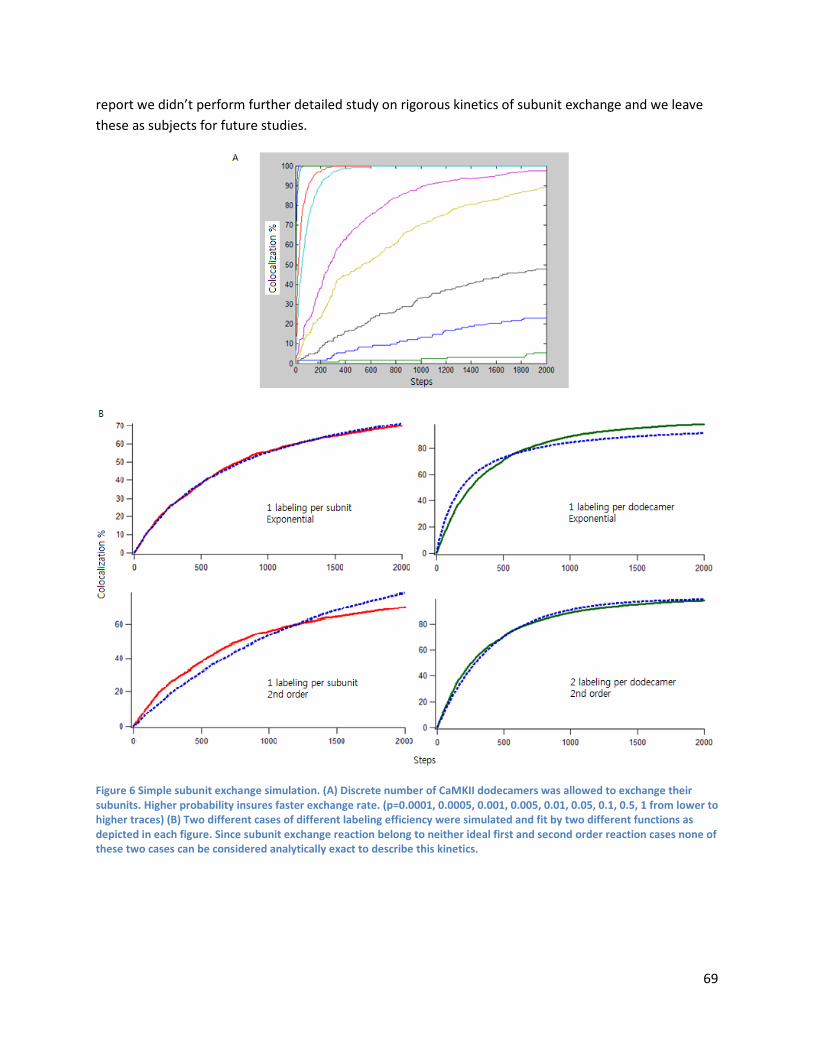
69
report we didn’t perform further detailed study on rigorous kinetics of subunit exchange and we leave these as subjects for future studies.
Figure 6 Simple subunit exchange simulation. (A) Discrete number of CaMKII dodecamers was allowed to exchange their subunits. Higher probability insures faster exchange rate. (p=0.0001, 0.0005, 0.001, 0.005, 0.01, 0.05, 0.1, 0.5, 1 from lower to higher traces) (B) Two different cases of different labeling efficiency were simulated and fit by two different functions as depicted in each figure. Since subunit exchange reaction belong to neither ideal first and second order reaction cases none of these two cases can be considered analytically exact to describe this kinetics.
70
5.4 Conclusion
Using single molecule TIRF assay we could observe activation dependent subunit exchange reactions of CaMKII dodecamers. CaMKII dodecamers were able to propagate autophosphorylation following subunit exchange. It strongly supports the hypothesis of CaMKII as molecular memory itself but these reactions might be actually more important for other functions in CaMKII signaling networks. A detailed study on chemical kinetics of these reactions with thorough quantification of kinetic constants and also theoretical study on effect of these reactions with in vivo experiments would be interesting future works that would provide us more interesting insight on various functions of CaMKII in LTP and signaling.
5.5 Methods
Expression and purification CaMKII (human alpha isoform) was expressed in E. coli with an N-terminal His-sumo moiety and C-terminal avitag. Cleared lysate was loaded onto a nickel fast-flow column, and the eluate was desalted into buffer containing low imidazole. The His-sumo moiety was cleaved overnight at 4 deg by the addition of Ulp1. CaMKII wass run through the nickel column and the flow through was loaded on a Q sepharose column and eluted by a KCl gradient. These fractions were analyzed by SDS-PAGE, concentrated, and loaded onto a Superose 6 gel filtration column. The pure product was concentrated and used immediately or flash frozen and stored at -80 deg. Varying CaMKII mutants were similarly expressed and purified. Calmodulin was expressed and purified as previously reported (2).
Labeling Purified CaMKII was first biotinylated via reaction with BirA (biotin ligase). The reaction buffer (25 mM Tris pH 8, 10 % glycerol, 2 mM TCEP, 150 mM KCl) i\was supplemented with 200 uM BirA, 250 uM ATP, and 20 uM biotin. The reaction was carried out on ice for 1 h. This was then desalted into reaction buffer and concentrated to <500 uL final volume. CaMKII was then split into two equal fractions and labeled with Alexa 488 or Alexa 594. Dyes were solubilized in 25 mM Tris pH 7.5 to a stock concentration of ~15 mM. They were added at 10-fold excess over CaMKII concentration. This reaction proceeded for 1-2 h at RT. Samples were desalted 1-2 times using nap10 columns into reaction buffer without glycerol. Labeled protein was concentrated to at least 6 uM final concentration and used immediately. Anti CaMKII alpha (phosphoThr286) antibody was labeled with Alexa 647 using a kit Invitrogen monoclocal antibody labeling kit.
Mixing reactions CaMKII was mixed under varying conditions to observe subunit exchange. All reactions contained roughly 6 uM CaMKII subunits (~0.5 uM holoenzyme). Inactive conditions involved simply mixing equal molar ratios of green CaMKII (CaMKII labeled with Alexa488) and red CaMKII (CaMKII labeled with
71
Alexa594). Active conditions included adding calmodulin (20 uM), calcium (500 uM), ATP (250 uM) and MgCl2 (8 mM). Both conditions were monitored over time at RT and 37 deg. At each time point, 2 uL were removed from the reaction and diluted in to 1000 uL reaction buffer. This was then added onto a PEG-biotinylated, streptavidin functionalized glass cover slip. Protein was allowed to bind for 1 min and then washed 3X with 1000 uL buffer. For 3-color experiments, prior to dilution, labeled CaMKII antibody was added at 4-fold excess and allowed to bind for 3-5 min. Then this reaction was diluted and plated as before.
Preparation of PEG coated glass surface for protein immobilization Coverslips were cleaned by sonication in a 50:50 (v/v) mixture of isopropanol and water. They were then dried and further cleaned by plasma treatment for 5 min in a Harrick Plasma PDC-32G plasma cleaner. They were then assembled with an Attofluor cell chamber (Invitrogen, Carlsbad, CA) and 0.25 mL poly-L-lysine PEG with PLK-PEG-biotin (500:3 ratio of the two solutions by volume) was added. After 30 min, the samples were rinsed five times with PBS buffer each time. Neutravidin was added to a final concentration of 0.1 mg/mL and incubated for 10 min. Excess neutravidin was rinsed with ten 5 mL rinses PBS buffer. The sample was incubated for an additional 30 min and then rinsed with five 5 mL portions of PBS buffer.
Single molecule TIRF imaging Single particle fluorescence imaging was performed on a Nikon Ti-E/B (Tokyo, Japan) inverted microscope equipped with a Nikon 100x Apo TIRF 1.49 NA objective lens and an Epi/TIRF illuminator. Static images were recorded with a Hamamatsu (Hamamatsu City, Japan) Orca-R2 interline charge coupled device (CCD) camera. The sample was illuminated with the 488 nm line of a Spectra Physics (Santa Clara, CA) 177g argon-ion laser, which was controlled using an acousto-optic tunable filter from Solamere (Salt Lake City, UT). The excitation light was directed to a Chroma (Bellows Falls, VT) ZT488rdc dichroic mirror, which directed the light to the sample. Emission light was filtered by a Chroma ET500lp long-pass filter and a Chroma ET525/50m band-pass filter. Images were acquired using Micro-Manager microscopy software.2
72
Chapter 6
CaMKII does not show localization to the microclusters in Jurkat T cells when activated by anti-CD3 and anti-CD28 presented on supported lipid bilayer
6.1 Abstract
CaMKII is known to be involved in Nf-kB activation during TCR activation in Jurkat T cells. (1,2) Although previous studies reported localization of CaMKII near immunological synapse (IS) after its formation, we did not observe similar behavior in hybrid junction. This suggests that anti-CD3 and anti-CD28 from a supported lipid bilayer (SLB) are insufficient to cause change of CaMKII localization while Nf-kB signaling may still be functioning.
6.2 Introduction
CaMKII is well known as the major protein in neural signaling, but it is expressed in a wide repertoire of systems with structural variation. Previous studies report that perturbing CaMKII function can cause serious defects in normal functioning of the immune system. (3, 4) Biochemical assay also suggests CaMKII is involved in Nf-kB signaling pathways as an amplifier. (1) Previous researchers observed localization of cytosolic CaMKII near IS after initiation of signaling (1,2), but what’s causing the CaMKII to change its localization is not clear. Depending on the mechanism, this could mean interesting roles of CaMKII that were not known previously. If CaMKII is colocalizing with initial microclusters or other signaling clusters, that would imply a clear interaction with those molecules. CaMKII could potentially bind to target receptors as is the case in neural signaling, or its interaction with actin, combined with active reorganization of actin structure, could result in a change of CaMKII localization. To address this question, we designed a hybrid junction experiment to image the localization of CaMKII where we can observe CaMKII location clearly.
6.3 Methods
We followed the protocols from (5,6) for preparation of SLB, cell culture, and signal initiation. We presented anti-CD3 and anti-CD28 prelabeled with Alexa fluorophores after biotin labeling as needed by incubating SLB with both in a 1:1 ratio. After preparation of SLB, cells were added directly from the
media and were incubated at 37℃, 5% CO2. At each time point, cells were fixed by 10% formalin
mixture incubation in RT for 15 minutes. After rinsing with 15ml PBS, cell membranes were
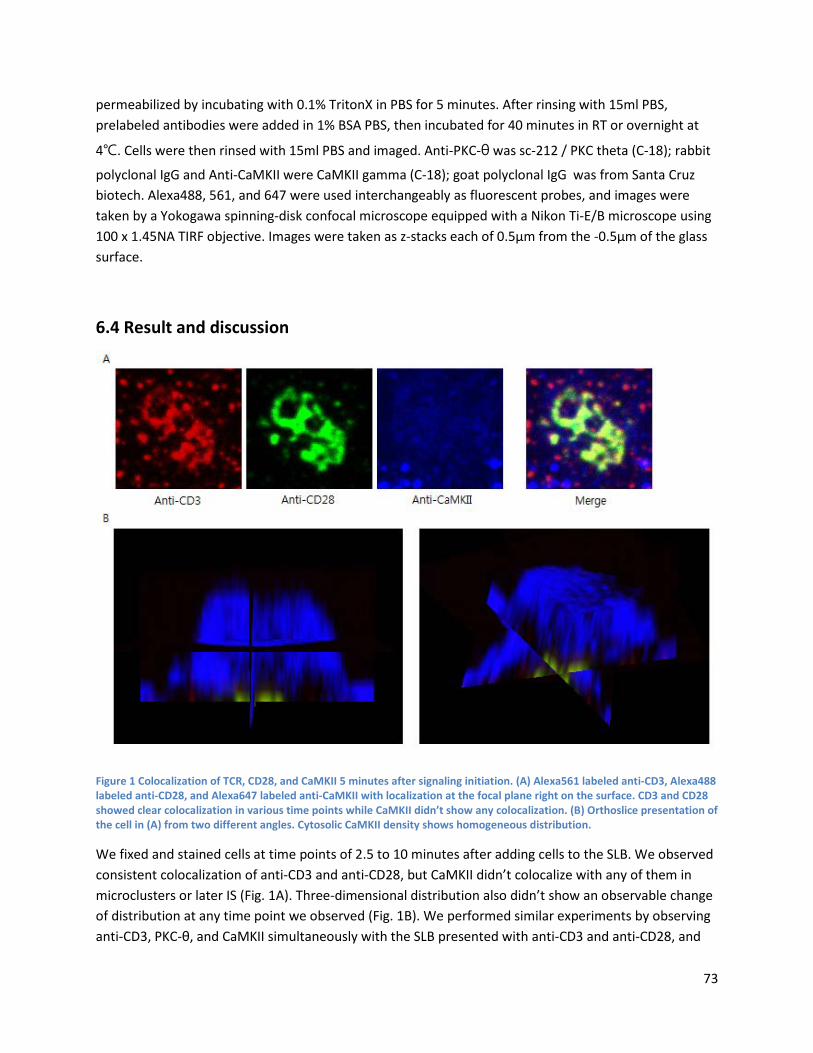
73
permeabilized by incubating with 0.1% TritonX in PBS for 5 minutes. After rinsing with 15ml PBS, prelabeled antibodies were added in 1% BSA PBS, then incubated for 40 minutes in RT or overnight at
4℃. Cells were then rinsed with 15ml PBS and imaged. Anti-PKC-θ was sc-212 / PKC theta (C-18); rabbit
polyclonal IgG and Anti-CaMKII were CaMKII gamma (C-18); goat polyclonal IgG was from Santa Cruz biotech. Alexa488, 561, and 647 were used interchangeably as fluorescent probes, and images were taken by a Yokogawa spinning-disk confocal microscope equipped with a Nikon Ti-E/B microscope using 100 x 1.45NA TIRF objective. Images were taken as z-stacks each of 0.5µm from the -0.5µm of the glass surface.
6.4 Result and discussion
Figure 1 Colocalization of TCR, CD28, and CaMKII 5 minutes after signaling initiation. (A) Alexa561 labeled anti-CD3, Alexa488 labeled anti-CD28, and Alexa647 labeled anti-CaMKII with localization at the focal plane right on the surface. CD3 and CD28 showed clear colocalization in various time points while CaMKII didn’t show any colocalization. (B) Orthoslice presentation of the cell in (A) from two different angles. Cytosolic CaMKII density shows homogeneous distribution.
We fixed and stained cells at time points of 2.5 to 10 minutes after adding cells to the SLB. We observed consistent colocalization of anti-CD3 and anti-CD28, but CaMKII didn’t colocalize with any of them in microclusters or later IS (Fig. 1A). Three-dimensional distribution also didn’t show an observable change of distribution at any time point we observed (Fig. 1B). We performed similar experiments by observing anti-CD3, PKC-θ, and CaMKII simultaneously with the SLB presented with anti-CD3 and anti-CD28, and
74
PKC-θ also didn’t show any observable change of density distribution, although it often showed a more heterogeneous local region compared to the distribution of CaMKII (data not shown).
We believe the fact that our observation contradicts that of (1,2) comes from the factors that our hybrid junction system is missing compared to actual antigen-presenting cells (APC). These factors are probably aiding spatial redistribution of many down-stream molecules, including CaMKII. This suggests that major redistribution of CaMKII may not be an essential part of CD28-aided TCR-initiated T-cell signaling but becomes pronounced under specific conditions.
75
Biblography Chapter1 1. Veatch, S. L., and S. L. Keller. 2003. Separation of liquid phases in giant vesicles of ternary mixtures of phospholipids and cholesterol. Biophys J 85:3074-3083.
2. Baumgart, T., A. T. Hammond, P. Sengupta, S. T. Hess, D. A. Holowka, B. A. Baird, and W. W. Webb. 2007. Large-scale fluid/fluid phase separation of proteins and lipids in giant plasma membrane vesicles. Proc Natl Acad Sci U S A 104:3165-3170.
3. Veatch, S. L., P. Cicuta, P. Sengupta, A. Honerkamp-Smith, D. Holowka, and B. Baird. 2008. Critical fluctuations in plasma membrane vesicles. ACS Chem Biol 3:287-293.
4. Lingwood, D., and K. Simons. 2010. Lipid rafts as a membrane-organizing principle. Science 327:46-50.
5. Tabouillot, T., H. S. Muddana, and P. J. Butler. 2010. Endothelial Cell Membrane Sensitivity to Shear Stress is Lipid Domain Dependent. Cellular and Molecular Bioengineering 4:169-181.
6. Groves, J. T., S. G. Boxer, and H. M. McConnell. 1998. Electric Field induced critical demixing in lipid bilayer membrane. Proc Natl Acad Sci USA 95:935-938.
7. Ehrig, J., E. P. Petrov, and P. Schwille. 2011. Near-critical fluctuations and cytoskeleton-assisted phase separation lead to subdiffusion in cell membranes. Biophys J 100:80-89.
8. Feigenson, G. W. 2009. Phase diagrams and lipid domains in multicomponent lipid bilayer mixtures. Biochim Biophys Acta 1788:47-52.
9. Groves, J. T., S. G. Boxer, and H. M. McConnell. 2000. Electric field effects in multicomponent fluid lipid membranes. J Phys Chem B 104:119-124.
10. Groves, J. T., and J. Kuriyan. 2010. Molecular mechanisms in signal transduction at the membrane. Nat Struct Mol Biol 17:659-665.
11. Veatch, S. L., O. Soubias, S. L. Keller, and K. Gawrisch. 2007. Critical fluctuations in domain-forming lipid mixtures. Proc Natl Acad Sci U S A 104:17650-17655.
12. Veatch, S. L. 2007. From small fluctuations to large-scale phase separation: lateral organization in model membranes containing cholesterol. Semin Cell Dev Biol 18:573-582.
13. Honerkamp-Smith, A. R., P. Cicuta, M. D. Collins, S. L. Veatch, M. den Nijs, M. Schick, and S. L. Keller. 2008. Line tensions, correlation lengths, and critical exponents in lipid membranes near critical points. Biophys J 95:236-246.
14. Bacia, K., C. G. Schuette, N. Kahya, R. Jahn, and P. Schwille. 2004. SNAREs prefer liquid-disordered over "raft" (liquid-ordered) domains when reconstituted into giant unilamellar vesicles. J Biol Chem 279:37951-37955.
15. Hammond, A. T., F. A. Heberle, T. Baumgart, D. Holowka, B. Baird, and G. W. Feigenson. 2005. Crosslinking a lipid raft component triggers liquid ordered-liquid disordered phase separation in model plasma membranes. Proc Natl Acad Sci U S A 102:6320-6325.
16. Young, R. M., D. Holowka, and B. Baird. 2003. A lipid raft environment enhances Lyn kinase activity by protecting the active site tyrosine from dephosphorylation. J Biol Chem 278:20746-20752.
17. Sahl, S. J., M. Leutenegger, M. Hilbert, S. W. Hell, and C. Eggeling. 2010. Fast molecular tracking maps nanoscale dynamics of plasma membrane lipids. Proc Natl Acad Sci U S A 107:6829-6834.
18. Eggeling, C., C. Ringemann, R. Medda, G. Schwarzmann, K. Sandhoff, S. Polyakova, V. N. Belov, B. Hein, C. von Middendorff, A. Schonle, and S. W. Hell. 2009. Direct observation of the nanoscale dynamics of membrane lipids in a living cell. Nature 457:1159-1162.
19. Wawrezinieck, L., H. Rigneault, D. Marguet, and P. F. Lenne. 2005. Fluorescence correlation spectroscopy diffusion laws to probe the submicron cell membrane organization. Biophys J 89:4029-4042.
76
20. Murase, K., T. Fujiwara, Y. Umemura, K. Suzuki, R. Iino, H. Yamashita, M. Saito, H. Murakoshi, K. Ritchie, and A. Kusumi. 2004. Ultrafine membrane compartments for molecular diffusion as revealed by single molecule techniques. Biophys J 86:4075-4093.
21. Kahya, N., D. Scherfeld, K. Bacia, and P. Schwille. 2004. Lipid domain formation and dynamics in giant unilamellar vesicles explored by fluorescence correlation spectroscopy. J Struct Biol 147:77-89.
22. Levental, I., F. J. Byfield, P. Chowdhury, F. Gai, T. Baumgart, and P. A. Janmey. 2009. Cholesterol-dependent phase separation in cell-derived giant plasma-membrane vesicles. Biochem J 424:163-167.
23. Schwille, P., J. Korlach, and W. W. Webb. 1999. Fluorescence correlation spectroscopy with single-molecule sensitivity on cell and model membranes. Cytometry 36:176-182.
24. Davide Magatti, F. F. 2001. Fast multi-tau real-time software correlator for dynamic light scattering. Appl Opt 40:4011-4021.
25. Johannes M. Nitsche, H.-C. C., Paul A. Weber, Bruce J. Nicholson. 2004. A transient diffusion model yields unitary gap junctional permeabilities from inages of cell-to-cell fluorescent dye transfer between Xenopus oocytes. Biophys J 86:2058-2077.
26. Saxton, M. J. 2007. A biological interpretation of transient anomalous subdiffusion. I. Qualitative model. Biophys J 92:1178-1191.
27. Lin, W.-C., C.-H. Yu, S. Triffo, and J. T. Groves. 2010. Supported membrane formation, characterization, functionalization, and patterning for application in biological science and technology. Curr Protoc Chem Biol 2:235-269.
28. Bacia, K., D. Scherfeld, N. Kahya, and P. Schwille. 2004. Fluorescence correlation spectroscopy relates rafts in model and native membranes. Biophys J 87:1034-1043.
29. Fan, J., and M. Haataja. 2010. Lipid Microdomains: Structural Correlations, Fluctuations, and Formation Mechanisms. Physical Review Letters 104.
30. Dietrich, C., L. A. Bagatolli, Z. N. Volovyk, N. L. Thompson, M. Levi, K. Jacobson, and E. Gratton. 2001. Lipids rafts reconstituted in model membranes. Biophys J 80:1417-1428.
31. Machta, B. B., S. Papanikolaou, J. P. Sethna, and S. L. Veatch. 2011. Minimal model of plasma membrane heterogeneity requires coupling cortical actin to criticality. Biophys J 100:1668-1677.
32. Saffman, P. G., and M. Delbruck. 1975. Brownian motion in biological membranes. Proc Natl Acad Sci U S A 72:3111-3113.
33. Forstner, M. B., C. K. Yee, A. N. Parikh, and J. T. Groves. 2006. Lipid lateral mobility and membrane phase structure modulation by protein binding. J Am Chem Soc 128:15221-15227.
34. Weber, B. H. 2009. On the Emergence of Living Systems. Biosemiotics 2:343-359.
35. Liu, A. P., and D. A. Fletcher. 2006. Actin polymerization serves as a membrane domain switch in model lipid bilayers. Biophys J 91:4064-4070.
36. Sens, P., and M. Turner. 2011. Microphase Separation in Nonequilibrium Biomembranes. Physical Review Letters 106.
37. Levental, I., M. Grzybek, and K. Simons. 2011. Raft domains of variable properties and compositions in plasma membrane vesicles. Proc Natl Acad Sci U S A 108:11411-11416.
38. Hess, S. T., S. Huang, A. A. Heikal, and W. W. Webb. 2002. Biological and chemical applications of fluorescence correlation spectroscopy: a review. Biochemistry 41:697-705.
39. He, H. T., and D. Marguet. 2011. Detecting nanodomains in living cell membrane by fluorescence correlation spectroscopy. Annu Rev Phys Chem 62:417-436.
40. Stottrup, B. L., D. S. Stevens, and S. L. Keller. 2005. Miscibility of ternary mixtures of phospholipids and cholesterol in monolayers, and application to bilayer systems. Biophys J 88:269-276.
41. Jay T. Groves, S. G. B., Harden M. McConnell. 2000. Lateral Reorganization of Fluid Lipid membranes in Response to the Electric Field Produced by a Buried Charge. J Phys Chem B 104:11409-11415.
77
42. Raghuveer Parthasarathy, C.-h. Y., Jay T. Groves. 2006. Curvature Modulated Phase Separation in Lipid Bilayer Membranes. Langmuir 22:5095-5099.
43. Fan, J., M. Sammalkorpi, and M. Haataja. 2008. Domain Formation in the Plasma Membrane: Roles of Nonequilibrium Lipid Transport and Membrane Proteins. Physical Review Letters 100.
44. Abhishek Chaudhuri, B. B., Kripa Gowrishankar, Satyajit Mayor, Madan Rao. 2011. Spatiotemporal regulation of chemical reactions by active cytoskeletal remodeling. PNAS 108:14825-14830.
45. Lingwood, D., J. Ries, P. Schwille, and K. Simons. 2008. Plasma membranes are poised for activation of raft phase coalescence at physiological temperature. Proc Natl Acad Sci U S A 105:10005-10010.
46. Lillemeier, B. F., M. A. Mortelmaier, M. B. Forstner, J. B. Huppa, J. T. Groves, and M. M. Davis. 2010. TCR and Lat are expressed on separate protein islands on T cell membranes and concatenate during activation. Nat Immunol 11:90-96.
47. Parthasarathy, R., and J. T. Groves. 2007. Curvature and spatial organization in biological membranes. Soft Matter 3:24.
48. Sorre, B., A. Callan-Jones, J. B. Manneville, P. Nassoy, J. F. Joanny, J. Prost, B. Goud, and P. Bassereau. 2009. Curvature-driven lipid sorting needs proximity to a demixing point and is aided by proteins. Proc Natl Acad Sci U S A 106:5622-5626.
49. Erma Z. Drobins, L. M. C., Trish Berger, Thomas J. Anchordoguy, James W. Overstreet, John H. Crowe. 1993. Cold Shock Damage Is Due to Lipid Phase Transitions in Cell Membranes: A Demonstration Using Sperm as a model. J. Exp. Zool. 265:432-437.
50. Schmidt, U., G. Guigas, and M. Weiss. 2008. Cluster Formation of Transmembrane Proteins Due to Hydrophobic Mismatching. Physical Review Letters 101.
51. de Meyer, F. J., M. Venturoli, and B. Smit. 2008. Molecular simulations of lipid-mediated protein-protein interactions. Biophys J 95:1851-1865.
Chapter 2 1. Lingwood, D., and K. Simons. 2010. Lipid rafts as a membrane-organizing principle. Science 327:46-50.
2. Young, R.M., D. Holowka and and B. Baird, 2003, A lipid raft environment enhances Lyn kinase activity by protecting the active site tyrosine from dephosphorylation. J. Biol. Chem. 278: 20746-20752.
3. Larson, D. R., J. A. Gosse, D. Holowka, B. Baird, W. W. Webb, 2005, Temporally Resolved Interactions Between Antigen-stimulated IgE Receptor s and Lyn Kinase on Living Cells. J. Cell Sci. 171(3): 527-36.
4. Laure Wawrezinieck, Hervé Rigneault, Didier Marguet, 2005, Pierre-François Lenne, Fluorescence Correlation Spectroscopy Diffusion Laws to Probe the Submicron Cell Membrane Organization, Biophys. J., 89(6): 4029–4042.
5. Akiko Hashimoto-Tane, Tadashi Yokosuka, Chitose Ishihara, Machie Sakuma, Wakana Kobayashi and Takashi Saito, 2010, T-Cell Receptor Microclusters Critical for T-Cell Activation Are Formed Independently of Lipid Raft Clustering, Mol. Cell. Biol, vol. 30 no. 14, 3421-3429.
Chapter 3 1. Aurelia R. Honerkamp-Smith, Sarah L. Veatch, Sarah L. Keller, 2009, An introduction to critical points for biophysicists; observations of compositional heterogeneity in lipid membranes, BBA, Volume 1788, Issue 1, January, 53–63.
2. Baumgart, T., A. T. Hammond, P. Sengupta, S. T. Hess, D. A. Holowka, B. A. Baird, and W. W. Webb. 2007. Large-scale fluid/fluid phase separation of proteins and lipids in giant plasma membrane vesicles. Proc Natl Acad Sci U S A 104:3165-3170.
78
3. Veatch, S. L., P. Cicuta, P. Sengupta, A. Honerkamp-Smith, D. Holowka, and B. Baird. 2008. Critical fluctuations in plasma membrane vesicles. ACS Chem Biol 3:287-293.
4. T. Mora, W. Bialek, 20011, Are biological systems poised at criticality?, J Stat Phys, 144:268-302.
5. Benjamin B. Machta, Stefanos Papanikolaou, James P. Sethna, Sarah L. Veatch, 2011, Minimal Model of Plasma Membrane Heterogeneity Requires Coupling Cortical Actin to Criticality, Biophys J., 100(7), 1668 – 1677.
6. Jens Ehrig, Eugene P. Petrov, Petra Schwille, 2011, Phase separation and near-critical fluctuations in two-component lipid membranes: Monte Carlo simulations on experimentally relevant scales, 13, 045019.
Chapter 4 1. P.D. Adams, R.W. Grosse-Kunstleve, L.W. Hung, T.R. Ioerger, A.J. McCoy, N.W. Moriarty, R.J. Read, J.C. Sacchettini, N.K. Sauter, T.C. Terwilliger, 2002, PHENIX: building new software for automated crystallographic structure determination, Acta Crystallogr. D Biol. Crystallogr., 58: 1948–1954.
2. S.C. Barker, D.B. Kassel, D. Weigl, X. Huang, M.A. Luther, W.B. Knight, 1995, Characterization of pp60c-src tyrosine kinase activities using a continuous assay: autoactivation of the enzyme is an intermolecular autophosphorylation process, Biochemistry, 34: 14843–14851.
3. K.U. Bayer, P. De Koninck, H. Schulman, 2002, Alternative splicing modulates the frequency-dependent response of CaMKII to Ca(2+) oscillations, EMBO J., 21: 3590–3597.
4. A.T. Brünger, P.D. Adams, G.M. Clore, W.L. DeLano, P. Gros, R.W. Grosse-Kunstleve, J.S. Jiang, J. Kuszewski, M. Nilges, N.S. Pannu et al., 1998, Crystallography & NMR system: A new software suite for macromolecular structure determination, Acta Crystallogr. D Biol. Crystallogr., 54: 905–921.
5. L.H. Chao, P. Pellicena, S. Deindl, L.A. Barclay, H. Schulman, J. Kuriyan, 2010, Intersubunit capture of regulatory segments is a component of cooperative CaMKII activation, Nat. Struct. Mol. Biol., 17: 264–272.
6. H. Chiba, N.S. Schneider, S. Matsuoka, A. Noma, 2008, A simulation study on the activation of cardiac CaMKII delta-isoform and its regulation by phosphatases, Biophys. J., 95: 2139–2149.
7. R.J. Colbran, 1993, Inactivation of Ca2+/calmodulin-dependent protein kinase II by basal autophosphorylation, J. Biol. Chem., 268: 7163–7170.
8. P. De Koninck, H. Schulman, 1998, Sensitivity of CaM kinase II to the frequency of Ca2+ oscillations, Science, 279: 227–230.
9. Y. Elgersma, N.B. Fedorov, S. Ikonen, E.S. Choi, M. Elgersma, O.M. Carvalho, K.P. Giese, A.J. Silva, 2002, Inhibitory autophosphorylation of CaMKII controls PSD association, plasticity, and learning, Neuron, 36 : 493–505.
10. R.J. Ellis, 2001, Macromolecular crowding: obvious but underappreciated, Trends Biochem. Sci., 26: 597–604.
11. P. Emsley, K. Cowtan, 2004, Coot: model-building tools for molecular graphics, Acta Crystallogr. D Biol. Crystallogr., 60: 2126–2132.
12. D.T. Gillespie, 1976, A general method for numerically simulating the stochastic time evolution of coupled chemical reactions, J. Comp. Physiol., 22: 403–434.
13. P.I. Hanson, H. Schulman, 1992, Inhibitory autophosphorylation of multifunctional Ca2+/calmodulin-dependent protein kinase analyzed by site-directed mutagenesis, J. Biol. Chem., 267: 17216–17224.
14. P.I. Hanson, M.S. Kapiloff, L.L. Lou, M.G. Rosenfeld, H. Schulman, 1989, Expression of a multifunctional Ca2+/calmodulin-dependent protein kinase and mutational analysis of its autoregulation, Neuron, 3: 59–70.
15. P.I. Hanson, T. Meyer, L. Stryer, H. Schulman, 1994, Dual role of calmodulin in autophosphorylation of multifunctional CaM kinase may underlie decoding of calcium signals, Neuron, 12: 943–956.
79
16. A. Hoelz, A.C. Nairn, J. Kuriyan, 2003, Crystal structure of a tetradecameric assembly of the association domain of Ca2+/calmodulin-dependent kinase II, Mol. Cell, 11: 1241–1251.
17. L. Hoffman, R.A. Stein, R.J. Colbran, H.S. Mchaourab, 2011, Conformational changes underlying calcium/calmodulin-dependent protein kinase II activation, EMBO J., 30:1251–1262.
18. M. Howarth, A.Y. Ting, 2008, Imaging proteins in live mammalian cells with biotin ligase and monovalent streptavidin, Nat. Protoc., 3: 534–545.
19. A. Hudmon, H. Schulman, 2002, Structure-function of the multifunctional Ca2+/calmodulin-dependent protein kinase II, Biochem. J., 364: 593–611.
20. G.L. Hura, A.L. Menon, M. Hammel, R.P. Rambo, F.L. Poole 2nd, S.E. Tsutakawa, F.E. Jenney Jr., S. Classen, K.A. Frankel, R.C. Hopkins et al., 2009, Robust, high-throughput solution structural analyses by small angle X-ray scattering (SAXS), Nat. Methods, 6: 606–612.
21. T.A. Jones, J.Y. Zou, S.W. Cowan, M. Kjeldgaard, 1991, Improved methods for building protein models in electron density maps and the location of errors in these models, Acta Crystallogr. A, 47: 110–119.
22. M.B. Kennedy, T. McGuinness, P. Greengard, 1983, A calcium/calmodulin-dependent protein kinase from mammalian brain that phosphorylates Synapsin I: partial purification and characterization, J. Neurosci., 3: 818–831.
23. C. Kim, C.Y. Cheng, S.A. Saldanha, S.S. Taylor, 2007, PKA-I holoenzyme structure reveals a mechanism for cAMP-dependent activation, Cell, 130: 1032–1043.
24. S.J. Kolodziej, A. Hudmon, M.N. Waxham, J.K. Stoops, 2000, Three-dimensional reconstructions of calcium/calmodulin-dependent (CaM) kinase IIalpha and truncated CaM kinase IIalpha reveal a unique organization for its structural core and functional domains, J. Biol. Chem., 275: 14354–14359.
25. P.V. Konarev, V.V. Volkov, A.V. Sokolova, M.H.J. Koch, D.I. Svergun, 2003, PRIMUS - a Windows-PC based system for small-angle scattering data analysis, J. Appl. Cryst., 36: 1277–1282.
26. J. Kuriyan, D. Eisenberg, 2007, The origin of protein interactions and allostery in colocalization, Nature, 450: 983–990.
27. B. LeBoeuf, T.R. Gruninger, L.R. Garcia, 2007, Food deprivation attenuates seizures through CaMKII and EAG K+ channels, PLoS Genet., 3: 1622–1632.
28. R.C. Malenka, M.F. Bear, 2004, LTP and LTD: an embarrassment of riches, Neuron, 44: 5–21.
29. D.J. Mandell, E.A. Coutsias, T. Kortemme, 2009, Sub-angstrom accuracy in protein loop reconstruction by robotics-inspired conformational sampling, Nat. Methods, 6: 551–552.
30. A.J. McCoy, R.W. Grosse-Kunstleve, P.D. Adams, M.D. Winn, L.C. Storoni, R.J. Read, 2007, Phaser crystallographic software, J. Appl. Cryst., 40: 658–674.
31. S.G. Miller, M.B. Kennedy, 1986, Regulation of brain type II Ca2+/calmodulin-dependent protein kinase by autophosphorylation: a Ca2+-triggered molecular switch, Cell, 44: 861–870.
32. E.P. Morris, K. Török, 2001, Oligomeric structure of alpha-calmodulin-dependent protein kinase II, J. Mol. Biol., 308: 1–8.
33. A.C. Nairn, H.C. Hemmings Jr., P. Greengard, 1985, Protein kinases in the brain, Annu. Rev. Biochem., 54: 931–976.
34. S. Pepke, T. Kinzer-Ursem, S. Mihalas, M.B. Kennedy, 2010, A dynamic model of interactions of Ca2+, calmodulin, and catalytic subunits of Ca2+/calmodulin-dependent protein kinase II, PLoS Comput. Biol., 6: e1000675.
35. J.A. Putkey, M.N. Waxham, 1996, A peptide model for calmodulin trapping by calcium/calmodulin-dependent protein kinase II, J. Biol. Chem., 271: 29619–29623.
36. M. Puttini, A.M. Coluccia, F. Boschelli, L. Cleris, E. Marchesi, A. Donella-Deana, S. Ahmed, S. Redaelli, R. Piazza, V. Magistroni et al., 2006, In vitro and in vivo activity of SKI-606, a novel Src-Abl inhibitor, against imatinib-resistant Bcr-Abl+ neoplastic cells, Cancer Res., 66: 11314–11322.
80
37. P. Rellos, A.C. Pike, F.H. Niesen, E. Salah, W.H. Lee, F. von Delft, S. Knapp, 2010, Calmodulin complex reveals the molecular mechanism/calmodulin complex reveals the molecular mechanism of CaMKII kinase activation, PLoS Biol., 8: e1000426.
38. U. Rix, L.L. Remsing Rix, A.S. Terker, N.V. Fernbach, O. Hantschel, M. Planyavsky, F.P. Breitwieser, H. Herrmann, J. Colinge, K.L. Bennett et al., 2010, A comprehensive target selectivity survey of the BCR-ABL kinase inhibitor INNO-406 by kinase profiling and chemical proteomics in chronic myeloid leukemia cells, Leukemia, 24: 44–50.
39. O.S. Rosenberg, S. Deindl, R.J. Sung, A.C. Nairn, J. Kuriyan, 2005, Structure of the autoinhibited kinase domain of CaMKII and SAXS analysis of the holoenzyme, Cell, 123: 849–860.
40. T.J. Ryan, S.G. Grant, 2009, The origin and evolution of synapses, Nat. Rev. Neurosci., 10: 701–712.
41. H. Schulman, P. Greengard, 1978, Stimulation of brain membrane protein phosphorylation by calcium and an endogenous heat-stable protein, Nature, 271: 478–479.
42. K. Shen, T. Meyer, 1998, In vivo and in vitro characterization of the sequence requirement for oligomer formation of Ca2+/calmodulin-dependent protein kinase IIalpha, J. Neurochem., 70: 96–104.
43. A.J. Silva, R. Paylor, J.M. Wehner, S. Tonegawa, 1992, Impaired spatial learning in alpha-calcium-calmodulin kinase II mutant mice, Science, 257: 206–211.
44. D.I. Svergun, 1992, Determination of the regularization parameter in indirect-transform methods using perceptual criteria, J. Appl. Cryst., 25: 495–503.
45. D.I. Svergun, C. Barberato, M.H.J. Koch, 1995, CRYSOL - a program to evaluate X-ray solution scattering of biological macromolecules from atomic coordinates, J. Appl. Cryst., 28: 768–773.
46. D.I. Svergun, M.V. Petoukhov, M.H. Koch, 2001, Determination of domain structure of proteins from X-ray solution scattering, Biophys. J., 80: 2946–2953.
47. C. Thaler, S.V. Koushik, H.L. Puhl 3rd, P.S. Blank, S.S. Vogel, 2009, Structural rearrangement of CaMKIIalpha catalytic domains encodes activation, Proc. Natl. Acad. Sci. USA, 106, 6369–6374.
48. R.M. Tombes, M.O. Faison, J.M. Turbeville, 2003, Organization and evolution of multifunctional Ca(2+)/CaM-dependent protein kinase genes, Gene, 322: 17–31.
49. P. Wang, Y.L. Wu, T.H. Zhou, Y. Sun, G. Pei, 2000, Identification of alternative splicing variants of the beta subunit of human Ca(2+)/calmodulin-dependent protein kinase II with different activities, FEBS Lett., 475: 107–110.
50. J.R. Woodgett, P. Cohen, T. Yamauchi, H. Fujisawa, 1984, Comparison of calmodulin-dependent glycogen synthase kinase from skeletal muscle and calmodulin-dependent protein kinase-II from brain, FEBS Lett., 170: 49–54.
Supplemental References
51. Chao, L.H., Pellicena, P., Deindl, S., Barclay, L.A., Schulman, H., and Kuriyan, J., 2010, Intersubunit capture of regulatory segments is a component of cooperative CaMKII activation. Nat. Struct. Mol. Biol. 17: 264–272.
52. Chiba, H., Schneider, N.S., Matsuoka, S., and Noma, A., 2008, A simulation study on the activation of cardiac CaMKII delta-isoform and its regulation by phosphatases. Biophys. J. 95: 2139-2149.
53. de Diego, I., Kuper, J., Bakalova, N., Kursula, P., and Wilmanns, M., 2010, Molecular basis of the death-associated protein kinase-calcium/calmodulin regulator complex. Sci. Signal. 3: ra6.
54. Gillespie, D.T., 1976, A general method for numerically simulating the stochastic time evolution of coupled chemical reactions. J. Comp. Physiol. 22: 403–434.
55. Goldberg, J., Nairn, A.C., and Kuriyan, J., 1996, Structural basis for the autoinhibition of calcium/calmodulin-dependent protein kinase I. Cell 84: 875–887.
81
56. Griffith, L.C., Lu, C.S., and Sun, X.X., 2003, CaMKII, an enzyme on the move: regulation of temporospatial localization. Mol. Interv. 3: 386–403.
57. Hu, S.H., Parker, M.W., Lei, J.Y., Wilce, M.C., Benian, G.M., and Kemp, B.E., 1994, Insights into autoregulation from the crystal structure of twitchin kinase. Nature 369: 581–584.
58. Ikura, M., Clore, G.M., Gronenborn, A.M., Zhu, G., Klee, C.B., and Bax, A., 1992, Solution structure of a calmodulin-target peptide complex by multidimensional NMR. Science 256: 632–638.
59. Kim, C., Cheng, C.Y., Saldanha, S.A., and Taylor, S.S., 2007, PKA-I holoenzyme structure reveals a mechanism for cAMP-dependent activation. Cell 130: 1032–1043.
60. Lei, M., Lu, W., Meng, W., Parrini, M.C., Eck, M.J., Mayer, B.J., and Harrison, S.C., 2000, Structure of PAK1 in an autoinhibited conformation reveals a multistage activation switch. Cell 102: 387–397.
61. Mayans, O., van der Ven, P.F., Wilm, M., Mues, A., Young, P., Fürst, D.O., Wilmanns, M., and Gautel, M., 1998, Structural basis for activation of the titin kinase domain during myofibrillogenesis. Nature 395: 863–869.
62. Pirruccello, M., Sondermann, H., Pelton, J.G., Pellicena, P., Hoelz, A., Chernoff, J., Wemmer, D.E., and Kuriyan, J., 2006, A dimeric kinase assembly underlying autophosphorylation in the p21 activated kinases. J. Mol. Biol. 361: 312–326.
63. Rellos, P., Pike, A.C., Niesen, F.H., Salah, E., Lee, W.H., von Delft, F., and Knapp, S. (2010). calmodulin complex reveals the molecular mechanism/calmodulin complex reveals the molecular mechanism of CaMKII kinase activation. PLoS Biol. 8, e1000426. 64. Rosenberg, O.S., Deindl, S., Sung, R.J., Nairn, A.C., and Kuriyan, J., 2005, Structure of the autoinhibited kinase domain of CaMKII and SAXS analysis of the holoenzyme. Cell 123: 849–860.
65. Shen, K., Teruel, M.N., Subramanian, K., and Meyer, T., 1998, CaMKIIbeta functions as an F-actin targeting module that localizes CaMKIIalpha/beta heterooligomers to dendritic spines. Neuron 21: 593–606.
Chapter 5 1. Crick F., 1984, Memory and molecular turnover, Nature, 312(5990):101.
2. Luke H. Chao, Margaret M. Stratton, Il-Hyung Lee, Oren S. Rosenberg, Joshua Levitz, Daniel J. Mandell, Tanja Kortemme, Jay T. Groves, Howard Schulman and John Kuriyan., 2011, A Mechanism for Tunable Autoinhibition in the Structure of a Human Ca2+/Calmodulin- Dependent Kinase II Holoenzyme, Cell, 146(5): 732-745.
3. M.B. Kennedy, T. McGuinness, P. Greengard, 1983, A calcium/calmodulin-dependent protein kinase from mammalian brain that phosphorylates Synapsin I: partial purification and characterization, J. Neurosci., 3: 818–831.
4. R.C. Malenka, M.F. Bear, 2004, LTP and LTD: an embarrassment of riches, Neuron, 44: 5–21.
5. A. Hudmon, H. Schulman, 2002, Structure-function of the multifunctional Ca2+/calmodulin-dependent protein kinase II, Biochem. J., 364: 593–611.
6. John Lisman1, Ryohei Yasuda, Sridhar Raghavachari, 2012, Mechanisms of CaMKII action in long-term potentiation, Nat. Rev. Neurosci., 13: 169-182.
7. Oren S. Rosenberg, Sebastian Deindl, Luis R. Comolli, André Hoelz, Kenneth H. Downing, Angus C. Nairn, John Kuriyan, 2006, Oligomerization states of the association domain and the holoenyzme of Ca2+/CaM kinase II, FEBS Journal, 273( 4): 682–694.
8. Paul Miller, Anatol M. Zhabotinsky, John E. Lisman, Xiao-Jing Wang, 2005, The stability of a stochastic CaMKII switch: Dependence on the number of enzyme molecules and protein turnover, PLoS Biol, 3(4): e107.
9. Joseph S. Markson, Erin K. O’Shea, 2009, The molecular clockwork of a protein-based circadian oscillator, FEBS let., 583: 3938-3947.
82
10. Hakuto Kageyama, Taeko Nishiwaki, Masato Nakajima, Hideo Iwasaki, Tokitaka Oyama, Takao Kondo, 2006, Cyanobacterial Circadian Pacemaker: Kai Protein Complex Dynamics in the KaiC Phosphorylation Cycle In Vitro, Mol. Cell, 23(2): 161-171.
11. Bihua Feng, Sridhar Raghavachari, John Lisman, 2011, Quantitativeestimates of the cytoplasmic, PSD, and NMDAR-boundpools of CaMKII in dendritic spines, Brain Res., 1419(24): 46-52.
12. P. Wang, Y.L. Wu, T.H. Zhou, Y. Sun, G. Pei, 2000, Identification of alternative splicing variants of the beta subunit of human Ca(2+)/calmodulin-dependent protein kinase II with different activities, FEBS Lett., 475: 107–110.
13. Wei Zhang, Yaxin Jiang, Qiang Wang, Xinyong Ma, Zeyu Xiao, Wei Zuo, Xiaohong Fang, and Ye-Guang Chen, 2009, Single-molecule imaging reveals transforming growth factor-β-induced type II receptor dimerization, PNAS, 106(37): 15679-15683.
Chapter 6 1. Sreenivasa Rao Oruganti, Sofia Edin, Christine Grundstr, Thomas Grundstr, 2011, CaMKII targets Bcl10 in T-cell receptor induced activation of NF-kB, Mol. Immunol., 48: 1448-1460.
2. Ishiguro K, Green T, Rapley J, Wachtel H, Giallourakis C, Landry A, Cao Z, Lu N, Takafumi A, Goto H, Daly MJ, Xavier RJ., 2006, Ca2+/calmodulin-dependent protein kinase II is a modulator of CARMA1-mediated NF-kappaB activation., Mol. Cell. Biol., 14: 5497-508.
3. P Nghiem, T Ollick, P Gardner, H Schulman, 1994, lnterleukin-2 transcriptional block by multifunctional Ca2+/calmodulin kinase, Nature, 371: 347 – 350.
4. Jack D Bui, Sébastien Calbo, Kristine Hayden-Martinez, Lawrence P Kane∣, Phyllis Gardner, Stephen M Hedrick, 2000, A Role for CaMKII in TCellMemory, 100(4): 457–467.
5. Yoshihisa Kaizuka, Adam D. Douglass, Rajat Varma, Michael L. Dustin and Ronald D. Vale, 2007, Mechanisms for segregating T cell receptor and adhesion molecules during immunological synapse formation in Jurkat T cells, PNAS, 104( 51): 20296-20301.
6. Cheng-han Yu, Hung-Jen Wu, Yoshihisa Kaizuka, Ronald D. Vale, Jay T. Groves, 2010, Altered Actin Centripetal Retrograde Flow in Physically Restricted Immunological Synapses., PLoS ONE 5(7): e11878.
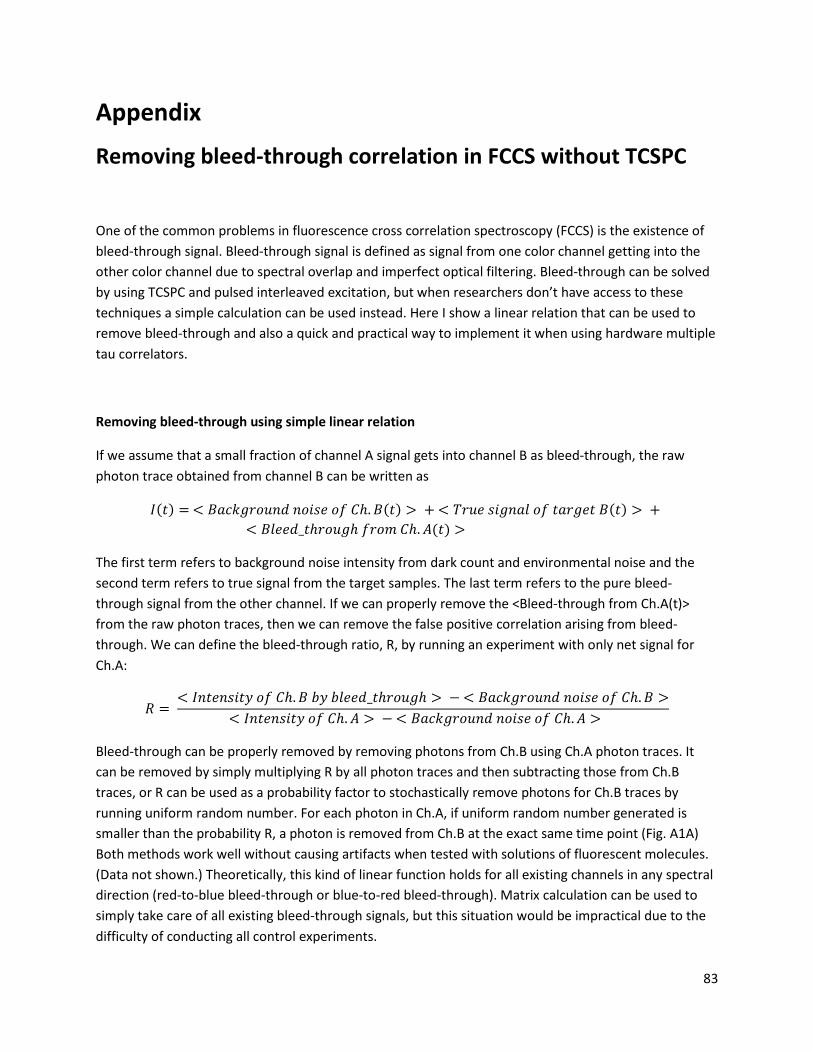
83
Appendix
Removing bleed-through correlation in FCCS without TCSPC
One of the common problems in fluorescence cross correlation spectroscopy (FCCS) is the existence of bleed-through signal. Bleed-through signal is defined as signal from one color channel getting into the other color channel due to spectral overlap and imperfect optical filtering. Bleed-through can be solved by using TCSPC and pulsed interleaved excitation, but when researchers don’t have access to these techniques a simple calculation can be used instead. Here I show a linear relation that can be used to remove bleed-through and also a quick and practical way to implement it when using hardware multiple tau correlators.
Removing bleed-through using simple linear relation
If we assume that a small fraction of channel A signal gets into channel B as bleed-through, the raw photon trace obtained from channel B can be written as
𝐼(𝑡) = < 𝐵𝑎𝑐𝑘𝑔𝑟𝑜𝑢𝑛𝑑 𝑛𝑜𝑖𝑠𝑒 𝑜𝑓 𝐶ℎ.𝐵(𝑡) > + < 𝑇𝑟𝑢𝑒 𝑠𝑖𝑔𝑛𝑎𝑙 𝑜𝑓 𝑡𝑎𝑟𝑔𝑒𝑡 𝐵(𝑡) > + < 𝐵𝑙𝑒𝑒𝑑_𝑡ℎ𝑟𝑜𝑢𝑔ℎ 𝑓𝑟𝑜𝑚 𝐶ℎ.𝐴(𝑡) >
The first term refers to background noise intensity from dark count and environmental noise and the second term refers to true signal from the target samples. The last term refers to the pure bleed-through signal from the other channel. If we can properly remove the <Bleed-through from Ch.A(t)> from the raw photon traces, then we can remove the false positive correlation arising from bleed-through. We can define the bleed-through ratio, R, by running an experiment with only net signal for Ch.A:
𝑅 = < 𝐼𝑛𝑡𝑒𝑛𝑠𝑖𝑡𝑦 𝑜𝑓 𝐶ℎ.𝐵 𝑏𝑦 𝑏𝑙𝑒𝑒𝑑_𝑡ℎ𝑟𝑜𝑢𝑔ℎ > − < 𝐵𝑎𝑐𝑘𝑔𝑟𝑜𝑢𝑛𝑑 𝑛𝑜𝑖𝑠𝑒 𝑜𝑓 𝐶ℎ.𝐵 >
< 𝐼𝑛𝑡𝑒𝑛𝑠𝑖𝑡𝑦 𝑜𝑓 𝐶ℎ.𝐴 > − < 𝐵𝑎𝑐𝑘𝑔𝑟𝑜𝑢𝑛𝑑 𝑛𝑜𝑖𝑠𝑒 𝑜𝑓 𝐶ℎ.𝐴 >
Bleed-through can be properly removed by removing photons from Ch.B using Ch.A photon traces. It can be removed by simply multiplying R by all photon traces and then subtracting those from Ch.B traces, or R can be used as a probability factor to stochastically remove photons for Ch.B traces by running uniform random number. For each photon in Ch.A, if uniform random number generated is smaller than the probability R, a photon is removed from Ch.B at the exact same time point (Fig. A1A) Both methods work well without causing artifacts when tested with solutions of fluorescent molecules. (Data not shown.) Theoretically, this kind of linear function holds for all existing channels in any spectral direction (red-to-blue bleed-through or blue-to-red bleed-through). Matrix calculation can be used to simply take care of all existing bleed-through signals, but this situation would be impractical due to the difficulty of conducting all control experiments.
84
Quick practical way to remove bleed-through correlation when using hardware multiple tau correlator
The method presented here can be used for Flex-OEM hardware correlators and also other correlators if they yield the information needed for this calculation. If one can obtain correlation functions of AxA, BxB, AxB (or BxA) simultaneously, this simple method can be used to immediately calculate final cross correlation (AxB or BxA) without treating raw photon traces. This is possible because a hardware correlator provides some intermediate numbers used for calculation before finalizing as numbers for correlation. Correlation is defined by
𝐶(𝜏) = < 𝐼𝐴(𝑡) × 𝐼𝐵(𝑡 + 𝜏) >< 𝐼𝐴(𝑡) >< 𝐼𝐵(𝑡) >
in which IA(t) and IB(t) are intensity traces for Ch.A and B. In the hardware correlator output, the three terms in the above equation are all given for each delay time as additional information. (Fig.A1B) If we abbreviate the term of numerator as <IAxIB>, then the following relation holds for cases with bleed-through from A to B:
<true IAxIB> = <IAxIB> - R x <IAxIA>
True correlation value can be obtained by subtracting the false amount of correlation using the equation above. Average intensity <IB> should also be adjusted by subtracting R x <IA> before dividing the above value.
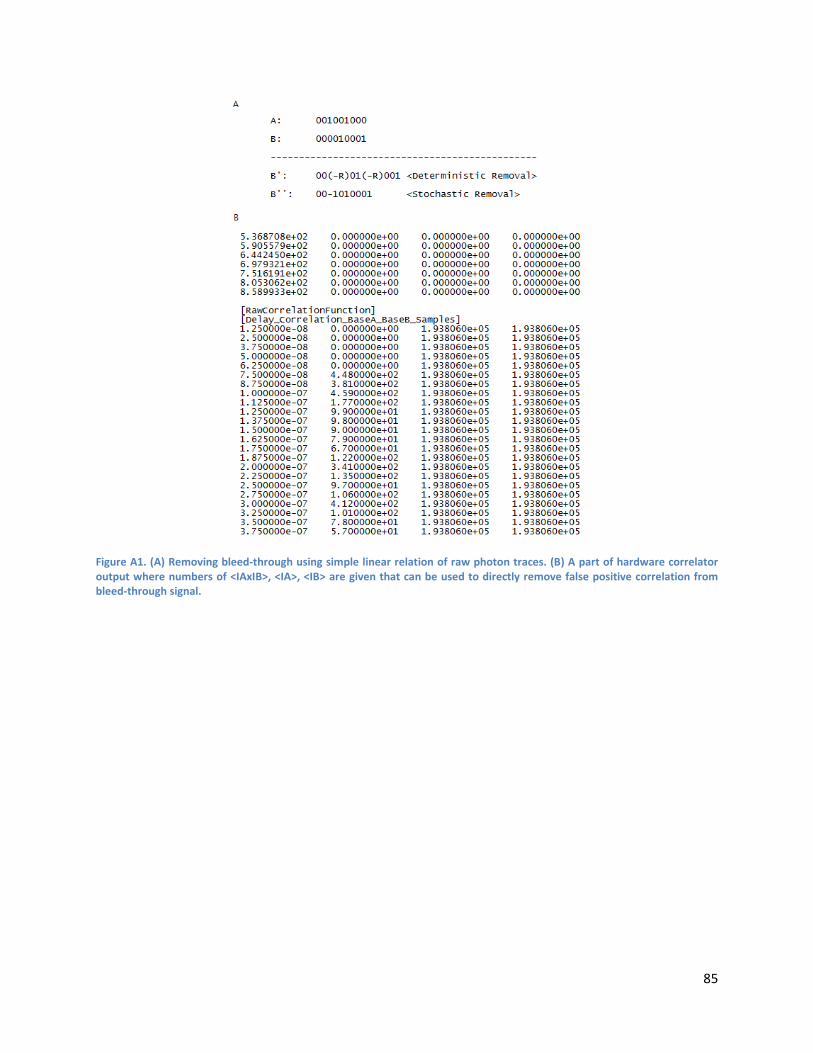
85
Figure A1. (A) Removing bleed-through using simple linear relation of raw photon traces. (B) A part of hardware correlator output where numbers of <IAxIB>, <IA>, <IB> are given that can be used to directly remove false positive correlation from bleed-through signal.