Embed Size (px)
Citation preview
LUND UNIVERSITY
PO Box 117221 00 Lund+46 46-222 00 00
Molecular subtyping of serous ovarian tumors reveals multiple connections to intrinsicbreast cancer subtypes.
Jönsson, Jenny-Maria; Johansson, Ida; Dominguez, Mev; Kimbung, Siker; Jönsson, Mats;Bonde, Jesper Hansen; Kannisto, Päivi; Måsbäck, Anna; Malander, Susanne; Nilbert, Mef;Hedenfalk, IngridPublished in:PLoS ONE
DOI:10.1371/journal.pone.0107643
2014
Link to publication
Citation for published version (APA):Jönsson, J-M., Johansson, I., Dominguez, M., Kimbung, S., Jönsson, M., Bonde, J. H., Kannisto, P., Måsbäck,A., Malander, S., Nilbert, M., & Hedenfalk, I. (2014). Molecular subtyping of serous ovarian tumors revealsmultiple connections to intrinsic breast cancer subtypes. PLoS ONE, 9(9), [e107643].https://doi.org/10.1371/journal.pone.0107643
Total number of authors:11
General rightsUnless other specific re-use rights are stated the following general rights apply:Copyright and moral rights for the publications made accessible in the public portal are retained by the authorsand/or other copyright owners and it is a condition of accessing publications that users recognise and abide by thelegal requirements associated with these rights. • Users may download and print one copy of any publication from the public portal for the purpose of private studyor research. • You may not further distribute the material or use it for any profit-making activity or commercial gain • You may freely distribute the URL identifying the publication in the public portal
Read more about Creative commons licenses: https://creativecommons.org/licenses/Take down policyIf you believe that this document breaches copyright please contact us providing details, and we will removeaccess to the work immediately and investigate your claim.
Molecular Subtyping of Serous Ovarian Tumors RevealsMultiple Connections to Intrinsic Breast Cancer SubtypesJenny-Maria Jonsson1*, Ida Johansson1,2, Mev Dominguez-Valentin1,5, Siker Kimbung1,2, Mats Jonsson1,
Jesper Hansen Bonde3, Paivi Kannisto4, Anna Masback1, Susanne Malander1, Mef Nilbert1,5,
Ingrid Hedenfalk1,2
1 Division of Oncology-Pathology, Department of Clinical Sciences, Skane University Hospital, Lund University, Lund, Sweden, 2 CREATE Health Strategic Center for
Translational Cancer Research, Lund University, Lund, Sweden, 3 Department of Pathology, Clinical Research Centre, Hvidovre Hospital, Copenhagen University, Hvidovre,
Denmark, 4 Division of Obstetrics and Gynecology, Department of Clinical Sciences, Skane University Hospital, Lund University, Lund, Sweden, 5 Clinical Research Centre,
Hvdiovre Hospital, Copenhagen University, Hvidovre, Denmark
Abstract
Objective: Transcriptional profiling of epithelial ovarian cancer has revealed molecular subtypes correlating to biologicaland clinical features. We aimed to determine gene expression differences between malignant, benign and borderline serousovarian tumors, and investigate similarities with the well-established intrinsic molecular subtypes of breast cancer.
Methods: Global gene expression profiling using Illumina’s HT12 Bead Arrays was applied to 59 fresh-frozen serous ovarianmalignant, benign and borderline tumors. Nearest centroid classification was performed applying previously publishedgene profiles for the ovarian and breast cancer subtypes. Correlations to gene expression modules representing keybiological breast cancer features were also sought. Validation was performed using an independent, publicly availabledataset.
Results: 5,944 genes were significantly differentially expressed between benign and malignant serous ovarian tumors, withcell cycle processes enriched in the malignant subgroup. Borderline tumors were split between the two clusters. Significantcorrelations between the malignant serous tumors and the highly aggressive ovarian cancer signatures, and the basal-likebreast cancer subtype were found. The benign and borderline serous tumors together were significantly correlated to thenormal-like breast cancer subtype and the ovarian cancer signature derived from borderline tumors. The borderline tumorsin the study dataset, in addition, also correlated significantly to the luminal A breast cancer subtype. These findingsremained when analyzed in an independent dataset, supporting links between the molecular subtypes of ovarian cancerand breast cancer beyond those recently acknowledged.
Conclusions: These data link the transcriptional profiles of serous ovarian cancer to the intrinsic molecular subtypes ofbreast cancer, in line with the shared clinical and molecular features between high-grade serous ovarian cancer and basal-like breast cancer, and suggest that biomarkers and targeted therapies may overlap between these tumor subsets. The linkbetween benign and borderline ovarian cancer and luminal breast cancer may indicate endocrine responsiveness in asubset of ovarian cancers.
Citation: Jonsson J-M, Johansson I, Dominguez-Valentin M, Kimbung S, Jonsson M, et al. (2014) Molecular Subtyping of Serous Ovarian Tumors Reveals MultipleConnections to Intrinsic Breast Cancer Subtypes. PLoS ONE 9(9): e107643. doi:10.1371/journal.pone.0107643
Editor: Goli Samimi, Garvan Institute of Medical Research, Australia
Received June 5, 2014; Accepted August 12, 2014; Published September 16, 2014
Copyright: � 2014 Jonsson et al. This is an open-access article distributed under the terms of the Creative Commons Attribution License, which permitsunrestricted use, distribution, and reproduction in any medium, provided the original author and source are credited.
Data Availability: The authors confirm that all data underlying the findings are fully available without restriction. All gene expression data files are available inthe National Center for Biotechnology Information Gene Expression Omnibus [GEO accession number: GSE57477].
Funding: Financial support was granted from a governmental funding of clinical research within the National Health Services (JMJ), the Swedish Cancer Society(MN, IH), the Swedish Research Council (MN, IH) and an unrestricted educational grant from the Swedish Society of Gynecologic Oncology sponsored by Roche(JMJ). Funding has neither influenced study design, data collection nor analysis or manuscript writing.
Competing Interests: The authors have declared that no competing interests exist.
* Email: [email protected]
Introduction
Epithelial ovarian tumors constitute a heterogeneous group of
neoplasms that differ in epidemiology, genetic risk factors,
precursor lesions and clinical behavior. The different histopath-
ologic subtypes, i.e. serous, mucinous, endometrioid, clear cell and
transitional carcinomas and carcinosarcomas, likely have different
origins and appear to evolve along distinct pathways [1–3].
Alongside with the standard taxane and platinum based agents
used for ovarian cancer [4–6], multiple targeted agents are being
evaluated, with e.g. bevacizumab recently being included in the
therapeutic arsenal [7]. Personalized therapy is called for in
ovarian cancer particularly since the histopathologic subtypes, as
well as tumors with different malignant potential and tumor grade,
can be viewed as separate diseases with differences related to both
prognosis and treatment response [8–12]. Refined molecular
subtyping and recognition of key genetic mechanisms constitutes
PLOS ONE | www.plosone.org 1 September 2014 | Volume 9 | Issue 9 | e107643
an encouraging basis for further development of subtype-specific
targeted therapies.
Previous efforts to characterize ovarian cancers at the molecular
level have identified distinct profiles related to the histologic
subtypes and have suggested predictive gene signatures [13–17].
Tothill et al. suggested six different subtypes, referred to as C1–C6,
based on serous and endometrioid ovarian, primary peritoneal
and fallopian tube tumors. The C1–C2 and C4–C5 subtypes, in
general, are thought to characterize high-grade serous tumors.
The C1 signature is characterized by a high degree of
desmoplasia, C5 by mesenchymal genes and overexpression of
proliferation genes and the C2 and C4 signatures by high numbers
of intra-tumoral and stroma associated CD3+ cells. The signatures
are outcome predictive, with the C1 signature corresponding to a
considerably worse outcome than the other signatures. The C3
signature represents low-grade serous and borderline tumors and
the C6 signature low-grade, early-stage endometrioid tumors; in
general they show good response to treatment and long-time
survival [18]. Likewise, molecular subtyping in breast cancer is
well established and recent reports have recognized similarities
between high-grade serous ovarian cancer and basal-like breast
cancer [19].
We performed global gene expression profiling of serous ovarian
tumors, including serous cystadenomas, serous borderline tumors
and serous adenocarcinomas, and applied previously described
gene signatures including the well-known intrinsic breast cancer
subtypes [18,20–22] to outline further possible similarities between
these tumor types. Since mutations in the MAPK/ERK pathways
are common in both borderline and low-grade ovarian cancer and
luminal breast cancers the presence of KRAS and BRAFmutations was investigated among the ovarian tumors [23,24].
Shared common features between ovarian and breast cancer may
be useful for future development of predictive biomarkers and
tailored treatments in both tumor types, and in this study we
present interesting connections between the molecular subtypes of
ovarian and breast cancer.
Materials and Methods
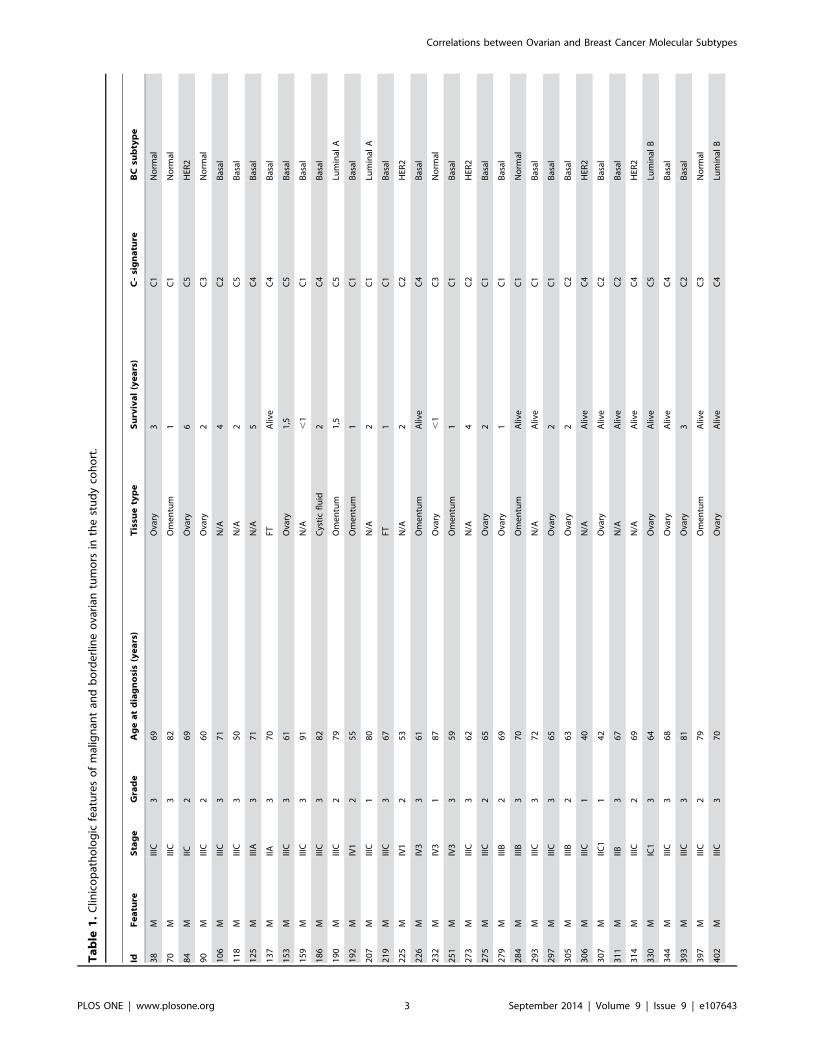
Tumor samplesIn total, 37 serous ovarian adenocarcinomas, 17 serous
cystadenomas/adenofibromas and 5 serous borderline tumors
were obtained from the Skane University Hospital ovarian tumor
biobank (table 1). A total of 13 biological replicates (6 omental
metastases, 1 pelvic metastasis and 2 metastases to the contralat-
eral ovary as well as 3 benign and 1 borderline ovarian tumors)
were included to account for intra-tumor heterogeneity. All tumor
samples were collected at primary surgery (2003–2011) and the
patients had not received chemotherapy prior to surgery.
Histologic subtype and grade were determined according to
Silverberg and WHO [25,26] and all tumors were staged
according to the International Federation of Gynecology and
Obstetrics (FIGO) criteria. Hematoxylin & Eosin stained slides
were used to assess tumor grade. This was performed by a senior
pathologist (AM). Ethical approval for the study was granted from
the Lund University ethics committee, Sweden, waiving the
requirement for informed consent for the study.
RNA extraction and gene expression analysisTotal RNA was extracted using the Allprep kit (Qiagen,
Heidelberg, Germany) according to the manufacturer’s instruc-
tions. RNA concentration was determined using a NanoDrop
Spectrophotometer (NanoDrop Technologies, Wilmington, DE)
and samples with $200 ng RNA with 260/280 ratios $1.8 were
used for further analysis. RNA quality was assessed using a
Bioanalyzer (Agilent technologies, Santa Clara, CA), and RNA
integrity numbers (RIN) .6 were regarded as sufficient.
Gene expression profiling analyses were performed at the
SCIBLU Genomics Centre, Lund University, Sweden. The cDNA
synthesis, labeling, and subsequent hybridization to the Hu-
manHT-12 v4 Expression BeadChips (Illumina Inc., San Diego,
CA) was performed according to the manufacturer’s instructions.
The Illumina HumanHT-12 v4 Expression BeadChips allow
genome-wide expression profiling of more than 47,000 gene
transcripts and splice variants. The 59 samples and 13 biological
replicates were randomized on the chips. The BeadChips were
then scanned on an i-Scan (Illumina Inc.), during which
fluorescence intensities were read and images extracted. The gene
expression data are available in the National Center for
Biotechnology Information Gene Expression Omnibus [GEO
accession number: GSE57477] [27].
Data analysisGene expression data were uploaded to the GenomeStudio
software (Illumina Inc.), quantile normalized, background cor-
rected and log2 transformed. Probes with a mean intensity ,2.5
and variance ,0.1 were excluded, leaving a total of 16,024 probes
corresponding to 12,313 unique genes. Thereafter the data were
uploaded to the MeV v4 software, an application used for
identification of genes and expression patterns in microarray data
[28], mean centered and a variance filter was applied to select the
20% of the probes with the greatest variation of expression across
the dataset. Unsupervised hierarchical clustering was performed
using complete linkage and Pearson distant metric. Two-class
unpaired significance analysis of microarrays (SAM) was per-
formed based on all 16,024 probes to identify differentially
expressed probes between the different tumor subgroups (benign,
borderline, malignant) at a false discovery rate (FDR) ,0.01 [29].
Hierarchical clustering, supervised by the SAM analysis results
and thereby identifying significantly differentially expressed genes
between the tumor subgroups, was performed using the same
methods as for unsupervised clustering. Gene ontology analyses
based on the significant genes were performed in the gene
ontology enrichment analysis and visualization tools GOrilla and
ToppGene for identification of possible gene enrichment with
biological or functional differences separating the subgroups
[30,31].
Molecular subtyping and external data setsGene signatures outlining six molecular subtypes of high-grade
and advanced stage serous ovarian tumors as well as endometrioid,
low-grade serous and borderline ovarian tumors (referred to as the
‘‘Tothill dataset’’) [18] were applied to the serous ovarian tumors
in our cohort. Data were normalized and log2 transformed using
the Gene Chip Operating Software Version 1.4 with Affymetrix
default analysis settings. Probes with intensity values ,4 and
variance ,0.15 were excluded. The six ovarian cancer signatures
contained in total 4,732 probes of which 4,099 probes,
corresponding to 2,725 unique genes, with good quality were left
after filtering away probes with bad quality. 1,295/2,725 (47.5%)
of these genes were identified in our dataset and used for further
analyses. To validate the classifier, the 1,295 genes present in our
dataset were re-applied to the 285 ovarian tumors in the original
cohort, thereby re-assigning subtypes to each tumor. A gene
signature for intrinsic subtyping of breast cancer was also applied
to our serous ovarian tumors [22]. Each tumor in our cohort was
classified into the molecular subtypes of ovarian cancer (C1–C6) as
well as the intrinsic subtypes of breast cancer (luminal A, luminal
Correlations between Ovarian and Breast Cancer Molecular Subtypes
PLOS ONE | www.plosone.org 2 September 2014 | Volume 9 | Issue 9 | e107643
Ta
ble
1.
Clin
ico
pat
ho
log
icfe
atu
res
of
mal
ign
ant
and
bo
rde
rlin
eo
vari
antu
mo
rsin
the
stu
dy
coh
ort
.
IdF
ea
ture
Sta
ge
Gra
de
Ag
ea
td
iag
no
sis
(ye
ars
)T
issu
ety
pe
Su
rviv
al
(ye
ars
)C
-si
gn
atu
reB
Csu
bty
pe
38
MIII
C3
69
Ova
ry3
C1
No
rmal
70
MIII
C3
82
Om
en
tum
1C
1N
orm
al
84
MIIC
26
9O
vary
6C
5H
ER2
90
MIII
C2
60
Ova
ry2
C3
No
rmal
10
6M
IIIC
37
1N
/A4
C2
Bas
al
11
8M
IIIC
35
0N
/A2
C5
Bas
al
12
5M
IIIA
37
1N
/A5
C4
Bas
al
13
7M
IIA3
70
FTA
live
C4
Bas
al
15
3M
IIIC
36
1O
vary
1,5
C5
Bas
al
15
9M
IIIC
39
1N
/A,
1C
1B
asal
18
6M
IIIC
38
2C
ysti
cfl
uid
2C
4B
asal
19
0M
IIIC
27
9O
me
ntu
m1
,5C
5Lu
min
alA
19
2M
IV1
25
5O
me
ntu
m1
C1
Bas
al
20
7M
IIIC
18
0N
/A2
C1
Lum
inal
A
21
9M
IIIC
36
7FT
1C
1B
asal
22
5M
IV1
25
3N
/A2
C2
HER
2
22
6M
IV3
36
1O
me
ntu
mA
live
C4
Bas
al
23
2M
IV3
18
7O
vary
,1
C3
No
rmal
25
1M
IV3
35
9O
me
ntu
m1
C1
Bas
al
27
3M
IIIC
36
2N
/A4
C2
HER
2
27
5M
IIIC
26
5O
vary
2C
1B
asal
27
9M
IIIB
26
9O
vary
1C
1B
asal
28
4M
IIIB
37
0O
me
ntu
mA
live
C1
No
rmal
29
3M
IIIC
37
2N
/AA
live
C1
Bas
al
29
7M
IIIC
36
5O
vary
2C
1B
asal
30
5M
IIIB
26
3O
vary
2C
2B
asal
30
6M
IIIC
14
0N
/AA
live
C4
HER
2
30
7M
IIC1
14
2O
vary
Aliv
eC
2B
asal
31
1M
IIB3
67
N/A
Aliv
eC
2B
asal
31
4M
IIIC
26
9N
/AA
live
C4
HER
2
33
0M
IC1
36
4O
vary
Aliv
eC
5Lu
min
alB
34
4M
IIIC
36
8O
vary
Aliv
eC
4B
asal
39
3M
IIIC
38
1O
vary
3C
2B
asal
39
7M
IIIC
27
9O
me
ntu
mA
live
C3
No
rmal
40
2M
IIIC
37
0O
vary
Aliv
eC
4Lu
min
alB
Correlations between Ovarian and Breast Cancer Molecular Subtypes
PLOS ONE | www.plosone.org 3 September 2014 | Volume 9 | Issue 9 | e107643

B, basal-like, normal-like, and HER2 enriched) using nearest
centroid classification. The methodology for nearest centroid
classification is outlined by Johansson et al.[32]. Validation was
performed by classifying the 285 ovarian tumors in the Tothill
dataset into the intrinsic breast cancer subtypes. Furthermore,
seven gene expression modules representing key biological
processes in breast cancer (AURKA/proliferation, CASP3/
apoptosis, ERBb2/HER2 signaling, ESR1/ER signaling,
STAT1/immune response, PLAU/tumor invasion and metastasis,
VEGF/angiogenesis; referred to as the ‘‘Desmedt modules’’) were
applied to the serous ovarian tumors in our dataset as well as the
Tothill dataset [33], and their relationship to the previously
described intrinsic breast cancer subtypes was investigated. These
modules, derived from 917 breast cancers in publicly available
datasets and characterized by computed module scores, comprise
in total 889 genes.
Mutation analysisKRAS mutation analysis was performed using the Roche cobas
K-RAS Mutation Kit (product number 05852170190) (Roche,
Pleasanton, CA), a CE-IVD real-time melting curve KRAS
mutations assay, detecting mutations in codons 12, 13 and 61 of
the KRAS oncogene. BRAF mutation analysis was performed
using the Roche cobas BRAF V600 mutational analysis (product
number 05985595190), which evaluates the BRAF V600 site in
exon 15 and detects wildtype or mutated V600. The analyses were
performed according to the manufacturer’s instructions, and the
assays were run on the z480 Lightcycler (Roche). The mutation
analyses were performed at the Department of Pathology, Clinical
Research Centre, Hvidovre Hospital, Denmark.
Statistical methodsMann-Whitney U-test and Pearson correlation were used for
comparison between expression profiles of the different tumor
subsets using the MeV 4.6.02 software. Correlations between
different subtype classifications were assessed using Fisher’s exact
test and between module scores using Mann-Whitney U-test and
Kruskal Wallis test in SPSS (IBM SPSS Statistics 19). P-values ,
0.05 were considered statistically significant.
Results
Comparison of malignant, benign and borderline serousovarian cancers
Unsupervised hierarchical clustering of benign and malignant
tumors based on the 20% of the probes that showed the most
variability revealed two distinct clusters, one containing only
malignant tumors and one containing all benign and four
malignant tumors (Figure S1). All but one of the biological
replicates clustered together pair-wise. The clusters remained
stable after removal of the biological replicates, suggesting stable
transcriptional differences between the clusters (Figure S2). Of
note, of the four malignant tumors in the benign cluster one was
grade 1, two were grade 2 and one was grade 3, but no significant
differences regarding stage or mean age at diagnosis were seen
between the malignant tumors in the two clusters.
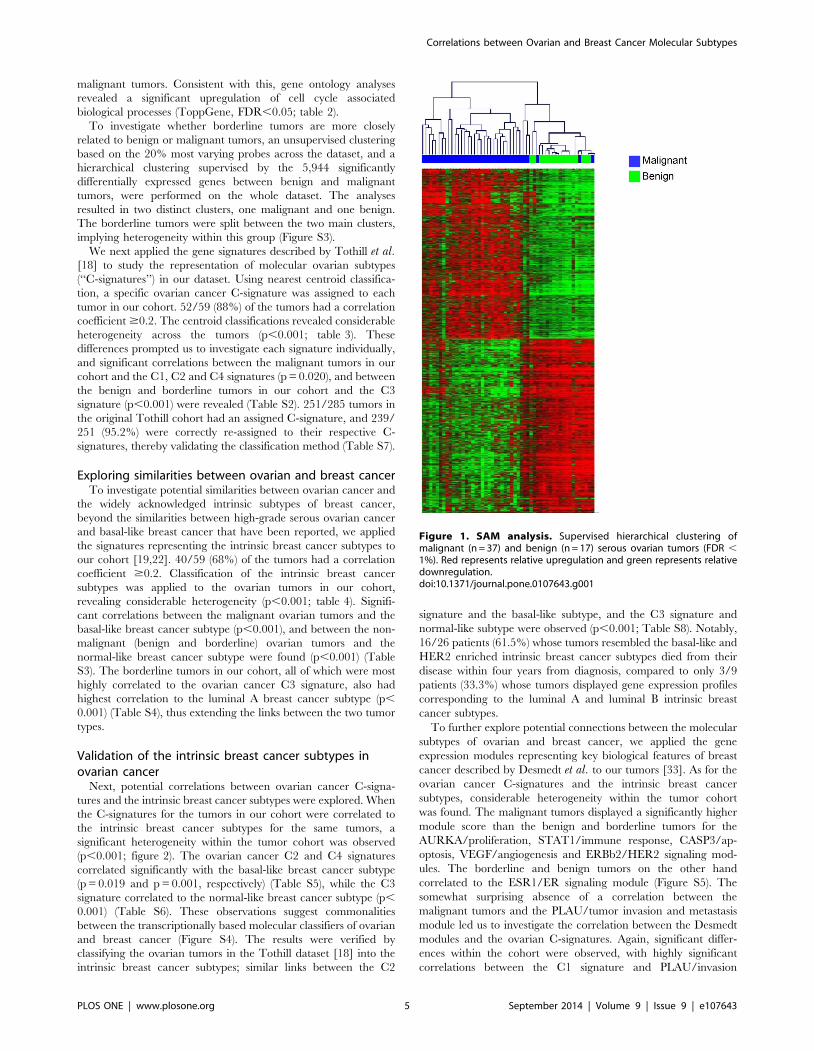
Next, a SAM analysis was performed to explore transcriptional
differences between benign and malignant tumors, revealing 5,944
significantly differentially expressed genes (FDR ,0.01), of which
2,984 were upregulated and 2,960 were downregulated among the
malignant tumors (figure 1, Table S1).
Cell cycle kinases (e.g. CDC2, CDC5, CDC7 and CDC20) as
well as AURKA and S100A9, which can all broadly be linked to
cell cycle regulation and mitosis, were upregulated in the
Ta
ble
1.
Co
nt.
IdF
ea
ture
Sta
ge
Gra
de
Ag
ea
td
iag
no
sis
(ye
ars
)T
issu
ety
pe
Su
rviv
al
(ye
ars
)C
-si
gn
atu
reB
Csu
bty
pe
42
0M
IC1
16
7O
vary
Aliv
eC
4Lu
min
alB
43
8M
IIIC
35
3O
vary
Aliv
eC
2B
asal
16
Bo
IAN
/A4
0O
vary
Aliv
eC
3Lu
min
alA
48
Bo
IAN
/A5
1O
vary
Aliv
eC
3Lu
min
alA
86
Bo
IAN
/A4
5N
/AA
live
C3
Lum
inal
A
37
7B
oIC
1N
/A6
7O
vary
Aliv
eC
3N
orm
al
38
5B
oIC
1N
/A6
0O
vary
Aliv
eC
3Lu
min
alA
Fea
ture
:M=
Mal
ign
ant,
Bo
=B
ord
erl
ine
;Tis
sue
typ
e:ti
ssu
eu
sed
for
RN
Ae
xtra
ctio
n,F
T=
Fallo
pia
nT
ub
e,N
/A=
Un
kno
wn
;Su
rviv
al:
Dis
eas
esp
eci
fic
surv
ival
,Aliv
e=
aliv
eat
star
to
fst
ud
y;C
-sig
na
ture
:co
rre
spo
nd
ing
ova
rian
mo
lecu
lar
sub
typ
e[1
8];
BC
sub
typ
e:co
rre
spo
nd
ing
intr
insi
cb
reas
tca
nce
rsu
bty
pe
[22
].d
oi:1
0.1
37
1/j
ou
rnal
.po
ne
.01
07
64
3.t
00
1
Correlations between Ovarian and Breast Cancer Molecular Subtypes
PLOS ONE | www.plosone.org 4 September 2014 | Volume 9 | Issue 9 | e107643
malignant tumors. Consistent with this, gene ontology analyses
revealed a significant upregulation of cell cycle associated
biological processes (ToppGene, FDR,0.05; table 2).
To investigate whether borderline tumors are more closely
related to benign or malignant tumors, an unsupervised clustering
based on the 20% most varying probes across the dataset, and a
hierarchical clustering supervised by the 5,944 significantly
differentially expressed genes between benign and malignant
tumors, were performed on the whole dataset. The analyses
resulted in two distinct clusters, one malignant and one benign.
The borderline tumors were split between the two main clusters,
implying heterogeneity within this group (Figure S3).
We next applied the gene signatures described by Tothill et al.[18] to study the representation of molecular ovarian subtypes
(‘‘C-signatures’’) in our dataset. Using nearest centroid classifica-
tion, a specific ovarian cancer C-signature was assigned to each
tumor in our cohort. 52/59 (88%) of the tumors had a correlation
coefficient $0.2. The centroid classifications revealed considerable
heterogeneity across the tumors (p,0.001; table 3). These
differences prompted us to investigate each signature individually,
and significant correlations between the malignant tumors in our
cohort and the C1, C2 and C4 signatures (p = 0.020), and between
the benign and borderline tumors in our cohort and the C3
signature (p,0.001) were revealed (Table S2). 251/285 tumors in
the original Tothill cohort had an assigned C-signature, and 239/
251 (95.2%) were correctly re-assigned to their respective C-
signatures, thereby validating the classification method (Table S7).
Exploring similarities between ovarian and breast cancerTo investigate potential similarities between ovarian cancer and
the widely acknowledged intrinsic subtypes of breast cancer,
beyond the similarities between high-grade serous ovarian cancer
and basal-like breast cancer that have been reported, we applied
the signatures representing the intrinsic breast cancer subtypes to
our cohort [19,22]. 40/59 (68%) of the tumors had a correlation
coefficient $0.2. Classification of the intrinsic breast cancer
subtypes was applied to the ovarian tumors in our cohort,
revealing considerable heterogeneity (p,0.001; table 4). Signifi-
cant correlations between the malignant ovarian tumors and the
basal-like breast cancer subtype (p,0.001), and between the non-
malignant (benign and borderline) ovarian tumors and the
normal-like breast cancer subtype were found (p,0.001) (Table
S3). The borderline tumors in our cohort, all of which were most
highly correlated to the ovarian cancer C3 signature, also had
highest correlation to the luminal A breast cancer subtype (p,
0.001) (Table S4), thus extending the links between the two tumor
types.
Validation of the intrinsic breast cancer subtypes inovarian cancer
Next, potential correlations between ovarian cancer C-signa-
tures and the intrinsic breast cancer subtypes were explored. When
the C-signatures for the tumors in our cohort were correlated to
the intrinsic breast cancer subtypes for the same tumors, a
significant heterogeneity within the tumor cohort was observed
(p,0.001; figure 2). The ovarian cancer C2 and C4 signatures
correlated significantly with the basal-like breast cancer subtype
(p = 0.019 and p = 0.001, respectively) (Table S5), while the C3
signature correlated to the normal-like breast cancer subtype (p,
0.001) (Table S6). These observations suggest commonalities
between the transcriptionally based molecular classifiers of ovarian
and breast cancer (Figure S4). The results were verified by
classifying the ovarian tumors in the Tothill dataset [18] into the
intrinsic breast cancer subtypes; similar links between the C2
signature and the basal-like subtype, and the C3 signature and
normal-like subtype were observed (p,0.001; Table S8). Notably,
16/26 patients (61.5%) whose tumors resembled the basal-like and
HER2 enriched intrinsic breast cancer subtypes died from their
disease within four years from diagnosis, compared to only 3/9
patients (33.3%) whose tumors displayed gene expression profiles
corresponding to the luminal A and luminal B intrinsic breast
cancer subtypes.
To further explore potential connections between the molecular
subtypes of ovarian and breast cancer, we applied the gene
expression modules representing key biological features of breast
cancer described by Desmedt et al. to our tumors [33]. As for the
ovarian cancer C-signatures and the intrinsic breast cancer
subtypes, considerable heterogeneity within the tumor cohort
was found. The malignant tumors displayed a significantly higher
module score than the benign and borderline tumors for the
AURKA/proliferation, STAT1/immune response, CASP3/ap-
optosis, VEGF/angiogenesis and ERBb2/HER2 signaling mod-
ules. The borderline and benign tumors on the other hand
correlated to the ESR1/ER signaling module (Figure S5). The
somewhat surprising absence of a correlation between the
malignant tumors and the PLAU/tumor invasion and metastasis
module led us to investigate the correlation between the Desmedt
modules and the ovarian C-signatures. Again, significant differ-
ences within the cohort were observed, with highly significant
correlations between the C1 signature and PLAU/invasion
Figure 1. SAM analysis. Supervised hierarchical clustering ofmalignant (n = 37) and benign (n = 17) serous ovarian tumors (FDR ,1%). Red represents relative upregulation and green represents relativedownregulation.doi:10.1371/journal.pone.0107643.g001
Correlations between Ovarian and Breast Cancer Molecular Subtypes
PLOS ONE | www.plosone.org 5 September 2014 | Volume 9 | Issue 9 | e107643
module (p,0.001), the C2 signature and STAT1/immune
response module (p,0.001), and the C4 signature and VEGF/
angiogenesis module (p = 0.001). The C5 signature showed a trend
towards correlation to the AURKA/proliferation module com-
pared to non-C5 tumors, but did not reach statistical significance
(p = 0.176). The C3 signature correlated significantly to the
ESR1/ER module (p,0.001, figure 3). Finally, we also applied
the Desmedt modules to the tumors in the Tothill dataset, and
could verify the correlations described between the ovarian cancer
C-signatures and the functional breast cancer derived gene
expression modules (Figure S6). In addition, in this larger cohort,
the C5/AURKA correlation was also found to be significant (p,
0.001).
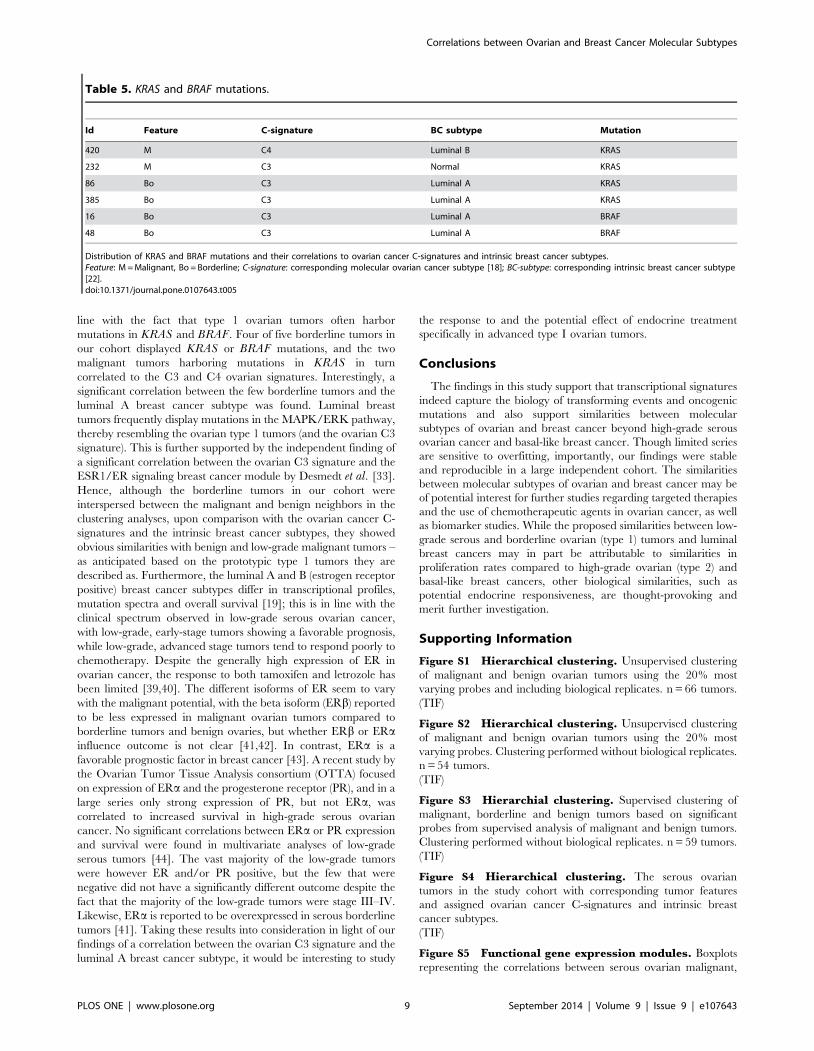
Mutation analysisMutation analyses revealed four tumors with KRAS mutations
and two tumors with BRAF mutations in our cohort. Four of these
mutations were present among the borderline tumors, all of which
corresponded to the C3 ovarian cancer signature and the luminal
A breast cancer subtype, respectively. Two malignant tumors,
both grade 1, harbored mutations in KRAS and corresponded to
the C3/normal-like subtypes and C4/luminal B subtypes,
respectively (table 5).
Discussion
Serous carcinomas account for about 50% of the malignant
epithelial ovarian tumors and thereby constitute the predominant
histologic subtype. Type 1 tumors, i.e. low-grade serous carcino-
mas, along with low-grade endometrioid, mucinous and clear cell
tumors, are thought to develop step-wise from benign cystadeno-
mas/adenofibromas via borderline tumors and are typically slowly
proliferating and frequently harbor mutations in KRAS, BRAFand PTEN. In contrast, type 2 tumors (high-grade serous and
high-grade endometrioid ovarian tumors, carcinosarcomas and
undifferentiated carcinomas) are suggested to develop from
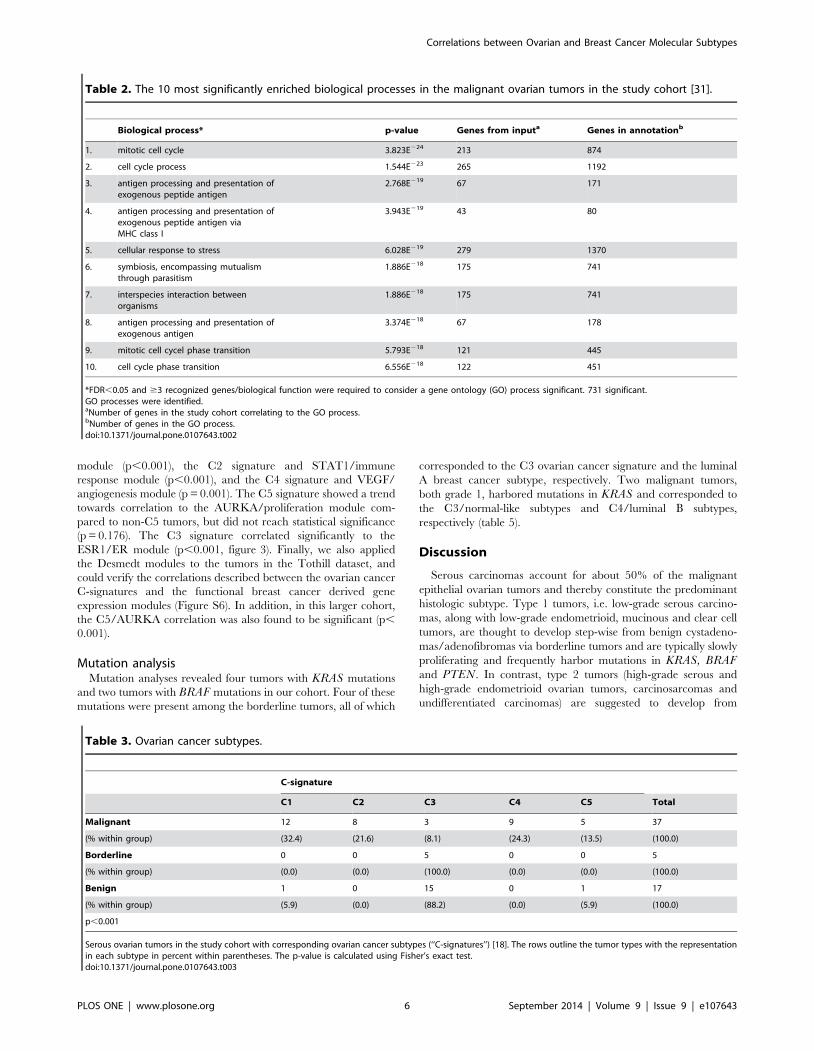
Table 2. The 10 most significantly enriched biological processes in the malignant ovarian tumors in the study cohort [31].
Biological process* p-value Genes from inputa Genes in annotationb
1. mitotic cell cycle 3.823E224 213 874
2. cell cycle process 1.544E223 265 1192
3. antigen processing and presentation ofexogenous peptide antigen
2.768E219 67 171
4. antigen processing and presentation ofexogenous peptide antigen viaMHC class I
3.943E219 43 80
5. cellular response to stress 6.028E219 279 1370
6. symbiosis, encompassing mutualismthrough parasitism
1.886E218 175 741
7. interspecies interaction betweenorganisms
1.886E218 175 741
8. antigen processing and presentation ofexogenous antigen
3.374E218 67 178
9. mitotic cell cycel phase transition 5.793E218 121 445
10. cell cycle phase transition 6.556E218 122 451
*FDR,0.05 and $3 recognized genes/biological function were required to consider a gene ontology (GO) process significant. 731 significant.GO processes were identified.aNumber of genes in the study cohort correlating to the GO process.bNumber of genes in the GO process.doi:10.1371/journal.pone.0107643.t002
Table 3. Ovarian cancer subtypes.
C-signature
C1 C2 C3 C4 C5 Total
Malignant 12 8 3 9 5 37
(% within group) (32.4) (21.6) (8.1) (24.3) (13.5) (100.0)
Borderline 0 0 5 0 0 5
(% within group) (0.0) (0.0) (100.0) (0.0) (0.0) (100.0)
Benign 1 0 15 0 1 17
(% within group) (5.9) (0.0) (88.2) (0.0) (5.9) (100.0)
p,0.001
Serous ovarian tumors in the study cohort with corresponding ovarian cancer subtypes (‘‘C-signatures’’) [18]. The rows outline the tumor types with the representationin each subtype in percent within parentheses. The p-value is calculated using Fisher’s exact test.doi:10.1371/journal.pone.0107643.t003
Correlations between Ovarian and Breast Cancer Molecular Subtypes
PLOS ONE | www.plosone.org 6 September 2014 | Volume 9 | Issue 9 | e107643
precursor lesions in the fallopian tube [24] and are characterized
by rapid progression and frequent TP53 mutations [10,34–36].
Molecular subtyping of ovarian cancer is being increasingly
recognized, with e.g. the six transcriptionally based ovarian C-
signatures proposed by Tothill et al. being both descriptive (with
good correlations to clinical factors) and predictive of outcome
[18].
Molecular subtypes of breast cancer have been established and
linked to clinical behavior and treatment response [20,21].
Although about 60% of all ovarian tumors display high expression
of estrogen receptors (ER) [37], features shared between high-
grade serous ovarian cancer and basal-like breast cancer (the
majority of which are ‘‘triple negative’’, i.e. lack expression of
estrogen and progesterone receptors and HER2 amplification)
have recently been reported. Both tumor groups display frequent
TP53 mutations and genomic instability and are clinically
aggressive. Also, BRCA mutations are more frequent in high-
grade serous ovarian cancers and in basal-like breast cancers in the
case of BRCA1 [19]. The diagnostic and therapeutic potential in
clarifying ovarian cancer heterogeneity and identifying mecha-
nisms shared between ovarian cancer and breast cancer consti-
tuted the basis of our study.
SAM analysis between the malignant and benign ovarian
tumors in our cohort revealed enrichment of cell cycle associated
processes among the malignant tumors, in line with malignant
tumors being highly proliferative per se. Although very few
borderline tumors were included in our cohort, the fact that they
were divided between the benign and the malignant tumor
clusters, regardless of whether the clustering was supervised by
significantly differentially expressed genes between benign and
malignant tumors, or unsupervised, is in line with other studies
indicating that borderline tumors constitute a very heterogeneous
group with both benign and malignant features [38].
Classification of the ovarian tumors in our cohort using the C-
signatures demonstrated the presence of all but the C6 signature.
Since the C6 signature is characterized mainly by low-grade
endometrioid tumors, which were not present in our cohort, this
finding supports the ability of gene signatures to capture
histological differences, and indicates that the C-signatures are
stable and widely applicable across datasets and microarray
platforms. The malignant tumors correlated significantly to the
C1, C2 and C4 signatures, and as anticipated from the recent data
reported from the TCGA, classification into the intrinsic breast
cancer subtypes also revealed a significant correlation between
malignant ovarian tumors and the basal-like breast cancer subtype
[19]. This link was further supported by the finding that the
ovarian tumors classified as basal-like in our cohort in turn
correlated to the C2 and C4 signatures. A majority of both high-
grade serous ovarian and basal-like breast cancers express high
levels of proliferation genes [16,19]. Proliferation, among other
biological processes, is captured by the Desmedt modules, and we
could correlate the C-signatures to these modules and verify the
finding in an independent dataset. The C2 ‘‘high immune
signature’’ correlated significantly to the STAT1/immune re-
sponse module, for example, and the C1 ‘‘high stromal response
signature’’ to the PLAU/invasion and metastasis module. Taken
together, the breast cancer derived Desmedt modules capture the
nature of the C-signatures as outlined by both Tothill et al. and the
TCGA well [16,18] and provide further biological information
regarding the differences in phenotype between the subgroups.
Moreover, the statistical correlations shown here further support
the link between the subtypes of serous ovarian and breast cancer.
The C3 signature in the original study encompassed borderline
(low malignant potential, LMP) tumors and, as expected, the
benign and borderline tumors in our cohort correlated signifi-
cantly to the C3 signature. This signature is characterized by a
relative overexpression of genes in the MAPK/ERK pathway, in
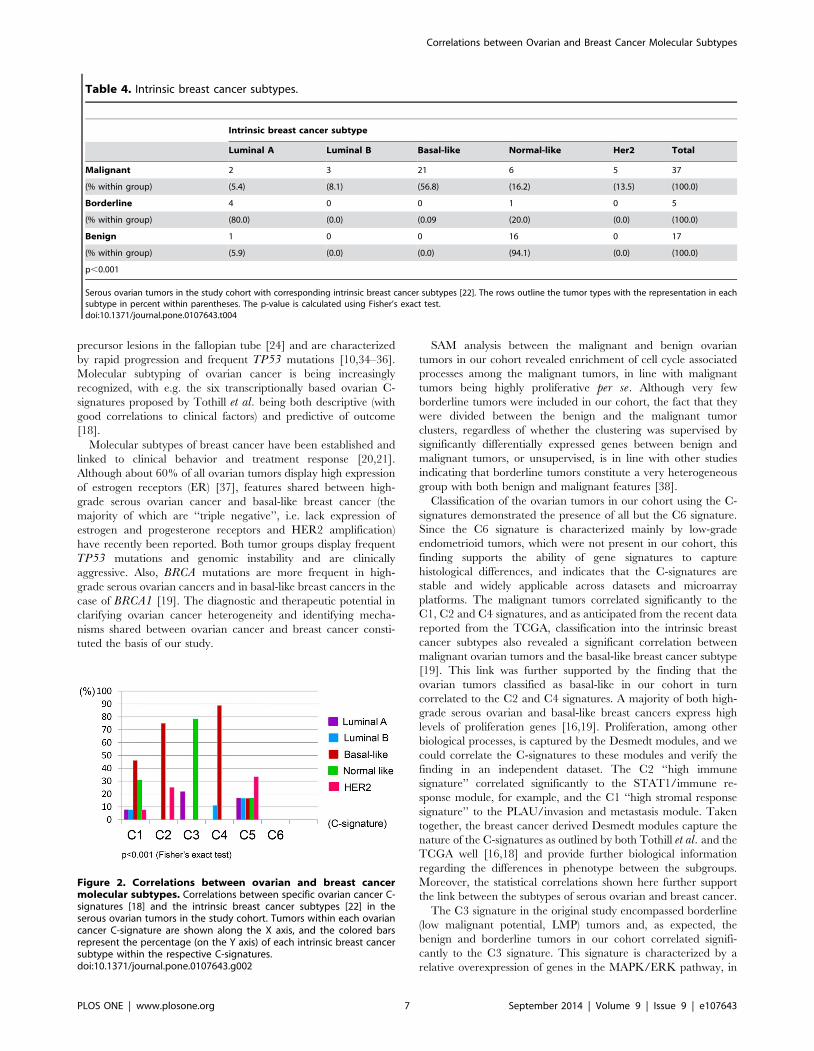
Table 4. Intrinsic breast cancer subtypes.
Intrinsic breast cancer subtype
Luminal A Luminal B Basal-like Normal-like Her2 Total
Malignant 2 3 21 6 5 37
(% within group) (5.4) (8.1) (56.8) (16.2) (13.5) (100.0)
Borderline 4 0 0 1 0 5
(% within group) (80.0) (0.0) (0.09 (20.0) (0.0) (100.0)
Benign 1 0 0 16 0 17
(% within group) (5.9) (0.0) (0.0) (94.1) (0.0) (100.0)
p,0.001
Serous ovarian tumors in the study cohort with corresponding intrinsic breast cancer subtypes [22]. The rows outline the tumor types with the representation in eachsubtype in percent within parentheses. The p-value is calculated using Fisher’s exact test.doi:10.1371/journal.pone.0107643.t004
Figure 2. Correlations between ovarian and breast cancermolecular subtypes. Correlations between specific ovarian cancer C-signatures [18] and the intrinsic breast cancer subtypes [22] in theserous ovarian tumors in the study cohort. Tumors within each ovariancancer C-signature are shown along the X axis, and the colored barsrepresent the percentage (on the Y axis) of each intrinsic breast cancersubtype within the respective C-signatures.doi:10.1371/journal.pone.0107643.g002
Correlations between Ovarian and Breast Cancer Molecular Subtypes
PLOS ONE | www.plosone.org 7 September 2014 | Volume 9 | Issue 9 | e107643
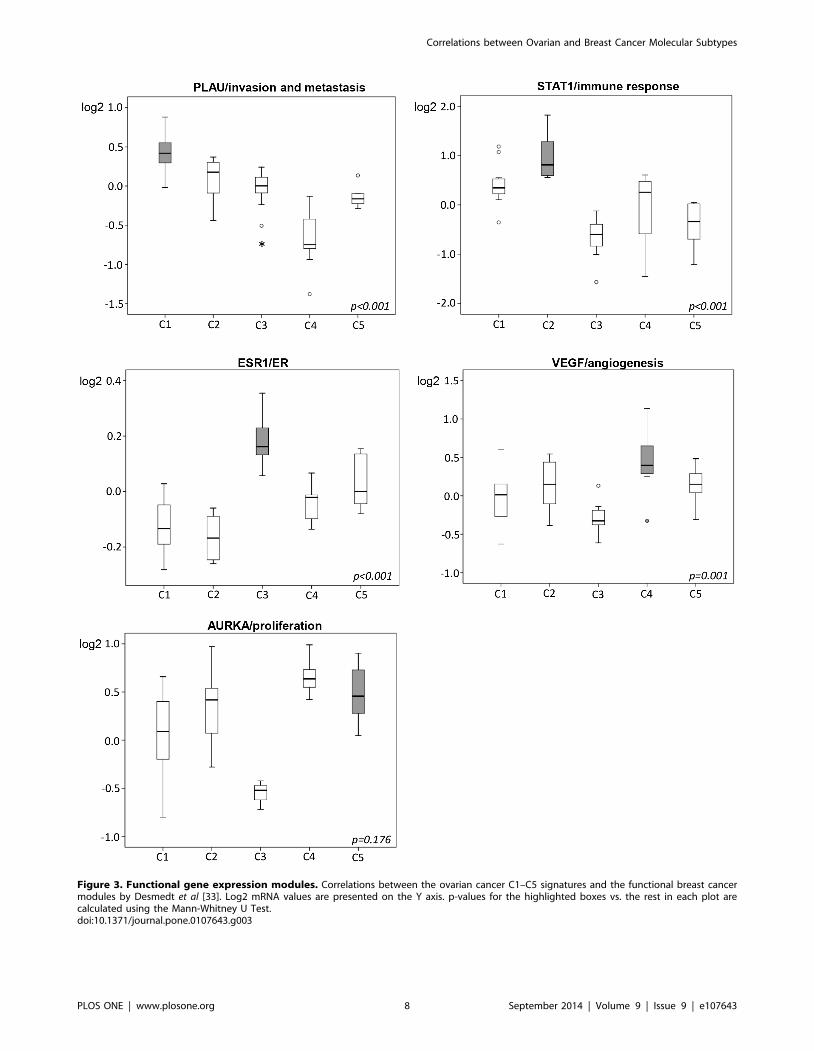
Figure 3. Functional gene expression modules. Correlations between the ovarian cancer C1–C5 signatures and the functional breast cancermodules by Desmedt et al [33]. Log2 mRNA values are presented on the Y axis. p-values for the highlighted boxes vs. the rest in each plot arecalculated using the Mann-Whitney U Test.doi:10.1371/journal.pone.0107643.g003
Correlations between Ovarian and Breast Cancer Molecular Subtypes
PLOS ONE | www.plosone.org 8 September 2014 | Volume 9 | Issue 9 | e107643
line with the fact that type 1 ovarian tumors often harbor
mutations in KRAS and BRAF. Four of five borderline tumors in
our cohort displayed KRAS or BRAF mutations, and the two
malignant tumors harboring mutations in KRAS in turn
correlated to the C3 and C4 ovarian signatures. Interestingly, a
significant correlation between the few borderline tumors and the
luminal A breast cancer subtype was found. Luminal breast
tumors frequently display mutations in the MAPK/ERK pathway,
thereby resembling the ovarian type 1 tumors (and the ovarian C3
signature). This is further supported by the independent finding of
a significant correlation between the ovarian C3 signature and the
ESR1/ER signaling breast cancer module by Desmedt et al. [33].
Hence, although the borderline tumors in our cohort were
interspersed between the malignant and benign neighbors in the
clustering analyses, upon comparison with the ovarian cancer C-
signatures and the intrinsic breast cancer subtypes, they showed
obvious similarities with benign and low-grade malignant tumors –
as anticipated based on the prototypic type 1 tumors they are
described as. Furthermore, the luminal A and B (estrogen receptor
positive) breast cancer subtypes differ in transcriptional profiles,
mutation spectra and overall survival [19]; this is in line with the
clinical spectrum observed in low-grade serous ovarian cancer,
with low-grade, early-stage tumors showing a favorable prognosis,
while low-grade, advanced stage tumors tend to respond poorly to
chemotherapy. Despite the generally high expression of ER in
ovarian cancer, the response to both tamoxifen and letrozole has
been limited [39,40]. The different isoforms of ER seem to vary
with the malignant potential, with the beta isoform (ERb) reported
to be less expressed in malignant ovarian tumors compared to
borderline tumors and benign ovaries, but whether ERb or ERainfluence outcome is not clear [41,42]. In contrast, ERa is a
favorable prognostic factor in breast cancer [43]. A recent study by
the Ovarian Tumor Tissue Analysis consortium (OTTA) focused
on expression of ERa and the progesterone receptor (PR), and in a
large series only strong expression of PR, but not ERa, was
correlated to increased survival in high-grade serous ovarian
cancer. No significant correlations between ERa or PR expression
and survival were found in multivariate analyses of low-grade
serous tumors [44]. The vast majority of the low-grade tumors
were however ER and/or PR positive, but the few that were
negative did not have a significantly different outcome despite the
fact that the majority of the low-grade tumors were stage III–IV.
Likewise, ERa is reported to be overexpressed in serous borderline
tumors [41]. Taking these results into consideration in light of our
findings of a correlation between the ovarian C3 signature and the
luminal A breast cancer subtype, it would be interesting to study
the response to and the potential effect of endocrine treatment
specifically in advanced type I ovarian tumors.
Conclusions
The findings in this study support that transcriptional signatures
indeed capture the biology of transforming events and oncogenic
mutations and also support similarities between molecular
subtypes of ovarian and breast cancer beyond high-grade serous
ovarian cancer and basal-like breast cancer. Though limited series
are sensitive to overfitting, importantly, our findings were stable
and reproducible in a large independent cohort. The similarities
between molecular subtypes of ovarian and breast cancer may be
of potential interest for further studies regarding targeted therapies
and the use of chemotherapeutic agents in ovarian cancer, as well
as biomarker studies. While the proposed similarities between low-
grade serous and borderline ovarian (type 1) tumors and luminal
breast cancers may in part be attributable to similarities in
proliferation rates compared to high-grade ovarian (type 2) and
basal-like breast cancers, other biological similarities, such as
potential endocrine responsiveness, are thought-provoking and
merit further investigation.
Supporting Information
Figure S1 Hierarchical clustering. Unsupervised clustering
of malignant and benign ovarian tumors using the 20% most
varying probes and including biological replicates. n = 66 tumors.
(TIF)
Figure S2 Hierarchical clustering. Unsupervised clustering
of malignant and benign ovarian tumors using the 20% most
varying probes. Clustering performed without biological replicates.
n = 54 tumors.
(TIF)
Figure S3 Hierarchial clustering. Supervised clustering of
malignant, borderline and benign tumors based on significant
probes from supervised analysis of malignant and benign tumors.
Clustering performed without biological replicates. n = 59 tumors.
(TIF)
Figure S4 Hierarchical clustering. The serous ovarian
tumors in the study cohort with corresponding tumor features
and assigned ovarian cancer C-signatures and intrinsic breast
cancer subtypes.
(TIF)
Figure S5 Functional gene expression modules. Boxplots
representing the correlations between serous ovarian malignant,
Table 5. KRAS and BRAF mutations.
Id Feature C-signature BC subtype Mutation
420 M C4 Luminal B KRAS
232 M C3 Normal KRAS
86 Bo C3 Luminal A KRAS
385 Bo C3 Luminal A KRAS
16 Bo C3 Luminal A BRAF
48 Bo C3 Luminal A BRAF
Distribution of KRAS and BRAF mutations and their correlations to ovarian cancer C-signatures and intrinsic breast cancer subtypes.Feature: M = Malignant, Bo = Borderline; C-signature: corresponding molecular ovarian cancer subtype [18]; BC-subtype: corresponding intrinsic breast cancer subtype[22].doi:10.1371/journal.pone.0107643.t005
Correlations between Ovarian and Breast Cancer Molecular Subtypes
PLOS ONE | www.plosone.org 9 September 2014 | Volume 9 | Issue 9 | e107643
borderline and benign tumors in the study cohort and the
respective gene expression modules by Desmedt et al. (Desmedt etal., Clin Cancer Res 2008). Log2 mRNA values are presented on
the Y axes. p-values are calculated using the Kruskal-Wallis test.
(TIF)
Figure S6 Functional gene expression modules. Boxplots
representing the correlations between the C1-C6 ovarian cancer
signatures in an independent, publicly available dataset and the
respective breast cancer gene expression modules by Desmedt etal. (Desmedt et al., Clin Cancer Res 2008). Log2 mRNA values
are presented on the Y axes. p-values for the highlighted boxes vs.
the rest in each plot are calculated using the Mann-Whitney U
Test.
(TIF)
Table S1 Deregulated genes. All significantly deregulated
genes (n = 5,944) between malignant and benign ovarian tumors in
the study cohort.
(XLSX)
Table S2 Molecular subtypes. Significant correlations be-
tween malignant, borderline and benign ovarian tumors in the
study cohort (n = 59) and the ovarian cancer C-signatures. p-values
for each part of the table (separated with double lines) are
calculated using Fisher’s exact test.
(XLSX)
Table S3 Molecular subtypes. Significant correlations be-
tween malignant, borderline and benign ovarian tumors in the
study cohort (n = 59) and the basal-like and normal-like breast
cancer subtypes. p-values for each part of the table (separated with
double lines) are calculated using Fisher’s exact test.
(XLSX)
Table S4 Molecular subtypes. Significant correlations be-
tween malignant, borderline and benign ovarian tumors in the
study cohort (n = 59) and the luminal A breast cancer subtype. The
p-value is calculated using Fisher’s exact test.
(XLSX)
Table S5 Correlations between molecular subtypes.Significant correlations between and between assigned C-signa-
tures and the basal-like breast cancer subtype. p-values for each
part of the table (separated with double lines) are calculated using
Fisher’s exact test.
(XLSX)
Table S6 Correlations between molecular subtypes.Significant correlations between and between assigned C-signa-
tures and the normal-like breast cancer subtype. The p-value is
calculated using Fisher’s exact test.
(XLSX)
Table S7 Validation of the centroid classifier. Cross table
comparing the original k.means groups (rows) for the tumors in an
independent, publicly available dataset, consisting of malignant
and borderline tumors, with the centroid classification for the same
tumors (columns). The numbers represent number of tumors.
Correlations between the C-signature classifications are highlight-
ed in bold (diagonal). 251 tumors had an assigned k.means group.
239 of these (95.2%) were correctly re-assigned using nearest
centroid classification.
(XLSX)
Table S8 Correlations between molecular subtypes.Correlations between ovarian cancer C-signatures and intrinsic
breast cancer subtypes in an independent, publicly available
dataset consisting of malignant and borderline ovarian tumors
(n = 285). The C2 signature correlated significantly to the basal-
like breast cancer subtype and the C3 signature to the normal-like
breast cancer subtype. p-values (*) are calculated using Fisher’s
exact test.
(XLSX)
Acknowledgments
We would like to acknowledge the patients who have generously
contributed to the Skane University Hospital ovarian tumor biobank.
Author Contributions
Conceived and designed the experiments: JMJ SM MN IH MJ IJ MDV.
Performed the experiments: JMJ IJ MDV SK MJ AM JHB. Analyzed the
data: JMJ IJ MDV SK AM SM MJ MN IH JHB PK. Contributed
reagents/materials/analysis tools: JMJ SM PK AM MN. Contributed to
the writing of the manuscript: JMJ IJ MDV SK MJ JHB PK AM SM MN
IH.
References
1. Kurman RJ, le Shih M (2010) The origin and pathogenesis of epithelial ovarian
cancer: a proposed unifying theory. Am J Surg Pathol 34: 433–443.
2. Piek JM, van Diest PJ, Zweemer RP, Jansen JW, Poort-Keesom RJ, et al. (2001)
Dysplastic changes in prophylactically removed Fallopian tubes of women
predisposed to developing ovarian cancer. J Pathol 195: 451–456.
3. Kindelberger DW, Lee Y, Miron A, Hirsch MS, Feltmate C, et al. (2007)
Intraepithelial carcinoma of the fimbria and pelvic serous carcinoma: Evidence
for a causal relationship. Am J Surg Pathol 31: 161–169.
4. Heintz AP, Odicino F, Maisonneuve P, Quinn MA, Benedet JL, et al. (2006)
Carcinoma of the ovary. FIGO 26th Annual Report on the Results of Treatment
in Gynecological Cancer. Int J Gynaecol Obstet 95 Suppl 1: S161–192.
5. Bookman MA, Brady MF, McGuire WP, Harper PG, Alberts DS, et al. (2009)
Evaluation of new platinum-based treatment regimens in advanced-stage
ovarian cancer: a Phase III Trial of the Gynecologic Cancer Intergroup. J Clin
Oncol 27: 1419–1425.
6. Winter-Roach BA, Kitchener HC, Dickinson HO (2009) Adjuvant (post-surgery)
chemotherapy for early stage epithelial ovarian cancer. Cochrane Database Syst
Rev: CD004706.
7. Perren TJ, Swart AM, Pfisterer J, Ledermann JA, Pujade-Lauraine E, et al.
(2011) A phase 3 trial of bevacizumab in ovarian cancer. N Engl J Med 365:
2484–2496.
8. McCluggage WG (2011) Morphological subtypes of ovarian carcinoma: a review
with emphasis on new developments and pathogenesis. Pathology 43: 420–432.
9. Saad AF, Hu W, Sood AK (2010) Microenvironment and pathogenesis of
epithelial ovarian cancer. Horm Cancer 1: 277–290.
10. Prat J (2012) Ovarian carcinomas: five distinct diseases with different origins,
genetic alterations, and clinicopathological features. Virchows Arch 460: 237–
249.
11. Kobel M, Kalloger SE, Boyd N, McKinney S, Mehl E, et al. (2008) Ovarian
carcinoma subtypes are different diseases: implications for biomarker studies.
PLoS Med 5: e232.
12. Bonome T, Lee JY, Park DC, Radonovich M, Pise-Masison C, et al. (2005)
Expression profiling of serous low malignant potential, low-grade, and high-
grade tumors of the ovary. Cancer Res 65: 10602–10612.
13. Meinhold-Heerlein I, Bauerschlag D, Hilpert F, Dimitrov P, Sapinoso LM, et al.
(2005) Molecular and prognostic distinction between serous ovarian carcinomas
of varying grade and malignant potential. Oncogene 24: 1053–1065.
14. Marquez RT, Baggerly KA, Patterson AP, Liu J, Broaddus R, et al. (2005)
Patterns of gene expression in different histotypes of epithelial ovarian cancer
correlate with those in normal fallopian tube, endometrium, and colon. Clin
Cancer Res 11: 6116–6126.
15. Marchini S, Mariani P, Chiorino G, Marrazzo E, Bonomi R, et al. (2008)
Analysis of gene expression in early-stage ovarian cancer. Clin Cancer Res 14:
7850–7860.
16. The Cancer Genome Atlas Network (2011) Integrated genomic analyses of
ovarian carcinoma. Nature 474: 609–615.
17. Yoshihara K, Tsunoda T, Shigemizu D, Fujiwara H, Hatae M, et al. (2012)
High-risk ovarian cancer based on 126-gene expression signature is uniquely
characterized by downregulation of antigen presentation pathway. Clin Cancer
Res 18: 1374–1385.
Correlations between Ovarian and Breast Cancer Molecular Subtypes
PLOS ONE | www.plosone.org 10 September 2014 | Volume 9 | Issue 9 | e107643
18. Tothill RW, Tinker AV, George J, Brown R, Fox SB, et al. (2008) Novel
molecular subtypes of serous and endometrioid ovarian cancer linked to clinicaloutcome. Clin Cancer Res 14: 5198–5208.
19. The Cancer Genome Atlas Network (2012) Comprehensive molecular portraits
of human breast tumours. Nature 490: 61–70.20. Perou CM, Sorlie T, Eisen MB, van de Rijn M, Jeffrey SS, et al. (2000)
Molecular portraits of human breast tumours. Nature 406: 747–752.21. Sorlie T, Perou CM, Tibshirani R, Aas T, Geisler S, et al. (2001) Gene
expression patterns of breast carcinomas distinguish tumor subclasses with
clinical implications. Proc Natl Acad Sci U S A 98: 10869–10874.22. Hu Z, Fan C, Oh DS, Marron JS, He X, et al. (2006) The molecular portraits of
breast tumors are conserved across microarray platforms. BMC Genomics 7: 96.23. Anglesio MS, Arnold JM, George J, Tinker AV, Tothill R, et al. (2008) Mutation
of ERBB2 provides a novel alternative mechanism for the ubiquitous activationof RAS-MAPK in ovarian serous low malignant potential tumors. Mol Cancer
Res 6: 1678–1690.
24. Shih Ie M, Kurman RJ (2004) Ovarian tumorigenesis: a proposed model basedon morphological and molecular genetic analysis. Am J Pathol 164: 1511–1518.
25. Silverberg SG (2000) Histopathologic grading of ovarian carcinoma: a reviewand proposal. Int J Gynecol Pathol 19: 7–15.
26. Tavassoli FA, Devilee P (2003) Pathology and Genetics of Tumours of the Breast
and Female Genital Organs; Tavassoli Fattaneh A DP, editor. Lyon: IARCPress.
27. Edgar R, Domrachev M, Lash AE (2002) Gene Expression Omnibus: NCBIgene expression and hybridization array data repository. Nucleic Acids Res 30:
207–210.28. Saeed AI, Sharov V, White J, Li J, Liang W, et al. (2003) TM4: a free, open-
source system for microarray data management and analysis. Biotechniques 34:
374–378.29. Tusher VG, Tibshirani R, Chu G (2001) Significance analysis of microarrays
applied to the ionizing radiation response. Proc Natl Acad Sci U S A 98: 5116–5121.
30. Eden E, Navon R, Steinfeld I, Lipson D, Yakhini Z (2009) GOrilla: a tool for
discovery and visualization of enriched GO terms in ranked gene lists. BMCBioinformatics 10: 48.
31. Chen J, Aronow BJ, Jegga AG (2009) Disease candidate gene identification andprioritization using protein interaction networks. BMC Bioinformatics 10: 73.
32. Johansson I, Nilsson C, Berglund P, Lauss M, Ringner M, et al. (2012) Geneexpression profiling of primary male breast cancers reveals two unique
subgroups and identifies N-acetyltransferase-1 (NAT1) as a novel prognostic
biomarker. Breast Cancer Res 14: R31.
33. Desmedt C, Haibe-Kains B, Wirapati P, Buyse M, Larsimont D, et al. (2008)
Biological processes associated with breast cancer clinical outcome depend on
the molecular subtypes. Clin Cancer Res 14: 5158–5165.
34. Hauptmann S, Dietel M (2001) Serous tumors of low malignant potential of the
ovary-molecular pathology: part 2. Virchows Arch 438: 539–551.
35. Li J, Fadare O, Xiang L, Kong B, Zheng W (2012) Ovarian serous carcinoma:
recent concepts on its origin and carcinogenesis. J Hematol Oncol 5: 8.
36. Berns EM, Bowtell DD (2012) The changing view of high-grade serous ovarian
cancer. Cancer Res 72: 2701–2704.
37. Perez-Gracia JL, Carrasco EM (2002) Tamoxifen therapy for ovarian cancer in
the adjuvant and advanced settings: systematic review of the literature and
implications for future research. Gynecol Oncol 84: 201–209.
38. Curry EW, Stronach EA, Rama NR, Wang YY, Gabra H, et al. (2013)
Molecular subtypes of serous borderline ovarian tumor show distinct expression
patterns of benign tumor and malignant tumor-associated signatures. Mod
Pathol.
39. Smyth JF, Gourley C, Walker G, MacKean MJ, Stevenson A, et al. (2007)
Antiestrogen therapy is active in selected ovarian cancer cases: the use of
letrozole in estrogen receptor-positive patients. Clin Cancer Res 13: 3617–3622.
40. Hatch KD, Beecham JB, Blessing JA, Creasman WT (1991) Responsiveness of
patients with advanced ovarian carcinoma to tamoxifen. A Gynecologic
Oncology Group study of second-line therapy in 105 patients. Cancer 68:
269–271.
41. Chan KK, Wei N, Liu SS, Xiao-Yun L, Cheung AN, et al. (2008) Estrogen
receptor subtypes in ovarian cancer: a clinical correlation. Obstet Gynecol 111:
144–151.
42. Burges A, Bruning A, Dannenmann C, Blankenstein T, Jeschke U, et al. (2010)
Prognostic significance of estrogen receptor alpha and beta expression in human
serous carcinomas of the ovary. Arch Gynecol Obstet 281: 511–517.
43. Early Breast Cancer Trialists’ Collaborative Group (2005) Effects of chemo-
therapy and hormonal therapy for early breast cancer on recurrence and 15-year
survival: an overview of the randomised trials. Lancet 365: 1687–1717.
44. Sieh W, Kobel M, Longacre TA, Bowtell DD, deFazio A, et al. (2013)
Hormone-receptor expression and ovarian cancer survival: an Ovarian Tumor
Tissue Analysis consortium study. Lancet Oncol 14: 853–862.
Correlations between Ovarian and Breast Cancer Molecular Subtypes
PLOS ONE | www.plosone.org 11 September 2014 | Volume 9 | Issue 9 | e107643