Embed Size (px)
Citation preview

A U G U S T 2 , 2 0 1 7
M O L S O N C O O R S B R E W I N G C O M PA N Y
2 n d Q U A R T E R 2 0 1 7 E A R N I N G S R E S U LT S
2
F O RWA R D L O O K I N G S TAT E M E N T
Forward Looking Statements
This presentation includes estimates or projections that constitute “forward-looking statements” within the meaning of the U.S. federal securities laws. Generally, the words “believe,” “expect,” “intend,” “anticipate,” “project,” “will,” and similar expressions identify forward-looking statements, which generally are not historic in nature. Although the Company believes that the assumptions upon which its forward-looking statements are based are reasonable, it can give no assurance that these assumptions will prove to be correct. Important factors that could cause actual results to differ materially from the Company’s historical experience, and present projections and expectations are disclosed in the Company’s filings with the Securities and Exchange Commission (“SEC”). These factors include, among others, our ability to successfully integrate the acquisition of MillerCoors; our ability to achieve expected tax benefits, accretion and cost savings and synergies; impact ofincreased competition resulting from further consolidation of brewers, competitive pricing and product pressures; health of the beer industry and our brands in our markets; economic conditions in our markets; additional impairment charges; our ability to maintain manufacturer/distribution agreements; changes in our supply chain system; availability or increase in thecost of packaging materials; success of our joint ventures; risks relating to operations in developing and emerging markets; changes in legal and regulatory requirements, including the regulation of distribution systems; fluctuations in foreign currencyexchange rates; increase in the cost of commodities used in the business; the impact of climate change and the availability and quality of water; loss or closure of a major brewery or other key facility; our ability to implement our strategic initiatives, including executing and realizing cost savings; our ability to successfully integrate newly acquired businesses; pension planand other post retirement benefit costs; failure to comply with debt covenants or deterioration in our credit rating; our ability to maintain good labor relations; our ability to maintain brand image, reputation and product quality; and other risks discussed inour filings with the SEC, including our most recent Annual Report on Form 10-K and our Quarterly Reports on Form 10-Q. All forward-looking statements in this presentation are expressly qualified by such cautionary statements and by reference to the underlying assumptions. You should not place undue reliance on forward looking statements, which speak only as of the date they are made. We do not undertake to update forward-looking statements, whether as a result of new information, future events or otherwise.
Non-GAAP Information
Please see our most recent earnings release or visit the investor relations page of our website – www.molsoncoors.com – to find disclosure and applicable reconciliations of non-GAAP financial measures discussed in this presentation.
3
M O L S O N C O O R S O V E RV I E W
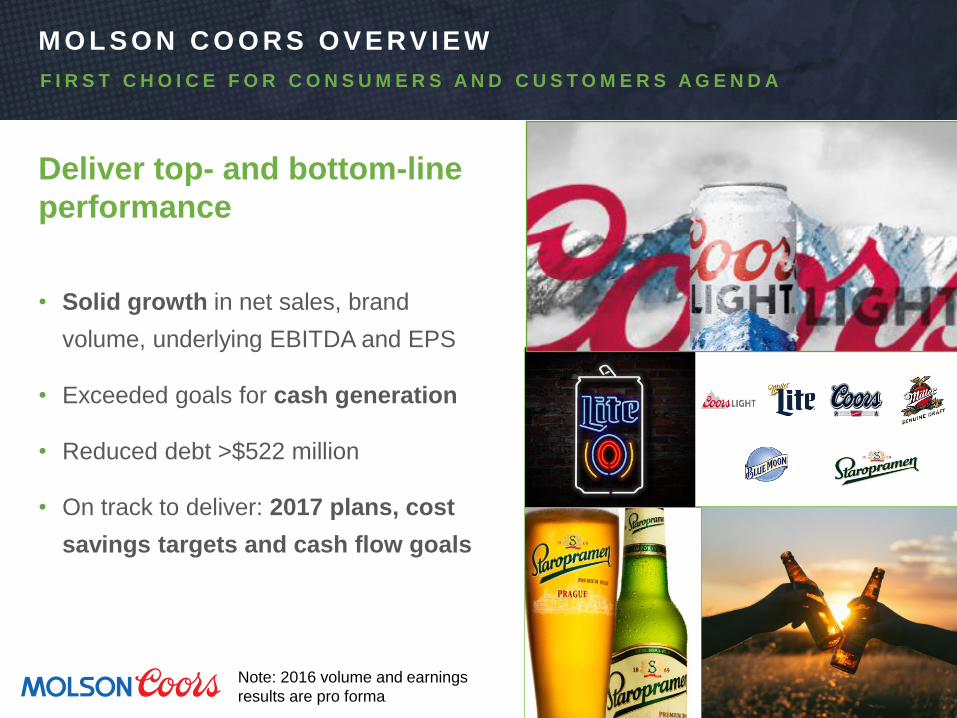
Deliver top- and bottom-line
performance
• Solid growth in net sales, brand
volume, underlying EBITDA and EPS
• Exceeded goals for cash generation
• Reduced debt >$522 million
• On track to deliver: 2017 plans, cost
savings targets and cash flow goals
F I R S T C H O I C E F O R C O N S U M E R S A N D C U S T O M E R S A G E N D A
Note: 2016 volume and earnings
results are pro forma
4
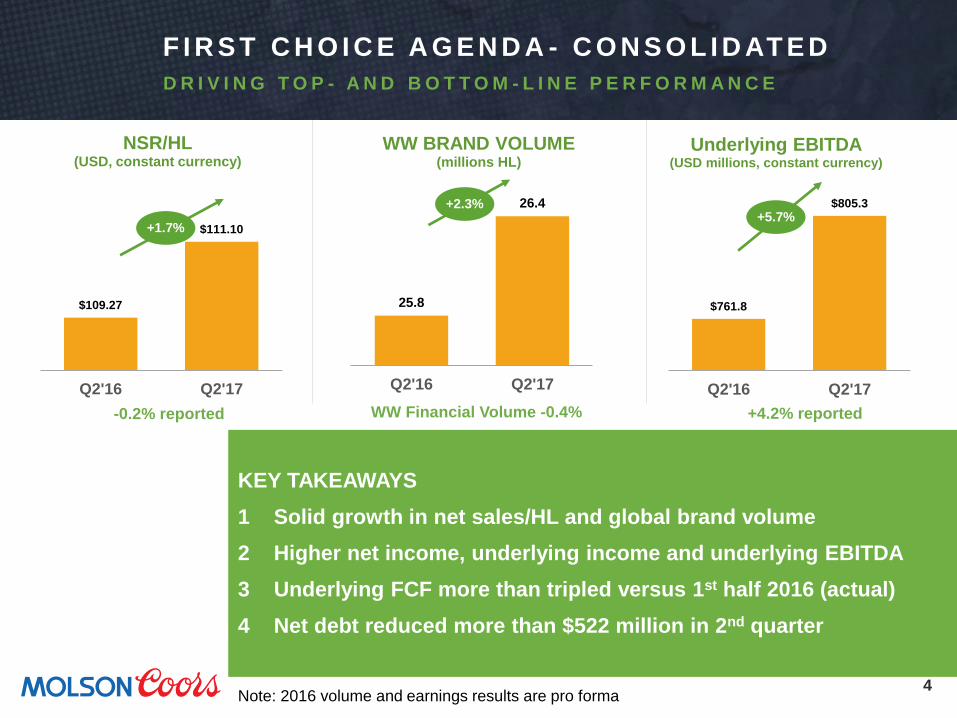
KEY TAKEAWAYS
1 Solid growth in net sales/HL and global brand volume
2 Higher net income, underlying income and underlying EBITDA
3 Underlying FCF more than tripled versus 1st half 2016 (actual)
4 Net debt reduced more than $522 million in 2nd quarter
$109.27
$111.10
Q2'16 Q2'17
NSR/HL(USD, constant currency)
+1.7%
25.8
26.4
Q2'16 Q2'17
WW BRAND VOLUME (millions HL)
+2.3%
$761.8
$805.3
Q2'16 Q2'17
Underlying EBITDA(USD millions, constant currency)
+5.7%
-0.2% reported +4.2% reportedWW Financial Volume -0.4%
F I R S T C H O I C E A G E N D A - C O N S O L I D AT E D
D R I V I N G T O P - A N D B O T T O M - L I N E P E R F O R M A N C E
Note: 2016 volume and earnings results are pro forma
5
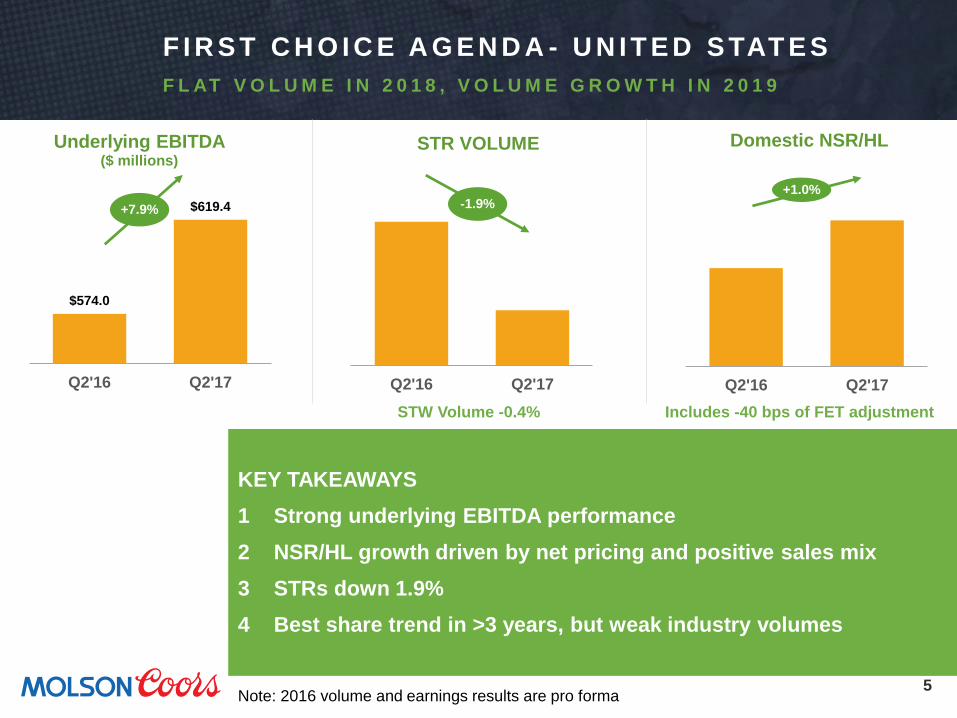
KEY TAKEAWAYS
1 Strong underlying EBITDA performance
2 NSR/HL growth driven by net pricing and positive sales mix
3 STRs down 1.9%
4 Best share trend in >3 years, but weak industry volumes
Q2'16 Q2'17
Domestic NSR/HL
+1.0%
Q2'16 Q2'17
STR VOLUME
-1.9%
$574.0
$619.4
Q2'16 Q2'17
Underlying EBITDA($ millions)
+7.9%
STW Volume -0.4%
F I R S T C H O I C E A G E N D A - U N I T E D S TAT E S
F L AT V O L U M E I N 2 0 1 8 , V O L U M E G R O W T H I N 2 0 1 9
Includes -40 bps of FET adjustment
Note: 2016 volume and earnings results are pro forma
6
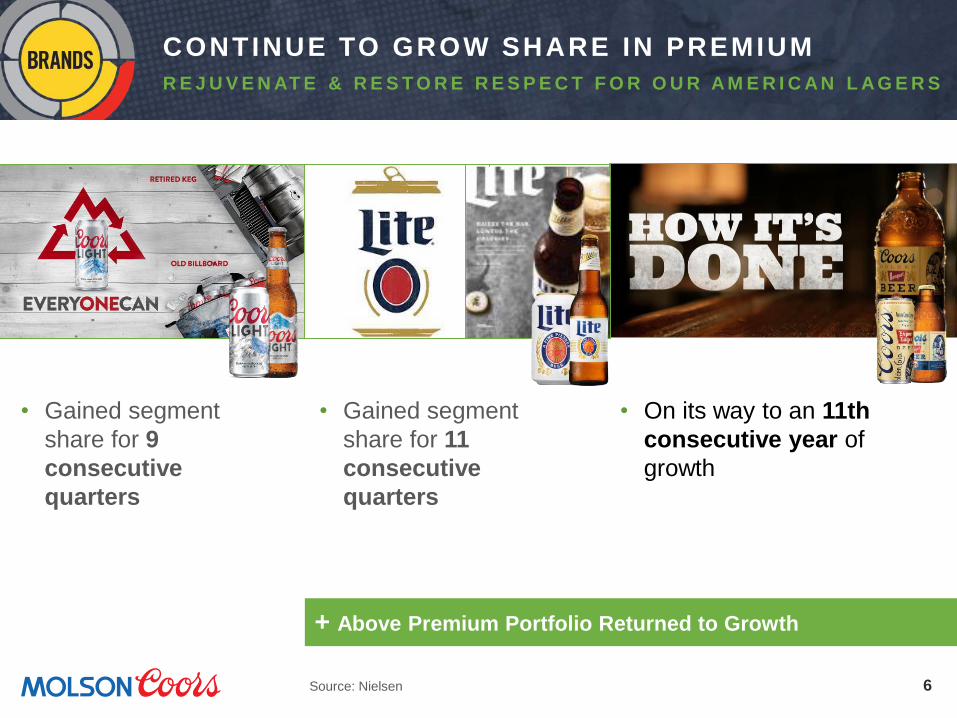
CONTINUE TO GROW SHARE IN PREMIUM
R E J U V E N AT E & R E S T O R E R E S P E C T F O R O U R A M E R I C A N L A G E R S
Source: Nielsen
+ Above Premium Portfolio Returned to Growth
• Gained segment
share for 9
consecutive
quarters
• Gained segment
share for 11
consecutive
quarters
• On its way to an 11th
consecutive year of
growth
7
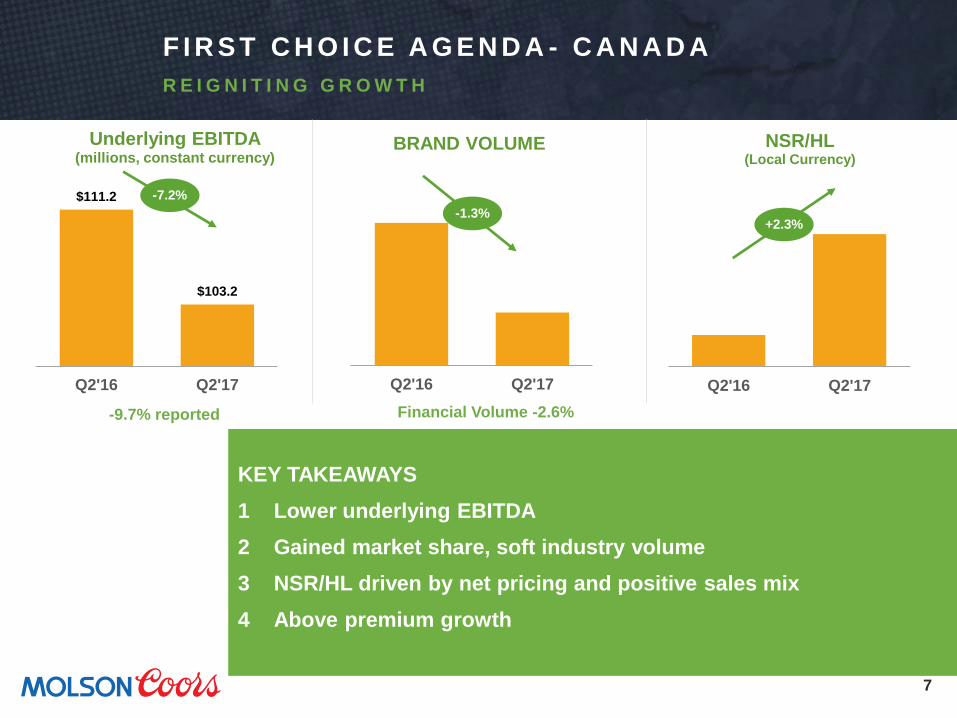
KEY TAKEAWAYS
1 Lower underlying EBITDA
2 Gained market share, soft industry volume
3 NSR/HL driven by net pricing and positive sales mix
4 Above premium growth
Q2'16 Q2'17
NSR/HL(Local Currency)
+2.3%
Q2'16 Q2'17
BRAND VOLUME
-1.3%
$111.2
$103.2
Q2'16 Q2'17
Underlying EBITDA(millions, constant currency)
-7.2%
-9.7% reported Financial Volume -2.6%
F I R S T C H O I C E A G E N D A - C A N A D A
R E I G N I T I N G G R O W T H
8
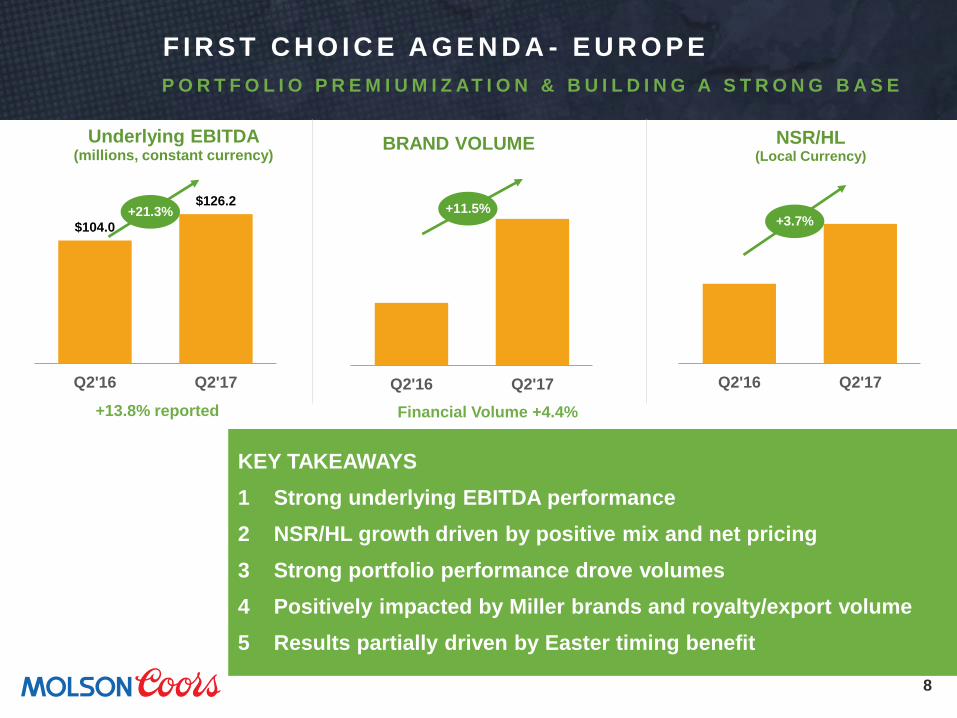
KEY TAKEAWAYS
1 Strong underlying EBITDA performance
2 NSR/HL growth driven by positive mix and net pricing
3 Strong portfolio performance drove volumes
4 Positively impacted by Miller brands and royalty/export volume
5 Results partially driven by Easter timing benefit
Q2'16 Q2'17
NSR/HL(Local Currency)
+3.7%
Q2'16 Q2'17
BRAND VOLUME
+11.5%
$104.0
$126.2
Q2'16 Q2'17
Underlying EBITDA(millions, constant currency)
+21.3%
+13.8% reported Financial Volume +4.4%
F I R S T C H O I C E A G E N D A - E U R O P E
P O R T F O L I O P R E M I U M I Z AT I O N & B U I L D I N G A S T R O N G B A S E
9
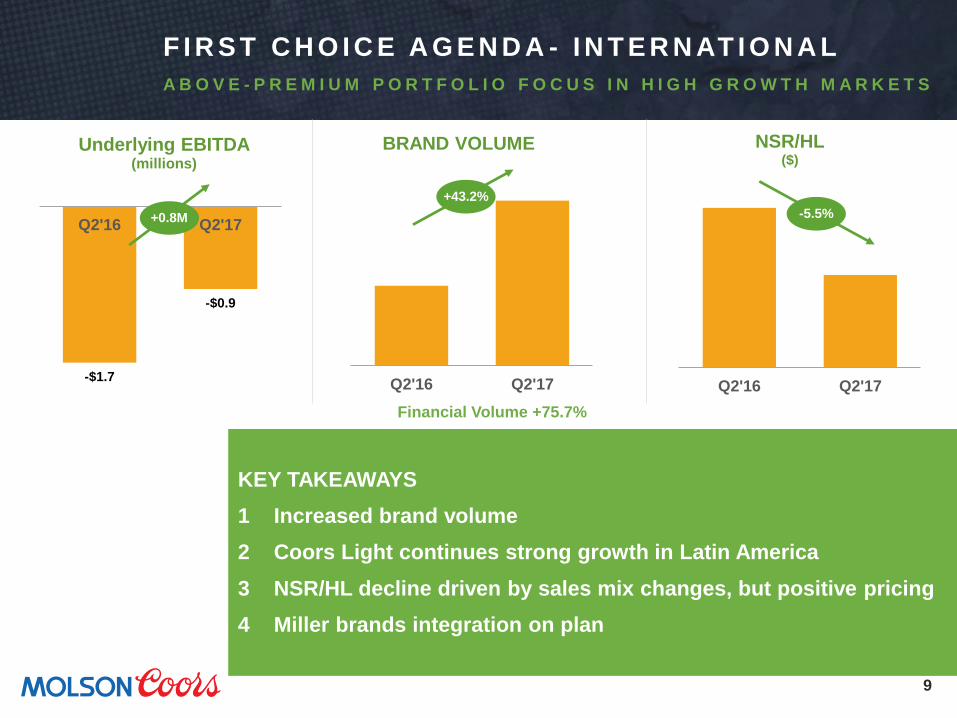
KEY TAKEAWAYS
1 Increased brand volume
2 Coors Light continues strong growth in Latin America
3 NSR/HL decline driven by sales mix changes, but positive pricing
4 Miller brands integration on plan
Q2'16 Q2'17
NSR/HL($)
-5.5%
Q2'16 Q2'17
BRAND VOLUME
+43.2%
-$1.7
-$0.9
Q2'16 Q2'17
Underlying EBITDA(millions)
+0.8M
Financial Volume +75.7%
F I R S T C H O I C E A G E N D A - I N T E R N AT I O N A L
A B O V E - P R E M I U M P O R T F O L I O F O C U S I N H I G H G R O W T H M A R K E T S
10
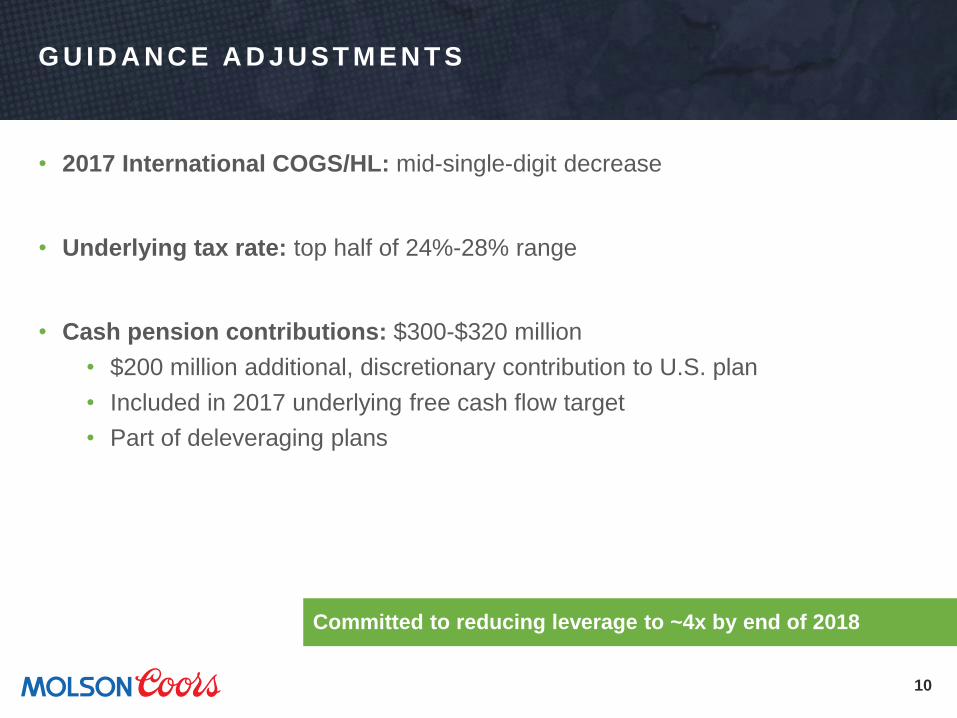
Committed to reducing leverage to ~4x by end of 2018
G U I D A N C E A D J U S T M E N T S
• 2017 International COGS/HL: mid-single-digit decrease
• Underlying tax rate: top half of 24%-28% range
• Cash pension contributions: $300-$320 million
• $200 million additional, discretionary contribution to U.S. plan
• Included in 2017 underlying free cash flow target
• Part of deleveraging plans
11
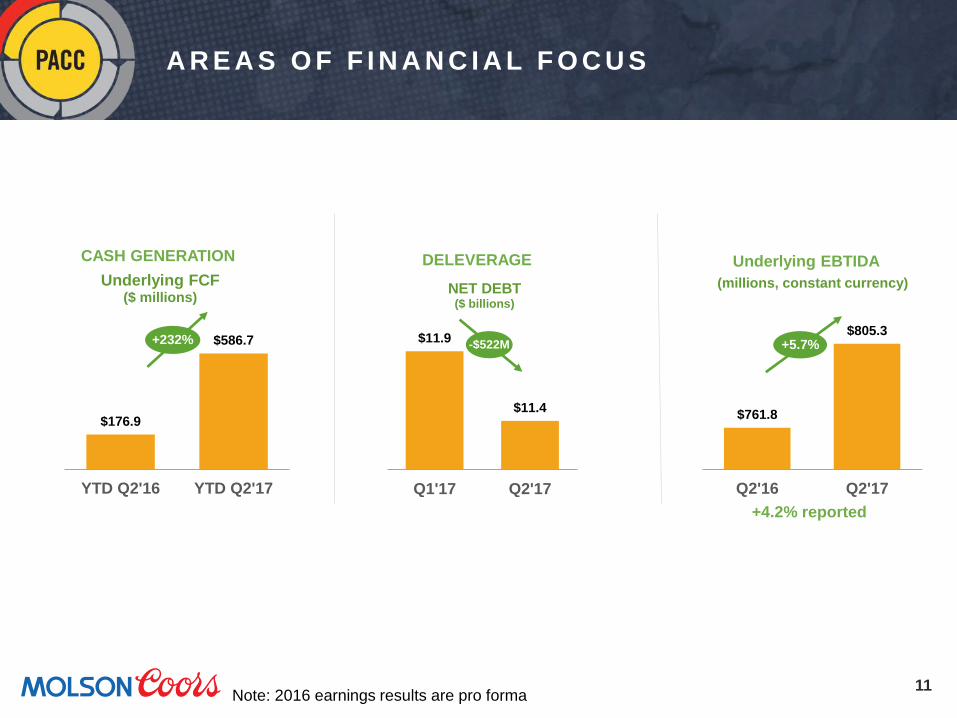
A R E A S O F F I N A N C I A L F O C U S
Underlying EBTIDA
+4.2% reported
Note: 2016 earnings results are pro forma
DELEVERAGE
$11.9
$11.4
Q1'17 Q2'17
NET DEBT($ billions)
-$522M
CASH GENERATION
$176.9
$586.7
YTD Q2'16 YTD Q2'17
Underlying FCF($ millions)
+232%
$761.8
$805.3
Q2'16 Q2'17
(millions, constant currency)
+5.7%
12
2 0 1 7 G L O B A L S T R AT E G I C P R I O R I T I E S
• First Choice Culture - Embed Our Brew & Our
Brewhouse
• Execute Integration & Cost Savings Plan
• Drive Global Commercial Excellence Capability– Top
Line Growth
• Accelerate International Performance
• Productivity Improvements via WCSC 2.0, North
American Supply Chain and Global Scale Procurement
• Enabled via Global Shared Services
DRIVE TOTAL SHAREHOLDER RETURNS
13
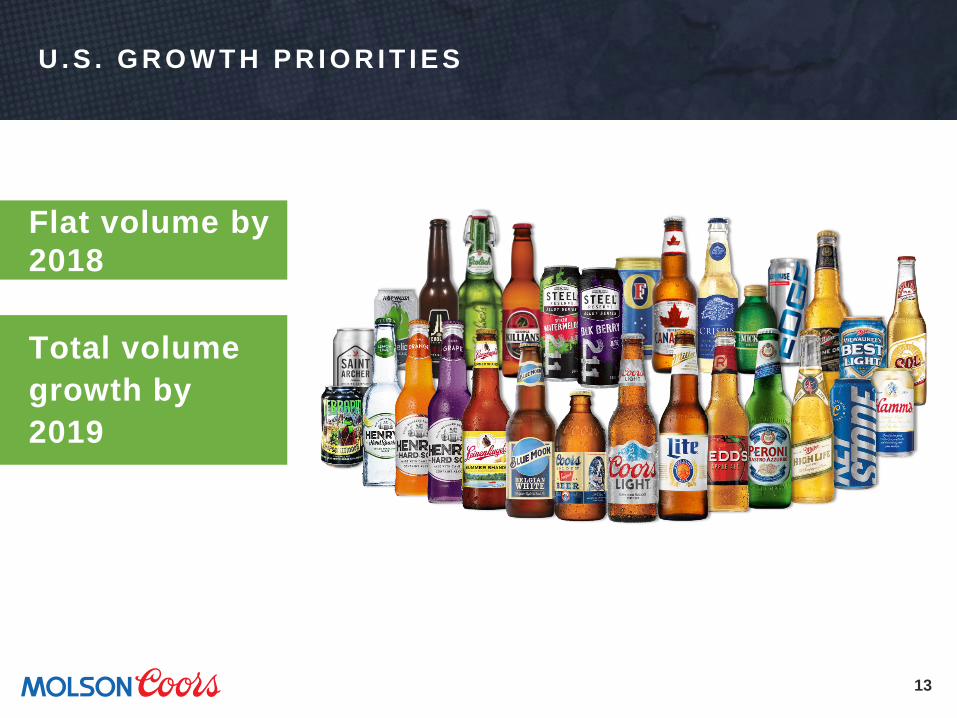
U . S . G R O W T H P R I O R I T I E S
Flat volume by
2018
Total volume
growth by
2019
14
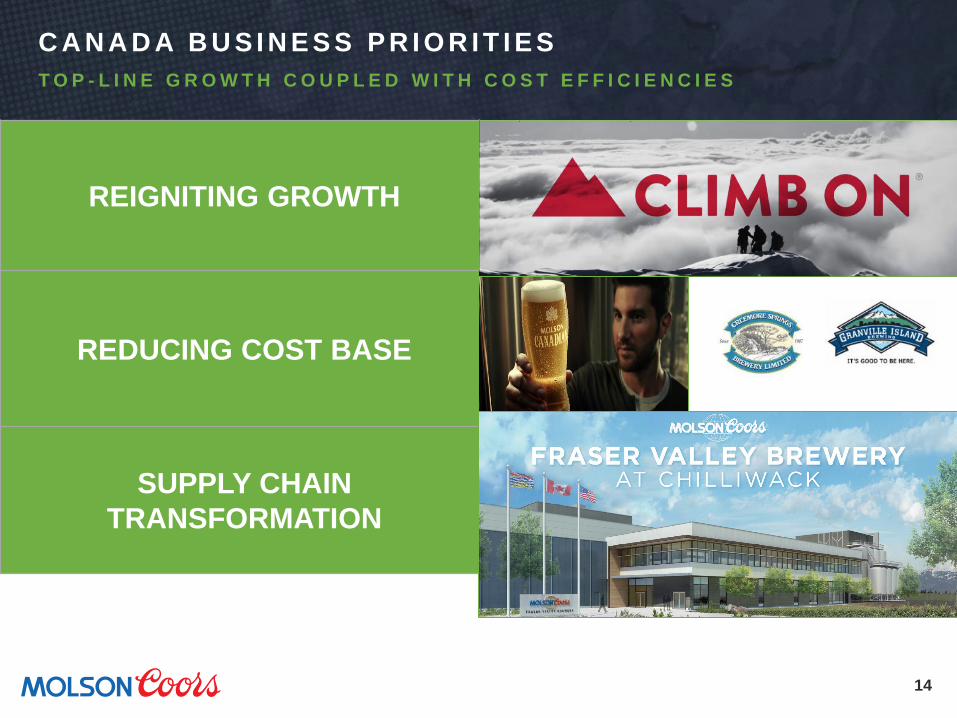
REIGNITING GROWTH
REDUCING COST BASE
SUPPLY CHAIN
TRANSFORMATION
C A N A D A B U S I N E S S P R I O R I T I E S
T O P - L I N E G R O W T H C O U P L E D W I T H C O S T E F F I C I E N C I E S
15
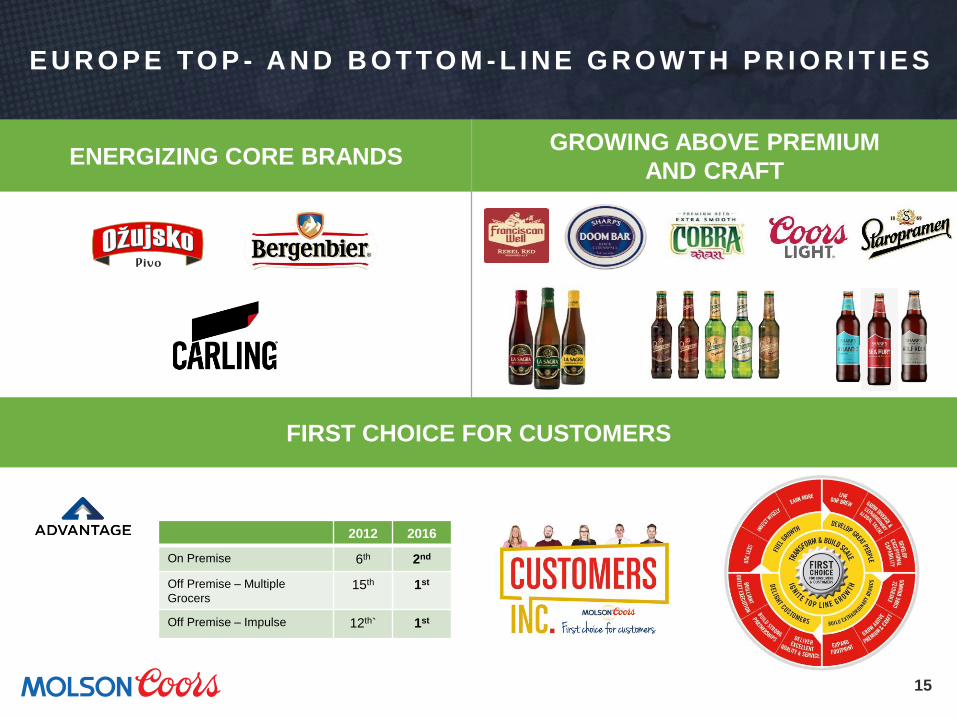
E U R O P E TO P - A N D B O T TO M - L I N E G R O W T H P R I O R I T I E S
GROWING ABOVE PREMIUM
AND CRAFT
FIRST CHOICE FOR CUSTOMERS
ENERGIZING CORE BRANDS
2012 2016
On Premise 6th 2nd
Off Premise – Multiple
Grocers15th 1st
Off Premise – Impulse 12th` 1st
16
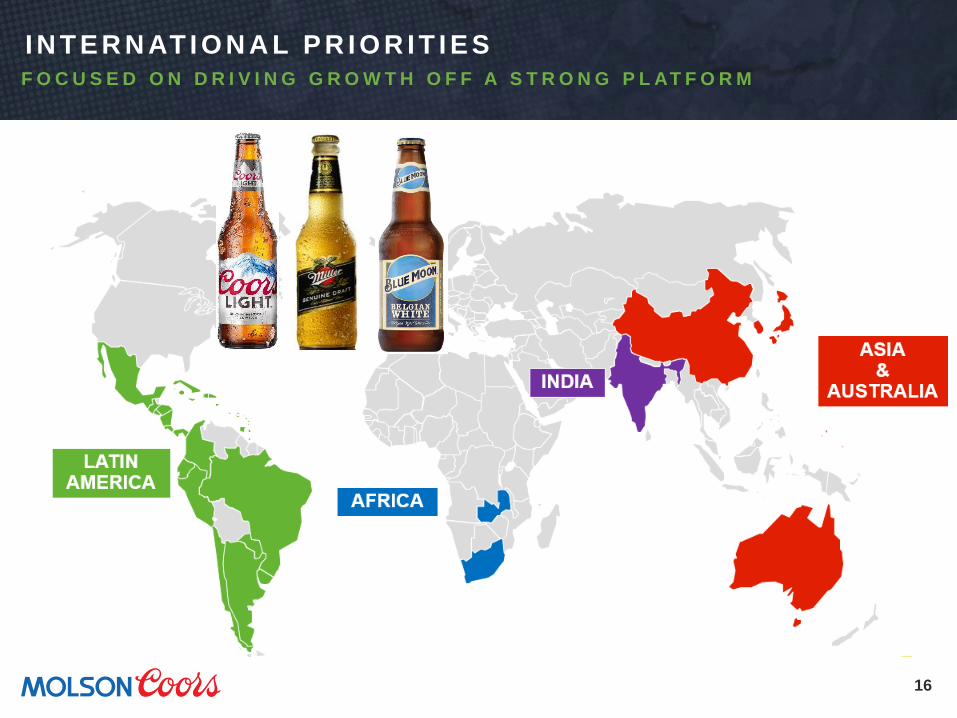
I N T E R N AT I O N A L P R I O R I T I E S
F O C U S E D O N D R I V I N G G R O W T H O F F A S T R O N G P L AT F O R M
17
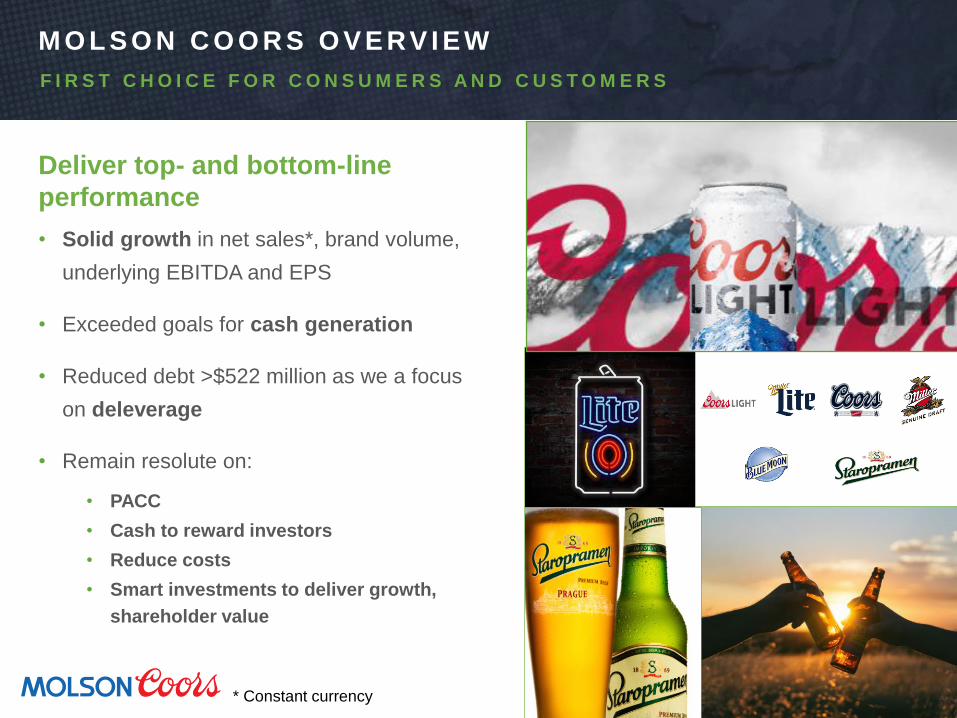
M O L S O N C O O R S O V E RV I E W
Deliver top- and bottom-line
performance
• Solid growth in net sales*, brand volume,
underlying EBITDA and EPS
• Exceeded goals for cash generation
• Reduced debt >$522 million as we a focus
on deleverage
• Remain resolute on:
• PACC
• Cash to reward investors
• Reduce costs
• Smart investments to deliver growth,
shareholder value
F I R S T C H O I C E F O R C O N S U M E R S A N D C U S T O M E R S
* Constant currency

A U G U S T 2 , 2 0 1 7
Q&A


![RASRV06Q-Q2 RASRV07Q-Q2 RASRK07Q-Q2 RASR07Q-Q2 … · 7~ g^oj 537d :\7d {[K3o 5EZo6 5EZo6 .Xd YHZY]=CX ;co5J_p;AI](https://img.pdfslide.tips/doc/110x75/5fe4be6bd31a312efe7d5bd6/rasrv06q-q2-rasrv07q-q2-rasrk07q-q2-rasr07q-q2-7-goj-537d-7d-k3o-5ezo6-5ezo6.jpg)