Embed Size (px)
Citation preview

Mpac Group plcIngenious Packaging Solutions2017 Full Year Results
March 2018

Agenda
1. Overview
2. 2017 Financial Highlights
3. Strategic Update
4. Outlook
5. Appendices
2

OVERVIEW - REVIEW
Tony Steels – Chief Executive

Strategic Update
Transformational year of progress against the strategic plan:
• Strategic plans accelerated by the divestment of the I&TM business
• Continuing business 100% focused on target growth markets
• Order intake, order book and sales all exceeded strategic plan
• Leveraged embedded partnerships with global blue chip customers
• Profitability turned around
• Moved Canadian & Singapore operations to new customer showcase environment
• Launch of new branding Mpac
• New Leadership team onboarded
4

ServiceProviding lifetime service and sustaining excellence, globally, quickly and efficiently.
What we do?
MakeCreating and enabling new ideas that give a competitive advantage and keep customers at the forefront of their markets.
PackProvider of high speed processing and packing technologies that drive business performance and long-term value.
TestTest and inspection technologies are incorporated into the solutions we provide to ensure product quality and compliance.
Global leader in “Make, Pack, Test, Service” high-speed packaging solutions
5

Core Skills & Experience
Web handling
High-speed web handling, forming, cutting, punching,
folding, sealing, printing,
verification.
We are specialists in the design of
precision powder dosing and
powder micro-dosing, and
powder filling machines.
Dosing andfilling
We have designed robotic cells allowing the
manufacture of a wide variety of
different product concepts on the
same base machine.
Assembly automation and
robotics
High specification automation
Continuous motion, indexing
mechanisms, control systems, vision systems,
ultrasound, lasers.
Cartoning
End load cartoners have been a core competency of ours from the
beginning. Applications include stick
packs, contact lenses, tissue,
premium spirits, bag-in-box.
Case Packing
We have a long history of
providing reliable and robust case
packing and palletising
equipment. Our highly flexible
standard solutions commonly load
RSC, HSC and tray containers.
6

Key Markets
Mpac has a highly skilled and experienced team dedicated to finding practical solutions to your challenges.
Operating in the pharmaceutical, healthcare and food and beverage sectors, we meet the ever-increasing demand of our customers’ manufacturing processes and operational objectives.
Cross industry experience and expertise means that customers benefit from the diversity of ideas and concepts.
Pharmaceutical Healthcare Nutrition & Beverage
7

Global Reach
Service personnel
Office locations (engineering, manufacturing, sales & service)
8

2017 FINANCIAL HIGHLIGHTS
Jim Haughey – Group Finance Director
Overview – 2017 Financial Highlights
• Order intake increased 21% year on year
• Closing order book 35% increase over 2017 opening position
• Increase in Group sales - continuing operations of £11.9m (29%)
• Underlying operating profit of £1.3m (2016: £1.2m loss)
• Underlying PBT of £1.1m (2016: £1.5m loss)
• Disposal of Tobacco division generated £25.9m net proceeds (£23.5m following additional pension payment)
• Sale of Canadian property generates £6.8m net proceeds
• Closing net cash of £29.4m (2016: £0.8m)
• Underlying EPS of 4.2p (2016: 6.0p loss per share)
• 2018 final dividend nil - Future dividend policy to be considered in the context of 2018 result
• Priority organic growth then acquisitions
10
20.4
23.2
9.8
Sales by region 2017 (£m)
Europe Americas Asia Pacific
7.4
13.0
28.1
4.9
Sales by sector 2017 (£m)
Pharma Healthcare F&B Other

2017 Group Performance
£m£m
11

2017 Group Performance
£m
OE GP = Original Equipment Gross ProfitService GP = Service Gross Profit 12

2017 Group Performance
£m
0
5
10
15
20
25
30
35
2013 2014 2015 2016 2017
5 year revenue chart (continuing)
H1
H2
£m
13
Pensions
2013 2014 2015 2016 2017
300
310
320
330
340
350
360
370
380
390
400
410
420
Valu
e (
£ m
illio
n)
Surplus
Deficit
Liabilities
Assets
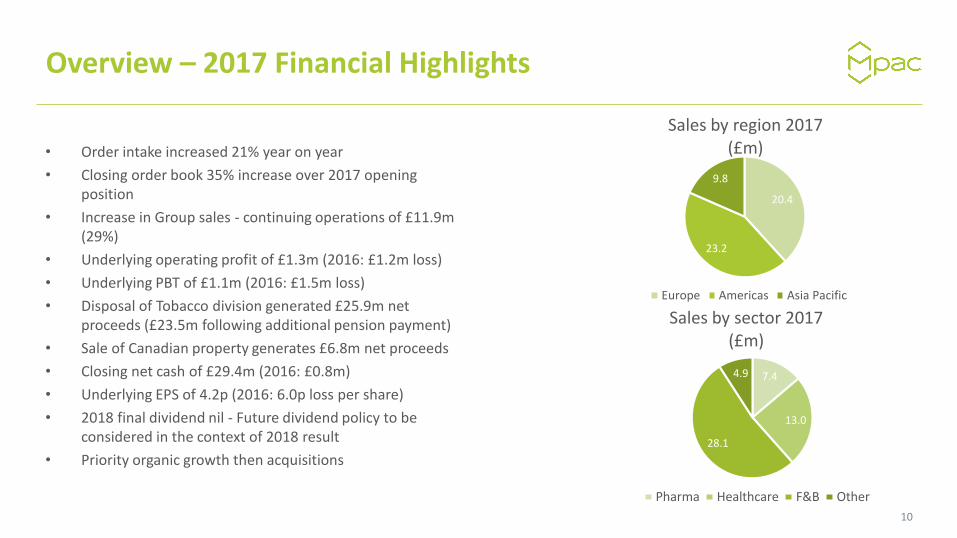
General
• PPF stated 66% of pensions schemes were in deficit
• Of the deficit schemes, the Median funding level was 86%
• Molins scheme was 87% funded (2nd quartile)
UK Scheme
• IAS19 surplus of £17.7m
• Mature scheme with 4233 members (68% pensioners)
• Scheme closed in 2012
• Current payments £1.8m pa until 2029
US scheme
• IAS19 deficit of £6.8m
• Mature scheme with 279 members (59% pensioners)
• Scheme closed in 2011
• Current payments of £0.7m, increasing to £1.1m, and then reduces to normal levels post 2023
UK Pension Surplus14

STRATEGIC UPDATE
Tony Steels – Chief Executive

Mission
• To be a global leader of high speed packaging solutions focused on attractive growth markets enhanced by a world class service offer programme to ensure customers achieve maximum return on their investments
• Customer focused, responsive and flexible through operational excellence underpinned by a global competitive supply chain and internal activities optimised to maximise efficiency
• Broaden application and customer scope by leveraging market leading technology and application know-how
10% annual organic revenue growth, 10% ROS over medium term
16
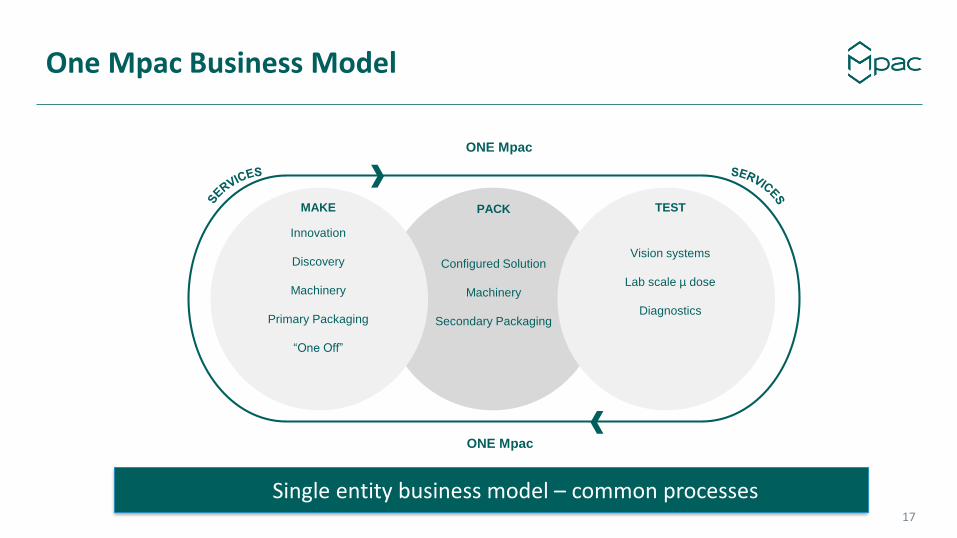
One Mpac Business Model
TESTPACKMAKE
ONE Mpac
ONE Mpac
Vision systems
Lab scale µ dose
Diagnostics
Configured Solution
Machinery
Secondary Packaging
Innovation
Discovery
Machinery
Primary Packaging
“One Off”
Single entity business model – common processes17

SECTOR SOLUTIONS MARKET VALUE CAGR DRIVERS
Pharmaceutical » Dry Powder Inhaler
» First of a kind
» Test and
Measurement$29 billion*
4.9%
5.3%
Healthcare » Ostomy
» Contact Lens
» Personal Care
Food and beverage » Bakery
» Chilled & Frozen
Foods
» Spirits
» Target Applications
$3.3 billion* 2.9%
Addressable Growth Markets
*PMMI 2016 – Period 2017 - 2021
Premiumisation
HealthIncreasing
income
Convenience Urbanization
Recycling
Leadership in higher margin segments in long-term growth markets
18

Application Know-how
Knowledge based solutions to leverage across established customer base19

Case Study Contact Lenses
20
Challenge
Customer USP - historical brands and SKU’s areretained. Some maybe only used 3~4 /yr.Minimum batch was 20 packs leading to highinventory, manufacturing costs and productexpiry
Solution
Store in unbranded state. Individual label blistersand load labelled blisters into correct brandedpacket and label again
Benefits
Batch size of one. 75% reduction in inventoryloss due to product expiry. Product data labellingintegrity. First line with new concept of flexiblepackaging

Strategic Priorities
DURING 2017 FUTURE PLANS
Going for Growth
Make Service a
Business
Operational Efficiency
• Commercial excellence programme
• Drive regional sales structure
• Launch Mpac identity
• Pipeline management - CRM
• Create Services business
• Secure installed base
• New location and build the team
• Deliver first service agreements
• Embed new “One” organisation
• Move to “showcase” new facility
• Build Site Leadership Teams
• Supply chain optimisation
• Full solution selling
• Product Development Roadmap
• Key account development
• Brand and Product Management
• Life cycle ROI proposition
• Promote contractual agreements
• Develop product portfolio
• Incorporate Industry 4.0
• Employee engagement and recognition
• Shared Platforms Eng and Pro
Management
• Global Supply Chain
• KPIs to support strategy
Functional Excellence and Cross Functional Alignment
21

The Journey - update
H1 2017 H2 2017 H1 2018 H2 2018 H1 2019 H2 2019 H1 2020 2021
One Mpac & cost
reductions
Leverage commonalities
Sustainable growth
• Sale of I&TM
• Relocation of Canadian Business
• Onboard new leadership team
• Product roadmap
• Centralised services • Rebrand Mpac
• “Commercial excellence”
• World class service offer
• Focus on Operational
Efficiency
• Developing people
• Modularisation
• Cross selling
• Broaden target market
• Implement PDR
• Build “full solution”
capabilities in target
markets
22

Outcome
Global leader in “Make, Pack, Test, Service” high-speed packaging solutions
Improved
customer
performance
Improved returns
and cash
generation
Improved
operational
performance
Target 10% annual organic growth and 10% ROS over medium term
GROWTH SERVICE AS
A BUSINESS
OPERATIONAL
EFFICIENCY
Transforming our business performance
23

Outlook
• Company entered 2018 with stronger order book than a year before
• Sustained focus on development of continuing operations
• Order intake and sales strongly ahead of last year
• Prime focus on organic growth
• Consideration of complementary acquisitions
24

Appendices

Income Statement
• Sales increase 21% over 2016
• Underlying operating profit increase of £2.5m to £1.3m
• Underlying PBT increase of £2.6m in year to £1.1m
• Non underlying items of £3.3m include:
• Canada property profit of £4.8m
• Pension admin costs £(0.8)m
• Re-organisation costs £(0.7)m, with significant management changes within all group operations.
• Loss on discontinued operations of £(0.8)m includes:
• IT&M trading PBT of £0.8m
• Net loss on disposal of £(0.1)m
• US deferred tax adjustment – Pensions £(2.6)m
• Recycle of translation reserve of £1.1m
• Underlying interest expense of £0.2m, non-underlying is pension related of £0.1m
• Underlying tax relates to Netherlands (£0.3m), non underlying relates to £1.7m of deferred tax on pension scheme movements.
• Underlying EPS increased by 10.2p to 4.2p.
26

Segmental Information
Original Equipment (OE)
• OE sales increase 40% over 2016 level
• Asia sales double
• EMEA sales increase 41%
Service
• A modest 2.4% increase in turnover, as the Group’s new service team is established
Sales by Sector
• Sales to Food and beverage market increase 31%
• Sales to Healthcare market increase by 25%
• Sales to the Pharmaceutical market increase by 7.4%
27

Cash Flows
• Cash flows from operating activities include:
• £2.7m working capital increase, in line with activity
• £4.9m of pension payments, including £2.4m due to the sale of I&TM, and £0.7m US scheme payments
• £4.4m cash inflow from discontinued operations
• Re-organisation costs paid of £0.8m
• Cash flows from investing activities include:
• Net proceeds from sale of I&TM of £25.9m
• Proceeds from disposal of Canadian property of £6.8m
• Capex of £1.6m primarily related to the new Canadian building
• Cash flows from financing activities include:
• Repayment of Loan £7.0m
• Interest paid of £0.2m
• No dividends were paid in the year (2016: £0.5m)
28

Working Capital (continuing operations)
• Strong order intake in late 2016 resulted in favourable working capital as customers deposits were not significantly utilised on projects
• The Group has seen a corresponding outflow of working capital as projects have progressed through the year
• Net working capital increase in line with the increase in activity
29
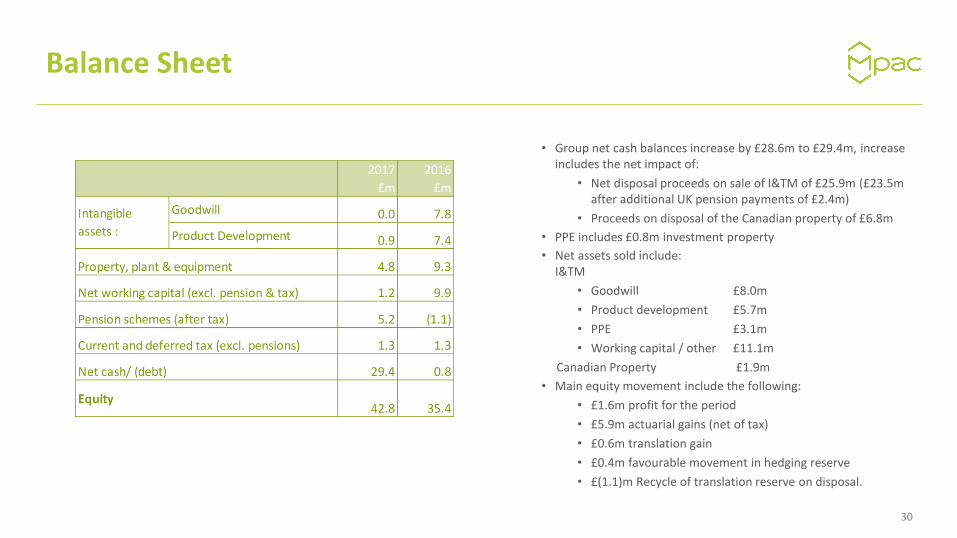
Balance Sheet
• Group net cash balances increase by £28.6m to £29.4m, increase includes the net impact of:
• Net disposal proceeds on sale of I&TM of £25.9m (£23.5m after additional UK pension payments of £2.4m)
• Proceeds on disposal of the Canadian property of £6.8m
• PPE includes £0.8m investment property
• Net assets sold include:I&TM
• Goodwill £8.0m
• Product development £5.7m
• PPE £3.1m
• Working capital / other £11.1m
Canadian Property £1.9m
• Main equity movement include the following:
• £1.6m profit for the period
• £5.9m actuarial gains (net of tax)
• £0.6m translation gain
• £0.4m favourable movement in hedging reserve
• £(1.1)m Recycle of translation reserve on disposal.
30

Pensions
2013 2014 2015 2016 2017
300
310
320
330
340
350
360
370
380
390
400
410
420
Valu
e (
£ m
illio
n)
Surplus
Deficit
Liabilities
Assets
UK Scheme
• IAS 19 surplus £17.7m (2016: £4.6m)
• Assets increased by £12.7m to £414.6m
• Liabilities reduced slightly by £0.4m to £396.9m, with a discount rate of 2.3% (2016: 2.5%) and a CPI inflation rate of 2.1% (2016:2.2%)
• Interest rate sensitivity: 10bp rise = £5.8m surplus increase
• Mature scheme
• 4,233 members with 2,896 (68%) pensioners, with an average age of 75.5 years.
• Pensioner payroll of £17m, peaking at £19m in 2025 – 2030
• Scheme closed to new entrants and future accrual in 2012
• Current recovery plan in place since August 2017, at £1.8m (+2.1%) pa until 2029. Also includes £2.4m of net proceeds of I&TM (paid in the year) and a profit share of 33% of underlying operating profit between £5.5m and £10.0m.
• Company also funds the levy to the Pension Protection Fund (PPF)
US Scheme
• IAS 19 deficit £6.2m (2016: £6.8m)
• Assets reduced by £0.4m to £16.7m
• Liabilities reduced by £1.0m to £22.9m, with a discount rate of 3.45% (2016: 4.0%)
• Interest rate sensitivity: 10bp rise = £0.3m deficit reduction
• Mature scheme
• 279 members with 164 (59%) pensioners.
• Pensioner payroll of £1.4m pa.
• Closed to future accrual in 2011
• Funding payments in accordance with regulation - £0.7m in 2017, expected to increase to £1.1m in 2018UK Pension Surplus
31

Executive Leadership Team
New Executive Leadership Team32

Mpac Group plc13 Westwood WayWestwood Business ParkCoventryCV4 8HSUnited Kingdom
T +44(0) 247 642 1100F +44(0) 247 642 1255E [email protected]
www.mpac-group.com