Embed Size (px)
DESCRIPTION
Phase diagrams
Citation preview
ChEg_3161
Year III Taye Zewdu
SCBE-AAiT-AAU1
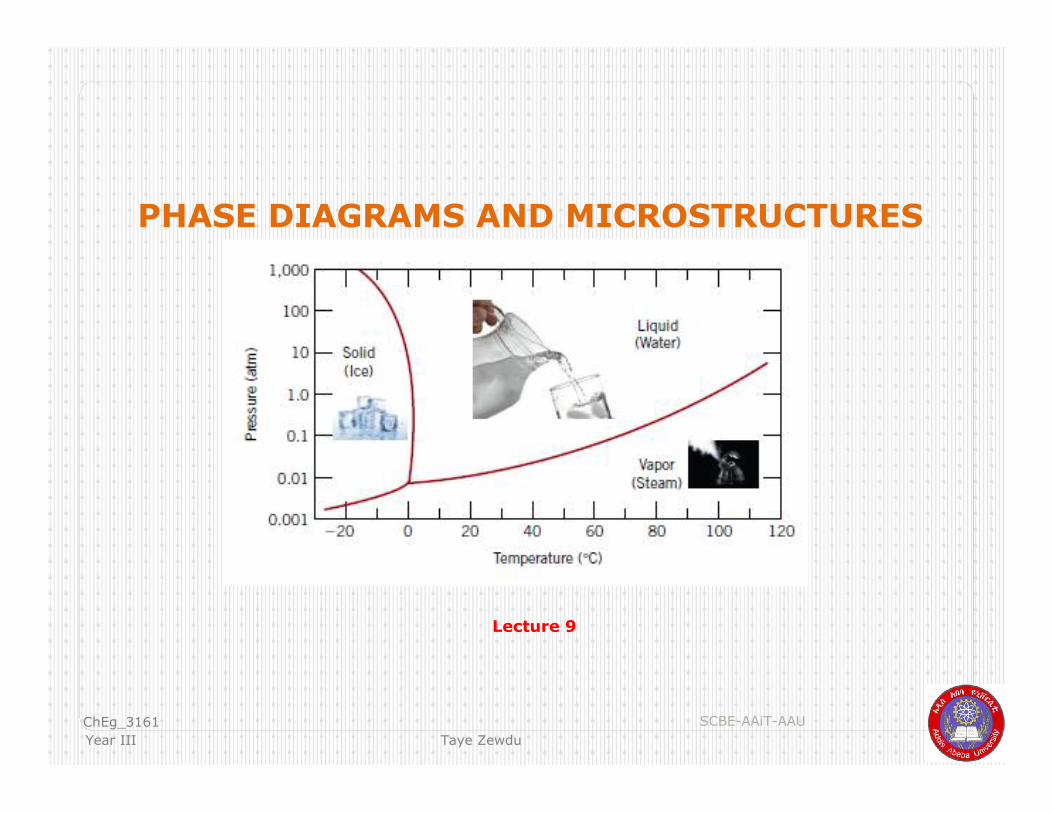
PHASE DIAGRAMS AND MICROSTRUCTURES
Lecture 9
SCBE-AAiT-AAU 2
Focal points in this lecture:
(1) Terminology associated with phase diagrams and phase transformations;
(2)Pressure–temperature phase diagrams for pure materials;
(3)The interpretation of phase diagrams;
(4)Some of the common and relatively simple binary phase diagrams, including that for the iron–carbon system; and
(5)The development of equilibrium microstructures, upon cooling,
SCBE-AAiT-AAU 3
Key Words
(1)Component: pure metal and/or compound of which an alloy
is composed
(2)System: a specific body of material under consideration or
series of possible alloys consisting of the same components
(3)Solubility limit: a maximum concentration of solute atoms
that may dissolve in the solvent to form a solid solution
(4)Phase: a homogeneous portion of a system that has uniform
physical and chemical characteristics
(5)Microstructure: Visible under optical or electron microscopes
(6)Equilibrium: When the free energy of a system is at a
minimum under some specified combination of temperature,
pressure, and composition.
SCBE-AAiT-AAU 4
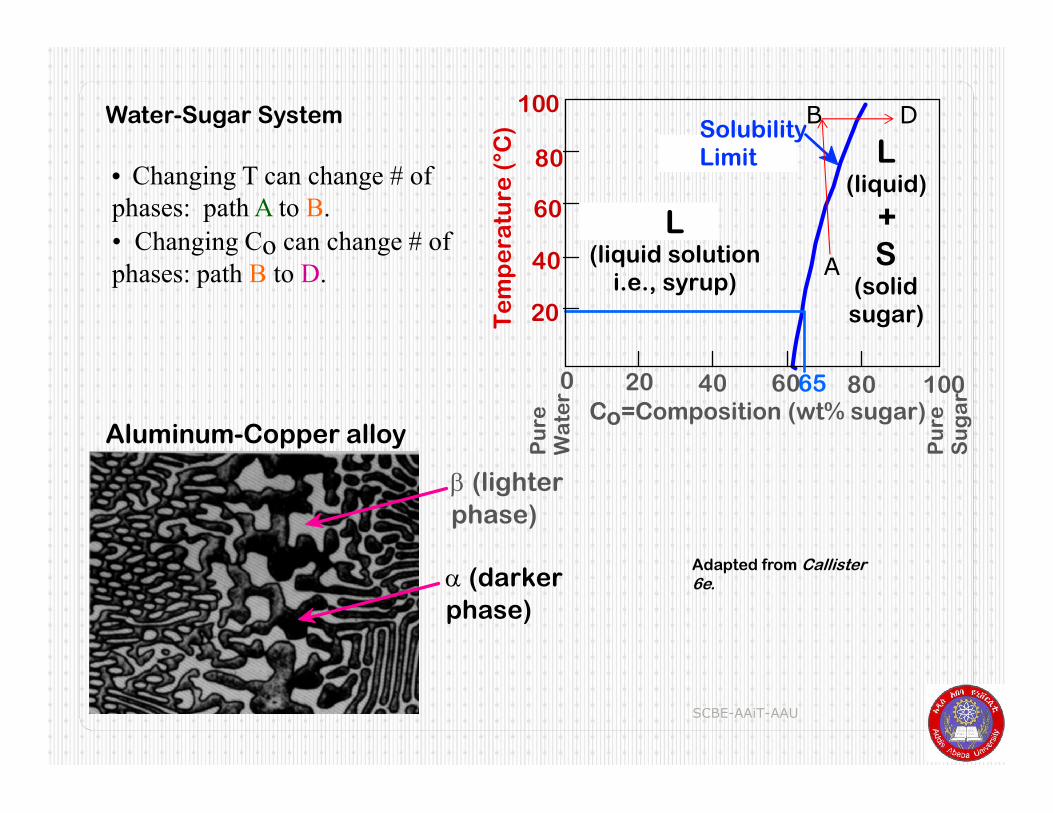
a (darker phase)
b (lighter
phase)
Pu
re
Su
ga
r
Te
mp
era
ture
(°C
)
0 20 40 60 80 100Co=Composition (wt% sugar)
L (liquid solution
i.e., syrup)
Solubility Limit L
(liquid)
+ S
(solid sugar)
65
20
40
60
80
100
Pu
re
Wa
ter
Water-Sugar System
Aluminum-Copper alloy
• Changing T can change # of phases: path A to B.
• Changing Co can change # of phases: path B to D. A
B D
Adapted from Callister6e.
SCBE-AAiT-AAU 5
Phase Diagrams
Tell us about phases as function of T, Co, P.
Tools to determine: the number and types of phases, the wt% of each phase, and the composition of each phase
Independent variables: T and Co (P = 1atm is always used).
Unary, binary and ternary phase diagrams
The phases can be liquidus, solidus or the combination
SCBE-AAiT-AAU 6
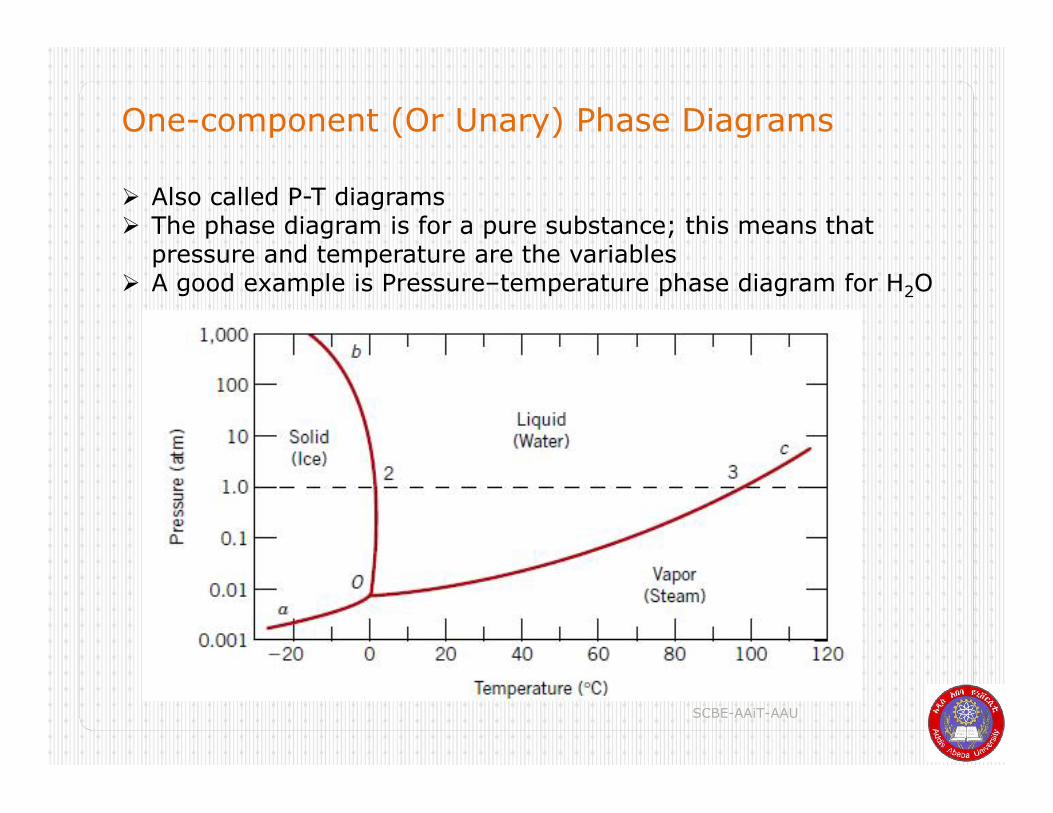
One-component (Or Unary) Phase Diagrams
Also called P-T diagrams The phase diagram is for a pure substance; this means that
pressure and temperature are the variables A good example is Pressure–temperature phase diagram for H2O
SCBE-AAiT-AAU 7
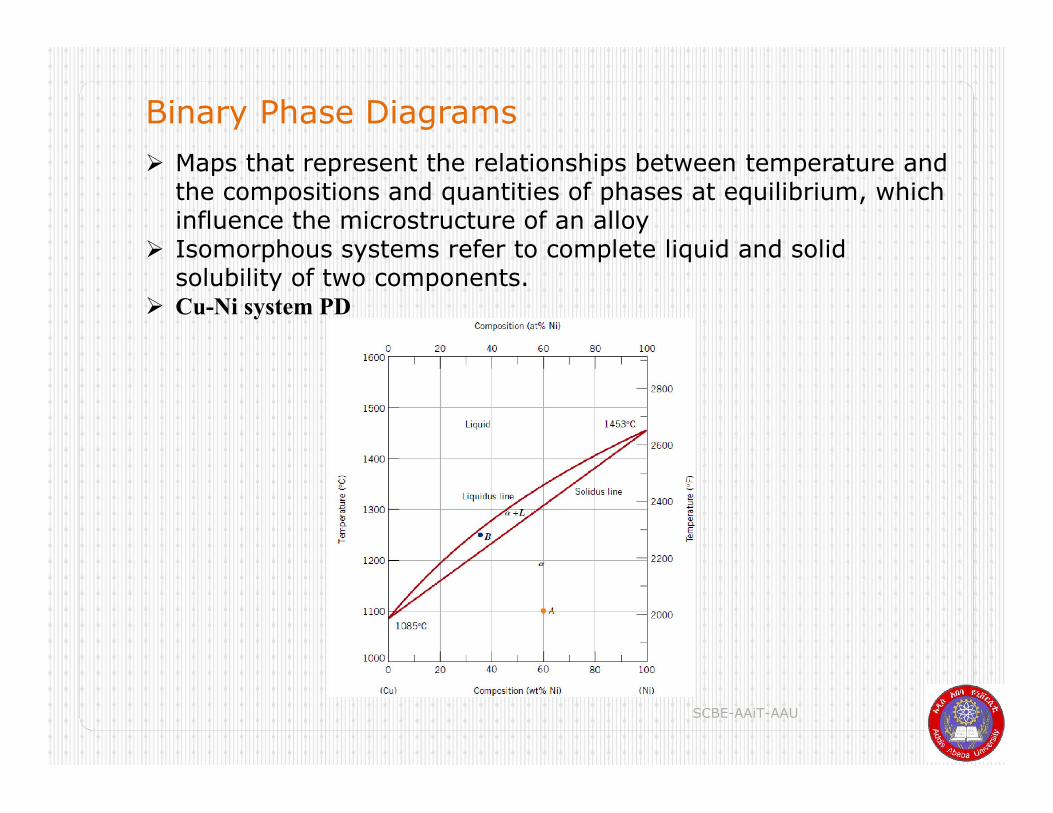
Binary Phase Diagrams
Maps that represent the relationships between temperature and the compositions and quantities of phases at equilibrium, which influence the microstructure of an alloy
Isomorphous systems refer to complete liquid and solid solubility of two components.
Cu-Ni system PD
SCBE-AAiT-AAU 8
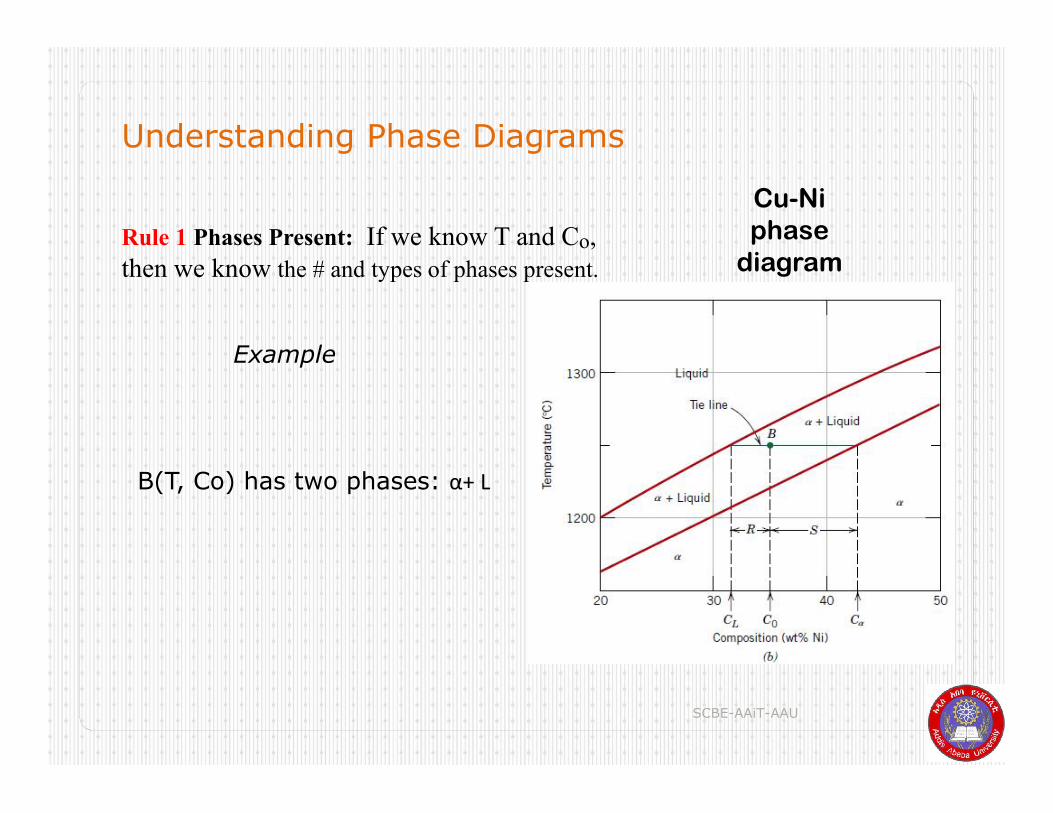
Understanding Phase Diagrams
Rule 1 Phases Present: If we know T and Co, then we know the # and types of phases present.
Cu-Niphase
diagram
Example
B(T, Co) has two phases: α+ L
SCBE-AAiT-AAU 9
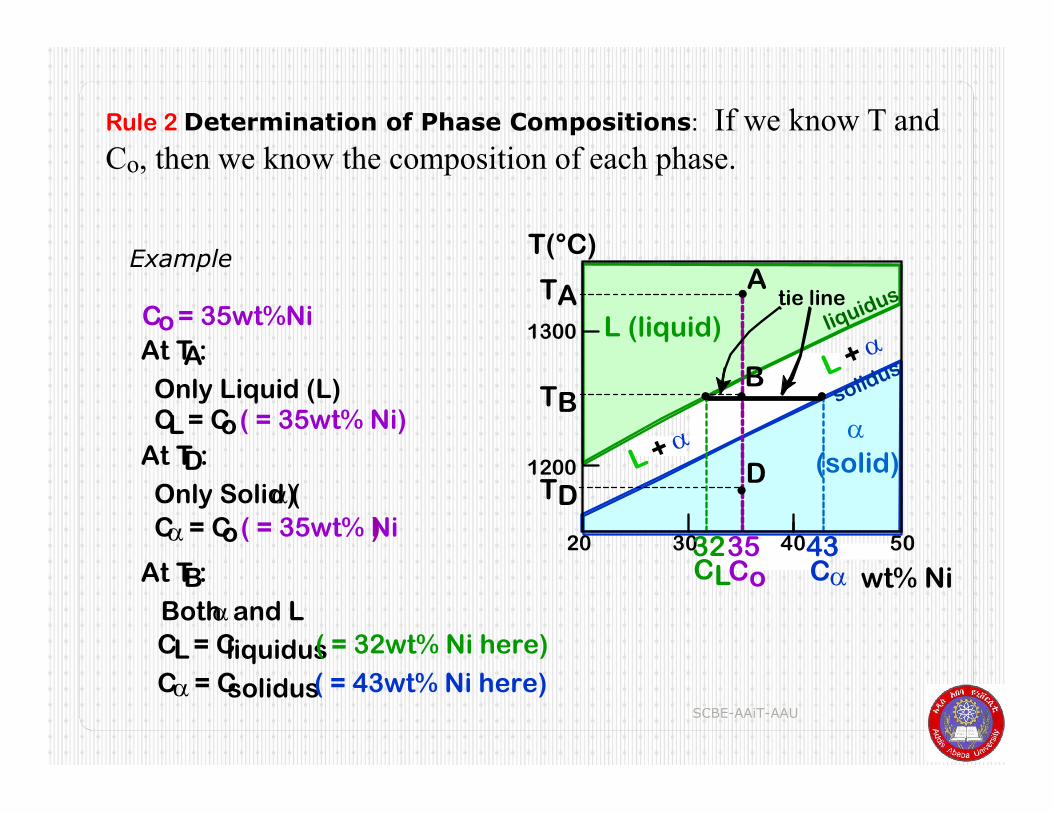
Rule 2 Determination of Phase Compositions: If we know T and Co, then we know the composition of each phase.
wt% Ni
20
1200
1300
T(°C)
L (liquid)
a
(solid)L + a
liquidus
solidus
30 40 50
TAA
DTD
TBB
tie line
L + a
433532CoCL Ca
At TA:
Only Liquid (L) CL = Co ( = 35wt% Ni)
At TB:
Both a and L CL = Cliquidus ( = 32wt% Ni here)
Ca = Csolidus ( = 43wt% Ni here)
At TD:
Only Solid (a)
Ca = Co ( = 35wt% Ni)
Co = 35wt%Ni
Example
SCBE-AAiT-AAU 10
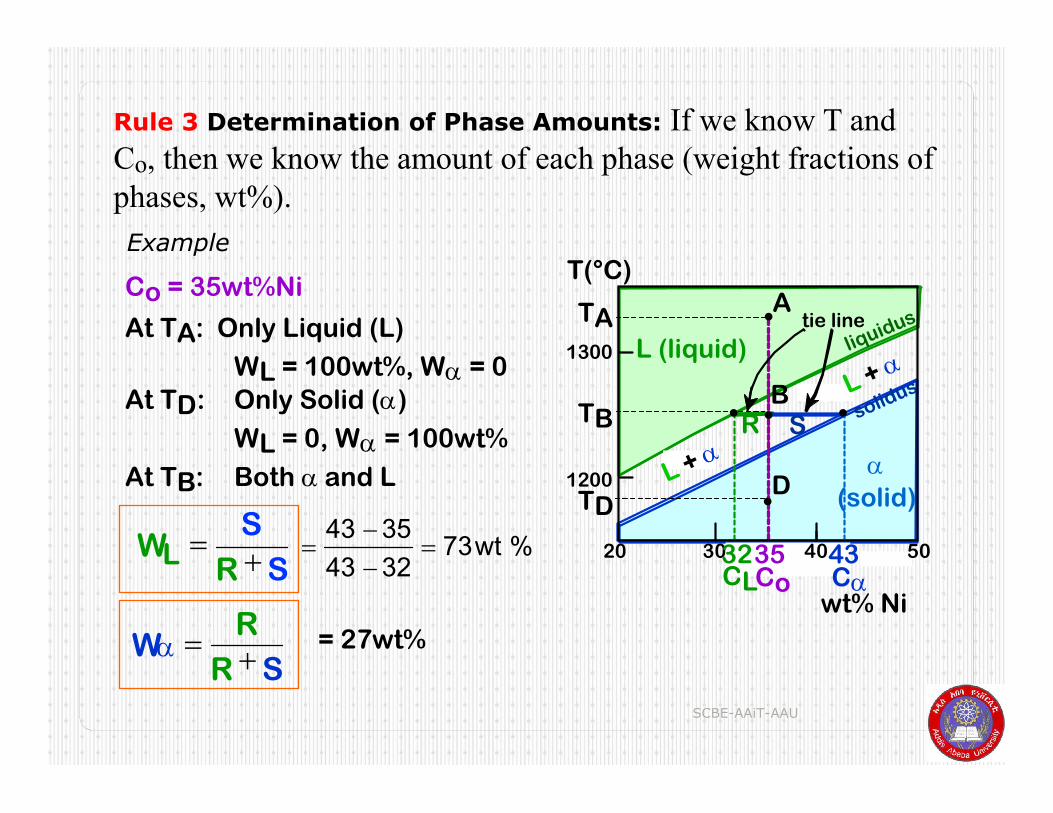
Rule 3 Determination of Phase Amounts: If we know T and Co, then we know the amount of each phase (weight fractions of phases, wt%).
wt% Ni
20
1200
1300
T(°C)
L (liquid)
a
(solid)L + a
liquidus
solidus
30 40 50
TAA
DTD
TBB
tie line
L + a
433532CoCL Ca
R S
At TB: Both a and L
At TA: Only Liquid (L)
WL = 100wt%, Wa = 0At TD: Only Solid (a)
WL = 0, Wa = 100wt%
Co = 35wt%Ni
WL S
R S
Wa R
R S
43 35
43 32 73wt %
= 27wt%
Example
SCBE-AAiT-AAU 11
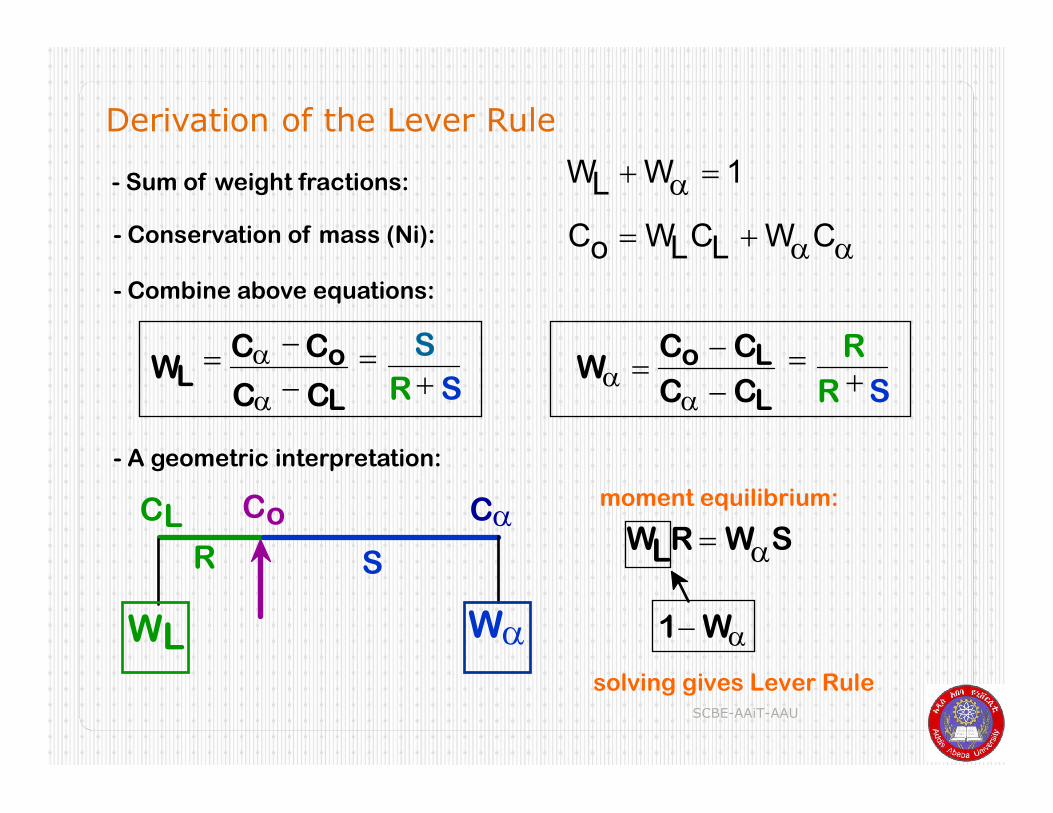
- Sum of weight fractions:
- Conservation of mass (Ni):
- Combine above equations:
Co WLCL WaCa
R
R S Wa
Co CL
Ca CL
S
R SWL
Ca Co
Ca CL
- A geometric interpretation:
Co
R S
WaWL
CL Camoment equilibrium:
1 Wa
solving gives Lever Rule
WLR WaS
Derivation of the Lever Rule
WL Wa 1
SCBE-AAiT-AAU 12
Here you have a class exercise!
SCBE-AAiT-AAU 13
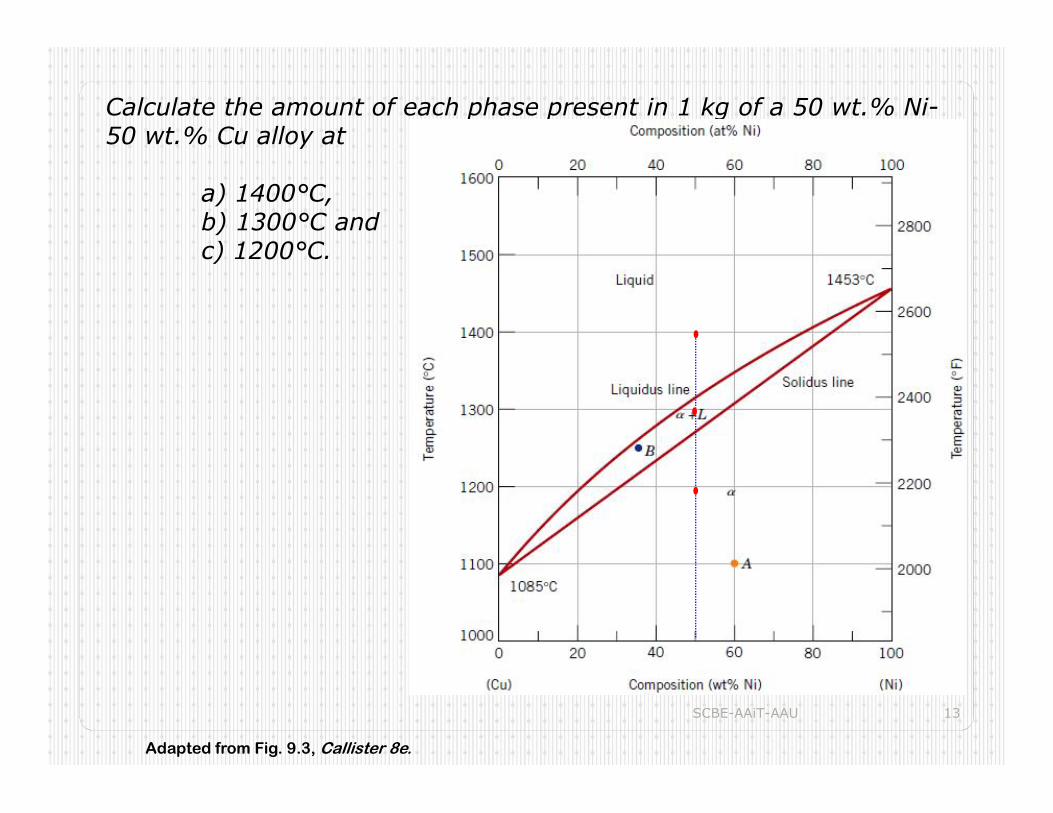
Calculate the amount of each phase present in 1 kg of a 50 wt.% Ni-50 wt.% Cu alloy at
a) 1400°C, b) 1300°C and c) 1200°C.
Adapted from Fig. 9.3, Callister 8e.
SCBE-AAiT-AAU 14
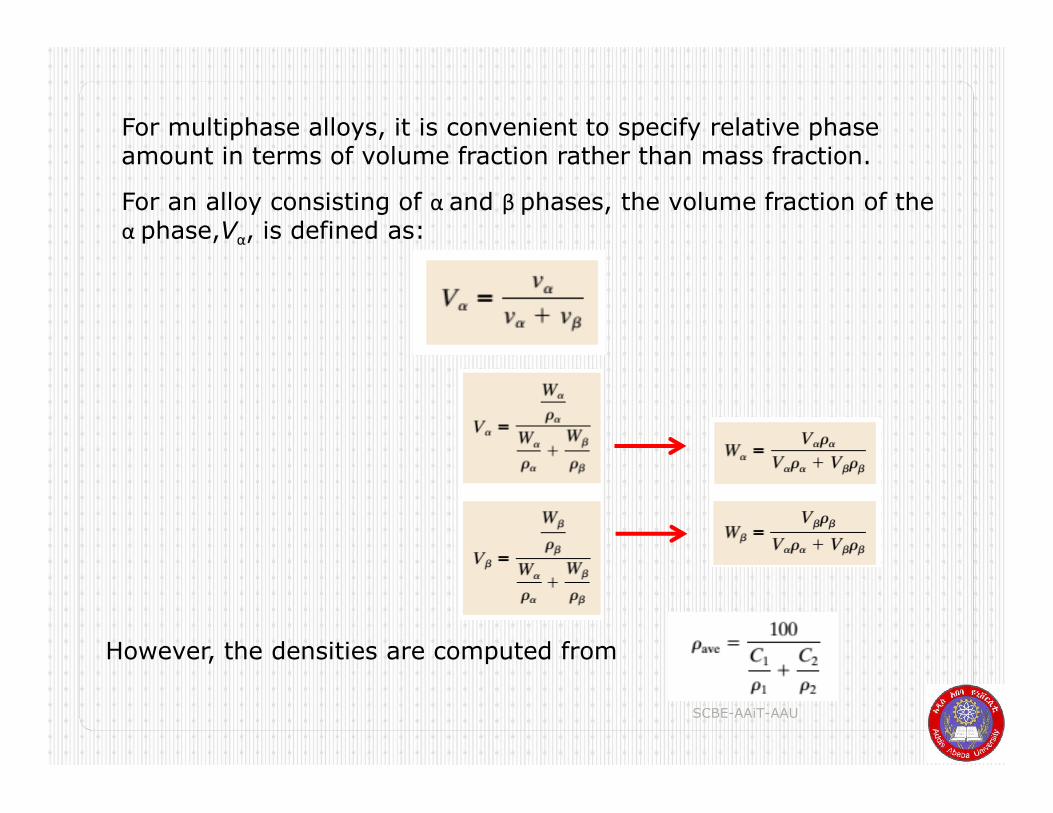
For an alloy consisting of α and β phases, the volume fraction of the α phase,Vα, is defined as:
However, the densities are computed from
For multiphase alloys, it is convenient to specify relative phase amount in terms of volume fraction rather than mass fraction.
SCBE-AAiT-AAU 15
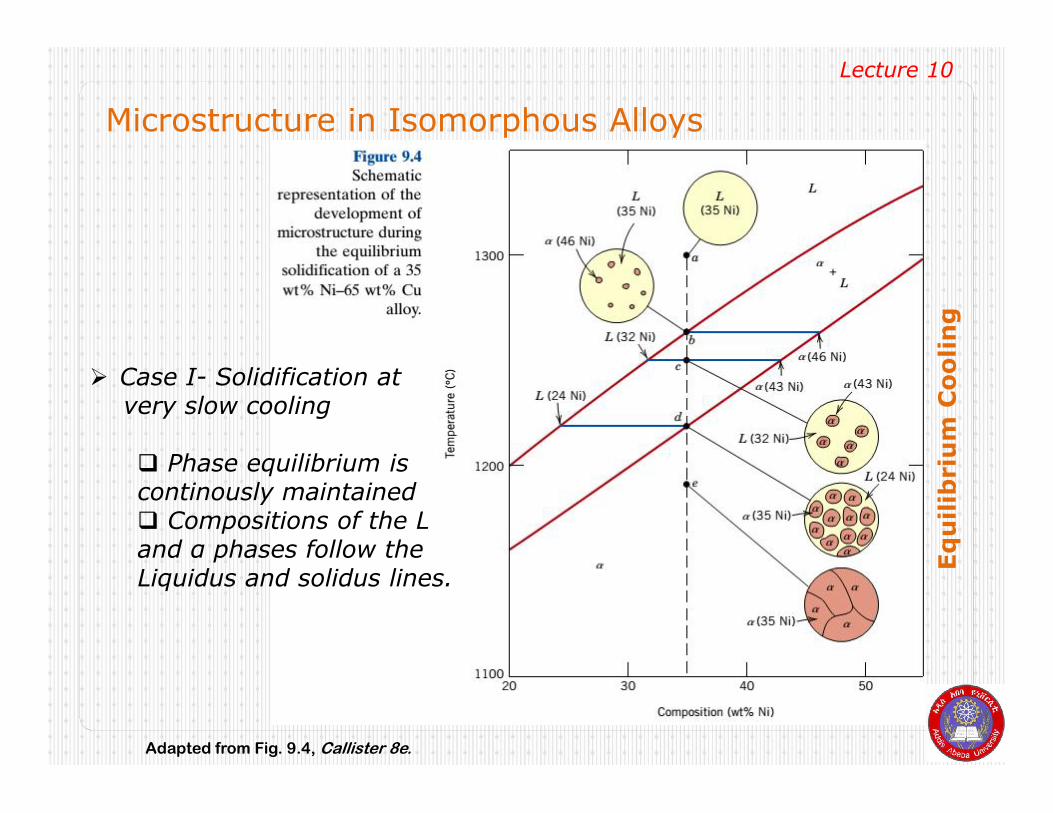
Microstructure in Isomorphous Alloys
Lecture 10
Eq
uilib
riu
m C
oo
lin
g
Case I- Solidification at very slow cooling
Phase equilibrium is continously maintained Compositions of the L and α phases follow the Liquidus and solidus lines.
Adapted from Fig. 9.4, Callister 8e.
SCBE-AAiT-AAU 16
No
n-e
qu
ilib
riu
m C
oo
lin
g
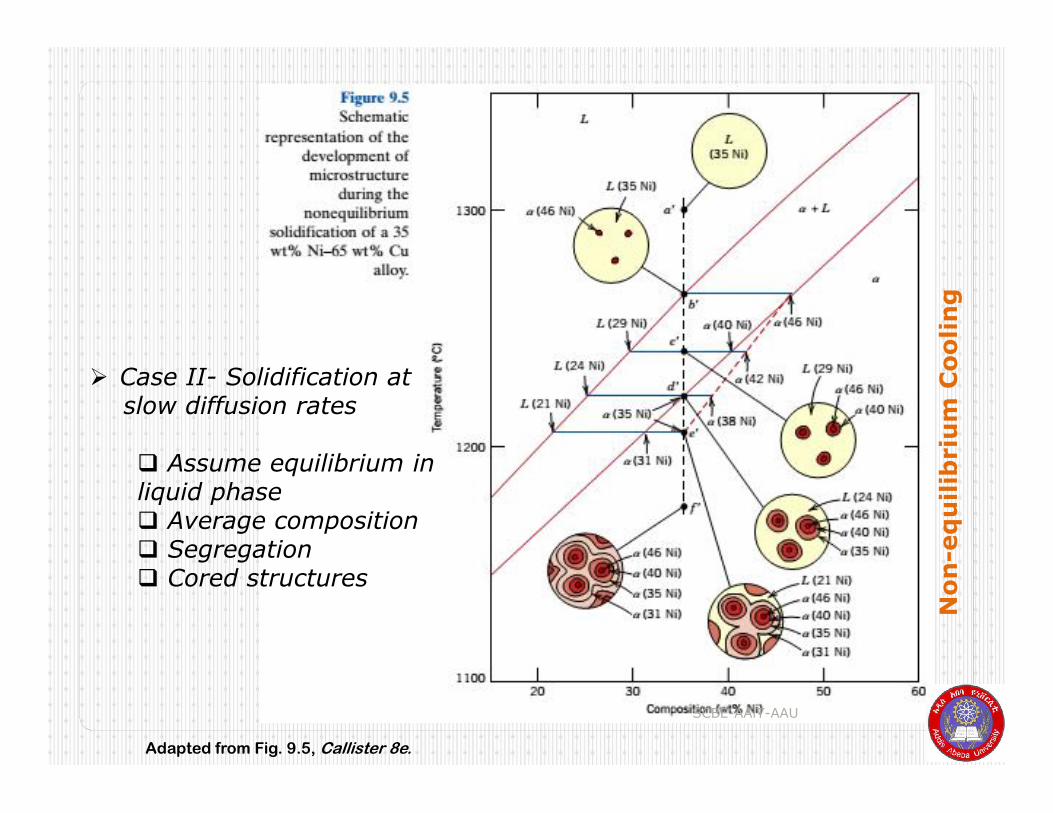
Case II- Solidification at slow diffusion rates
Assume equilibrium in liquid phase Average composition Segregation Cored structures
Adapted from Fig. 9.5, Callister 8e.
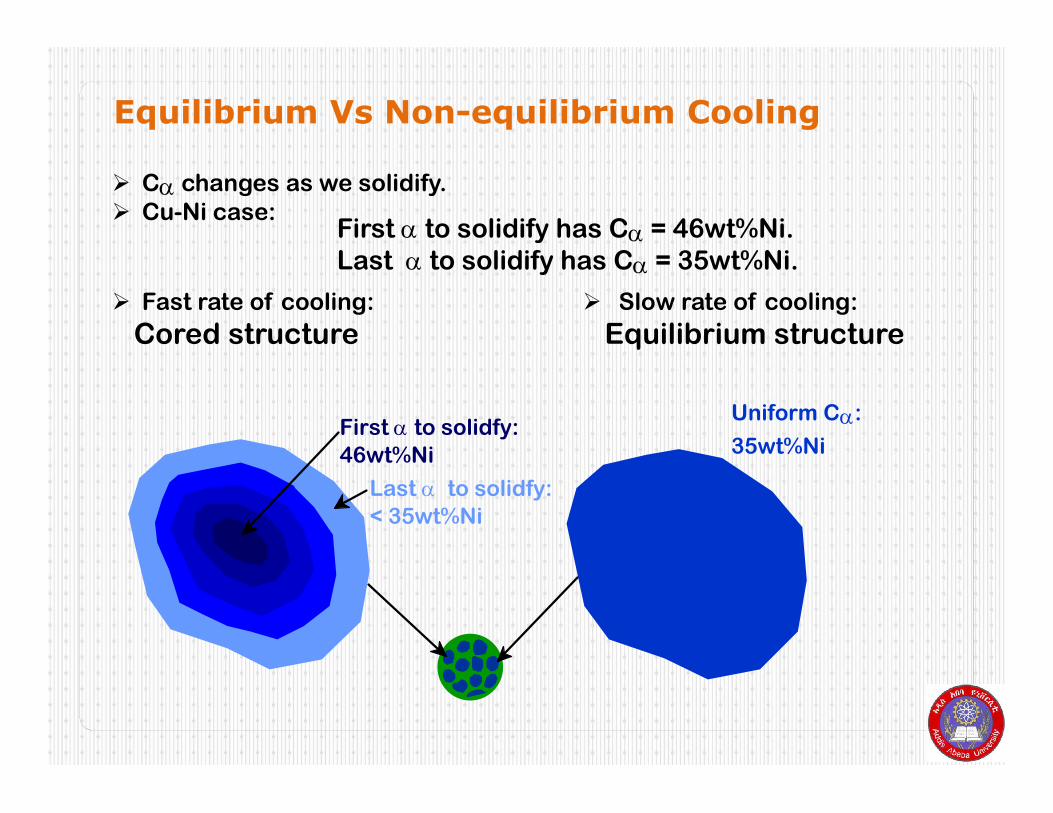
First a to solidfy: 46wt%Ni
Uniform Ca:
35wt%Ni
Last a to solidfy: < 35wt%Ni
Ca changes as we solidify. Cu-Ni case:
Fast rate of cooling:
Cored structure Slow rate of cooling:
Equilibrium structure
First a to solidify has Ca = 46wt%Ni.Last a to solidify has Ca = 35wt%Ni.
Equilibrium Vs Non-equilibrium Cooling
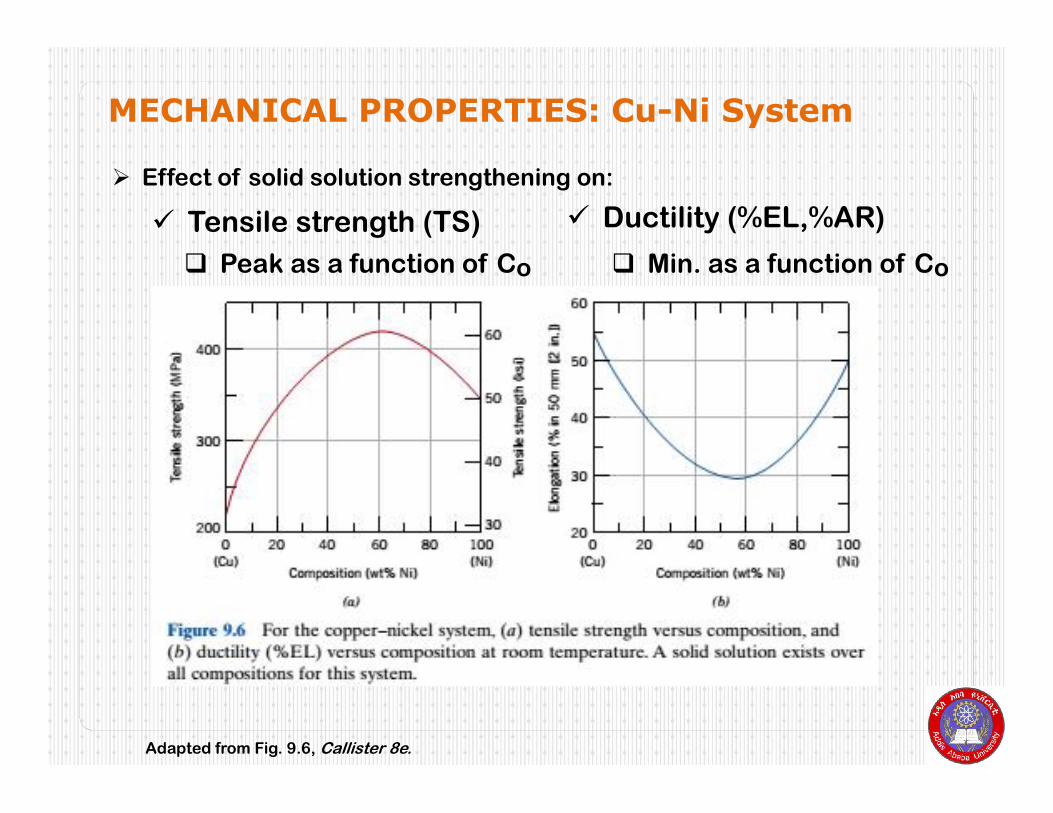
Effect of solid solution strengthening on:
Tensile strength (TS) Ductility (%EL,%AR)
Peak as a function of Co Min. as a function of Co
Adapted from Fig. 9.6, Callister 8e.
MECHANICAL PROPERTIES: Cu-Ni System
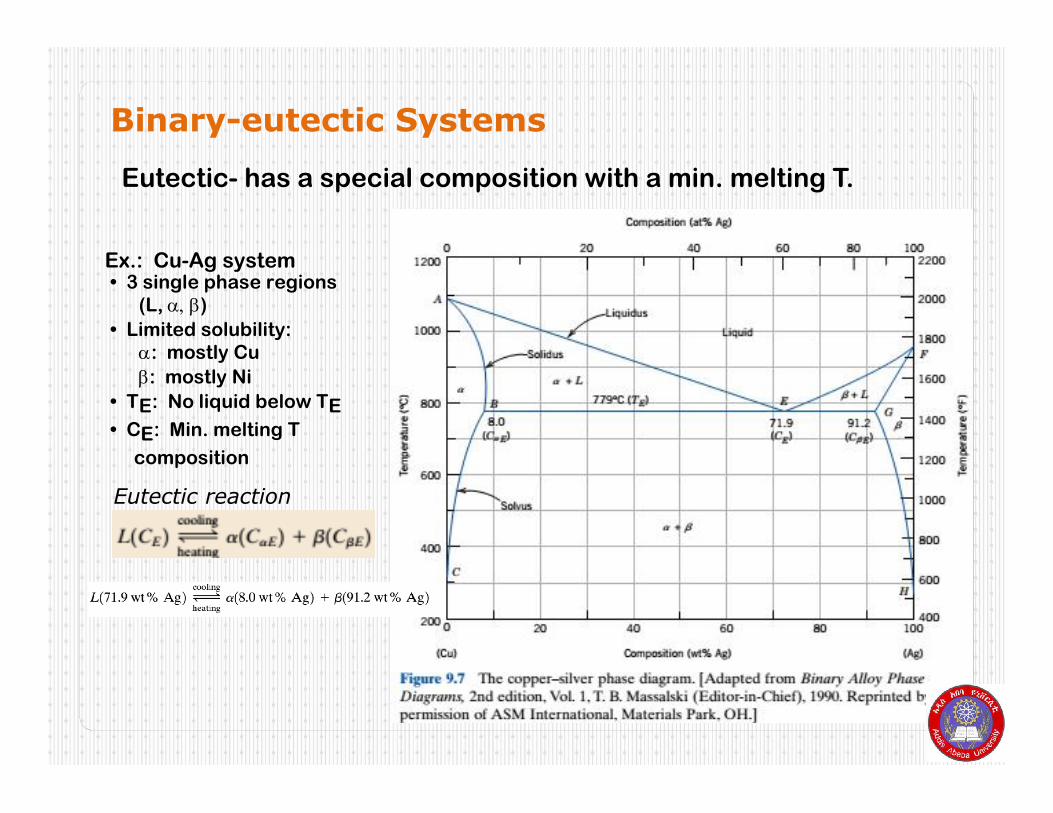
Eutectic- has a special composition with a min. melting T.
• 3 single phase regions (L, a b)
• Limited solubility: a: mostly Cu
b: mostly Ni
• TE: No liquid below TE
• CE: Min. melting T
composition
Ex.: Cu-Ag system
Binary-eutectic Systems
Eutectic reaction
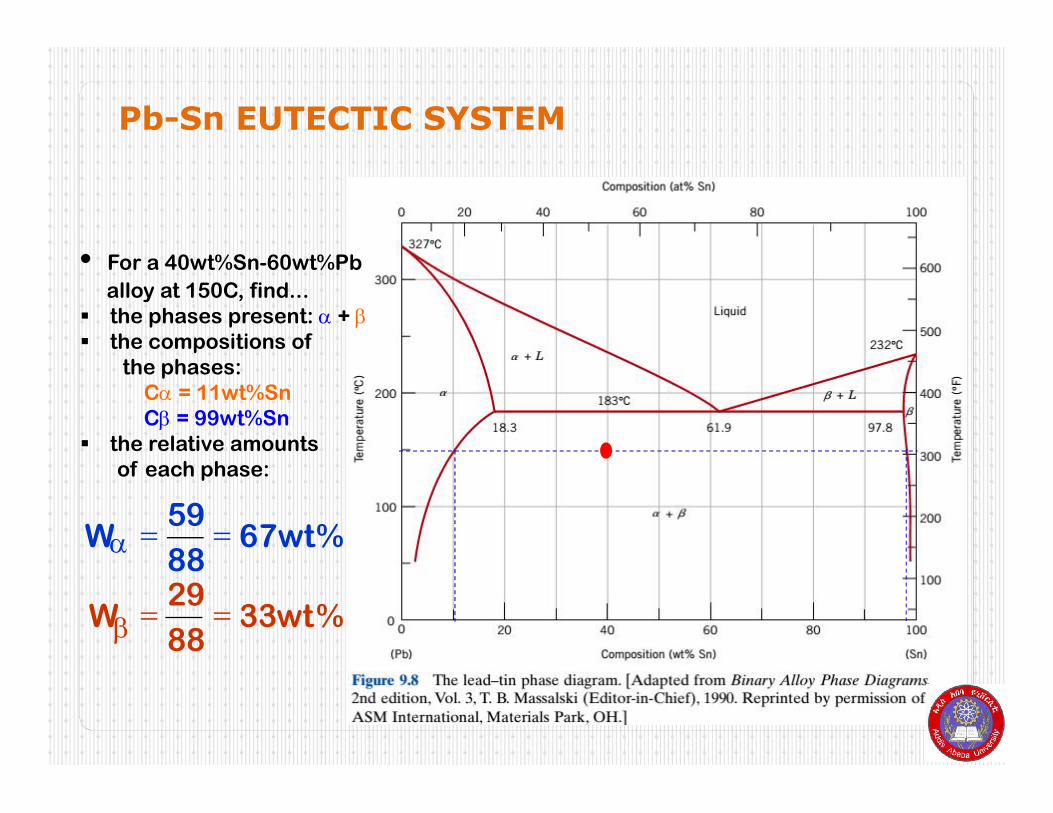
Pb-Sn EUTECTIC SYSTEM
• For a 40wt%Sn-60wt%Pb
alloy at 150C, find... the phases present: a + b the compositions of
the phases:Ca = 11wt%SnCb = 99wt%Sn
the relative amountsof each phase:
W a 59
88 67 wt %
W b 29
88 33 wt %
SCBE-AAiT-AAU 21
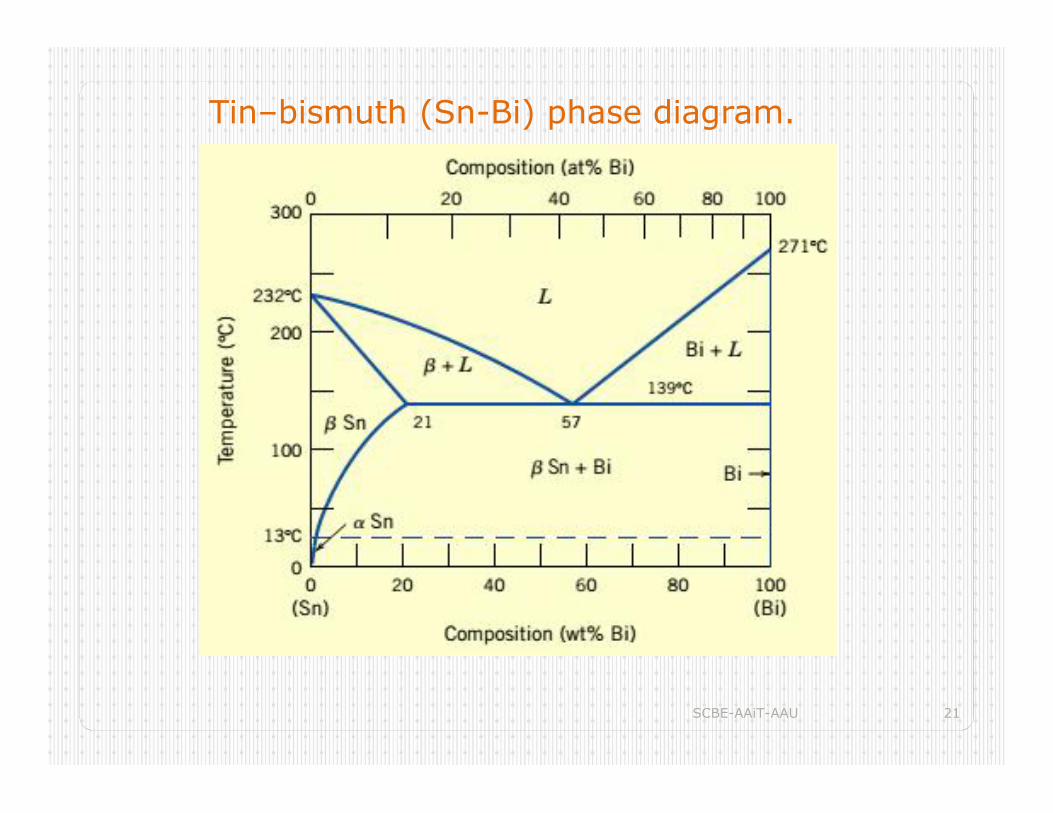
Tin–bismuth (Sn-Bi) phase diagram.
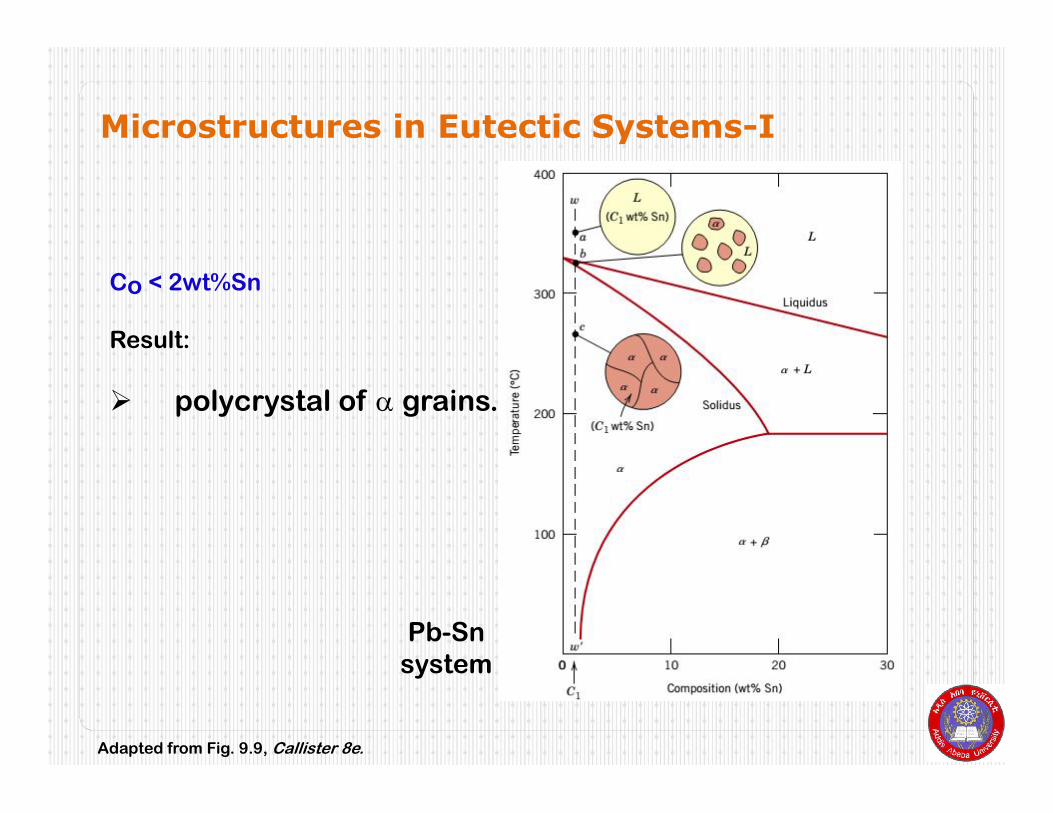
Co < 2wt%Sn
Result:
polycrystal of a grains.
Adapted from Fig. 9.9, Callister 8e.
Microstructures in Eutectic Systems-I
Pb-Snsystem
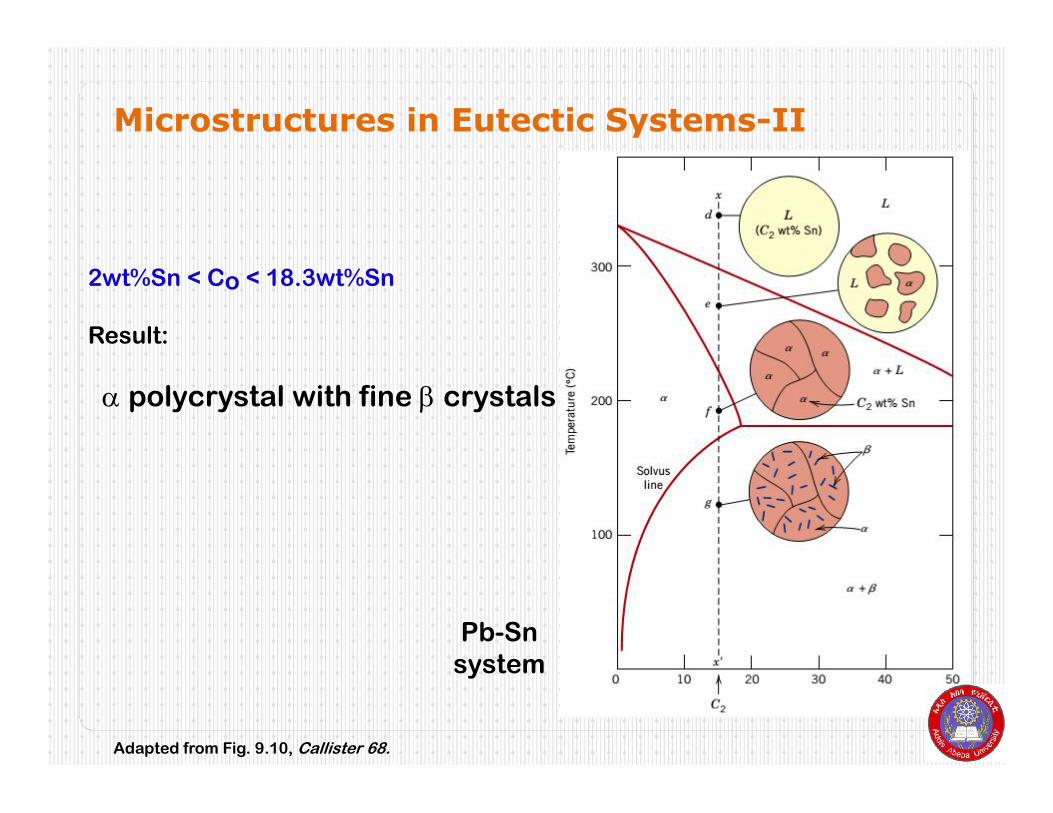
2wt%Sn < Co < 18.3wt%Sn
Result:
a polycrystal with fine b crystals
Adapted from Fig. 9.10, Callister 68.
Microstructures in Eutectic Systems-II
Pb-Snsystem
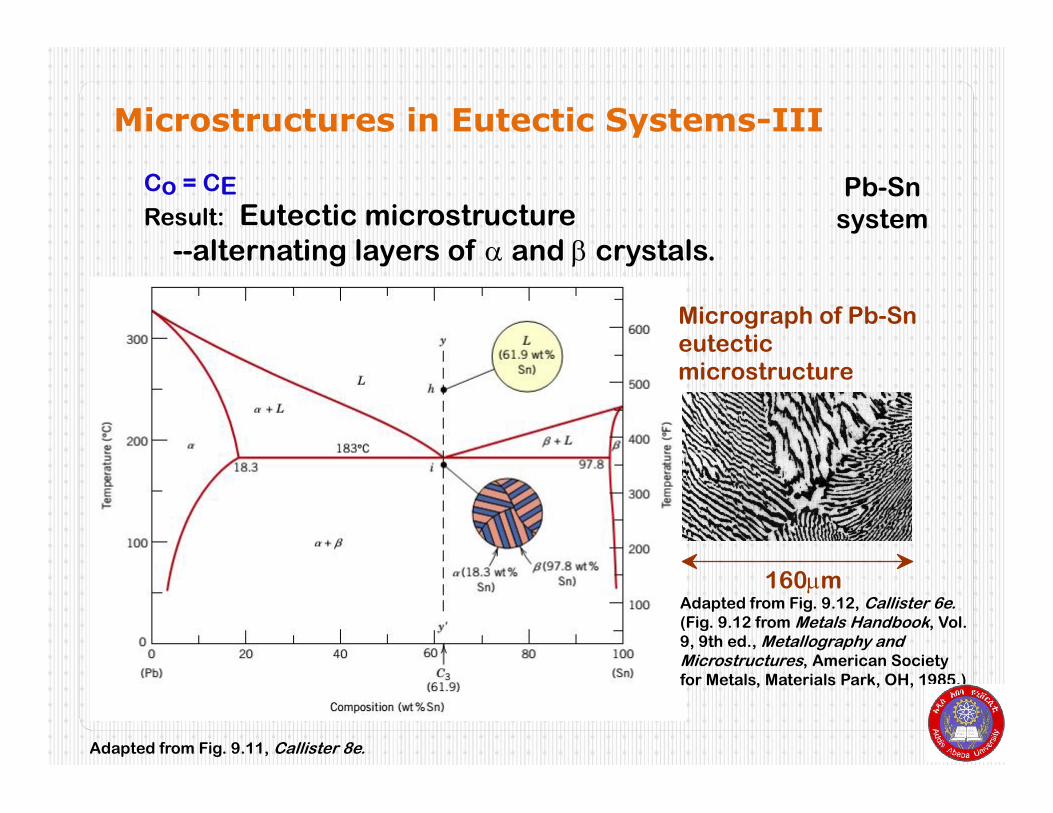
160m
Micrograph of Pb-Sn eutectic microstructure
Co = CEResult: Eutectic microstructure
--alternating layers of a and b crystals.
Pb-Snsystem
Adapted from Fig. 9.11, Callister 8e.
Adapted from Fig. 9.12, Callister 6e.(Fig. 9.12 from Metals Handbook, Vol. 9, 9th ed., Metallography and Microstructures, American Society for Metals, Materials Park, OH, 1985.)
Microstructures in Eutectic Systems-III
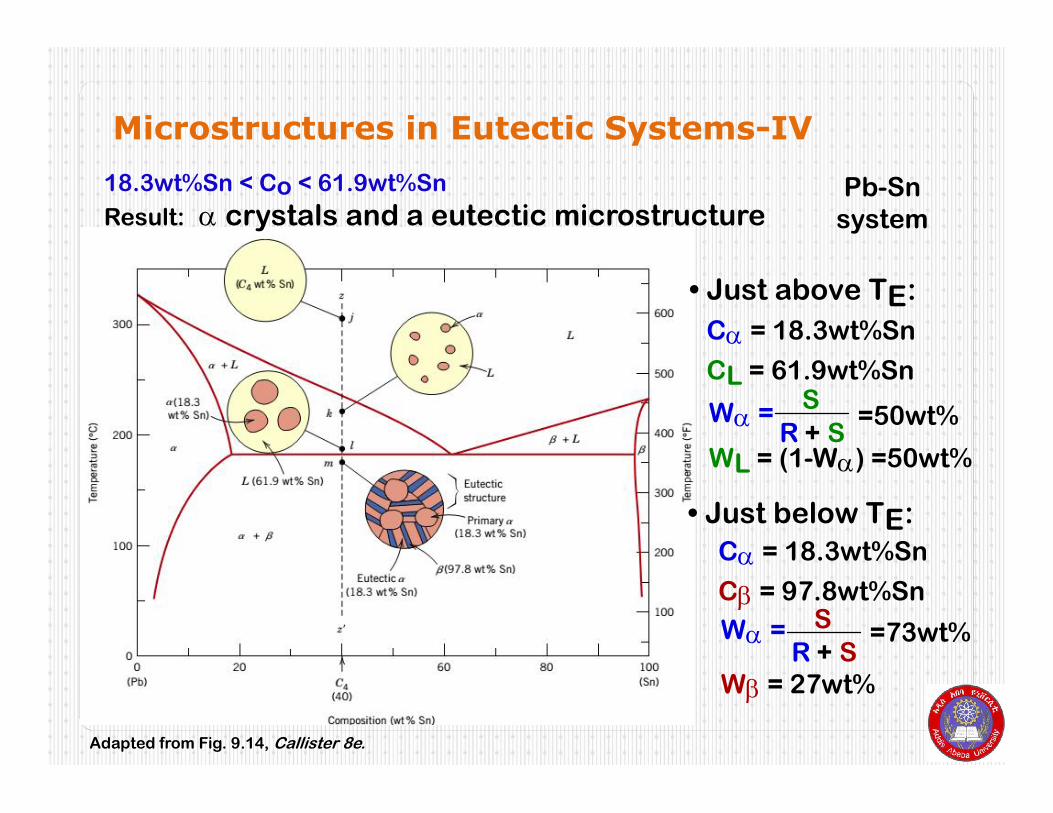
18.3wt%Sn < Co < 61.9wt%Sn
Result: a crystals and a eutectic microstructure
• Just above TE:
WL = (1-Wa) =50wt%
Ca = 18.3wt%Sn
CL = 61.9wt%SnS
R + SWa = =50wt%
• Just below TE:
Ca = 18.3wt%Sn
Cb = 97.8wt%SnS
R + SWa = =73wt%
Wb = 27wt%
Adapted from Fig. 9.14, Callister 8e.
Microstructures in Eutectic Systems-IV
Pb-Snsystem
SCBE-AAiT-AAU 26
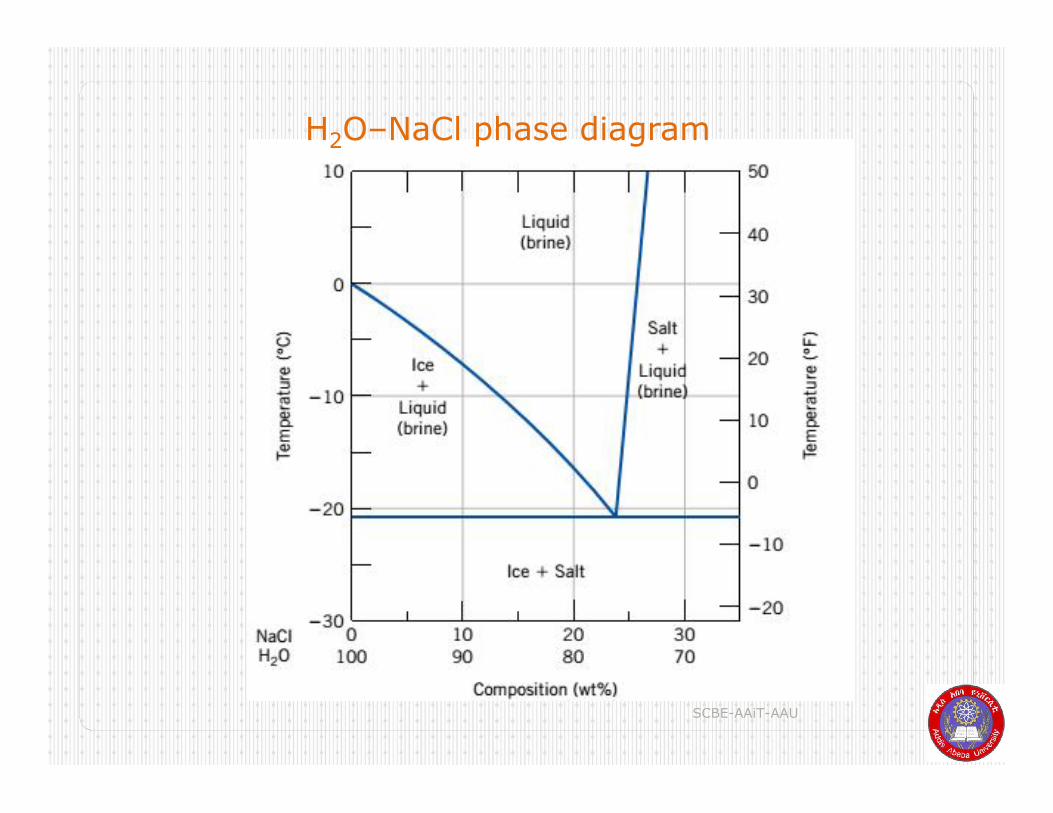
H2O–NaCl phase diagram
SCBE-AAiT-AAU 27
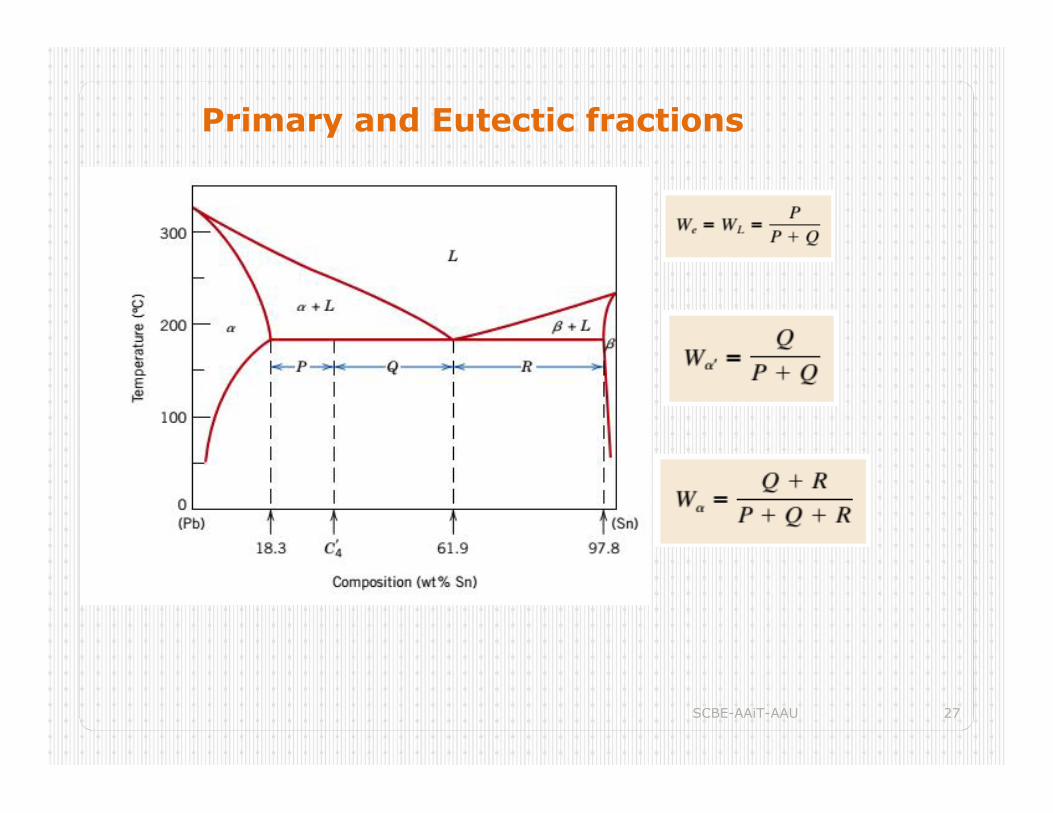
Primary and Eutectic fractions
SCBE-AAiT-AAU 28
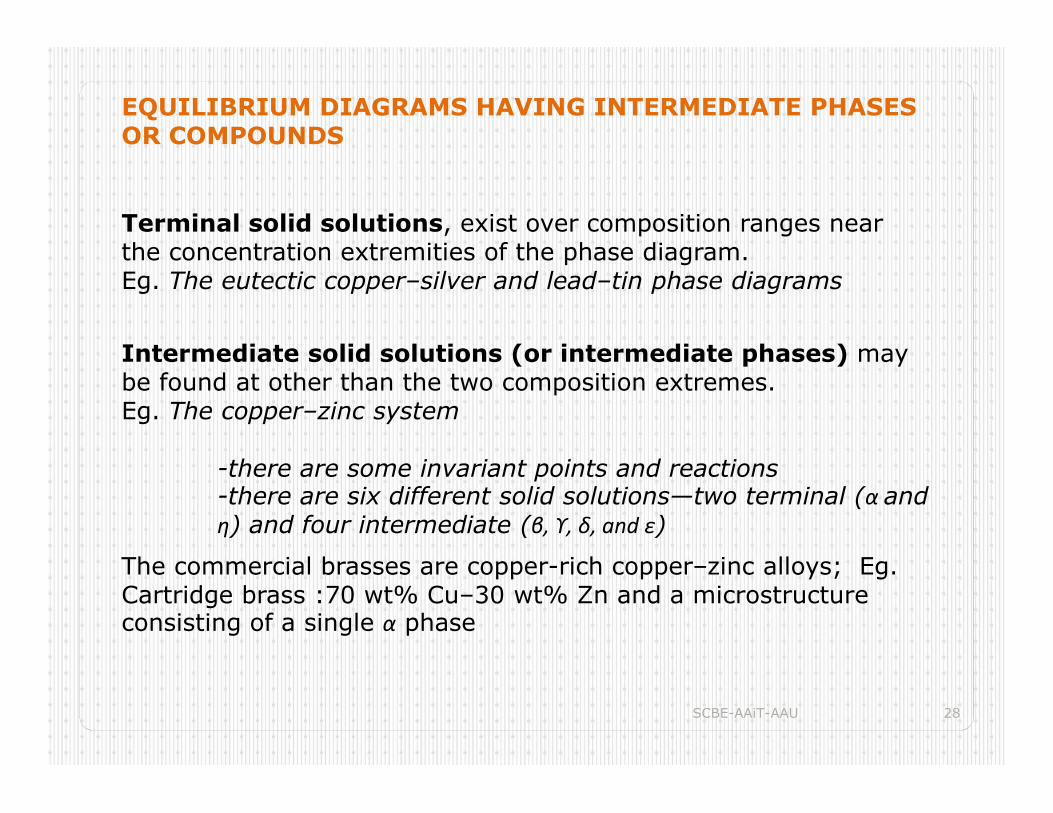
EQUILIBRIUM DIAGRAMS HAVING INTERMEDIATE PHASES OR COMPOUNDS
Terminal solid solutions, exist over composition ranges near the concentration extremities of the phase diagram.Eg. The eutectic copper–silver and lead–tin phase diagrams
Intermediate solid solutions (or intermediate phases) may be found at other than the two composition extremes.Eg. The copper–zinc system
-there are some invariant points and reactions-there are six different solid solutions—two terminal (α and η) and four intermediate (β, ϒ, δ, and ε)
The commercial brasses are copper-rich copper–zinc alloys; Eg. Cartridge brass :70 wt% Cu–30 wt% Zn and a microstructure consisting of a single α phase
SCBE-AAiT-AAU 29
SCBE-AAiT-AAU 30
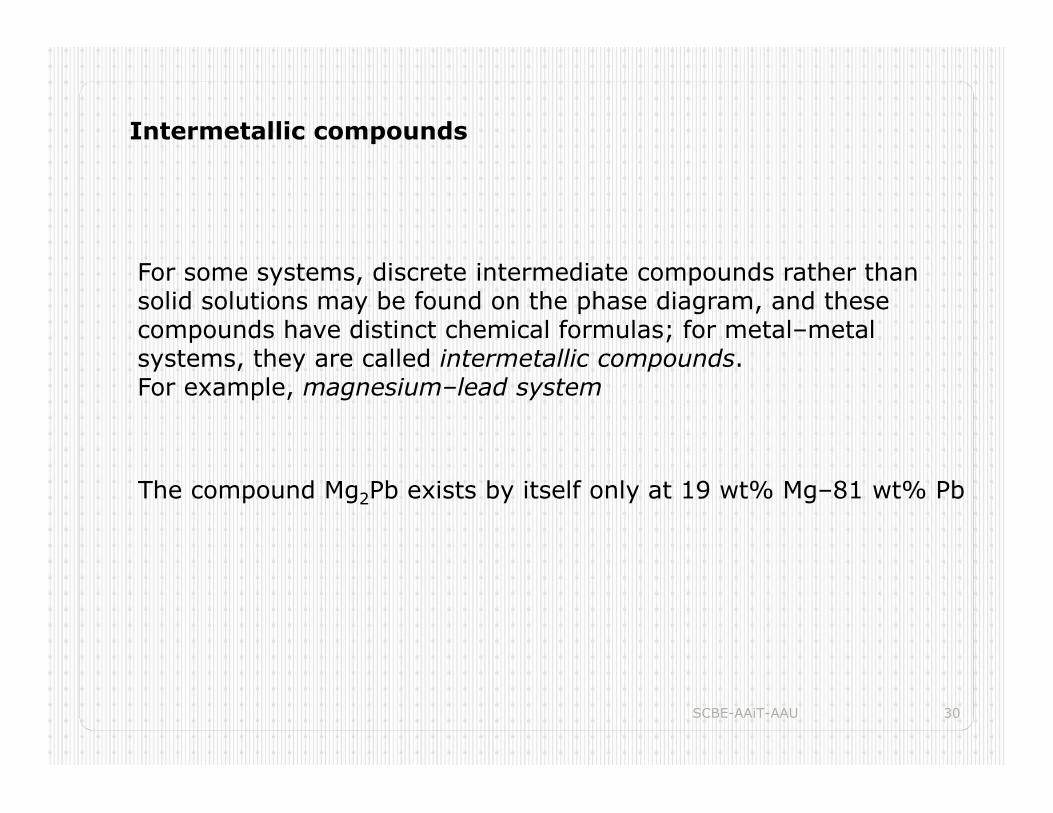
Intermetallic compounds
For some systems, discrete intermediate compounds rather than solid solutions may be found on the phase diagram, and these compounds have distinct chemical formulas; for metal–metal systems, they are called intermetallic compounds. For example, magnesium–lead system
The compound Mg2Pb exists by itself only at 19 wt% Mg–81 wt% Pb
SCBE-AAiT-AAU 31
SCBE-AAiT-AAU 32
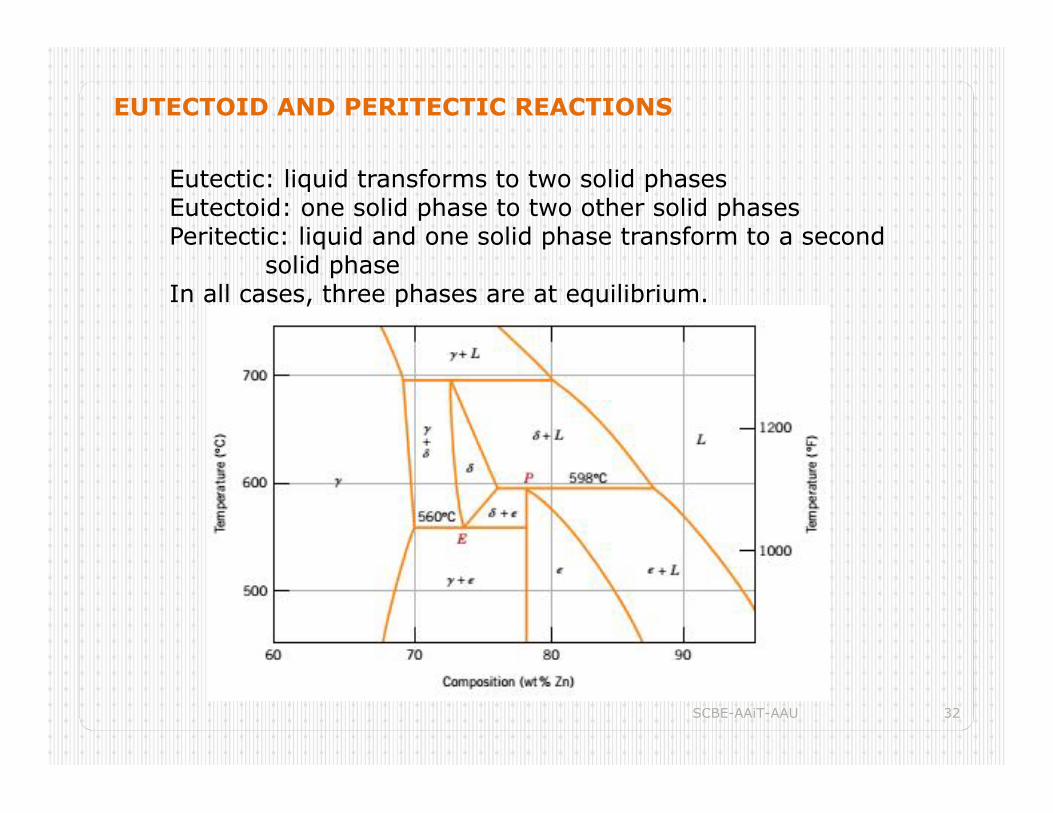
EUTECTOID AND PERITECTIC REACTIONS
Eutectic: liquid transforms to two solid phasesEutectoid: one solid phase to two other solid phasesPeritectic: liquid and one solid phase transform to a second
solid phaseIn all cases, three phases are at equilibrium.
SCBE-AAiT-AAU 33
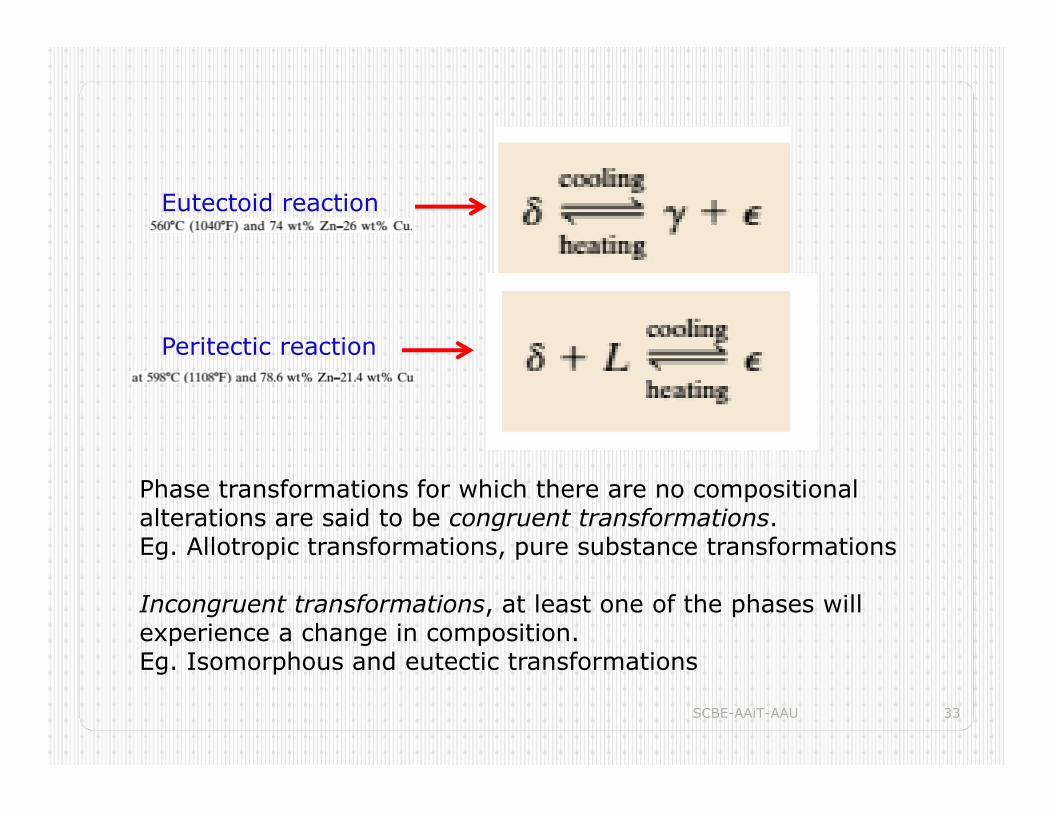
Eutectoid reaction
Peritectic reaction
Phase transformations for which there are no compositionalalterations are said to be congruent transformations.Eg. Allotropic transformations, pure substance transformations
Incongruent transformations, at least one of the phases will experience a change in composition. Eg. Isomorphous and eutectic transformations
SCBE-AAiT-AAU 34
THE GIBBS PHASE RULE
This rule represents a criterion for the number of phases that will coexist within a system at equilibrium, and is expressed by the simple equation:
P+F=C+N
Where: P is the number of phasesF is the degree of freedom or the no. of externally
controlled variablesC is the number of components in the systemN is the number of non-compositional variables
F is the number of variables that can be changedindependently without altering the number of phases thatcoexist at equilibrium.
SCBE-AAiT-AAU 35
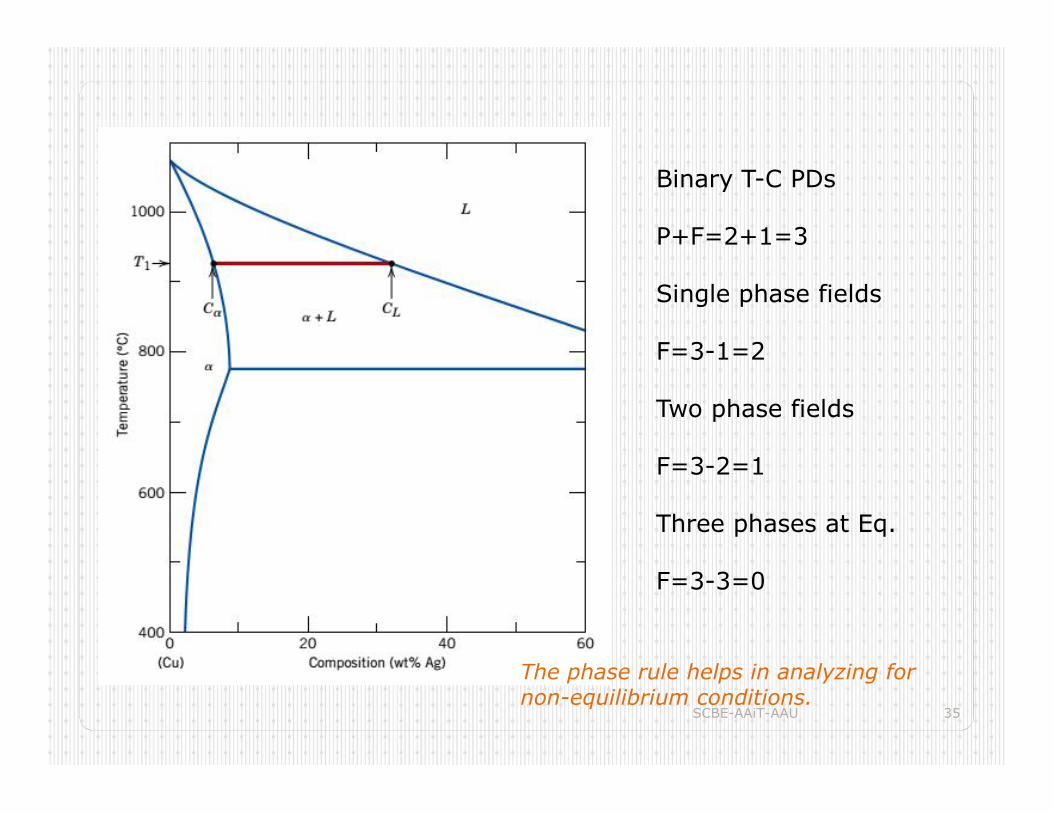
Binary T-C PDs
P+F=2+1=3
Single phase fields
F=3-1=2
Two phase fields
F=3-2=1
Three phases at Eq.
F=3-3=0
The phase rule helps in analyzing for non-equilibrium conditions.
SCBE-AAiT-AAU 36
The most important Phase Diagram


![IPv6-Gene[1].. Chap7](https://img.pdfslide.tips/doc/110x75/563dbb0d550346aa9aa9dcfc/ipv6-gene1-chap7.jpg)