Embed Size (px)
Citation preview
MTAT.03.159 / Lecture 07 / © Dietmar Pfahl 2018
MTAT.03.159: Software Testing
Lecture 07: Defect Estimation, Test Documentation, Organisation and Process Improvement Exam Preparation Dietmar Pfahl
email: [email protected] Spring 2018
MTAT.03.159 / Lecture 07 / © Dietmar Pfahl 2018
Structure of Lecture 07
• Defect Estimation • Test Planning & Documentation • Test Organisation • Test Process Improvement (TMMi) • Exam Preparation
MTAT.03.159 / Lecture 07 / © Dietmar Pfahl 2018
Structure of Lecture 07
• Defect Estimation • Test Planning & Documentation • Test Organisation • Test Process Improvement (TMMi) • Exam Preparation
MTAT.03.159 / Lecture 07 / © Dietmar Pfahl 2018
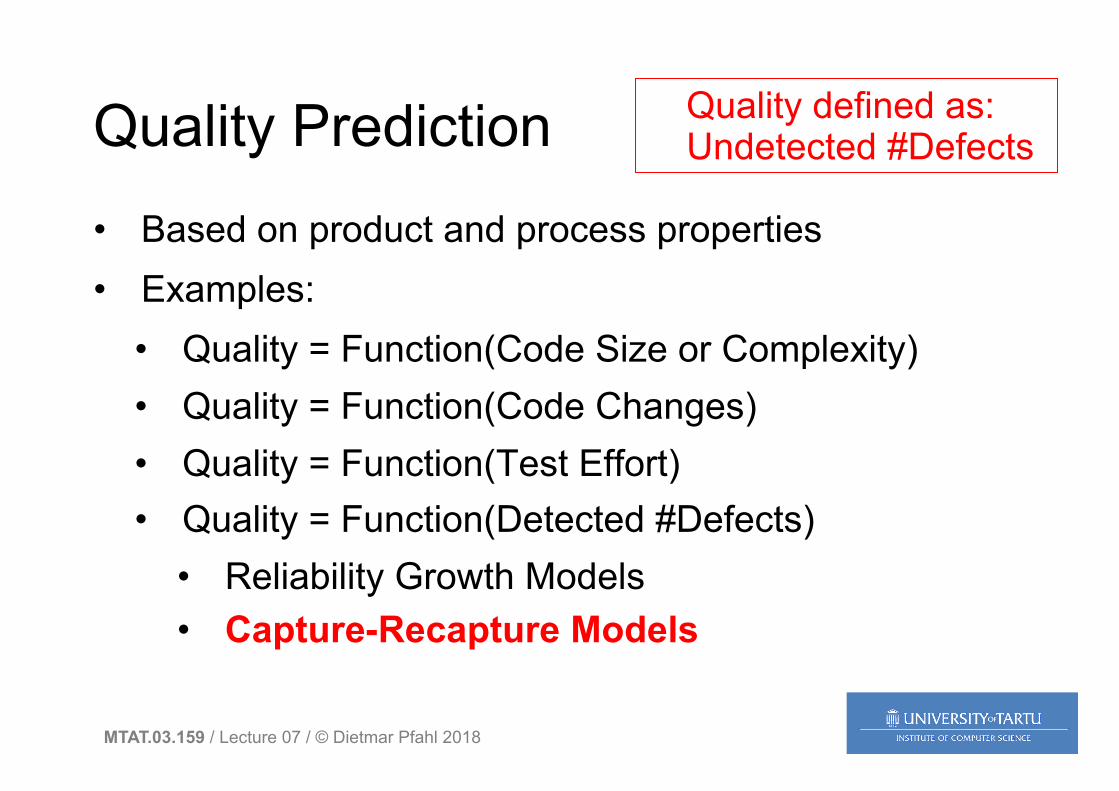
Quality Prediction • Based on product and process properties • Examples:
• Quality = Function(Code Size or Complexity) • Quality = Function(Code Changes) • Quality = Function(Test Effort) • Quality = Function(Detected #Defects)
• Reliability Growth Models • Capture-Recapture Models
Quality defined as: Undetected #Defects
MTAT.03.159 / Lecture 07 / © Dietmar Pfahl 2018
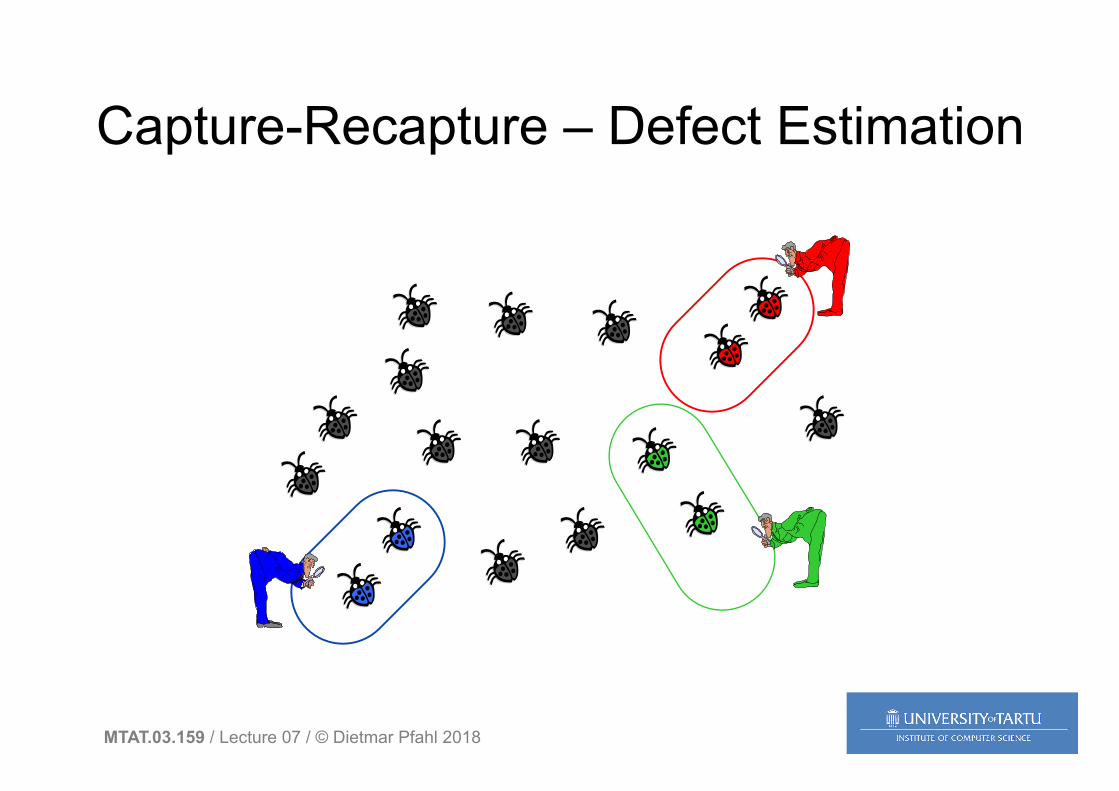
Capture-Recapture – Defect Estimation
MTAT.03.159 / Lecture 07 / © Dietmar Pfahl 2018
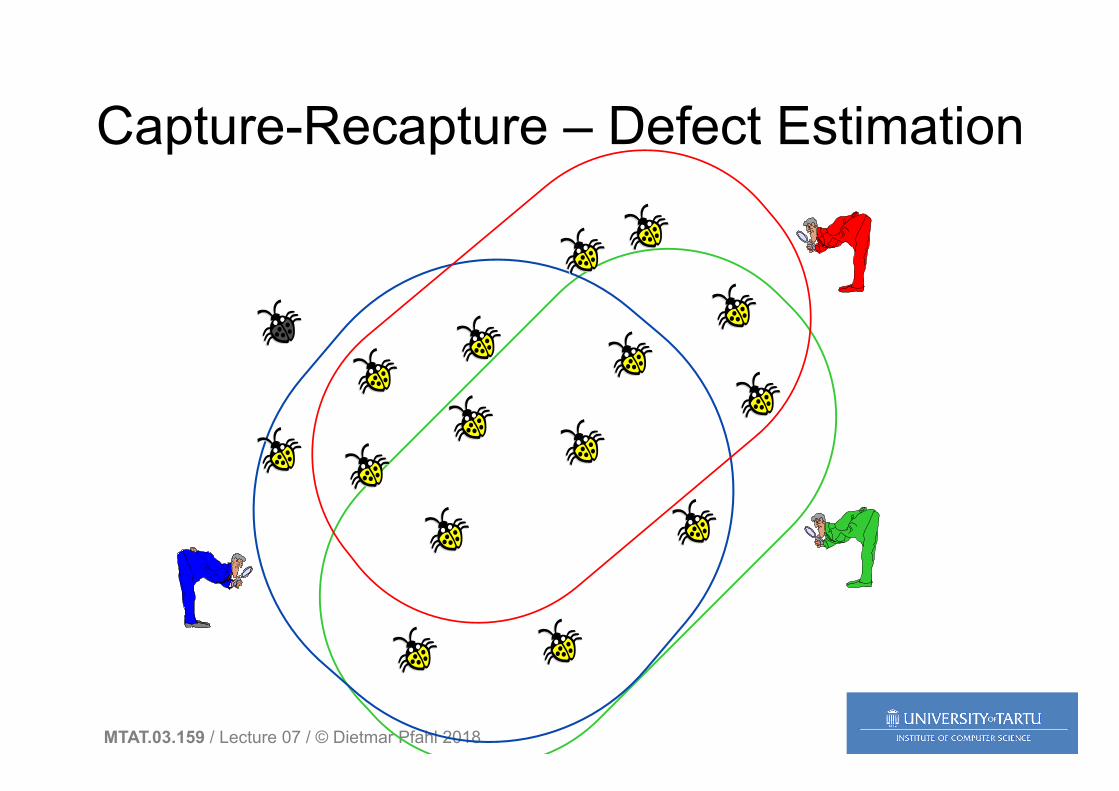
Capture-Recapture – Defect Estimation
MTAT.03.159 / Lecture 07 / © Dietmar Pfahl 2018
Capture-Recapture – Defect Estimation
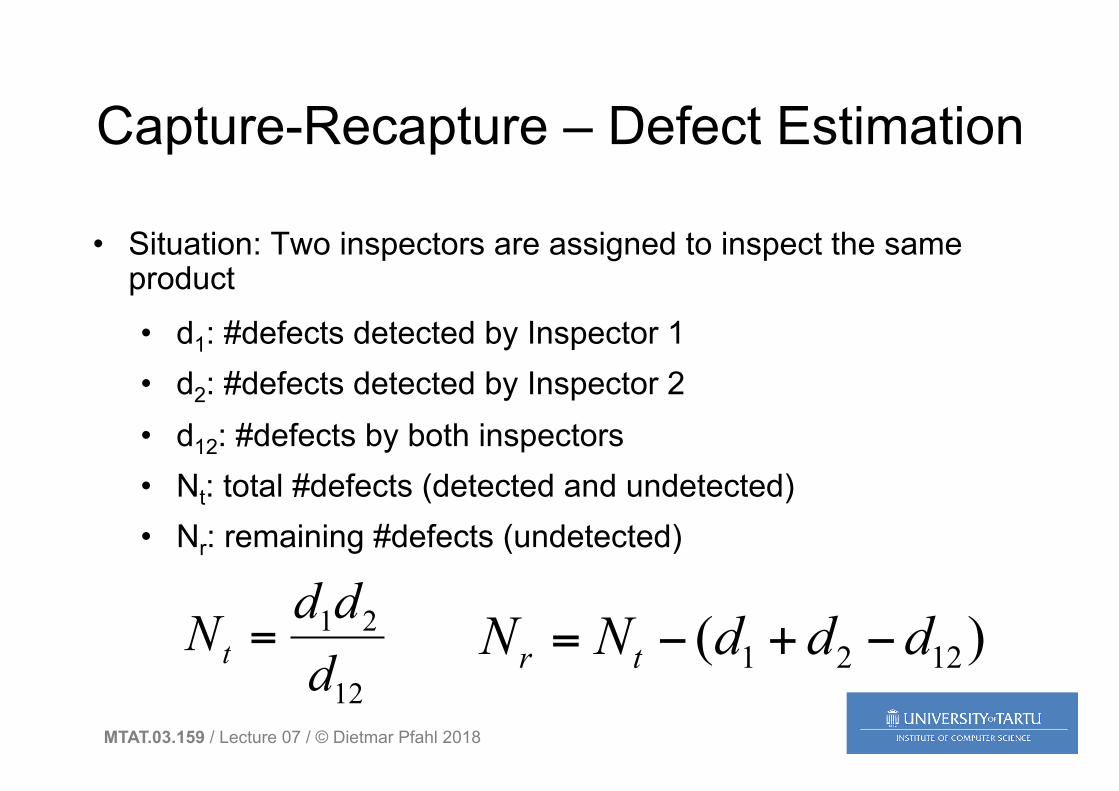
• Situation: Two inspectors are assigned to inspect the same product
• d1: #defects detected by Inspector 1 • d2: #defects detected by Inspector 2 • d12: #defects by both inspectors • Nt: total #defects (detected and undetected) • Nr: remaining #defects (undetected)
12
21
dddNt = )( 1221 dddNN tr −+−=
MTAT.03.159 / Lecture 07 / © Dietmar Pfahl 2018
Capture-Recapture – Example
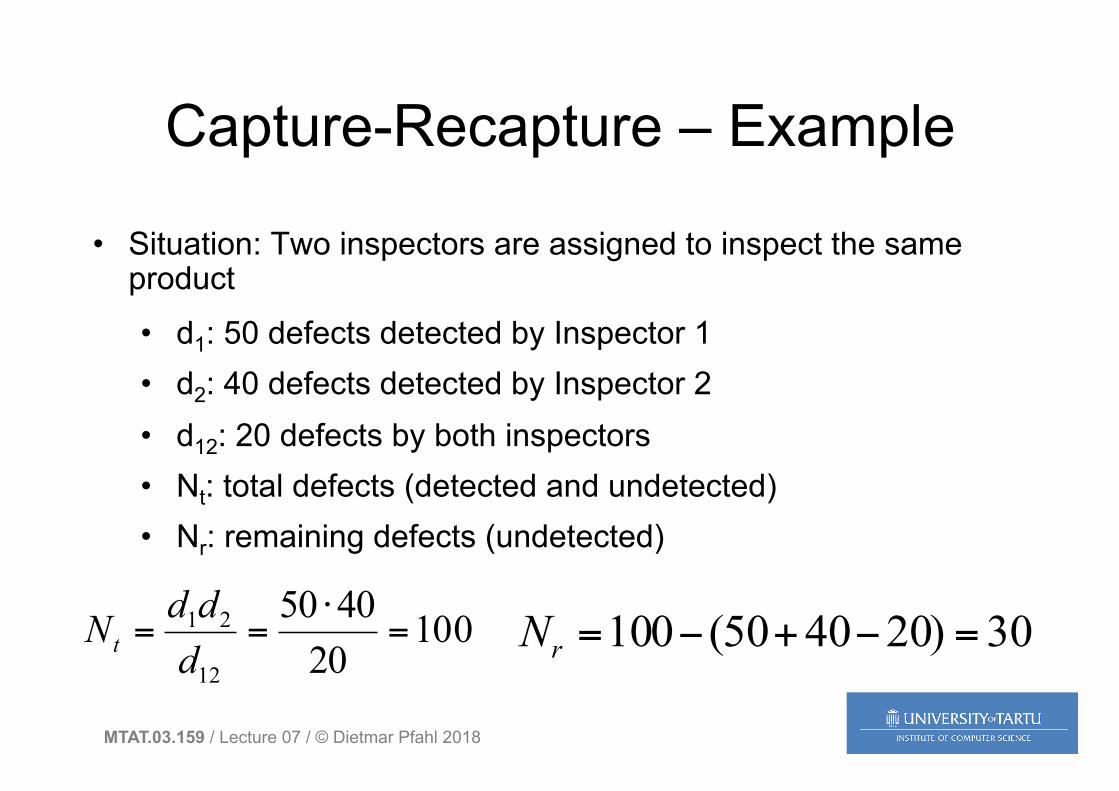
• Situation: Two inspectors are assigned to inspect the same product
• d1: 50 defects detected by Inspector 1 • d2: 40 defects detected by Inspector 2 • d12: 20 defects by both inspectors • Nt: total defects (detected and undetected) • Nr: remaining defects (undetected)
100204050
12
21 =⋅
==dddNt 30)204050(100 =−+−=rN
MTAT.03.159 / Lecture 07 / © Dietmar Pfahl 2018
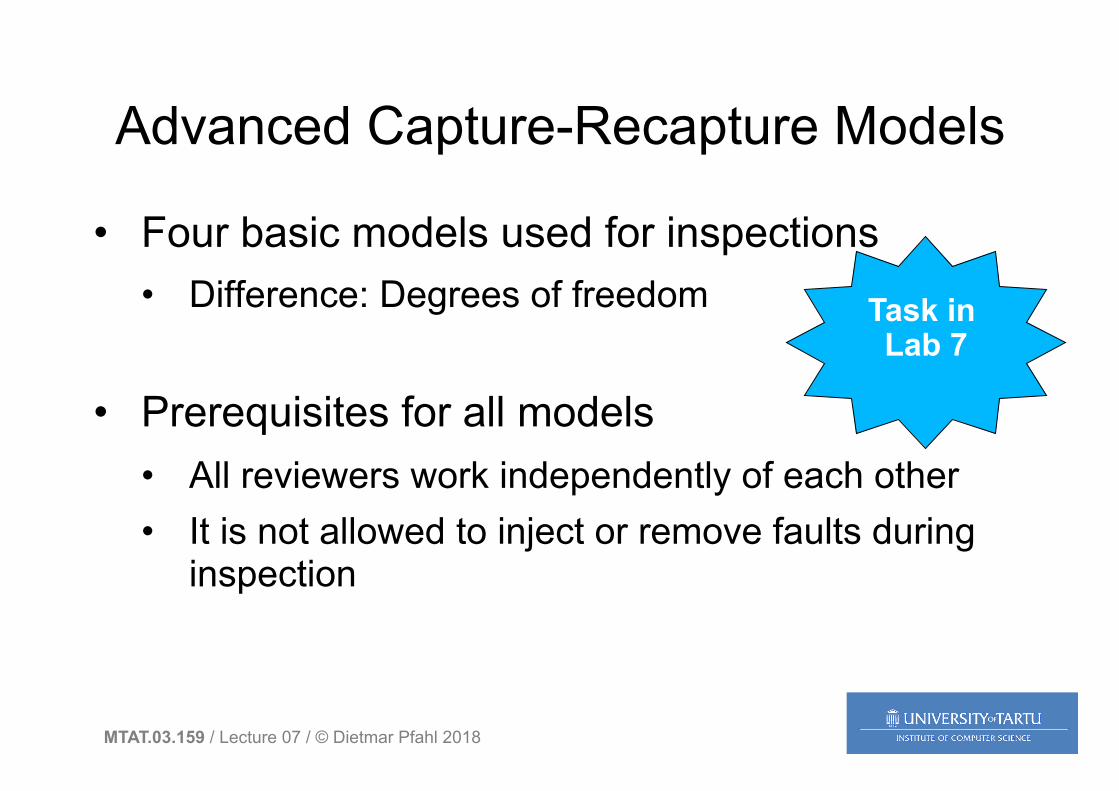
Advanced Capture-Recapture Models
• Four basic models used for inspections • Difference: Degrees of freedom
• Prerequisites for all models • All reviewers work independently of each other • It is not allowed to inject or remove faults during
inspection
Task in Lab 7
MTAT.03.159 / Lecture 07 / © Dietmar Pfahl 2018
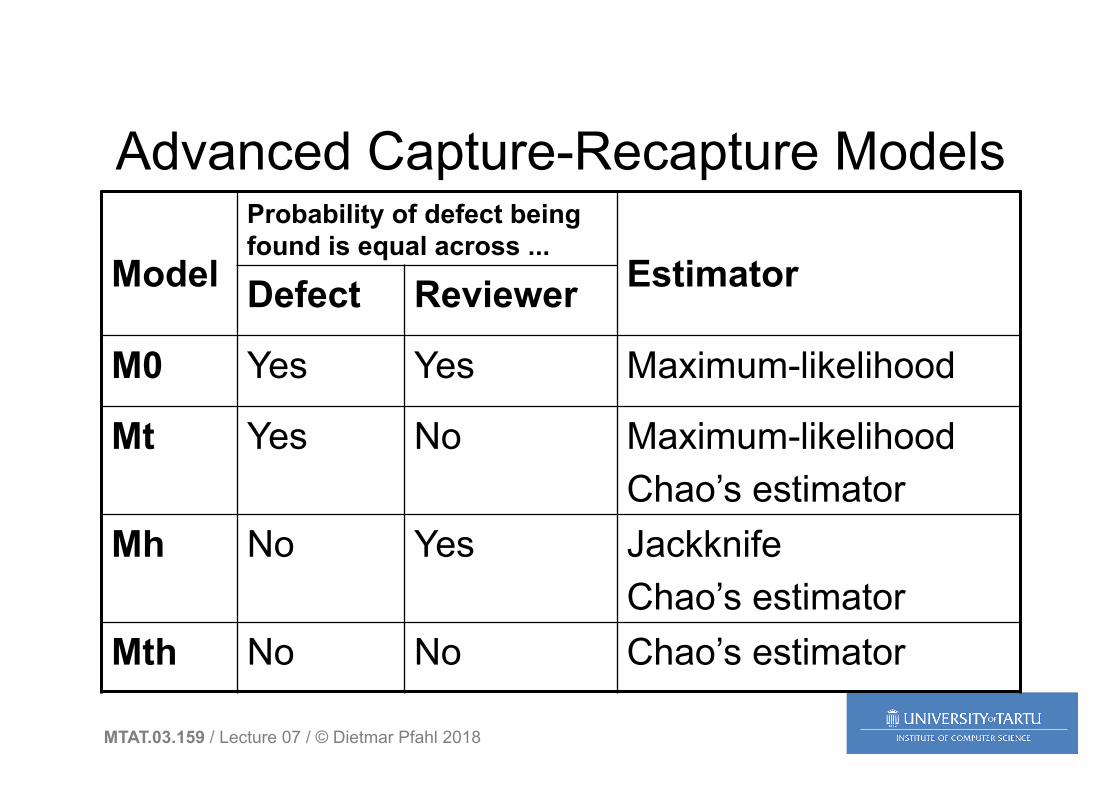
Advanced Capture-Recapture Models Model
Probability of defect being found is equal across ...
Estimator Defect Reviewer
M0 Yes Yes Maximum-likelihood
Mt Yes No Maximum-likelihood Chao’s estimator
Mh No Yes Jackknife Chao’s estimator
Mth No No Chao’s estimator
MTAT.03.159 / Lecture 07 / © Dietmar Pfahl 2018
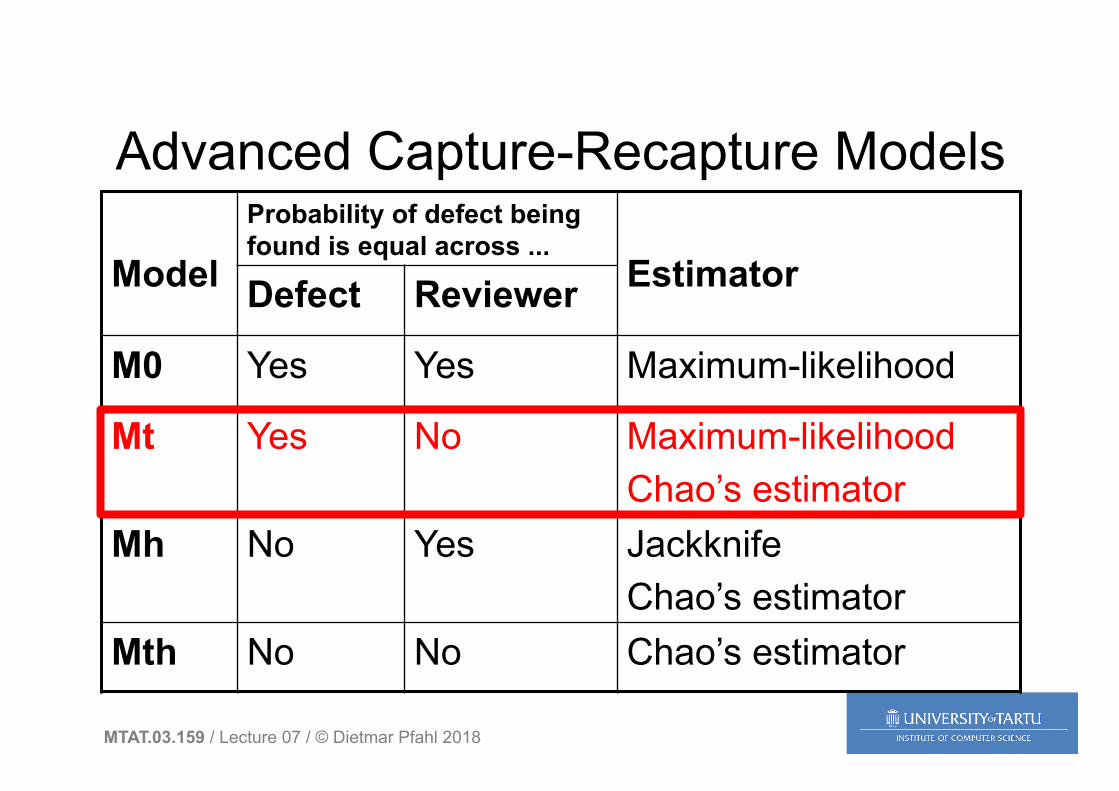
Advanced Capture-Recapture Models Model
Probability of defect being found is equal across ...
Estimator Defect Reviewer
M0 Yes Yes Maximum-likelihood
Mt Yes No Maximum-likelihood Chao’s estimator
Mh No Yes Jackknife Chao’s estimator
Mth No No Chao’s estimator
MTAT.03.159 / Lecture 07 / © Dietmar Pfahl 2018
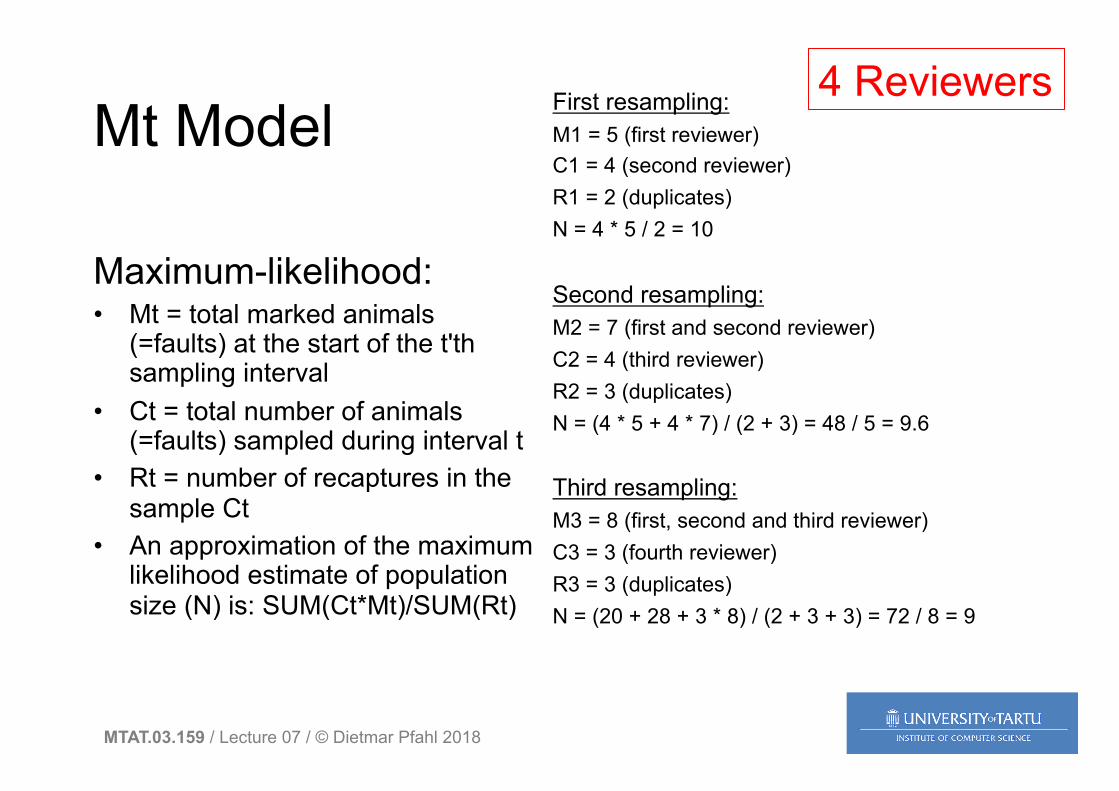
Mt Model
Maximum-likelihood: • Mt = total marked animals
(=faults) at the start of the t'th sampling interval
• Ct = total number of animals (=faults) sampled during interval t
• Rt = number of recaptures in the sample Ct
• An approximation of the maximum likelihood estimate of population size (N) is: SUM(Ct*Mt)/SUM(Rt)
First resampling: M1 = 5 (first reviewer) C1 = 4 (second reviewer) R1 = 2 (duplicates) N = 4 * 5 / 2 = 10 Second resampling: M2 = 7 (first and second reviewer) C2 = 4 (third reviewer) R2 = 3 (duplicates) N = (4 * 5 + 4 * 7) / (2 + 3) = 48 / 5 = 9.6 Third resampling: M3 = 8 (first, second and third reviewer) C3 = 3 (fourth reviewer) R3 = 3 (duplicates) N = (20 + 28 + 3 * 8) / (2 + 3 + 3) = 72 / 8 = 9
4 Reviewers
MTAT.03.159 / Lecture 07 / © Dietmar Pfahl 2018
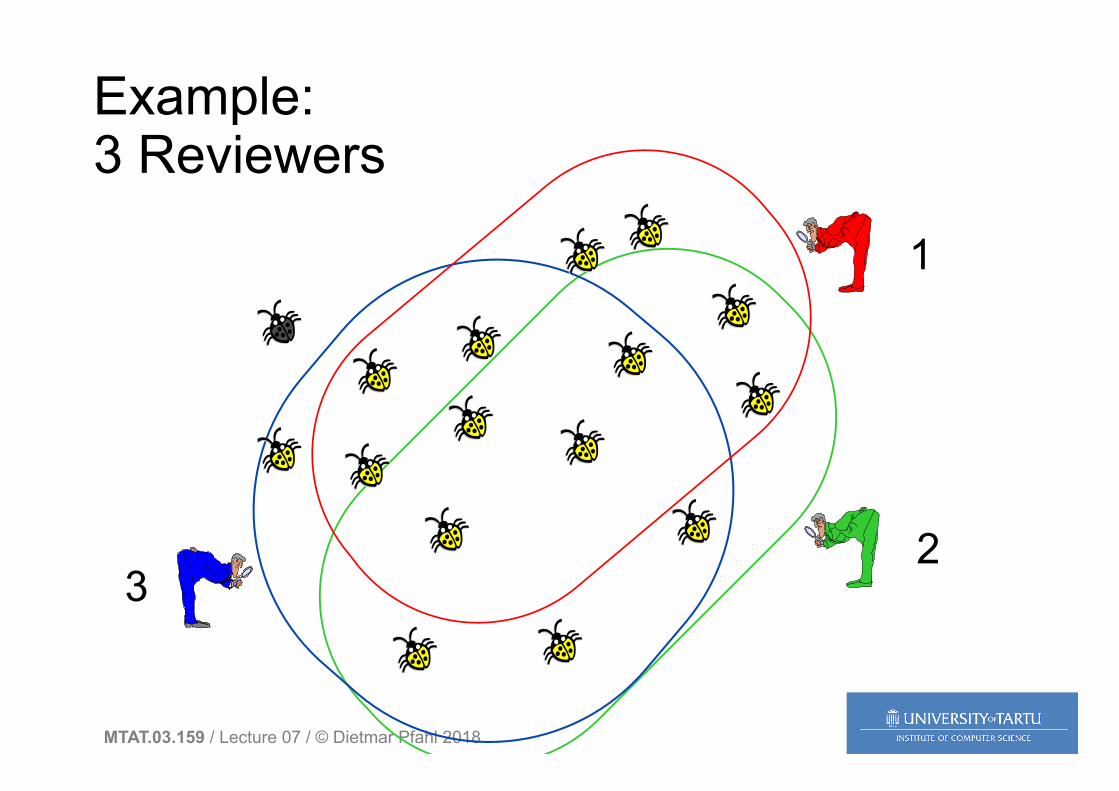
Example: 3 Reviewers
1
2 3
MTAT.03.159 / Lecture 07 / © Dietmar Pfahl 2018
Example:
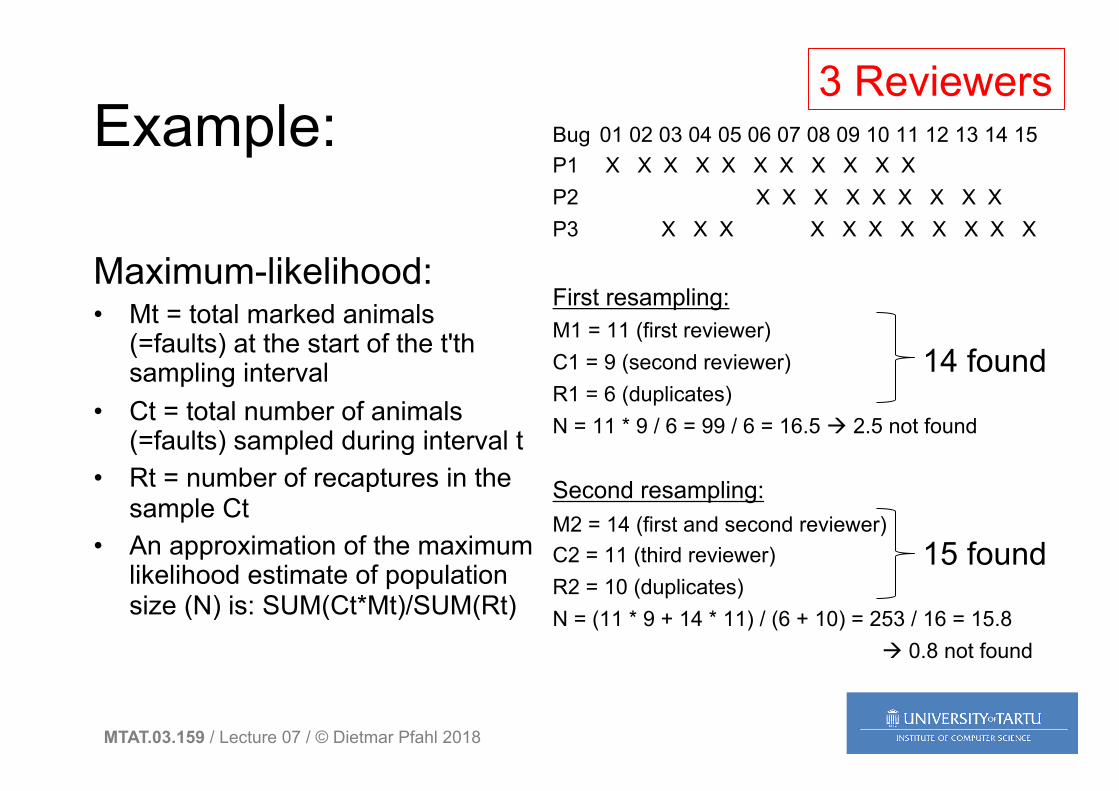
Maximum-likelihood: • Mt = total marked animals
(=faults) at the start of the t'th sampling interval
• Ct = total number of animals (=faults) sampled during interval t
• Rt = number of recaptures in the sample Ct
• An approximation of the maximum likelihood estimate of population size (N) is: SUM(Ct*Mt)/SUM(Rt)
Bug 01 02 03 04 05 06 07 08 09 10 11 12 13 14 15 P1 X X X X X X X X X X X P2 X X X X X X X X X P3 X X X X X X X X X X X First resampling: M1 = 11 (first reviewer) C1 = 9 (second reviewer) R1 = 6 (duplicates) N = 11 * 9 / 6 = 99 / 6 = 16.5 à 2.5 not found Second resampling: M2 = 14 (first and second reviewer) C2 = 11 (third reviewer) R2 = 10 (duplicates) N = (11 * 9 + 14 * 11) / (6 + 10) = 253 / 16 = 15.8
à 0.8 not found
3 Reviewers
14 found
15 found
MTAT.03.159 / Lecture 07 / © Dietmar Pfahl 2018
Lab 7 – Document Inspection & Defect Prediction
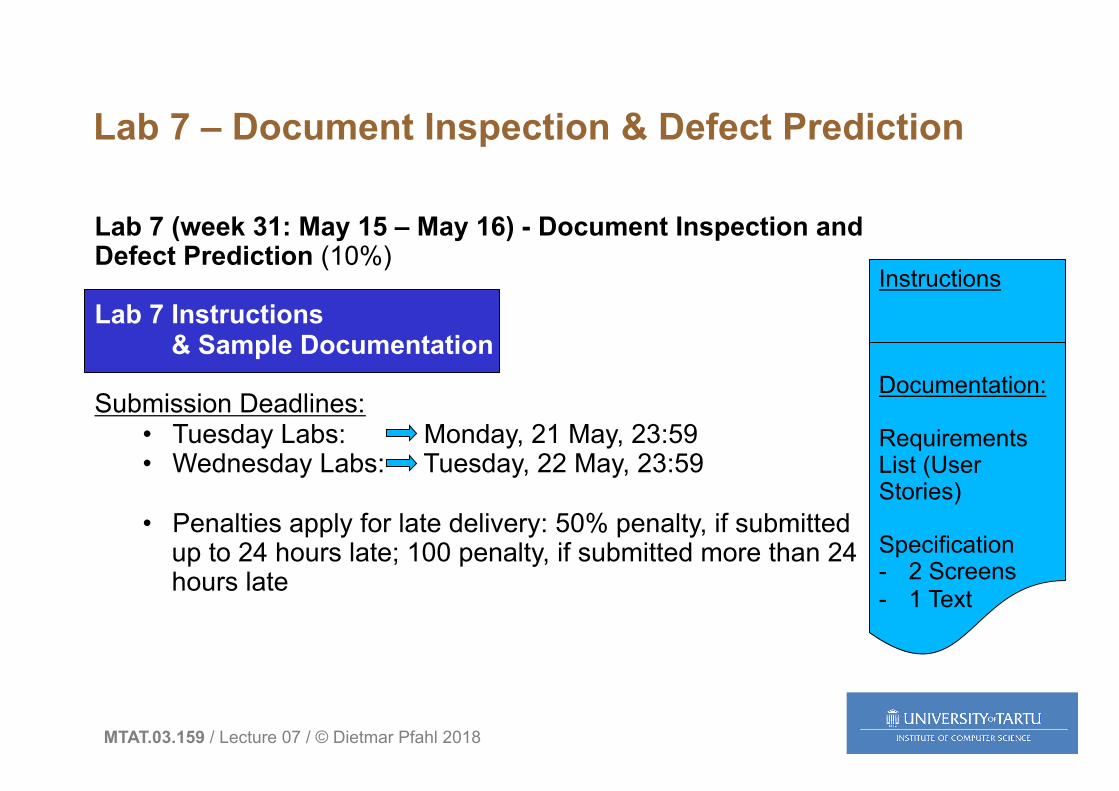
Lab 7 (week 31: May 15 – May 16) - Document Inspection and Defect Prediction (10%) Lab 7 Instructions Lab 4 & Sample Documentation Submission Deadlines:
• Tuesday Labs: Monday, 21 May, 23:59 • Wednesday Labs: Tuesday, 22 May, 23:59
• Penalties apply for late delivery: 50% penalty, if submitted up to 24 hours late; 100 penalty, if submitted more than 24 hours late
Instructions Documentation: Requirements List (User Stories) Specification - 2 Screens - 1 Text
MTAT.03.159 / Lecture 07 / © Dietmar Pfahl 2018
Student Pair
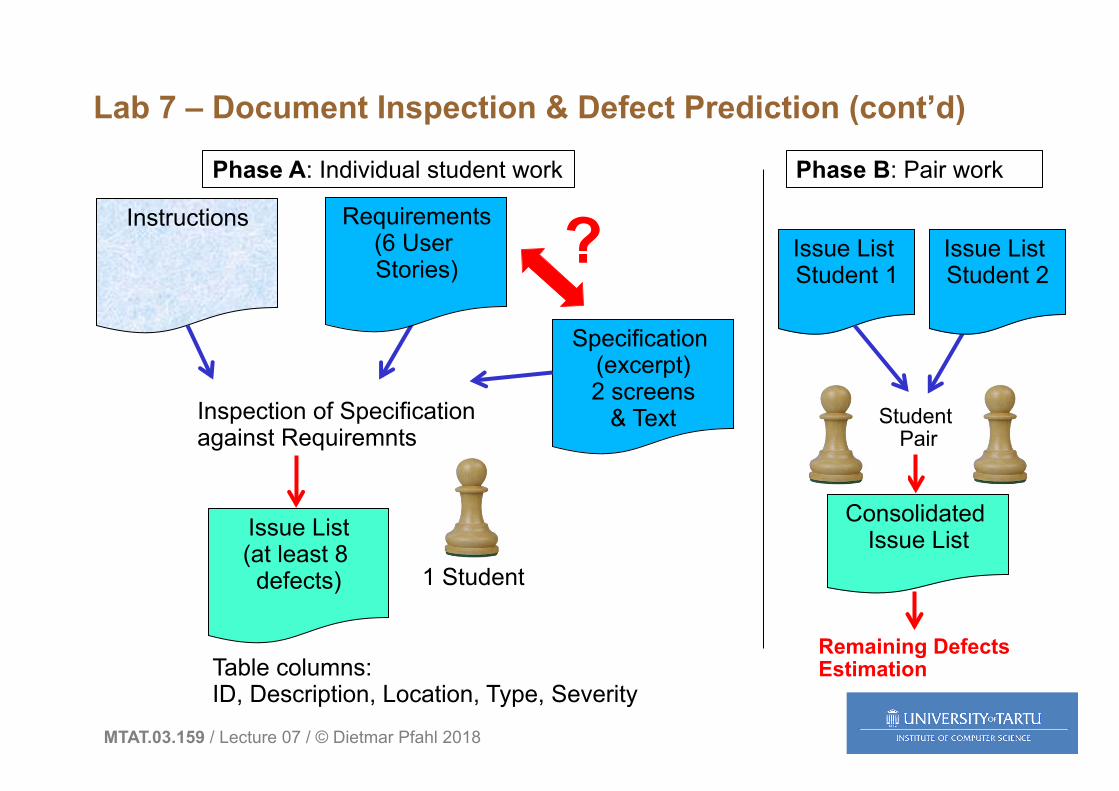
Lab 7 – Document Inspection & Defect Prediction (cont’d)
Instructions
Inspection of Specification against Requiremnts
Table columns: ID, Description, Location, Type, Severity
Requirements (6 User Stories)
Specification (excerpt) 2 screens
& Text
?
Issue List (at least 8 defects)
Phase A: Individual student work Phase B: Pair work
1 Student
Issue List Student 1
Issue List Student 2
Consolidated Issue List
Remaining Defects Estimation
MTAT.03.159 / Lecture 07 / © Dietmar Pfahl 2018
Lab 7 – Document Inspection & Defect Prediction (cont’d)
Lab 7: Must work in
pairs to be able to get full marks!
MTAT.03.159 / Lecture 07 / © Dietmar Pfahl 2018
Structure of Lecture 07
• Defect Estimation • Test Planning & Documentation • Test Organisation • Test Process Improvement (TMMi) • Exam Preparation
MTAT.03.159 / Lecture 07 / © Dietmar Pfahl 2018
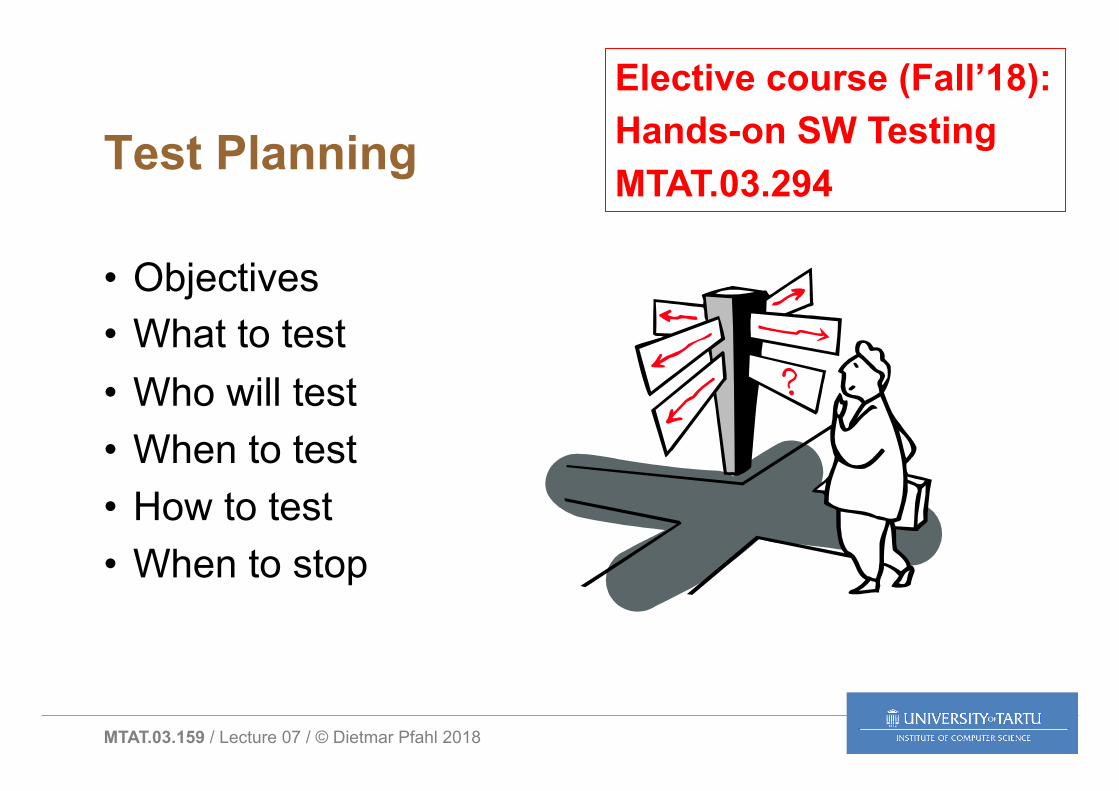
Test Planning
• Objectives • What to test • Who will test • When to test • How to test • When to stop
Elective course (Fall’18): Hands-on SW Testing MTAT.03.294
MTAT.03.159 / Lecture 07 / © Dietmar Pfahl 2018
2257.6 Report ing Test Results |
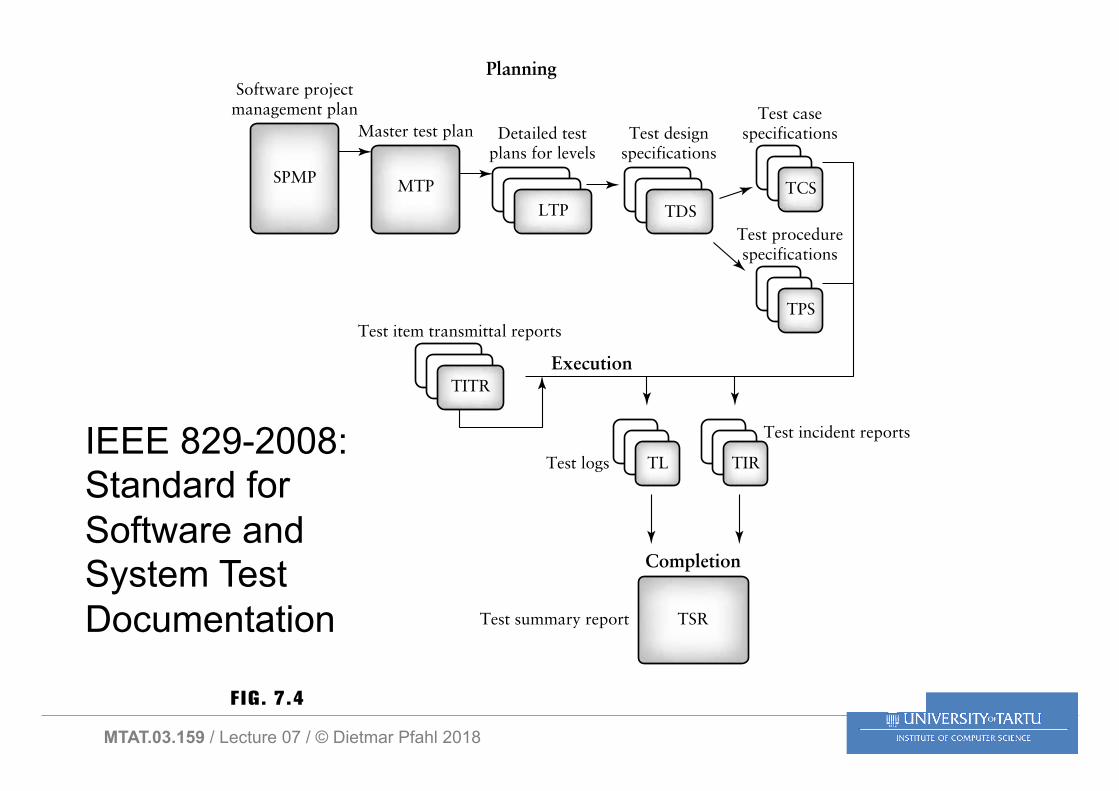
Planning
Execution
Completion
SPMP
Software projectmanagement plan
Master test plan Test designspecifications
Detailed testplans for levels
Test casespecifications
Test procedurespecifications
MTPLTP TDS
TCS
TPSTest item transmittal reports
Test incident reports
Test logs TL TIR
Test summary report TSR
TITR
FIG. 7.4
Test-related documents asrecommended by IEEE [5].
document [5]. In the figure it is assumed that an overall Master Test Plan(MTP) is developed at first, and this is followed by more detailed testplans for the different levels of testing, unit, integration, system, accep-tance, and so on. From the figure and the discussion in this chapter, it isapparent that the preparation of a complete set of test documents thatfully conform to IEEE standards requires many resources and an invest-ment of a great deal of time and effort. Not all organizations require suchan extensive set of test-related documents. Each organization should de-scribe, as part of its testing or quality standards, which test-related doc-uments should be prepared. The content and format for each documentshould be included in the standards. Very often, a subset of the IEEE-recommended documents is satisfactory, especially if the organization issmall and there is no separate testing group.
IEEE 829-2008: Standard for Software and System Test Documentation
MTAT.03.159 / Lecture 07 / © Dietmar Pfahl 2018
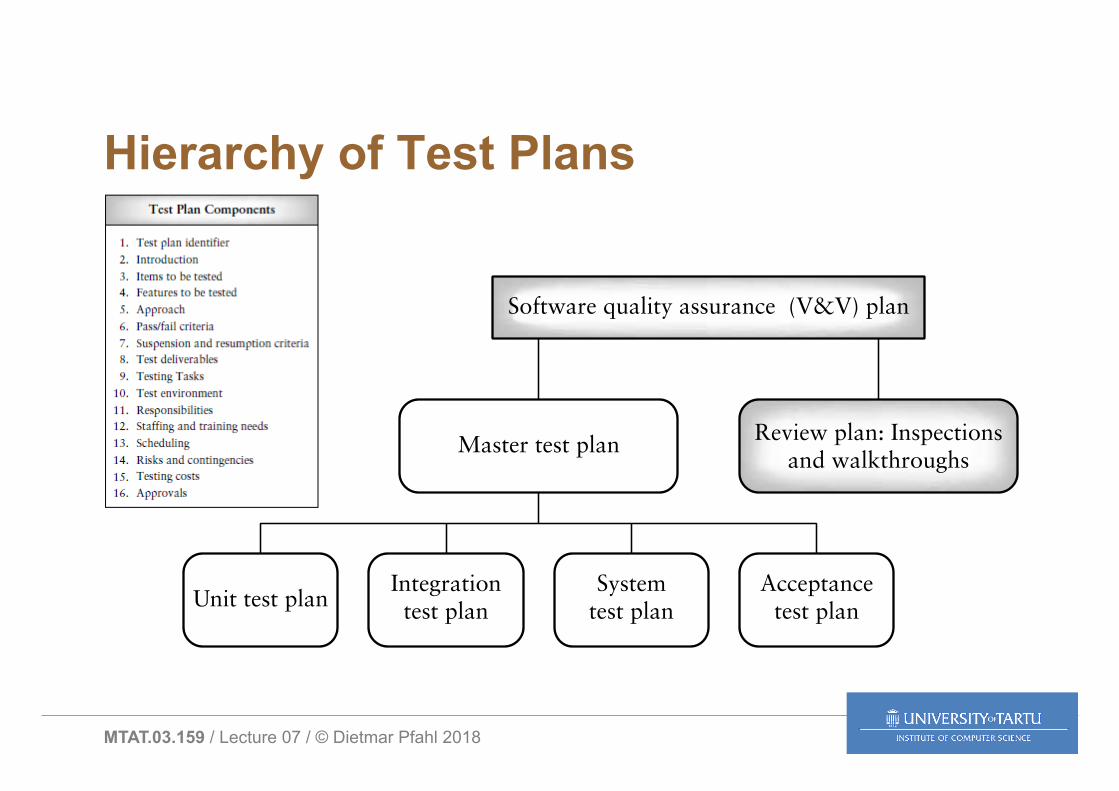
Hierarchy of Test Plans 1997.2 Test Planning |
Software quality assurance (V&V) plan
Master test plan
Unit test planIntegrationtest plan
Systemtest plan
Acceptancetest plan
Review plan: Inspectionsand walkthroughs
FIG. 7.1
A hierarchy of test plans.
document. Depending on organizational policy, another level of the hi-erarchy could contain a separate test plan for unit, integration, system,and acceptance tests. In some organizations these are part of the mastertest plan. The level-based plans give a more detailed view of testing ap-propriate to that level. The IEEE Software Engineering Standards Col-lection has useful descriptions for many of these plans and other test andquality-related documents such as verification and validation plans[4–7].
The persons responsible for developing test plans depend on the typeof plan under development. Usually staff from one or more groups co-operates in test plan development. For example, the master test plan forexecution-based testing may be developed by the project manager, espe-cially if there is no separate testing group. It can also be developed by atester or software quality assurance manager, but always requires coop-eration and input from the project manager. It is essential that develop-ment and testing activities be coordinated to allow the project to progresssmoothly. The type and organization of the test plan, the test plan hier-archy, and who is responsible for development should be specified inorganizational standards or software quality assurance documents.
The remainder of this chapter focuses on the development of a gen-eral-purpose execution-based test plan that will be referred to as a “testplan.” The description of the test plan contents is based on a discussionof recommended test plan components appearing in the IEEE Standardfor Software Test Documentation: IEEE/ANSI Std 829-1983 [5]. This

MTAT.03.159 / Lecture 07 / © Dietmar Pfahl 2018
Test plan according to IEEE Std 829-2008 (Appendix II)
a) Test plan identifier b) Introduction c) Test items d) Features to be tested e) Features not to be tested f) Approach g) Item pass/fail criteria h) Suspension criteria and
resumption requirements
i) Test deliverables j) Testing tasks k) Environmental needs l) Responsibilities m) Staffing and training needs n) Schedule o) Risks and contingencies p) Approvals
MTAT.03.159 / Lecture 07 / © Dietmar Pfahl 2018
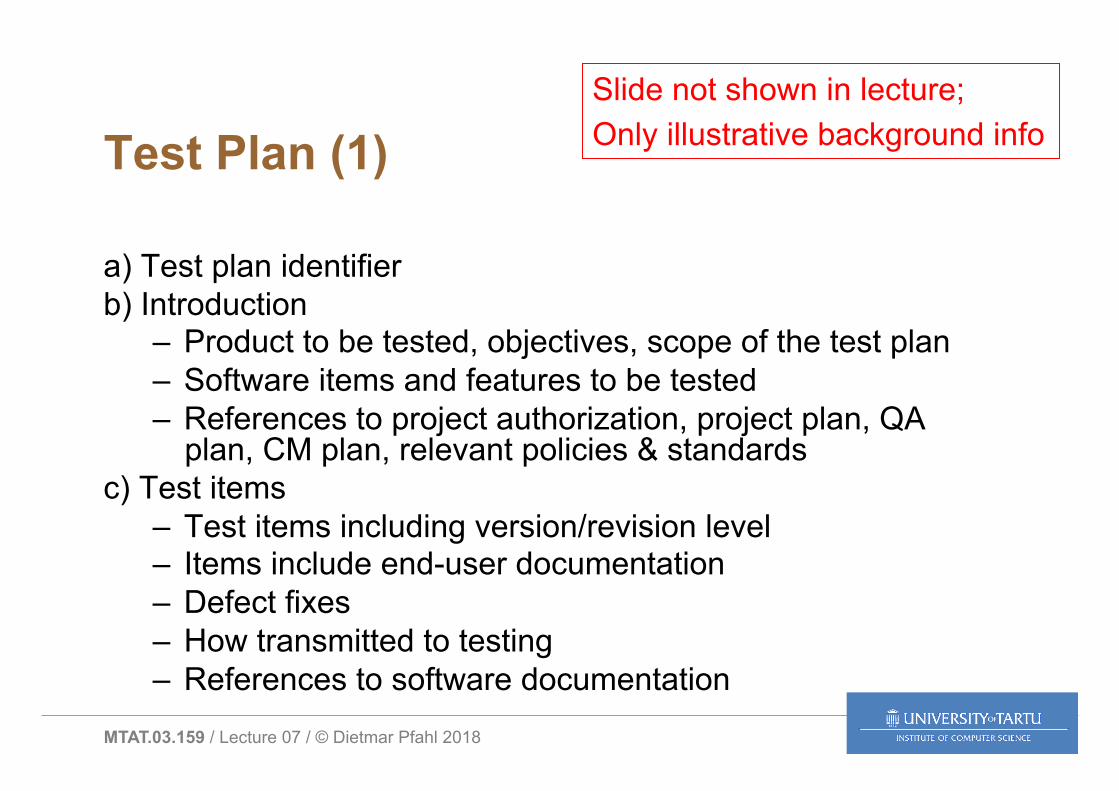
Test Plan (1)
a) Test plan identifier b) Introduction
– Product to be tested, objectives, scope of the test plan – Software items and features to be tested – References to project authorization, project plan, QA
plan, CM plan, relevant policies & standards c) Test items
– Test items including version/revision level – Items include end-user documentation – Defect fixes – How transmitted to testing – References to software documentation
Slide not shown in lecture; Only illustrative background info

MTAT.03.159 / Lecture 07 / © Dietmar Pfahl 2018
Test Plan (2)
d) Features to be tested – Identify test design / specification techniques – Reference requirements or other specs
e) Features not to be tested – Deferred features, environment combinations, … – Reasons for exclusion
f) Approach – How you are going to test this system
• Activities, techniques and tools – Detailed enough to estimate – Completion criteria (e.g. coverage, reliability) – Identify constraints (environment, staff, deadlines)
Slide not shown in lecture; Only illustrative background info
MTAT.03.159 / Lecture 07 / © Dietmar Pfahl 2018
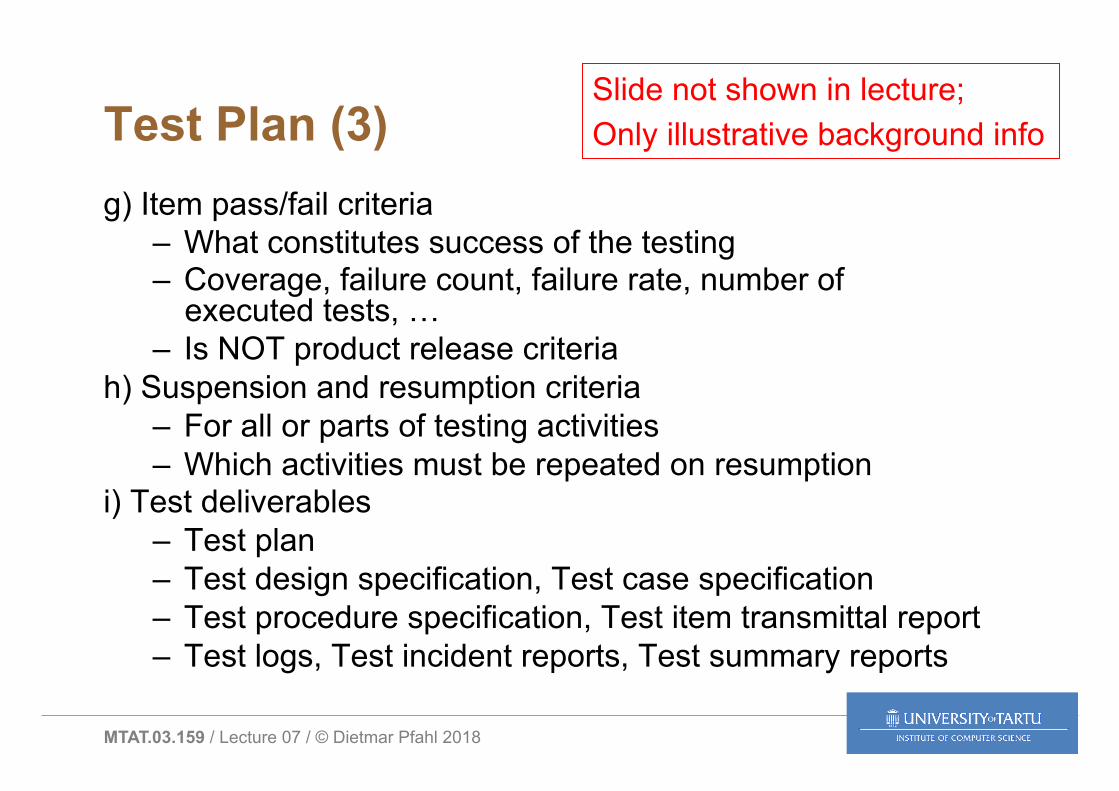
Test Plan (3) g) Item pass/fail criteria
– What constitutes success of the testing – Coverage, failure count, failure rate, number of
executed tests, … – Is NOT product release criteria
h) Suspension and resumption criteria – For all or parts of testing activities – Which activities must be repeated on resumption
i) Test deliverables – Test plan – Test design specification, Test case specification – Test procedure specification, Test item transmittal report – Test logs, Test incident reports, Test summary reports
Slide not shown in lecture; Only illustrative background info
MTAT.03.159 / Lecture 07 / © Dietmar Pfahl 2018
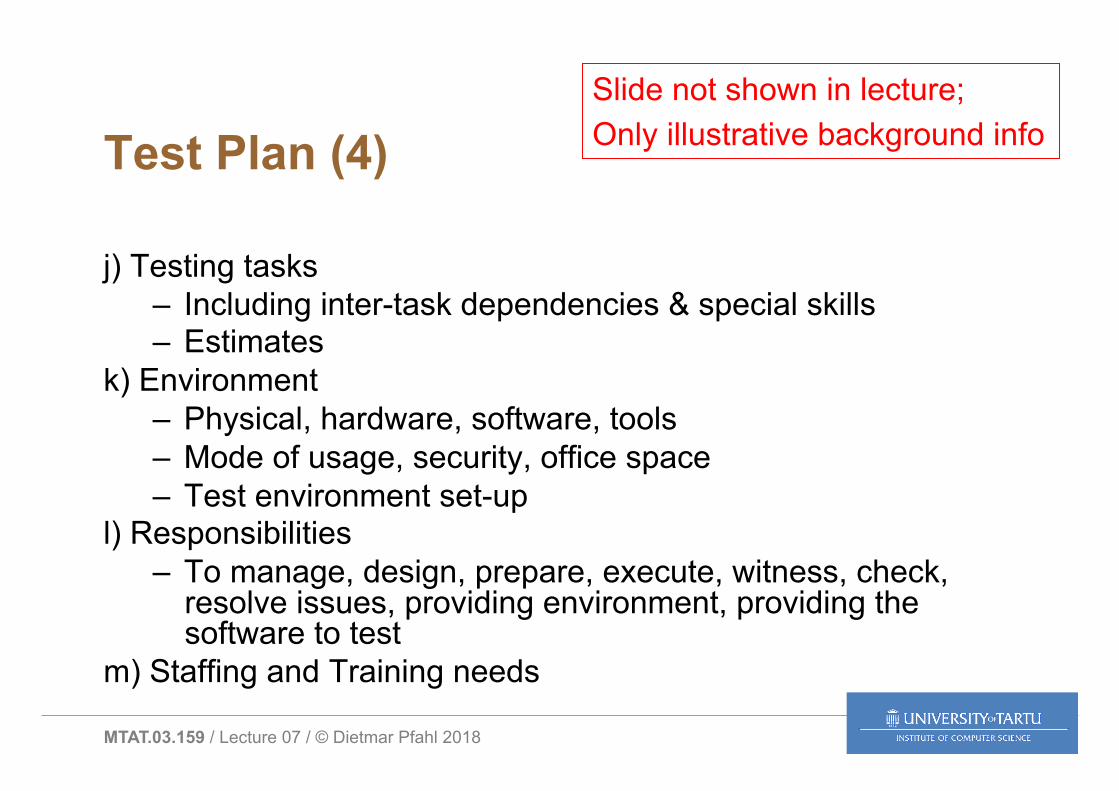
Test Plan (4)
j) Testing tasks – Including inter-task dependencies & special skills – Estimates
k) Environment – Physical, hardware, software, tools – Mode of usage, security, office space – Test environment set-up
l) Responsibilities – To manage, design, prepare, execute, witness, check,
resolve issues, providing environment, providing the software to test
m) Staffing and Training needs
Slide not shown in lecture; Only illustrative background info
MTAT.03.159 / Lecture 07 / © Dietmar Pfahl 2018
Test Plan (5)
n) Schedule – Test milestones in project schedule – Item transmittal milestones – Additional test milestones (environment ready) – What resources are needed when
o) Risks and Contingencies – Testing project risks – Contingency and mitigation plan for each identified risk
p) Approvals – Names and when approved
Slide not shown in lecture; Only illustrative background info

MTAT.03.159 / Lecture 07 / © Dietmar Pfahl 2018
Test Case Specification – Why? • Organization
– All testers and other project team members can review and use test cases effectively
• Repeatability – Know what test cases were last run and how so that you could
repeat the same tests
• Tracking – What requirements or features are tested? – Tracking information’s value depends on the quality of the test
cases
• Evidence of testing – Confidence (quality) – Detect failures
TCS
MTAT.03.159 / Lecture 07 / © Dietmar Pfahl 2018
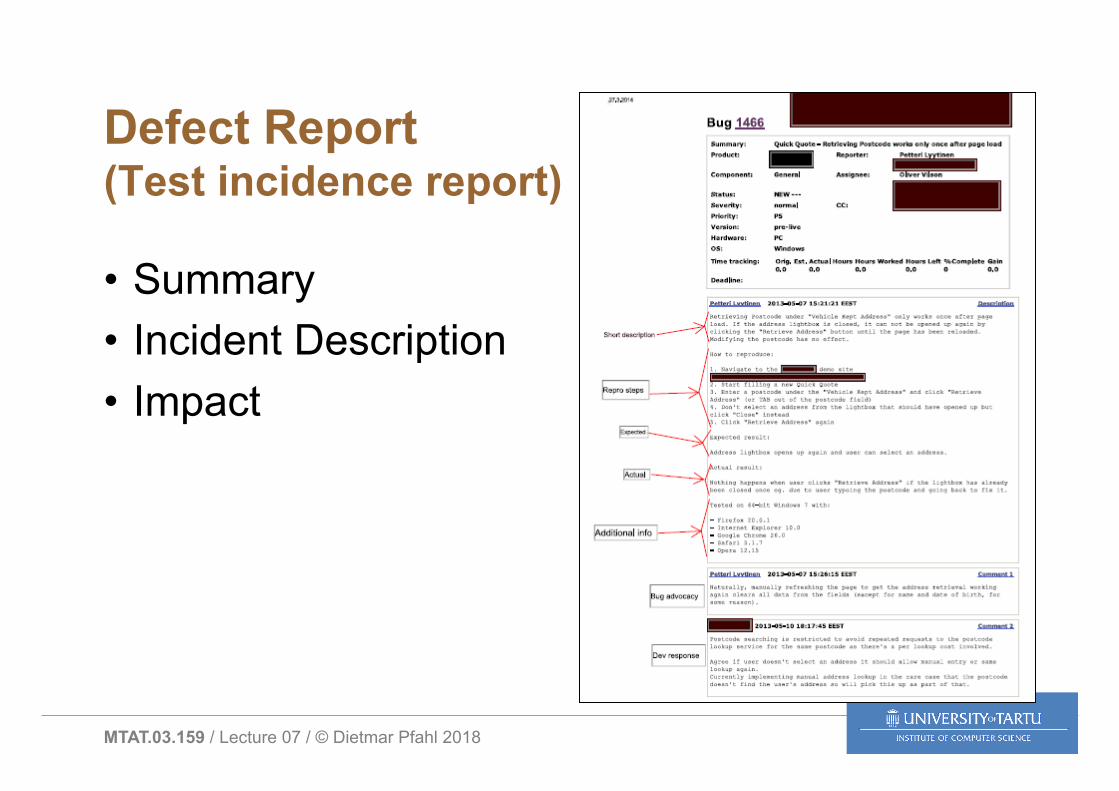
Defect Report (Test incidence report)
• Summary • Incident Description • Impact

MTAT.03.159 / Lecture 07 / © Dietmar Pfahl 2018
Defect Report (Test incidence report)
Summary
• This is a summation/description of the actual incident.
– Provides enough details to enable others to understand how the incident was discovered and any relevant supporting information
• References to: – Test Procedure used to
discover the incident – Test Case Specifications that
will provide the information to repeat the incident
– Test logs showing the actual execution of the test cases and procedures
– Any other supporting materials, trace logs, memory dumps/maps etc.
MTAT.03.159 / Lecture 07 / © Dietmar Pfahl 2018
Defect Report (Test incidence report)
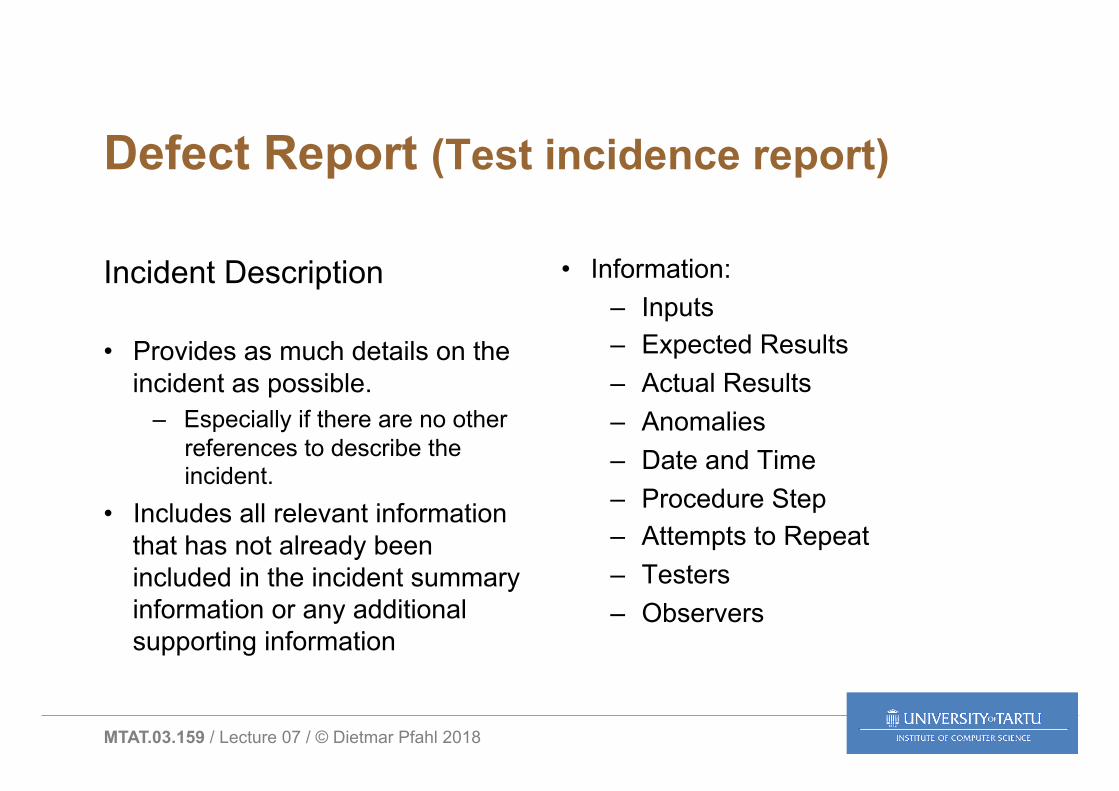
Incident Description
• Provides as much details on the incident as possible.
– Especially if there are no other references to describe the incident.
• Includes all relevant information that has not already been included in the incident summary information or any additional supporting information
• Information: – Inputs – Expected Results – Actual Results – Anomalies – Date and Time – Procedure Step – Attempts to Repeat – Testers – Observers

MTAT.03.159 / Lecture 07 / © Dietmar Pfahl 2018
Defect Report (Test incidence report)
Impact
• Describe the actual/potential damage caused by the incident.
– Severity – Priority
• Severity and Priority need to be defined so as to ensure consistent use and interpretation, for example:
• Severity – The potential impact to the system
– Mission Critical - Application will not function or system fails
– Major - Severe problems but possible to work around
– Minor – Does not impact the functionality or usability of the process but is not according to requirements/design specifications
• Priority – The order in which the incidents are to be addressed
– Immediate – Must be fixed as soon as possible
– Delayed – System is usable but incident must be fixed prior to next level of test or shipment
– Deferred – Defect can be left in if necessary doe to time or costs
MTAT.03.159 / Lecture 07 / © Dietmar Pfahl 2018
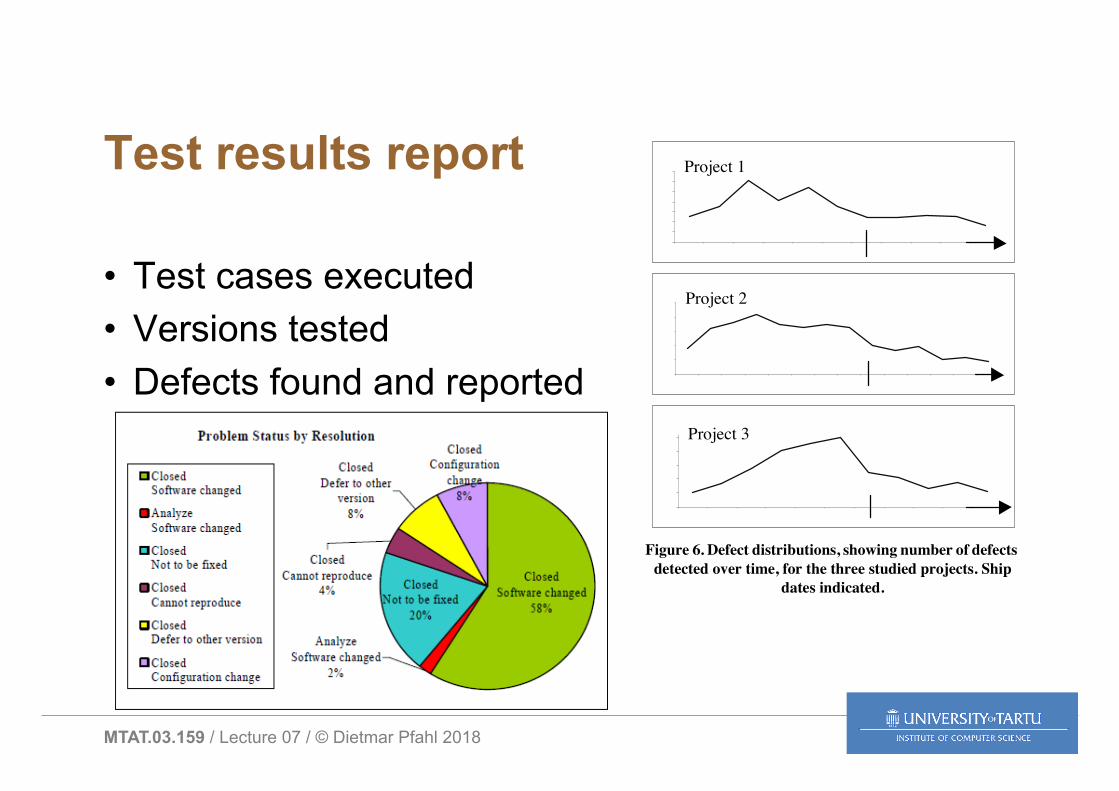
Test results report
• Test cases executed • Versions tested • Defects found and reported
date. The percentage of defects detected in each test activity com-pared to the total number of defects detected at ship date, in eachof the three projects, are given in Table 3. By truncating the datasets by the ship date, dissimilarities between the three projectswere decreased, and the three projects could be compared withoutregard to the project decisions made after ship date, see Figure 4.These decisions were very project specific, sometimes resulting innew functionality development, other times not, which made it dif-ficult to draw any inferences between the projects after this date.Also, by the truncation, confusion of which project a defect be-longed to could be handled. For some feature groups the develop-ment continued in a later project, using the same modules, i.e.certain components were part of more than one product in theproduct-line.
The distribution of defects found by the test activities appeared tobe quite stable across the three projects, as can be seen in Table 3.However, a �2-test [20], with the three projects as samples do notshow on any statistical similarities at a significance level of � =0.05.
In addition, other milestones in the projects were used as basis forcomparisons. Specifically the dates for finished regressions testperiods reflected commonalities between the projects. Until thefirst regression period, mainly function testers have reported de-fects. System test do start before, although the main part of the re-sources are spent after this point in time. What happened until thispoint in time, equivalent to milestone Alpha, was very similar be-tween the projects. In Table 4 the number of defects detected byfunction test until the milestone Alpha, divided by the total numberof defects detected by function test until the ship-date for theprojects, is shown. It can be noticed that this ratio is quite stable
over the three projects, and in the �2-test the hypothesis of no dif-ference between the samples could not be rejected.
5.2. Defect detection per feature groupIn the second exploratory case study cycle (cycle 3), the defectdata was separated for each individual feature group. The analysisshowed that at this level of detail, the variations between theprojects were too extensive to make any conclusions for each indi-vidual feature group, which was confirmed by statistical tests. Forsome groups, trends could be observed and the pattern was similarfor the three projects, while other groups showed an ad hoc behav-ior. The defect distribution for a subset of the feature groups inproject 2 is presented in Table 5, where the last row shows the av-erage for the whole project, i.e. including all feature groups in theproject. The data for each feature group reflects the differences be-tween the groups, while on a higher detail level the average for thethree projects, shown in Table 3, are more similar. The figures forthe complete project are calculated based on the absolute numberof defects for each feature group in the project, i.e. including thegroups not presented in Table 5. The figures for the completeproject are used for the overview of projects’ distributions given inTable 3.
In Figure 7 defect distributions for function test and system test fora subset of the existing feature groups is presented. The variationswithin groups between projects could be seen for several of thefeature groups. Some trends could be noticed, e.g. feature groupnumber 4 has a similar defect distribution in function test over thethree projects. However, when analyzing the distributions for sys-tem test, no trends could be noticed for the same group. Note theorder of projects, for the function test chart the order is project 3 infront of project 2 and project 1, while for the system test chart theorder is reversed to improve readability.
The analysis also examined whether the defects reported by func-tion testers were responsible for testing these modules, i.e.belong-ing to the tester’s own feature group, or if the defects were locatedin modules, which were part of other feature groups’ functionality.The column FT-own in Table 5 shows the percentage of number of
Figure 6. Defect distributions, showing number of defects detected over time, for the three studied projects. Ship
dates indicated.
0
500
1000
1500
2000
2500
1 2 3 4 5 6 7 8 9 10 11
0
1 00
2 00
3 00
4 00
5 00
6 00
7 00
1 2 3 4 5 6 7 8 9 1 0 1 1
0
200
400
600
800
1000
1 2 3 4 5 6 7 8 9 10 11 12 13 14
Project 1
Project 2
Project 3
Table 3: Distribution of defects found by the different test activities.
Test activity Project 1 Project 2 Project 3 Average
FT 67% 69% 62% 66%
ST 19% 25% 30% 25%
CAT 5% 2% 3% 3%
Misc 9% 4% 5% 6%
Table 4: Share of defects in function test detected at Alpha.
Project 1 Project 2 Project 3 Average
80% 81% 80% 80%
MTAT.03.159 / Lecture 07 / © Dietmar Pfahl 2018
Standards
• IEEE 829-2008 Standard for Software Test Documentation
• IEEE 1008-1993 Standard for Software Unit Testing
• IEEE 1012-2012 Standard for System and Software Verification and Validation
-> • ISO/IEC/IEEE 29119 Software Testing (5 parts)
– replaces most of the older standards
MTAT.03.159 / Lecture 07 / © Dietmar Pfahl 2018
Structure of Lecture 07
• Defect Estimation • Test Planning & Documentation • Test Organisation • Test Process Improvement (TMMi) • Exam Preparation
MTAT.03.159 / Lecture 07 / © Dietmar Pfahl 2018
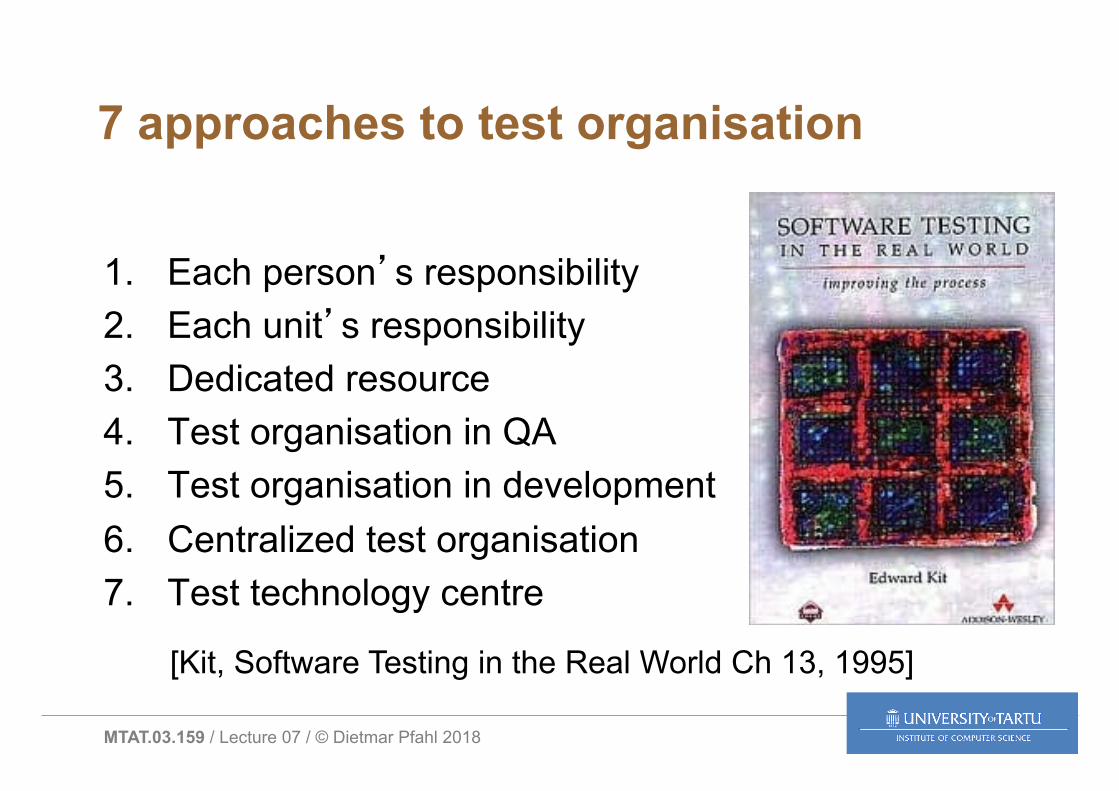
7 approaches to test organisation
1. Each person’s responsibility 2. Each unit’s responsibility 3. Dedicated resource 4. Test organisation in QA 5. Test organisation in development 6. Centralized test organisation 7. Test technology centre
[Kit, Software Testing in the Real World Ch 13, 1995]

MTAT.03.159 / Lecture 07 / © Dietmar Pfahl 2018
7 approaches to test organisation
1. Each person’s responsibility 2. Each unit’s responsibility 3. Dedicated resource 4. Test organisation in QA 5. Test organisation in development 6. Centralized test organisation 7. Test technology centre
[Kit, Software Testing in the Real World Ch 13, 1995]
MTAT.03.159 / Lecture 07 / © Dietmar Pfahl 2018
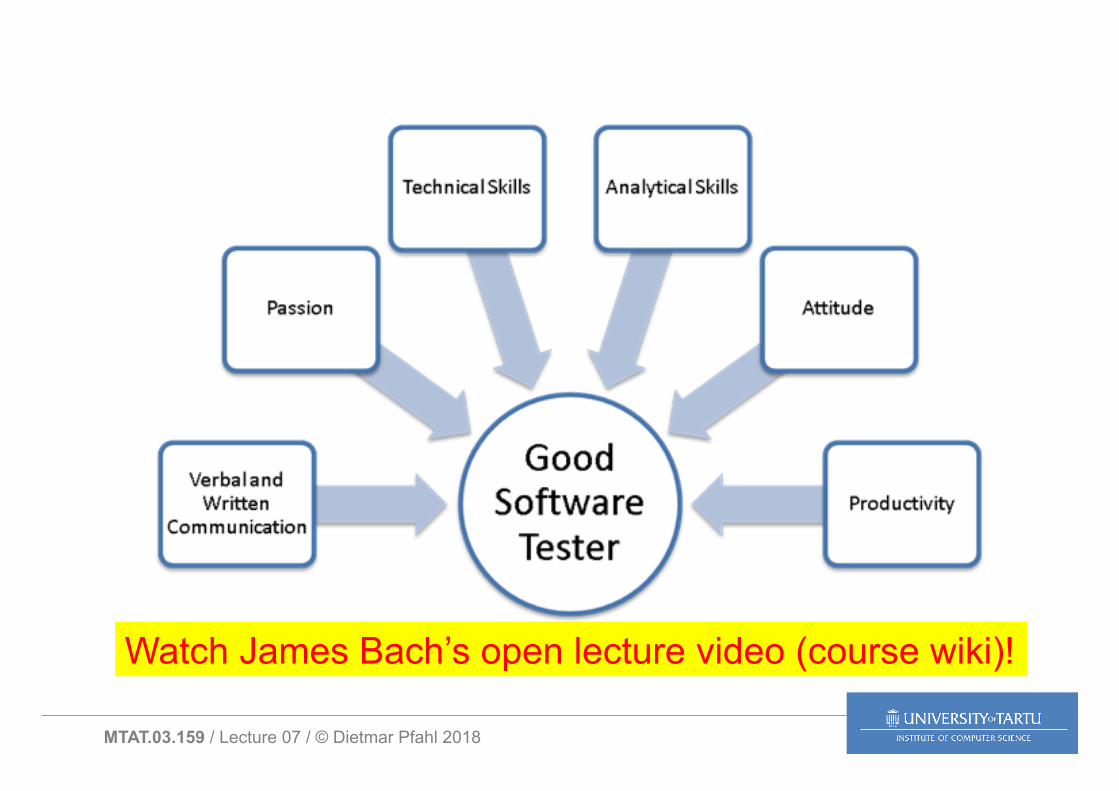
Which organization should we choose?
• Depending on – size – maturity – focus
• The solution is often a mix of different approaches
MTAT.03.159 / Lecture 07 / © Dietmar Pfahl 2018
Watch James Bach’s open lecture video (course wiki)!

MTAT.03.159 / Lecture 07 / © Dietmar Pfahl 2018
Structure of Lecture 07
• Defect Estimation • Test Planning & Documentation • Test Organisation • Test Process Improvement (TMMi) • Exam Preparation
MTAT.03.159 / Lecture 07 / © Dietmar Pfahl 2018
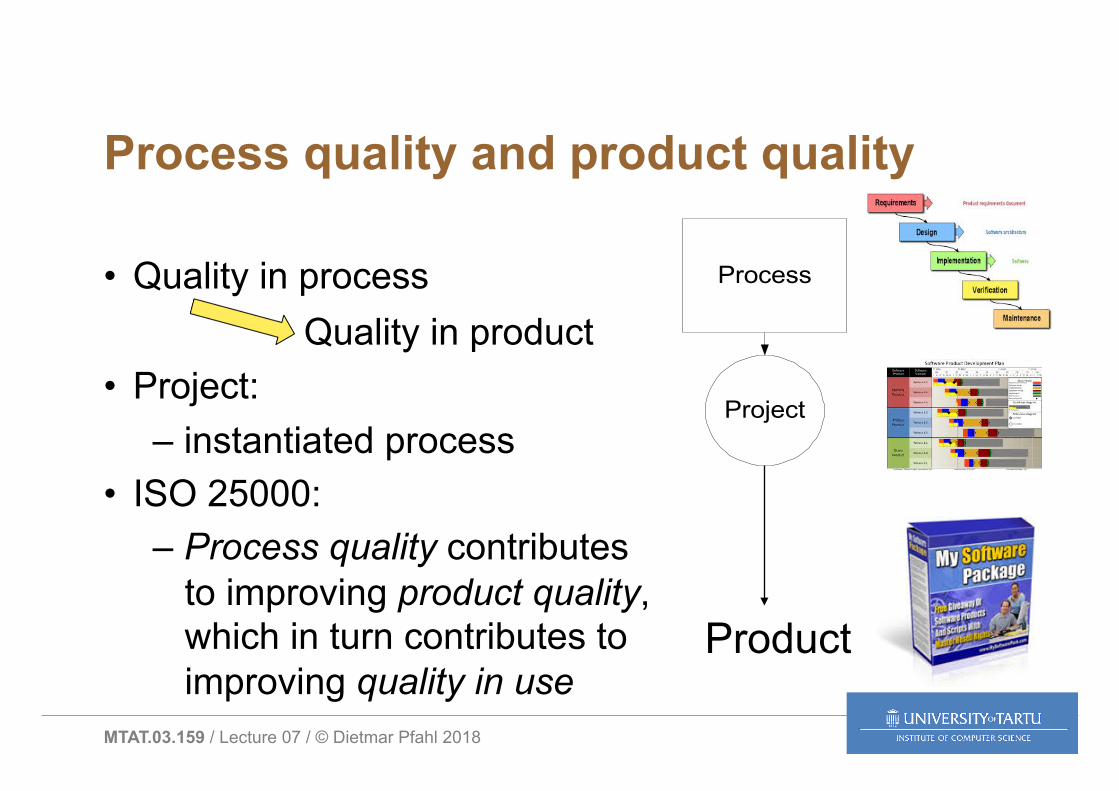
Process quality and product quality
• Quality in process Quality in product
• Project: – instantiated process
• ISO 25000: – Process quality contributes
to improving product quality, which in turn contributes to improving quality in use
Process
Project
Product
MTAT.03.159 / Lecture 07 / © Dietmar Pfahl 2018
Process improvement models vs Test Process improvement models • (Integrated) Capability maturity model (CMM, CMMI) • Software process improvement and capability determination (SPICE) • ISO 9001, Bootstrap, …
Test Process Improvement Models: • Test maturity model (TMM, TMMi) • Test process improvement model (TPI) • Test improvement model (TIM) • Minimal Test Practice Framework (MTPF) • …
MTAT.03.159 / Lecture 07 / © Dietmar Pfahl 2018
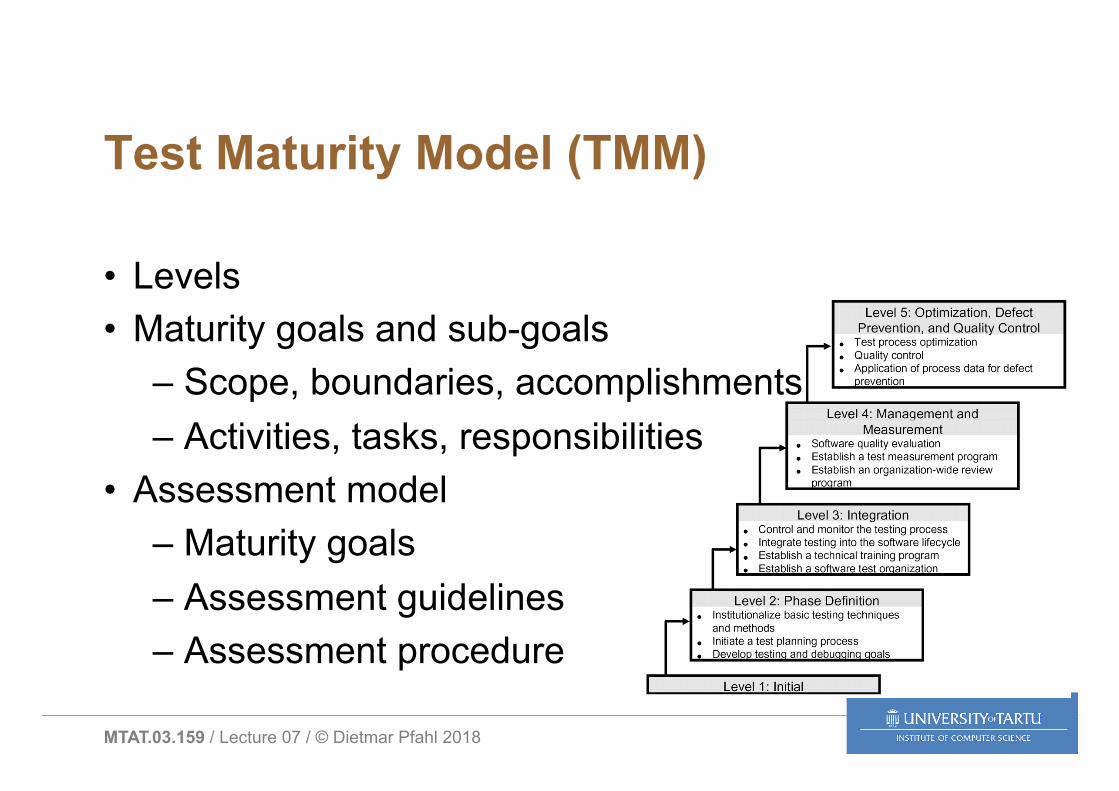
Test Maturity Model (TMM)
• Levels • Maturity goals and sub-goals
– Scope, boundaries, accomplishments – Activities, tasks, responsibilities
• Assessment model – Maturity goals – Assessment guidelines – Assessment procedure
MTAT.03.159 / Lecture 07 / © Dietmar Pfahl 2018
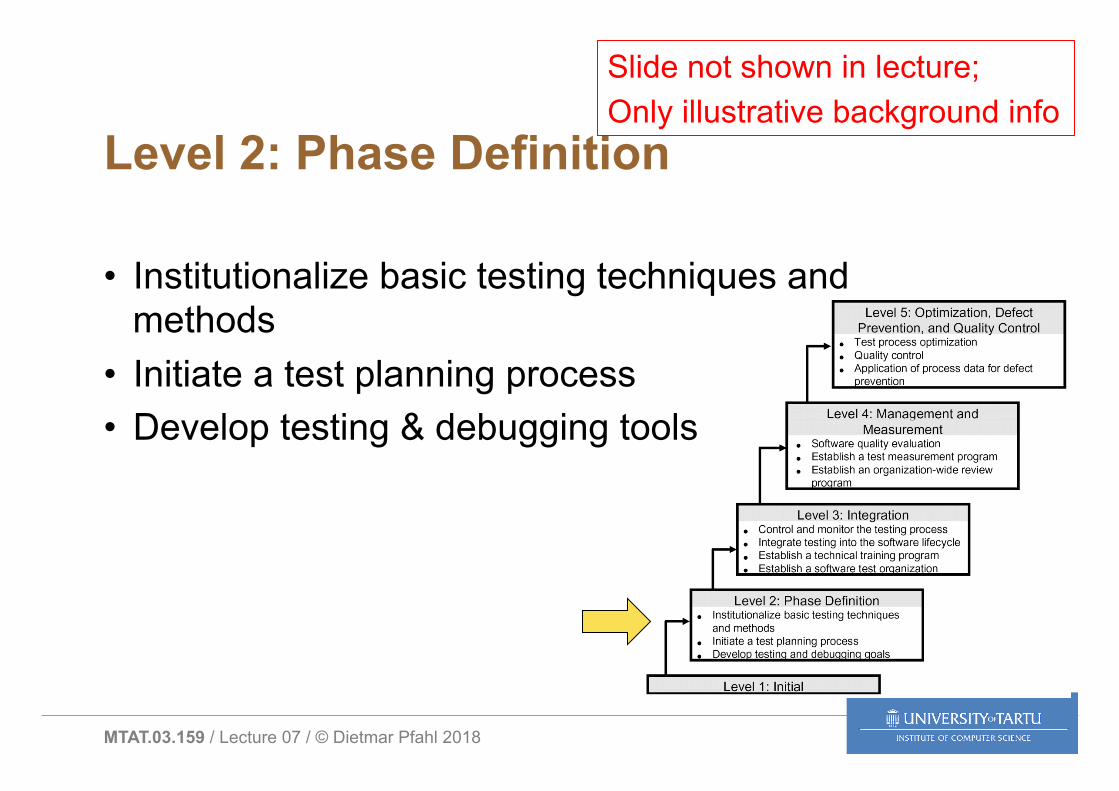
Level 2: Phase Definition
• Institutionalize basic testing techniques and methods
• Initiate a test planning process • Develop testing & debugging tools
Slide not shown in lecture; Only illustrative background info
MTAT.03.159 / Lecture 07 / © Dietmar Pfahl 2018
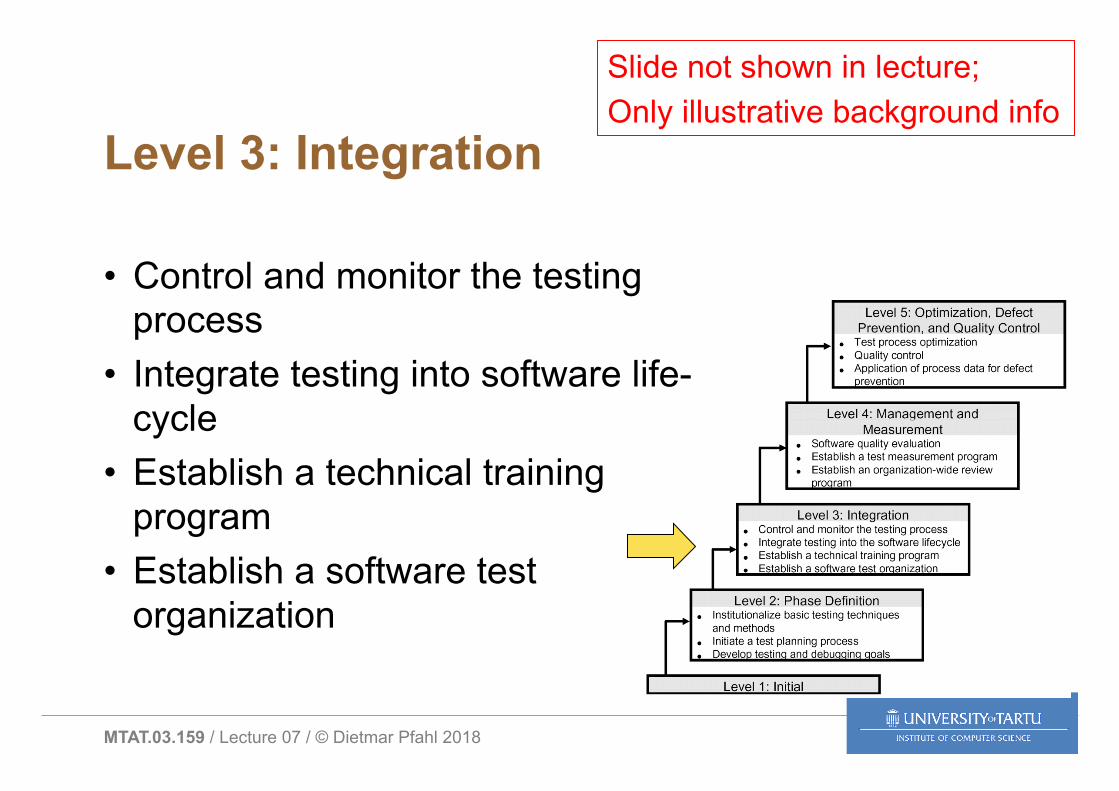
Level 3: Integration
• Control and monitor the testing process
• Integrate testing into software life-cycle
• Establish a technical training program
• Establish a software test organization
Slide not shown in lecture; Only illustrative background info
MTAT.03.159 / Lecture 07 / © Dietmar Pfahl 2018
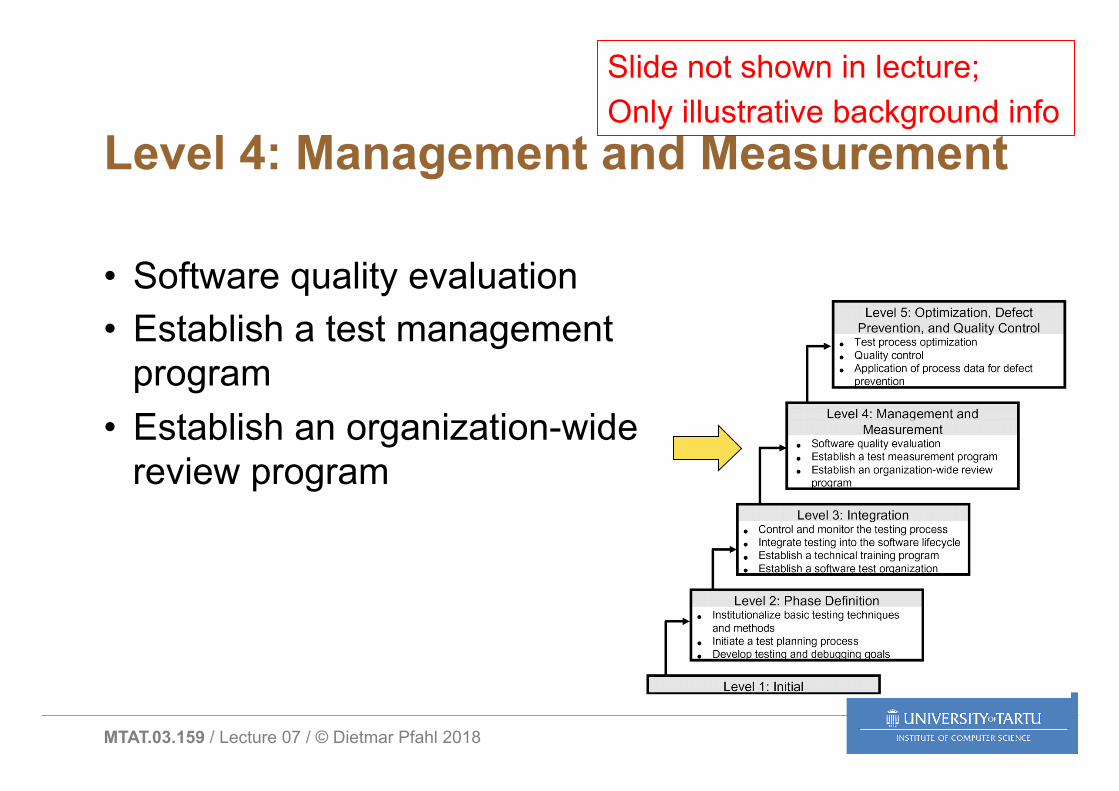
Level 4: Management and Measurement
• Software quality evaluation • Establish a test management
program • Establish an organization-wide
review program
Slide not shown in lecture; Only illustrative background info
MTAT.03.159 / Lecture 07 / © Dietmar Pfahl 2018
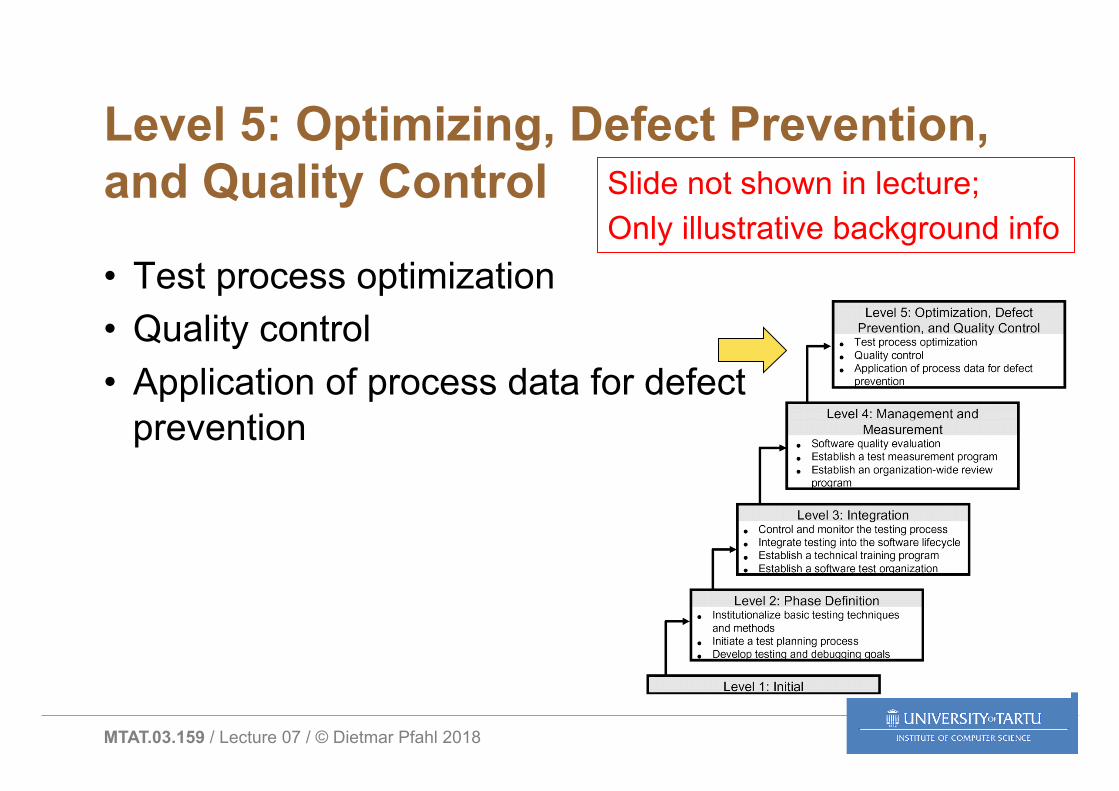
Level 5: Optimizing, Defect Prevention, and Quality Control
• Test process optimization • Quality control • Application of process data for defect
prevention
Slide not shown in lecture; Only illustrative background info
MTAT.03.159 / Lecture 07 / © Dietmar Pfahl 2018
Recommended Textbook Exercises
• Chapter 14 – 2, 4, 5, 6, 9
• Chapter 9 – 2, 3, 4, 5, 8, 12
• Chapter 7 – 2, 3, 6, 8, 9, 11
• Chapter 8 – 2, 3, 6, 7, 9
• Chapter 16 – No exercises
MTAT.03.159 / Lecture 07 / © Dietmar Pfahl 2018
Structure of Lecture 07
• Defect Estimation • Test Planning & Documentation • Test Organisation • Test Process Improvement (TMMi) • Exam Preparation
MTAT.03.159 / Lecture 07 / © Dietmar Pfahl 2018
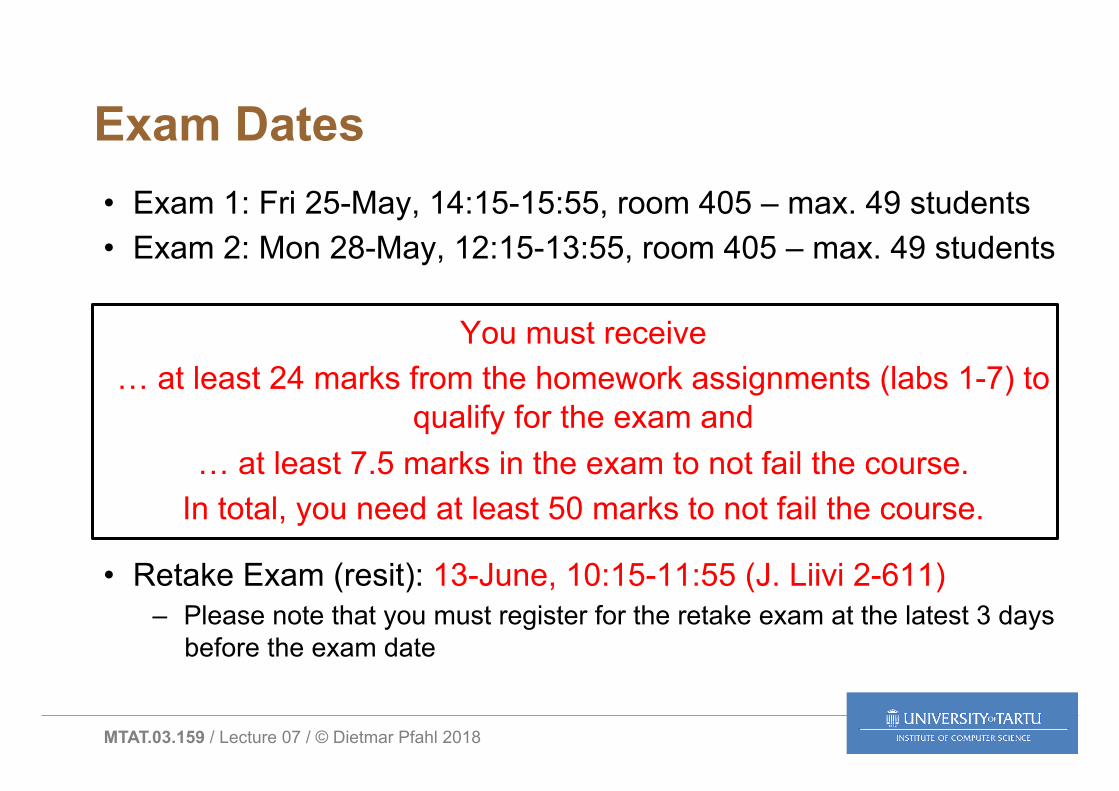
Exam Dates • Exam 1: Fri 25-May, 14:15-15:55, room 405 – max. 49 students • Exam 2: Mon 28-May, 12:15-13:55, room 405 – max. 49 students
You must receive … at least 24 marks from the homework assignments (labs 1-7) to
qualify for the exam and … at least 7.5 marks in the exam to not fail the course.
In total, you need at least 50 marks to not fail the course.
• Retake Exam (resit): 13-June, 10:15-11:55 (J. Liivi 2-611) – Please note that you must register for the retake exam at the latest 3 days
before the exam date
MTAT.03.159 / Lecture 07 / © Dietmar Pfahl 2018
Important
• You are registered for either exam 1 or exam 2 • You must go to the exam for which you are
registered – otherwise you will not be admitted
• Exam 1: Friday, May 25 • Exam 2: Monday, May 28
Check it out in the
SIS
MTAT.03.159 / Lecture 07 / © Dietmar Pfahl 2018
Important
• The exam duration is 100 min! • In the SIS, the reserved time slots are 120 min
to accommodate administrative tasks such as distribution and collection of exam materials.
• In order to get started in time, please arrive a few minutes before the exam starts.
MTAT.03.159 / Lecture 07 / © Dietmar Pfahl 2018
Final Exam
Admission Rule: • At least 24 marks from labs 1-7
Minimum required to not fail the course: • At least 24 marks from labs AND • At least 7.5 marks in exam AND • At least 50 marks overall

MTAT.03.159 / Lecture 07 / © Dietmar Pfahl 2018
Questions ?
MTAT.03.159 / Lecture 07 / © Dietmar Pfahl 2018
Final Exam – Format
• Written exam (30% = 30 marks) – Based on textbook, lectures and lab sessions – Open book – 100 min – 2 Parts:
• Part 1 – Multiple-Choice (8 marks) • Part 2 – Constructive Tasks (22 marks)
– Answers might require some technical work & calculation
Example exams from 2013 to 2017 are posted on the course wiki under tab ’Assessment and Grades’

MTAT.03.159 / Lecture 07 / © Dietmar Pfahl 2018
Questions ?
MTAT.03.159 / Lecture 07 / © Dietmar Pfahl 2018
Final Exam – Content/Topics Overview
• Introduction to Software Testing • Black-Box Testing Techniques • White-Box Testing Techniques • Mutation Testing • Static Testing (Inspection/Review) and Defect
Estimation • Test Tools (and Measures) • Test Documentation, Organisation, Improvement
MTAT.03.159 / Lecture 07 / © Dietmar Pfahl 2018
Final Exam – Content/Topics Overview
Introduction to Software Testing: • Know the basic terminology
– Software Testing & Software Quality – Verification & Validation – Error – Fault – Failure
• NB: Two competing definitions of ’Error’
– Test Case – Test Suite – Test Oracle ... – Test Levels – Issue Reporting – Debugging
LAB 1
MTAT.03.159 / Lecture 07 / © Dietmar Pfahl 2018
Final Exam – Content/Topics Overview
Black-Box Testing Techniques: • Difference between Black-Box and White-Box Testing
– Strengths & Weaknesses of each • Know various BBT Techniques (Methods):
– Equivalence Class Partitioning – Boundary Value Testing – Combinatorial Testing – State-Transition-Testing – Exploratory Testing – Usability Testing
LABs 2+3
MTAT.03.159 / Lecture 07 / © Dietmar Pfahl 2018
Final Exam – Content/Topics Overview
White-Box Testing Techniques: • Difference between Black-Box and White-Box Testing
– Strengths & Weaknesses of each • Control-Flow Testing
– Know how to construct a Control-Flow-Graph – Know different coverage criteria:
• Statement/Block, Decision/Branch, Condition, Linearly Independent Paths, etc.
• Data-Flow Testing • Mutation Testing
LABs 2+4
MTAT.03.159 / Lecture 07 / © Dietmar Pfahl 2018
Final Exam – Content/Topics Overview
Static Testing (Inspection) and Defect Estimation: • Document Reviews (Inspections)
– Why needed? – What variants exist?
• Static Code Analysis – What are false positives?
• Defect Estimation: – Capture-Recapture Model
LABs 6+7
MTAT.03.159 / Lecture 07 / © Dietmar Pfahl 2018
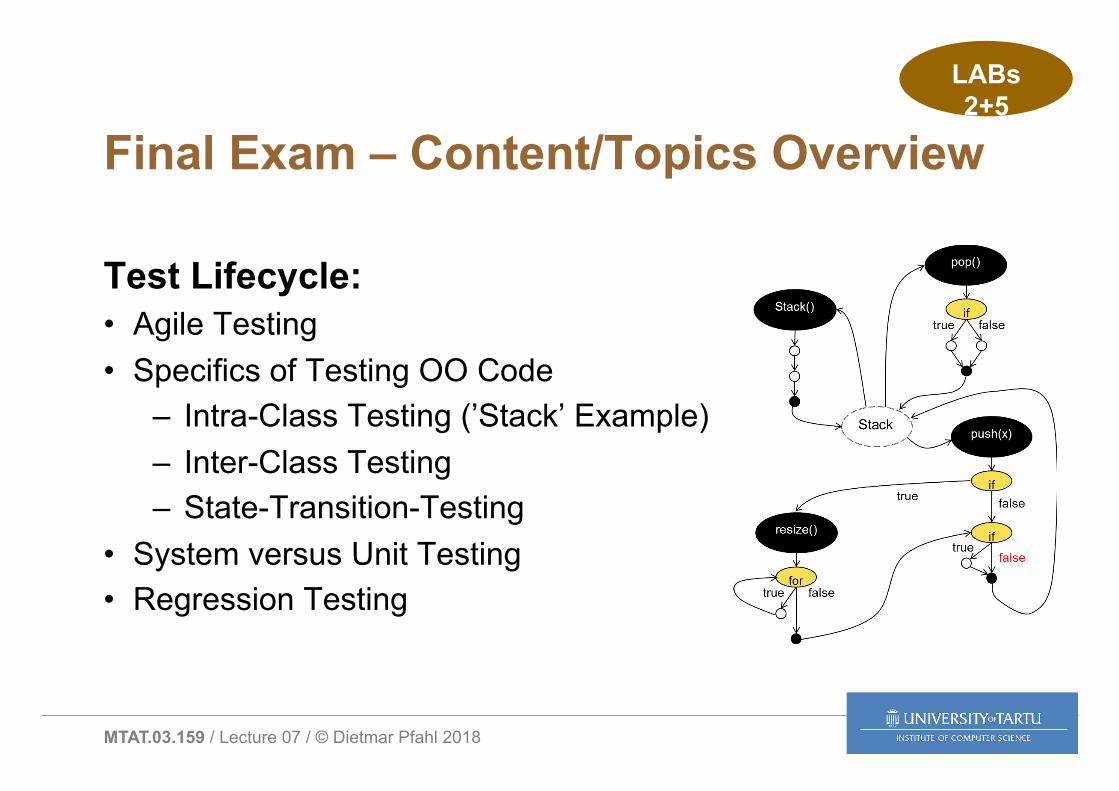
Final Exam – Content/Topics Overview
Test Lifecycle: • Agile Testing • Specifics of Testing OO Code
– Intra-Class Testing (’Stack’ Example) – Inter-Class Testing – State-Transition-Testing
• System versus Unit Testing • Regression Testing
LABs 2+5
MTAT.03.159 / Lecture 07 / © Dietmar Pfahl 2018
Final Exam – Content/Topics Overview
Tools (and Measures): • Different Tools for Different Purposes! • Test Automation
– Capture-Replay (Web App Testing) – Automated Regression Testing
• Test Measures – Test Coverage, Test Effectiveness, Test Efficiency, etc.
LABs 1-6

MTAT.03.159 / Lecture 07 / © Dietmar Pfahl 2018
Questions ?
MTAT.03.159 / Lecture 07 / © Dietmar Pfahl 2018
Next Weeks
• Submit Lab 6 (Tuesday Lab Groups) on time • Attend and do Lab 7
– Must work in Pairs to be able to get full marks
• Prepare for Exam • Take Exam
MTAT.03.159 / Lecture 07 / © Dietmar Pfahl 2018
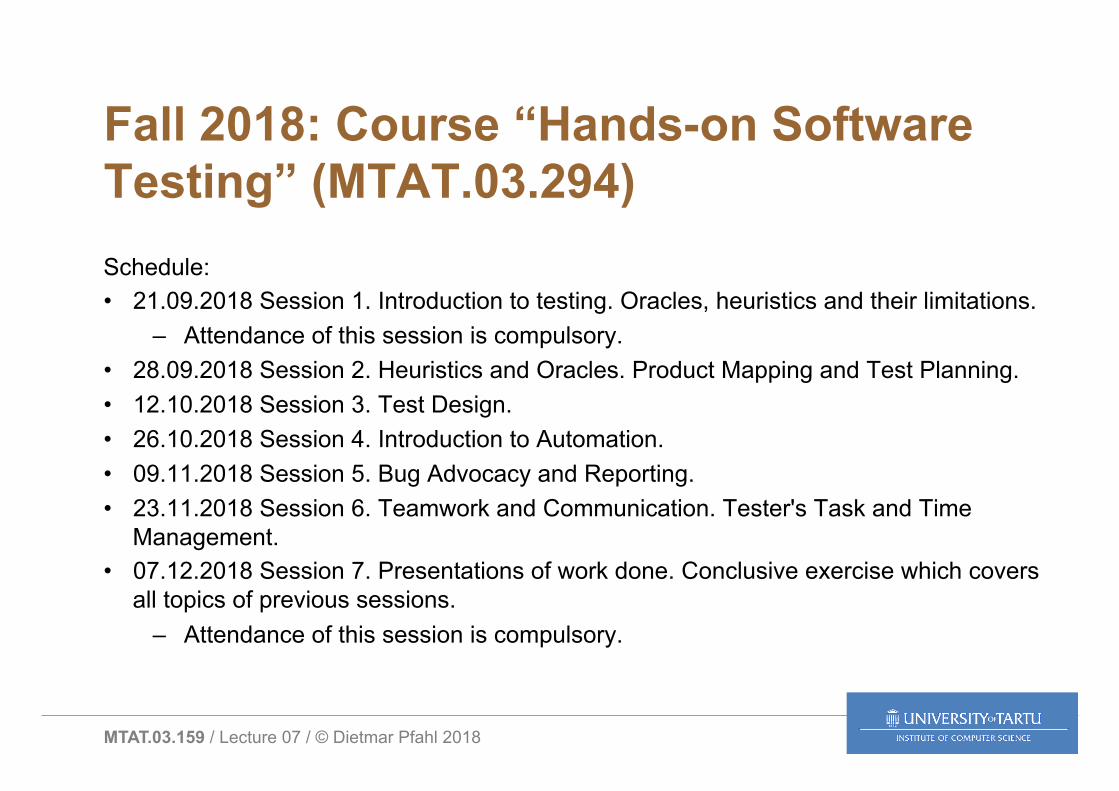
Fall 2018: Course “Hands-on Software Testing” (MTAT.03.294) Schedule: • 21.09.2018 Session 1. Introduction to testing. Oracles, heuristics and their limitations.
– Attendance of this session is compulsory. • 28.09.2018 Session 2. Heuristics and Oracles. Product Mapping and Test Planning. • 12.10.2018 Session 3. Test Design. • 26.10.2018 Session 4. Introduction to Automation. • 09.11.2018 Session 5. Bug Advocacy and Reporting. • 23.11.2018 Session 6. Teamwork and Communication. Tester's Task and Time
Management. • 07.12.2018 Session 7. Presentations of work done. Conclusive exercise which covers
all topics of previous sessions. – Attendance of this session is compulsory.

MTAT.03.159 / Lecture 07 / © Dietmar Pfahl 2018
Fall 2018: Course “Hands-on Software Testing” (MTAT.03.294)
Teachers are experts from industry (Estonian companies) Limit: 20 students (first come first serve) Coordinator: Oliver Vilson ([email protected])
MTAT.03.159 / Lecture 07 / © Dietmar Pfahl 2018
Thank You!