Embed Size (px)
Citation preview
J. Global Business Advancement, Vol. 5, No. 4, 2012 285
Copyright © 2012 Inderscience Enterprises Ltd.
Employee motivational factors: a comparison between Malaysia and Sultanate of Oman
Muhammad Madi Bin Abdullah* Faculty of Management, Multimedia University (MMU) Malaysia, Persiaran Multimedia, 63100 Cyberjaya, Selangor, Malaysia E-mail: [email protected] *Corresponding author
Rafikul Islam Department of Business Administration, Kulliyyah of Economics and Management Sciences, International Islamic University Malaysia, P.O. Box 10, 50728 Kuala Lumpur, Malaysia E-mail: [email protected]
Abstract: Industrial psychologists have continuously devised theories and executives and managers have tirelessly formulated various programmes related to employee motivation. A set of committed, motivated employees is an asset for any organisation – public or private. A well-known fact is that an organisation can emulate almost anything of another organisation except its human resources. How to motivate employees? Can one particular factor motivate everybody equally? Is there any cultural influence on motivating factors? Extensive investigations have been made to address these fundamental questions in the last few decades. This research, which is a sequel to the previous researches, basically aims at identifying the salient motivating factors for Malaysian as well as Omani employees. A detailed comparison has been made on the findings of the motivating factors with regard to the two countries. Finally, managerial implications are highlighted for both the countries.
Keywords: employee motivation; demographic impact on motivation; Malaysia; Sultanate of Oman.
Reference to this paper should be made as follows: Abdullah, M.M. and Islam, R. (2012) ‘Employee motivational factors: a comparison between Malaysia and Sultanate of Oman’, J. Global Business Advancement, Vol. 5, No. 4, pp.285–306.
Biographical notes: Muhammad Madi Bin Abdullah is now an Associate Professor of Management and Human Resource Development at the Faculty of Management, Multimedia University (MMU), Malaysia. He received his MSc Degree in Human Resource Development from the Universiti Putra Malaysia (UPM) in 1999 and subsequently his PhD in Training Management from the same university in 2007. His PhD thesis is about the influence of soft factors on quality improvement and performance in the electrical firms. His papers have
286 M.M. Abdullah and R. Islam
appeared in The TQM Journal, Total Quality Management & Business Excellence, International Journal of Productivity and Quality Management, International Journal of Business Management, Journal for Global Business Advancement, Asia Pacific Management Review, Intangible Capital, and Journal of Industrial Engineering and Management. His current research includes soft factors of quality improvement and its relationship with organisational performance. His research areas include quality management, human resource development, human resource management, training and development.
Rafikul Islam received his MSc Degree in Applied Mathematics from the University of Calcutta in 1988. Subsequently, he obtained his PhD in Operations Research from Indian Institute of Technology, Kharagpur in 1996. Presently, he is working as a Professor at the Department of Business Administration, International Islamic University Malaysia (IIUM). Previously, he held the positions of Head, Department of Business Administration (2005–2006) and Deputy Dean (Academic Affairs) (2007–2010) at the Faculty of Economics and Management Sciences of IIUM. He received IIUM Quality Research Award (university level) and Outstanding Researcher Award (faculty level), in the year 2006 and 2008, respectively. His papers have appeared in International Transactions in Operational Research, International Journal of Commerce and Management, International Journal of Business Information Systems, Journal for International Business and Entrepreneurship Development, and Socio-Economic Planning Sciences. His research areas include multiple criteria decision making, operations and quality management.
This paper is a revised and expanded version of a paper entitled ‘Employee motivational factors: a comparison between Malaysia and Sultanate of Oman’, presented at the 8th Annual World Congress of the Academy for Global Business Advancement (AGBA) held at Dongbei University of Finance & Economics (DUFE), Dalian, China, 15–17 September, 2011.
1 Introduction
Motivation is one of the most important variables that affect human performance and behaviour. There were times when employees were considered to be another resource to improve the production of services and products. However, a lot has changed now. Motivating organisational employees is an important step that every business organisation should take to succeed and perform better. This is because motivation encourages higher performance and productivity on the part of organisational employees. In this sense, the organisation has nothing to enjoy but benefits and profit. Therefore, it is imperative for the business owners, managers and team leaders to find ways to improve continuously the morale and satisfaction of their employees.
Why do we need motivated workers? The answer is survival. Highly motivated workers are needed in a rapidly changing workplace environment. Highly motivated workers help organisations survive and thrive continuously. Motivating the employees arguably is the most complex issue facing managers in organisations today. This is due, in part, to the fact that what motivates employees changes constantly (Bowen and Radhakrishna, 1991). For instance, research suggests that as employees’ income
Employee motivational factors 287
increases, money becomes less of a motivator (Kovach, 1987). Moreover, as employees get older, interesting work becomes more of a strong motivating factor.
In the present competitive marketplace, a set of competitive employees is essential for any organisation to remain in its business. In this respect, the importance of motivation cannot be overemphasised. Therefore, to ensure fully committed and loyal employees, management must take a serious look at their motivational factors.
There is to date no proper survey-based study conducted in Malaysian as well as Omanian organisational setting to identify the key factors that motivate employees to work hard. The reason of choosing these two countries is authors’ familiarity with them. Both the countries share some commonalities, such as stable government, comparable GDP growth, per-capita income and continuous push to develop a quality workforce. Demographic factors (age, gender, education level, marital status, type of the company, employee size of the company, company tenure and employee status) also play a crucial role in levels of motivation. Individuals at different organisation levels, in different environments may have different motivational values (Rai, 2004). Hence, there is a need to look at these demographic factors when analysing attitude for motivational purposes.
The purpose of this study was to describe the importance of certain factors in motivating Malaysian as well as Omani employees. Specifically, the study sought to describe the ranked importance of the following 10 motivating factors identified from motivational theories:
• job security
• promotion
• working condition
• high wages
• interesting work
• help
• appreciation
• rules
• opportunity
• responsibility.
2 Literature review
2.1 Motivation defined
Motivation can be defined as what people desire to do, the inducement or incentive and the term motivation refers to the needs, fears and aspirations within people that make them behave as they do currently (Walker and Miller, 2010). Many contemporary authors have also defined the concept of motivation. Motivation has been defined as: the psychological process that gives behaviour purpose and direction (Kreitner, 1995);
288 M.M. Abdullah and R. Islam
a predisposition to behave in a purposive manner to achieve specific, unmet needs (Buford et al., 1995); an internal drive to satisfy unsatisfied needs (Higgins, 1994) and the will to achieve (Bedelian, 1993). For this paper, motivation is operationally defined as the inner force that drives individual employees to accomplish personal, group and organisational goals.
2.2 Human motivational theories
Understanding what motivates employees and how they were motivated was the focus of many researchers following the publication of the Hawthorne studies (Terpstra, 1979). Five major approaches that have led to the understanding of human motivation are Maslow’s need-hierarchy theory, Herzberg’s two-factor theory, Vroom’s expectancy theory, Adam’s equity theory and Skinner’s reinforcement theory.
According to Maslow, employees in organisation have five levels of needs (Maslow, 1943): physiological, safety, social, self-esteem and self-actualisation. Maslow argued that lower-level needs have to be satisfied before the next higher-level need motivates employees. On the other hand, Herzberg’s study categorised motivational factors into two: motivators and hygienes (Herzberg et al., 1959). Motivators or intrinsic factors, such as achievement and recognition, lead to job satisfaction. Hygiene or extrinsic factors, such as pay and job security, produce job dissatisfaction.
Vroom’s theory is based on the belief that employee effort will lead to performance and in turn employee performance will lead to rewards (Vroom, 1964). Rewards may be either positive or negative. The more positive the reward the more likely the employee will be highly motivated. Conversely, the more negative the reward the less likely the employee will be motivated.
Adam’s theory states that employees strive for equity between themselves and other workers. Equity is achieved when the ratio of employee outcomes over inputs is equal to other employee outcomes over inputs (Adams, 1965). Finally, Skinner’s theory simply states that employee’s behaviour that lead to positive outcomes will be repeated and behaviours that lead to negative outcomes will not be repeated (Skinner, 1953). Managers should positively reinforce employee behaviours that lead to positive outcomes. Managers should negatively reinforce employee behaviour that leads to negative outcomes.
2.3 Factors of employee motivation
Employee motivation can be achieved through several factors that will contribute to employee motivation. Employee motivation will then affect employee performance. Flynn (2011) and Warr (2007) have stressed that managers and employers are in the motivation game in the workplace. Money is the most important motivation factor for employees to increase job performance in workplace and the other factors include contact with others, environment, employee goals, security, equity, skills used, position, career opportunity and supportive supervision (Flynn, 2011; Warr, 2007). All these factors will motivate the employees and increase their performance.
A study by Islam and Ismail (2008) resulted that there are ten most important factors that motivate Malaysian employees, which include high wages, good working conditions,
Employee motivational factors 289
promotion, job security, interesting work, full appreciation of work done, providing opportunities to grow, job responsibility, sensible rules and regulations and management help to solve personal problems.
With regard to employee motivation factors also, Cruz et al. (2009) have derived the employee motivational factors through developing intrinsic and extrinsic motivation. Intrinsic motivation rewards includes the satisfaction an employee receives from his or her own position whereas extrinsic motivation rewards is always a common and routine factor that is expected by employees in workplace. The intrinsic motivational factors according to Cruz et al. (2009) are self-confidence, autonomy, honesty and membership, and the extrinsic motivational factors are high-power incentives, recognition, promotion and stability.
Lindner (1998) examined the ranked importance of motivational factors of employees at the university extension centres. The study addressed 10 motivating factors: job security, sympathetic help with personal problems, personal loyalty to employees, interesting work, good working conditions, tactful discipline, good wages, promotions and growth in the organisation, feeling of being in on things and full appreciation of work done. The study found that interesting work ranked as the most important motivational factor.
Jurkiewicz and Massey (1997) made a comparison study of what motivates supervisory and non-supervisory municipal employees in USA. The study used 15 work-related motivational factors: chance to learn new things, chance to benefit society, freedom from pressures to conform both on and off the job, opportunity for advancement, high prestige and social status, chance to use employee special abilities, freedom from supervision, variety in work assignments, chance to engage in satisfying leisure activities, friendly and congenial associates, working as part of a ‘team’, high salary, a stable and secure future, chance to exercise leadership and chance to make a contribution to important decisions. The research result strongly suggests that today’s municipal employees are more concerned with job security, salary and opportunities for personal and professional advancement than they are with benefiting society, teamwork, or autonomy.
Malik (2010) conducted a study to examine the ranked importance of motivational factors of Serbian university employees. The study addressed eight motivating factors in the context of employee motivation theory. The eight factors are: living in a safe area, good salary, promotion and growth in the organisation, interesting work, conducive working condition, sympathetic help with personal problems, appreciation of work done and personal loyalty to employees. Findings suggest that living in a safe area and good pay are key to higher employee motivation. The study also suggests that carefully designed reward systems that include job enlargement, job enrichment, promotions, monetary and non-monetary compensation should also be considered.
Harell and Daim (2010) reviewed several motivation models in the literature and divided them into two types of motivators. The first is social–psychological motivational factors:
• autonomy, responsibility, variety of tasks
• growth/development, advancement
290 M.M. Abdullah and R. Islam
• interactions: feedback, co-worker relationship, manager relationship
• power, respect
• pride
• sense of accomplishment.
The second is tangible motivational factors:
• pay bonuses
• fringe benefits
• recognition
• outside environment
• working conditions.
3 Research methodology
The main instrument for data collection of the proposed work is questionnaire, which contains a list of 10 motivators to be ranked by the respondents. To find out the specific motivator(s) preferred by the employees working in various Malaysian as well as Omani organisations, the researchers have contacted 505 and 306 middle-level managers in various Malaysian and Omani public and private organisations, respectively.
In Part A of the questionnaire, the respondents were asked to furnish their demographic details, e.g., gender, age, education level, marital status, type of employment (public or private) and type of work (executive or non-executive).
In Part B, the respondents were asked to rank the 10 motivating factors in terms of effectiveness from their point of view. The exact statement in the questionnaire is: “Please rank the following motivating factors in term of effectiveness from your point of view. Most effective motivator, rank = 1, second most effective motivator, rank = 2, etc., the least effective of the 10 factors will receive the rank 10”. To avoid the problem of using the same rank for more than one factor, the following sentence was added with the previous statement: “Please do not use same rank for more than one factor. One sample is (assigned at random): 5, 1, 8, 10, 4, 3, 7, 6, 2, 9”.
All the 811 respondents were contacted either personally or through research assistants and obtained their responses. To keep anonymity of the respondents, writing the name of the organisation was made optional. However, many of the respondents wrote down their organisations’ names. Types of companies/organisations contacted for the purpose of data collection include airlines, automotive, banking, business and agencies, insurance, manufacturing, petroleum, transportation, etc.
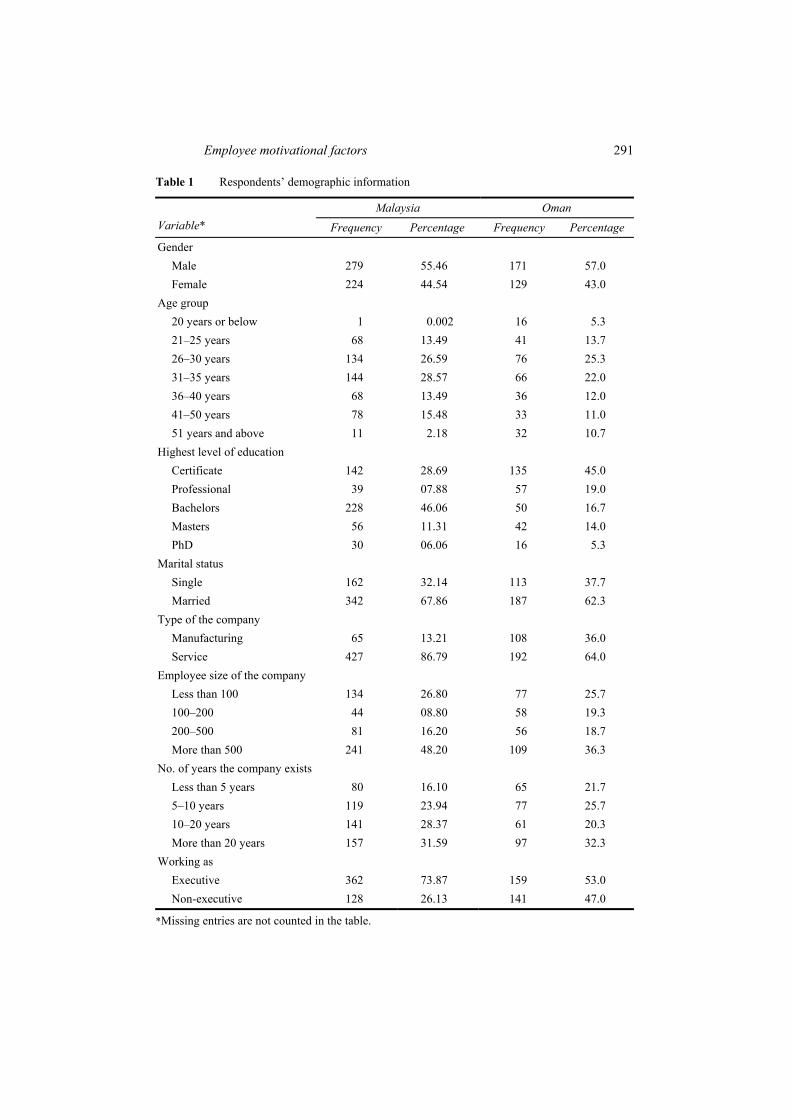
The data are analysed using SPSS. The main components of SPSS used are: descriptive statistics, one-way ANOVA, rank correlation test and Duncan’s multiple comparison test. Table 1 shows the respondents’ demographic information for both Malaysia and Sultanate of Oman.
Employee motivational factors 291
Table 1 Respondents’ demographic information
Malaysia Oman Variable* Frequency Percentage Frequency Percentage
Gender Male Female
279 224
55.46 44.54
171 129
57.0 43.0
Age group 20 years or below 21–25 years 26–30 years 31–35 years 36–40 years 41–50 years 51 years and above
1
68 134 144 68 78 11
0.002
13.49 26.59 28.57 13.49 15.48 2.18
16 41 76 66 36 33 32
5.3
13.7 25.3 22.0 12.0 11.0 10.7
Highest level of education Certificate Professional Bachelors Masters PhD
142 39
228 56 30
28.69 07.88 46.06 11.31 06.06
135 57 50 42 16
45.0 19.0 16.7 14.0 5.3
Marital status Single Married
162 342
32.14 67.86
113 187
37.7 62.3
Type of the company Manufacturing Service
65
427
13.21 86.79
108 192
36.0 64.0
Employee size of the company Less than 100 100–200 200–500 More than 500
134 44 81
241
26.80 08.80 16.20 48.20
77 58 56
109
25.7 19.3 18.7 36.3
No. of years the company exists Less than 5 years 5–10 years 10–20 years More than 20 years
80
119 141 157
16.10 23.94 28.37 31.59
65 77 61 97
21.7 25.7 20.3 32.3
Working as Executive Non-executive
362 128
73.87 26.13
159 141
53.0 47.0
*Missing entries are not counted in the table.
292 M.M. Abdullah and R. Islam
4 Results and discussion
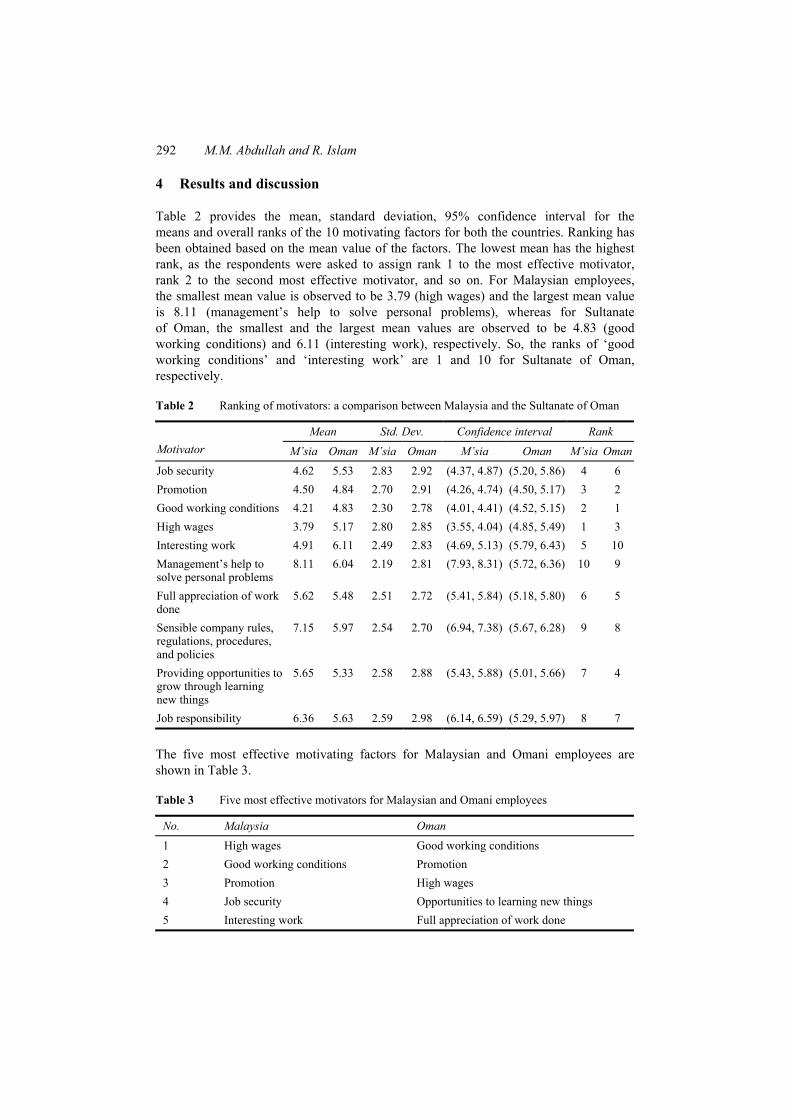
Table 2 provides the mean, standard deviation, 95% confidence interval for the means and overall ranks of the 10 motivating factors for both the countries. Ranking has been obtained based on the mean value of the factors. The lowest mean has the highest rank, as the respondents were asked to assign rank 1 to the most effective motivator, rank 2 to the second most effective motivator, and so on. For Malaysian employees, the smallest mean value is observed to be 3.79 (high wages) and the largest mean value is 8.11 (management’s help to solve personal problems), whereas for Sultanate of Oman, the smallest and the largest mean values are observed to be 4.83 (good working conditions) and 6.11 (interesting work), respectively. So, the ranks of ‘good working conditions’ and ‘interesting work’ are 1 and 10 for Sultanate of Oman, respectively.
Table 2 Ranking of motivators: a comparison between Malaysia and the Sultanate of Oman
Mean Std. Dev. Confidence interval Rank Motivator M’sia Oman M’sia Oman M’sia Oman M’sia Oman Job security 4.62 5.53 2.83 2.92 (4.37, 4.87) (5.20, 5.86) 4 6 Promotion 4.50 4.84 2.70 2.91 (4.26, 4.74) (4.50, 5.17) 3 2 Good working conditions 4.21 4.83 2.30 2.78 (4.01, 4.41) (4.52, 5.15) 2 1 High wages 3.79 5.17 2.80 2.85 (3.55, 4.04) (4.85, 5.49) 1 3 Interesting work 4.91 6.11 2.49 2.83 (4.69, 5.13) (5.79, 6.43) 5 10 Management’s help to solve personal problems
8.11 6.04 2.19 2.81 (7.93, 8.31) (5.72, 6.36) 10 9
Full appreciation of work done
5.62 5.48 2.51 2.72 (5.41, 5.84) (5.18, 5.80) 6 5
Sensible company rules, regulations, procedures, and policies
7.15 5.97 2.54 2.70 (6.94, 7.38) (5.67, 6.28) 9 8
Providing opportunities to grow through learning new things
5.65 5.33 2.58 2.88 (5.43, 5.88) (5.01, 5.66) 7 4
Job responsibility 6.36 5.63 2.59 2.98 (6.14, 6.59) (5.29, 5.97) 8 7
The five most effective motivating factors for Malaysian and Omani employees are shown in Table 3.
Table 3 Five most effective motivators for Malaysian and Omani employees
No. Malaysia Oman
1 High wages Good working conditions 2 Good working conditions Promotion 3 Promotion High wages 4 Job security Opportunities to learning new things 5 Interesting work Full appreciation of work done
Employee motivational factors 293
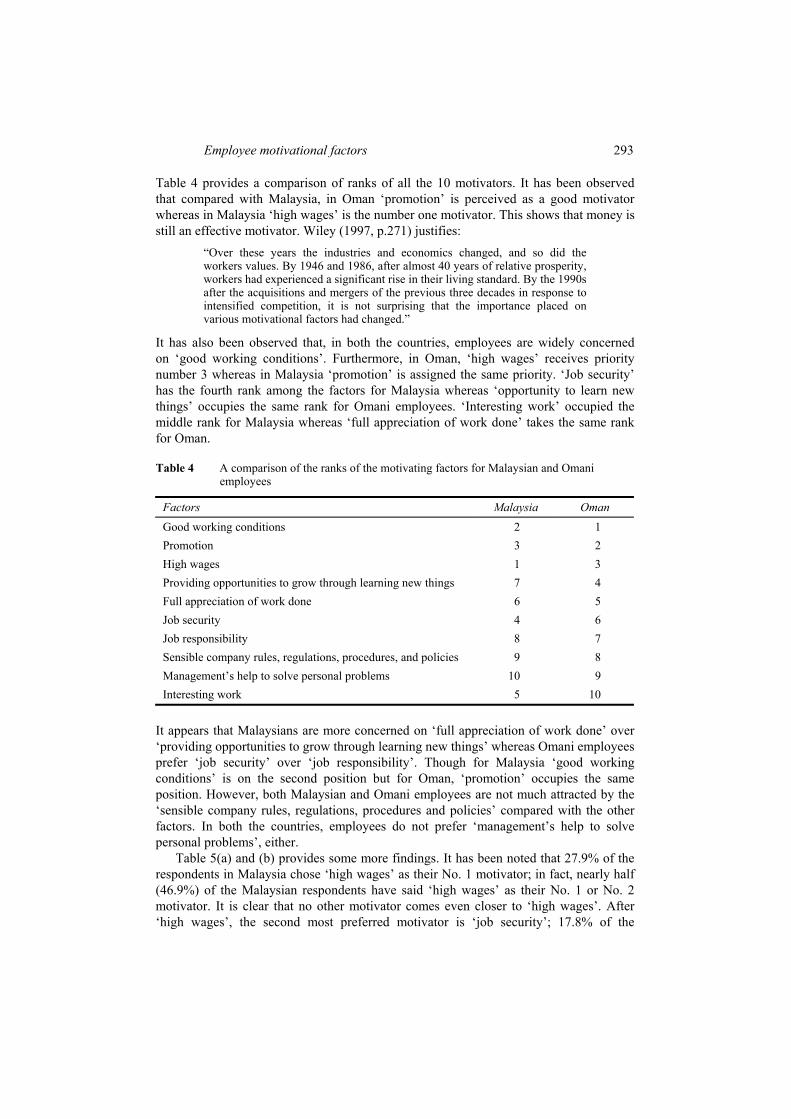
Table 4 provides a comparison of ranks of all the 10 motivators. It has been observed that compared with Malaysia, in Oman ‘promotion’ is perceived as a good motivator whereas in Malaysia ‘high wages’ is the number one motivator. This shows that money is still an effective motivator. Wiley (1997, p.271) justifies:
“Over these years the industries and economics changed, and so did the workers values. By 1946 and 1986, after almost 40 years of relative prosperity, workers had experienced a significant rise in their living standard. By the 1990s after the acquisitions and mergers of the previous three decades in response to intensified competition, it is not surprising that the importance placed on various motivational factors had changed.”
It has also been observed that, in both the countries, employees are widely concerned on ‘good working conditions’. Furthermore, in Oman, ‘high wages’ receives priority number 3 whereas in Malaysia ‘promotion’ is assigned the same priority. ‘Job security’ has the fourth rank among the factors for Malaysia whereas ‘opportunity to learn new things’ occupies the same rank for Omani employees. ‘Interesting work’ occupied the middle rank for Malaysia whereas ‘full appreciation of work done’ takes the same rank for Oman.
Table 4 A comparison of the ranks of the motivating factors for Malaysian and Omani employees
Factors Malaysia Oman
Good working conditions 2 1 Promotion 3 2 High wages 1 3 Providing opportunities to grow through learning new things 7 4 Full appreciation of work done 6 5 Job security 4 6 Job responsibility 8 7 Sensible company rules, regulations, procedures, and policies 9 8 Management’s help to solve personal problems 10 9 Interesting work 5 10
It appears that Malaysians are more concerned on ‘full appreciation of work done’ over ‘providing opportunities to grow through learning new things’ whereas Omani employees prefer ‘job security’ over ‘job responsibility’. Though for Malaysia ‘good working conditions’ is on the second position but for Oman, ‘promotion’ occupies the same position. However, both Malaysian and Omani employees are not much attracted by the ‘sensible company rules, regulations, procedures and policies’ compared with the other factors. In both the countries, employees do not prefer ‘management’s help to solve personal problems’, either.
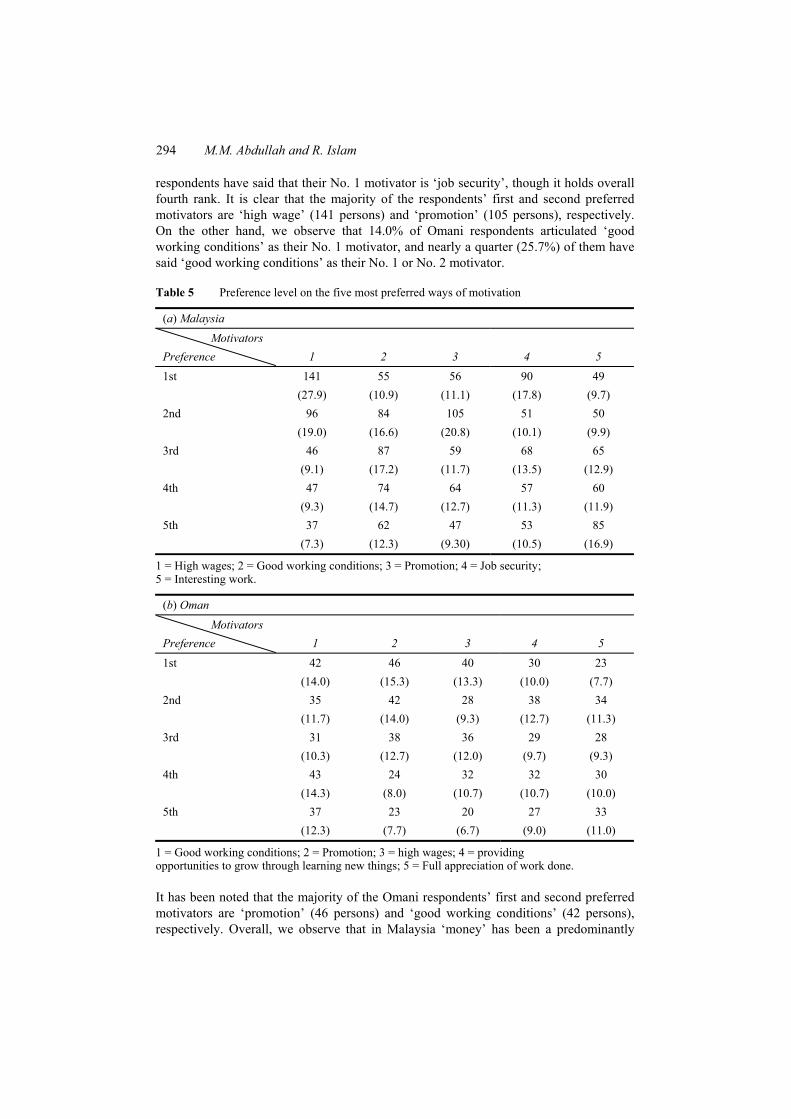
Table 5(a) and (b) provides some more findings. It has been noted that 27.9% of the respondents in Malaysia chose ‘high wages’ as their No. 1 motivator; in fact, nearly half (46.9%) of the Malaysian respondents have said ‘high wages’ as their No. 1 or No. 2 motivator. It is clear that no other motivator comes even closer to ‘high wages’. After ‘high wages’, the second most preferred motivator is ‘job security’; 17.8% of the
294 M.M. Abdullah and R. Islam
respondents have said that their No. 1 motivator is ‘job security’, though it holds overall fourth rank. It is clear that the majority of the respondents’ first and second preferred motivators are ‘high wage’ (141 persons) and ‘promotion’ (105 persons), respectively. On the other hand, we observe that 14.0% of Omani respondents articulated ‘good working conditions’ as their No. 1 motivator, and nearly a quarter (25.7%) of them have said ‘good working conditions’ as their No. 1 or No. 2 motivator.
Table 5 Preference level on the five most preferred ways of motivation
(a) Malaysia
Motivators Preference 1 2 3 4 5
1st 141 (27.9)
55 (10.9)
56 (11.1)
90 (17.8)
49 (9.7)
2nd 96 (19.0)
84 (16.6)
105 (20.8)
51 (10.1)
50 (9.9)
3rd 46 (9.1)
87 (17.2)
59 (11.7)
68 (13.5)
65 (12.9)
4th 47 (9.3)
74 (14.7)
64 (12.7)
57 (11.3)
60 (11.9)
5th 37 (7.3)
62 (12.3)
47 (9.30)
53 (10.5)
85 (16.9)
1 = High wages; 2 = Good working conditions; 3 = Promotion; 4 = Job security; 5 = Interesting work.
(b) Oman
Motivators Preference 1 2 3 4 5
1st 42 (14.0)
46 (15.3)
40 (13.3)
30 (10.0)
23 (7.7)
2nd 35 (11.7)
42 (14.0)
28 (9.3)
38 (12.7)
34 (11.3)
3rd 31 (10.3)
38 (12.7)
36 (12.0)
29 (9.7)
28 (9.3)
4th 43 (14.3)
24 (8.0)
32 (10.7)
32 (10.7)
30 (10.0)
5th 37 (12.3)
23 (7.7)
20 (6.7)
27 (9.0)
33 (11.0)
1 = Good working conditions; 2 = Promotion; 3 = high wages; 4 = providing opportunities to grow through learning new things; 5 = Full appreciation of work done.
It has been noted that the majority of the Omani respondents’ first and second preferred motivators are ‘promotion’ (46 persons) and ‘good working conditions’ (42 persons), respectively. Overall, we observe that in Malaysia ‘money’ has been a predominantly
Employee motivational factors 295
preferred motivator while ‘good working conditions’ is considered as the most effective motivator for Omani employees. It is further noted that, for both the countries, ‘promotion’ has been uniformly favoured as it is evident from its rank 1 through 5, and consequently, it has been placed into the third position ahead of ‘job security’ and ‘interesting work’ for Malaysia and second position ahead of ‘high wages’, ‘opportunity to learn new things’ and ‘full appreciation of work done’ for Oman.
5 Analysis based on demographic factors
The respondents’ demographic factors such as gender, age and education level may influence their preference on the motivating factors (the term ‘preference’ is used throughout to indicate that if the motivating factors are offered to the employees, then individually they can rank them (factors) in terms of effectiveness to motivate them). Kovach (1980, p.57) writes:
“Individuals at different organisation levels, with different earning power, may have different motivational values. Hence what motivates individuals at one level of the organisation may not motivate those at another level. This necessitates differentiating by income level and other demographic factors when analysing attitudes for motivational purposes.”
Ranks of the previously mentioned 10 motivating factors have been computed separately with respect to: gender (male, female), age (21–25, 26–30, 31–35, 36–40, 41–50 years), education (certificate, professional, bachelor’s, master’s, PhD), marital status (single, married) and employment status (executive, non-executive).
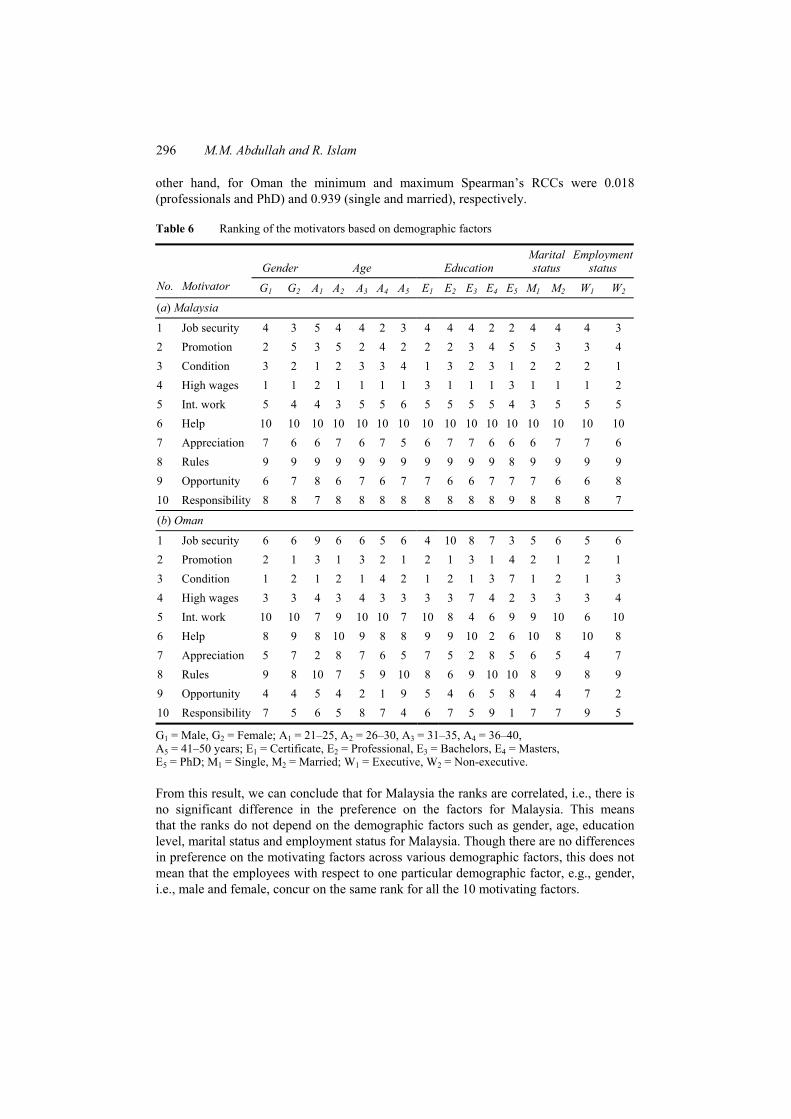
Details are shown in Table 6(a) and (b). From these tables, we can conclude that the overall ranking of all the 10 motivating factors (see Table 2) are more or less corroborated by the respondents belonging to different levels of the demographic factors. For instance, the overall rank of ‘high wages’ for Malaysia is 1, which is the rank for majority of the employees across various demographic factors. The same observation is made for the Sultanate of Oman where the overall rank of ‘promotion’ is 2, which is also the rank for many of the employees across various demographic factors.
The rank of ‘management’s help’, which is 10 across all types of Malaysian employees, is the same as the overall rank. However, for Omani employees, ‘interesting work’ possesses 10th rank and the corresponding row in Table 6(b) reveals a uniform pattern that match with this overall rank. A similar phenomenon is observed for the remaining motivating factors.
Spearman’s Rank Correlation Coefficient (RCC) is computed for each combination of levels within each factor and the corresponding non-parametric hypothesis test has been performed using SPSS. The results have been shown in Table 7(a) and (b).
All the RCCs are significant at p = 0.01 for Malaysia. While for Oman, it has been observed that RCCs are significant at p = 0.01 for (male & female), (age groups 21–25 and 41–50 years), (age groups 26–30 and 31–35 years), (age groups 26–30 and 36–40 years), (age groups 31–35 and 36–40 years) and (single and married). The RCCs between various levels of the remaining factors are not statistically significant.
The minimum and maximum RCCs were found to be 0.830 (age groups 26–30 and 41–50 years) and 0.988 (professionals and bachelor’s), respectively, for Malaysia. On the
296 M.M. Abdullah and R. Islam
other hand, for Oman the minimum and maximum Spearman’s RCCs were 0.018 (professionals and PhD) and 0.939 (single and married), respectively.
Table 6 Ranking of the motivators based on demographic factors
Gender Age Education Marital status
Employment status
No. Motivator G1 G2 A1 A2 A3 A4 A5 E1 E2 E3 E4 E5 M1 M2 W1 W2
(a) Malaysia
1 Job security 4 3 5 4 4 2 3 4 4 4 2 2 4 4 4 3 2 Promotion 2 5 3 5 2 4 2 2 2 3 4 5 5 3 3 4 3 Condition 3 2 1 2 3 3 4 1 3 2 3 1 2 2 2 1 4 High wages 1 1 2 1 1 1 1 3 1 1 1 3 1 1 1 2 5 Int. work 5 4 4 3 5 5 6 5 5 5 5 4 3 5 5 5 6 Help 10 10 10 10 10 10 10 10 10 10 10 10 10 10 10 10 7 Appreciation 7 6 6 7 6 7 5 6 7 7 6 6 6 7 7 6 8 Rules 9 9 9 9 9 9 9 9 9 9 9 8 9 9 9 9 9 Opportunity 6 7 8 6 7 6 7 7 6 6 7 7 7 6 6 8 10 Responsibility 8 8 7 8 8 8 8 8 8 8 8 9 8 8 8 7
(b) Oman
1 Job security 6 6 9 6 6 5 6 4 10 8 7 3 5 6 5 6 2 Promotion 2 1 3 1 3 2 1 2 1 3 1 4 2 1 2 1 3 Condition 1 2 1 2 1 4 2 1 2 1 3 7 1 2 1 3 4 High wages 3 3 4 3 4 3 3 3 3 7 4 2 3 3 3 4 5 Int. work 10 10 7 9 10 10 7 10 8 4 6 9 9 10 6 10 6 Help 8 9 8 10 9 8 8 9 9 10 2 6 10 8 10 8 7 Appreciation 5 7 2 8 7 6 5 7 5 2 8 5 6 5 4 7 8 Rules 9 8 10 7 5 9 10 8 6 9 10 10 8 9 8 9 9 Opportunity 4 4 5 4 2 1 9 5 4 6 5 8 4 4 7 2 10 Responsibility 7 5 6 5 8 7 4 6 7 5 9 1 7 7 9 5
G1 = Male, G2 = Female; A1 = 21–25, A2 = 26–30, A3 = 31–35, A4 = 36–40, A5 = 41–50 years; E1 = Certificate, E2 = Professional, E3 = Bachelors, E4 = Masters, E5 = PhD; M1 = Single, M2 = Married; W1 = Executive, W2 = Non-executive.
From this result, we can conclude that for Malaysia the ranks are correlated, i.e., there is no significant difference in the preference on the factors for Malaysia. This means that the ranks do not depend on the demographic factors such as gender, age, education level, marital status and employment status for Malaysia. Though there are no differences in preference on the motivating factors across various demographic factors, this does not mean that the employees with respect to one particular demographic factor, e.g., gender, i.e., male and female, concur on the same rank for all the 10 motivating factors.
Employee motivational factors 297
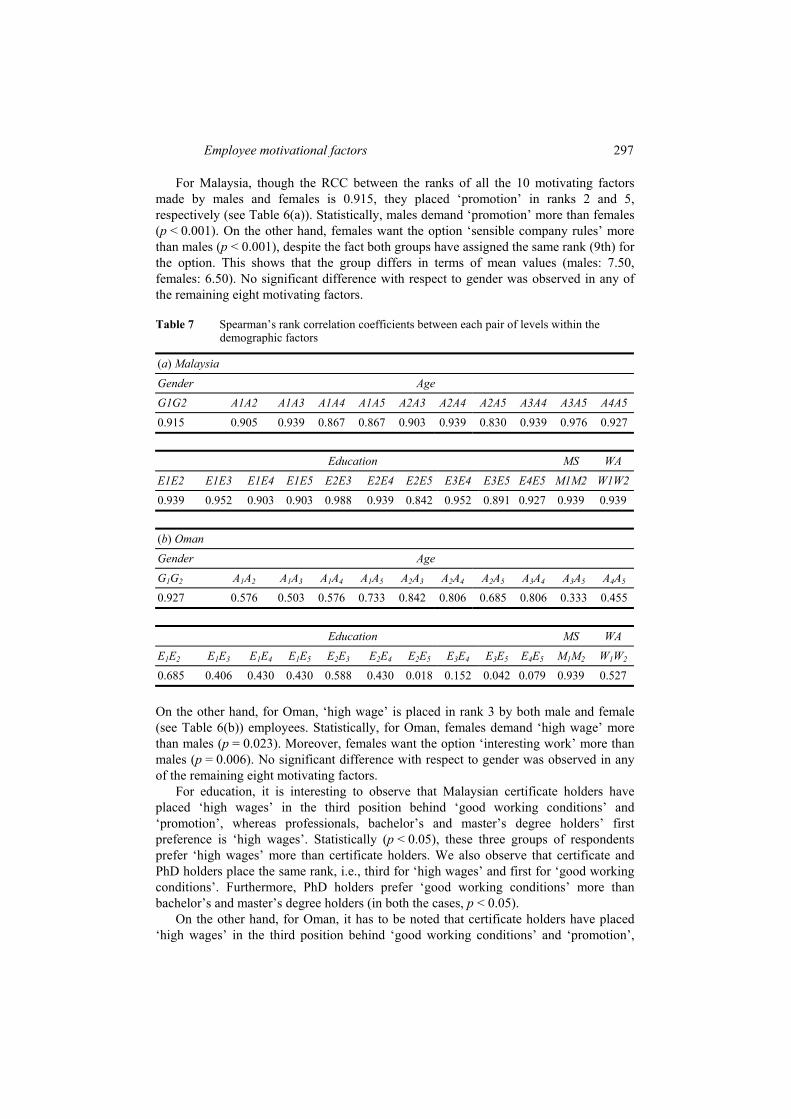
For Malaysia, though the RCC between the ranks of all the 10 motivating factors made by males and females is 0.915, they placed ‘promotion’ in ranks 2 and 5, respectively (see Table 6(a)). Statistically, males demand ‘promotion’ more than females (p < 0.001). On the other hand, females want the option ‘sensible company rules’ more than males (p < 0.001), despite the fact both groups have assigned the same rank (9th) for the option. This shows that the group differs in terms of mean values (males: 7.50, females: 6.50). No significant difference with respect to gender was observed in any of the remaining eight motivating factors.
Table 7 Spearman’s rank correlation coefficients between each pair of levels within the demographic factors
(a) Malaysia
Gender Age G1G2 A1A2 A1A3 A1A4 A1A5 A2A3 A2A4 A2A5 A3A4 A3A5 A4A5
0.915 0.905 0.939 0.867 0.867 0.903 0.939 0.830 0.939 0.976 0.927
Education MS WA
E1E2 E1E3 E1E4 E1E5 E2E3 E2E4 E2E5 E3E4 E3E5 E4E5 M1M2 W1W2 0.939 0.952 0.903 0.903 0.988 0.939 0.842 0.952 0.891 0.927 0.939 0.939
(b) Oman
Gender Age G1G2 A1A2 A1A3 A1A4 A1A5 A2A3 A2A4 A2A5 A3A4 A3A5 A4A5
0.927 0.576 0.503 0.576 0.733 0.842 0.806 0.685 0.806 0.333 0.455
Education MS WA
E1E2 E1E3 E1E4 E1E5 E2E3 E2E4 E2E5 E3E4 E3E5 E4E5 M1M2 W1W2
0.685 0.406 0.430 0.430 0.588 0.430 0.018 0.152 0.042 0.079 0.939 0.527
On the other hand, for Oman, ‘high wage’ is placed in rank 3 by both male and female (see Table 6(b)) employees. Statistically, for Oman, females demand ‘high wage’ more than males (p = 0.023). Moreover, females want the option ‘interesting work’ more than males (p = 0.006). No significant difference with respect to gender was observed in any of the remaining eight motivating factors.
For education, it is interesting to observe that Malaysian certificate holders have placed ‘high wages’ in the third position behind ‘good working conditions’ and ‘promotion’, whereas professionals, bachelor’s and master’s degree holders’ first preference is ‘high wages’. Statistically (p < 0.05), these three groups of respondents prefer ‘high wages’ more than certificate holders. We also observe that certificate and PhD holders place the same rank, i.e., third for ‘high wages’ and first for ‘good working conditions’. Furthermore, PhD holders prefer ‘good working conditions’ more than bachelor’s and master’s degree holders (in both the cases, p < 0.05).
On the other hand, for Oman, it has to be noted that certificate holders have placed ‘high wages’ in the third position behind ‘good working conditions’ and ‘promotion’,
298 M.M. Abdullah and R. Islam
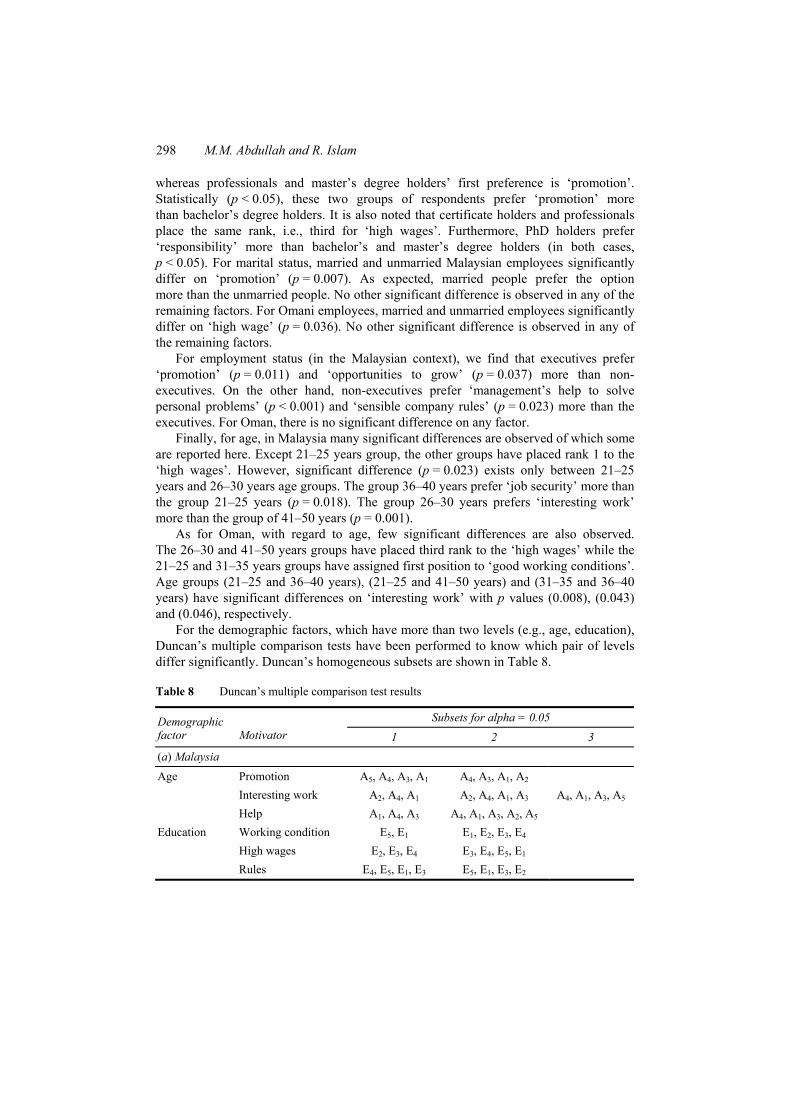
whereas professionals and master’s degree holders’ first preference is ‘promotion’. Statistically (p < 0.05), these two groups of respondents prefer ‘promotion’ more than bachelor’s degree holders. It is also noted that certificate holders and professionals place the same rank, i.e., third for ‘high wages’. Furthermore, PhD holders prefer ‘responsibility’ more than bachelor’s and master’s degree holders (in both cases, p < 0.05). For marital status, married and unmarried Malaysian employees significantly differ on ‘promotion’ (p = 0.007). As expected, married people prefer the option more than the unmarried people. No other significant difference is observed in any of the remaining factors. For Omani employees, married and unmarried employees significantly differ on ‘high wage’ (p = 0.036). No other significant difference is observed in any of the remaining factors.
For employment status (in the Malaysian context), we find that executives prefer ‘promotion’ (p = 0.011) and ‘opportunities to grow’ (p = 0.037) more than non-executives. On the other hand, non-executives prefer ‘management’s help to solve personal problems’ (p < 0.001) and ‘sensible company rules’ (p = 0.023) more than the executives. For Oman, there is no significant difference on any factor.
Finally, for age, in Malaysia many significant differences are observed of which some are reported here. Except 21–25 years group, the other groups have placed rank 1 to the ‘high wages’. However, significant difference (p = 0.023) exists only between 21–25 years and 26–30 years age groups. The group 36–40 years prefer ‘job security’ more than the group 21–25 years (p = 0.018). The group 26–30 years prefers ‘interesting work’ more than the group of 41–50 years (p = 0.001).
As for Oman, with regard to age, few significant differences are also observed. The 26–30 and 41–50 years groups have placed third rank to the ‘high wages’ while the 21–25 and 31–35 years groups have assigned first position to ‘good working conditions’. Age groups (21–25 and 36–40 years), (21–25 and 41–50 years) and (31–35 and 36–40 years) have significant differences on ‘interesting work’ with p values (0.008), (0.043) and (0.046), respectively.
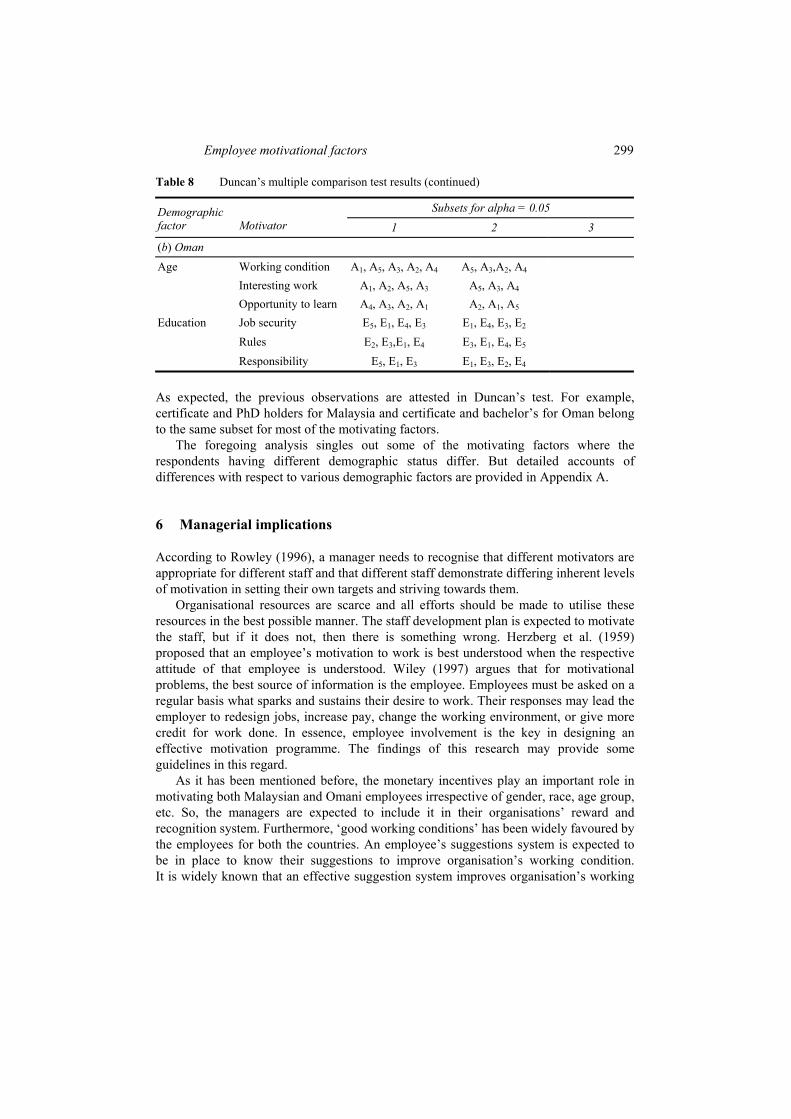
For the demographic factors, which have more than two levels (e.g., age, education), Duncan’s multiple comparison tests have been performed to know which pair of levels differ significantly. Duncan’s homogeneous subsets are shown in Table 8.
Table 8 Duncan’s multiple comparison test results
Subsets for alpha = 0.05 Demographic factor Motivator 1 2 3
(a) Malaysia
Age Promotion Interesting work Help
A5, A4, A3, A1
A2, A4, A1 A1, A4, A3
A4, A3, A1, A2 A2, A4, A1, A3
A4, A1, A3, A2, A5
A4, A1, A3, A5
Education Working condition
High wages Rules
E5, E1 E2, E3, E4
E4, E5, E1, E3
E1, E2, E3, E4 E3, E4, E5, E1 E5, E1, E3, E2
Employee motivational factors 299
Table 8 Duncan’s multiple comparison test results (continued)
Subsets for alpha = 0.05 Demographic factor Motivator 1 2 3
(b) Oman Age Working condition
Interesting work Opportunity to learn
A1, A5, A3, A2, A4
A1, A2, A5, A3 A4, A3, A2, A1
A5, A3,A2, A4 A5, A3, A4 A2, A1, A5
Job security E5, E1, E4, E3 E1, E4, E3, E2 Rules E2, E3,E1, E4 E3, E1, E4, E5
Education
Responsibility E5, E1, E3 E1, E3, E2, E4
As expected, the previous observations are attested in Duncan’s test. For example, certificate and PhD holders for Malaysia and certificate and bachelor’s for Oman belong to the same subset for most of the motivating factors.
The foregoing analysis singles out some of the motivating factors where the respondents having different demographic status differ. But detailed accounts of differences with respect to various demographic factors are provided in Appendix A.
6 Managerial implications
According to Rowley (1996), a manager needs to recognise that different motivators are appropriate for different staff and that different staff demonstrate differing inherent levels of motivation in setting their own targets and striving towards them.
Organisational resources are scarce and all efforts should be made to utilise these resources in the best possible manner. The staff development plan is expected to motivate the staff, but if it does not, then there is something wrong. Herzberg et al. (1959) proposed that an employee’s motivation to work is best understood when the respective attitude of that employee is understood. Wiley (1997) argues that for motivational problems, the best source of information is the employee. Employees must be asked on a regular basis what sparks and sustains their desire to work. Their responses may lead the employer to redesign jobs, increase pay, change the working environment, or give more credit for work done. In essence, employee involvement is the key in designing an effective motivation programme. The findings of this research may provide some guidelines in this regard.
As it has been mentioned before, the monetary incentives play an important role in motivating both Malaysian and Omani employees irrespective of gender, race, age group, etc. So, the managers are expected to include it in their organisations’ reward and recognition system. Furthermore, ‘good working conditions’ has been widely favoured by the employees for both the countries. An employee’s suggestions system is expected to be in place to know their suggestions to improve organisation’s working condition. It is widely known that an effective suggestion system improves organisation’s working
300 M.M. Abdullah and R. Islam
condition and saves organisation’s resources from getting wasted (Bassford and Charles, 1996; Trunko, 1993). Managerial actions on the basis of demographic factors are described here:
Gender: It is noted that Malaysian female employees prefer ‘sensible company rules’ more than males. The managers are expected to pay more attention to protect the rights of female employees and all measures should be taken to ensure that they are not harassed. In the context of Oman, since female employees are significantly more interested on ‘interesting work’, compared with males, a proper job design that will include some interesting elements in the job, whenever and wherever possible should be in place.
Education: Malaysia – Employees possessing higher qualifications such as PhD require good working conditions and job security. Since they are relatively on the upper echelon of educational qualifications, they may have plentiful opportunities outside; managers/administrators should provide a good working condition in retaining them. Special emphasis should be placed on their reward and recognition and job design. Oman – PhD holders will be highly motivated towards higher job responsibility; therefore, job enrichment is a desired and viable option for them. Because of their higher qualification, they also expect high wages from the employers. On the other hand, certificate and professional degree holders are expected to be motivated by providing monetary incentives to them.
Employment status: Malaysia – Though ‘management’s help to solve personal problems’ is least preferred among the motivators surveyed in Malaysia, but as far as this is concerned, managers should keep in mind that non-executives need their help more than executives. Oman – Non-executives have widely favoured the item ‘opportunity to grow through learning new thing’. Some options are: training on various issues, attending conferences and workshops, management/team leadership experience, etc. Job enlargement and enrichment are also relevant in this regard. More often than not, higher job responsibilities are given to the executives; however, non-executives have also raised voices in favour of some job responsibilities so that they can become satisfied by having a sense of ‘accomplishing a job’. Furthermore, executives expect more appreciation from the management for their job well-done.
7 Conclusions
Motivating employees is a crucial job for any manager of any organisation – public or private. In many organisations, managers make serious mistakes by thinking that what motivate themselves would also motivate the employees down the line. Managers need to come down to the employees and ask their motivators. It has been emphasised that employee involvement is crucial for the success of any motivation programme. This survey research has identified the important elements of employee motivation for both Malaysia and Sultanate of Oman. Overall, the three most effective motivating factors for both countries are: high wages, good working conditions and promotion.
Employee motivational factors 301
This list is followed by the following three effective factors, namely job security, full appreciation of work done and opportunity to grow through learning new things.
Non-declining rate of productivity is a prerequisite for organisation’s survival in the competitive business world; however, productivity improvement requires more than just customer service, technology, decentralisation, or process reengineering. Success or failure of these approaches depends largely on the motivation of the employees who are asked to implement them. The guidelines provided here are expected to help managers in developing effective motivation programmes.
Acknowledgements
The authors would like to gratefully acknowledge the contribution made by Dhikrayat Al Zakwani in preparing this paper. The authors also would like to express appreciation to the anonymous reviewers for their insightful comments.
References Adams, J.S. (1965) ‘Inequity in social exchange’, in Berkowitz, L. (Ed.): Advances in Experimental
Social Psychology, Academic Press, New York, pp.267–299. Bassford, R.L. and Charles, L.M. (1996) Employee Suggestion System: Boosting Productivity and
Profits, Crisp Publications, Lanham. Bedelian, A.G. (1993) Management, 3rd ed., Dryden Press, New York. Bowen, B.E. and Radhakrishna, R.B. (1991) ‘Job satisfaction of agricultural education faculty:
a constant phenomena’, Journal of Agricultural Education, Vol. 32, No. 2, pp.16–22. Buford, J.A. Jr., Bedeian, A.G. and Lindner, J.R. (1995) Management in Extension, 3rd ed.,
Ohio State University Extension, Columbus, Ohio. Cruz, N.M., Pérez, V.M. and Cantero, C.T. (2009) ‘The influence of employee motivation on
knowledge transfer’, Journal of Knowledge Management, Vol. 13, No. 6, pp.478–490. Flynn, S. (2011) ‘Can you directly motivate employees? Exploding the myth’, Development and
Learning in Organizations, Vol. 25, No. 1, pp.11–15. Harell, G. and Daim, T.U. (2010) ‘HDM modeling as a tool to assist management with employee
motivation: the case of silicon forest’, Engineering Management Journal, Vol. 22, No. 1, pp.23–33.
Herzberg, F., Maunser, B. and Snyderman, B. (1959) The Motivation to Work, John Wiley and Sons, Inc., New York.
Higgins, J.M. (1994) The Management Challenge, 2nd ed., Macmillan, New York. Islam, R. and Ismail, A.Z. (2008) ‘Employee motivation: a Malaysian perspective’, International
Journal of Commerce and Management, Vol. 18, No. 4, pp.344–362. Jurkiewicz, C.L. and Massey, T.K. (1997) ‘What motivates municipal employees: a comparison
study of supervisory vs. non-supervisory personnel’, Public Personnel Management, Vol. 26, No. 3, pp.367–377.
Kovach, K.A. (1987) ‘What motivates employees? Workers and supervisors give different answers’, Business Horizons, Vol. 30, pp.58–65.
Kovach, K.A. (1980) ‘Why motivational theories don’t work?’, SAM Advanced Management Journal, Vol. 2, pp.54–59.

302 M.M. Abdullah and R. Islam
Kreitner, R. (1995) Management, 6th ed., Houghton Mifflin Company, Boston. Lindner, J.R. (1998) ‘Understanding employee motivation’, Journal of Extension, Vol. 36, No. 3,
pp.1–8. Malik, N. (2010) ‘A study on motivational factors of the faculty members at university of
Balochistan’, Serbian Journal of Management, Vol. 5, No. 1, pp.143–149. Maslow, A.H. (1943) ‘A theory of human motivation’, Psychological Review, July, pp.370–396. Rai, S. (2004) ‘Motivational theories and incentive approaches’, IIMB Management Review,
December, pp.43–50. Rowley, J. (1996) ‘Motivation and academic staff in higher education’, Quality Assurance in
Higher Education, Vol. 4, pp.11–16. Skinner, B.F. (1953) Science and Human Behavior, Free Press, New York. Terpstra, D.E. (1979) ‘Theories of motivation: borrowing the best’, Personnel Journal, Vol. 58,
p.376. Trunko, M.E. (1993) ‘Open to suggestions: suggestion systems are changing to meet today’s needs
for employee involvement’, HR Magazine, February, pp.85–89. Vroom, V.H. (1964) Work and Motivation, Wiley, New York. Walker, J.R. and Miller, J.E. (2010) Supervision in the Hospitality Industry: Leading Human
Resources, John Wiley & Sons, New Jersey, USA. Warr, P. (2007) Work, Happiness and Unhappiness, Lawrence Erlbaum Associates, New Jersey. Wiley, C. (1997) ‘What motivate employees according to over 40 years of motivation surveys’,
International Journal of Manpower, Vol. 18, No. 3, pp.263–280.
Appendix A: Analysis of motivation factors based upon demographic information
(a) Malaysia
Demographic factor Level
Differ significantly on (p < 0.05) Remark
E1E2
(0.939) High wages (E1 = 3, E2 = 1)
Professional degree holders prefer the motivator more than the Certificate holders
E1E3 (0.952)
High wages (E1 = 3, E3 = 1)
Bachelor degree holders prefer the motivator more than the Certificate holders
E1E4 (0.903)
High wages (E1 = 3, E4 = 1)
Master degree holders prefer the Motivator more than the certificate holders
E2E5 (0.842)
High wages (E2 = 1, E5 = 3)
Professional degree holders prefer the motivator more than PhD degree holders
E3E5 (0.891)
Working condition (E3 = 2, E5 = 1)
PhD degree holders prefer the motivator more than Bachelors
Education
E4E5 (0.927)
Working condition (E2 = 3, E5 = 1)
PhD degree holders prefer the motivator more than masters degree holders
Marital status M1M2 (0.939)
Promotion (M1 = 5, M2 = 3)
Married people prefer the motivator more than single people
Employee motivational factors 303
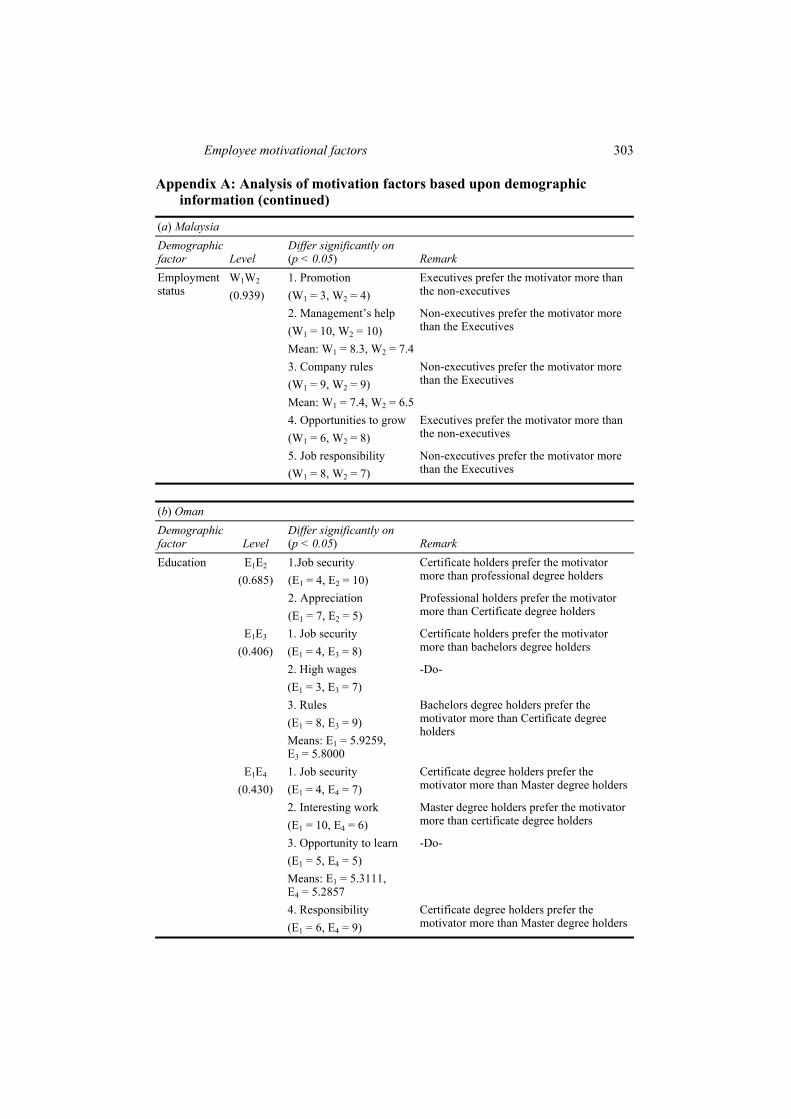
Appendix A: Analysis of motivation factors based upon demographic information (continued)
(a) Malaysia Demographic factor Level
Differ significantly on (p < 0.05) Remark 1. Promotion (W1 = 3, W2 = 4)
Executives prefer the motivator more than the non-executives
2. Management’s help (W1 = 10, W2 = 10) Mean: W1 = 8.3, W2 = 7.4
Non-executives prefer the motivator more than the Executives
3. Company rules (W1 = 9, W2 = 9) Mean: W1 = 7.4, W2 = 6.5
Non-executives prefer the motivator more than the Executives
4. Opportunities to grow (W1 = 6, W2 = 8)
Executives prefer the motivator more than the non-executives
Employment status
W1W2 (0.939)
5. Job responsibility (W1 = 8, W2 = 7)
Non-executives prefer the motivator more than the Executives
(b) Oman Demographic factor Level
Differ significantly on (p < 0.05) Remark 1.Job security (E1 = 4, E2 = 10)
Certificate holders prefer the motivator more than professional degree holders
E1E2
(0.685) 2. Appreciation (E1 = 7, E2 = 5)
Professional holders prefer the motivator more than Certificate degree holders
1. Job security (E1 = 4, E3 = 8)
Certificate holders prefer the motivator more than bachelors degree holders
2. High wages (E1 = 3, E3 = 7)
-Do-
Education
E1E3
(0.406)
3. Rules (E1 = 8, E3 = 9) Means: E1 = 5.9259, E3 = 5.8000
Bachelors degree holders prefer the motivator more than Certificate degree holders
1. Job security (E1 = 4, E4 = 7)
Certificate degree holders prefer the motivator more than Master degree holders
2. Interesting work (E1 = 10, E4 = 6)
Master degree holders prefer the motivator more than certificate degree holders
3. Opportunity to learn (E1 = 5, E4 = 5) Means: E1 = 5.3111, E4 = 5.2857
-Do-
E1E4
(0.430)
4. Responsibility (E1 = 6, E4 = 9)
Certificate degree holders prefer the motivator more than Master degree holders
304 M.M. Abdullah and R. Islam
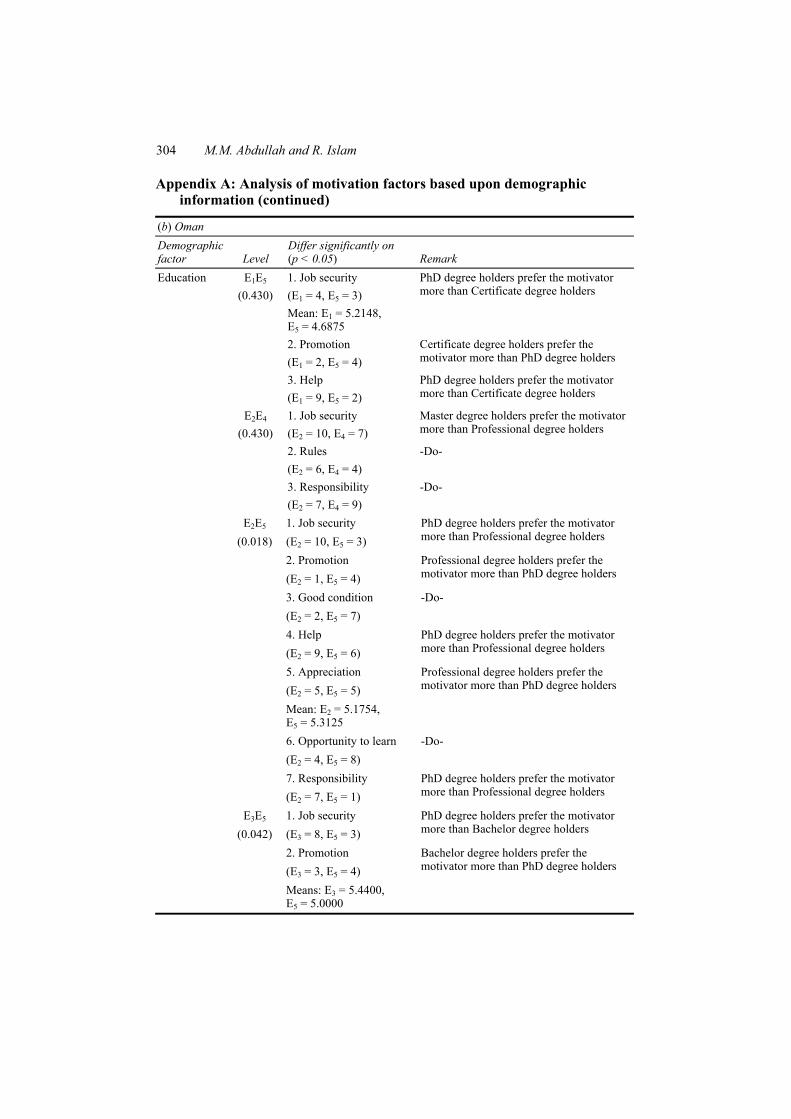
Appendix A: Analysis of motivation factors based upon demographic information (continued)
(b) Oman Demographic factor Level
Differ significantly on (p < 0.05) Remark 1. Job security (E1 = 4, E5 = 3) Mean: E1 = 5.2148, E5 = 4.6875
PhD degree holders prefer the motivator more than Certificate degree holders
2. Promotion (E1 = 2, E5 = 4)
Certificate degree holders prefer the motivator more than PhD degree holders
Education E1E5
(0.430)
3. Help (E1 = 9, E5 = 2)
PhD degree holders prefer the motivator more than Certificate degree holders
1. Job security (E2 = 10, E4 = 7)
Master degree holders prefer the motivator more than Professional degree holders
2. Rules (E2 = 6, E4 = 4)
-Do-
E2E4
(0.430)
3. Responsibility (E2 = 7, E4 = 9)
-Do-
1. Job security (E2 = 10, E5 = 3)
PhD degree holders prefer the motivator more than Professional degree holders
2. Promotion (E2 = 1, E5 = 4)
Professional degree holders prefer the motivator more than PhD degree holders
3. Good condition (E2 = 2, E5 = 7)
-Do-
4. Help (E2 = 9, E5 = 6)
PhD degree holders prefer the motivator more than Professional degree holders
5. Appreciation (E2 = 5, E5 = 5) Mean: E2 = 5.1754, E5 = 5.3125
Professional degree holders prefer the motivator more than PhD degree holders
6. Opportunity to learn (E2 = 4, E5 = 8)
-Do-
E2E5
(0.018)
7. Responsibility (E2 = 7, E5 = 1)
PhD degree holders prefer the motivator more than Professional degree holders
1. Job security (E3 = 8, E5 = 3)
PhD degree holders prefer the motivator more than Bachelor degree holders
E3E5
(0.042) 2. Promotion (E3 = 3, E5 = 4) Means: E3 = 5.4400, E5 = 5.0000
Bachelor degree holders prefer the motivator more than PhD degree holders
Employee motivational factors 305
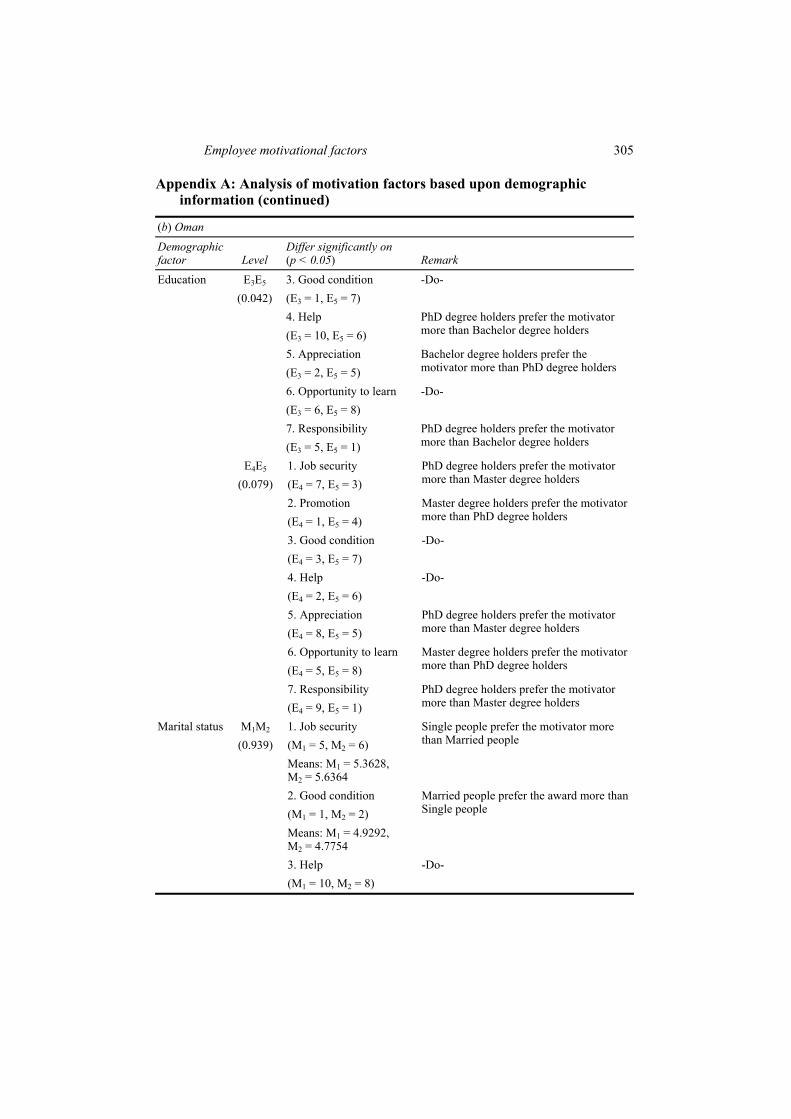
Appendix A: Analysis of motivation factors based upon demographic information (continued)
(b) Oman
Demographic factor Level
Differ significantly on (p < 0.05) Remark
3. Good condition (E3 = 1, E5 = 7)
-Do-
4. Help (E3 = 10, E5 = 6)
PhD degree holders prefer the motivator more than Bachelor degree holders
5. Appreciation (E3 = 2, E5 = 5)
Bachelor degree holders prefer the motivator more than PhD degree holders
6. Opportunity to learn (E3 = 6, E5 = 8)
-Do-
Education E3E5
(0.042)
7. Responsibility (E3 = 5, E5 = 1)
PhD degree holders prefer the motivator more than Bachelor degree holders
1. Job security (E4 = 7, E5 = 3)
PhD degree holders prefer the motivator more than Master degree holders
2. Promotion (E4 = 1, E5 = 4)
Master degree holders prefer the motivator more than PhD degree holders
3. Good condition (E4 = 3, E5 = 7)
-Do-
4. Help (E4 = 2, E5 = 6)
-Do-
5. Appreciation (E4 = 8, E5 = 5)
PhD degree holders prefer the motivator more than Master degree holders
6. Opportunity to learn (E4 = 5, E5 = 8)
Master degree holders prefer the motivator more than PhD degree holders
E4E5
(0.079)
7. Responsibility (E4 = 9, E5 = 1)
PhD degree holders prefer the motivator more than Master degree holders
1. Job security (M1 = 5, M2 = 6) Means: M1 = 5.3628, M2 = 5.6364
Single people prefer the motivator more than Married people
2. Good condition (M1 = 1, M2 = 2) Means: M1 = 4.9292, M2 = 4.7754
Married people prefer the award more than Single people
Marital status M1M2 (0.939)
3. Help (M1 = 10, M2 = 8)
-Do-
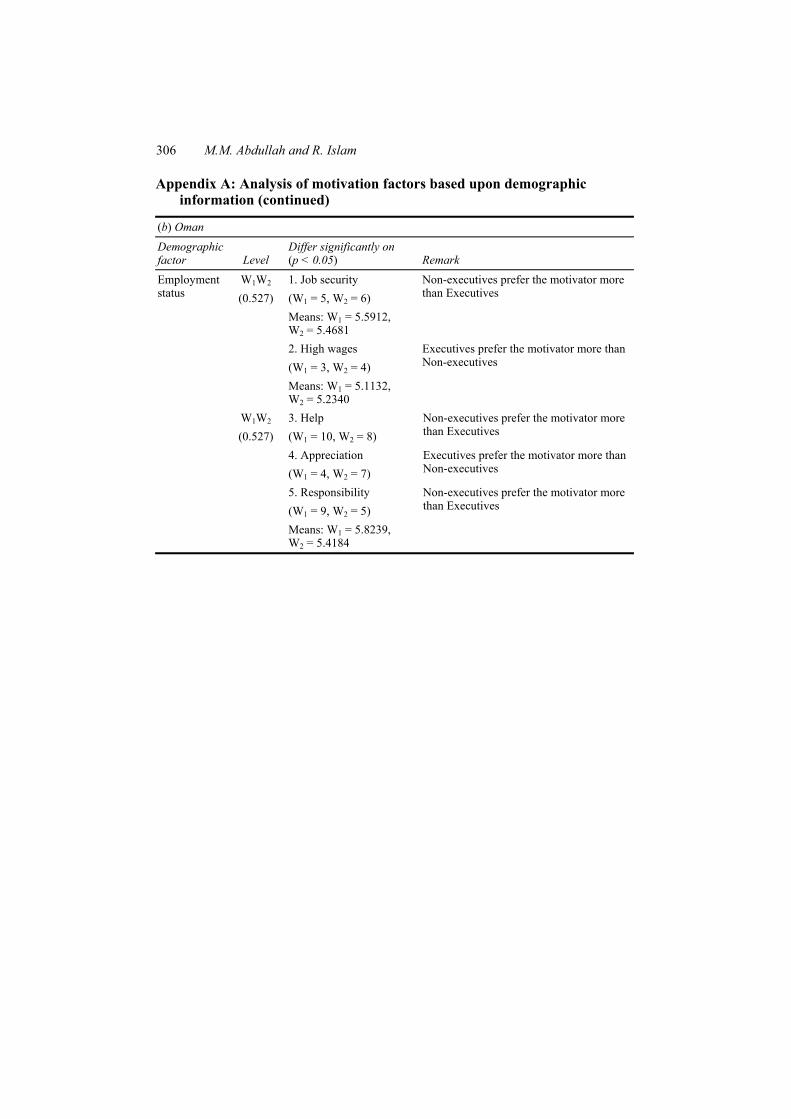
306 M.M. Abdullah and R. Islam
Appendix A: Analysis of motivation factors based upon demographic information (continued)
(b) Oman
Demographic factor Level
Differ significantly on (p < 0.05) Remark
1. Job security (W1 = 5, W2 = 6) Means: W1 = 5.5912, W2 = 5.4681
Non-executives prefer the motivator more than Executives
Employment status
W1W2 (0.527)
2. High wages (W1 = 3, W2 = 4) Means: W1 = 5.1132, W2 = 5.2340
Executives prefer the motivator more than Non-executives
3. Help (W1 = 10, W2 = 8)
Non-executives prefer the motivator more than Executives
4. Appreciation (W1 = 4, W2 = 7)
Executives prefer the motivator more than Non-executives
W1W2 (0.527)
5. Responsibility (W1 = 9, W2 = 5) Means: W1 = 5.8239, W2 = 5.4184
Non-executives prefer the motivator more than Executives