Embed Size (px)
Citation preview
MPRAMunich Personal RePEc Archive
Is Globalization fit for Social Europe?
Arno Tausch
Innsbruck University, Department of Political Science
24. March 2009
Online at http://mpra.ub.uni-muenchen.de/14264/MPRA Paper No. 14264, posted 27. March 2009 17:33 UTC
C:\Dokumente und Einstellungen\wj1\Lokale Einstellungen\Temporary Internet Files\OLKE6\20_01_2009_Transnationale
Konzerne und die Krise in Europa.doc
1
Ist die Globalisierung fit für das soziale Europa?
[Is Globalization fit for Social Europe?]
Arno TAUSCH Adjunct Professor of Political Science at Innsbruck University
E-mail: [email protected] Abstract: This analysis first of all shows with the latest empirical regional and other statistics of the OECD the true dimension of the Lisbon gap between Europe and the Western overseas democracies. The neo-liberal politicy consensus in Europe always assumed that the continuation of neo-liberal globalization is a "precondition" of a successful European "Lisbon Strategy". A recent Centre for European Policy Studies even asked: “Is Social Europe Fit for Globalisation?” We turn this question around and ask ourselves: is globalization fit for social Europe? It is now obvious, not only at the level of the 27 nationally organized member countries of the EU that the validity of such a strategy is highly dubious. The Fifth interim report on economic and social cohesion (dated June 2008) by the European Commission COM (2008) 371, 18 june 2008, still makes very far-reaching and sometimes very bold statements about the causes of regional convergence in Europe. It speaks about the continued strong growth in poorer regions, it maintains that growth in the regions concentrated in knowledge-
C:\Dokumente und Einstellungen\wj1\Lokale Einstellungen\Temporary Internet Files\OLKE6\20_01_2009_Transnationale
Konzerne und die Krise in Europa.doc
2
intensive sectors, especially financial and business services; trade, transport and communication; high and medium-high tech manufacturing. High-tech manufacturing is highlighted as the one manufacturing sector where the EU retains a competitive advantage. Critical globalization-oriented, quantitative social scientists, particularly in the United States, have maintained for a long time and all along in leading journals of social science that - following the economic theory of monopolistic competition in the tradition of Baran, Kalecki, Rothschild and Sweezy - there seems to be a confirmation of the darker and more negative aspects of the opening up of markets for goods, capital, labor and services, especially by transnational corporations. We analyzed to this effect regional development (economic growth, regional Lisbon performance, unemployment rates and employment rates of older workers) in the entire EU-27, using the freely available Inforegio database of the EU-Commission. Applying a newly constructed 5-point scale of the penetration of European regions by international capital (share of employment for transnational capital in the region per total employment in the region), derived from published Inforegio maps on the issue, the following, multivariate relationships of regional development in Europe hold: 1. There is a "perverse" effect of the regional divergence, mainly implying that rich regions are growing rapidly and poorer regions more slowly 2. The penetration of a region by foreign capital is indeed a significant blockade for all four used indicators 3. Higher education is an essential means to ensure the Lisbon objectives 4. A good demographic growth rate is essential for the achievement of regional development goals Keywords: F15 – Economic integration; F5 - International Relations and International Political Economy; R11 - Regional Economic Activity: Growth,
C:\Dokumente und Einstellungen\wj1\Lokale Einstellungen\Temporary Internet Files\OLKE6\20_01_2009_Transnationale
Konzerne und die Krise in Europa.doc
3
Development, and Changes; R12 - Size and Spatial Distributions of Regional Economic Activity JEL-classification: F15, F5; R11; R12
C:\Dokumente und Einstellungen\wj1\Lokale Einstellungen\Temporary Internet Files\OLKE6\20_01_2009_Transnationale
Konzerne und die Krise in Europa.doc
4
Zusammenfassung Diese Analyse zeigt zunächst mit den neuesten empirischen Regional-und anderen Statistiken der OECD die wahre Dimension der Lissabon-Kluft zwischen Europa und den westlichen Demokratien in Übersee. Der neo-liberale Politik-Konsens ist in Europa immer davon ausgegangen, dass die Fortsetzung der neoliberalen Globalisierung eine "Voraussetzung" einer erfolgreichen europäischen "Lissabon-Strategie" ist. Eine rezente Studie des Centre for European Policy Studies fragte sich sogar: “Is Social Europe Fit for Globalisation?” Wir kehren diese Frage um: Ist die Globalisierung fit für das soziale Europa? Es ist jetzt offensichtlich, nicht nur auf der Ebene der 27 Mitgliedstaaten und auf nationaler Ebene, dass die Gültigkeit einer solchen Strategie sehr zweifelhaft ist. Der Fünfte Zwischenbericht über den wirtschaftlichen und sozialen Zusammenhalt (vom Juni 2008) von der Europäischen Kommission KOM (2008) 371, 18. Juni 2008, macht zwar immer noch sehr weit reichende und manchmal auch sehr stark anmutende Aussagen über die Ursachen für die regionale Konvergenz in Europa. Er spricht über das anhaltend starke Wachstum in den ärmeren Regionen, er sagt dass das Wachstum in den Regionen sich auf wissensintensive Sektoren, vor allem Finanz-und Unternehmensdienstleistungen, Handel, Verkehr und Kommunikation, hoch und mittel-High-Tech-Produktion konzentriert. High-Tech-Produktion sei wie das verarbeitende Gewerbe, in der EU weiterhin ein Wettbewerbsvorteil. Globalisierungskritische quantitative SozialwissenschaftleInnen, vor allem in den Vereinigten Staaten, haben für eine lange Zeit in den führenden Zeitschriften der Sozialwissenschaften behauptet, dass - im Anschluss an die ökonomischen Theorin der monopolistischen Konkurrenz in der Tradition von Baran, Kalecki, Rothschild und Sweezy es eine Bestätigung der dunklen und negativen Aspekte der Öffnung der Märkte für Waren-, Kapital-, Arbeit-und Dienstleistungen, insbesondere durch transnationale Konzerne, zu geben scheint.
C:\Dokumente und Einstellungen\wj1\Lokale Einstellungen\Temporary Internet Files\OLKE6\20_01_2009_Transnationale
Konzerne und die Krise in Europa.doc
5
Wir analysieren zu diesem Zweck die regionale Entwicklung (Wirtschaftswachstum, regionale Lissabon-Leistung, Arbeitslosigkeit und Beschäftigung älterer Arbeitnehmer) in der gesamten EU-27 mit dem frei verfügbaren Inforegio-Datensatz der EU-Kommission. Unter Anwendung einer neuen 5-Punkte-Skala der Durchdringung der europäischen Regionen durch das internationale Kapital (Anteil an der Beschäftigung für die transnationalen Kapitals in der Region pro Beschäftigung in der Region insgesamt), die aus veröffentlichten Inforegio Karten gewonnen wurde, ergeben sich folgende, multivariate Beziehungen der regionalen Entwicklung in Europa: 1. Es gibt einen "perversen"-Effekt der regionalen Unterschiede, vor allem was bedeutet, dass die reichen Regionen rasch wachsen und ärmere Regionen langsamer 2. Die Kontrolle einer Region durch ausländisches Kapital ist in der Tat eine signifikante Blockade für alle vier Indikatoren 3. Höhere Bildung ist ein wesentliches Mittel, um die Lissabon-Ziele zu erreichen 4. Ein gutes demographisches Wachstum ist eine wesentliche Voraussetzung für die Erreichung der Ziele der regionalen Entwicklung Problemstellung Im Rahmen des neo-liberalen, bis vor dem Auftreffen des jüngsten internationalen Finanz-Tsunamis geltenden Politik-Konsenses in Europa galt die Fortsetzung der neo-liberalen Globalisierungspolitik als „sine qua“ einer erfolgreichen europäischen „Lissabon-Politik“. In mehreren, kritischen Analysen des Referenten zu dieser Frage wurde bereits darauf verwiesen, dass wesentliche Kausalfaktoren einer erfolgreichen „Lissabon-Politik“ – wie „balancing work and family life“, in der bisherigen europäischen Debatte sträflich vernachlässigt worden sind, wiewohl die vorhandene quantitative Evidenz sehr deutlich darauf hinweist, dass gerade die demographischen
C:\Dokumente und Einstellungen\wj1\Lokale Einstellungen\Temporary Internet Files\OLKE6\20_01_2009_Transnationale
Konzerne und die Krise in Europa.doc
6
Faktoren und der soziale Ausgleich zwischen den sozialen Schichten einen wesentlichen Produktivitätsfaktor darstellen. Es ist nun naheliegend, nicht nur auf der Ebene der 27 nationalstaatlich organisierten Mitgliedsländer der EU Evidenz für oder gegen die Gültigkeit einer derartigen Strategie zu suchen, sondern auch auf der Ebene der von den europäischen Behörden immer besser dokumentierten regionalen Entwicklung in Europa. Der Autor hat nun versucht, die Wirkung von demographischer Entwicklung und neo-liberaler Globalisierung und demographischer Entwicklung auf das regionale Wirtschaftswachstum, die Beschäftigungsraten der älteren ArbeitnehmerInnen, die Arbeitslosenraten und den regionalen, von der EU-Kommission in einer Maßzahl aggregierten Lissabon-Erfolg, der die 6 wichtigen Lissabon-Strukturindikatoren zusammenfasst:
• GDP/person employed in PPS – Kaufkraft pro Kopf • Employment rate, ages 15-64 – Beschäftigungsrate Alter 15-64 • Employment rate, ages 55-64 – Beschäftigungsrate der älteren
ArbeitnehmerInnen • GERD as percentage of GDP – Forschungsausgaben per BIP • Long term unemployment as % of total labour force – langfristige
Arbeitslosigkeit • Youth educational attainment level (% of population aged 20-24 having
completed at least upper secondary education) – Ausbildungsniveau der Jugend (Altersgruppe der 20-24-jährigen hat Sekundarschulabschluss)
zu untersuchen. Hiermit wird erstmals eine mit den Fragestellungen der jüngst vorgestellten Studie des Centres for European Policy Studies in Brüssel vergleichbare Untersuchung vorgestellt, die von der Frage ausgeht, wie der regional aufgefasste „Lissabon-Erfolg“ letztlich determiniert wird – durch eine Politik der weiterhin ungebremsten Globalisierung, oder durch eine Politik, die insbesondere dem demographischen Faktor ein gebührendes gewicht gibt. Die lapidarische Landkarte der Armut in Europa vor den Sozialtransfers ist überraschend und bestürzend zugleich: es sind neben der Slowakei, Polen, Litauen und Lettland sowie Estland vor allem die reicheren Staaten wie Großbritannien, Irland, Norwegen, Finnland, Belgien, Frankreich und Portugal,
C:\Dokumente und Einstellungen\wj1\Lokale Einstellungen\Temporary Internet Files\OLKE6\20_01_2009_Transnationale
Konzerne und die Krise in Europa.doc
7
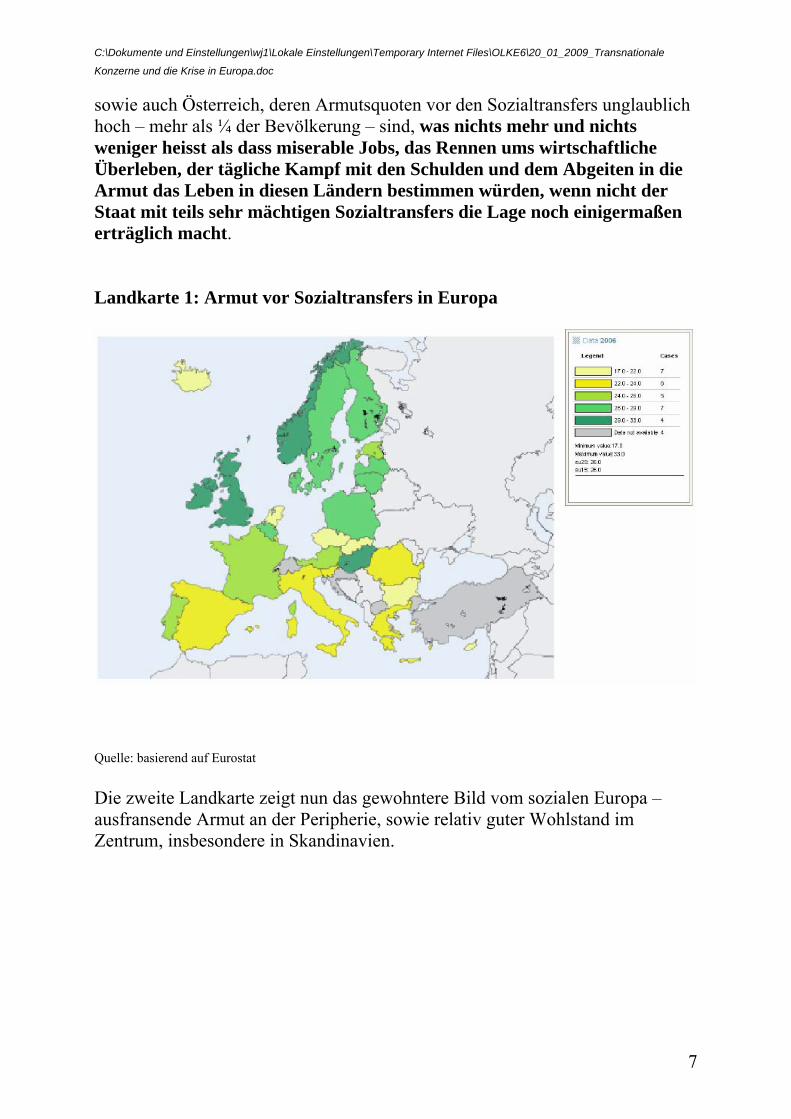
sowie auch Österreich, deren Armutsquoten vor den Sozialtransfers unglaublich hoch – mehr als ¼ der Bevölkerung – sind, was nichts mehr und nichts weniger heisst als dass miserable Jobs, das Rennen ums wirtschaftliche Überleben, der tägliche Kampf mit den Schulden und dem Abgeiten in die Armut das Leben in diesen Ländern bestimmen würden, wenn nicht der Staat mit teils sehr mächtigen Sozialtransfers die Lage noch einigermaßen erträglich macht. Landkarte 1: Armut vor Sozialtransfers in Europa
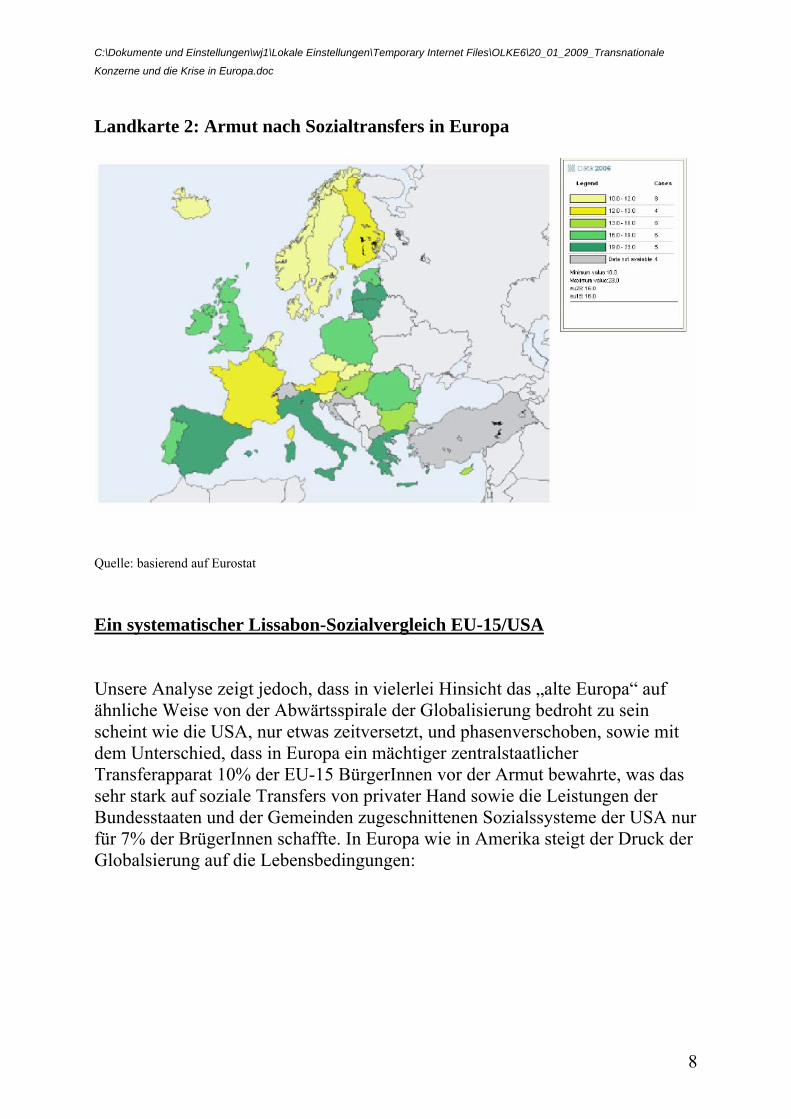
Quelle: basierend auf Eurostat Die zweite Landkarte zeigt nun das gewohntere Bild vom sozialen Europa – ausfransende Armut an der Peripherie, sowie relativ guter Wohlstand im Zentrum, insbesondere in Skandinavien.
C:\Dokumente und Einstellungen\wj1\Lokale Einstellungen\Temporary Internet Files\OLKE6\20_01_2009_Transnationale
Konzerne und die Krise in Europa.doc
8
Landkarte 2: Armut nach Sozialtransfers in Europa
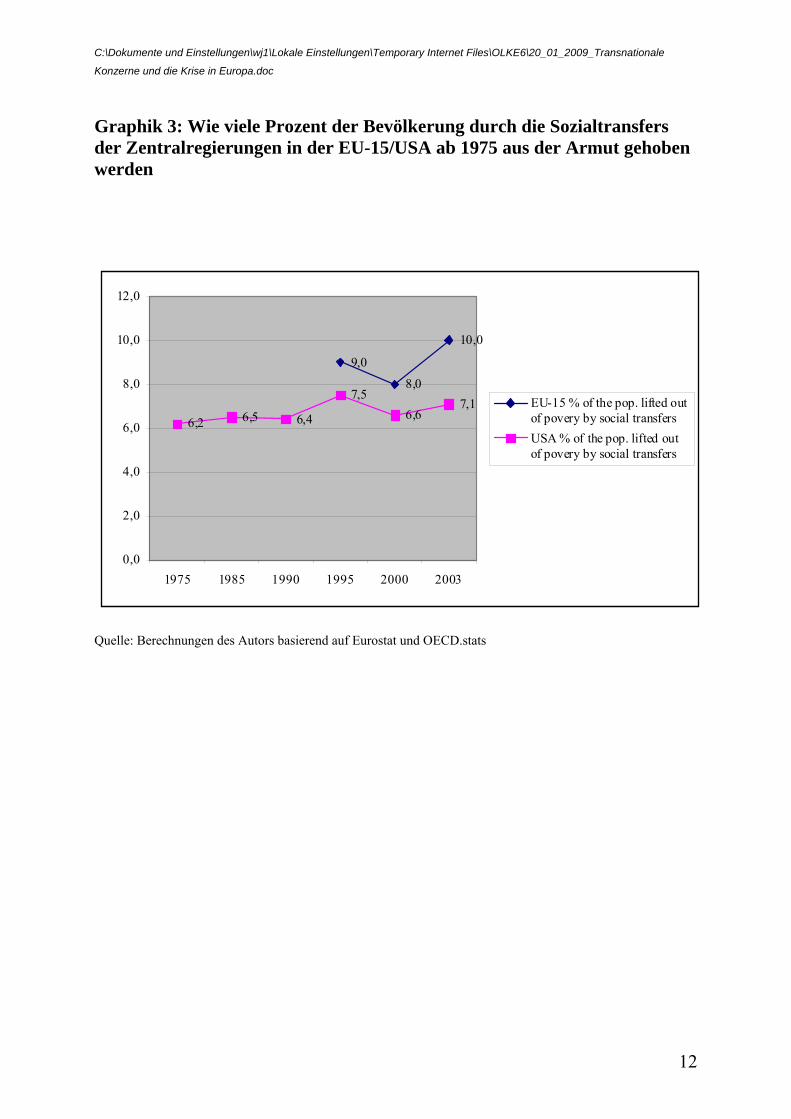
Quelle: basierend auf Eurostat Ein systematischer Lissabon-Sozialvergleich EU-15/USA Unsere Analyse zeigt jedoch, dass in vielerlei Hinsicht das „alte Europa“ auf ähnliche Weise von der Abwärtsspirale der Globalisierung bedroht zu sein scheint wie die USA, nur etwas zeitversetzt, und phasenverschoben, sowie mit dem Unterschied, dass in Europa ein mächtiger zentralstaatlicher Transferapparat 10% der EU-15 BürgerInnen vor der Armut bewahrte, was das sehr stark auf soziale Transfers von privater Hand sowie die Leistungen der Bundesstaaten und der Gemeinden zugeschnittenen Sozialssysteme der USA nur für 7% der BrügerInnen schaffte. In Europa wie in Amerika steigt der Druck der Globalsierung auf die Lebensbedingungen:
C:\Dokumente und Einstellungen\wj1\Lokale Einstellungen\Temporary Internet Files\OLKE6\20_01_2009_Transnationale
Konzerne und die Krise in Europa.doc
9
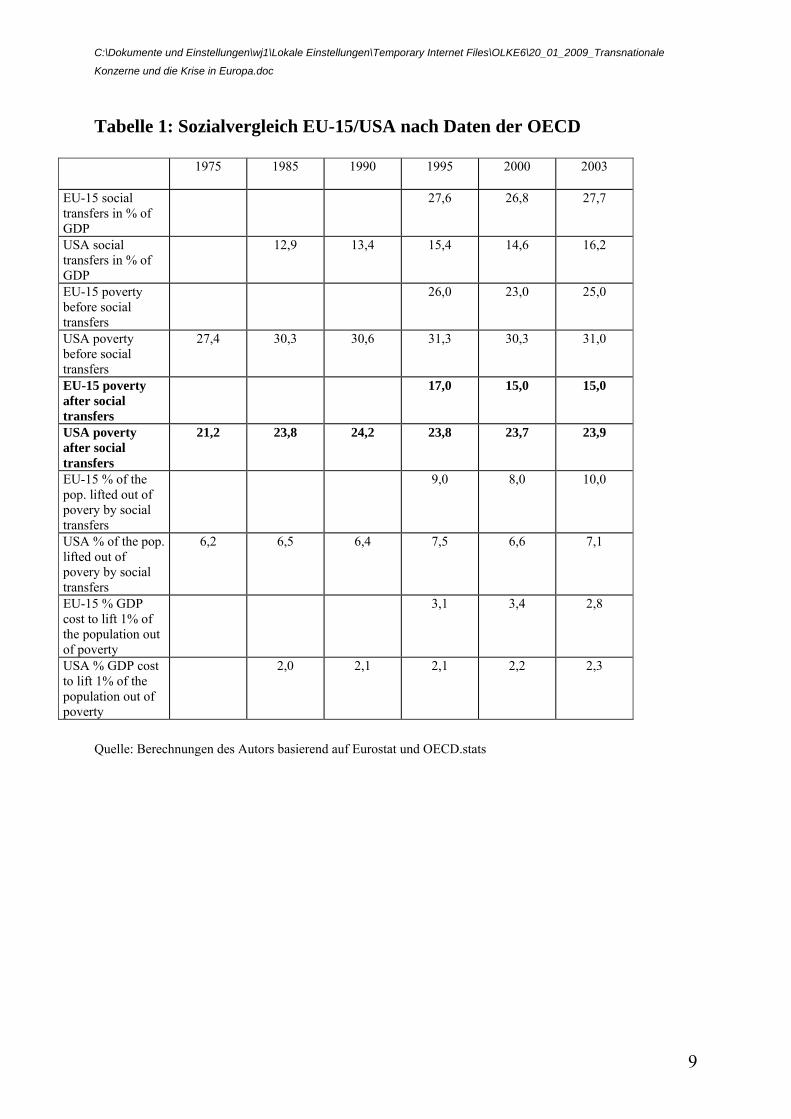
Tabelle 1: Sozialvergleich EU-15/USA nach Daten der OECD
1975 1985 1990 1995 2000 2003
EU-15 social transfers in % of GDP
27,6 26,8 27,7
USA social transfers in % of GDP
12,9 13,4 15,4 14,6 16,2
EU-15 poverty before social transfers
26,0 23,0 25,0
USA poverty before social transfers
27,4 30,3 30,6 31,3 30,3 31,0
EU-15 poverty after social transfers
17,0 15,0 15,0
USA poverty after social transfers
21,2 23,8 24,2 23,8 23,7 23,9
EU-15 % of the pop. lifted out of povery by social transfers
9,0 8,0 10,0
USA % of the pop. lifted out of povery by social transfers
6,2 6,5 6,4 7,5 6,6 7,1
EU-15 % GDP cost to lift 1% of the population out of poverty
3,1 3,4 2,8
USA % GDP cost to lift 1% of the population out of poverty
2,0 2,1 2,1 2,2 2,3
Quelle: Berechnungen des Autors basierend auf Eurostat und OECD.stats
C:\Dokumente und Einstellungen\wj1\Lokale Einstellungen\Temporary Internet Files\OLKE6\20_01_2009_Transnationale
Konzerne und die Krise in Europa.doc
10
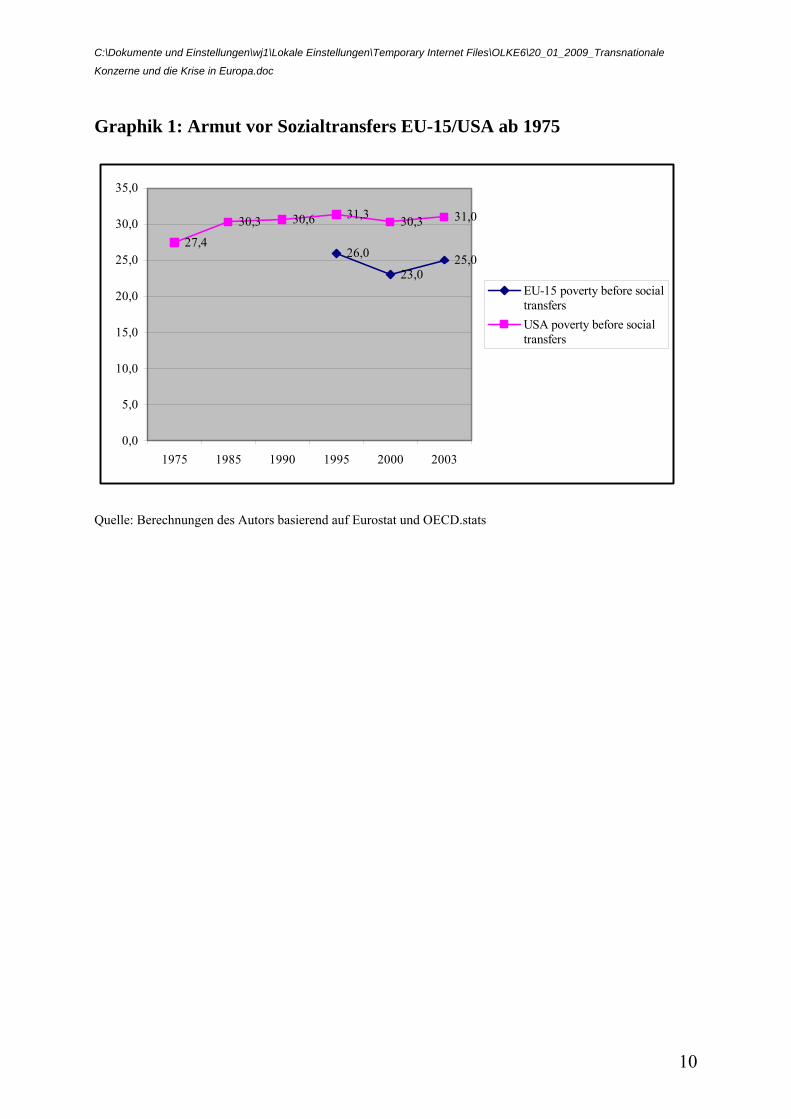
Graphik 1: Armut vor Sozialtransfers EU-15/USA ab 1975
26,0
23,025,0
27,430,3 30,6 31,3 30,3 31,0
0,0
5,0
10,0
15,0
20,0
25,0
30,0
35,0
1975 1985 1990 1995 2000 2003
EU-15 poverty before socialtransfersUSA poverty before socialtransfers
Quelle: Berechnungen des Autors basierend auf Eurostat und OECD.stats
C:\Dokumente und Einstellungen\wj1\Lokale Einstellungen\Temporary Internet Files\OLKE6\20_01_2009_Transnationale
Konzerne und die Krise in Europa.doc
11
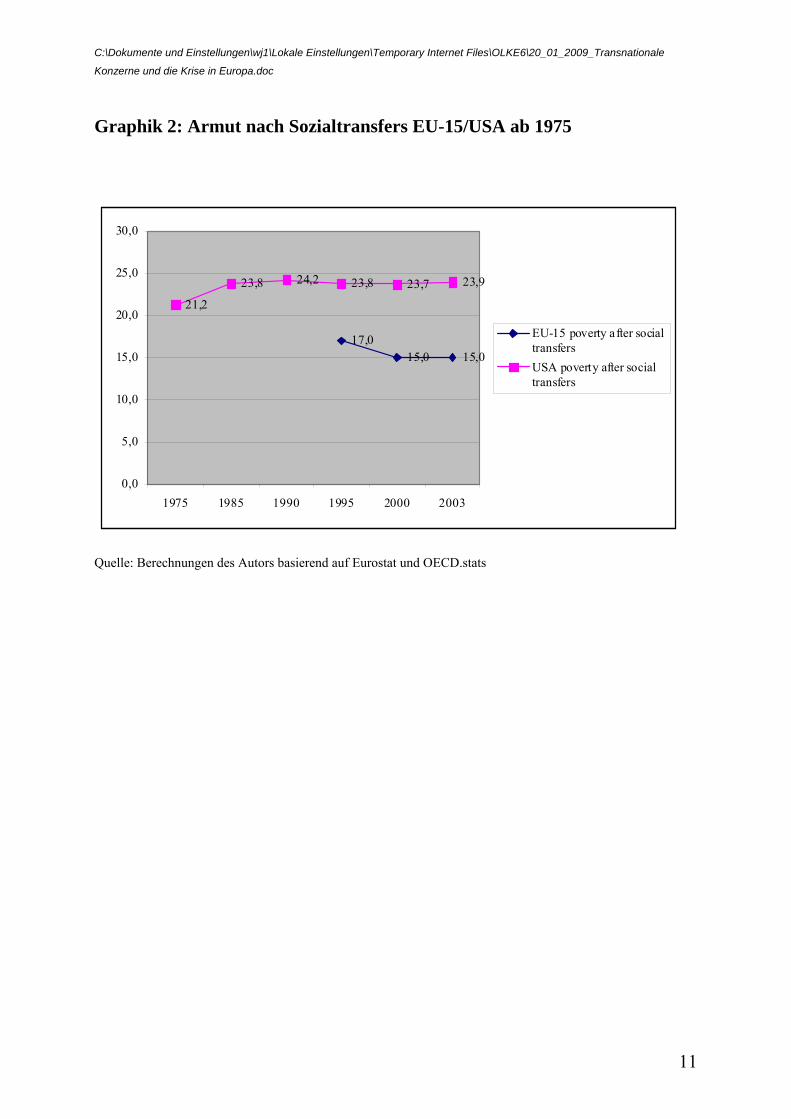
Graphik 2: Armut nach Sozialtransfers EU-15/USA ab 1975
17,015,0 15,0
21,2
23,8 24,2 23,8 23,7 23,9
0,0
5,0
10,0
15,0
20,0
25,0
30,0
1975 1985 1990 1995 2000 2003
EU-15 poverty after socialtransfersUSA poverty after socialtransfers
Quelle: Berechnungen des Autors basierend auf Eurostat und OECD.stats
C:\Dokumente und Einstellungen\wj1\Lokale Einstellungen\Temporary Internet Files\OLKE6\20_01_2009_Transnationale
Konzerne und die Krise in Europa.doc
12
Graphik 3: Wie viele Prozent der Bevölkerung durch die Sozialtransfers der Zentralregierungen in der EU-15/USA ab 1975 aus der Armut gehoben werden
9,08,0
10,0
6,2 6,5 6,4
7,56,6
7,1
0,0
2,0
4,0
6,0
8,0
10,0
12,0
1975 1985 1990 1995 2000 2003
EU-15 % of the pop. lifted outof povery by social transfersUSA % of the pop. lifted outof povery by social transfers
Quelle: Berechnungen des Autors basierend auf Eurostat und OECD.stats
C:\Dokumente und Einstellungen\wj1\Lokale Einstellungen\Temporary Internet Files\OLKE6\20_01_2009_Transnationale
Konzerne und die Krise in Europa.doc
13
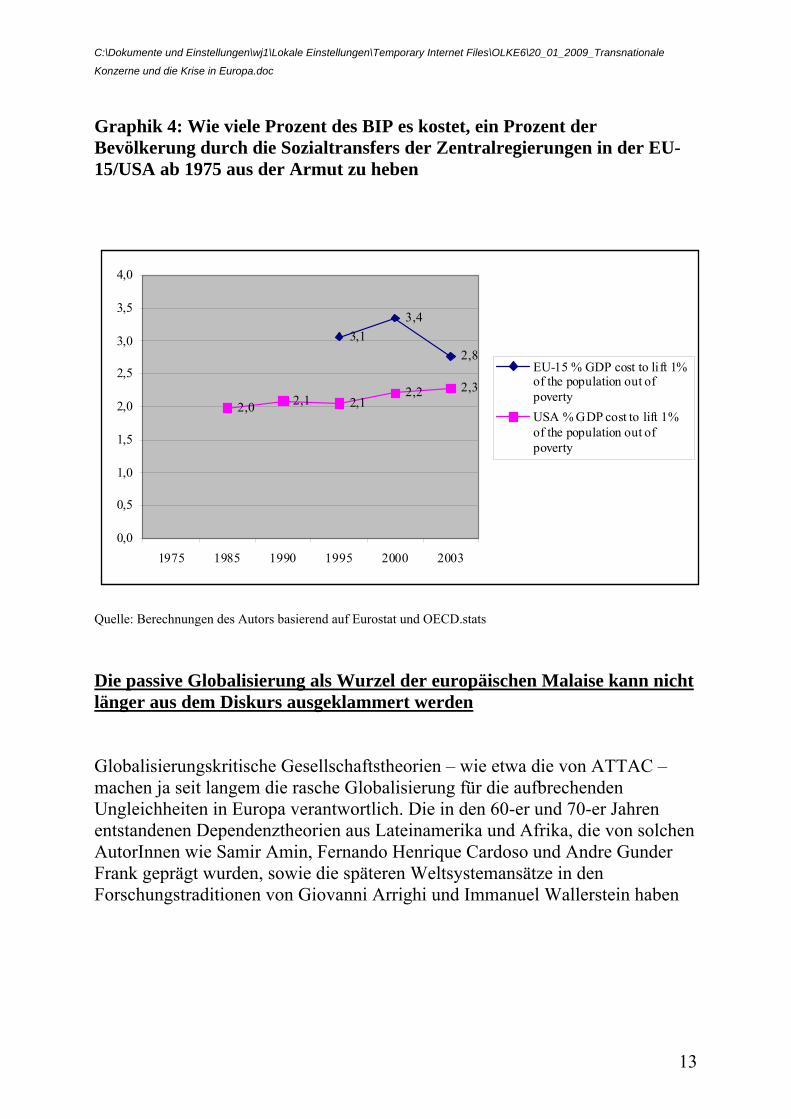
Graphik 4: Wie viele Prozent des BIP es kostet, ein Prozent der Bevölkerung durch die Sozialtransfers der Zentralregierungen in der EU-15/USA ab 1975 aus der Armut zu heben
3,13,4
2,8
2,0 2,1 2,12,2 2,3
0,0
0,5
1,0
1,5
2,0
2,5
3,0
3,5
4,0
1975 1985 1990 1995 2000 2003
EU-15 % GDP cost to lift 1%of the population out ofpovertyUSA % GDP cost to lift 1%of the population out ofpoverty
Quelle: Berechnungen des Autors basierend auf Eurostat und OECD.stats Die passive Globalisierung als Wurzel der europäischen Malaise kann nicht länger aus dem Diskurs ausgeklammert werden Globalisierungskritische Gesellschaftstheorien – wie etwa die von ATTAC – machen ja seit langem die rasche Globalisierung für die aufbrechenden Ungleichheiten in Europa verantwortlich. Die in den 60-er und 70-er Jahren entstandenen Dependenztheorien aus Lateinamerika und Afrika, die von solchen AutorInnen wie Samir Amin, Fernando Henrique Cardoso und Andre Gunder Frank geprägt wurden, sowie die späteren Weltsystemansätze in den Forschungstraditionen von Giovanni Arrighi und Immanuel Wallerstein haben
C:\Dokumente und Einstellungen\wj1\Lokale Einstellungen\Temporary Internet Files\OLKE6\20_01_2009_Transnationale
Konzerne und die Krise in Europa.doc
14
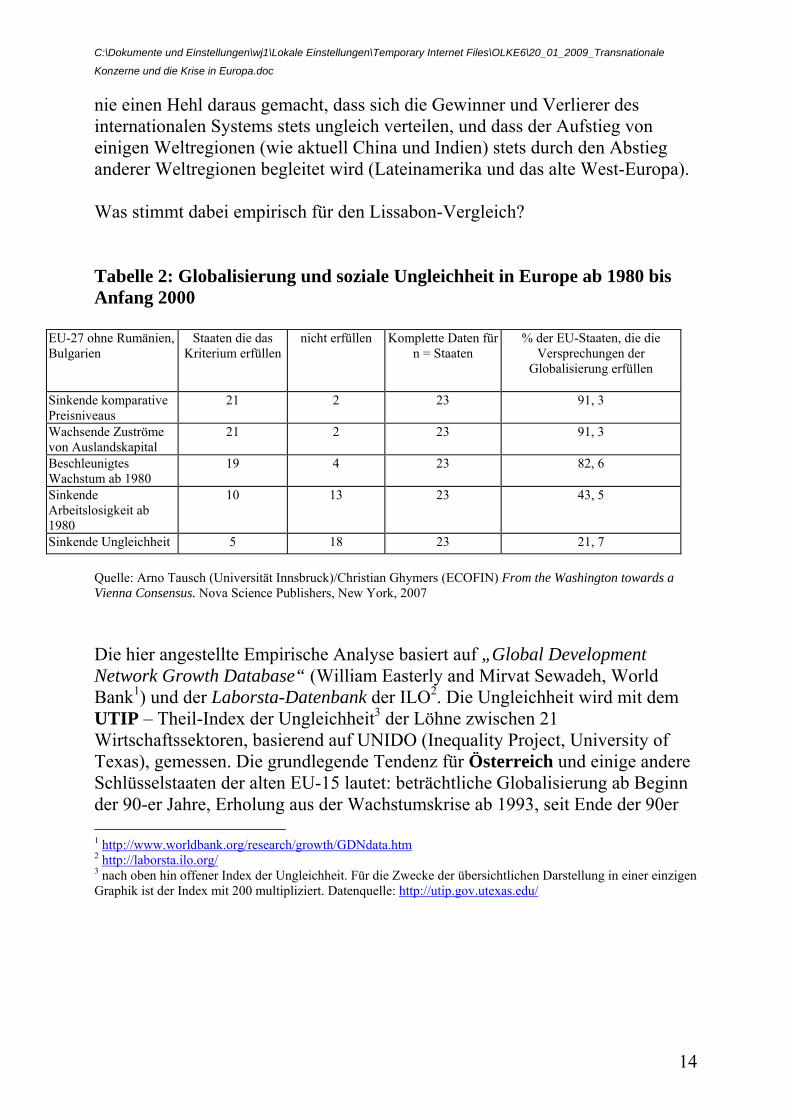
nie einen Hehl daraus gemacht, dass sich die Gewinner und Verlierer des internationalen Systems stets ungleich verteilen, und dass der Aufstieg von einigen Weltregionen (wie aktuell China und Indien) stets durch den Abstieg anderer Weltregionen begleitet wird (Lateinamerika und das alte West-Europa). Was stimmt dabei empirisch für den Lissabon-Vergleich? Tabelle 2: Globalisierung und soziale Ungleichheit in Europe ab 1980 bis Anfang 2000
EU-27 ohne Rumänien, Bulgarien
Staaten die das Kriterium erfüllen
nicht erfüllen Komplette Daten für n = Staaten
% der EU-Staaten, die die Versprechungen der
Globalisierung erfüllen
Sinkende komparative Preisniveaus
21 2 23 91, 3
Wachsende Zuströme von Auslandskapital
21 2 23 91, 3
Beschleunigtes Wachstum ab 1980
19 4 23 82, 6
Sinkende Arbeitslosigkeit ab 1980
10 13 23 43, 5
Sinkende Ungleichheit 5 18 23 21, 7 Quelle: Arno Tausch (Universität Innsbruck)/Christian Ghymers (ECOFIN) From the Washington towards a Vienna Consensus. Nova Science Publishers, New York, 2007 Die hier angestellte Empirische Analyse basiert auf „Global Development Network Growth Database“ (William Easterly and Mirvat Sewadeh, World Bank1) und der Laborsta-Datenbank der ILO2. Die Ungleichheit wird mit dem UTIP – Theil-Index der Ungleichheit3 der Löhne zwischen 21 Wirtschaftssektoren, basierend auf UNIDO (Inequality Project, University of Texas), gemessen. Die grundlegende Tendenz für Österreich und einige andere Schlüsselstaaten der alten EU-15 lautet: beträchtliche Globalisierung ab Beginn der 90-er Jahre, Erholung aus der Wachstumskrise ab 1993, seit Ende der 90er 1 http://www.worldbank.org/research/growth/GDNdata.htm 2 http://laborsta.ilo.org/ 3 nach oben hin offener Index der Ungleichheit. Für die Zwecke der übersichtlichen Darstellung in einer einzigen Graphik ist der Index mit 200 multipliziert. Datenquelle: http://utip.gov.utexas.edu/
C:\Dokumente und Einstellungen\wj1\Lokale Einstellungen\Temporary Internet Files\OLKE6\20_01_2009_Transnationale
Konzerne und die Krise in Europa.doc
15
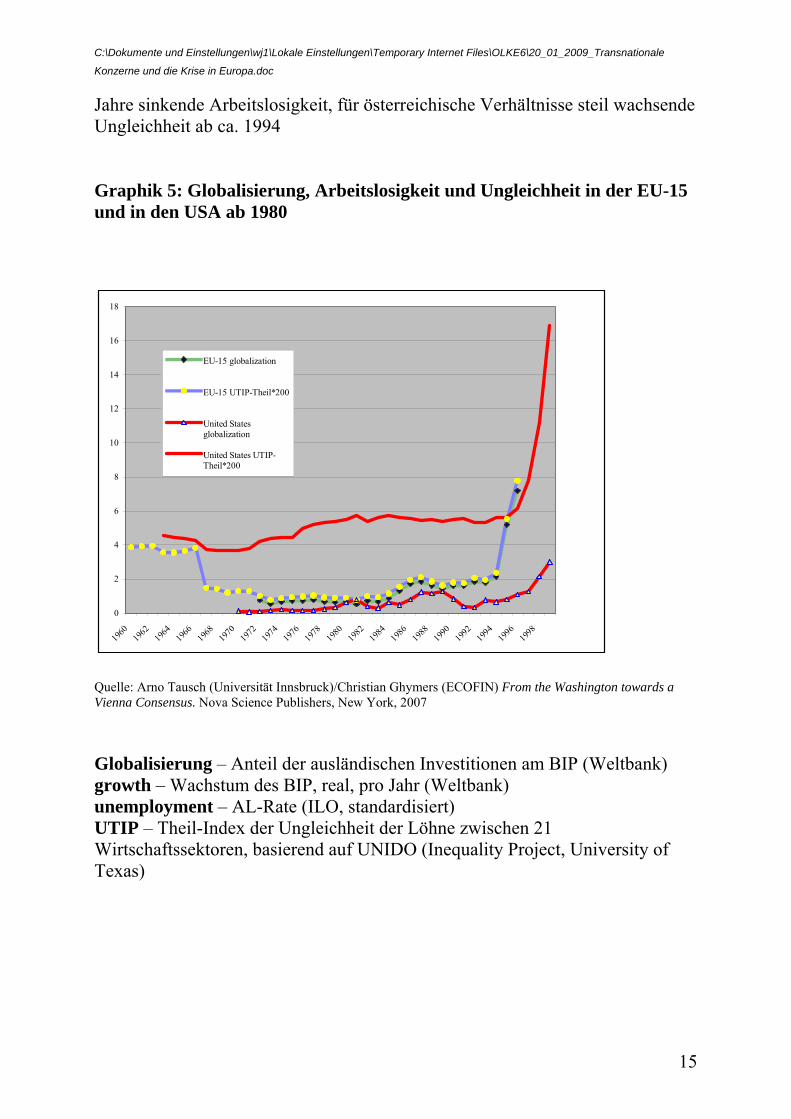
Jahre sinkende Arbeitslosigkeit, für österreichische Verhältnisse steil wachsende Ungleichheit ab ca. 1994 Graphik 5: Globalisierung, Arbeitslosigkeit und Ungleichheit in der EU-15 und in den USA ab 1980
0
2
4
6
8
10
12
14
16
18
1960
1962
1964
1966
1968
1970
1972
1974
1976
1978
1980
1982
1984
1986
1988
1990
1992
1994
1996
1998
EU-15 globalization
EU-15 UTIP-Theil*200
United Statesglobalization
United States UTIP-Theil*200
Quelle: Arno Tausch (Universität Innsbruck)/Christian Ghymers (ECOFIN) From the Washington towards a Vienna Consensus. Nova Science Publishers, New York, 2007 Globalisierung – Anteil der ausländischen Investitionen am BIP (Weltbank) growth – Wachstum des BIP, real, pro Jahr (Weltbank) unemployment – AL-Rate (ILO, standardisiert) UTIP – Theil-Index der Ungleichheit der Löhne zwischen 21 Wirtschaftssektoren, basierend auf UNIDO (Inequality Project, University of Texas)
C:\Dokumente und Einstellungen\wj1\Lokale Einstellungen\Temporary Internet Files\OLKE6\20_01_2009_Transnationale
Konzerne und die Krise in Europa.doc
16
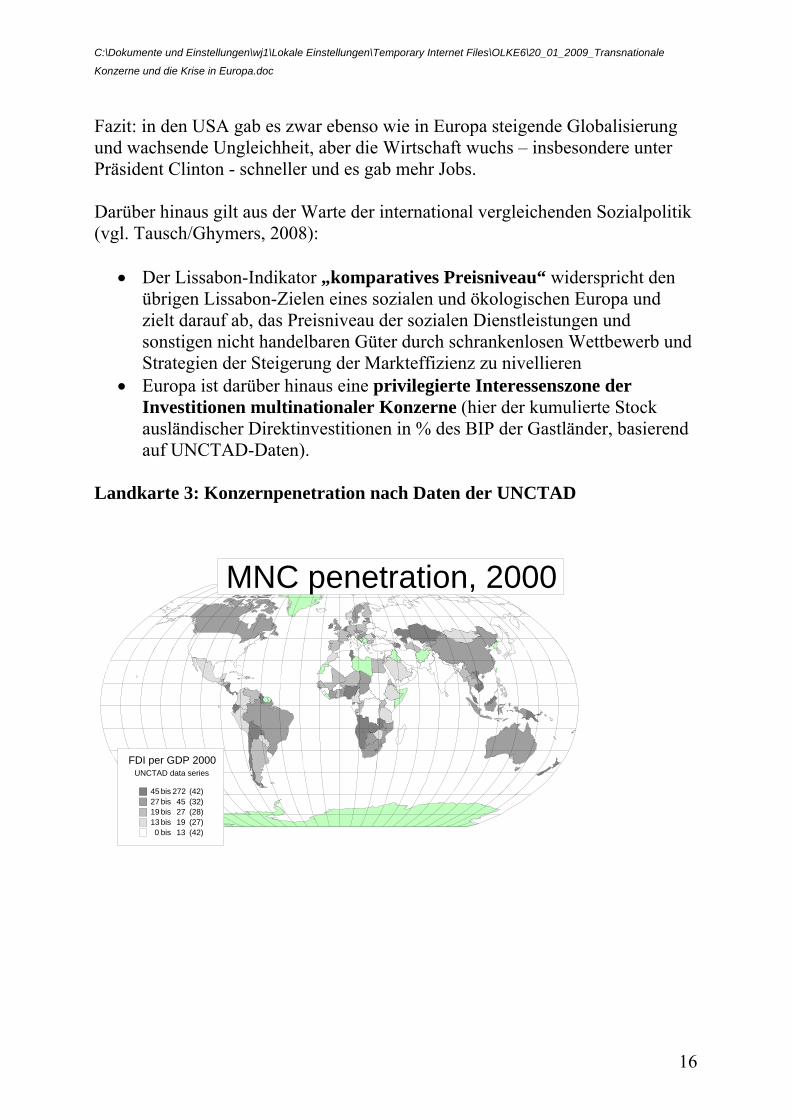
Fazit: in den USA gab es zwar ebenso wie in Europa steigende Globalisierung und wachsende Ungleichheit, aber die Wirtschaft wuchs – insbesondere unter Präsident Clinton - schneller und es gab mehr Jobs. Darüber hinaus gilt aus der Warte der international vergleichenden Sozialpolitik (vgl. Tausch/Ghymers, 2008):
• Der Lissabon-Indikator „komparatives Preisniveau“ widerspricht den übrigen Lissabon-Zielen eines sozialen und ökologischen Europa und zielt darauf ab, das Preisniveau der sozialen Dienstleistungen und sonstigen nicht handelbaren Güter durch schrankenlosen Wettbewerb und Strategien der Steigerung der Markteffizienz zu nivellieren
• Europa ist darüber hinaus eine privilegierte Interessenszone der Investitionen multinationaler Konzerne (hier der kumulierte Stock ausländischer Direktinvestitionen in % des BIP der Gastländer, basierend auf UNCTAD-Daten).
Landkarte 3: Konzernpenetration nach Daten der UNCTAD
FDI per GDP 2000UNCTAD data series
45 bis 272 (42)27 bis 45 (32)19 bis 27 (28)13 bis 19 (27)0 bis 13 (42)
MNC penetration, 2000
C:\Dokumente und Einstellungen\wj1\Lokale Einstellungen\Temporary Internet Files\OLKE6\20_01_2009_Transnationale
Konzerne und die Krise in Europa.doc
17
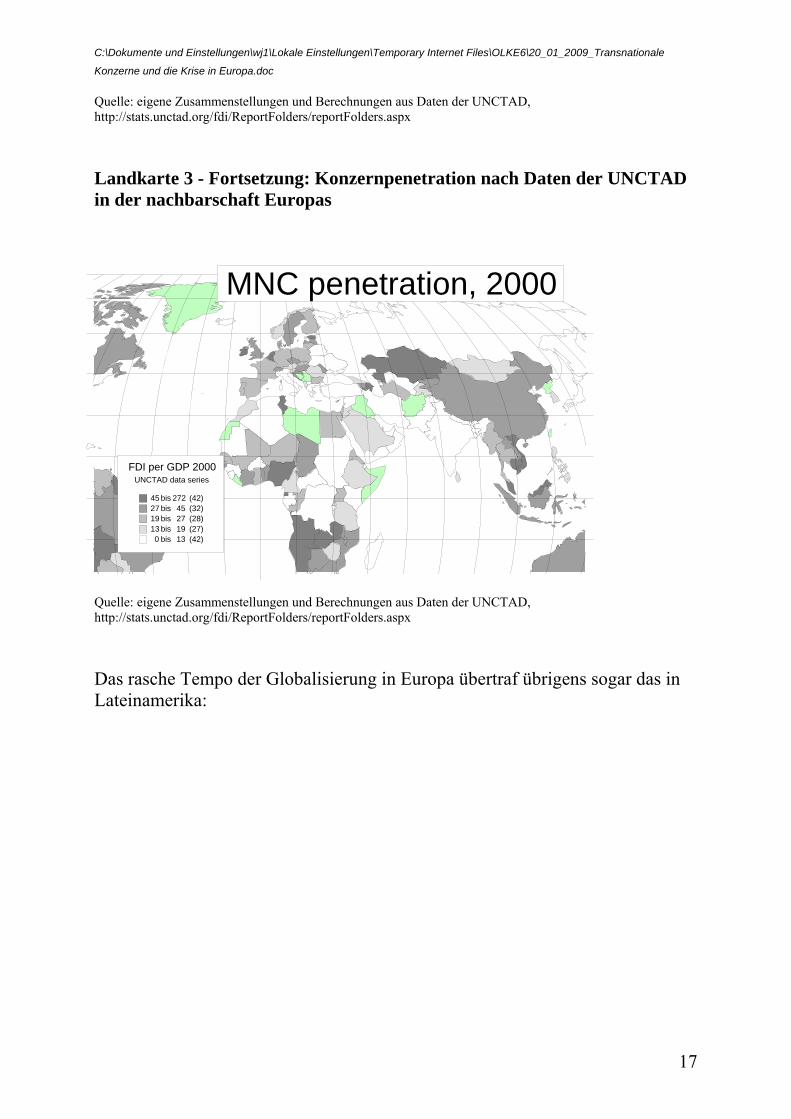
Quelle: eigene Zusammenstellungen und Berechnungen aus Daten der UNCTAD, http://stats.unctad.org/fdi/ReportFolders/reportFolders.aspx Landkarte 3 - Fortsetzung: Konzernpenetration nach Daten der UNCTAD in der nachbarschaft Europas
Quelle: eigene Zusammenstellungen und Berechnungen aus Daten der UNCTAD, http://stats.unctad.org/fdi/ReportFolders/reportFolders.aspx Das rasche Tempo der Globalisierung in Europa übertraf übrigens sogar das in Lateinamerika:
FDI per GDP 2000UNCTAD data series
45 bis 272 (42)27 bis 45 (32)19 bis 27 (28)13 bis 19 (27)0 bis 13 (42)
MNC penetration, 2000
C:\Dokumente und Einstellungen\wj1\Lokale Einstellungen\Temporary Internet Files\OLKE6\20_01_2009_Transnationale
Konzerne und die Krise in Europa.doc
18
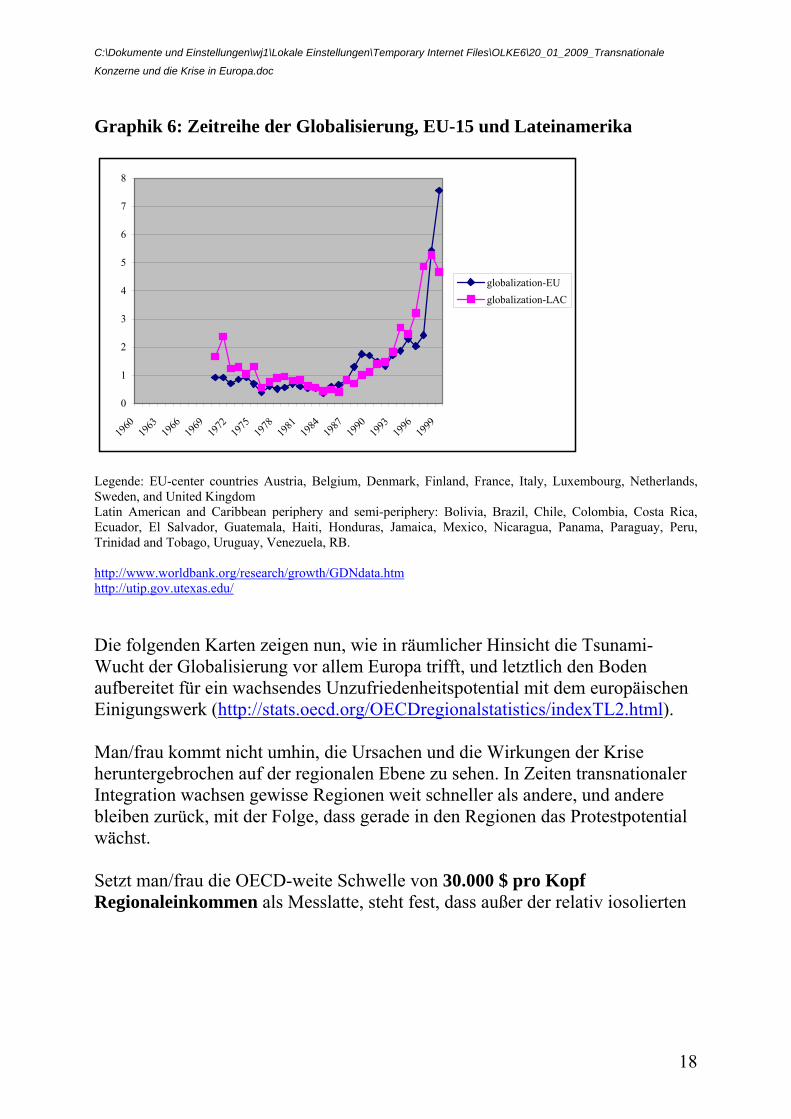
Graphik 6: Zeitreihe der Globalisierung, EU-15 und Lateinamerika
0
1
2
3
4
5
6
7
8
1960
1963
1966
1969
1972
1975
1978
1981
1984
1987
1990
1993
1996
1999
globalization-EUglobalization-LAC
Legende: EU-center countries Austria, Belgium, Denmark, Finland, France, Italy, Luxembourg, Netherlands, Sweden, and United Kingdom Latin American and Caribbean periphery and semi-periphery: Bolivia, Brazil, Chile, Colombia, Costa Rica, Ecuador, El Salvador, Guatemala, Haiti, Honduras, Jamaica, Mexico, Nicaragua, Panama, Paraguay, Peru, Trinidad and Tobago, Uruguay, Venezuela, RB. http://www.worldbank.org/research/growth/GDNdata.htm http://utip.gov.utexas.edu/ Die folgenden Karten zeigen nun, wie in räumlicher Hinsicht die Tsunami-Wucht der Globalisierung vor allem Europa trifft, und letztlich den Boden aufbereitet für ein wachsendes Unzufriedenheitspotential mit dem europäischen Einigungswerk (http://stats.oecd.org/OECDregionalstatistics/indexTL2.html). Man/frau kommt nicht umhin, die Ursachen und die Wirkungen der Krise heruntergebrochen auf der regionalen Ebene zu sehen. In Zeiten transnationaler Integration wachsen gewisse Regionen weit schneller als andere, und andere bleiben zurück, mit der Folge, dass gerade in den Regionen das Protestpotential wächst. Setzt man/frau die OECD-weite Schwelle von 30.000 $ pro Kopf Regionaleinkommen als Messlatte, steht fest, dass außer der relativ iosolierten
C:\Dokumente und Einstellungen\wj1\Lokale Einstellungen\Temporary Internet Files\OLKE6\20_01_2009_Transnationale
Konzerne und die Krise in Europa.doc
19
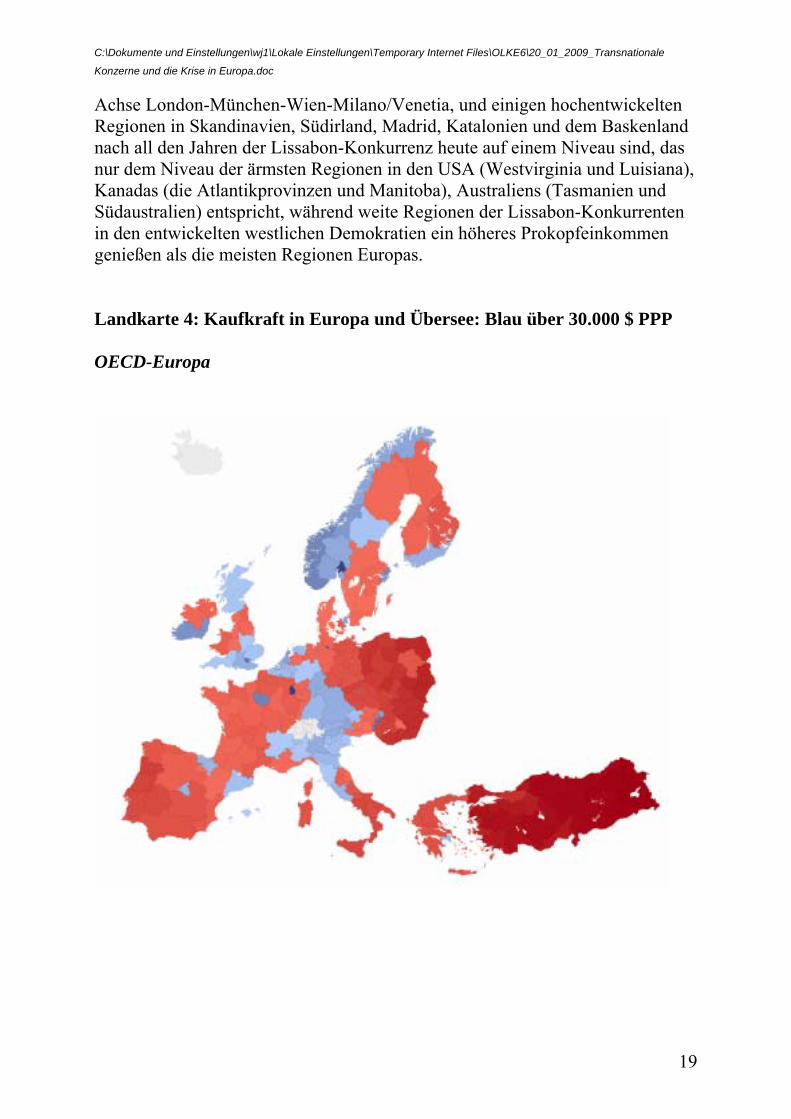
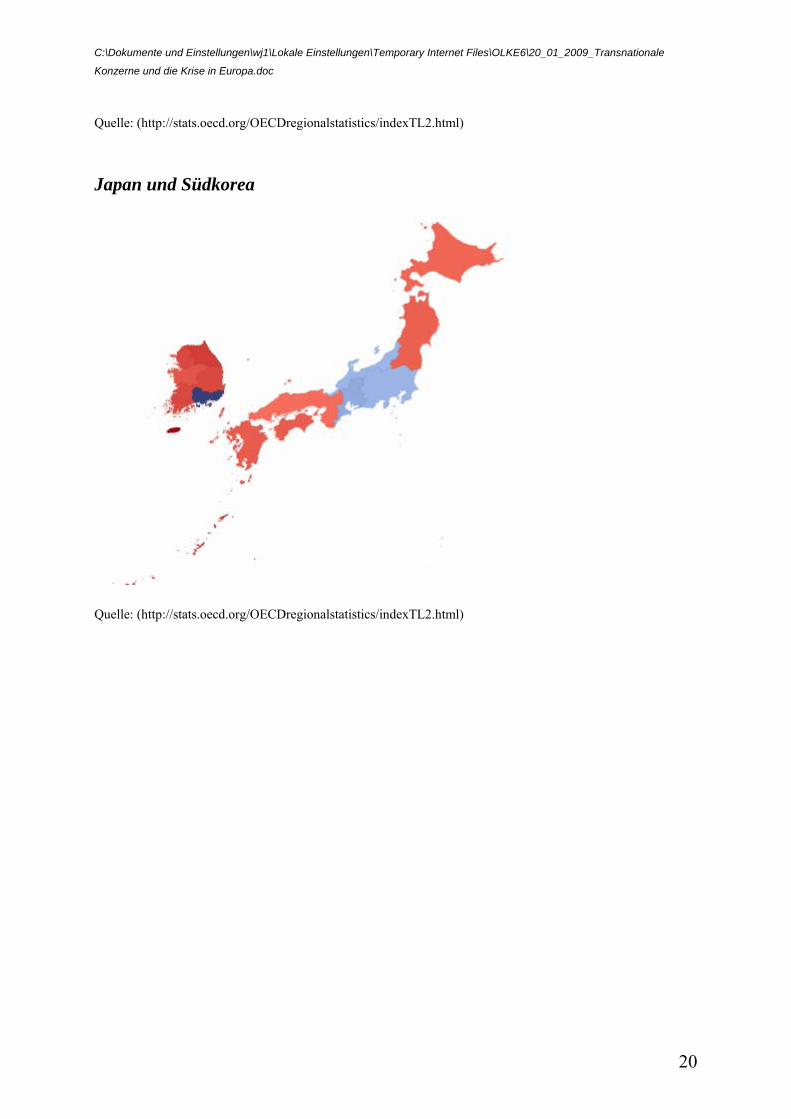
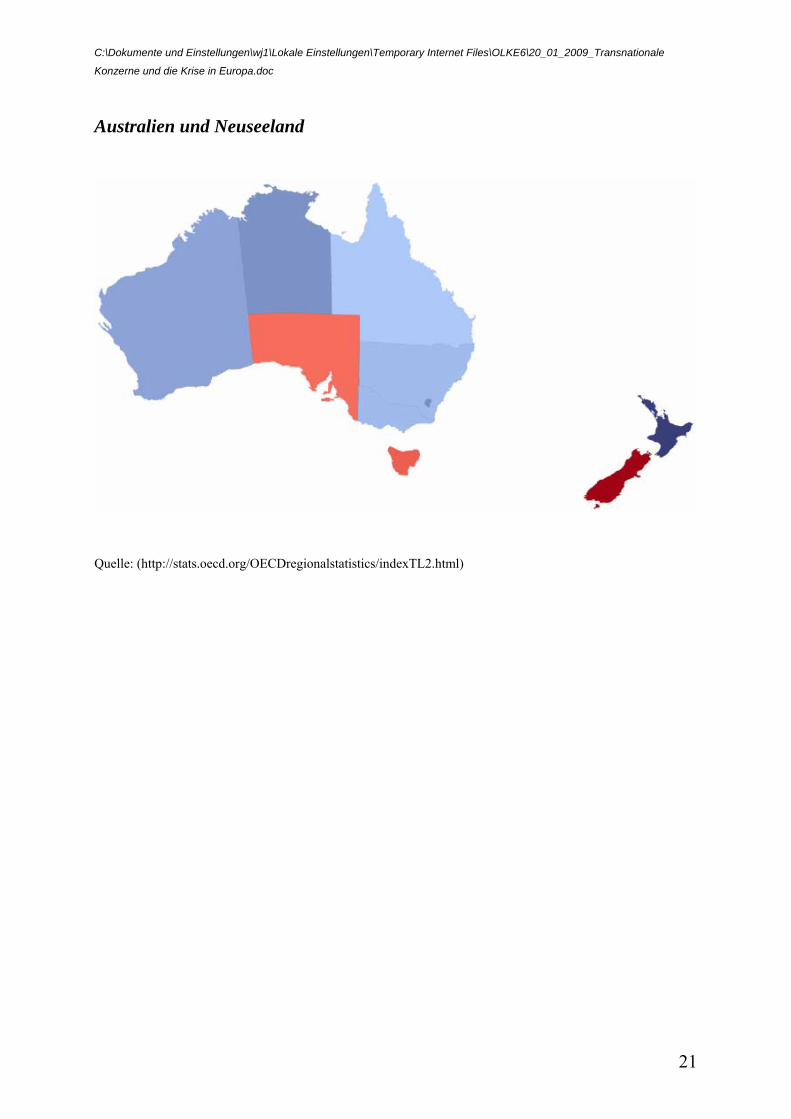
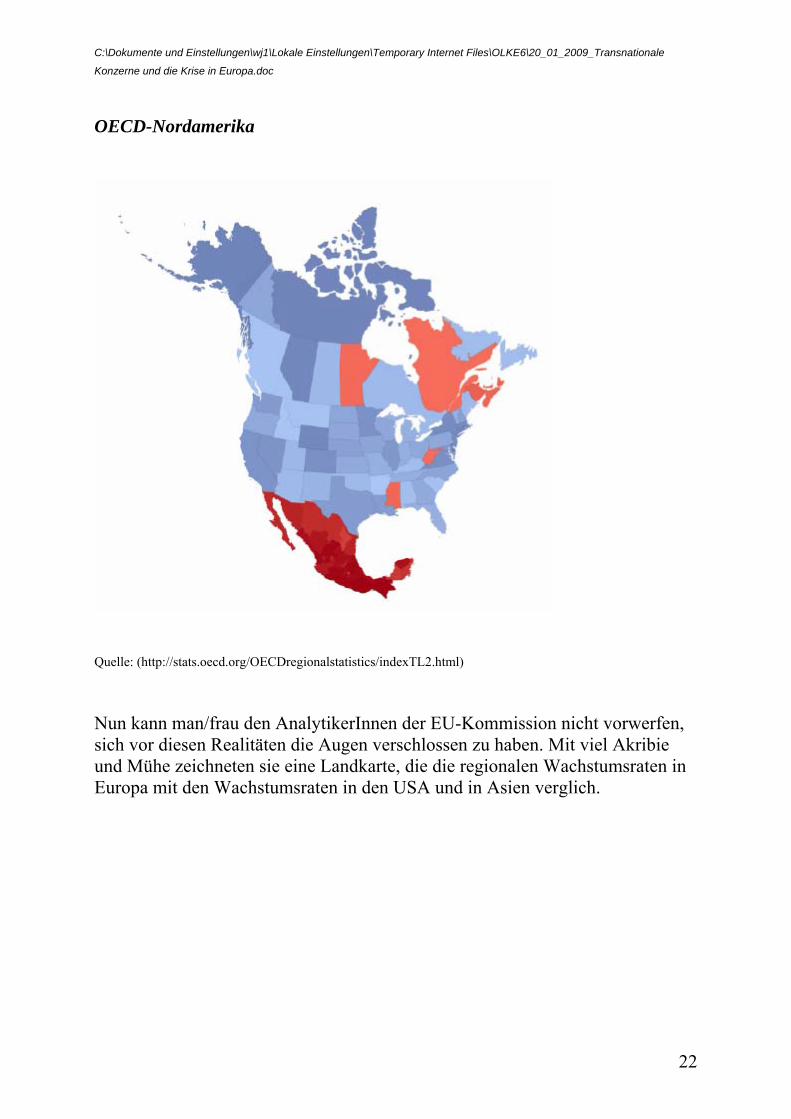
Achse London-München-Wien-Milano/Venetia, und einigen hochentwickelten Regionen in Skandinavien, Südirland, Madrid, Katalonien und dem Baskenland nach all den Jahren der Lissabon-Konkurrenz heute auf einem Niveau sind, das nur dem Niveau der ärmsten Regionen in den USA (Westvirginia und Luisiana), Kanadas (die Atlantikprovinzen und Manitoba), Australiens (Tasmanien und Südaustralien) entspricht, während weite Regionen der Lissabon-Konkurrenten in den entwickelten westlichen Demokratien ein höheres Prokopfeinkommen genießen als die meisten Regionen Europas. Landkarte 4: Kaufkraft in Europa und Übersee: Blau über 30.000 $ PPP OECD-Europa
C:\Dokumente und Einstellungen\wj1\Lokale Einstellungen\Temporary Internet Files\OLKE6\20_01_2009_Transnationale
Konzerne und die Krise in Europa.doc
20
Quelle: (http://stats.oecd.org/OECDregionalstatistics/indexTL2.html) Japan und Südkorea
Quelle: (http://stats.oecd.org/OECDregionalstatistics/indexTL2.html)
C:\Dokumente und Einstellungen\wj1\Lokale Einstellungen\Temporary Internet Files\OLKE6\20_01_2009_Transnationale
Konzerne und die Krise in Europa.doc
21
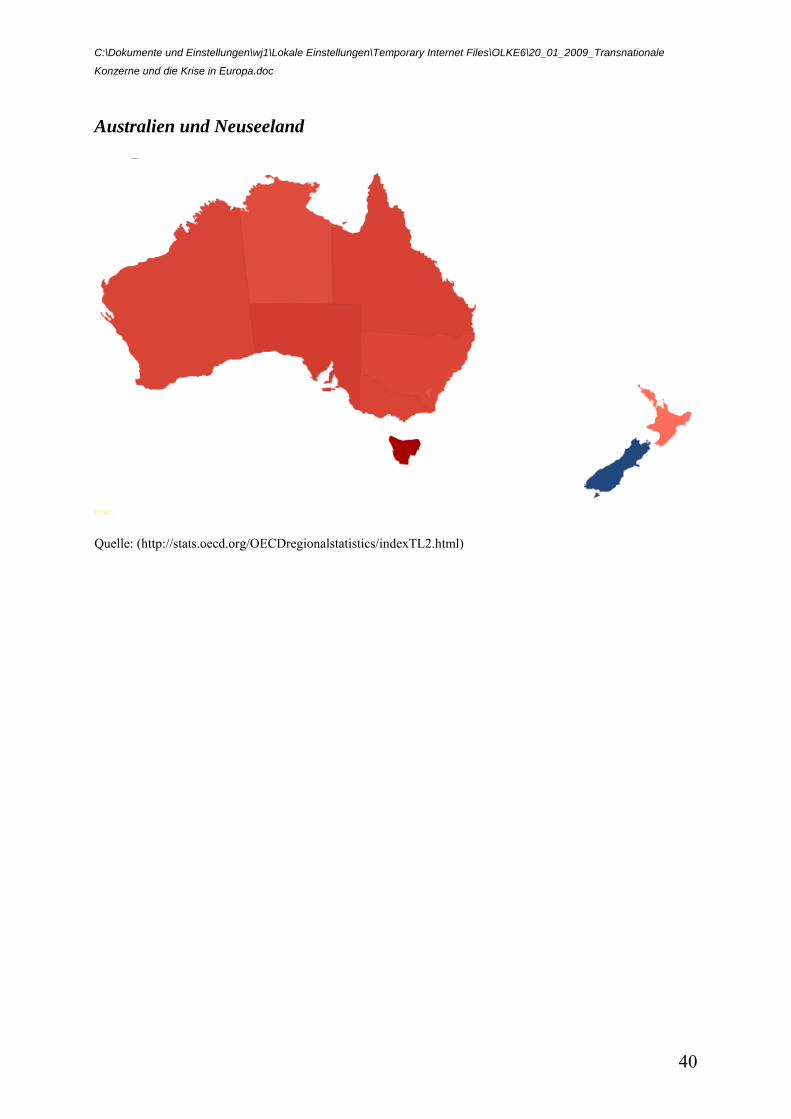
Australien und Neuseeland
Quelle: (http://stats.oecd.org/OECDregionalstatistics/indexTL2.html)
C:\Dokumente und Einstellungen\wj1\Lokale Einstellungen\Temporary Internet Files\OLKE6\20_01_2009_Transnationale
Konzerne und die Krise in Europa.doc
22
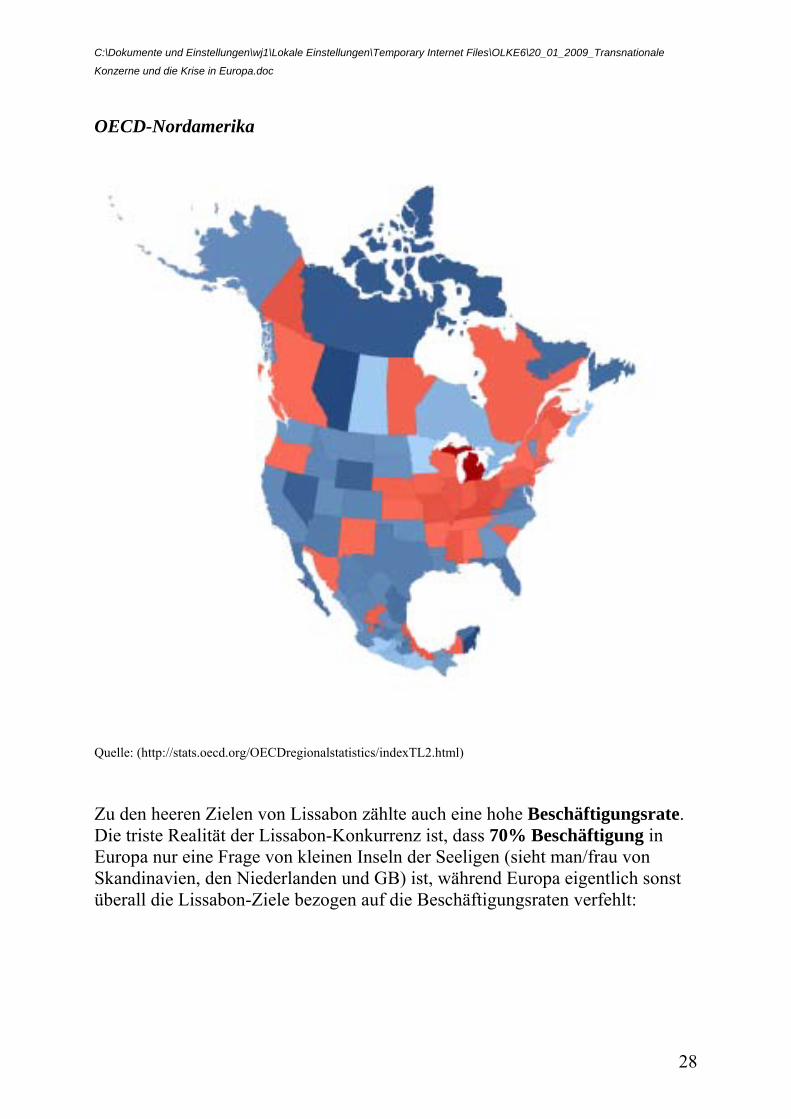
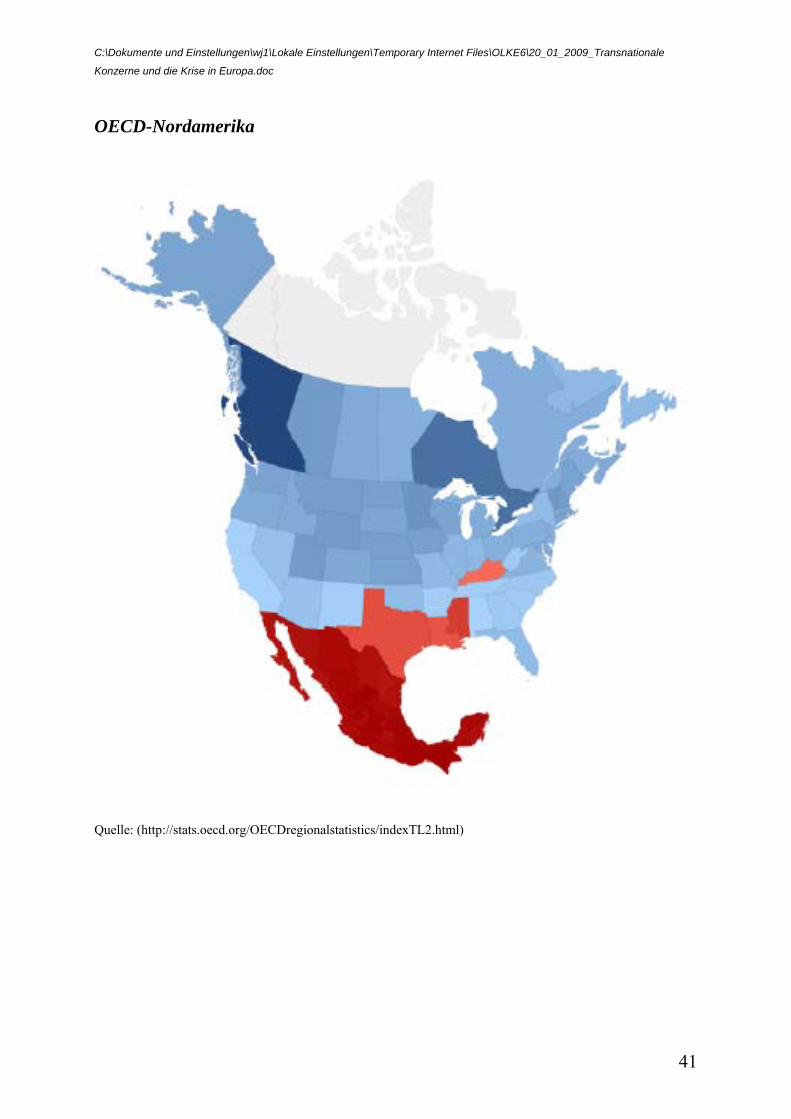
OECD-Nordamerika
Quelle: (http://stats.oecd.org/OECDregionalstatistics/indexTL2.html) Nun kann man/frau den AnalytikerInnen der EU-Kommission nicht vorwerfen, sich vor diesen Realitäten die Augen verschlossen zu haben. Mit viel Akribie und Mühe zeichneten sie eine Landkarte, die die regionalen Wachstumsraten in Europa mit den Wachstumsraten in den USA und in Asien verglich.
C:\Dokumente und Einstellungen\wj1\Lokale Einstellungen\Temporary Internet Files\OLKE6\20_01_2009_Transnationale
Konzerne und die Krise in Europa.doc
23
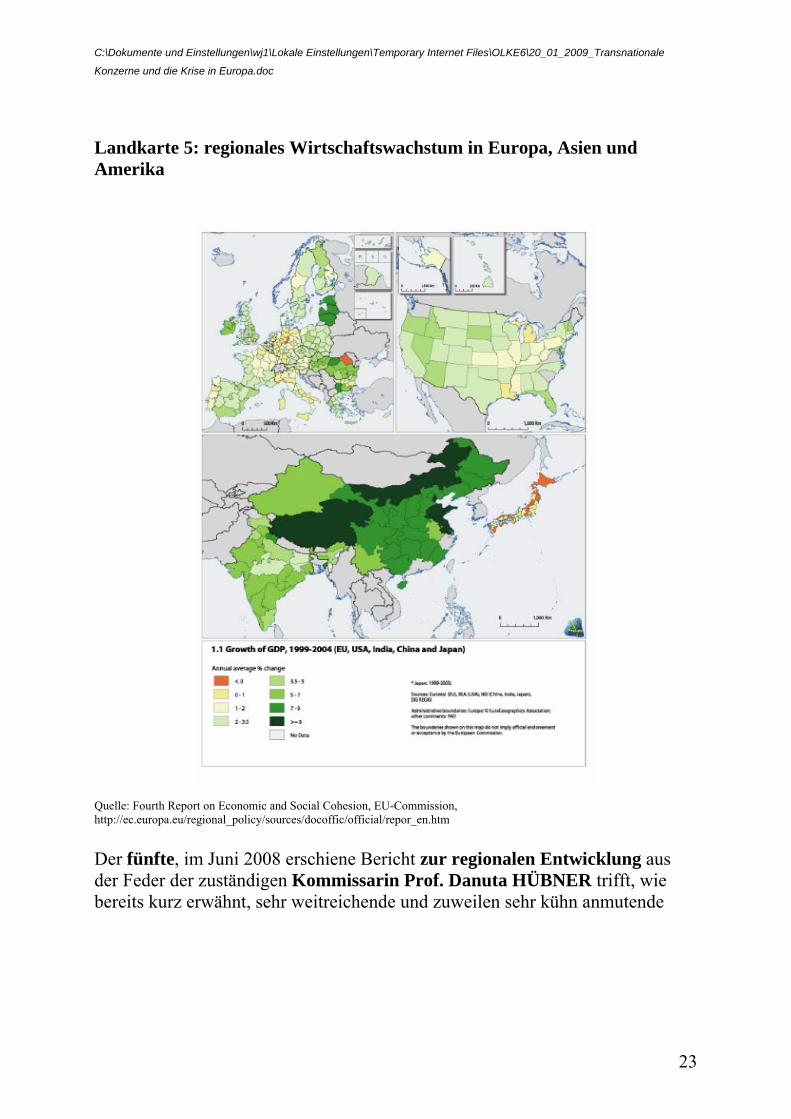
Landkarte 5: regionales Wirtschaftswachstum in Europa, Asien und Amerika
Quelle: Fourth Report on Economic and Social Cohesion, EU-Commission, http://ec.europa.eu/regional_policy/sources/docoffic/official/repor_en.htm
Der fünfte, im Juni 2008 erschiene Bericht zur regionalen Entwicklung aus der Feder der zuständigen Kommissarin Prof. Danuta HÜBNER trifft, wie bereits kurz erwähnt, sehr weitreichende und zuweilen sehr kühn anmutende
C:\Dokumente und Einstellungen\wj1\Lokale Einstellungen\Temporary Internet Files\OLKE6\20_01_2009_Transnationale
Konzerne und die Krise in Europa.doc
24
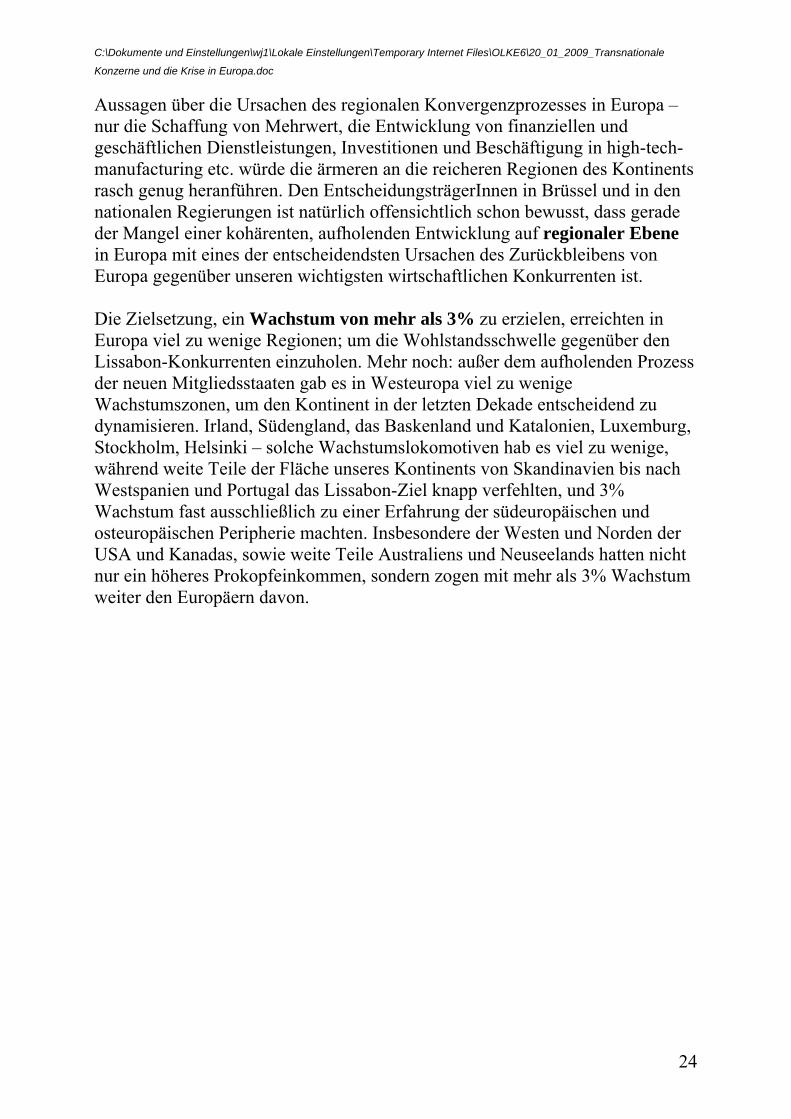
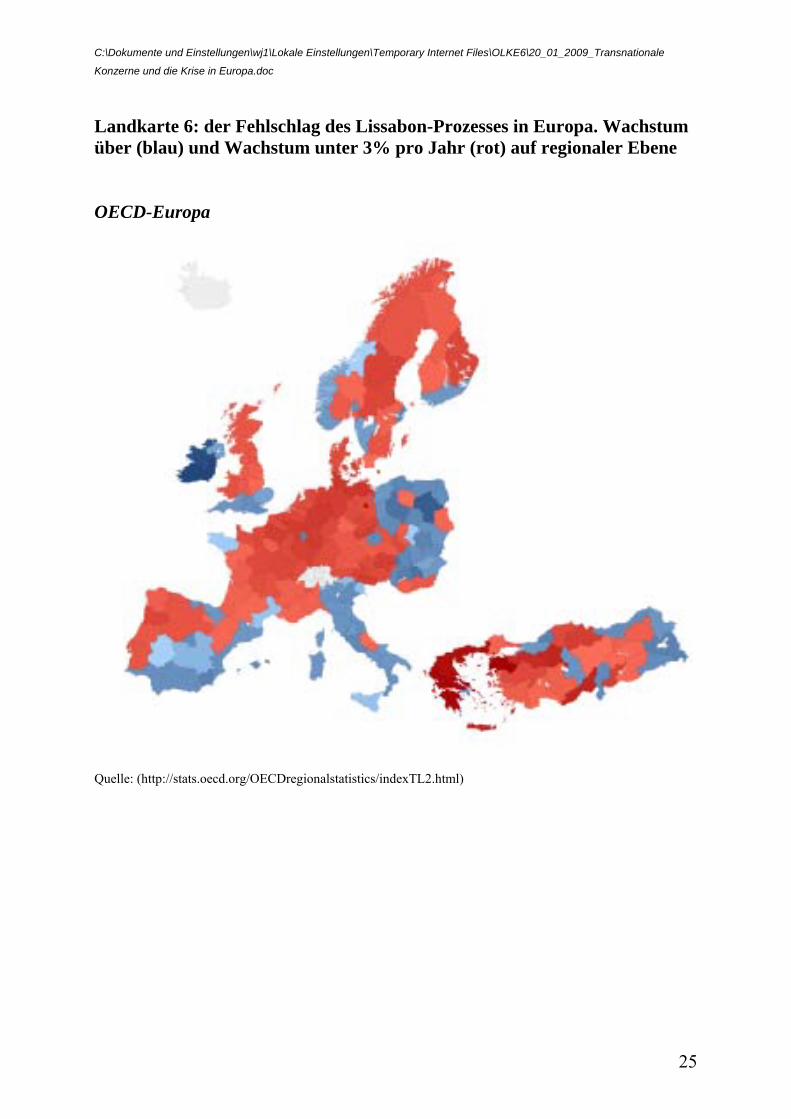
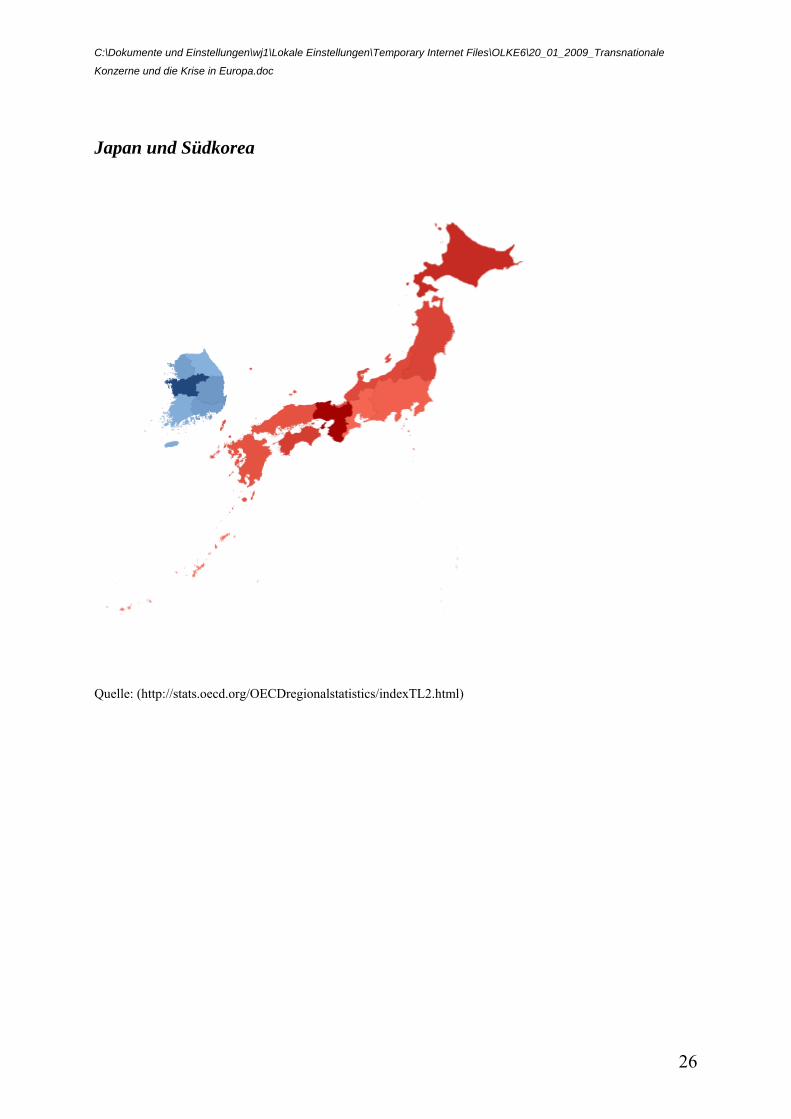
Aussagen über die Ursachen des regionalen Konvergenzprozesses in Europa – nur die Schaffung von Mehrwert, die Entwicklung von finanziellen und geschäftlichen Dienstleistungen, Investitionen und Beschäftigung in high-tech-manufacturing etc. würde die ärmeren an die reicheren Regionen des Kontinents rasch genug heranführen. Den EntscheidungsträgerInnen in Brüssel und in den nationalen Regierungen ist natürlich offensichtlich schon bewusst, dass gerade der Mangel einer kohärenten, aufholenden Entwicklung auf regionaler Ebene in Europa mit eines der entscheidendsten Ursachen des Zurückbleibens von Europa gegenüber unseren wichtigsten wirtschaftlichen Konkurrenten ist. Die Zielsetzung, ein Wachstum von mehr als 3% zu erzielen, erreichten in Europa viel zu wenige Regionen; um die Wohlstandsschwelle gegenüber den Lissabon-Konkurrenten einzuholen. Mehr noch: außer dem aufholenden Prozess der neuen Mitgliedsstaaten gab es in Westeuropa viel zu wenige Wachstumszonen, um den Kontinent in der letzten Dekade entscheidend zu dynamisieren. Irland, Südengland, das Baskenland und Katalonien, Luxemburg, Stockholm, Helsinki – solche Wachstumslokomotiven hab es viel zu wenige, während weite Teile der Fläche unseres Kontinents von Skandinavien bis nach Westspanien und Portugal das Lissabon-Ziel knapp verfehlten, und 3% Wachstum fast ausschließlich zu einer Erfahrung der südeuropäischen und osteuropäischen Peripherie machten. Insbesondere der Westen und Norden der USA und Kanadas, sowie weite Teile Australiens und Neuseelands hatten nicht nur ein höheres Prokopfeinkommen, sondern zogen mit mehr als 3% Wachstum weiter den Europäern davon.
C:\Dokumente und Einstellungen\wj1\Lokale Einstellungen\Temporary Internet Files\OLKE6\20_01_2009_Transnationale
Konzerne und die Krise in Europa.doc
25
Landkarte 6: der Fehlschlag des Lissabon-Prozesses in Europa. Wachstum über (blau) und Wachstum unter 3% pro Jahr (rot) auf regionaler Ebene OECD-Europa
Quelle: (http://stats.oecd.org/OECDregionalstatistics/indexTL2.html)
C:\Dokumente und Einstellungen\wj1\Lokale Einstellungen\Temporary Internet Files\OLKE6\20_01_2009_Transnationale
Konzerne und die Krise in Europa.doc
26
Japan und Südkorea
Quelle: (http://stats.oecd.org/OECDregionalstatistics/indexTL2.html)
C:\Dokumente und Einstellungen\wj1\Lokale Einstellungen\Temporary Internet Files\OLKE6\20_01_2009_Transnationale
Konzerne und die Krise in Europa.doc
27
Australien und Neuseeland
Quelle: (http://stats.oecd.org/OECDregionalstatistics/indexTL2.html)
C:\Dokumente und Einstellungen\wj1\Lokale Einstellungen\Temporary Internet Files\OLKE6\20_01_2009_Transnationale
Konzerne und die Krise in Europa.doc
28
OECD-Nordamerika
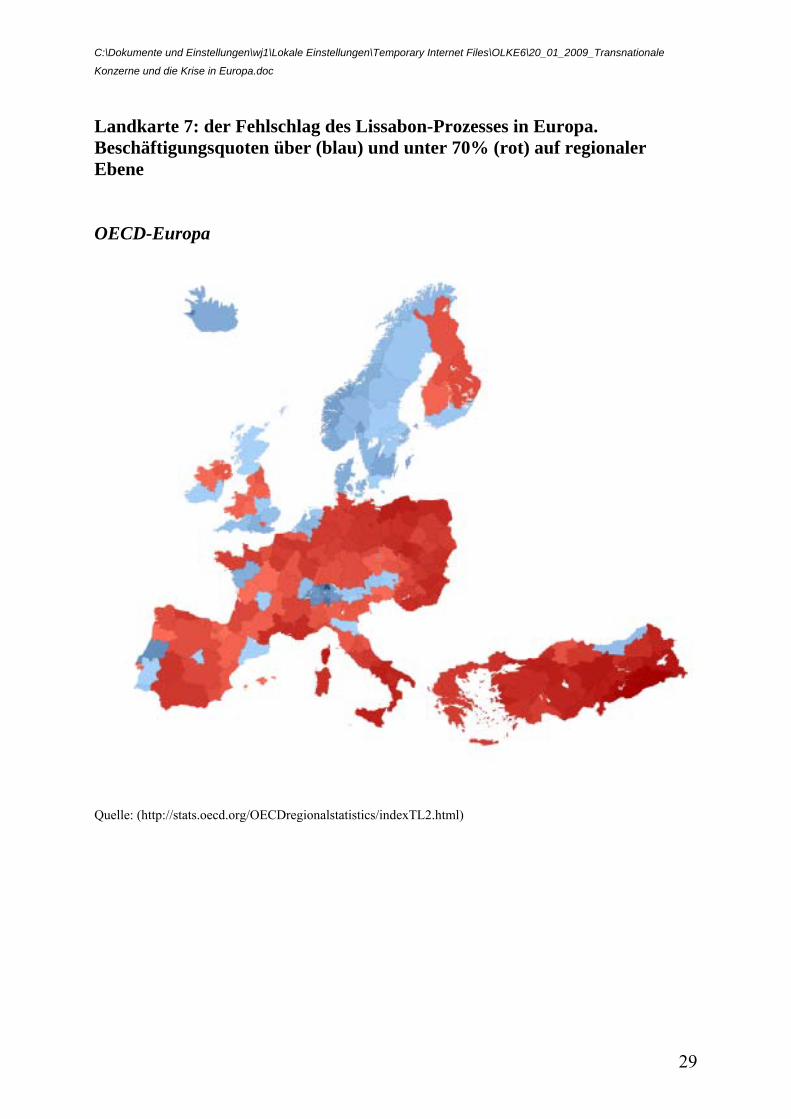
Quelle: (http://stats.oecd.org/OECDregionalstatistics/indexTL2.html) Zu den heeren Zielen von Lissabon zählte auch eine hohe Beschäftigungsrate. Die triste Realität der Lissabon-Konkurrenz ist, dass 70% Beschäftigung in Europa nur eine Frage von kleinen Inseln der Seeligen (sieht man/frau von Skandinavien, den Niederlanden und GB) ist, während Europa eigentlich sonst überall die Lissabon-Ziele bezogen auf die Beschäftigungsraten verfehlt:
C:\Dokumente und Einstellungen\wj1\Lokale Einstellungen\Temporary Internet Files\OLKE6\20_01_2009_Transnationale
Konzerne und die Krise in Europa.doc
29
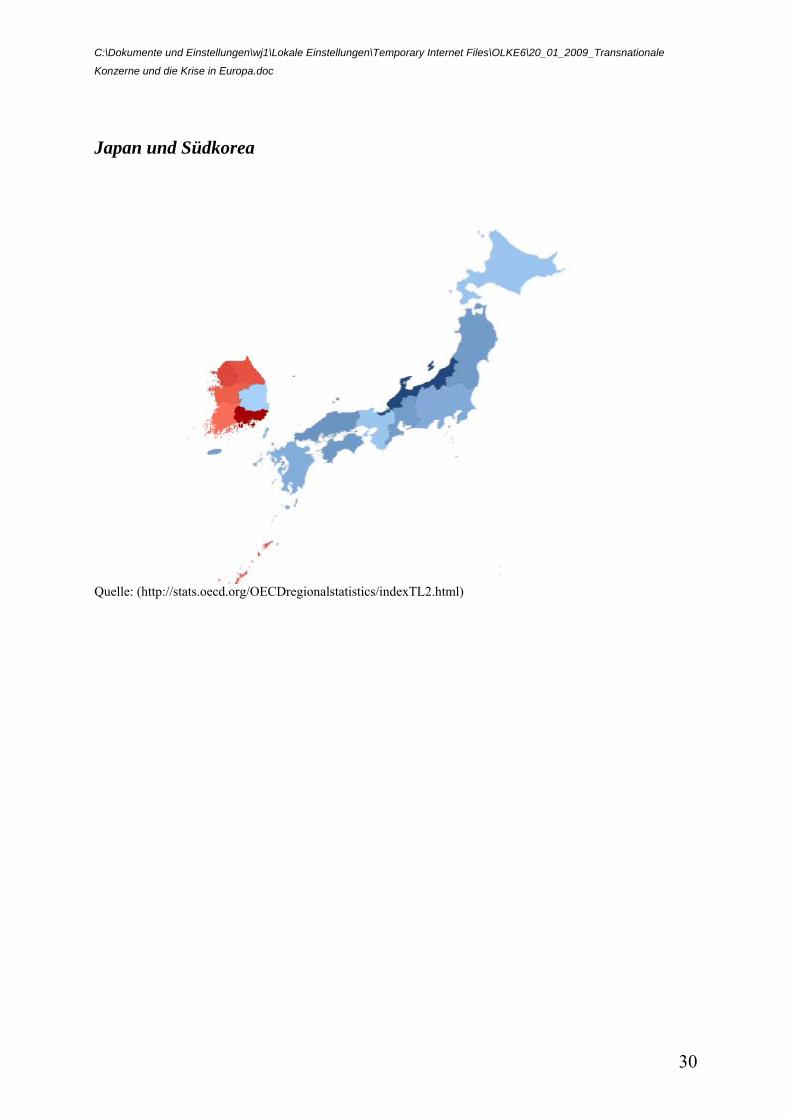
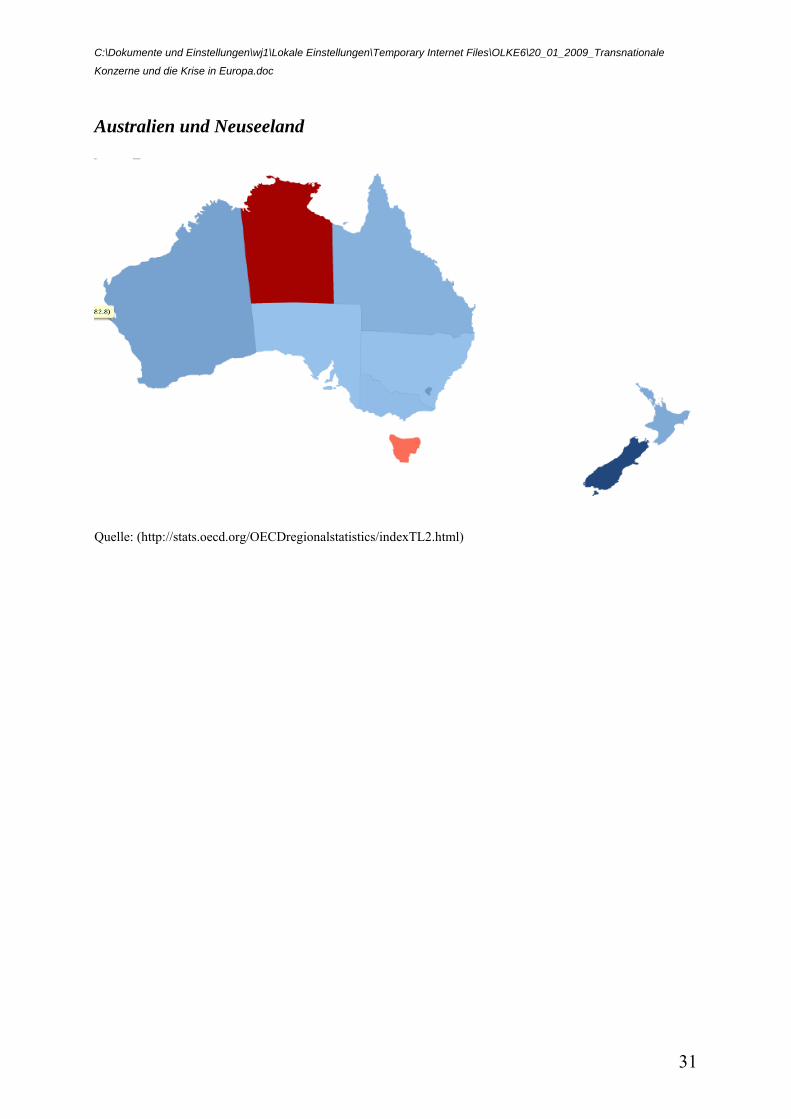
Landkarte 7: der Fehlschlag des Lissabon-Prozesses in Europa. Beschäftigungsquoten über (blau) und unter 70% (rot) auf regionaler Ebene OECD-Europa
Quelle: (http://stats.oecd.org/OECDregionalstatistics/indexTL2.html)
C:\Dokumente und Einstellungen\wj1\Lokale Einstellungen\Temporary Internet Files\OLKE6\20_01_2009_Transnationale
Konzerne und die Krise in Europa.doc
30
Japan und Südkorea
Quelle: (http://stats.oecd.org/OECDregionalstatistics/indexTL2.html)
C:\Dokumente und Einstellungen\wj1\Lokale Einstellungen\Temporary Internet Files\OLKE6\20_01_2009_Transnationale
Konzerne und die Krise in Europa.doc
31
Australien und Neuseeland
Quelle: (http://stats.oecd.org/OECDregionalstatistics/indexTL2.html)
C:\Dokumente und Einstellungen\wj1\Lokale Einstellungen\Temporary Internet Files\OLKE6\20_01_2009_Transnationale
Konzerne und die Krise in Europa.doc
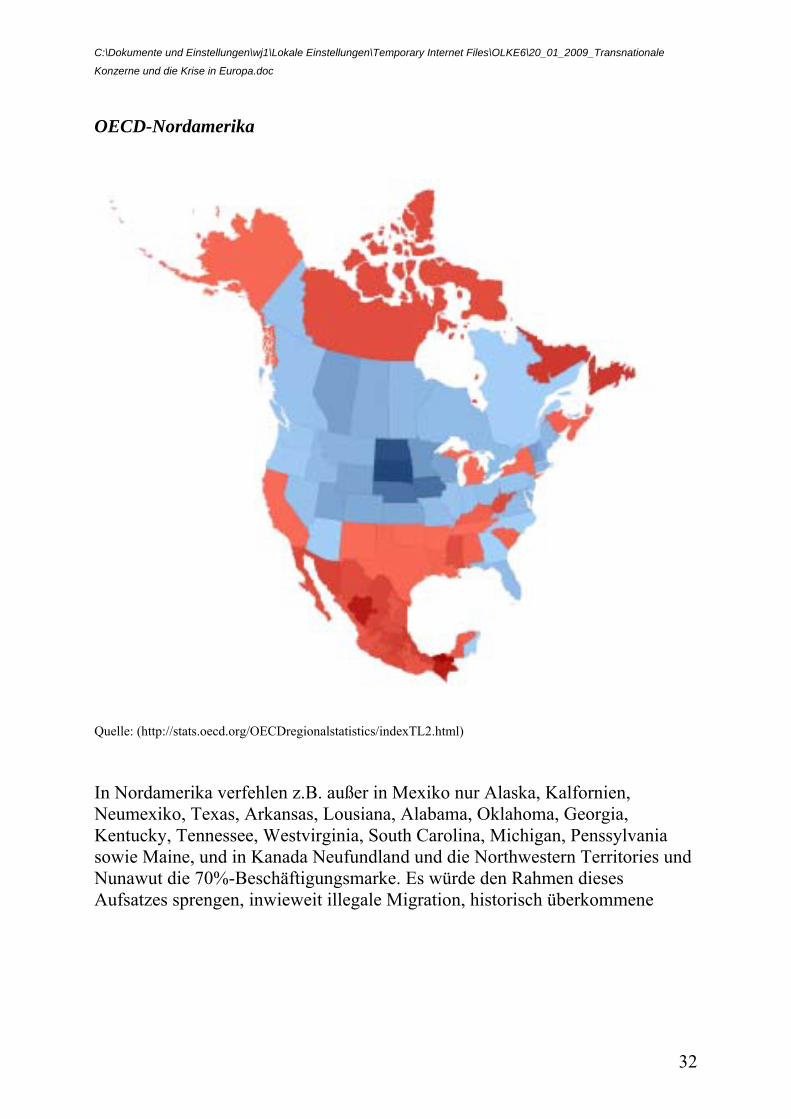
32
OECD-Nordamerika
Quelle: (http://stats.oecd.org/OECDregionalstatistics/indexTL2.html) In Nordamerika verfehlen z.B. außer in Mexiko nur Alaska, Kalfornien, Neumexiko, Texas, Arkansas, Lousiana, Alabama, Oklahoma, Georgia, Kentucky, Tennessee, Westvirginia, South Carolina, Michigan, Penssylvania sowie Maine, und in Kanada Neufundland und die Northwestern Territories und Nunawut die 70%-Beschäftigungsmarke. Es würde den Rahmen dieses Aufsatzes sprengen, inwieweit illegale Migration, historisch überkommene
C:\Dokumente und Einstellungen\wj1\Lokale Einstellungen\Temporary Internet Files\OLKE6\20_01_2009_Transnationale
Konzerne und die Krise in Europa.doc
33
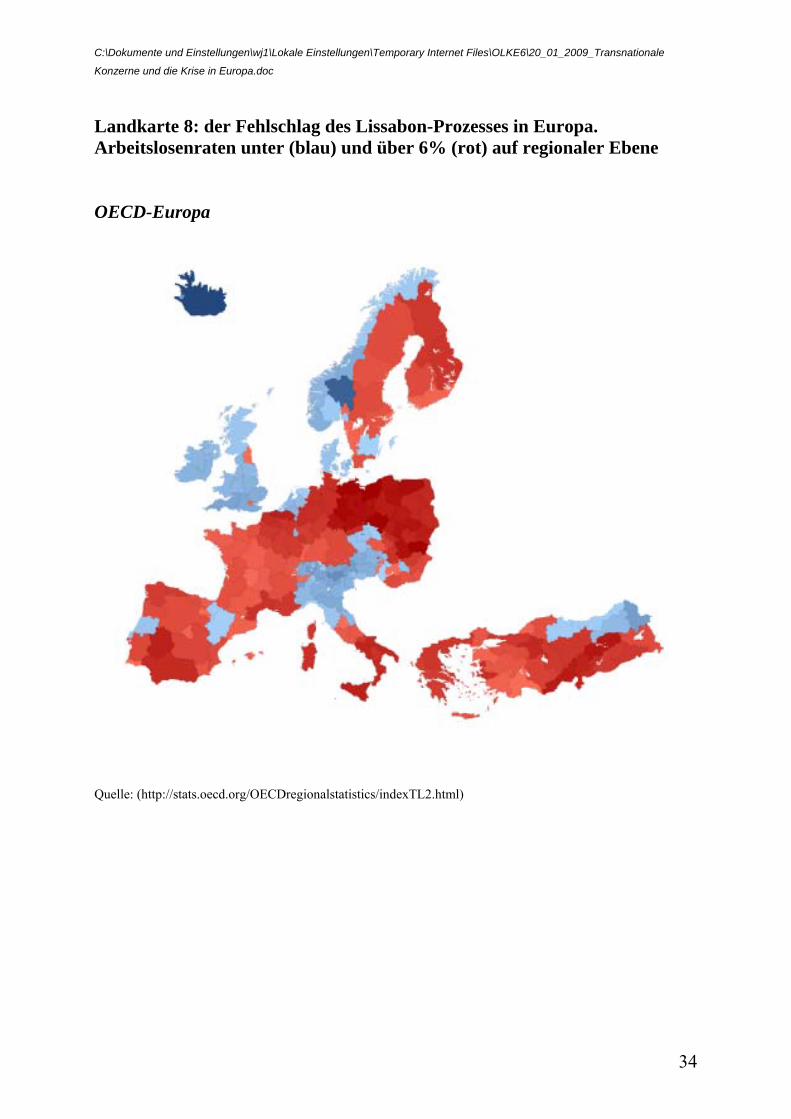
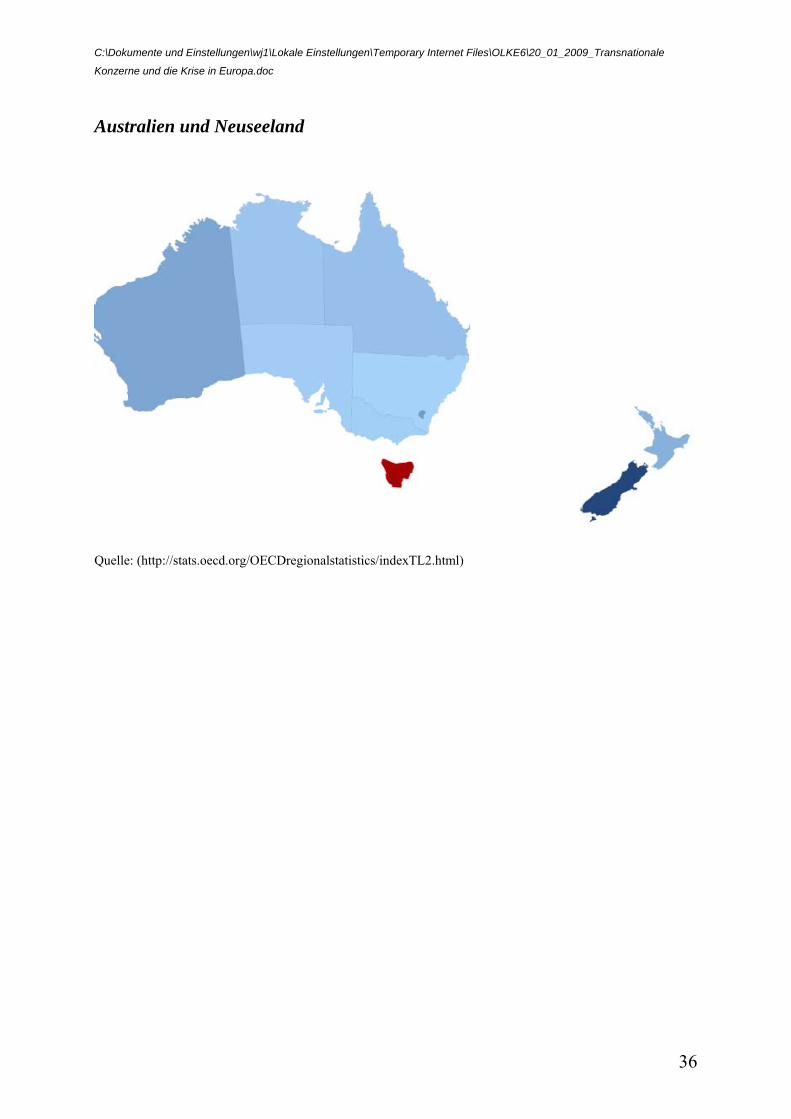
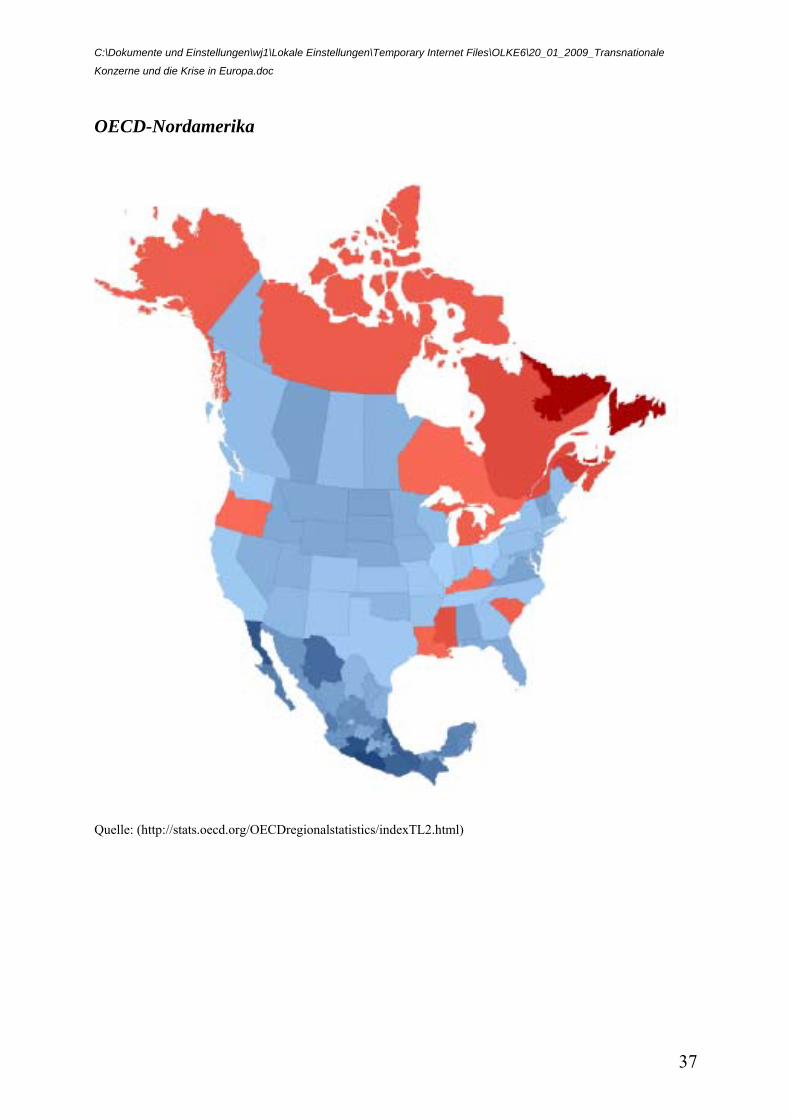
Verarmungsmuster der afro-amerikanischen Bevölkerung, sowie in Krise befindliche alte Industrien und die nördliche Randlage dieses Phänomen erklären. Ähnlich trist ist heute das Resultat der Lissabon-Konkurrenz im Bereich Beschäftigung: wiederum nur eine Insel der Seligen erreicht überhaupt – noch vor dem Auftreffen der Wucht des rezenten Finanz-Tsunami – eine Marke von 6% Arbeitslosenquote, während in Japan und Australien derart hohe Arbeitslosenquoten fast gänzlich unbekannt waren und in den USA lediglich die Bundesstaaten Alaska, Oregon, Lousiana, Alabama, Kentucky und South Carolina derartige Arbeitslosenquoten aufwiesen, wie sie für ca. 2/3 der Fläche der gesamten EU typisch sind. Kanadas Beschäftigungskrise ist eher im Norden, in Ontario sowie in den Atlantik-Provinzen angesiedelt.
C:\Dokumente und Einstellungen\wj1\Lokale Einstellungen\Temporary Internet Files\OLKE6\20_01_2009_Transnationale
Konzerne und die Krise in Europa.doc
34
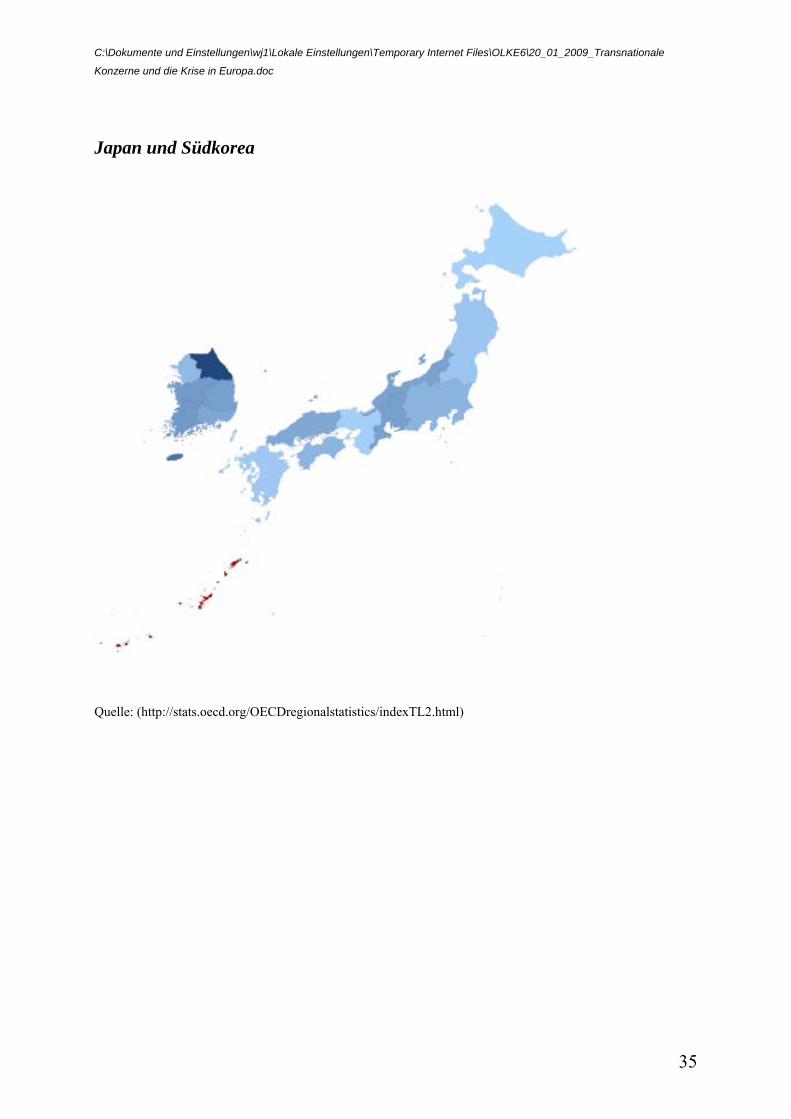
Landkarte 8: der Fehlschlag des Lissabon-Prozesses in Europa. Arbeitslosenraten unter (blau) und über 6% (rot) auf regionaler Ebene OECD-Europa
Quelle: (http://stats.oecd.org/OECDregionalstatistics/indexTL2.html)
C:\Dokumente und Einstellungen\wj1\Lokale Einstellungen\Temporary Internet Files\OLKE6\20_01_2009_Transnationale
Konzerne und die Krise in Europa.doc
35
Japan und Südkorea
Quelle: (http://stats.oecd.org/OECDregionalstatistics/indexTL2.html)
C:\Dokumente und Einstellungen\wj1\Lokale Einstellungen\Temporary Internet Files\OLKE6\20_01_2009_Transnationale
Konzerne und die Krise in Europa.doc
36
Australien und Neuseeland
Quelle: (http://stats.oecd.org/OECDregionalstatistics/indexTL2.html)
C:\Dokumente und Einstellungen\wj1\Lokale Einstellungen\Temporary Internet Files\OLKE6\20_01_2009_Transnationale
Konzerne und die Krise in Europa.doc
37
OECD-Nordamerika
Quelle: (http://stats.oecd.org/OECDregionalstatistics/indexTL2.html)
C:\Dokumente und Einstellungen\wj1\Lokale Einstellungen\Temporary Internet Files\OLKE6\20_01_2009_Transnationale
Konzerne und die Krise in Europa.doc
38
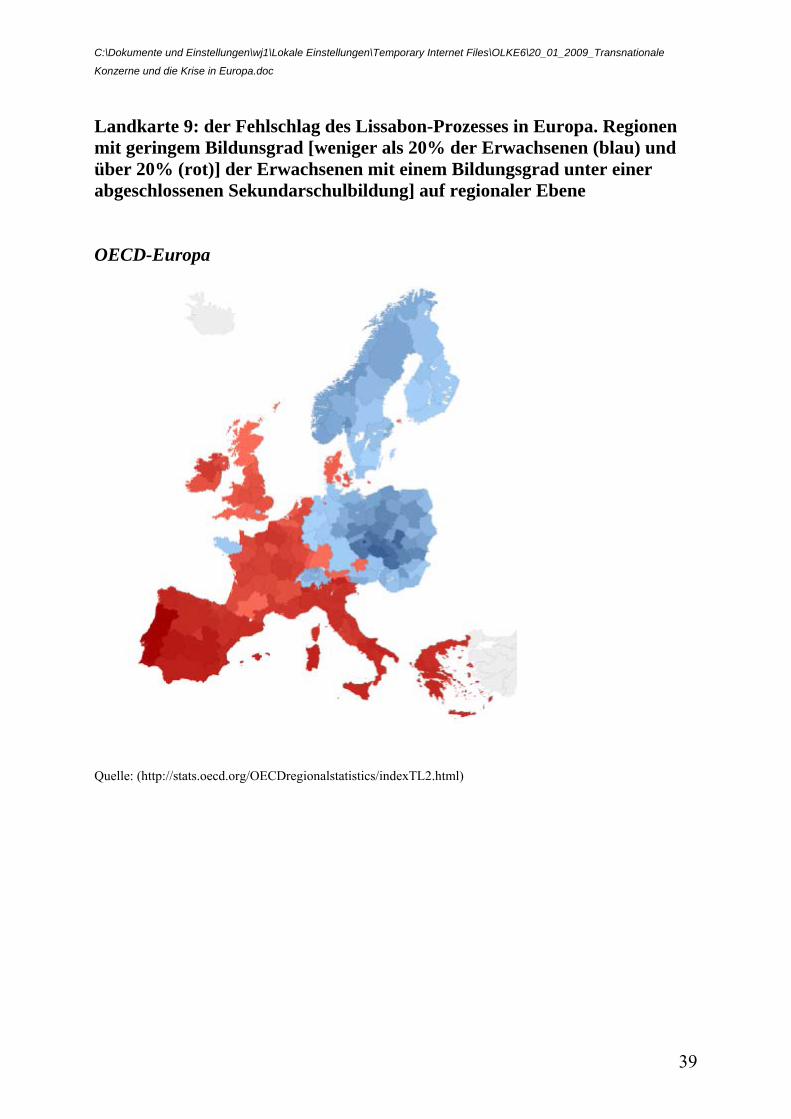
Kommen wir zum Thema von Europa als Fehlschlag auf dem Weg zu einem Kontinent des wissensbezogenen Wachstums und der Bildung. Die rot gefärbten Alarmleuchten von regional mehr als 20% der erwachsenen Bevölkerung mit einem Bildunsniveau von niedriger als der unteren Sekundarstufe sind leider vor allem im Süden und Westen unseres Kontinents angesiedelt; während Skandinavien, die paar Bildungsinseln wie London und die Bretagne, Deutschland, die Schweiz und Österreich sowie die neuen Mitgliedsstaaten eine wohltuende Ausnahme bilden. Während „down under“ diesbezüglich eine ähnliche Problemlage herrscht wie in Europa, schneiden in den USA lediglich die Bundestaaten Texas, Lousiana, Alabama und Kentucky ähnlich schlecht ab wie weiteste Teile solcher Kernzonen der EU wie Großbritannien, Frankreich, Spanien, Portugal und Italien (Für Japan sind leider keine Vergleichsdaten vorhanden).
C:\Dokumente und Einstellungen\wj1\Lokale Einstellungen\Temporary Internet Files\OLKE6\20_01_2009_Transnationale
Konzerne und die Krise in Europa.doc
39
Landkarte 9: der Fehlschlag des Lissabon-Prozesses in Europa. Regionen mit geringem Bildunsgrad [weniger als 20% der Erwachsenen (blau) und über 20% (rot)] der Erwachsenen mit einem Bildungsgrad unter einer abgeschlossenen Sekundarschulbildung] auf regionaler Ebene OECD-Europa
Quelle: (http://stats.oecd.org/OECDregionalstatistics/indexTL2.html)
C:\Dokumente und Einstellungen\wj1\Lokale Einstellungen\Temporary Internet Files\OLKE6\20_01_2009_Transnationale
Konzerne und die Krise in Europa.doc
40
Australien und Neuseeland
Quelle: (http://stats.oecd.org/OECDregionalstatistics/indexTL2.html)
C:\Dokumente und Einstellungen\wj1\Lokale Einstellungen\Temporary Internet Files\OLKE6\20_01_2009_Transnationale
Konzerne und die Krise in Europa.doc
41
OECD-Nordamerika
Quelle: (http://stats.oecd.org/OECDregionalstatistics/indexTL2.html)
C:\Dokumente und Einstellungen\wj1\Lokale Einstellungen\Temporary Internet Files\OLKE6\20_01_2009_Transnationale
Konzerne und die Krise in Europa.doc
42
Bei der Analyse der möglichen Kausalmechanismen für die weiter bestehende Kluft wird man/frau nicht umhin kommen, folgende Faktoren zu nennen, die dramatisch zur Fehlentwicklung der letzten Dekade beigetragen haben:
1) die schließlich auch in den 14 Lissabonner Strukturindikatoren festgeschriebene Verpflichtung der Mitgliedsstaaten, das komparative Preisniveau zu senken, und damit zu einer Abwärtsspirale gerade im Bereich nicht handelbare Dienstleistungen beigetragen zu haben
2) der weitgehende Fehlschlag der Integration der 15 Millionen Muslime in Westeuropa und der 15 Millionen Roma vor allem in den neuen Mitgliedsstaaten, welcher sich u.a. in den katastrophalen Schulabbruchsquoten äußert
3) im Vergleich zu Übersee die mangelnde Vereinbarkeit von Beruf und Familie sowie das gegenüber Australien, Kanada und den USA weit rigidere Migrationsregime, die beide die Überalterung der Bevölkerung weiter vertiefen.
C:\Dokumente und Einstellungen\wj1\Lokale Einstellungen\Temporary Internet Files\OLKE6\20_01_2009_Transnationale
Konzerne und die Krise in Europa.doc
43
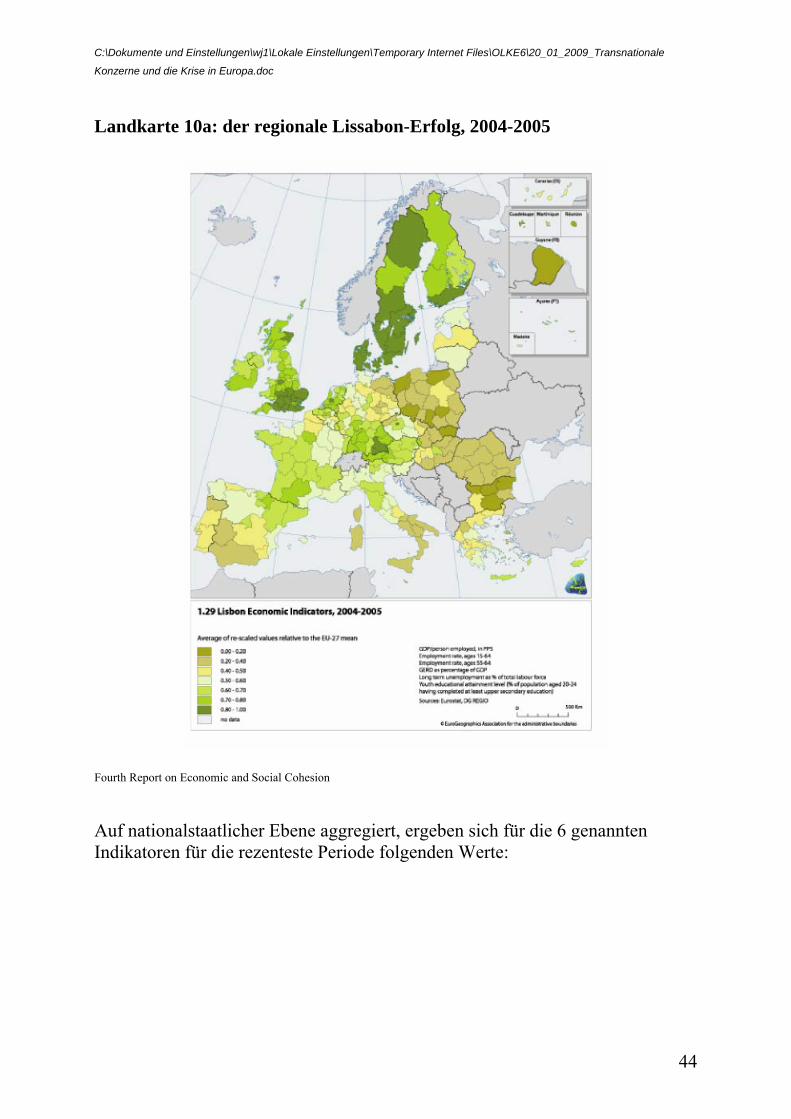
Zur empirischen Analyse der Kausalfaktoren der Krise von Europas Regionen Die EU-Kommission hat, wie bereits kurz erwähnt, in einer Maßzahl den Lissabon-Erfolg der Regionen aggregiert, die die 6 wichtigen Lissabon-Strukturindikatoren zusammenfasst: • GDP/person employed in PPS – Kaufkraft pro Kopf • Employment rate, ages 15-64 – Beschäftigungsrate Alter 15-64 • Employment rate, ages 55-64 – Beschäftigungsrate der älteren ArbeitnehmerInnen • GERD as percentage of GDP – Forschungsausgaben per BIP • Long term unemployment as % of total labour force – langfristige Arbeitslosigkeit • Youth educational attainment level (% of population aged 20-24 having completed at least upper secondary education) – Ausbildungsniveau der Jugend (Altersgruppe der 20-24-jährigen hat Sekundarschulabschluss) Das Vorhandensein einer derartigen aggregierten Maßzahl ist ein wichtiger Durchbruch in der Forschung zur Lissabon-Strategie-Performance. Karten 10a und b zeigen aber auch, wie wichtig es ist, die Daten auf regionaler Ebene zu analysieren, und nicht nur auf der aggregierten nationalstaatlichen Ebene:
C:\Dokumente und Einstellungen\wj1\Lokale Einstellungen\Temporary Internet Files\OLKE6\20_01_2009_Transnationale
Konzerne und die Krise in Europa.doc
44
Landkarte 10a: der regionale Lissabon-Erfolg, 2004-2005
Fourth Report on Economic and Social Cohesion
Auf nationalstaatlicher Ebene aggregiert, ergeben sich für die 6 genannten Indikatoren für die rezenteste Periode folgenden Werte:
C:\Dokumente und Einstellungen\wj1\Lokale Einstellungen\Temporary Internet Files\OLKE6\20_01_2009_Transnationale
Konzerne und die Krise in Europa.doc
45
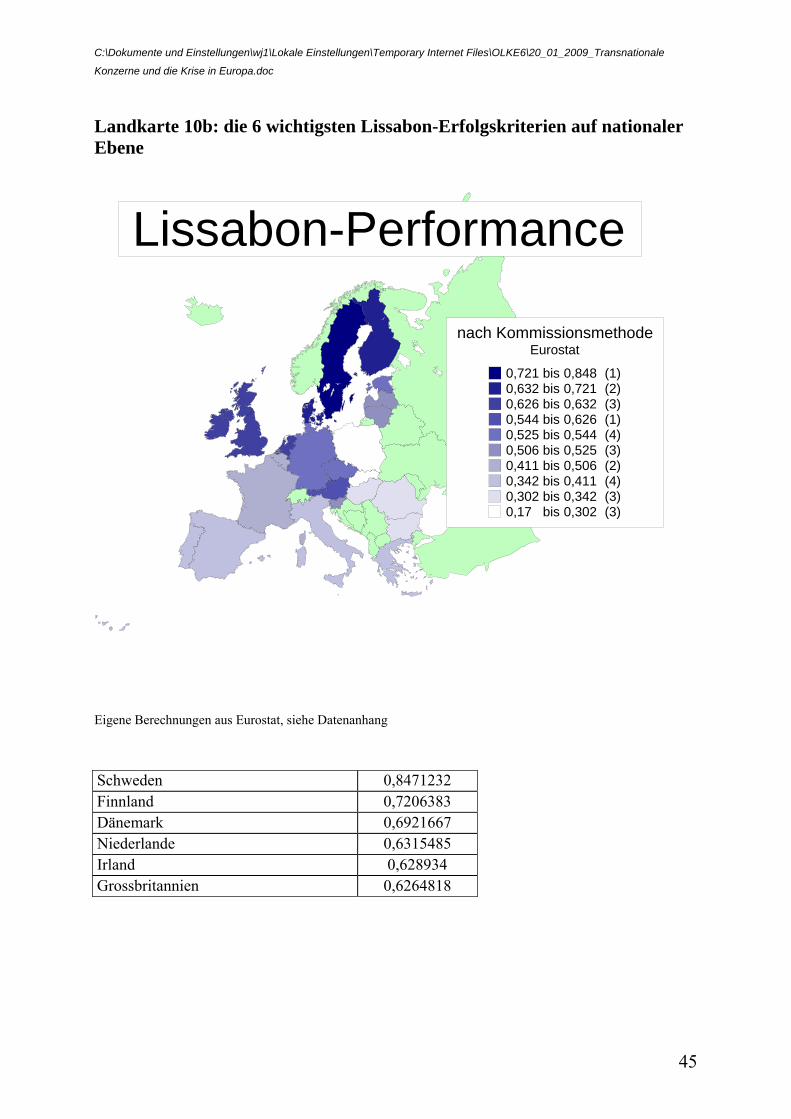
Landkarte 10b: die 6 wichtigsten Lissabon-Erfolgskriterien auf nationaler Ebene
nach KommissionsmethodeEurostat
0,721 bis 0,848 (1)0,632 bis 0,721 (2)0,626 bis 0,632 (3)0,544 bis 0,626 (1)0,525 bis 0,544 (4)0,506 bis 0,525 (3)0,411 bis 0,506 (2)0,342 bis 0,411 (4)0,302 bis 0,342 (3)0,17 bis 0,302 (3)
Lissabon-Performance
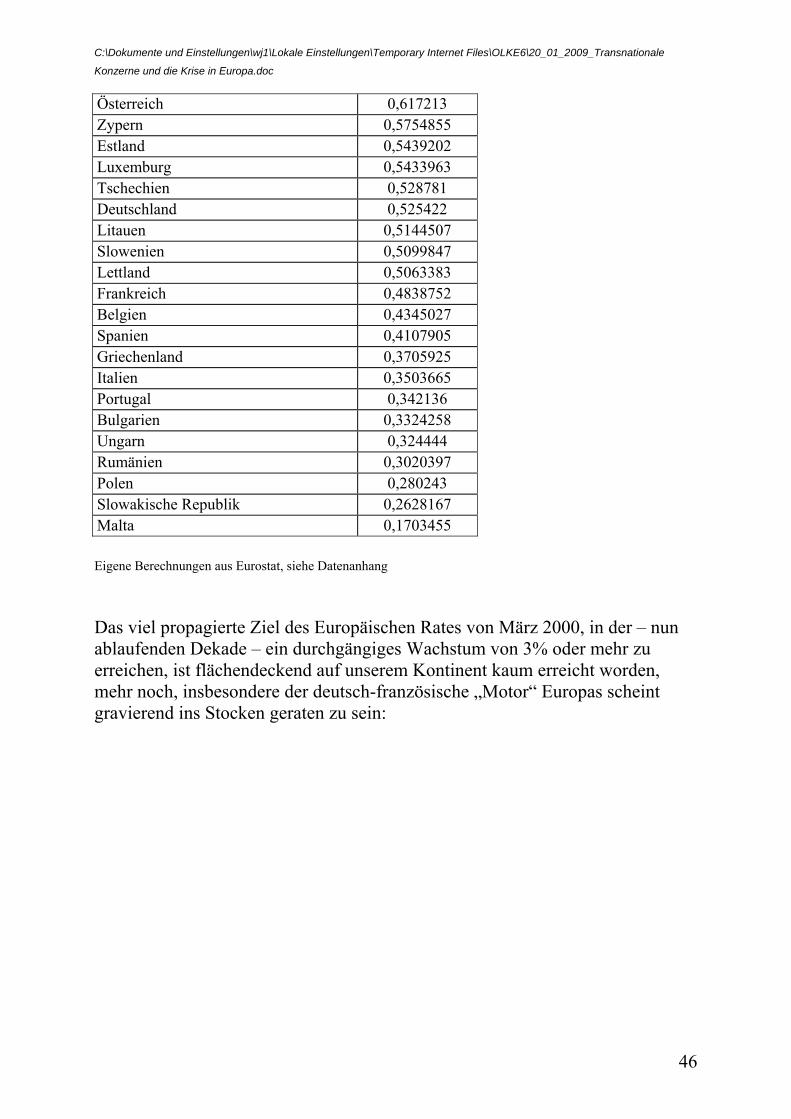
Eigene Berechnungen aus Eurostat, siehe Datenanhang Schweden 0,8471232 Finnland 0,7206383 Dänemark 0,6921667 Niederlande 0,6315485 Irland 0,628934 Grossbritannien 0,6264818
C:\Dokumente und Einstellungen\wj1\Lokale Einstellungen\Temporary Internet Files\OLKE6\20_01_2009_Transnationale
Konzerne und die Krise in Europa.doc
46
Österreich 0,617213 Zypern 0,5754855 Estland 0,5439202 Luxemburg 0,5433963 Tschechien 0,528781 Deutschland 0,525422 Litauen 0,5144507 Slowenien 0,5099847 Lettland 0,5063383 Frankreich 0,4838752 Belgien 0,4345027 Spanien 0,4107905 Griechenland 0,3705925 Italien 0,3503665 Portugal 0,342136 Bulgarien 0,3324258 Ungarn 0,324444 Rumänien 0,3020397 Polen 0,280243 Slowakische Republik 0,2628167 Malta 0,1703455 Eigene Berechnungen aus Eurostat, siehe Datenanhang Das viel propagierte Ziel des Europäischen Rates von März 2000, in der – nun ablaufenden Dekade – ein durchgängiges Wachstum von 3% oder mehr zu erreichen, ist flächendeckend auf unserem Kontinent kaum erreicht worden, mehr noch, insbesondere der deutsch-französische „Motor“ Europas scheint gravierend ins Stocken geraten zu sein:
C:\Dokumente und Einstellungen\wj1\Lokale Einstellungen\Temporary Internet Files\OLKE6\20_01_2009_Transnationale
Konzerne und die Krise in Europa.doc
47
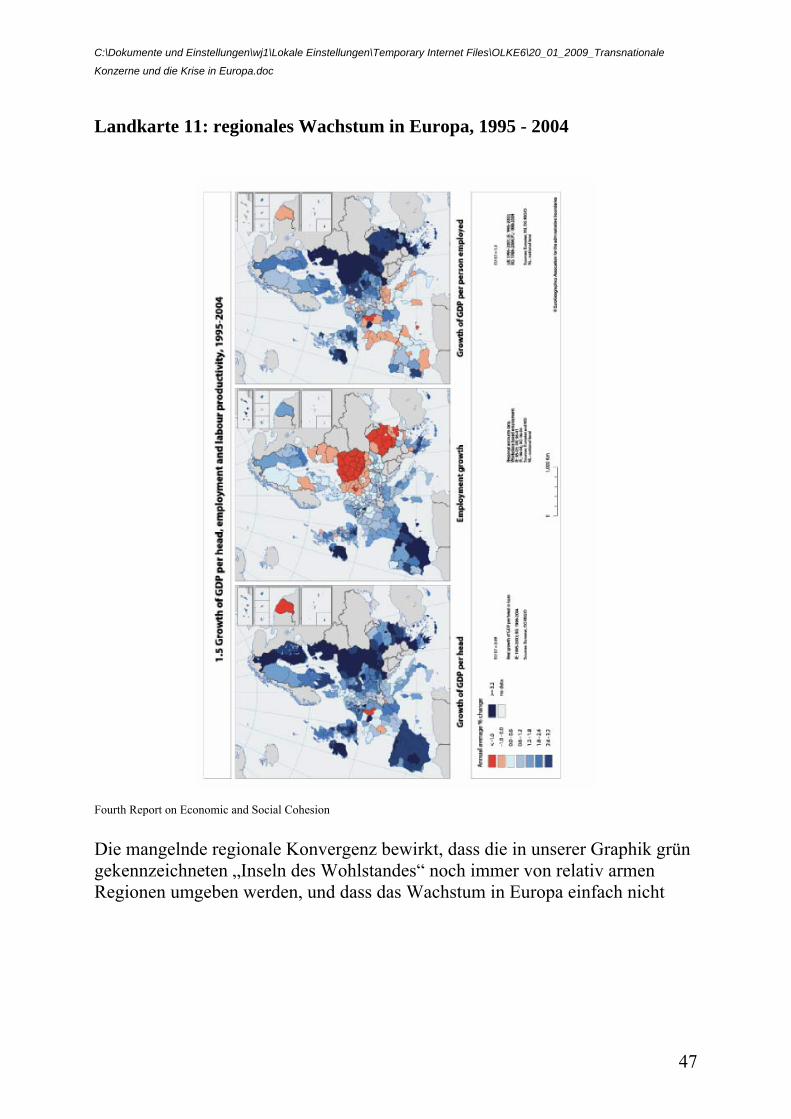
Landkarte 11: regionales Wachstum in Europa, 1995 - 2004
Fourth Report on Economic and Social Cohesion
Die mangelnde regionale Konvergenz bewirkt, dass die in unserer Graphik grün gekennzeichneten „Inseln des Wohlstandes“ noch immer von relativ armen Regionen umgeben werden, und dass das Wachstum in Europa einfach nicht
C:\Dokumente und Einstellungen\wj1\Lokale Einstellungen\Temporary Internet Files\OLKE6\20_01_2009_Transnationale
Konzerne und die Krise in Europa.doc
48
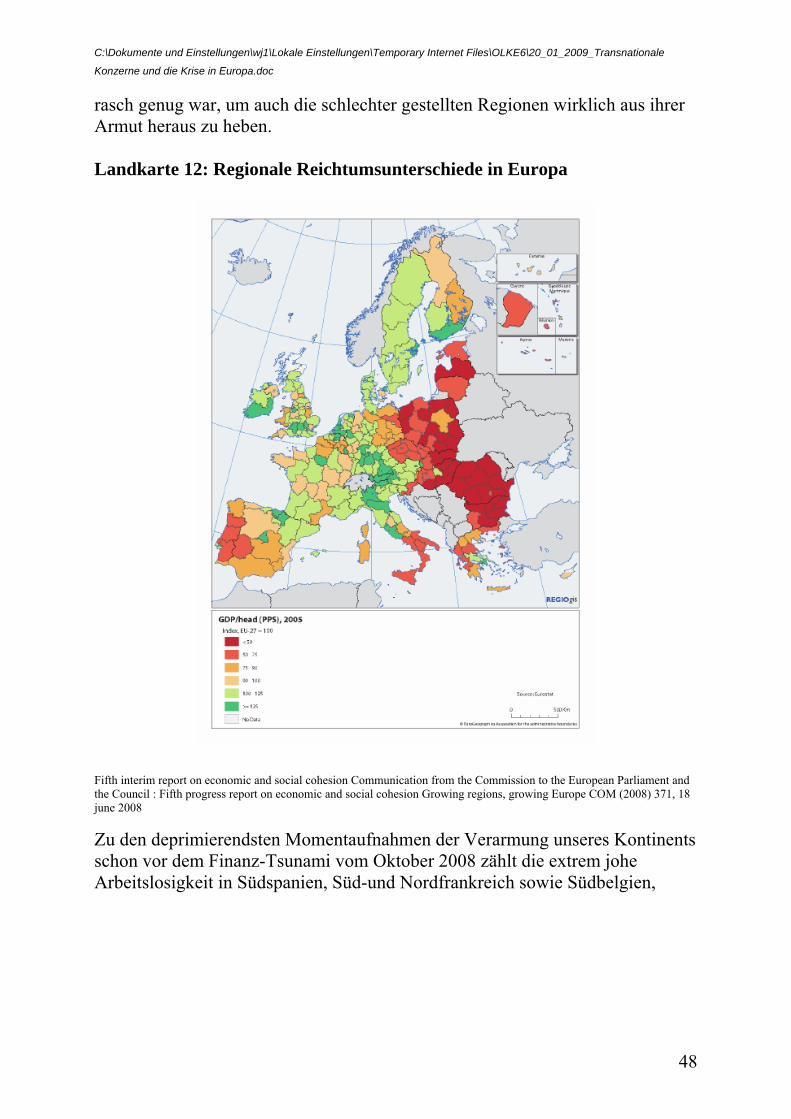
rasch genug war, um auch die schlechter gestellten Regionen wirklich aus ihrer Armut heraus zu heben. Landkarte 12: Regionale Reichtumsunterschiede in Europa
Fifth interim report on economic and social cohesion Communication from the Commission to the European Parliament and the Council : Fifth progress report on economic and social cohesion Growing regions, growing Europe COM (2008) 371, 18 june 2008
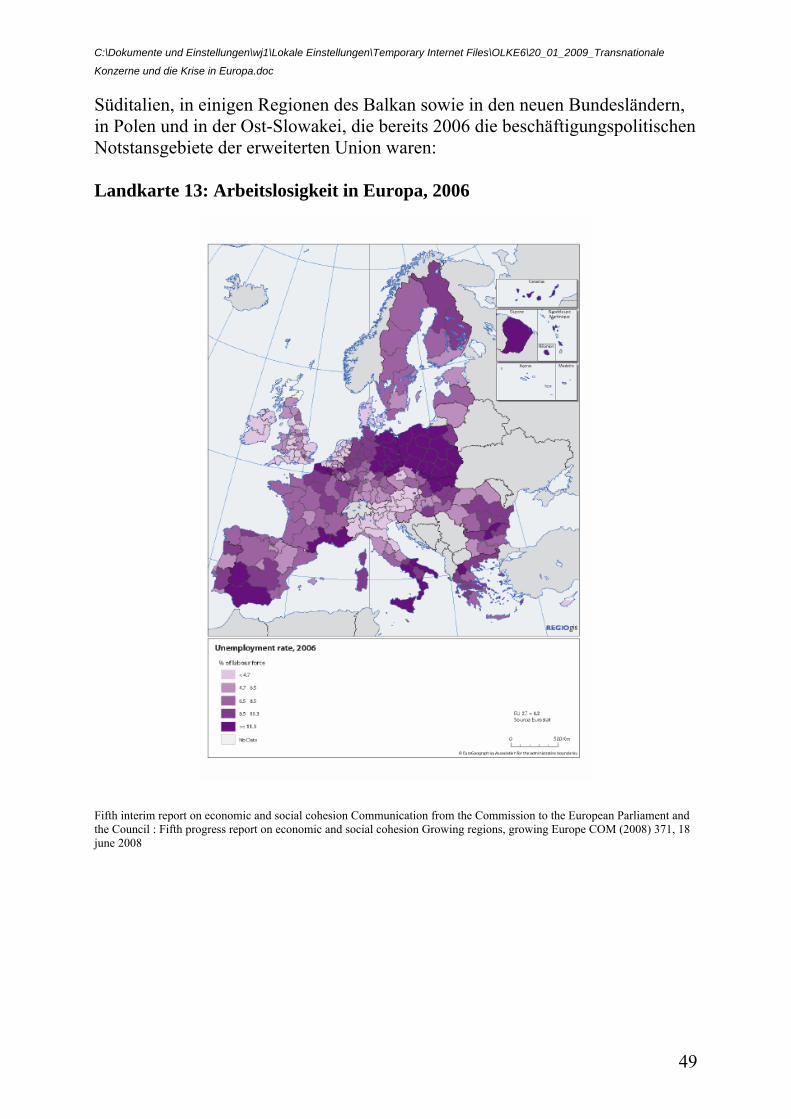
Zu den deprimierendsten Momentaufnahmen der Verarmung unseres Kontinents schon vor dem Finanz-Tsunami vom Oktober 2008 zählt die extrem johe Arbeitslosigkeit in Südspanien, Süd-und Nordfrankreich sowie Südbelgien,
C:\Dokumente und Einstellungen\wj1\Lokale Einstellungen\Temporary Internet Files\OLKE6\20_01_2009_Transnationale
Konzerne und die Krise in Europa.doc
49
Süditalien, in einigen Regionen des Balkan sowie in den neuen Bundesländern, in Polen und in der Ost-Slowakei, die bereits 2006 die beschäftigungspolitischen Notstansgebiete der erweiterten Union waren: Landkarte 13: Arbeitslosigkeit in Europa, 2006
Fifth interim report on economic and social cohesion Communication from the Commission to the European Parliament and the Council : Fifth progress report on economic and social cohesion Growing regions, growing Europe COM (2008) 371, 18 june 2008
C:\Dokumente und Einstellungen\wj1\Lokale Einstellungen\Temporary Internet Files\OLKE6\20_01_2009_Transnationale
Konzerne und die Krise in Europa.doc
50
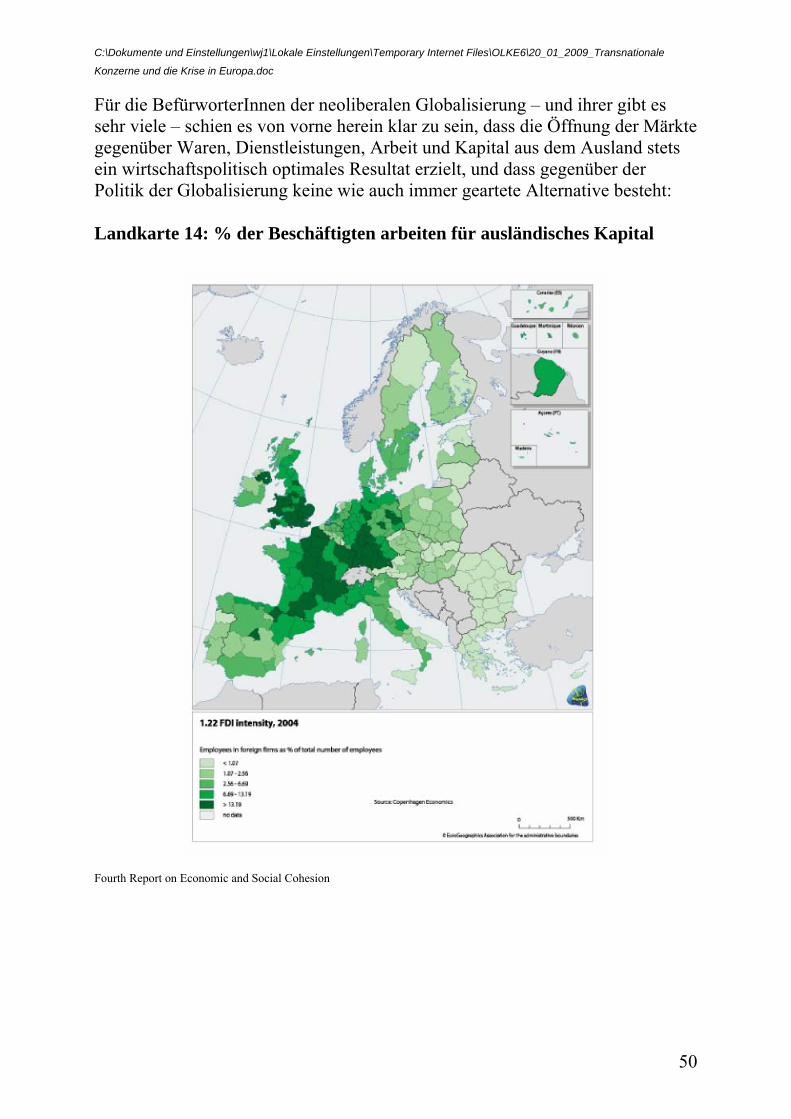
Für die BefürworterInnen der neoliberalen Globalisierung – und ihrer gibt es sehr viele – schien es von vorne herein klar zu sein, dass die Öffnung der Märkte gegenüber Waren, Dienstleistungen, Arbeit und Kapital aus dem Ausland stets ein wirtschaftspolitisch optimales Resultat erzielt, und dass gegenüber der Politik der Globalisierung keine wie auch immer geartete Alternative besteht: Landkarte 14: % der Beschäftigten arbeiten für ausländisches Kapital
Fourth Report on Economic and Social Cohesion
C:\Dokumente und Einstellungen\wj1\Lokale Einstellungen\Temporary Internet Files\OLKE6\20_01_2009_Transnationale
Konzerne und die Krise in Europa.doc
51
Gerade die Offenheit gegenüber ausländischen Direktinvestitionen schien den “Königsweg” einer erfolgreichen Entwicklung darzustellen. Der Fünfte Zwischenbericht über den wirtschaftlichen und sozialen Zusammenhalt in Europa der EU-Kommission geht von einem optimistischen Bild der regionalen Konvergenz in wirtschaftlicher und sozialer Hinsicht in Europa aus. Hauptaussage ist, dass die knapp vor dem Sprung zum Wohlstand sowie die wenig entwickelten Regionen ein rasches Wirtschaftswachstum von 4.3 bis 5.6% aufweisen, während die satten, reichen Regionen im Vergleich zu den ärmeren Regionen einen Teil ihres Wohlstandes in die ärmeren Zonen transferiert hätten. Die grundlegende analytische Belegstelle in diesem fünften Zwischenbericht vom Juni 2008 lautet dann: Diese kurze Analyse hat gezeigt, dass die europäischen Wachstumssektoren einen wichtigen Beitrag zur Konvergenz geleistet haben. Allerdings bestehen weiterhin große Unterschiede in der Wirtschaftsstruktur der drei Kategorien von Regionen, und das Muster der Angleichung ist in Konvergenz- und Übergangsregionen unterschiedlich. Dies hat verschiedene Auswirkungen auf die Politik. Bemühungen zur Stärkung der wachstumsstarken europäischen Sektoren, d. h. der Sektoren mit überdurchschnittlichen Beschäftigungs- oder BWS-Zuwächsen, scheinen gerechtfertigt. Diese Sektoren bieten der europäischen Wirtschaft nicht nur eine ganz klare globale Wachstumsperspektive, sondern sie können auch leistungsstarke Motoren des EU-Konvergenzprozesses sein. Darüber hinaus zeigt die Analyse, dass die Konvergenzregionen eine umfangreiche wirtschaftliche Umstrukturierung durchlaufen. Im Dienstleistungsbereich werden zahlreiche Arbeitsplätze geschaffen, während noch mehr Arbeitsplätze in der Landwirtschaft verloren gehen. Der BWS-Zuwachs ist vor allem in der Industrie und im Dienstleistungsbereich hoch, das Produktivitätswachstum ist drei mal höher als in den Regionen des Ziels „regionale Wettbewerbsfähigkeit und Beschäftigung“. Diese Umstrukturierung erfordert maßgeschneiderte politische Maßnahmen. Die Konvergenzregionen sollten die Verlagerung von Beschäftigung in den Dienstleistungsbereich erleichtern, insbesondere in Sektoren, für die kein hohes Bildungsniveau erforderlich ist, und mit der Modernisierung ihrer Landwirtschaft fortfahren. Da die Industrie ein wichtiger Sektor in den Konvergenzregionen ist und bleiben wird, sollte die Politik eine schrittweise Neuausrichtung der Industrie auf Aktivitäten mit hoher Produktivität und hoher Wertschöpfung unterstützen, um eine Spezialisierung auf Industriesektoren zu vermeiden, die dem internationalen Wettbewerb besonders ausgesetzt sind und geringe Wachstumsaussichten bieten. Die Konvergenzregionen sollten außerdem versuchen, das Bildungsniveau der Arbeitskräfte zu verbessern, da die Umstellung auf Aktivitäten mit höherer Wertschöpfung zu einer höheren Nachfrage nach besser qualifizierten Arbeitskräften führen wird. Dies wird sich auch darauf auswirken, wie schnell neue Technologien übernommen werden können, und zur Verringerung der Produktivitätslücke beitragen. Das hohe Produktivitätsniveau in den Regionen des Ziels „regionale Wettbewerbsfähigkeit und Beschäftigung“ verschaff t diesen Regionen schließlich nicht nur in Europa, sondern auch weltweit einen Wettbewerbsvorteil. Diese hohe Produktivität basiert auf hohen FuE-Investitionen, die bei weitem über denen in Konvergenzregionen liegen. Um einen globalen Wettbewerbsvorteil zu bewahren, müssen diese Regionen allerdings in der Lage sein, mit anderen internationalen Konkurrenten mitzuhalten, die noch mehr in FuE und Bildung investieren. Dies unterstreicht deutlich, dass es sinnvoll ist, die Kohäsionspolitik in den Regionen des Ziels „regionale Wettbewerbsfähigkeit und Beschäftigung“ zunehmend auf Investitionen in Innovation und Humankapital auszurichten.“
C:\Dokumente und Einstellungen\wj1\Lokale Einstellungen\Temporary Internet Files\OLKE6\20_01_2009_Transnationale
Konzerne und die Krise in Europa.doc
52
Der Bericht macht auch weitgehende Aussagen über die künftige neoliberal inspirierte Orientierung der EU-Regionalpolitik: keine Konvergenz ohne Kompetitivität, gutes Wachstum in der Peripherie, schlechter werdendes Wachstum im Zentrum, wachsende Arbeitslosigkeit im Zentrum, sinkende Arbeitslosigkeit in der EU-Peripherie. Globalisierungskritisch orientierte, methodisch quantitativ verfahrende SozialwissenschafterInnen, insbesondere in den Vereinigten Staaten, haben seit Jahren in den führenden sozialwissenschaftlichen Journalen Untersuchungen vorgelegt, die wirtschaftswissenschaftlichen Theorien monopolistischer Konkurrenz im Anschluss an Baran, Kalecki, Rothschild und Sweezy viel eher zu bestätigen scheinen als die Thesen von der allseits heilsamen Wirkung der Öffnung der Märkte für Waren, Kapital, Arbeit und Dienstleistungen. Insbesondere das – auch durch den Franzosen Francois Perroux problematisierte – Verhältnis der Macht in der Ökonomie ist letztlich nicht aus der Realität auszuklammern, vor allem das Verhältnis der Investitionen der Transnationalen Konzerne mit der wirtschaftlichen und sozialen Entwicklung der Gastländer. Zahlreiche Untersuchungen (vgl. auch die Studie „Ist das soziale Europa fit für die Globalisierung? Studie des CEPS im Auftrag der EU-Kommission“) haben immer wieder belegt, dass unter Konstanthaltung des erreichten Entwicklungsniveaus die Penetration eines Landes durch Investitionen transnationaler Konzerne vor allem die Ungleichheit in der Einkommensverteilung erhöht und zu einer sozial unausgeglichenen Entwicklung führt. Die zahlreichen Untersuchungen von AutorInnen wie Bornschier, Boswell, Kentor, London u.v.a. in solchen Journalen wie der „American Sociological Review“ wurden in der sozialwissenschaftlichen Debatte breit rezipiert und haben bereits früh zu gewissen „eschatologischen“ Zweifeln an der ultraliberalen Globalisierungspolitik der letzten Jahre beigetragen, Zweifel, die sich nun in der Folge des Finanz-Tsunami vom Oktober 2008 erneut zu bestätigen scheinen. Die US-Soziologin Linda Beer hat die Argumente wie folgt zusammengefasst: (…) This approach argues that national economic growth, inequality and sociopolitical change can only be understood through the analysis of a nation's relative position in the spacioeconomic hierarchy of the world system. That is, the relationship between economic growth and income inequality within any single nation is dependent on that society's relational position in the world division of labor and global power structure. It is asserted that the dynamics of capitalist accumulation in developing countries are different than the processes observable in core nations.
C:\Dokumente und Einstellungen\wj1\Lokale Einstellungen\Temporary Internet Files\OLKE6\20_01_2009_Transnationale
Konzerne und die Krise in Europa.doc
53
(…) The issue that World-System/Dependency analyses point our attention to is not the lack of economic growth in developing nations, but the type of growth their dependent status affords them and it's consequences. (…) In the World-System/Dependency perspective, capitalist development is dependent on social and material inequality and this inequality is in turn a result of incorporation into the world system. National economic growth and income distribution are in large part determined by growth potentials of productive activities in the larger global structure. Therefore, this approach hypothesizes that stratification of income will correspond with the world division of labor and position in the world economy. (…) There are variants to the World-System/Dependency approach regarding the creation of income inequality, some of which emphasize concentration of land ownership (…) or national export-structure. (…) Many empirical studies of this relationship have confirmed a significant association between foreign corporate penetration [ … and inequality] (…) In the World-System/Dependency perspective there are three mechanisms that are hypothesized to link foreign investment and social inequality. (…) . First, foreign investment in developing countries generates large sectoral disparities in the national economy, creates labor aristocracies and results in the underutilization of indigenous labor. Second, transnational corporations operating in developing nations accrue a disproportionate share of local sources of credit and repatriate profits rather than reinvesting them in the local economy. Finally, the governments of these nations, motivated by the necessity (generated by their incorporation into the capitalist world economy) of attracting and maintaining foreign investment, implement policies and strategies that decrease the power of labor and inhibit vertical mobility. These include tax concessions, guarantees of profit repatriation, and labor laws unfavorable to workers. (…) Scholars in the World-System/Dependency tradition argue that the relationship between foreign investment and internal income inequality has different effects on various sectors of the economy, but in all segments it creates and sustains income inequality in the national population. (…) Foreign capital investment in the agricultural sector destroys traditional production processes and leads to unemployment and overurbanization through its capital intensive means of organization (i.e. labor shedding, land enclosure). In the extractive sector of the economy, foreign investment benefits only a small portion of the national population and thereby increases income inequality. This is because TNC penetration in this sector creates only a small well-paid labor force and because ownership of natural resources is typically concentrated. (…) World-System theorists argue that foreign investment in the manufacturing sector has the most harmful effect on national income distribution. National economies in non-core nations with large manufacturing sectors have high levels of income inequality because profits in this sector are increased by the maintenance of a large, surplus low-wage labor force. Therefore, high rates of income inequality are in the interest of transnational corporations and national elites who benefit from foreign investment; they have little incentive to take action to distribute income more equitably. Contrary to the hypotheses of Modernization theorists, the World-System perspective argues that the uneven development of highly penetrated developing economies benefits transnational corporations in that the only segment of the population which can afford to buy these manufactured goods is the wealthy elite. (…) Domestic demand for these goods depends on the concentration of wealth and high levels of income inequality. Although redistribution of wealth and the resultant expansion of markets may be in the long term interest of foreign corporations, they are driven primarily by the short-term profit logic of capitalism. (…) Furthermore, there is a convergence of interests between transnational corporations and the wealthy elite segments of the national population in maintaining income inequality which creates barriers to the "trickle-down" effect of industrialization predicted by Modernization theories. In addition to the incentives for inequity
C:\Dokumente und Einstellungen\wj1\Lokale Einstellungen\Temporary Internet Files\OLKE6\20_01_2009_Transnationale
Konzerne und die Krise in Europa.doc
54
for foreign investors discussed above, the national elite strive to maintain their power and higher income so as to maintain privileged consumption patterns and access to status symbols. A common international class interest in the persistence of high levels of inequality thus link foreign investors and indigenous elites, leading these powerful groups to support (and in some cases attempt to increase) the existing unequal income distribution and to coopt and repress opposition from other segments of the population (…) (Beer, 1999: 4 - 7) Kategorisiert man/frau die Regionen Europas bezüglich ihrer in der Landkarte 14 wiedergegebenen 5-er Skala der Penetration durch das internationale Kapital, und berechnet man/frau überdies die Wirkungen der übrigen, von Info-Regio der EU-Kommission übernommenen Erklärungsvariablen, so stehen folgende, multivariat berechnete Erklärungsmuster der Regionalentwicklung in Europa fest:
1. Es gibt einen „perversen“ Effekt der regionalen Divergenz, der vor allem bedeutet, dass reiche Regionen rasch wachsen, und arme Regionen langsam
2. Die Penetration einer Region durch das Auslandskapital ist tatsächlich
eine wesentliche Entwicklungsblockade für alle 4 herangezogenen Indikatoren
3. Höhere Bildung ist ein wesentliches Mittel, um die Lissabon-Ziele zu
erreichen
4. Eine gute demographische Zuwachsrate ist wesentlich für die Erreichung der regionalen Entwicklungsziele
C:\Dokumente und Einstellungen\wj1\Lokale Einstellungen\Temporary Internet Files\OLKE6\20_01_2009_Transnationale
Konzerne und die Krise in Europa.doc
55
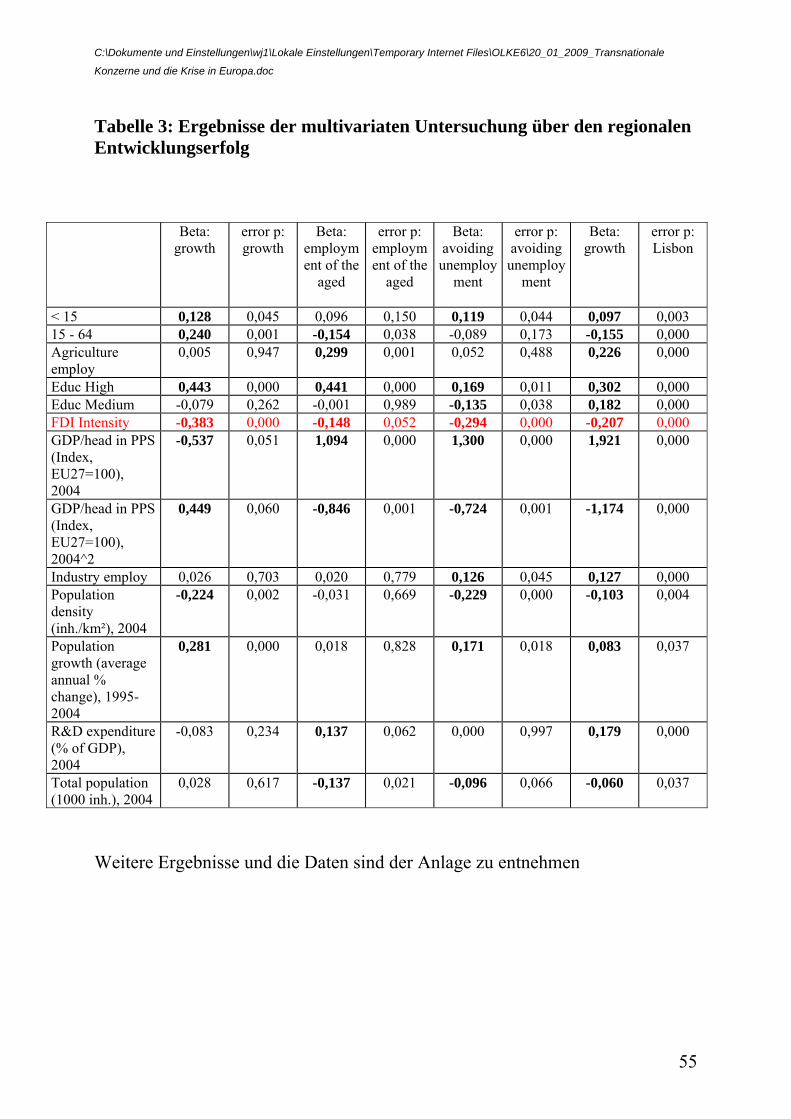
Tabelle 3: Ergebnisse der multivariaten Untersuchung über den regionalen Entwicklungserfolg
Beta: growth
error p: growth
Beta: employment of the
aged
error p: employment of the
aged
Beta: avoiding unemploy
ment
error p: avoiding unemploy
ment
Beta: growth
error p: Lisbon
< 15 0,128 0,045 0,096 0,150 0,119 0,044 0,097 0,003 15 - 64 0,240 0,001 -0,154 0,038 -0,089 0,173 -0,155 0,000 Agriculture employ
0,005 0,947 0,299 0,001 0,052 0,488 0,226 0,000
Educ High 0,443 0,000 0,441 0,000 0,169 0,011 0,302 0,000 Educ Medium -0,079 0,262 -0,001 0,989 -0,135 0,038 0,182 0,000 FDI Intensity -0,383 0,000 -0,148 0,052 -0,294 0,000 -0,207 0,000 GDP/head in PPS (Index, EU27=100), 2004
-0,537 0,051 1,094 0,000 1,300 0,000 1,921 0,000
GDP/head in PPS (Index, EU27=100), 2004^2
0,449 0,060 -0,846 0,001 -0,724 0,001 -1,174 0,000
Industry employ 0,026 0,703 0,020 0,779 0,126 0,045 0,127 0,000 Population density (inh./km²), 2004
-0,224 0,002 -0,031 0,669 -0,229 0,000 -0,103 0,004
Population growth (average annual % change), 1995-2004
0,281 0,000 0,018 0,828 0,171 0,018 0,083 0,037
R&D expenditure (% of GDP), 2004
-0,083 0,234 0,137 0,062 0,000 0,997 0,179 0,000
Total population (1000 inh.), 2004
0,028 0,617 -0,137 0,021 -0,096 0,066 -0,060 0,037
Weitere Ergebnisse und die Daten sind der Anlage zu entnehmen
C:\Dokumente und Einstellungen\wj1\Lokale Einstellungen\Temporary Internet Files\OLKE6\20_01_2009_Transnationale
Konzerne und die Krise in Europa.doc
56
Datenanlage: Transnationale Konzerne und die Krise in Europa Statistische Ergebnisse Variablen – Definition
• Total population (1000 inh.), 2004 • Population density (inh./km²), 2004 • Population growth (average annual % change), 1995-2004 • GDP/head in PPS (Index, EU27=100), 2004 • GDP/person employed, in Euro (Index, EU27=100), 2004 • GDP growth (average annual % change), 1995-2004 • Agriculture employment in % • Industry employment in % • Services employment in % • R&D expenditure (% of GDP), 2004 • R&D expenditure in the business enterprise sector (% of GDP), 2004 • Employment rate (%), 2005 15-64 • Employment Female 15-64 - employment rate • Employment rate Ages 55-64 • Unemployment rate (%), 2005 • Unemployment female • Unemployment young • Unemployment long term • % pop < 15 • % pop 15 - 64 years • % pop 65 + • % adult pop with education: low • % adult pop with education: medium • % adult pop with education: High • Economic Lisbon Indicators (average of re-scaled values relative to the EU27 mean), 2004-2005
C:\Dokumente und Einstellungen\wj1\Lokale Einstellungen\Temporary Internet Files\OLKE6\20_01_2009_Transnationale
Konzerne und die Krise in Europa.doc
57
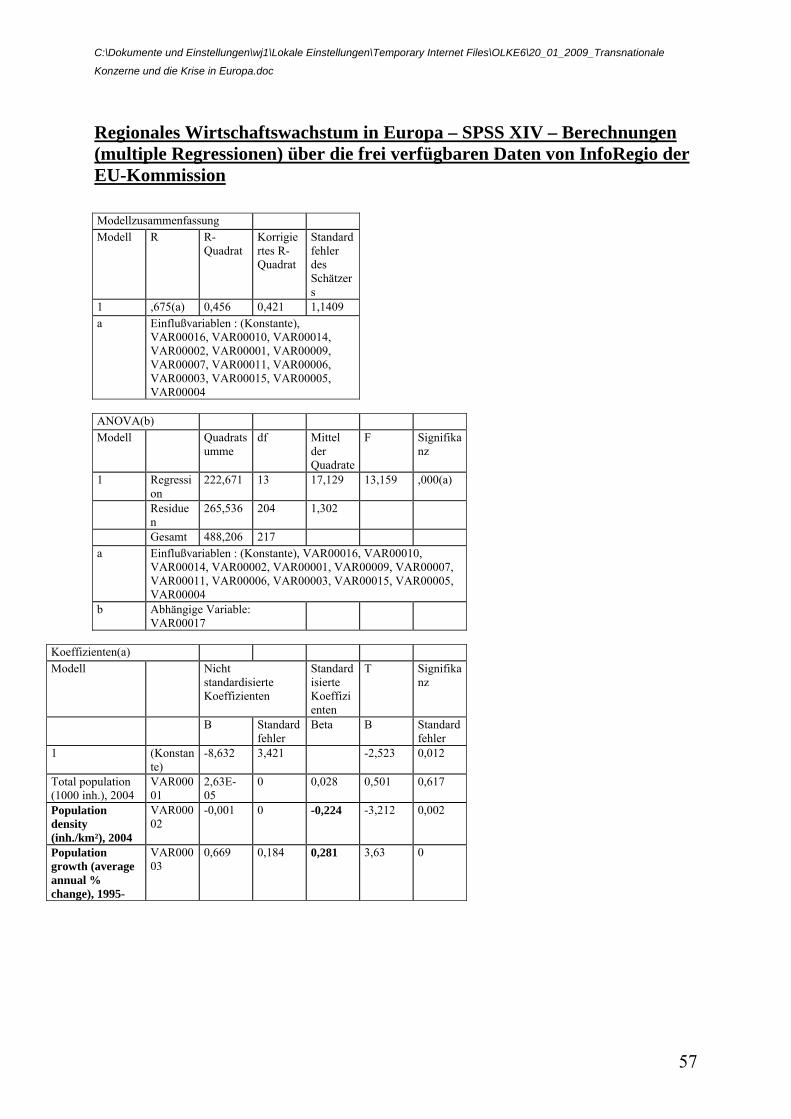
Regionales Wirtschaftswachstum in Europa – SPSS XIV – Berechnungen (multiple Regressionen) über die frei verfügbaren Daten von InfoRegio der EU-Kommission Modellzusammenfassung Modell R R-
Quadrat Korrigiertes R-Quadrat
Standardfehler des Schätzers
1 ,675(a) 0,456 0,421 1,1409 a Einflußvariablen : (Konstante),
VAR00016, VAR00010, VAR00014, VAR00002, VAR00001, VAR00009, VAR00007, VAR00011, VAR00006, VAR00003, VAR00015, VAR00005, VAR00004
ANOVA(b) Modell Quadrats
umme df Mittel
der Quadrate
F Signifikanz
1 Regression
222,671 13 17,129 13,159 ,000(a)
Residuen
265,536 204 1,302
Gesamt 488,206 217 a Einflußvariablen : (Konstante), VAR00016, VAR00010,
VAR00014, VAR00002, VAR00001, VAR00009, VAR00007, VAR00011, VAR00006, VAR00003, VAR00015, VAR00005, VAR00004
b Abhängige Variable: VAR00017
Koeffizienten(a) Modell Nicht
standardisierte Koeffizienten
Standardisierte Koeffizienten
T Signifikanz
B Standardfehler
Beta B Standardfehler
1 (Konstante)
-8,632 3,421 -2,523 0,012
Total population (1000 inh.), 2004
VAR00001
2,63E-05
0 0,028 0,501 0,617
Population density (inh./km²), 2004
VAR00002
-0,001 0 -0,224 -3,212 0,002
Population growth (average annual % change), 1995-
VAR00003
0,669 0,184 0,281 3,63 0
C:\Dokumente und Einstellungen\wj1\Lokale Einstellungen\Temporary Internet Files\OLKE6\20_01_2009_Transnationale
Konzerne und die Krise in Europa.doc
58
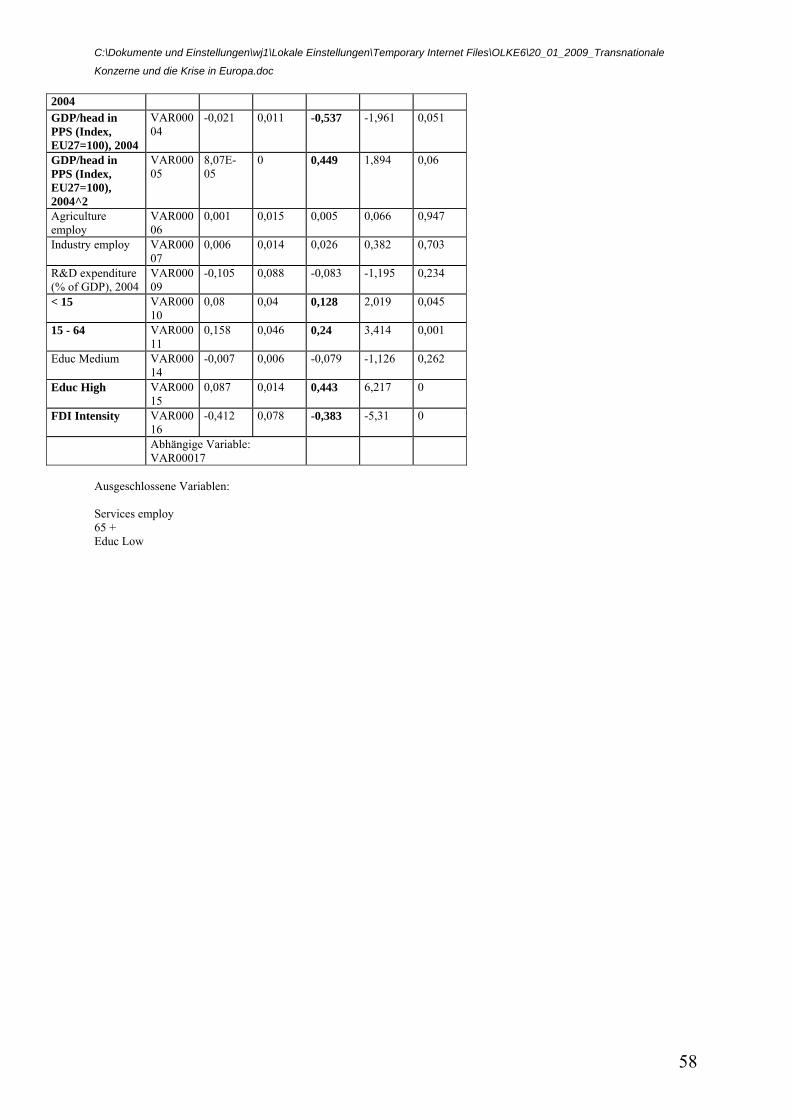
2004 GDP/head in PPS (Index, EU27=100), 2004
VAR00004
-0,021 0,011 -0,537 -1,961 0,051
GDP/head in PPS (Index, EU27=100), 2004^2
VAR00005
8,07E-05
0 0,449 1,894 0,06
Agriculture employ
VAR00006
0,001 0,015 0,005 0,066 0,947
Industry employ VAR00007
0,006 0,014 0,026 0,382 0,703
R&D expenditure (% of GDP), 2004
VAR00009
-0,105 0,088 -0,083 -1,195 0,234
< 15 VAR00010
0,08 0,04 0,128 2,019 0,045
15 - 64 VAR00011
0,158 0,046 0,24 3,414 0,001
Educ Medium VAR00014
-0,007 0,006 -0,079 -1,126 0,262
Educ High VAR00015
0,087 0,014 0,443 6,217 0
FDI Intensity VAR00016
-0,412 0,078 -0,383 -5,31 0
Abhängige Variable: VAR00017
Ausgeschlossene Variablen: Services employ 65 + Educ Low
C:\Dokumente und Einstellungen\wj1\Lokale Einstellungen\Temporary Internet Files\OLKE6\20_01_2009_Transnationale
Konzerne und die Krise in Europa.doc
59
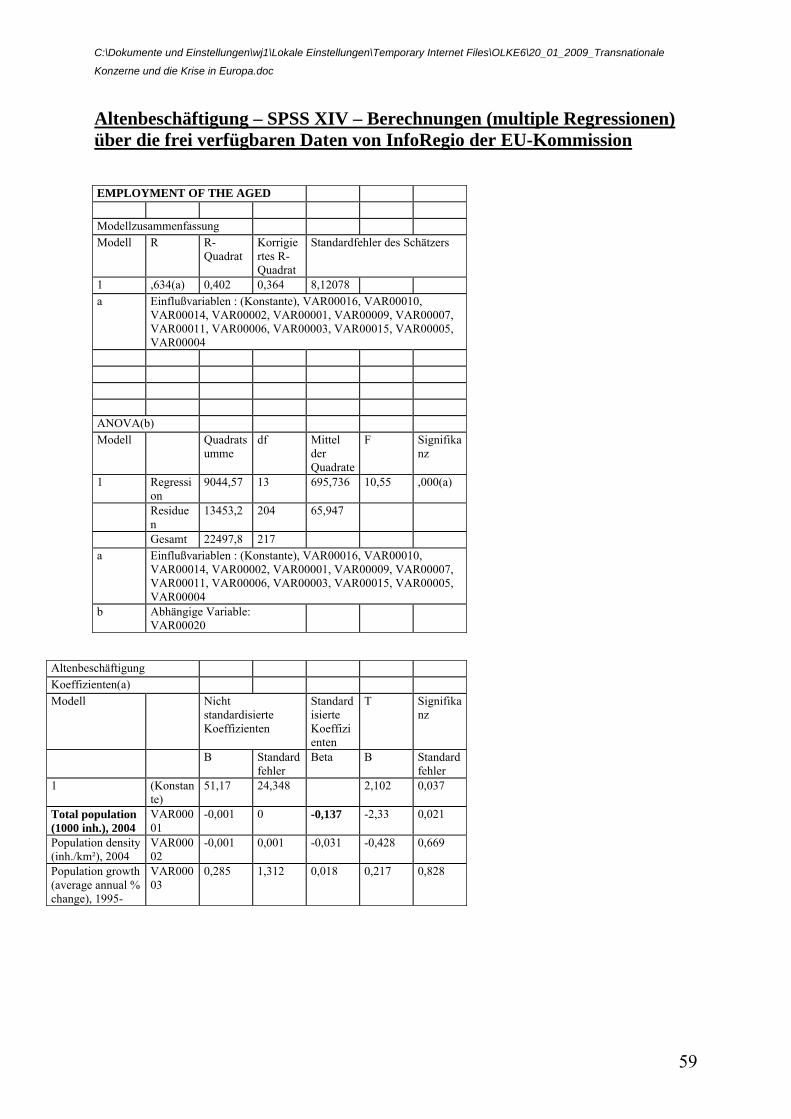
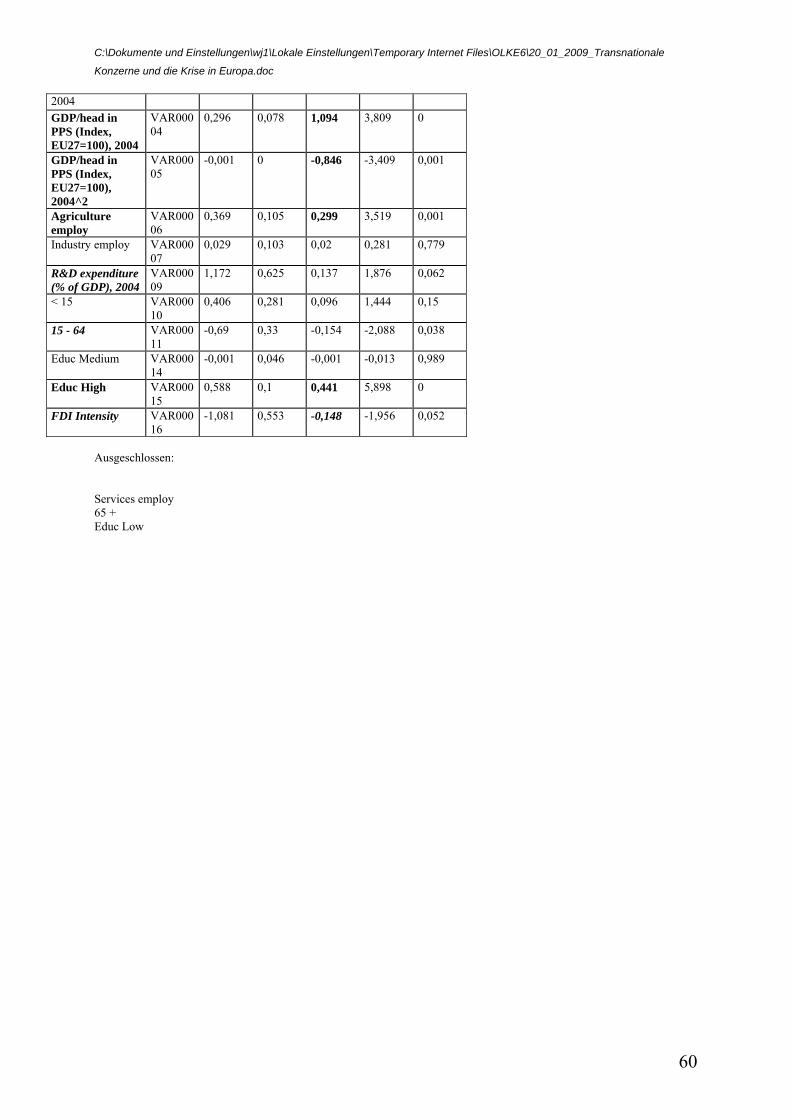
Altenbeschäftigung – SPSS XIV – Berechnungen (multiple Regressionen) über die frei verfügbaren Daten von InfoRegio der EU-Kommission EMPLOYMENT OF THE AGED Modellzusammenfassung Modell R R-
Quadrat Korrigiertes R-Quadrat
Standardfehler des Schätzers
1 ,634(a) 0,402 0,364 8,12078 a Einflußvariablen : (Konstante), VAR00016, VAR00010,
VAR00014, VAR00002, VAR00001, VAR00009, VAR00007, VAR00011, VAR00006, VAR00003, VAR00015, VAR00005, VAR00004
ANOVA(b) Modell Quadrats
umme df Mittel
der Quadrate
F Signifikanz
1 Regression
9044,57 13 695,736 10,55 ,000(a)
Residuen
13453,2 204 65,947
Gesamt 22497,8 217 a Einflußvariablen : (Konstante), VAR00016, VAR00010,
VAR00014, VAR00002, VAR00001, VAR00009, VAR00007, VAR00011, VAR00006, VAR00003, VAR00015, VAR00005, VAR00004
b Abhängige Variable: VAR00020
Altenbeschäftigung Koeffizienten(a) Modell Nicht
standardisierte Koeffizienten
Standardisierte Koeffizienten
T Signifikanz
B Standardfehler
Beta B Standardfehler
1 (Konstante)
51,17 24,348 2,102 0,037
Total population (1000 inh.), 2004
VAR00001
-0,001 0 -0,137 -2,33 0,021
Population density (inh./km²), 2004
VAR00002
-0,001 0,001 -0,031 -0,428 0,669
Population growth (average annual % change), 1995-
VAR00003
0,285 1,312 0,018 0,217 0,828
C:\Dokumente und Einstellungen\wj1\Lokale Einstellungen\Temporary Internet Files\OLKE6\20_01_2009_Transnationale
Konzerne und die Krise in Europa.doc
60
2004 GDP/head in PPS (Index, EU27=100), 2004
VAR00004
0,296 0,078 1,094 3,809 0
GDP/head in PPS (Index, EU27=100), 2004^2
VAR00005
-0,001 0 -0,846 -3,409 0,001
Agriculture employ
VAR00006
0,369 0,105 0,299 3,519 0,001
Industry employ VAR00007
0,029 0,103 0,02 0,281 0,779
R&D expenditure (% of GDP), 2004
VAR00009
1,172 0,625 0,137 1,876 0,062
< 15 VAR00010
0,406 0,281 0,096 1,444 0,15
15 - 64 VAR00011
-0,69 0,33 -0,154 -2,088 0,038
Educ Medium VAR00014
-0,001 0,046 -0,001 -0,013 0,989
Educ High VAR00015
0,588 0,1 0,441 5,898 0
FDI Intensity VAR00016
-1,081 0,553 -0,148 -1,956 0,052
Ausgeschlossen: Services employ 65 + Educ Low
C:\Dokumente und Einstellungen\wj1\Lokale Einstellungen\Temporary Internet Files\OLKE6\20_01_2009_Transnationale
Konzerne und die Krise in Europa.doc
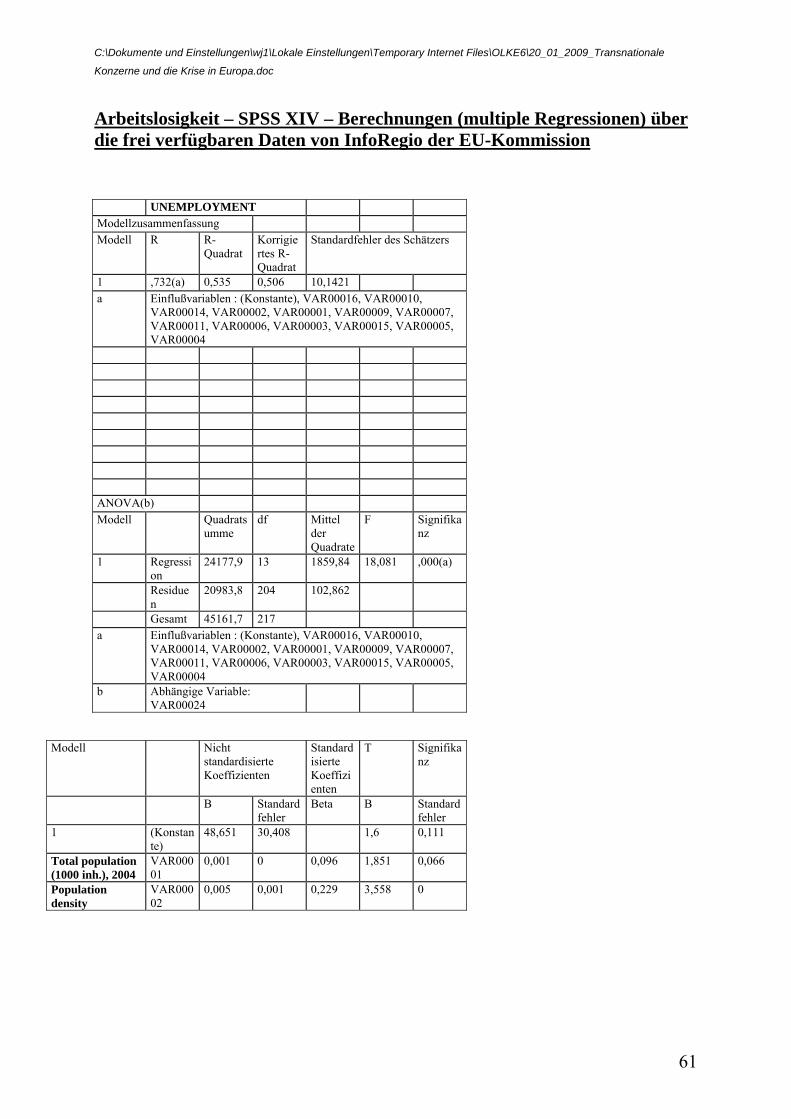
61
Arbeitslosigkeit – SPSS XIV – Berechnungen (multiple Regressionen) über die frei verfügbaren Daten von InfoRegio der EU-Kommission UNEMPLOYMENT Modellzusammenfassung Modell R R-
Quadrat Korrigiertes R-Quadrat
Standardfehler des Schätzers
1 ,732(a) 0,535 0,506 10,1421 a Einflußvariablen : (Konstante), VAR00016, VAR00010,
VAR00014, VAR00002, VAR00001, VAR00009, VAR00007, VAR00011, VAR00006, VAR00003, VAR00015, VAR00005, VAR00004
ANOVA(b) Modell Quadrats
umme df Mittel
der Quadrate
F Signifikanz
1 Regression
24177,9 13 1859,84 18,081 ,000(a)
Residuen
20983,8 204 102,862
Gesamt 45161,7 217 a Einflußvariablen : (Konstante), VAR00016, VAR00010,
VAR00014, VAR00002, VAR00001, VAR00009, VAR00007, VAR00011, VAR00006, VAR00003, VAR00015, VAR00005, VAR00004
b Abhängige Variable: VAR00024
Modell Nicht standardisierte Koeffizienten
Standardisierte Koeffizienten
T Signifikanz
B Standardfehler
Beta B Standardfehler
1 (Konstante)
48,651 30,408 1,6 0,111
Total population (1000 inh.), 2004
VAR00001
0,001 0 0,096 1,851 0,066
Population density
VAR00002
0,005 0,001 0,229 3,558 0
C:\Dokumente und Einstellungen\wj1\Lokale Einstellungen\Temporary Internet Files\OLKE6\20_01_2009_Transnationale
Konzerne und die Krise in Europa.doc
62
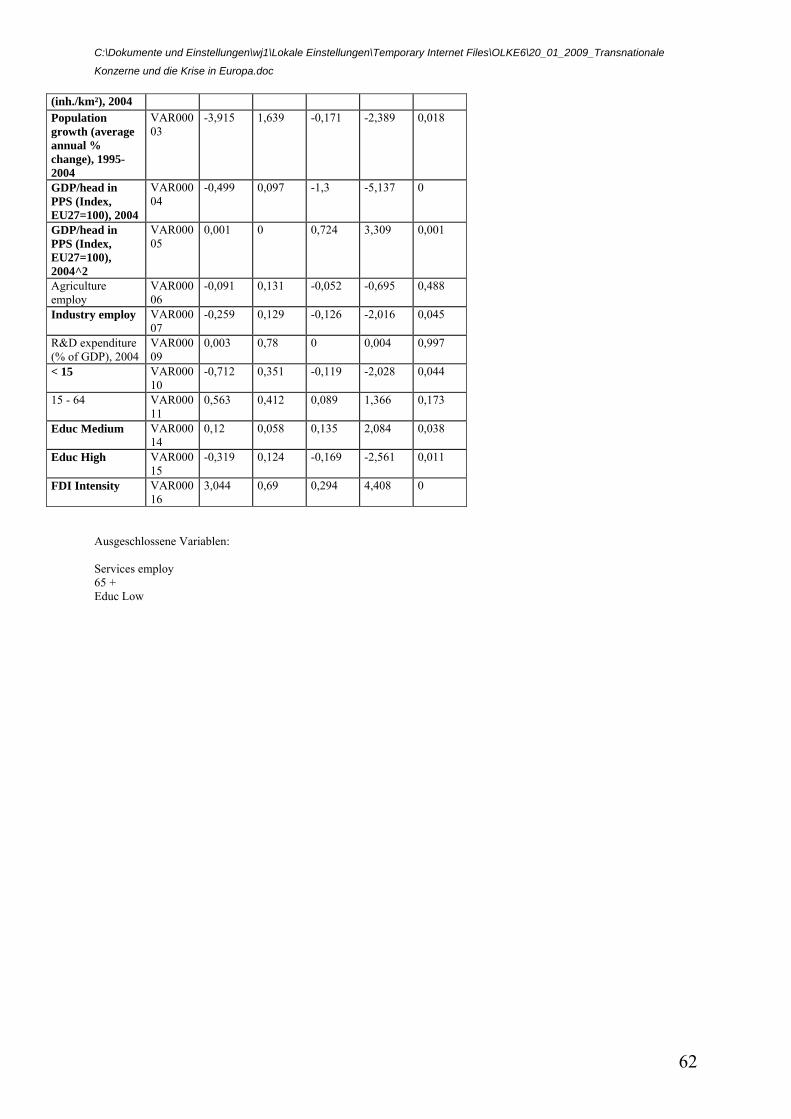
(inh./km²), 2004 Population growth (average annual % change), 1995-2004
VAR00003
-3,915 1,639 -0,171 -2,389 0,018
GDP/head in PPS (Index, EU27=100), 2004
VAR00004
-0,499 0,097 -1,3 -5,137 0
GDP/head in PPS (Index, EU27=100), 2004^2
VAR00005
0,001 0 0,724 3,309 0,001
Agriculture employ
VAR00006
-0,091 0,131 -0,052 -0,695 0,488
Industry employ VAR00007
-0,259 0,129 -0,126 -2,016 0,045
R&D expenditure (% of GDP), 2004
VAR00009
0,003 0,78 0 0,004 0,997
< 15 VAR00010
-0,712 0,351 -0,119 -2,028 0,044
15 - 64 VAR00011
0,563 0,412 0,089 1,366 0,173
Educ Medium VAR00014
0,12 0,058 0,135 2,084 0,038
Educ High VAR00015
-0,319 0,124 -0,169 -2,561 0,011
FDI Intensity VAR00016
3,044 0,69 0,294 4,408 0
Ausgeschlossene Variablen: Services employ 65 + Educ Low
C:\Dokumente und Einstellungen\wj1\Lokale Einstellungen\Temporary Internet Files\OLKE6\20_01_2009_Transnationale
Konzerne und die Krise in Europa.doc
63
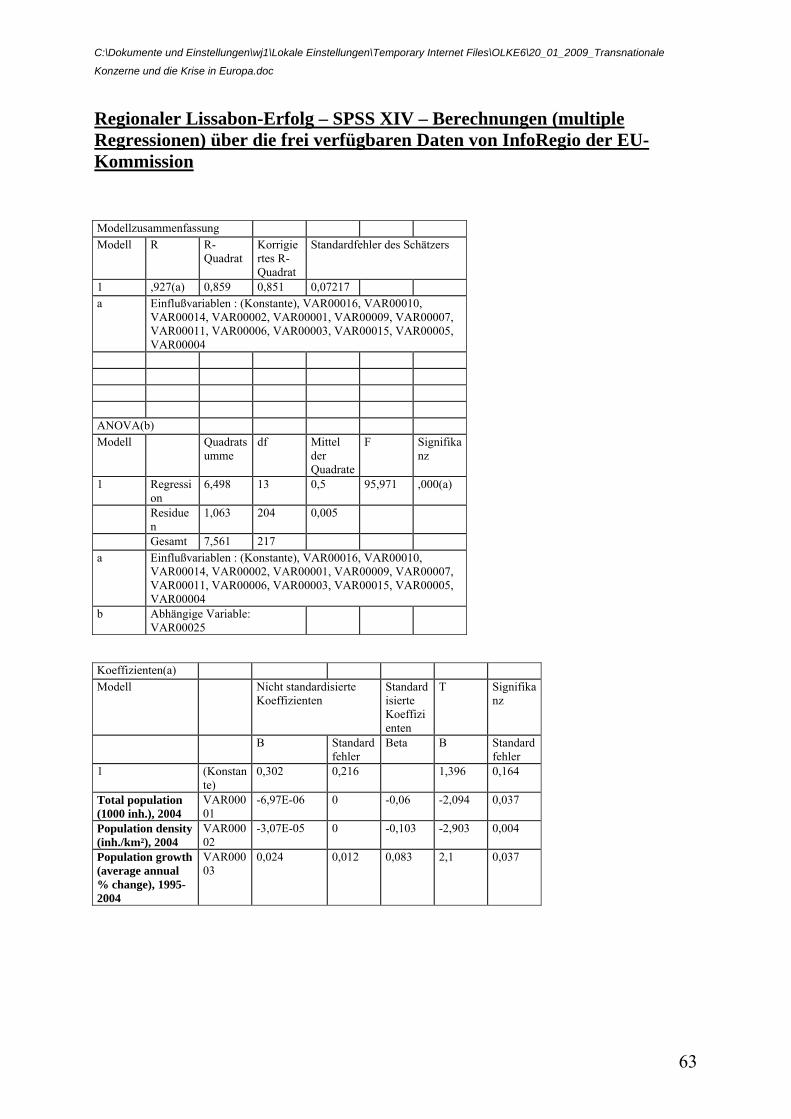
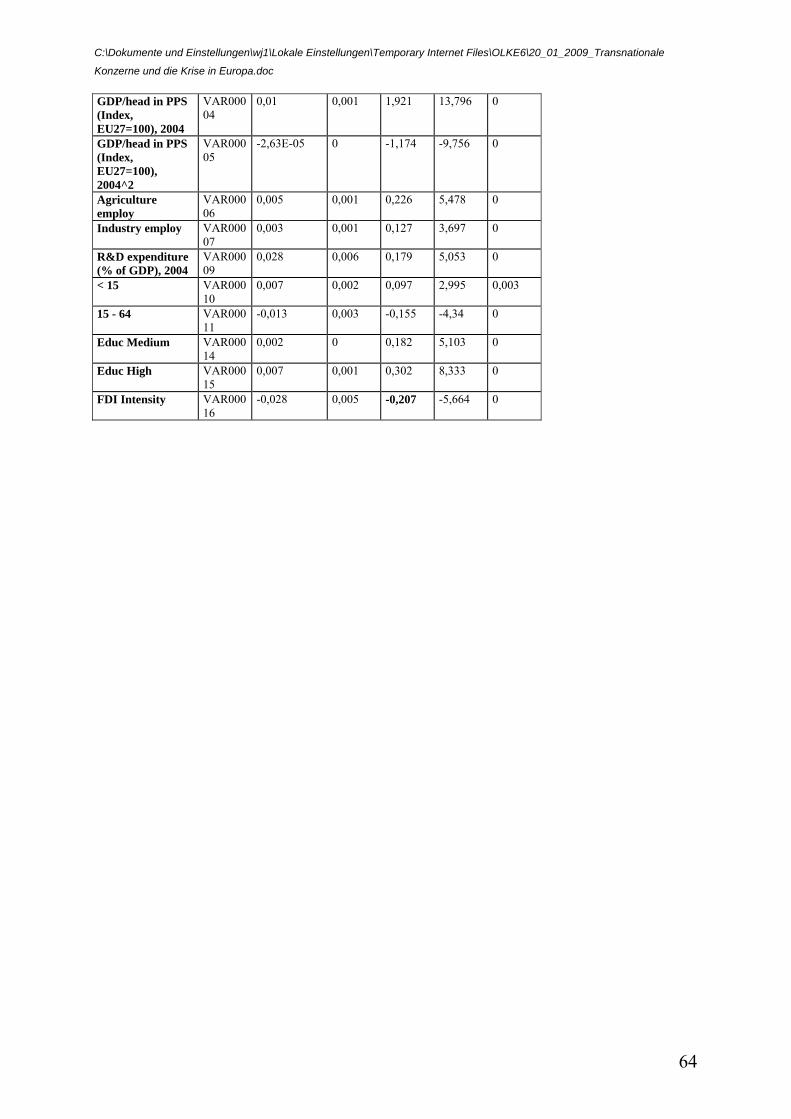
Regionaler Lissabon-Erfolg – SPSS XIV – Berechnungen (multiple Regressionen) über die frei verfügbaren Daten von InfoRegio der EU-Kommission Modellzusammenfassung Modell R R-
Quadrat Korrigiertes R-Quadrat
Standardfehler des Schätzers
1 ,927(a) 0,859 0,851 0,07217 a Einflußvariablen : (Konstante), VAR00016, VAR00010,
VAR00014, VAR00002, VAR00001, VAR00009, VAR00007, VAR00011, VAR00006, VAR00003, VAR00015, VAR00005, VAR00004
ANOVA(b) Modell Quadrats
umme df Mittel
der Quadrate
F Signifikanz
1 Regression
6,498 13 0,5 95,971 ,000(a)
Residuen
1,063 204 0,005
Gesamt 7,561 217 a Einflußvariablen : (Konstante), VAR00016, VAR00010,
VAR00014, VAR00002, VAR00001, VAR00009, VAR00007, VAR00011, VAR00006, VAR00003, VAR00015, VAR00005, VAR00004
b Abhängige Variable: VAR00025
Koeffizienten(a) Modell Nicht standardisierte
Koeffizienten Standardisierte Koeffizienten
T Signifikanz
B Standardfehler
Beta B Standardfehler
1 (Konstante)
0,302 0,216 1,396 0,164
Total population (1000 inh.), 2004
VAR00001
-6,97E-06 0 -0,06 -2,094 0,037
Population density (inh./km²), 2004
VAR00002
-3,07E-05 0 -0,103 -2,903 0,004
Population growth (average annual % change), 1995-2004
VAR00003
0,024 0,012 0,083 2,1 0,037
C:\Dokumente und Einstellungen\wj1\Lokale Einstellungen\Temporary Internet Files\OLKE6\20_01_2009_Transnationale
Konzerne und die Krise in Europa.doc
64
GDP/head in PPS (Index, EU27=100), 2004
VAR00004
0,01 0,001 1,921 13,796 0
GDP/head in PPS (Index, EU27=100), 2004^2
VAR00005
-2,63E-05 0 -1,174 -9,756 0
Agriculture employ
VAR00006
0,005 0,001 0,226 5,478 0
Industry employ VAR00007
0,003 0,001 0,127 3,697 0
R&D expenditure (% of GDP), 2004
VAR00009
0,028 0,006 0,179 5,053 0
< 15 VAR00010
0,007 0,002 0,097 2,995 0,003
15 - 64 VAR00011
-0,013 0,003 -0,155 -4,34 0
Educ Medium VAR00014
0,002 0 0,182 5,103 0
Educ High VAR00015
0,007 0,001 0,302 8,333 0
FDI Intensity VAR00016
-0,028 0,005 -0,207 -5,664 0
C:\Dokumente und Einstellungen\wj1\Lokale Einstellungen\Temporary Internet Files\OLKE6\20_01_2009_Transnationale
Konzerne und die Krise in Europa.doc
65
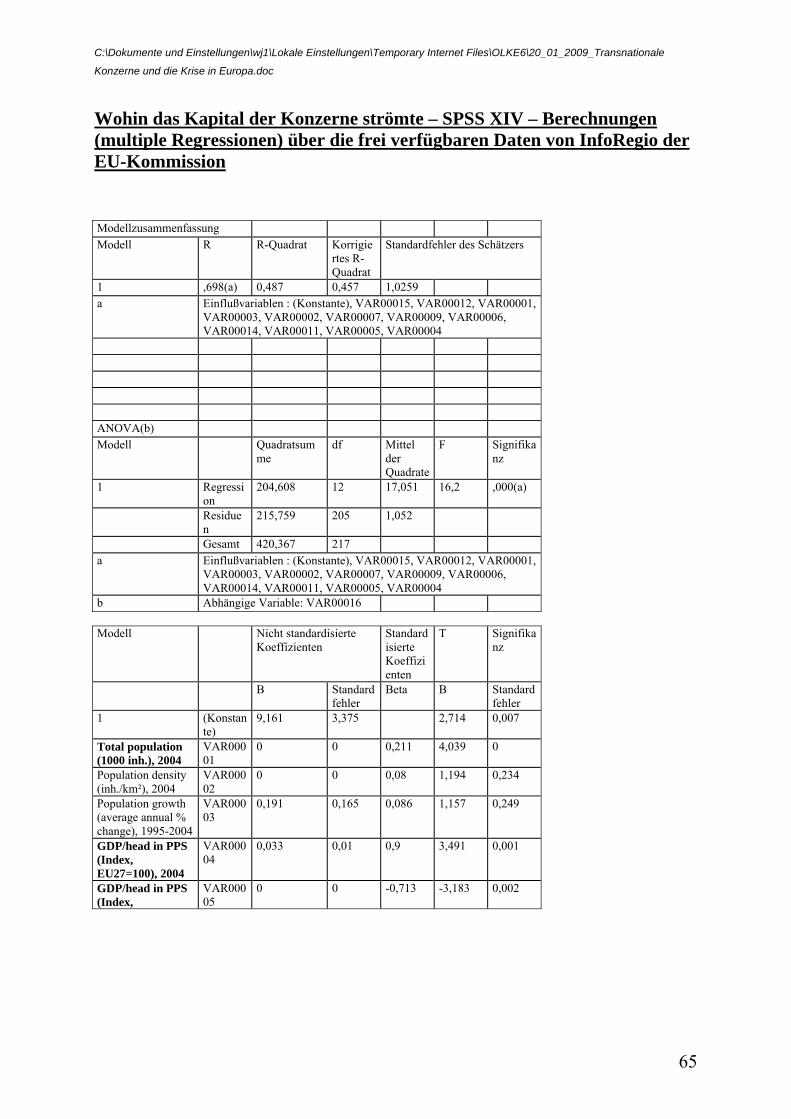
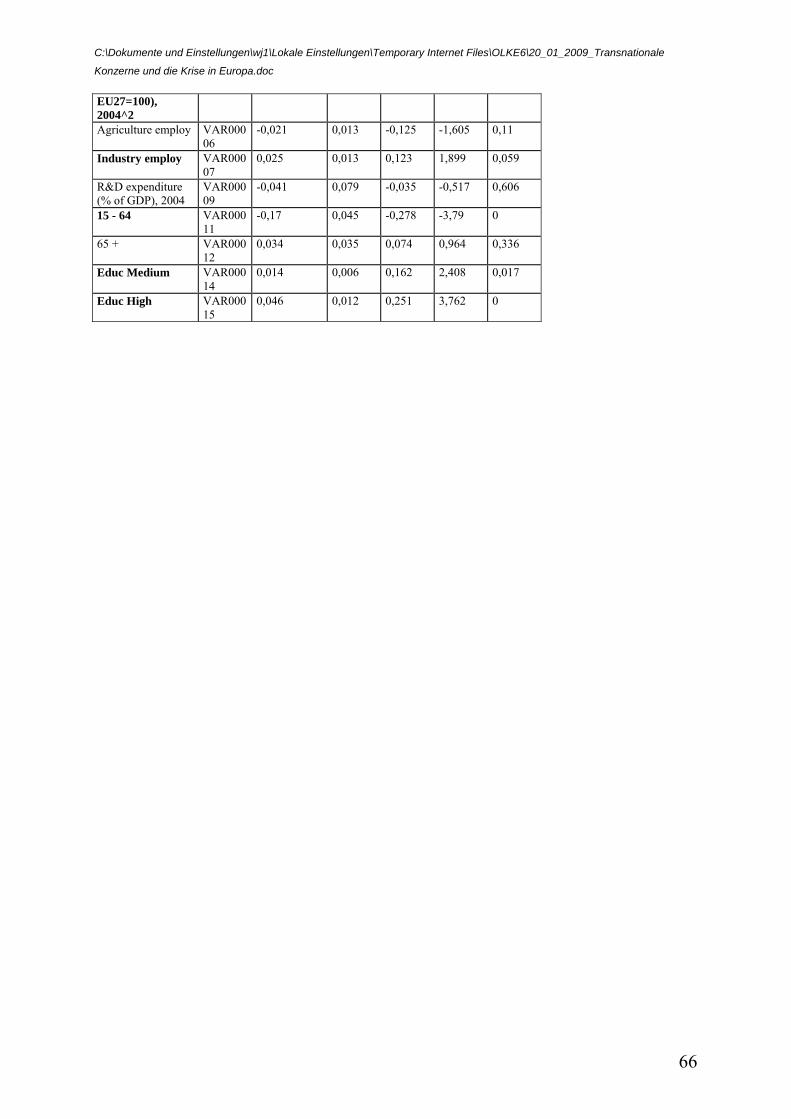
Wohin das Kapital der Konzerne strömte – SPSS XIV – Berechnungen (multiple Regressionen) über die frei verfügbaren Daten von InfoRegio der EU-Kommission Modellzusammenfassung Modell R R-Quadrat Korrigie
rtes R-Quadrat
Standardfehler des Schätzers
1 ,698(a) 0,487 0,457 1,0259 a Einflußvariablen : (Konstante), VAR00015, VAR00012, VAR00001,
VAR00003, VAR00002, VAR00007, VAR00009, VAR00006, VAR00014, VAR00011, VAR00005, VAR00004
ANOVA(b) Modell Quadratsum
me df Mittel
der Quadrate
F Signifikanz
1 Regression
204,608 12 17,051 16,2 ,000(a)
Residuen
215,759 205 1,052
Gesamt 420,367 217 a Einflußvariablen : (Konstante), VAR00015, VAR00012, VAR00001,
VAR00003, VAR00002, VAR00007, VAR00009, VAR00006, VAR00014, VAR00011, VAR00005, VAR00004
b Abhängige Variable: VAR00016 Modell Nicht standardisierte
Koeffizienten Standardisierte Koeffizienten
T Signifikanz
B Standardfehler
Beta B Standardfehler
1 (Konstante)
9,161 3,375 2,714 0,007
Total population (1000 inh.), 2004
VAR00001
0 0 0,211 4,039 0
Population density (inh./km²), 2004
VAR00002
0 0 0,08 1,194 0,234
Population growth (average annual % change), 1995-2004
VAR00003
0,191 0,165 0,086 1,157 0,249
GDP/head in PPS (Index, EU27=100), 2004
VAR00004
0,033 0,01 0,9 3,491 0,001
GDP/head in PPS (Index,
VAR00005
0 0 -0,713 -3,183 0,002
C:\Dokumente und Einstellungen\wj1\Lokale Einstellungen\Temporary Internet Files\OLKE6\20_01_2009_Transnationale
Konzerne und die Krise in Europa.doc
66
EU27=100), 2004^2 Agriculture employ VAR000
06 -0,021 0,013 -0,125 -1,605 0,11
Industry employ VAR00007
0,025 0,013 0,123 1,899 0,059
R&D expenditure (% of GDP), 2004
VAR00009
-0,041 0,079 -0,035 -0,517 0,606
15 - 64 VAR00011
-0,17 0,045 -0,278 -3,79 0
65 + VAR00012
0,034 0,035 0,074 0,964 0,336
Educ Medium VAR00014
0,014 0,006 0,162 2,408 0,017
Educ High VAR00015
0,046 0,012 0,251 3,762 0
C:\Dokumente und Einstellungen\wj1\Lokale Einstellungen\Temporary Internet Files\OLKE6\20_01_2009_Transnationale
Konzerne und die Krise in Europa.doc
67
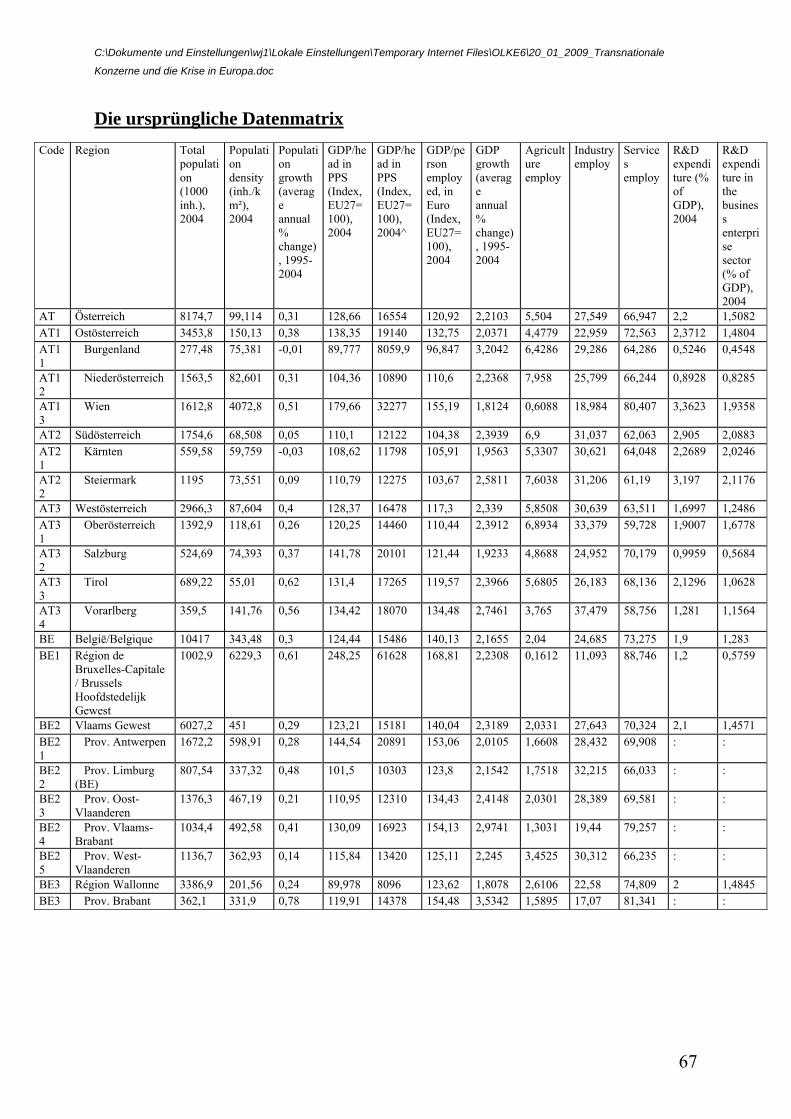
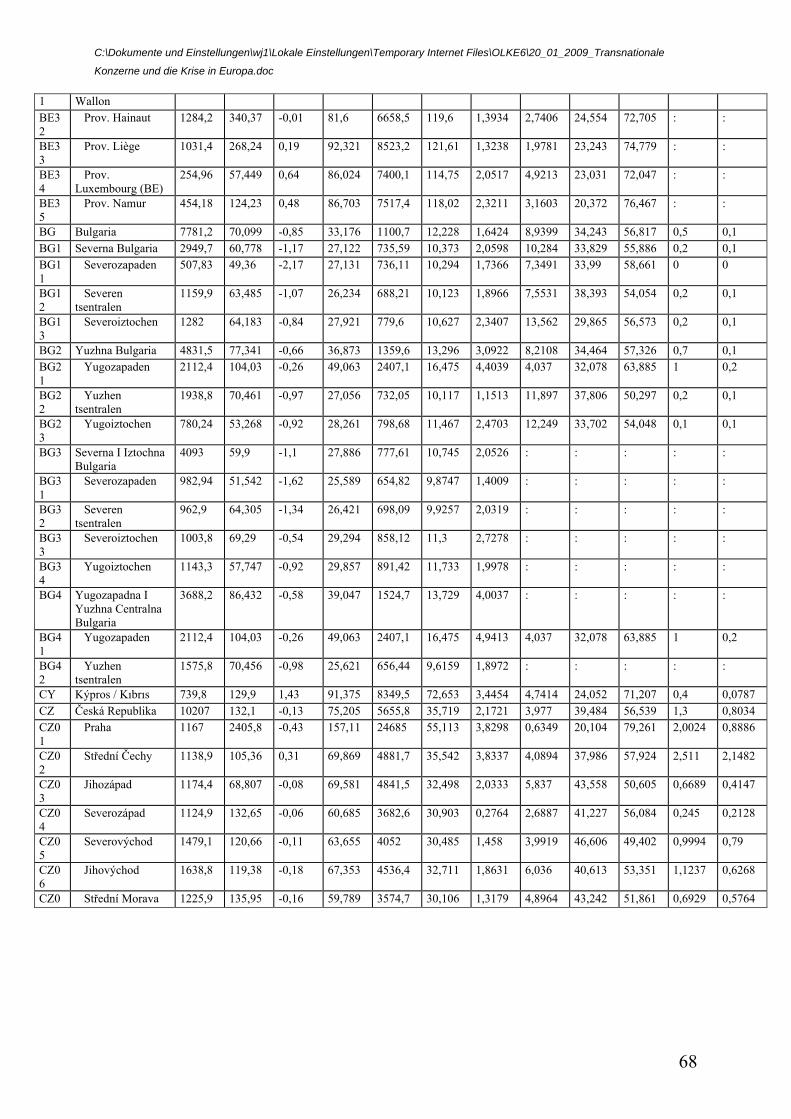
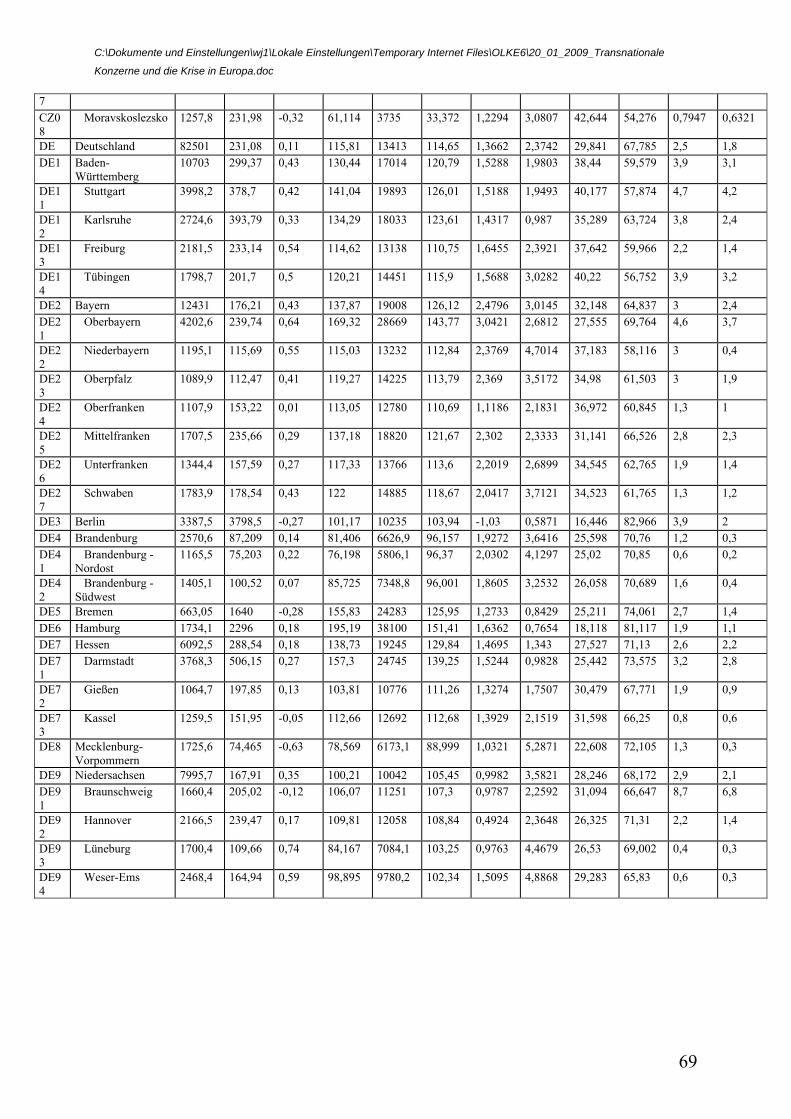
Die ursprüngliche Datenmatrix
Code Region Total population (1000 inh.), 2004
Population density (inh./km²), 2004
Population growth (average annual % change), 1995-2004
GDP/head in PPS (Index, EU27=100), 2004
GDP/head in PPS (Index, EU27=100), 2004^
GDP/person employed, in Euro (Index, EU27=100), 2004
GDP growth (average annual % change), 1995-2004
Agriculture employ
Industry employ
Services employ
R&D expenditure (% of GDP), 2004
R&D expenditure in the business enterprise sector (% of GDP), 2004
AT Österreich 8174,7 99,114 0,31 128,66 16554 120,92 2,2103 5,504 27,549 66,947 2,2 1,5082 AT1 Ostösterreich 3453,8 150,13 0,38 138,35 19140 132,75 2,0371 4,4779 22,959 72,563 2,3712 1,4804 AT11
Burgenland 277,48 75,381 -0,01 89,777 8059,9 96,847 3,2042 6,4286 29,286 64,286 0,5246 0,4548
AT12
Niederösterreich 1563,5 82,601 0,31 104,36 10890 110,6 2,2368 7,958 25,799 66,244 0,8928 0,8285
AT13
Wien 1612,8 4072,8 0,51 179,66 32277 155,19 1,8124 0,6088 18,984 80,407 3,3623 1,9358
AT2 Südösterreich 1754,6 68,508 0,05 110,1 12122 104,38 2,3939 6,9 31,037 62,063 2,905 2,0883 AT21
Kärnten 559,58 59,759 -0,03 108,62 11798 105,91 1,9563 5,3307 30,621 64,048 2,2689 2,0246
AT22
Steiermark 1195 73,551 0,09 110,79 12275 103,67 2,5811 7,6038 31,206 61,19 3,197 2,1176
AT3 Westösterreich 2966,3 87,604 0,4 128,37 16478 117,3 2,339 5,8508 30,639 63,511 1,6997 1,2486 AT31
Oberösterreich 1392,9 118,61 0,26 120,25 14460 110,44 2,3912 6,8934 33,379 59,728 1,9007 1,6778
AT32
Salzburg 524,69 74,393 0,37 141,78 20101 121,44 1,9233 4,8688 24,952 70,179 0,9959 0,5684
AT33
Tirol 689,22 55,01 0,62 131,4 17265 119,57 2,3966 5,6805 26,183 68,136 2,1296 1,0628
AT34
Vorarlberg 359,5 141,76 0,56 134,42 18070 134,48 2,7461 3,765 37,479 58,756 1,281 1,1564
BE België/Belgique 10417 343,48 0,3 124,44 15486 140,13 2,1655 2,04 24,685 73,275 1,9 1,283 BE1 Région de
Bruxelles-Capitale / Brussels Hoofdstedelijk Gewest
1002,9 6229,3 0,61 248,25 61628 168,81 2,2308 0,1612 11,093 88,746 1,2 0,5759
BE2 Vlaams Gewest 6027,2 451 0,29 123,21 15181 140,04 2,3189 2,0331 27,643 70,324 2,1 1,4571 BE21
Prov. Antwerpen 1672,2 598,91 0,28 144,54 20891 153,06 2,0105 1,6608 28,432 69,908 : :
BE22
Prov. Limburg (BE)
807,54 337,32 0,48 101,5 10303 123,8 2,1542 1,7518 32,215 66,033 : :
BE23
Prov. Oost-Vlaanderen
1376,3 467,19 0,21 110,95 12310 134,43 2,4148 2,0301 28,389 69,581 : :
BE24
Prov. Vlaams-Brabant
1034,4 492,58 0,41 130,09 16923 154,13 2,9741 1,3031 19,44 79,257 : :
BE25
Prov. West-Vlaanderen
1136,7 362,93 0,14 115,84 13420 125,11 2,245 3,4525 30,312 66,235 : :
BE3 Région Wallonne 3386,9 201,56 0,24 89,978 8096 123,62 1,8078 2,6106 22,58 74,809 2 1,4845 BE3 Prov. Brabant 362,1 331,9 0,78 119,91 14378 154,48 3,5342 1,5895 17,07 81,341 : :
C:\Dokumente und Einstellungen\wj1\Lokale Einstellungen\Temporary Internet Files\OLKE6\20_01_2009_Transnationale
Konzerne und die Krise in Europa.doc
68
1 Wallon BE32
Prov. Hainaut 1284,2 340,37 -0,01 81,6 6658,5 119,6 1,3934 2,7406 24,554 72,705 : :
BE33
Prov. Liège 1031,4 268,24 0,19 92,321 8523,2 121,61 1,3238 1,9781 23,243 74,779 : :
BE34
Prov. Luxembourg (BE)
254,96 57,449 0,64 86,024 7400,1 114,75 2,0517 4,9213 23,031 72,047 : :
BE35
Prov. Namur 454,18 124,23 0,48 86,703 7517,4 118,02 2,3211 3,1603 20,372 76,467 : :
BG Bulgaria 7781,2 70,099 -0,85 33,176 1100,7 12,228 1,6424 8,9399 34,243 56,817 0,5 0,1 BG1 Severna Bulgaria 2949,7 60,778 -1,17 27,122 735,59 10,373 2,0598 10,284 33,829 55,886 0,2 0,1 BG11
Severozapaden 507,83 49,36 -2,17 27,131 736,11 10,294 1,7366 7,3491 33,99 58,661 0 0
BG12
Severen tsentralen
1159,9 63,485 -1,07 26,234 688,21 10,123 1,8966 7,5531 38,393 54,054 0,2 0,1
BG13
Severoiztochen 1282 64,183 -0,84 27,921 779,6 10,627 2,3407 13,562 29,865 56,573 0,2 0,1
BG2 Yuzhna Bulgaria 4831,5 77,341 -0,66 36,873 1359,6 13,296 3,0922 8,2108 34,464 57,326 0,7 0,1 BG21
Yugozapaden 2112,4 104,03 -0,26 49,063 2407,1 16,475 4,4039 4,037 32,078 63,885 1 0,2
BG22
Yuzhen tsentralen
1938,8 70,461 -0,97 27,056 732,05 10,117 1,1513 11,897 37,806 50,297 0,2 0,1
BG23
Yugoiztochen 780,24 53,268 -0,92 28,261 798,68 11,467 2,4703 12,249 33,702 54,048 0,1 0,1
BG3 Severna I Iztochna Bulgaria
4093 59,9 -1,1 27,886 777,61 10,745 2,0526 : : : : :
BG31
Severozapaden 982,94 51,542 -1,62 25,589 654,82 9,8747 1,4009 : : : : :
BG32
Severen tsentralen
962,9 64,305 -1,34 26,421 698,09 9,9257 2,0319 : : : : :
BG33
Severoiztochen 1003,8 69,29 -0,54 29,294 858,12 11,3 2,7278 : : : : :
BG34
Yugoiztochen 1143,3 57,747 -0,92 29,857 891,42 11,733 1,9978 : : : : :
BG4 Yugozapadna I Yuzhna Centralna Bulgaria
3688,2 86,432 -0,58 39,047 1524,7 13,729 4,0037 : : : : :
BG41
Yugozapaden 2112,4 104,03 -0,26 49,063 2407,1 16,475 4,9413 4,037 32,078 63,885 1 0,2
BG42
Yuzhen tsentralen
1575,8 70,456 -0,98 25,621 656,44 9,6159 1,8972 : : : : :
CY Kýpros / Kıbrıs 739,8 129,9 1,43 91,375 8349,5 72,653 3,4454 4,7414 24,052 71,207 0,4 0,0787 CZ Česká Republika 10207 132,1 -0,13 75,205 5655,8 35,719 2,1721 3,977 39,484 56,539 1,3 0,8034 CZ01
Praha 1167 2405,8 -0,43 157,11 24685 55,113 3,8298 0,6349 20,104 79,261 2,0024 0,8886
CZ02
Střední Čechy 1138,9 105,36 0,31 69,869 4881,7 35,542 3,8337 4,0894 37,986 57,924 2,511 2,1482
CZ03
Jihozápad 1174,4 68,807 -0,08 69,581 4841,5 32,498 2,0333 5,837 43,558 50,605 0,6689 0,4147
CZ04
Severozápad 1124,9 132,65 -0,06 60,685 3682,6 30,903 0,2764 2,6887 41,227 56,084 0,245 0,2128
CZ05
Severovýchod 1479,1 120,66 -0,11 63,655 4052 30,485 1,458 3,9919 46,606 49,402 0,9994 0,79
CZ06
Jihovýchod 1638,8 119,38 -0,18 67,353 4536,4 32,711 1,8631 6,036 40,613 53,351 1,1237 0,6268
CZ0 Střední Morava 1225,9 135,95 -0,16 59,789 3574,7 30,106 1,3179 4,8964 43,242 51,861 0,6929 0,5764
C:\Dokumente und Einstellungen\wj1\Lokale Einstellungen\Temporary Internet Files\OLKE6\20_01_2009_Transnationale
Konzerne und die Krise in Europa.doc
69
7 CZ08
Moravskoslezsko 1257,8 231,98 -0,32 61,114 3735 33,372 1,2294 3,0807 42,644 54,276 0,7947 0,6321
DE Deutschland 82501 231,08 0,11 115,81 13413 114,65 1,3662 2,3742 29,841 67,785 2,5 1,8 DE1 Baden-
Württemberg 10703 299,37 0,43 130,44 17014 120,79 1,5288 1,9803 38,44 59,579 3,9 3,1
DE11
Stuttgart 3998,2 378,7 0,42 141,04 19893 126,01 1,5188 1,9493 40,177 57,874 4,7 4,2
DE12
Karlsruhe 2724,6 393,79 0,33 134,29 18033 123,61 1,4317 0,987 35,289 63,724 3,8 2,4
DE13
Freiburg 2181,5 233,14 0,54 114,62 13138 110,75 1,6455 2,3921 37,642 59,966 2,2 1,4
DE14
Tübingen 1798,7 201,7 0,5 120,21 14451 115,9 1,5688 3,0282 40,22 56,752 3,9 3,2
DE2 Bayern 12431 176,21 0,43 137,87 19008 126,12 2,4796 3,0145 32,148 64,837 3 2,4 DE21
Oberbayern 4202,6 239,74 0,64 169,32 28669 143,77 3,0421 2,6812 27,555 69,764 4,6 3,7
DE22
Niederbayern 1195,1 115,69 0,55 115,03 13232 112,84 2,3769 4,7014 37,183 58,116 3 0,4
DE23
Oberpfalz 1089,9 112,47 0,41 119,27 14225 113,79 2,369 3,5172 34,98 61,503 3 1,9
DE24
Oberfranken 1107,9 153,22 0,01 113,05 12780 110,69 1,1186 2,1831 36,972 60,845 1,3 1
DE25
Mittelfranken 1707,5 235,66 0,29 137,18 18820 121,67 2,302 2,3333 31,141 66,526 2,8 2,3
DE26
Unterfranken 1344,4 157,59 0,27 117,33 13766 113,6 2,2019 2,6899 34,545 62,765 1,9 1,4
DE27
Schwaben 1783,9 178,54 0,43 122 14885 118,67 2,0417 3,7121 34,523 61,765 1,3 1,2
DE3 Berlin 3387,5 3798,5 -0,27 101,17 10235 103,94 -1,03 0,5871 16,446 82,966 3,9 2 DE4 Brandenburg 2570,6 87,209 0,14 81,406 6626,9 96,157 1,9272 3,6416 25,598 70,76 1,2 0,3 DE41
Brandenburg - Nordost
1165,5 75,203 0,22 76,198 5806,1 96,37 2,0302 4,1297 25,02 70,85 0,6 0,2
DE42
Brandenburg - Südwest
1405,1 100,52 0,07 85,725 7348,8 96,001 1,8605 3,2532 26,058 70,689 1,6 0,4
DE5 Bremen 663,05 1640 -0,28 155,83 24283 125,95 1,2733 0,8429 25,211 74,061 2,7 1,4 DE6 Hamburg 1734,1 2296 0,18 195,19 38100 151,41 1,6362 0,7654 18,118 81,117 1,9 1,1 DE7 Hessen 6092,5 288,54 0,18 138,73 19245 129,84 1,4695 1,343 27,527 71,13 2,6 2,2 DE71
Darmstadt 3768,3 506,15 0,27 157,3 24745 139,25 1,5244 0,9828 25,442 73,575 3,2 2,8
DE72
Gießen 1064,7 197,85 0,13 103,81 10776 111,26 1,3274 1,7507 30,479 67,771 1,9 0,9
DE73
Kassel 1259,5 151,95 -0,05 112,66 12692 112,68 1,3929 2,1519 31,598 66,25 0,8 0,6
DE8 Mecklenburg-Vorpommern
1725,6 74,465 -0,63 78,569 6173,1 88,999 1,0321 5,2871 22,608 72,105 1,3 0,3
DE9 Niedersachsen 7995,7 167,91 0,35 100,21 10042 105,45 0,9982 3,5821 28,246 68,172 2,9 2,1 DE91
Braunschweig 1660,4 205,02 -0,12 106,07 11251 107,3 0,9787 2,2592 31,094 66,647 8,7 6,8
DE92
Hannover 2166,5 239,47 0,17 109,81 12058 108,84 0,4924 2,3648 26,325 71,31 2,2 1,4
DE93
Lüneburg 1700,4 109,66 0,74 84,167 7084,1 103,25 0,9763 4,4679 26,53 69,002 0,4 0,3
DE94
Weser-Ems 2468,4 164,94 0,59 98,895 9780,2 102,34 1,5095 4,8868 29,283 65,83 0,6 0,3
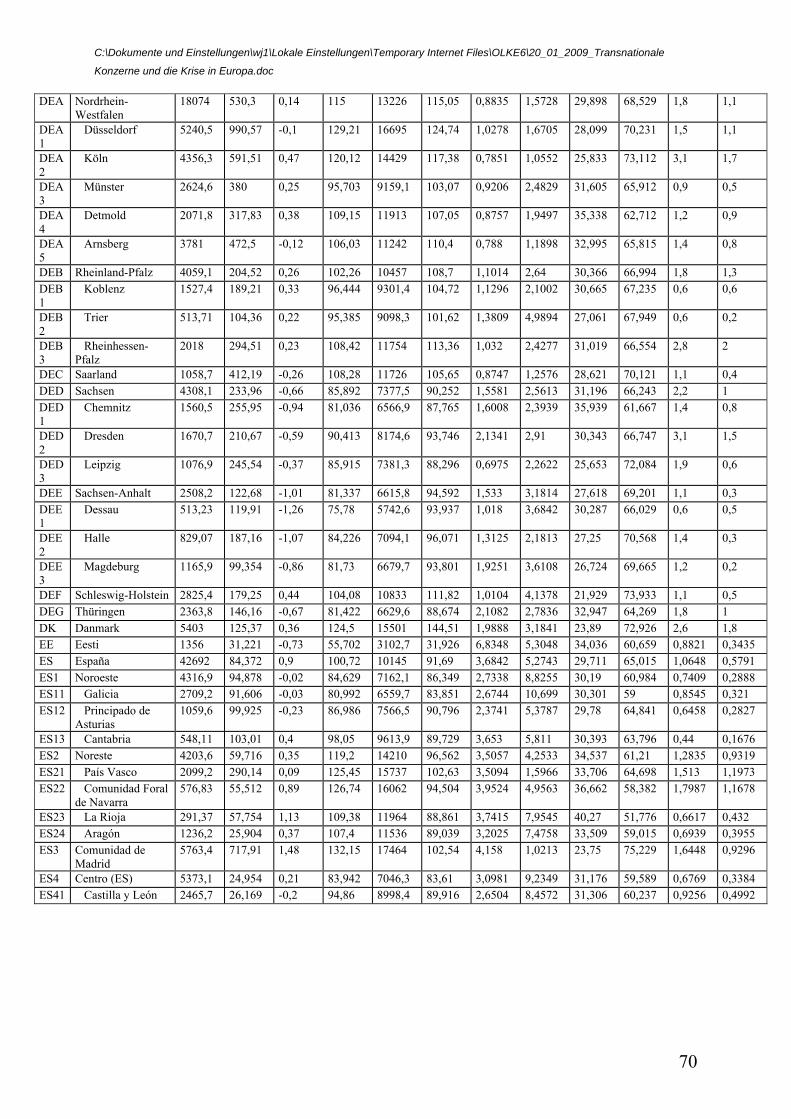
C:\Dokumente und Einstellungen\wj1\Lokale Einstellungen\Temporary Internet Files\OLKE6\20_01_2009_Transnationale
Konzerne und die Krise in Europa.doc
70
DEA Nordrhein-Westfalen
18074 530,3 0,14 115 13226 115,05 0,8835 1,5728 29,898 68,529 1,8 1,1
DEA1
Düsseldorf 5240,5 990,57 -0,1 129,21 16695 124,74 1,0278 1,6705 28,099 70,231 1,5 1,1
DEA2
Köln 4356,3 591,51 0,47 120,12 14429 117,38 0,7851 1,0552 25,833 73,112 3,1 1,7
DEA3
Münster 2624,6 380 0,25 95,703 9159,1 103,07 0,9206 2,4829 31,605 65,912 0,9 0,5
DEA4
Detmold 2071,8 317,83 0,38 109,15 11913 107,05 0,8757 1,9497 35,338 62,712 1,2 0,9
DEA5
Arnsberg 3781 472,5 -0,12 106,03 11242 110,4 0,788 1,1898 32,995 65,815 1,4 0,8
DEB Rheinland-Pfalz 4059,1 204,52 0,26 102,26 10457 108,7 1,1014 2,64 30,366 66,994 1,8 1,3 DEB1
Koblenz 1527,4 189,21 0,33 96,444 9301,4 104,72 1,1296 2,1002 30,665 67,235 0,6 0,6
DEB2
Trier 513,71 104,36 0,22 95,385 9098,3 101,62 1,3809 4,9894 27,061 67,949 0,6 0,2
DEB3
Rheinhessen-Pfalz
2018 294,51 0,23 108,42 11754 113,36 1,032 2,4277 31,019 66,554 2,8 2
DEC Saarland 1058,7 412,19 -0,26 108,28 11726 105,65 0,8747 1,2576 28,621 70,121 1,1 0,4 DED Sachsen 4308,1 233,96 -0,66 85,892 7377,5 90,252 1,5581 2,5613 31,196 66,243 2,2 1 DED1
Chemnitz 1560,5 255,95 -0,94 81,036 6566,9 87,765 1,6008 2,3939 35,939 61,667 1,4 0,8
DED2
Dresden 1670,7 210,67 -0,59 90,413 8174,6 93,746 2,1341 2,91 30,343 66,747 3,1 1,5
DED3
Leipzig 1076,9 245,54 -0,37 85,915 7381,3 88,296 0,6975 2,2622 25,653 72,084 1,9 0,6
DEE Sachsen-Anhalt 2508,2 122,68 -1,01 81,337 6615,8 94,592 1,533 3,1814 27,618 69,201 1,1 0,3 DEE1
Dessau 513,23 119,91 -1,26 75,78 5742,6 93,937 1,018 3,6842 30,287 66,029 0,6 0,5
DEE2
Halle 829,07 187,16 -1,07 84,226 7094,1 96,071 1,3125 2,1813 27,25 70,568 1,4 0,3
DEE3
Magdeburg 1165,9 99,354 -0,86 81,73 6679,7 93,801 1,9251 3,6108 26,724 69,665 1,2 0,2
DEF Schleswig-Holstein 2825,4 179,25 0,44 104,08 10833 111,82 1,0104 4,1378 21,929 73,933 1,1 0,5 DEG Thüringen 2363,8 146,16 -0,67 81,422 6629,6 88,674 2,1082 2,7836 32,947 64,269 1,8 1 DK Danmark 5403 125,37 0,36 124,5 15501 144,51 1,9888 3,1841 23,89 72,926 2,6 1,8 EE Eesti 1356 31,221 -0,73 55,702 3102,7 31,926 6,8348 5,3048 34,036 60,659 0,8821 0,3435 ES España 42692 84,372 0,9 100,72 10145 91,69 3,6842 5,2743 29,711 65,015 1,0648 0,5791 ES1 Noroeste 4316,9 94,878 -0,02 84,629 7162,1 86,349 2,7338 8,8255 30,19 60,984 0,7409 0,2888 ES11 Galicia 2709,2 91,606 -0,03 80,992 6559,7 83,851 2,6744 10,699 30,301 59 0,8545 0,321 ES12 Principado de
Asturias 1059,6 99,925 -0,23 86,986 7566,5 90,796 2,3741 5,3787 29,78 64,841 0,6458 0,2827
ES13 Cantabria 548,11 103,01 0,4 98,05 9613,9 89,729 3,653 5,811 30,393 63,796 0,44 0,1676 ES2 Noreste 4203,6 59,716 0,35 119,2 14210 96,562 3,5057 4,2533 34,537 61,21 1,2835 0,9319 ES21 País Vasco 2099,2 290,14 0,09 125,45 15737 102,63 3,5094 1,5966 33,706 64,698 1,513 1,1973 ES22 Comunidad Foral
de Navarra 576,83 55,512 0,89 126,74 16062 94,504 3,9524 4,9563 36,662 58,382 1,7987 1,1678
ES23 La Rioja 291,37 57,754 1,13 109,38 11964 88,861 3,7415 7,9545 40,27 51,776 0,6617 0,432 ES24 Aragón 1236,2 25,904 0,37 107,4 11536 89,039 3,2025 7,4758 33,509 59,015 0,6939 0,3955 ES3 Comunidad de
Madrid 5763,4 717,91 1,48 132,15 17464 102,54 4,158 1,0213 23,75 75,229 1,6448 0,9296
ES4 Centro (ES) 5373,1 24,954 0,21 83,942 7046,3 83,61 3,0981 9,2349 31,176 59,589 0,6769 0,3384 ES41 Castilla y León 2465,7 26,169 -0,2 94,86 8998,4 89,916 2,6504 8,4572 31,306 60,237 0,9256 0,4992
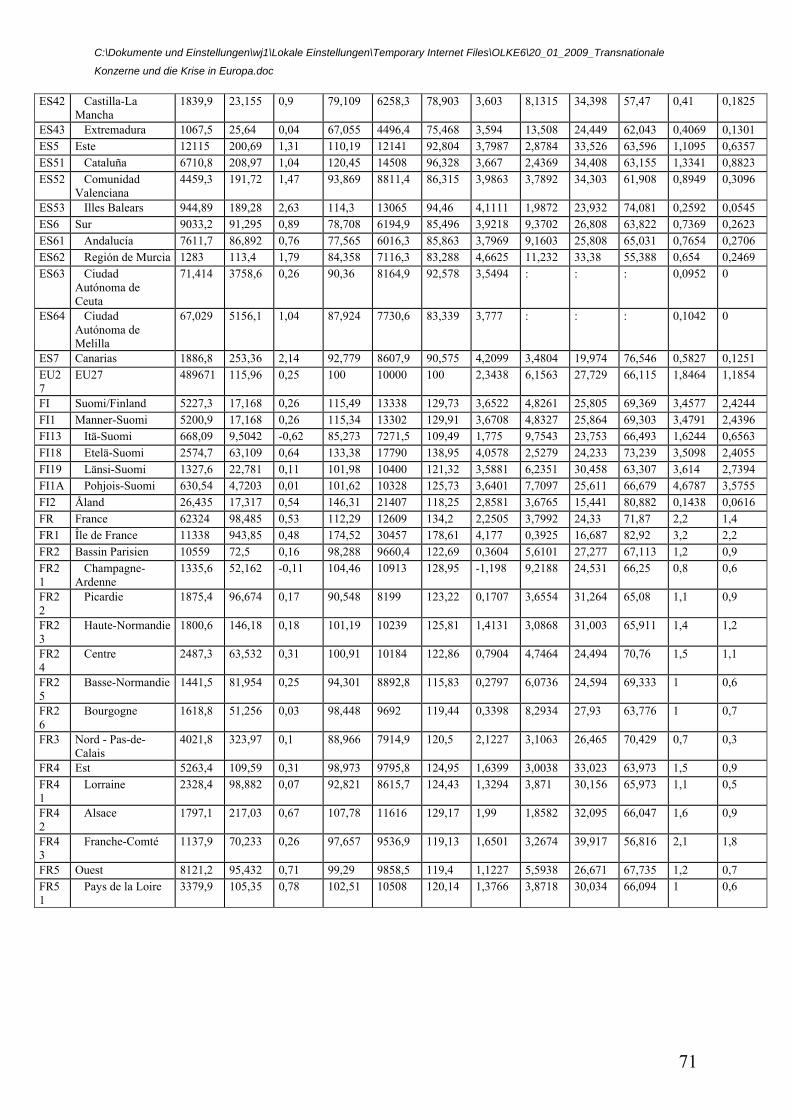
C:\Dokumente und Einstellungen\wj1\Lokale Einstellungen\Temporary Internet Files\OLKE6\20_01_2009_Transnationale
Konzerne und die Krise in Europa.doc
71
ES42 Castilla-La Mancha
1839,9 23,155 0,9 79,109 6258,3 78,903 3,603 8,1315 34,398 57,47 0,41 0,1825
ES43 Extremadura 1067,5 25,64 0,04 67,055 4496,4 75,468 3,594 13,508 24,449 62,043 0,4069 0,1301 ES5 Este 12115 200,69 1,31 110,19 12141 92,804 3,7987 2,8784 33,526 63,596 1,1095 0,6357 ES51 Cataluña 6710,8 208,97 1,04 120,45 14508 96,328 3,667 2,4369 34,408 63,155 1,3341 0,8823 ES52 Comunidad
Valenciana 4459,3 191,72 1,47 93,869 8811,4 86,315 3,9863 3,7892 34,303 61,908 0,8949 0,3096
ES53 Illes Balears 944,89 189,28 2,63 114,3 13065 94,46 4,1111 1,9872 23,932 74,081 0,2592 0,0545 ES6 Sur 9033,2 91,295 0,89 78,708 6194,9 85,496 3,9218 9,3702 26,808 63,822 0,7369 0,2623 ES61 Andalucía 7611,7 86,892 0,76 77,565 6016,3 85,863 3,7969 9,1603 25,808 65,031 0,7654 0,2706 ES62 Región de Murcia 1283 113,4 1,79 84,358 7116,3 83,288 4,6625 11,232 33,38 55,388 0,654 0,2469 ES63 Ciudad
Autónoma de Ceuta
71,414 3758,6 0,26 90,36 8164,9 92,578 3,5494 : : : 0,0952 0
ES64 Ciudad Autónoma de Melilla
67,029 5156,1 1,04 87,924 7730,6 83,339 3,777 : : : 0,1042 0
ES7 Canarias 1886,8 253,36 2,14 92,779 8607,9 90,575 4,2099 3,4804 19,974 76,546 0,5827 0,1251 EU27
EU27 489671 115,96 0,25 100 10000 100 2,3438 6,1563 27,729 66,115 1,8464 1,1854
FI Suomi/Finland 5227,3 17,168 0,26 115,49 13338 129,73 3,6522 4,8261 25,805 69,369 3,4577 2,4244 FI1 Manner-Suomi 5200,9 17,168 0,26 115,34 13302 129,91 3,6708 4,8327 25,864 69,303 3,4791 2,4396 FI13 Itä-Suomi 668,09 9,5042 -0,62 85,273 7271,5 109,49 1,775 9,7543 23,753 66,493 1,6244 0,6563 FI18 Etelä-Suomi 2574,7 63,109 0,64 133,38 17790 138,95 4,0578 2,5279 24,233 73,239 3,5098 2,4055 FI19 Länsi-Suomi 1327,6 22,781 0,11 101,98 10400 121,32 3,5881 6,2351 30,458 63,307 3,614 2,7394 FI1A Pohjois-Suomi 630,54 4,7203 0,01 101,62 10328 125,73 3,6401 7,7097 25,611 66,679 4,6787 3,5755 FI2 Åland 26,435 17,317 0,54 146,31 21407 118,25 2,8581 3,6765 15,441 80,882 0,1438 0,0616 FR France 62324 98,485 0,53 112,29 12609 134,2 2,2505 3,7992 24,33 71,87 2,2 1,4 FR1 Île de France 11338 943,85 0,48 174,52 30457 178,61 4,177 0,3925 16,687 82,92 3,2 2,2 FR2 Bassin Parisien 10559 72,5 0,16 98,288 9660,4 122,69 0,3604 5,6101 27,277 67,113 1,2 0,9 FR21
Champagne-Ardenne
1335,6 52,162 -0,11 104,46 10913 128,95 -1,198 9,2188 24,531 66,25 0,8 0,6
FR22
Picardie 1875,4 96,674 0,17 90,548 8199 123,22 0,1707 3,6554 31,264 65,08 1,1 0,9
FR23
Haute-Normandie 1800,6 146,18 0,18 101,19 10239 125,81 1,4131 3,0868 31,003 65,911 1,4 1,2
FR24
Centre 2487,3 63,532 0,31 100,91 10184 122,86 0,7904 4,7464 24,494 70,76 1,5 1,1
FR25
Basse-Normandie 1441,5 81,954 0,25 94,301 8892,8 115,83 0,2797 6,0736 24,594 69,333 1 0,6
FR26
Bourgogne 1618,8 51,256 0,03 98,448 9692 119,44 0,3398 8,2934 27,93 63,776 1 0,7
FR3 Nord - Pas-de-Calais
4021,8 323,97 0,1 88,966 7914,9 120,5 2,1227 3,1063 26,465 70,429 0,7 0,3
FR4 Est 5263,4 109,59 0,31 98,973 9795,8 124,95 1,6399 3,0038 33,023 63,973 1,5 0,9 FR41
Lorraine 2328,4 98,882 0,07 92,821 8615,7 124,43 1,3294 3,871 30,156 65,973 1,1 0,5
FR42
Alsace 1797,1 217,03 0,67 107,78 11616 129,17 1,99 1,8582 32,095 66,047 1,6 0,9
FR43
Franche-Comté 1137,9 70,233 0,26 97,657 9536,9 119,13 1,6501 3,2674 39,917 56,816 2,1 1,8
FR5 Ouest 8121,2 95,432 0,71 99,29 9858,5 119,4 1,1227 5,5938 26,671 67,735 1,2 0,7 FR51
Pays de la Loire 3379,9 105,35 0,78 102,51 10508 120,14 1,3766 3,8718 30,034 66,094 1 0,6
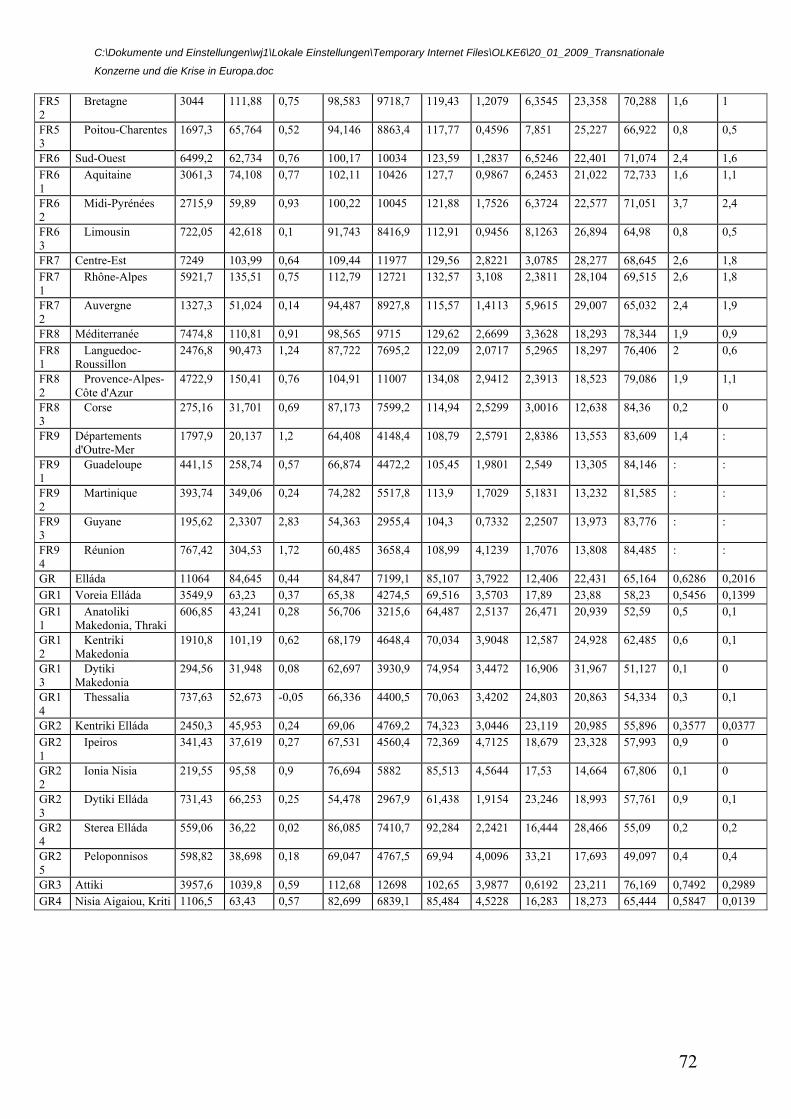
C:\Dokumente und Einstellungen\wj1\Lokale Einstellungen\Temporary Internet Files\OLKE6\20_01_2009_Transnationale
Konzerne und die Krise in Europa.doc
72
FR52
Bretagne 3044 111,88 0,75 98,583 9718,7 119,43 1,2079 6,3545 23,358 70,288 1,6 1
FR53
Poitou-Charentes 1697,3 65,764 0,52 94,146 8863,4 117,77 0,4596 7,851 25,227 66,922 0,8 0,5
FR6 Sud-Ouest 6499,2 62,734 0,76 100,17 10034 123,59 1,2837 6,5246 22,401 71,074 2,4 1,6 FR61
Aquitaine 3061,3 74,108 0,77 102,11 10426 127,7 0,9867 6,2453 21,022 72,733 1,6 1,1
FR62
Midi-Pyrénées 2715,9 59,89 0,93 100,22 10045 121,88 1,7526 6,3724 22,577 71,051 3,7 2,4
FR63
Limousin 722,05 42,618 0,1 91,743 8416,9 112,91 0,9456 8,1263 26,894 64,98 0,8 0,5
FR7 Centre-Est 7249 103,99 0,64 109,44 11977 129,56 2,8221 3,0785 28,277 68,645 2,6 1,8 FR71
Rhône-Alpes 5921,7 135,51 0,75 112,79 12721 132,57 3,108 2,3811 28,104 69,515 2,6 1,8
FR72
Auvergne 1327,3 51,024 0,14 94,487 8927,8 115,57 1,4113 5,9615 29,007 65,032 2,4 1,9
FR8 Méditerranée 7474,8 110,81 0,91 98,565 9715 129,62 2,6699 3,3628 18,293 78,344 1,9 0,9 FR81
Languedoc-Roussillon
2476,8 90,473 1,24 87,722 7695,2 122,09 2,0717 5,2965 18,297 76,406 2 0,6
FR82
Provence-Alpes-Côte d'Azur
4722,9 150,41 0,76 104,91 11007 134,08 2,9412 2,3913 18,523 79,086 1,9 1,1
FR83
Corse 275,16 31,701 0,69 87,173 7599,2 114,94 2,5299 3,0016 12,638 84,36 0,2 0
FR9 Départements d'Outre-Mer
1797,9 20,137 1,2 64,408 4148,4 108,79 2,5791 2,8386 13,553 83,609 1,4 :
FR91
Guadeloupe 441,15 258,74 0,57 66,874 4472,2 105,45 1,9801 2,549 13,305 84,146 : :
FR92
Martinique 393,74 349,06 0,24 74,282 5517,8 113,9 1,7029 5,1831 13,232 81,585 : :
FR93
Guyane 195,62 2,3307 2,83 54,363 2955,4 104,3 0,7332 2,2507 13,973 83,776 : :
FR94
Réunion 767,42 304,53 1,72 60,485 3658,4 108,99 4,1239 1,7076 13,808 84,485 : :
GR Elláda 11064 84,645 0,44 84,847 7199,1 85,107 3,7922 12,406 22,431 65,164 0,6286 0,2016 GR1 Voreia Elláda 3549,9 63,23 0,37 65,38 4274,5 69,516 3,5703 17,89 23,88 58,23 0,5456 0,1399 GR11
Anatoliki Makedonia, Thraki
606,85 43,241 0,28 56,706 3215,6 64,487 2,5137 26,471 20,939 52,59 0,5 0,1
GR12
Kentriki Makedonia
1910,8 101,19 0,62 68,179 4648,4 70,034 3,9048 12,587 24,928 62,485 0,6 0,1
GR13
Dytiki Makedonia
294,56 31,948 0,08 62,697 3930,9 74,954 3,4472 16,906 31,967 51,127 0,1 0
GR14
Thessalia 737,63 52,673 -0,05 66,336 4400,5 70,063 3,4202 24,803 20,863 54,334 0,3 0,1
GR2 Kentriki Elláda 2450,3 45,953 0,24 69,06 4769,2 74,323 3,0446 23,119 20,985 55,896 0,3577 0,0377 GR21
Ipeiros 341,43 37,619 0,27 67,531 4560,4 72,369 4,7125 18,679 23,328 57,993 0,9 0
GR22
Ionia Nisia 219,55 95,58 0,9 76,694 5882 85,513 4,5644 17,53 14,664 67,806 0,1 0
GR23
Dytiki Elláda 731,43 66,253 0,25 54,478 2967,9 61,438 1,9154 23,246 18,993 57,761 0,9 0,1
GR24
Sterea Elláda 559,06 36,22 0,02 86,085 7410,7 92,284 2,2421 16,444 28,466 55,09 0,2 0,2
GR25
Peloponnisos 598,82 38,698 0,18 69,047 4767,5 69,94 4,0096 33,21 17,693 49,097 0,4 0,4
GR3 Attiki 3957,6 1039,8 0,59 112,68 12698 102,65 3,9877 0,6192 23,211 76,169 0,7492 0,2989 GR4 Nisia Aigaiou, Kriti 1106,5 63,43 0,57 82,699 6839,1 85,484 4,5228 16,283 18,273 65,444 0,5847 0,0139
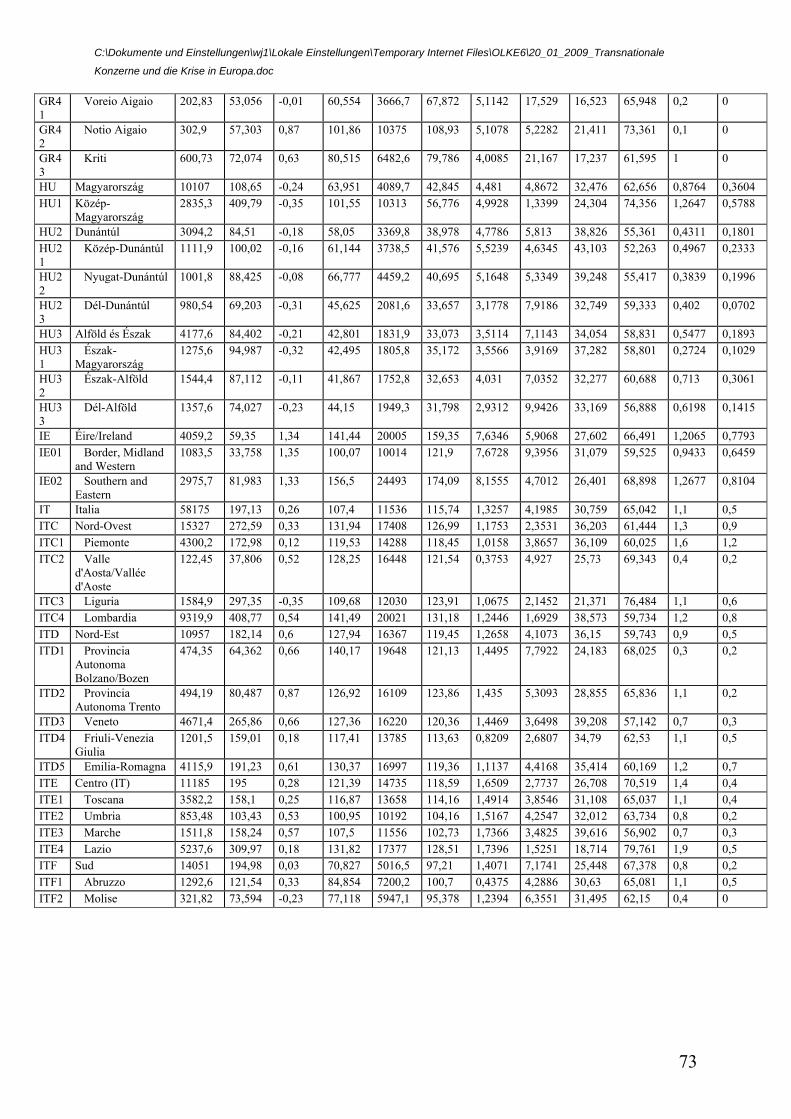
C:\Dokumente und Einstellungen\wj1\Lokale Einstellungen\Temporary Internet Files\OLKE6\20_01_2009_Transnationale
Konzerne und die Krise in Europa.doc
73
GR41
Voreio Aigaio 202,83 53,056 -0,01 60,554 3666,7 67,872 5,1142 17,529 16,523 65,948 0,2 0
GR42
Notio Aigaio 302,9 57,303 0,87 101,86 10375 108,93 5,1078 5,2282 21,411 73,361 0,1 0
GR43
Kriti 600,73 72,074 0,63 80,515 6482,6 79,786 4,0085 21,167 17,237 61,595 1 0
HU Magyarország 10107 108,65 -0,24 63,951 4089,7 42,845 4,481 4,8672 32,476 62,656 0,8764 0,3604 HU1 Közép-
Magyarország 2835,3 409,79 -0,35 101,55 10313 56,776 4,9928 1,3399 24,304 74,356 1,2647 0,5788
HU2 Dunántúl 3094,2 84,51 -0,18 58,05 3369,8 38,978 4,7786 5,813 38,826 55,361 0,4311 0,1801 HU21
Közép-Dunántúl 1111,9 100,02 -0,16 61,144 3738,5 41,576 5,5239 4,6345 43,103 52,263 0,4967 0,2333
HU22
Nyugat-Dunántúl 1001,8 88,425 -0,08 66,777 4459,2 40,695 5,1648 5,3349 39,248 55,417 0,3839 0,1996
HU23
Dél-Dunántúl 980,54 69,203 -0,31 45,625 2081,6 33,657 3,1778 7,9186 32,749 59,333 0,402 0,0702
HU3 Alföld és Észak 4177,6 84,402 -0,21 42,801 1831,9 33,073 3,5114 7,1143 34,054 58,831 0,5477 0,1893 HU31
Észak-Magyarország
1275,6 94,987 -0,32 42,495 1805,8 35,172 3,5566 3,9169 37,282 58,801 0,2724 0,1029
HU32
Észak-Alföld 1544,4 87,112 -0,11 41,867 1752,8 32,653 4,031 7,0352 32,277 60,688 0,713 0,3061
HU33
Dél-Alföld 1357,6 74,027 -0,23 44,15 1949,3 31,798 2,9312 9,9426 33,169 56,888 0,6198 0,1415
IE Éire/Ireland 4059,2 59,35 1,34 141,44 20005 159,35 7,6346 5,9068 27,602 66,491 1,2065 0,7793 IE01 Border, Midland
and Western 1083,5 33,758 1,35 100,07 10014 121,9 7,6728 9,3956 31,079 59,525 0,9433 0,6459
IE02 Southern and Eastern
2975,7 81,983 1,33 156,5 24493 174,09 8,1555 4,7012 26,401 68,898 1,2677 0,8104
IT Italia 58175 197,13 0,26 107,4 11536 115,74 1,3257 4,1985 30,759 65,042 1,1 0,5 ITC Nord-Ovest 15327 272,59 0,33 131,94 17408 126,99 1,1753 2,3531 36,203 61,444 1,3 0,9 ITC1 Piemonte 4300,2 172,98 0,12 119,53 14288 118,45 1,0158 3,8657 36,109 60,025 1,6 1,2 ITC2 Valle
d'Aosta/Vallée d'Aoste
122,45 37,806 0,52 128,25 16448 121,54 0,3753 4,927 25,73 69,343 0,4 0,2
ITC3 Liguria 1584,9 297,35 -0,35 109,68 12030 123,91 1,0675 2,1452 21,371 76,484 1,1 0,6 ITC4 Lombardia 9319,9 408,77 0,54 141,49 20021 131,18 1,2446 1,6929 38,573 59,734 1,2 0,8 ITD Nord-Est 10957 182,14 0,6 127,94 16367 119,45 1,2658 4,1073 36,15 59,743 0,9 0,5 ITD1 Provincia
Autonoma Bolzano/Bozen
474,35 64,362 0,66 140,17 19648 121,13 1,4495 7,7922 24,183 68,025 0,3 0,2
ITD2 Provincia Autonoma Trento
494,19 80,487 0,87 126,92 16109 123,86 1,435 5,3093 28,855 65,836 1,1 0,2
ITD3 Veneto 4671,4 265,86 0,66 127,36 16220 120,36 1,4469 3,6498 39,208 57,142 0,7 0,3 ITD4 Friuli-Venezia
Giulia 1201,5 159,01 0,18 117,41 13785 113,63 0,8209 2,6807 34,79 62,53 1,1 0,5
ITD5 Emilia-Romagna 4115,9 191,23 0,61 130,37 16997 119,36 1,1137 4,4168 35,414 60,169 1,2 0,7 ITE Centro (IT) 11185 195 0,28 121,39 14735 118,59 1,6509 2,7737 26,708 70,519 1,4 0,4 ITE1 Toscana 3582,2 158,1 0,25 116,87 13658 114,16 1,4914 3,8546 31,108 65,037 1,1 0,4 ITE2 Umbria 853,48 103,43 0,53 100,95 10192 104,16 1,5167 4,2547 32,012 63,734 0,8 0,2 ITE3 Marche 1511,8 158,24 0,57 107,5 11556 102,73 1,7366 3,4825 39,616 56,902 0,7 0,3 ITE4 Lazio 5237,6 309,97 0,18 131,82 17377 128,51 1,7396 1,5251 18,714 79,761 1,9 0,5 ITF Sud 14051 194,98 0,03 70,827 5016,5 97,21 1,4071 7,1741 25,448 67,378 0,8 0,2 ITF1 Abruzzo 1292,6 121,54 0,33 84,854 7200,2 100,7 0,4375 4,2886 30,63 65,081 1,1 0,5 ITF2 Molise 321,82 73,594 -0,23 77,118 5947,1 95,378 1,2394 6,3551 31,495 62,15 0,4 0
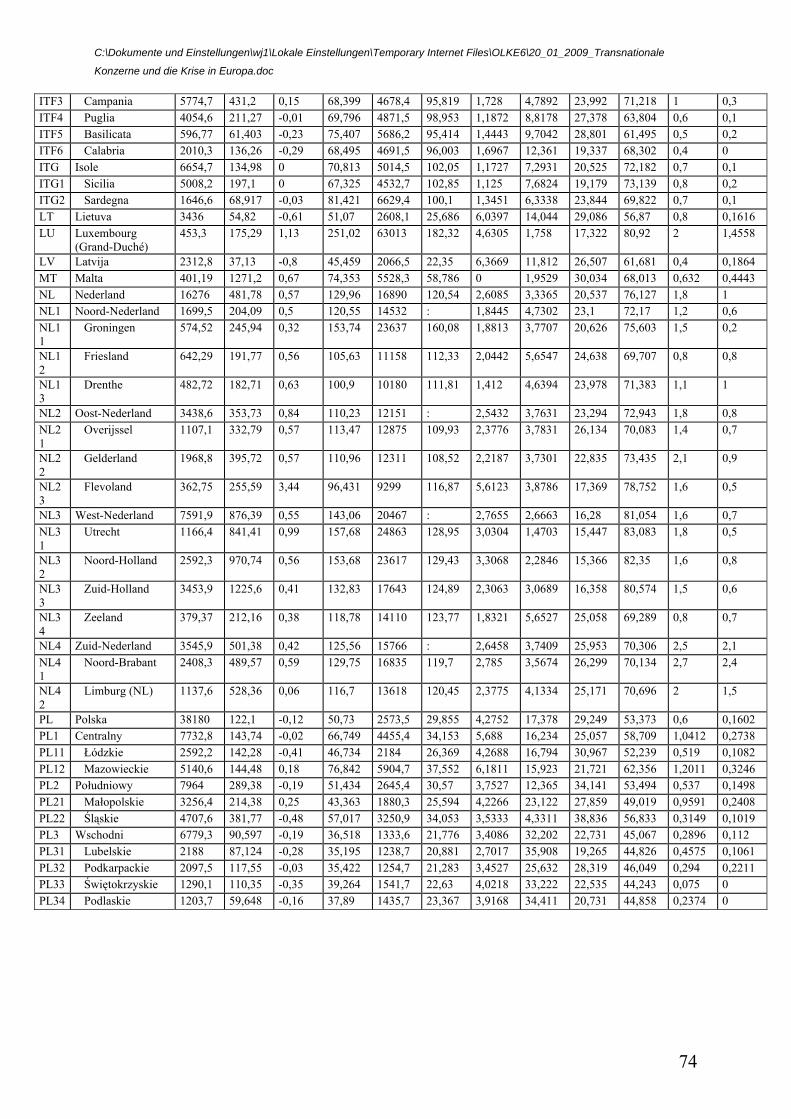
C:\Dokumente und Einstellungen\wj1\Lokale Einstellungen\Temporary Internet Files\OLKE6\20_01_2009_Transnationale
Konzerne und die Krise in Europa.doc
74
ITF3 Campania 5774,7 431,2 0,15 68,399 4678,4 95,819 1,728 4,7892 23,992 71,218 1 0,3 ITF4 Puglia 4054,6 211,27 -0,01 69,796 4871,5 98,953 1,1872 8,8178 27,378 63,804 0,6 0,1 ITF5 Basilicata 596,77 61,403 -0,23 75,407 5686,2 95,414 1,4443 9,7042 28,801 61,495 0,5 0,2 ITF6 Calabria 2010,3 136,26 -0,29 68,495 4691,5 96,003 1,6967 12,361 19,337 68,302 0,4 0 ITG Isole 6654,7 134,98 0 70,813 5014,5 102,05 1,1727 7,2931 20,525 72,182 0,7 0,1 ITG1 Sicilia 5008,2 197,1 0 67,325 4532,7 102,85 1,125 7,6824 19,179 73,139 0,8 0,2 ITG2 Sardegna 1646,6 68,917 -0,03 81,421 6629,4 100,1 1,3451 6,3338 23,844 69,822 0,7 0,1 LT Lietuva 3436 54,82 -0,61 51,07 2608,1 25,686 6,0397 14,044 29,086 56,87 0,8 0,1616 LU Luxembourg
(Grand-Duché) 453,3 175,29 1,13 251,02 63013 182,32 4,6305 1,758 17,322 80,92 2 1,4558
LV Latvija 2312,8 37,13 -0,8 45,459 2066,5 22,35 6,3669 11,812 26,507 61,681 0,4 0,1864 MT Malta 401,19 1271,2 0,67 74,353 5528,3 58,786 0 1,9529 30,034 68,013 0,632 0,4443 NL Nederland 16276 481,78 0,57 129,96 16890 120,54 2,6085 3,3365 20,537 76,127 1,8 1 NL1 Noord-Nederland 1699,5 204,09 0,5 120,55 14532 : 1,8445 4,7302 23,1 72,17 1,2 0,6 NL11
Groningen 574,52 245,94 0,32 153,74 23637 160,08 1,8813 3,7707 20,626 75,603 1,5 0,2
NL12
Friesland 642,29 191,77 0,56 105,63 11158 112,33 2,0442 5,6547 24,638 69,707 0,8 0,8
NL13
Drenthe 482,72 182,71 0,63 100,9 10180 111,81 1,412 4,6394 23,978 71,383 1,1 1
NL2 Oost-Nederland 3438,6 353,73 0,84 110,23 12151 : 2,5432 3,7631 23,294 72,943 1,8 0,8 NL21
Overijssel 1107,1 332,79 0,57 113,47 12875 109,93 2,3776 3,7831 26,134 70,083 1,4 0,7
NL22
Gelderland 1968,8 395,72 0,57 110,96 12311 108,52 2,2187 3,7301 22,835 73,435 2,1 0,9
NL23
Flevoland 362,75 255,59 3,44 96,431 9299 116,87 5,6123 3,8786 17,369 78,752 1,6 0,5
NL3 West-Nederland 7591,9 876,39 0,55 143,06 20467 : 2,7655 2,6663 16,28 81,054 1,6 0,7 NL31
Utrecht 1166,4 841,41 0,99 157,68 24863 128,95 3,0304 1,4703 15,447 83,083 1,8 0,5
NL32
Noord-Holland 2592,3 970,74 0,56 153,68 23617 129,43 3,3068 2,2846 15,366 82,35 1,6 0,8
NL33
Zuid-Holland 3453,9 1225,6 0,41 132,83 17643 124,89 2,3063 3,0689 16,358 80,574 1,5 0,6
NL34
Zeeland 379,37 212,16 0,38 118,78 14110 123,77 1,8321 5,6527 25,058 69,289 0,8 0,7
NL4 Zuid-Nederland 3545,9 501,38 0,42 125,56 15766 : 2,6458 3,7409 25,953 70,306 2,5 2,1 NL41
Noord-Brabant 2408,3 489,57 0,59 129,75 16835 119,7 2,785 3,5674 26,299 70,134 2,7 2,4
NL42
Limburg (NL) 1137,6 528,36 0,06 116,7 13618 120,45 2,3775 4,1334 25,171 70,696 2 1,5
PL Polska 38180 122,1 -0,12 50,73 2573,5 29,855 4,2752 17,378 29,249 53,373 0,6 0,1602 PL1 Centralny 7732,8 143,74 -0,02 66,749 4455,4 34,153 5,688 16,234 25,057 58,709 1,0412 0,2738 PL11 Łódzkie 2592,2 142,28 -0,41 46,734 2184 26,369 4,2688 16,794 30,967 52,239 0,519 0,1082 PL12 Mazowieckie 5140,6 144,48 0,18 76,842 5904,7 37,552 6,1811 15,923 21,721 62,356 1,2011 0,3246 PL2 Południowy 7964 289,38 -0,19 51,434 2645,4 30,57 3,7527 12,365 34,141 53,494 0,537 0,1498 PL21 Małopolskie 3256,4 214,38 0,25 43,363 1880,3 25,594 4,2266 23,122 27,859 49,019 0,9591 0,2408 PL22 Śląskie 4707,6 381,77 -0,48 57,017 3250,9 34,053 3,5333 4,3311 38,836 56,833 0,3149 0,1019 PL3 Wschodni 6779,3 90,597 -0,19 36,518 1333,6 21,776 3,4086 32,202 22,731 45,067 0,2896 0,112 PL31 Lubelskie 2188 87,124 -0,28 35,195 1238,7 20,881 2,7017 35,908 19,265 44,826 0,4575 0,1061 PL32 Podkarpackie 2097,5 117,55 -0,03 35,422 1254,7 21,283 3,4527 25,632 28,319 46,049 0,294 0,2211 PL33 Świętokrzyskie 1290,1 110,35 -0,35 39,264 1541,7 22,63 4,0218 33,222 22,535 44,243 0,075 0 PL34 Podlaskie 1203,7 59,648 -0,16 37,89 1435,7 23,367 3,9168 34,411 20,731 44,858 0,2374 0
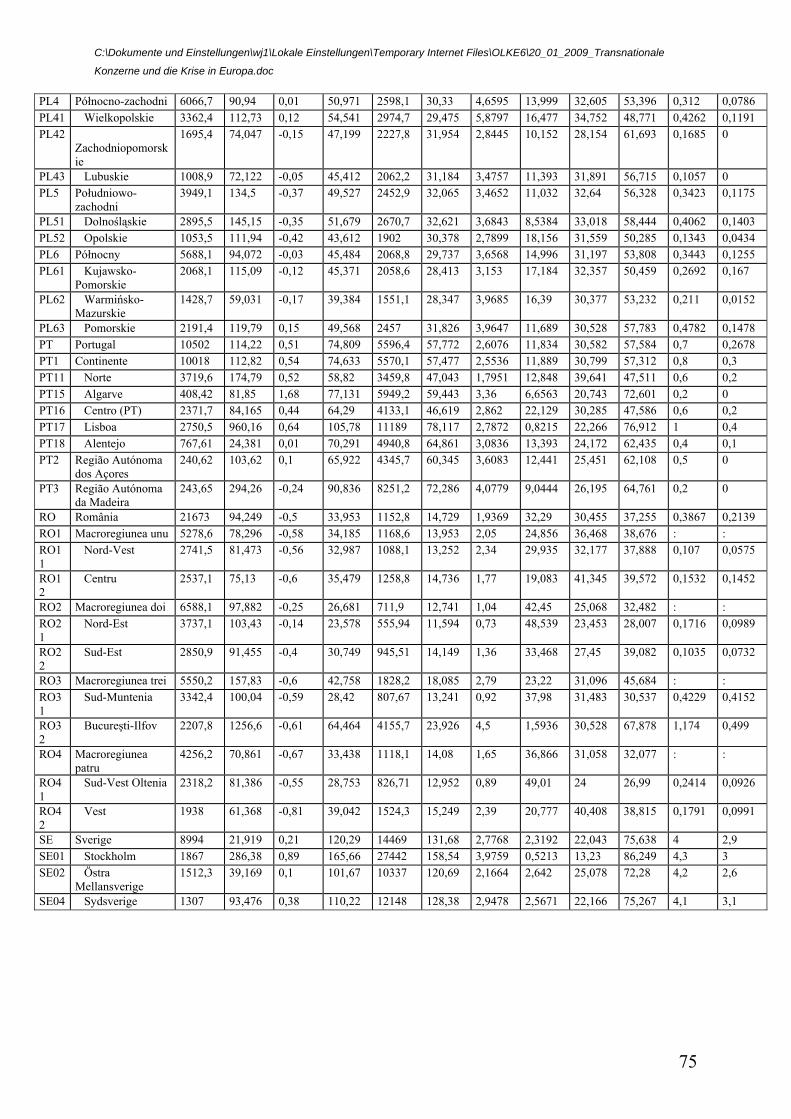
C:\Dokumente und Einstellungen\wj1\Lokale Einstellungen\Temporary Internet Files\OLKE6\20_01_2009_Transnationale
Konzerne und die Krise in Europa.doc
75
PL4 Północno-zachodni 6066,7 90,94 0,01 50,971 2598,1 30,33 4,6595 13,999 32,605 53,396 0,312 0,0786 PL41 Wielkopolskie 3362,4 112,73 0,12 54,541 2974,7 29,475 5,8797 16,477 34,752 48,771 0,4262 0,1191 PL42
Zachodniopomorskie
1695,4 74,047 -0,15 47,199 2227,8 31,954 2,8445 10,152 28,154 61,693 0,1685 0
PL43 Lubuskie 1008,9 72,122 -0,05 45,412 2062,2 31,184 3,4757 11,393 31,891 56,715 0,1057 0 PL5 Południowo-
zachodni 3949,1 134,5 -0,37 49,527 2452,9 32,065 3,4652 11,032 32,64 56,328 0,3423 0,1175
PL51 Dolnośląskie 2895,5 145,15 -0,35 51,679 2670,7 32,621 3,6843 8,5384 33,018 58,444 0,4062 0,1403 PL52 Opolskie 1053,5 111,94 -0,42 43,612 1902 30,378 2,7899 18,156 31,559 50,285 0,1343 0,0434 PL6 Północny 5688,1 94,072 -0,03 45,484 2068,8 29,737 3,6568 14,996 31,197 53,808 0,3443 0,1255 PL61 Kujawsko-
Pomorskie 2068,1 115,09 -0,12 45,371 2058,6 28,413 3,153 17,184 32,357 50,459 0,2692 0,167
PL62 Warmińsko-Mazurskie
1428,7 59,031 -0,17 39,384 1551,1 28,347 3,9685 16,39 30,377 53,232 0,211 0,0152
PL63 Pomorskie 2191,4 119,79 0,15 49,568 2457 31,826 3,9647 11,689 30,528 57,783 0,4782 0,1478 PT Portugal 10502 114,22 0,51 74,809 5596,4 57,772 2,6076 11,834 30,582 57,584 0,7 0,2678 PT1 Continente 10018 112,82 0,54 74,633 5570,1 57,477 2,5536 11,889 30,799 57,312 0,8 0,3 PT11 Norte 3719,6 174,79 0,52 58,82 3459,8 47,043 1,7951 12,848 39,641 47,511 0,6 0,2 PT15 Algarve 408,42 81,85 1,68 77,131 5949,2 59,443 3,36 6,6563 20,743 72,601 0,2 0 PT16 Centro (PT) 2371,7 84,165 0,44 64,29 4133,1 46,619 2,862 22,129 30,285 47,586 0,6 0,2 PT17 Lisboa 2750,5 960,16 0,64 105,78 11189 78,117 2,7872 0,8215 22,266 76,912 1 0,4 PT18 Alentejo 767,61 24,381 0,01 70,291 4940,8 64,861 3,0836 13,393 24,172 62,435 0,4 0,1 PT2 Região Autónoma
dos Açores 240,62 103,62 0,1 65,922 4345,7 60,345 3,6083 12,441 25,451 62,108 0,5 0
PT3 Região Autónoma da Madeira
243,65 294,26 -0,24 90,836 8251,2 72,286 4,0779 9,0444 26,195 64,761 0,2 0
RO România 21673 94,249 -0,5 33,953 1152,8 14,729 1,9369 32,29 30,455 37,255 0,3867 0,2139 RO1 Macroregiunea unu 5278,6 78,296 -0,58 34,185 1168,6 13,953 2,05 24,856 36,468 38,676 : : RO11
Nord-Vest 2741,5 81,473 -0,56 32,987 1088,1 13,252 2,34 29,935 32,177 37,888 0,107 0,0575
RO12
Centru 2537,1 75,13 -0,6 35,479 1258,8 14,736 1,77 19,083 41,345 39,572 0,1532 0,1452
RO2 Macroregiunea doi 6588,1 97,882 -0,25 26,681 711,9 12,741 1,04 42,45 25,068 32,482 : : RO21
Nord-Est 3737,1 103,43 -0,14 23,578 555,94 11,594 0,73 48,539 23,453 28,007 0,1716 0,0989
RO22
Sud-Est 2850,9 91,455 -0,4 30,749 945,51 14,149 1,36 33,468 27,45 39,082 0,1035 0,0732
RO3 Macroregiunea trei 5550,2 157,83 -0,6 42,758 1828,2 18,085 2,79 23,22 31,096 45,684 : : RO31
Sud-Muntenia 3342,4 100,04 -0,59 28,42 807,67 13,241 0,92 37,98 31,483 30,537 0,4229 0,4152
RO32
Bucureşti-Ilfov 2207,8 1256,6 -0,61 64,464 4155,7 23,926 4,5 1,5936 30,528 67,878 1,174 0,499
RO4 Macroregiunea patru
4256,2 70,861 -0,67 33,438 1118,1 14,08 1,65 36,866 31,058 32,077 : :
RO41
Sud-Vest Oltenia 2318,2 81,386 -0,55 28,753 826,71 12,952 0,89 49,01 24 26,99 0,2414 0,0926
RO42
Vest 1938 61,368 -0,81 39,042 1524,3 15,249 2,39 20,777 40,408 38,815 0,1791 0,0991
SE Sverige 8994 21,919 0,21 120,29 14469 131,68 2,7768 2,3192 22,043 75,638 4 2,9 SE01 Stockholm 1867 286,38 0,89 165,66 27442 158,54 3,9759 0,5213 13,23 86,249 4,3 3 SE02 Östra
Mellansverige 1512,3 39,169 0,1 101,67 10337 120,69 2,1664 2,642 25,078 72,28 4,2 2,6
SE04 Sydsverige 1307 93,476 0,38 110,22 12148 128,38 2,9478 2,5671 22,166 75,267 4,1 3,1
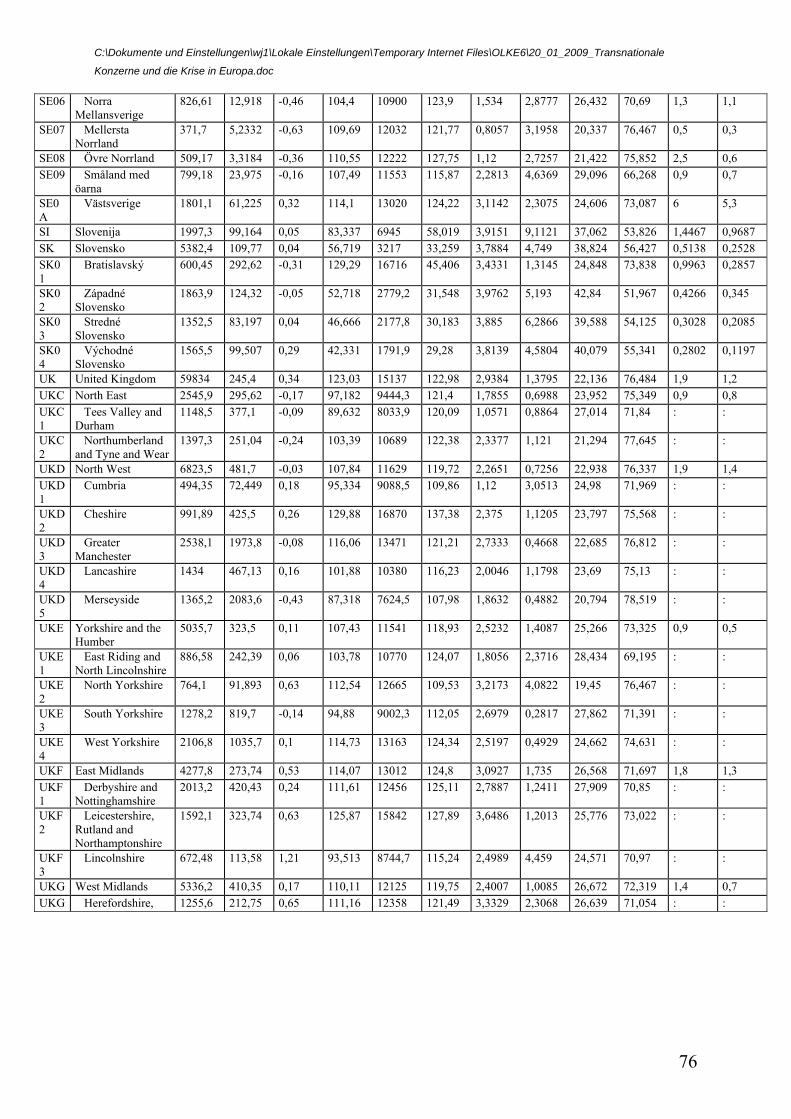
C:\Dokumente und Einstellungen\wj1\Lokale Einstellungen\Temporary Internet Files\OLKE6\20_01_2009_Transnationale
Konzerne und die Krise in Europa.doc
76
SE06 Norra Mellansverige
826,61 12,918 -0,46 104,4 10900 123,9 1,534 2,8777 26,432 70,69 1,3 1,1
SE07 Mellersta Norrland
371,7 5,2332 -0,63 109,69 12032 121,77 0,8057 3,1958 20,337 76,467 0,5 0,3
SE08 Övre Norrland 509,17 3,3184 -0,36 110,55 12222 127,75 1,12 2,7257 21,422 75,852 2,5 0,6 SE09 Småland med
öarna 799,18 23,975 -0,16 107,49 11553 115,87 2,2813 4,6369 29,096 66,268 0,9 0,7
SE0A
Västsverige 1801,1 61,225 0,32 114,1 13020 124,22 3,1142 2,3075 24,606 73,087 6 5,3
SI Slovenija 1997,3 99,164 0,05 83,337 6945 58,019 3,9151 9,1121 37,062 53,826 1,4467 0,9687 SK Slovensko 5382,4 109,77 0,04 56,719 3217 33,259 3,7884 4,749 38,824 56,427 0,5138 0,2528 SK01
Bratislavský 600,45 292,62 -0,31 129,29 16716 45,406 3,4331 1,3145 24,848 73,838 0,9963 0,2857
SK02
Západné Slovensko
1863,9 124,32 -0,05 52,718 2779,2 31,548 3,9762 5,193 42,84 51,967 0,4266 0,345
SK03
Stredné Slovensko
1352,5 83,197 0,04 46,666 2177,8 30,183 3,885 6,2866 39,588 54,125 0,3028 0,2085
SK04
Východné Slovensko
1565,5 99,507 0,29 42,331 1791,9 29,28 3,8139 4,5804 40,079 55,341 0,2802 0,1197
UK United Kingdom 59834 245,4 0,34 123,03 15137 122,98 2,9384 1,3795 22,136 76,484 1,9 1,2 UKC North East 2545,9 295,62 -0,17 97,182 9444,3 121,4 1,7855 0,6988 23,952 75,349 0,9 0,8 UKC1
Tees Valley and Durham
1148,5 377,1 -0,09 89,632 8033,9 120,09 1,0571 0,8864 27,014 71,84 : :
UKC2
Northumberland and Tyne and Wear
1397,3 251,04 -0,24 103,39 10689 122,38 2,3377 1,121 21,294 77,645 : :
UKD North West 6823,5 481,7 -0,03 107,84 11629 119,72 2,2651 0,7256 22,938 76,337 1,9 1,4 UKD1
Cumbria 494,35 72,449 0,18 95,334 9088,5 109,86 1,12 3,0513 24,98 71,969 : :
UKD2
Cheshire 991,89 425,5 0,26 129,88 16870 137,38 2,375 1,1205 23,797 75,568 : :
UKD3
Greater Manchester
2538,1 1973,8 -0,08 116,06 13471 121,21 2,7333 0,4668 22,685 76,812 : :
UKD4
Lancashire 1434 467,13 0,16 101,88 10380 116,23 2,0046 1,1798 23,69 75,13 : :
UKD5
Merseyside 1365,2 2083,6 -0,43 87,318 7624,5 107,98 1,8632 0,4882 20,794 78,519 : :
UKE Yorkshire and the Humber
5035,7 323,5 0,11 107,43 11541 118,93 2,5232 1,4087 25,266 73,325 0,9 0,5
UKE1
East Riding and North Lincolnshire
886,58 242,39 0,06 103,78 10770 124,07 1,8056 2,3716 28,434 69,195 : :
UKE2
North Yorkshire 764,1 91,893 0,63 112,54 12665 109,53 3,2173 4,0822 19,45 76,467 : :
UKE3
South Yorkshire 1278,2 819,7 -0,14 94,88 9002,3 112,05 2,6979 0,2817 27,862 71,391 : :
UKE4
West Yorkshire 2106,8 1035,7 0,1 114,73 13163 124,34 2,5197 0,4929 24,662 74,631 : :
UKF East Midlands 4277,8 273,74 0,53 114,07 13012 124,8 3,0927 1,735 26,568 71,697 1,8 1,3 UKF1
Derbyshire and Nottinghamshire
2013,2 420,43 0,24 111,61 12456 125,11 2,7887 1,2411 27,909 70,85 : :
UKF2
Leicestershire, Rutland and Northamptonshire
1592,1 323,74 0,63 125,87 15842 127,89 3,6486 1,2013 25,776 73,022 : :
UKF3
Lincolnshire 672,48 113,58 1,21 93,513 8744,7 115,24 2,4989 4,459 24,571 70,97 : :
UKG West Midlands 5336,2 410,35 0,17 110,11 12125 119,75 2,4007 1,0085 26,672 72,319 1,4 0,7 UKG Herefordshire, 1255,6 212,75 0,65 111,16 12358 121,49 3,3329 2,3068 26,639 71,054 : :
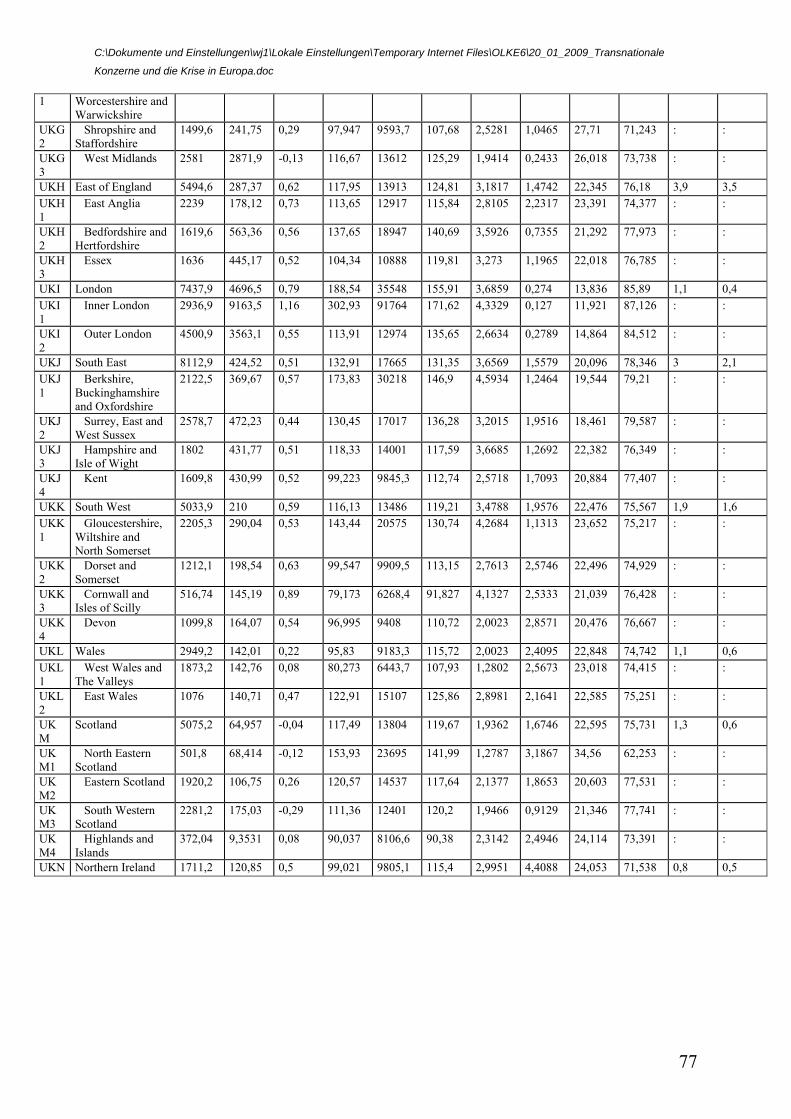
C:\Dokumente und Einstellungen\wj1\Lokale Einstellungen\Temporary Internet Files\OLKE6\20_01_2009_Transnationale
Konzerne und die Krise in Europa.doc
77
1 Worcestershire and Warwickshire
UKG2
Shropshire and Staffordshire
1499,6 241,75 0,29 97,947 9593,7 107,68 2,5281 1,0465 27,71 71,243 : :
UKG3
West Midlands 2581 2871,9 -0,13 116,67 13612 125,29 1,9414 0,2433 26,018 73,738 : :
UKH East of England 5494,6 287,37 0,62 117,95 13913 124,81 3,1817 1,4742 22,345 76,18 3,9 3,5 UKH1
East Anglia 2239 178,12 0,73 113,65 12917 115,84 2,8105 2,2317 23,391 74,377 : :
UKH2
Bedfordshire and Hertfordshire
1619,6 563,36 0,56 137,65 18947 140,69 3,5926 0,7355 21,292 77,973 : :
UKH3
Essex 1636 445,17 0,52 104,34 10888 119,81 3,273 1,1965 22,018 76,785 : :
UKI London 7437,9 4696,5 0,79 188,54 35548 155,91 3,6859 0,274 13,836 85,89 1,1 0,4 UKI1
Inner London 2936,9 9163,5 1,16 302,93 91764 171,62 4,3329 0,127 11,921 87,126 : :
UKI2
Outer London 4500,9 3563,1 0,55 113,91 12974 135,65 2,6634 0,2789 14,864 84,512 : :
UKJ South East 8112,9 424,52 0,51 132,91 17665 131,35 3,6569 1,5579 20,096 78,346 3 2,1 UKJ1
Berkshire, Buckinghamshire and Oxfordshire
2122,5 369,67 0,57 173,83 30218 146,9 4,5934 1,2464 19,544 79,21 : :
UKJ2
Surrey, East and West Sussex
2578,7 472,23 0,44 130,45 17017 136,28 3,2015 1,9516 18,461 79,587 : :
UKJ3
Hampshire and Isle of Wight
1802 431,77 0,51 118,33 14001 117,59 3,6685 1,2692 22,382 76,349 : :
UKJ4
Kent 1609,8 430,99 0,52 99,223 9845,3 112,74 2,5718 1,7093 20,884 77,407 : :
UKK South West 5033,9 210 0,59 116,13 13486 119,21 3,4788 1,9576 22,476 75,567 1,9 1,6 UKK1
Gloucestershire, Wiltshire and North Somerset
2205,3 290,04 0,53 143,44 20575 130,74 4,2684 1,1313 23,652 75,217 : :
UKK2
Dorset and Somerset
1212,1 198,54 0,63 99,547 9909,5 113,15 2,7613 2,5746 22,496 74,929 : :
UKK3
Cornwall and Isles of Scilly
516,74 145,19 0,89 79,173 6268,4 91,827 4,1327 2,5333 21,039 76,428 : :
UKK4
Devon 1099,8 164,07 0,54 96,995 9408 110,72 2,0023 2,8571 20,476 76,667 : :
UKL Wales 2949,2 142,01 0,22 95,83 9183,3 115,72 2,0023 2,4095 22,848 74,742 1,1 0,6 UKL1
West Wales and The Valleys
1873,2 142,76 0,08 80,273 6443,7 107,93 1,2802 2,5673 23,018 74,415 : :
UKL2
East Wales 1076 140,71 0,47 122,91 15107 125,86 2,8981 2,1641 22,585 75,251 : :
UKM
Scotland 5075,2 64,957 -0,04 117,49 13804 119,67 1,9362 1,6746 22,595 75,731 1,3 0,6
UKM1
North Eastern Scotland
501,8 68,414 -0,12 153,93 23695 141,99 1,2787 3,1867 34,56 62,253 : :
UKM2
Eastern Scotland 1920,2 106,75 0,26 120,57 14537 117,64 2,1377 1,8653 20,603 77,531 : :
UKM3
South Western Scotland
2281,2 175,03 -0,29 111,36 12401 120,2 1,9466 0,9129 21,346 77,741 : :
UKM4
Highlands and Islands
372,04 9,3531 0,08 90,037 8106,6 90,38 2,3142 2,4946 24,114 73,391 : :
UKN Northern Ireland 1711,2 120,85 0,5 99,021 9805,1 115,4 2,9951 4,4088 24,053 71,538 0,8 0,5
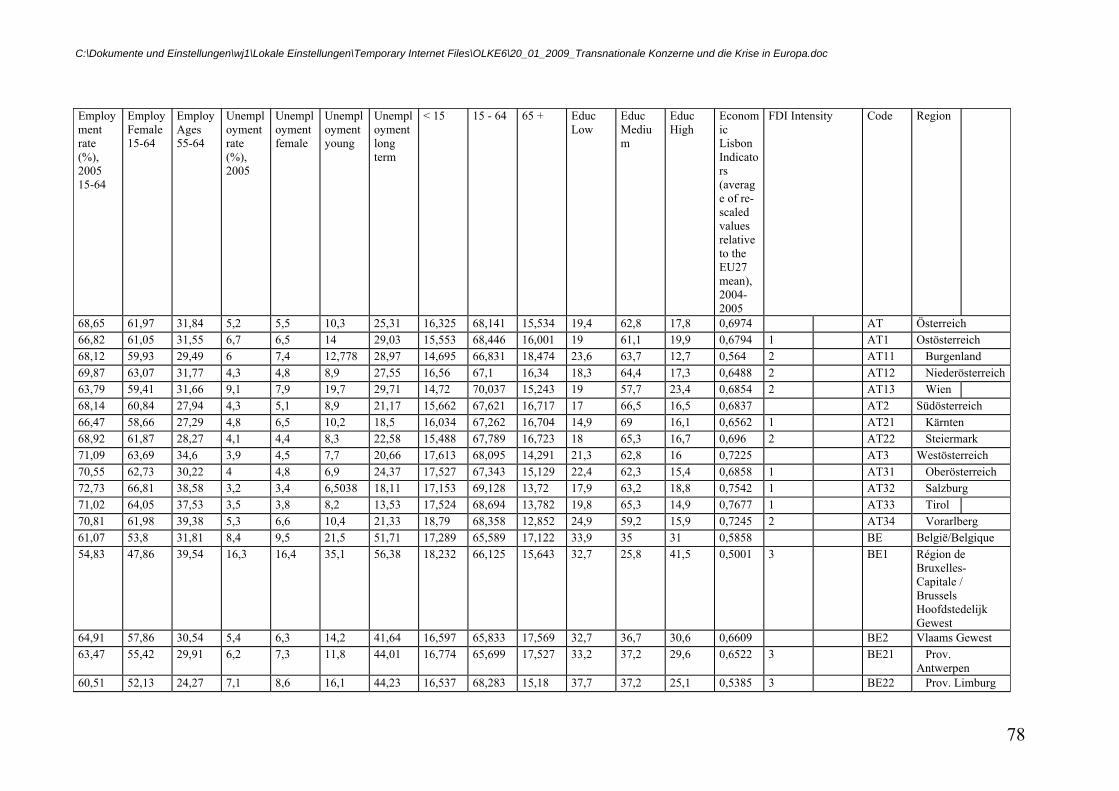
C:\Dokumente und Einstellungen\wj1\Lokale Einstellungen\Temporary Internet Files\OLKE6\20_01_2009_Transnationale Konzerne und die Krise in Europa.doc
78
Employment rate (%), 2005 15-64
Employ Female 15-64
Employ Ages 55-64
Unemployment rate (%), 2005
Unemployment female
Unemployment young
Unemployment long term
< 15 15 - 64 65 + Educ Low
Educ Medium
Educ High
Economic Lisbon Indicators (average of re-scaled values relative to the EU27 mean), 2004-2005
FDI Intensity Code Region
68,65 61,97 31,84 5,2 5,5 10,3 25,31 16,325 68,141 15,534 19,4 62,8 17,8 0,6974 AT Österreich 66,82 61,05 31,55 6,7 6,5 14 29,03 15,553 68,446 16,001 19 61,1 19,9 0,6794 1 AT1 Ostösterreich 68,12 59,93 29,49 6 7,4 12,778 28,97 14,695 66,831 18,474 23,6 63,7 12,7 0,564 2 AT11 Burgenland 69,87 63,07 31,77 4,3 4,8 8,9 27,55 16,56 67,1 16,34 18,3 64,4 17,3 0,6488 2 AT12 Niederösterreich 63,79 59,41 31,66 9,1 7,9 19,7 29,71 14,72 70,037 15,243 19 57,7 23,4 0,6854 2 AT13 Wien 68,14 60,84 27,94 4,3 5,1 8,9 21,17 15,662 67,621 16,717 17 66,5 16,5 0,6837 AT2 Südösterreich 66,47 58,66 27,29 4,8 6,5 10,2 18,5 16,034 67,262 16,704 14,9 69 16,1 0,6562 1 AT21 Kärnten 68,92 61,87 28,27 4,1 4,4 8,3 22,58 15,488 67,789 16,723 18 65,3 16,7 0,696 2 AT22 Steiermark 71,09 63,69 34,6 3,9 4,5 7,7 20,66 17,613 68,095 14,291 21,3 62,8 16 0,7225 AT3 Westösterreich 70,55 62,73 30,22 4 4,8 6,9 24,37 17,527 67,343 15,129 22,4 62,3 15,4 0,6858 1 AT31 Oberösterreich 72,73 66,81 38,58 3,2 3,4 6,5038 18,11 17,153 69,128 13,72 17,9 63,2 18,8 0,7542 1 AT32 Salzburg 71,02 64,05 37,53 3,5 3,8 8,2 13,53 17,524 68,694 13,782 19,8 65,3 14,9 0,7677 1 AT33 Tirol 70,81 61,98 39,38 5,3 6,6 10,4 21,33 18,79 68,358 12,852 24,9 59,2 15,9 0,7245 2 AT34 Vorarlberg 61,07 53,8 31,81 8,4 9,5 21,5 51,71 17,289 65,589 17,122 33,9 35 31 0,5858 BE België/Belgique 54,83 47,86 39,54 16,3 16,4 35,1 56,38 18,232 66,125 15,643 32,7 25,8 41,5 0,5001 3 BE1 Région de
Bruxelles-Capitale / Brussels Hoofdstedelijk Gewest
64,91 57,86 30,54 5,4 6,3 14,2 41,64 16,597 65,833 17,569 32,7 36,7 30,6 0,6609 BE2 Vlaams Gewest 63,47 55,42 29,91 6,2 7,3 11,8 44,01 16,774 65,699 17,527 33,2 37,2 29,6 0,6522 3 BE21 Prov.
Antwerpen 60,51 52,13 24,27 7,1 8,6 16,1 44,23 16,537 68,283 15,18 37,7 37,2 25,1 0,5385 3 BE22 Prov. Limburg
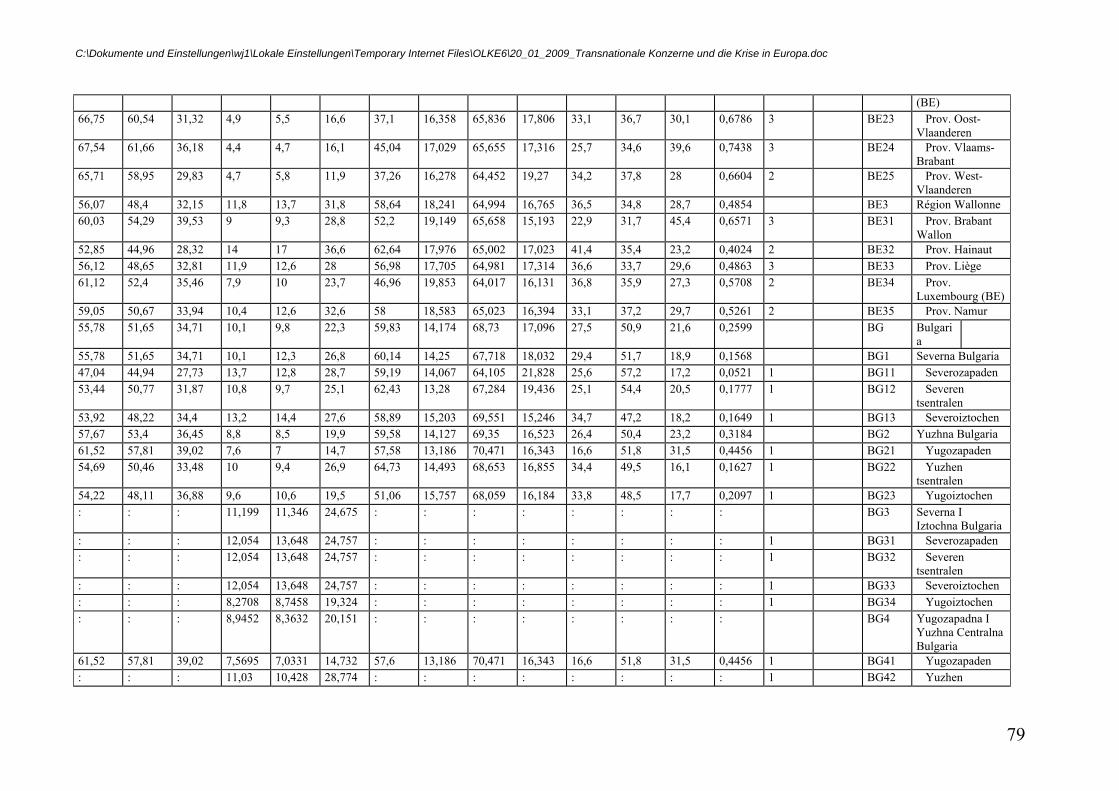
C:\Dokumente und Einstellungen\wj1\Lokale Einstellungen\Temporary Internet Files\OLKE6\20_01_2009_Transnationale Konzerne und die Krise in Europa.doc
79
(BE) 66,75 60,54 31,32 4,9 5,5 16,6 37,1 16,358 65,836 17,806 33,1 36,7 30,1 0,6786 3 BE23 Prov. Oost-
Vlaanderen 67,54 61,66 36,18 4,4 4,7 16,1 45,04 17,029 65,655 17,316 25,7 34,6 39,6 0,7438 3 BE24 Prov. Vlaams-
Brabant 65,71 58,95 29,83 4,7 5,8 11,9 37,26 16,278 64,452 19,27 34,2 37,8 28 0,6604 2 BE25 Prov. West-
Vlaanderen 56,07 48,4 32,15 11,8 13,7 31,8 58,64 18,241 64,994 16,765 36,5 34,8 28,7 0,4854 BE3 Région Wallonne 60,03 54,29 39,53 9 9,3 28,8 52,2 19,149 65,658 15,193 22,9 31,7 45,4 0,6571 3 BE31 Prov. Brabant
Wallon 52,85 44,96 28,32 14 17 36,6 62,64 17,976 65,002 17,023 41,4 35,4 23,2 0,4024 2 BE32 Prov. Hainaut 56,12 48,65 32,81 11,9 12,6 28 56,98 17,705 64,981 17,314 36,6 33,7 29,6 0,4863 3 BE33 Prov. Liège 61,12 52,4 35,46 7,9 10 23,7 46,96 19,853 64,017 16,131 36,8 35,9 27,3 0,5708 2 BE34 Prov.
Luxembourg (BE) 59,05 50,67 33,94 10,4 12,6 32,6 58 18,583 65,023 16,394 33,1 37,2 29,7 0,5261 2 BE35 Prov. Namur 55,78 51,65 34,71 10,1 9,8 22,3 59,83 14,174 68,73 17,096 27,5 50,9 21,6 0,2599 BG Bulgari
a
55,78 51,65 34,71 10,1 12,3 26,8 60,14 14,25 67,718 18,032 29,4 51,7 18,9 0,1568 BG1 Severna Bulgaria 47,04 44,94 27,73 13,7 12,8 28,7 59,19 14,067 64,105 21,828 25,6 57,2 17,2 0,0521 1 BG11 Severozapaden 53,44 50,77 31,87 10,8 9,7 25,1 62,43 13,28 67,284 19,436 25,1 54,4 20,5 0,1777 1 BG12 Severen
tsentralen 53,92 48,22 34,4 13,2 14,4 27,6 58,89 15,203 69,551 15,246 34,7 47,2 18,2 0,1649 1 BG13 Severoiztochen 57,67 53,4 36,45 8,8 8,5 19,9 59,58 14,127 69,35 16,523 26,4 50,4 23,2 0,3184 BG2 Yuzhna Bulgaria 61,52 57,81 39,02 7,6 7 14,7 57,58 13,186 70,471 16,343 16,6 51,8 31,5 0,4456 1 BG21 Yugozapaden 54,69 50,46 33,48 10 9,4 26,9 64,73 14,493 68,653 16,855 34,4 49,5 16,1 0,1627 1 BG22 Yuzhen
tsentralen 54,22 48,11 36,88 9,6 10,6 19,5 51,06 15,757 68,059 16,184 33,8 48,5 17,7 0,2097 1 BG23 Yugoiztochen : : : 11,199 11,346 24,675 : : : : : : : : BG3 Severna I
Iztochna Bulgaria : : : 12,054 13,648 24,757 : : : : : : : : 1 BG31 Severozapaden : : : 12,054 13,648 24,757 : : : : : : : : 1 BG32 Severen
tsentralen : : : 12,054 13,648 24,757 : : : : : : : : 1 BG33 Severoiztochen : : : 8,2708 8,7458 19,324 : : : : : : : : 1 BG34 Yugoiztochen : : : 8,9452 8,3632 20,151 : : : : : : : : BG4 Yugozapadna I
Yuzhna Centralna Bulgaria
61,52 57,81 39,02 7,5695 7,0331 14,732 57,6 13,186 70,471 16,343 16,6 51,8 31,5 0,4456 1 BG41 Yugozapaden : : : 11,03 10,428 28,774 : : : : : : : : 1 BG42 Yuzhen
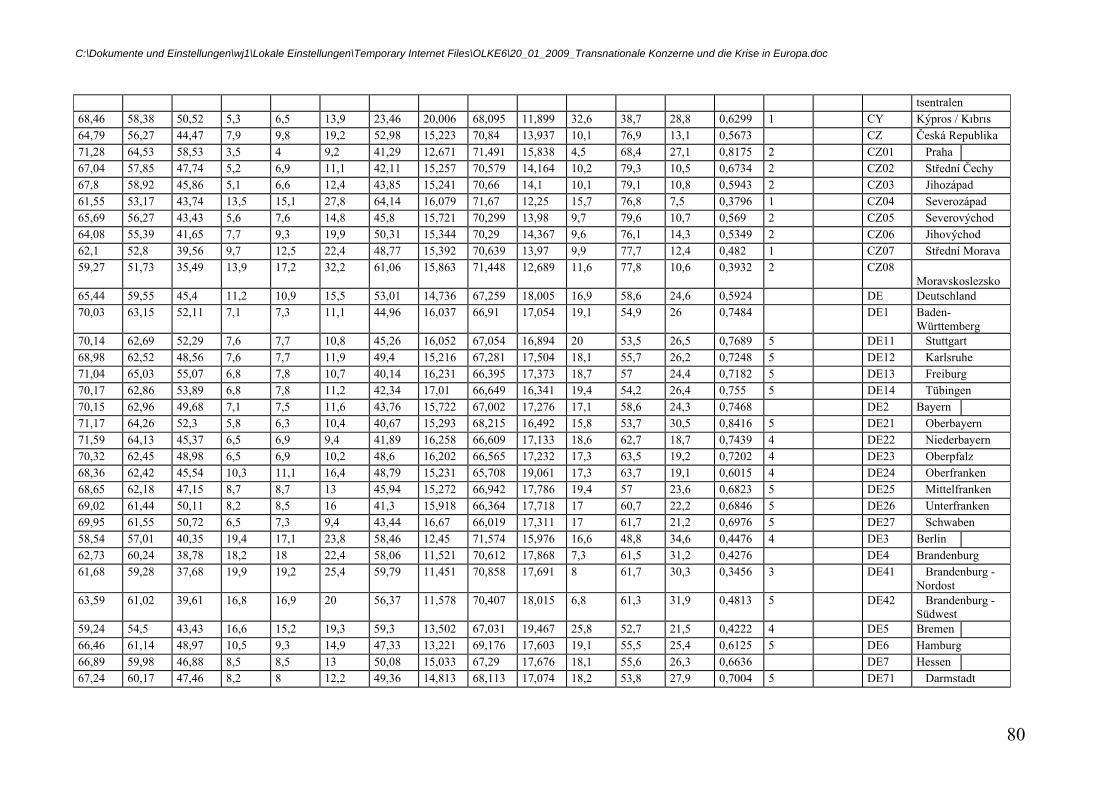
C:\Dokumente und Einstellungen\wj1\Lokale Einstellungen\Temporary Internet Files\OLKE6\20_01_2009_Transnationale Konzerne und die Krise in Europa.doc
80
tsentralen 68,46 58,38 50,52 5,3 6,5 13,9 23,46 20,006 68,095 11,899 32,6 38,7 28,8 0,6299 1 CY Kýpros / Kıbrıs 64,79 56,27 44,47 7,9 9,8 19,2 52,98 15,223 70,84 13,937 10,1 76,9 13,1 0,5673 CZ Česká Republika 71,28 64,53 58,53 3,5 4 9,2 41,29 12,671 71,491 15,838 4,5 68,4 27,1 0,8175 2 CZ01 Praha 67,04 57,85 47,74 5,2 6,9 11,1 42,11 15,257 70,579 14,164 10,2 79,3 10,5 0,6734 2 CZ02 Střední Čechy 67,8 58,92 45,86 5,1 6,6 12,4 43,85 15,241 70,66 14,1 10,1 79,1 10,8 0,5943 2 CZ03 Jihozápad 61,55 53,17 43,74 13,5 15,1 27,8 64,14 16,079 71,67 12,25 15,7 76,8 7,5 0,3796 1 CZ04 Severozápad 65,69 56,27 43,43 5,6 7,6 14,8 45,8 15,721 70,299 13,98 9,7 79,6 10,7 0,569 2 CZ05 Severovýchod 64,08 55,39 41,65 7,7 9,3 19,9 50,31 15,344 70,29 14,367 9,6 76,1 14,3 0,5349 2 CZ06 Jihovýchod 62,1 52,8 39,56 9,7 12,5 22,4 48,77 15,392 70,639 13,97 9,9 77,7 12,4 0,482 1 CZ07 Střední Morava 59,27 51,73 35,49 13,9 17,2 32,2 61,06 15,863 71,448 12,689 11,6 77,8 10,6 0,3932 2 CZ08
Moravskoslezsko 65,44 59,55 45,4 11,2 10,9 15,5 53,01 14,736 67,259 18,005 16,9 58,6 24,6 0,5924 DE Deutschland 70,03 63,15 52,11 7,1 7,3 11,1 44,96 16,037 66,91 17,054 19,1 54,9 26 0,7484 DE1 Baden-
Württemberg 70,14 62,69 52,29 7,6 7,7 10,8 45,26 16,052 67,054 16,894 20 53,5 26,5 0,7689 5 DE11 Stuttgart 68,98 62,52 48,56 7,6 7,7 11,9 49,4 15,216 67,281 17,504 18,1 55,7 26,2 0,7248 5 DE12 Karlsruhe 71,04 65,03 55,07 6,8 7,8 10,7 40,14 16,231 66,395 17,373 18,7 57 24,4 0,7182 5 DE13 Freiburg 70,17 62,86 53,89 6,8 7,8 11,2 42,34 17,01 66,649 16,341 19,4 54,2 26,4 0,755 5 DE14 Tübingen 70,15 62,96 49,68 7,1 7,5 11,6 43,76 15,722 67,002 17,276 17,1 58,6 24,3 0,7468 DE2 Bayern 71,17 64,26 52,3 5,8 6,3 10,4 40,67 15,293 68,215 16,492 15,8 53,7 30,5 0,8416 5 DE21 Oberbayern 71,59 64,13 45,37 6,5 6,9 9,4 41,89 16,258 66,609 17,133 18,6 62,7 18,7 0,7439 4 DE22 Niederbayern 70,32 62,45 48,98 6,5 6,9 10,2 48,6 16,202 66,565 17,232 17,3 63,5 19,2 0,7202 4 DE23 Oberpfalz 68,36 62,42 45,54 10,3 11,1 16,4 48,79 15,231 65,708 19,061 17,3 63,7 19,1 0,6015 4 DE24 Oberfranken 68,65 62,18 47,15 8,7 8,7 13 45,94 15,272 66,942 17,786 19,4 57 23,6 0,6823 5 DE25 Mittelfranken 69,02 61,44 50,11 8,2 8,5 16 41,3 15,918 66,364 17,718 17 60,7 22,2 0,6846 5 DE26 Unterfranken 69,95 61,55 50,72 6,5 7,3 9,4 43,44 16,67 66,019 17,311 17 61,7 21,2 0,6976 5 DE27 Schwaben 58,54 57,01 40,35 19,4 17,1 23,8 58,46 12,45 71,574 15,976 16,6 48,8 34,6 0,4476 4 DE3 Berlin 62,73 60,24 38,78 18,2 18 22,4 58,06 11,521 70,612 17,868 7,3 61,5 31,2 0,4276 DE4 Brandenburg 61,68 59,28 37,68 19,9 19,2 25,4 59,79 11,451 70,858 17,691 8 61,7 30,3 0,3456 3 DE41 Brandenburg -
Nordost 63,59 61,02 39,61 16,8 16,9 20 56,37 11,578 70,407 18,015 6,8 61,3 31,9 0,4813 5 DE42 Brandenburg -
Südwest 59,24 54,5 43,43 16,6 15,2 19,3 59,3 13,502 67,031 19,467 25,8 52,7 21,5 0,4222 4 DE5 Bremen 66,46 61,14 48,97 10,5 9,3 14,9 47,33 13,221 69,176 17,603 19,1 55,5 25,4 0,6125 5 DE6 Hamburg 66,89 59,98 46,88 8,5 8,5 13 50,08 15,033 67,29 17,676 18,1 55,6 26,3 0,6636 DE7 Hessen 67,24 60,17 47,46 8,2 8 12,2 49,36 14,813 68,113 17,074 18,2 53,8 27,9 0,7004 5 DE71 Darmstadt
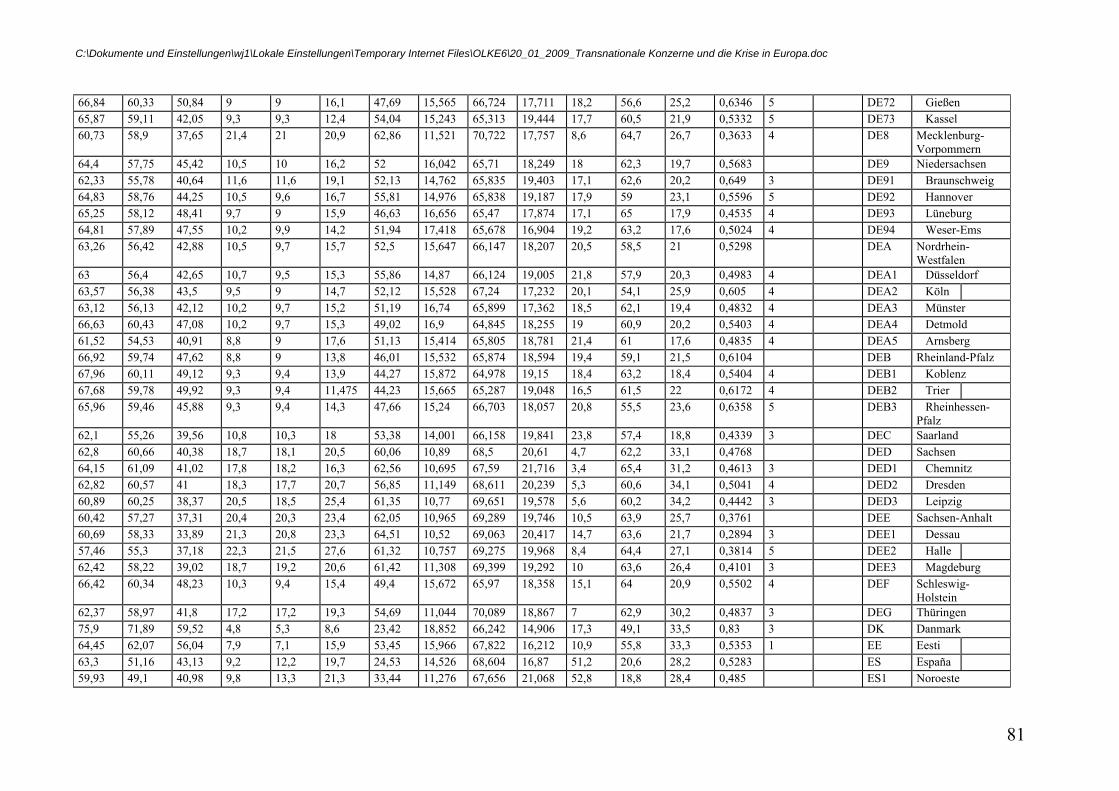
C:\Dokumente und Einstellungen\wj1\Lokale Einstellungen\Temporary Internet Files\OLKE6\20_01_2009_Transnationale Konzerne und die Krise in Europa.doc
81
66,84 60,33 50,84 9 9 16,1 47,69 15,565 66,724 17,711 18,2 56,6 25,2 0,6346 5 DE72 Gießen 65,87 59,11 42,05 9,3 9,3 12,4 54,04 15,243 65,313 19,444 17,7 60,5 21,9 0,5332 5 DE73 Kassel 60,73 58,9 37,65 21,4 21 20,9 62,86 11,521 70,722 17,757 8,6 64,7 26,7 0,3633 4 DE8 Mecklenburg-
Vorpommern 64,4 57,75 45,42 10,5 10 16,2 52 16,042 65,71 18,249 18 62,3 19,7 0,5683 DE9 Niedersachsen 62,33 55,78 40,64 11,6 11,6 19,1 52,13 14,762 65,835 19,403 17,1 62,6 20,2 0,649 3 DE91 Braunschweig 64,83 58,76 44,25 10,5 9,6 16,7 55,81 14,976 65,838 19,187 17,9 59 23,1 0,5596 5 DE92 Hannover 65,25 58,12 48,41 9,7 9 15,9 46,63 16,656 65,47 17,874 17,1 65 17,9 0,4535 4 DE93 Lüneburg 64,81 57,89 47,55 10,2 9,9 14,2 51,94 17,418 65,678 16,904 19,2 63,2 17,6 0,5024 4 DE94 Weser-Ems 63,26 56,42 42,88 10,5 9,7 15,7 52,5 15,647 66,147 18,207 20,5 58,5 21 0,5298 DEA Nordrhein-
Westfalen 63 56,4 42,65 10,7 9,5 15,3 55,86 14,87 66,124 19,005 21,8 57,9 20,3 0,4983 4 DEA1 Düsseldorf 63,57 56,38 43,5 9,5 9 14,7 52,12 15,528 67,24 17,232 20,1 54,1 25,9 0,605 4 DEA2 Köln 63,12 56,13 42,12 10,2 9,7 15,2 51,19 16,74 65,899 17,362 18,5 62,1 19,4 0,4832 4 DEA3 Münster 66,63 60,43 47,08 10,2 9,7 15,3 49,02 16,9 64,845 18,255 19 60,9 20,2 0,5403 4 DEA4 Detmold 61,52 54,53 40,91 8,8 9 17,6 51,13 15,414 65,805 18,781 21,4 61 17,6 0,4835 4 DEA5 Arnsberg 66,92 59,74 47,62 8,8 9 13,8 46,01 15,532 65,874 18,594 19,4 59,1 21,5 0,6104 DEB Rheinland-Pfalz 67,96 60,11 49,12 9,3 9,4 13,9 44,27 15,872 64,978 19,15 18,4 63,2 18,4 0,5404 4 DEB1 Koblenz 67,68 59,78 49,92 9,3 9,4 11,475 44,23 15,665 65,287 19,048 16,5 61,5 22 0,6172 4 DEB2 Trier 65,96 59,46 45,88 9,3 9,4 14,3 47,66 15,24 66,703 18,057 20,8 55,5 23,6 0,6358 5 DEB3 Rheinhessen-
Pfalz 62,1 55,26 39,56 10,8 10,3 18 53,38 14,001 66,158 19,841 23,8 57,4 18,8 0,4339 3 DEC Saarland 62,8 60,66 40,38 18,7 18,1 20,5 60,06 10,89 68,5 20,61 4,7 62,2 33,1 0,4768 DED Sachsen 64,15 61,09 41,02 17,8 18,2 16,3 62,56 10,695 67,59 21,716 3,4 65,4 31,2 0,4613 3 DED1 Chemnitz 62,82 60,57 41 18,3 17,7 20,7 56,85 11,149 68,611 20,239 5,3 60,6 34,1 0,5041 4 DED2 Dresden 60,89 60,25 38,37 20,5 18,5 25,4 61,35 10,77 69,651 19,578 5,6 60,2 34,2 0,4442 3 DED3 Leipzig 60,42 57,27 37,31 20,4 20,3 23,4 62,05 10,965 69,289 19,746 10,5 63,9 25,7 0,3761 DEE Sachsen-Anhalt 60,69 58,33 33,89 21,3 20,8 23,3 64,51 10,52 69,063 20,417 14,7 63,6 21,7 0,2894 3 DEE1 Dessau 57,46 55,3 37,18 22,3 21,5 27,6 61,32 10,757 69,275 19,968 8,4 64,4 27,1 0,3814 5 DEE2 Halle 62,42 58,22 39,02 18,7 19,2 20,6 61,42 11,308 69,399 19,292 10 63,6 26,4 0,4101 3 DEE3 Magdeburg 66,42 60,34 48,23 10,3 9,4 15,4 49,4 15,672 65,97 18,358 15,1 64 20,9 0,5502 4 DEF Schleswig-
Holstein 62,37 58,97 41,8 17,2 17,2 19,3 54,69 11,044 70,089 18,867 7 62,9 30,2 0,4837 3 DEG Thüringen 75,9 71,89 59,52 4,8 5,3 8,6 23,42 18,852 66,242 14,906 17,3 49,1 33,5 0,83 3 DK Danmark 64,45 62,07 56,04 7,9 7,1 15,9 53,45 15,966 67,822 16,212 10,9 55,8 33,3 0,5353 1 EE Eesti 63,3 51,16 43,13 9,2 12,2 19,7 24,53 14,526 68,604 16,87 51,2 20,6 28,2 0,5283 ES España 59,93 49,1 40,98 9,8 13,3 21,3 33,44 11,276 67,656 21,068 52,8 18,8 28,4 0,485 ES1 Noroeste
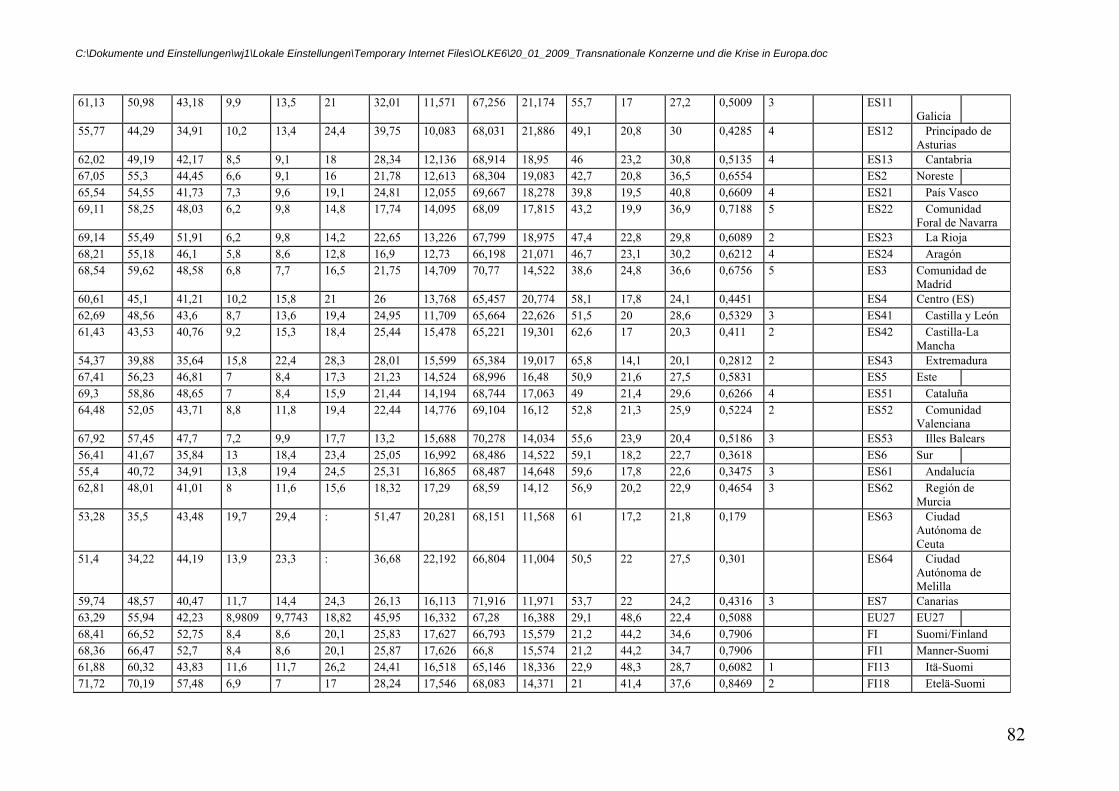
C:\Dokumente und Einstellungen\wj1\Lokale Einstellungen\Temporary Internet Files\OLKE6\20_01_2009_Transnationale Konzerne und die Krise in Europa.doc
82
61,13 50,98 43,18 9,9 13,5 21 32,01 11,571 67,256 21,174 55,7 17 27,2 0,5009 3 ES11 Galicia
55,77 44,29 34,91 10,2 13,4 24,4 39,75 10,083 68,031 21,886 49,1 20,8 30 0,4285 4 ES12 Principado de Asturias
62,02 49,19 42,17 8,5 9,1 18 28,34 12,136 68,914 18,95 46 23,2 30,8 0,5135 4 ES13 Cantabria 67,05 55,3 44,45 6,6 9,1 16 21,78 12,613 68,304 19,083 42,7 20,8 36,5 0,6554 ES2 Noreste 65,54 54,55 41,73 7,3 9,6 19,1 24,81 12,055 69,667 18,278 39,8 19,5 40,8 0,6609 4 ES21 País Vasco 69,11 58,25 48,03 6,2 9,8 14,8 17,74 14,095 68,09 17,815 43,2 19,9 36,9 0,7188 5 ES22 Comunidad
Foral de Navarra 69,14 55,49 51,91 6,2 9,8 14,2 22,65 13,226 67,799 18,975 47,4 22,8 29,8 0,6089 2 ES23 La Rioja 68,21 55,18 46,1 5,8 8,6 12,8 16,9 12,73 66,198 21,071 46,7 23,1 30,2 0,6212 4 ES24 Aragón 68,54 59,62 48,58 6,8 7,7 16,5 21,75 14,709 70,77 14,522 38,6 24,8 36,6 0,6756 5 ES3 Comunidad de
Madrid 60,61 45,1 41,21 10,2 15,8 21 26 13,768 65,457 20,774 58,1 17,8 24,1 0,4451 ES4 Centro (ES) 62,69 48,56 43,6 8,7 13,6 19,4 24,95 11,709 65,664 22,626 51,5 20 28,6 0,5329 3 ES41 Castilla y León 61,43 43,53 40,76 9,2 15,3 18,4 25,44 15,478 65,221 19,301 62,6 17 20,3 0,411 2 ES42 Castilla-La
Mancha 54,37 39,88 35,64 15,8 22,4 28,3 28,01 15,599 65,384 19,017 65,8 14,1 20,1 0,2812 2 ES43 Extremadura 67,41 56,23 46,81 7 8,4 17,3 21,23 14,524 68,996 16,48 50,9 21,6 27,5 0,5831 ES5 Este 69,3 58,86 48,65 7 8,4 15,9 21,44 14,194 68,744 17,063 49 21,4 29,6 0,6266 4 ES51 Cataluña 64,48 52,05 43,71 8,8 11,8 19,4 22,44 14,776 69,104 16,12 52,8 21,3 25,9 0,5224 2 ES52 Comunidad
Valenciana 67,92 57,45 47,7 7,2 9,9 17,7 13,2 15,688 70,278 14,034 55,6 23,9 20,4 0,5186 3 ES53 Illes Balears 56,41 41,67 35,84 13 18,4 23,4 25,05 16,992 68,486 14,522 59,1 18,2 22,7 0,3618 ES6 Sur 55,4 40,72 34,91 13,8 19,4 24,5 25,31 16,865 68,487 14,648 59,6 17,8 22,6 0,3475 3 ES61 Andalucía 62,81 48,01 41,01 8 11,6 15,6 18,32 17,29 68,59 14,12 56,9 20,2 22,9 0,4654 3 ES62 Región de
Murcia 53,28 35,5 43,48 19,7 29,4 : 51,47 20,281 68,151 11,568 61 17,2 21,8 0,179 ES63 Ciudad
Autónoma de Ceuta
51,4 34,22 44,19 13,9 23,3 : 36,68 22,192 66,804 11,004 50,5 22 27,5 0,301 ES64 Ciudad Autónoma de Melilla
59,74 48,57 40,47 11,7 14,4 24,3 26,13 16,113 71,916 11,971 53,7 22 24,2 0,4316 3 ES7 Canarias 63,29 55,94 42,23 8,9809 9,7743 18,82 45,95 16,332 67,28 16,388 29,1 48,6 22,4 0,5088 EU27 EU27 68,41 66,52 52,75 8,4 8,6 20,1 25,83 17,627 66,793 15,579 21,2 44,2 34,6 0,7906 FI Suomi/Finland 68,36 66,47 52,7 8,4 8,6 20,1 25,87 17,626 66,8 15,574 21,2 44,2 34,7 0,7906 FI1 Manner-Suomi 61,88 60,32 43,83 11,6 11,7 26,2 24,41 16,518 65,146 18,336 22,9 48,3 28,7 0,6082 1 FI13 Itä-Suomi 71,72 70,19 57,48 6,9 7 17 28,24 17,546 68,083 14,371 21 41,4 37,6 0,8469 2 FI18 Etelä-Suomi
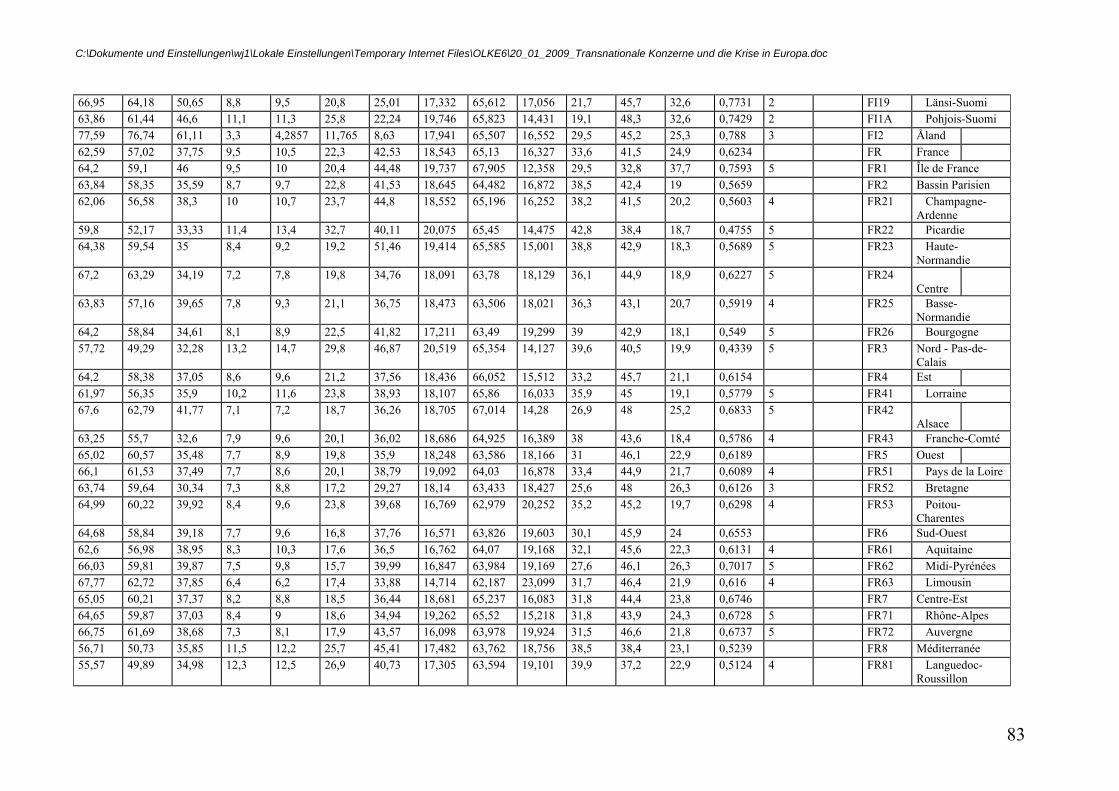
C:\Dokumente und Einstellungen\wj1\Lokale Einstellungen\Temporary Internet Files\OLKE6\20_01_2009_Transnationale Konzerne und die Krise in Europa.doc
83
66,95 64,18 50,65 8,8 9,5 20,8 25,01 17,332 65,612 17,056 21,7 45,7 32,6 0,7731 2 FI19 Länsi-Suomi 63,86 61,44 46,6 11,1 11,3 25,8 22,24 19,746 65,823 14,431 19,1 48,3 32,6 0,7429 2 FI1A Pohjois-Suomi 77,59 76,74 61,11 3,3 4,2857 11,765 8,63 17,941 65,507 16,552 29,5 45,2 25,3 0,788 3 FI2 Åland 62,59 57,02 37,75 9,5 10,5 22,3 42,53 18,543 65,13 16,327 33,6 41,5 24,9 0,6234 FR France 64,2 59,1 46 9,5 10 20,4 44,48 19,737 67,905 12,358 29,5 32,8 37,7 0,7593 5 FR1 Île de France 63,84 58,35 35,59 8,7 9,7 22,8 41,53 18,645 64,482 16,872 38,5 42,4 19 0,5659 FR2 Bassin Parisien 62,06 56,58 38,3 10 10,7 23,7 44,8 18,552 65,196 16,252 38,2 41,5 20,2 0,5603 4 FR21 Champagne-
Ardenne 59,8 52,17 33,33 11,4 13,4 32,7 40,11 20,075 65,45 14,475 42,8 38,4 18,7 0,4755 5 FR22 Picardie 64,38 59,54 35 8,4 9,2 19,2 51,46 19,414 65,585 15,001 38,8 42,9 18,3 0,5689 5 FR23 Haute-
Normandie 67,2 63,29 34,19 7,2 7,8 19,8 34,76 18,091 63,78 18,129 36,1 44,9 18,9 0,6227 5 FR24
Centre
63,83 57,16 39,65 7,8 9,3 21,1 36,75 18,473 63,506 18,021 36,3 43,1 20,7 0,5919 4 FR25 Basse-Normandie
64,2 58,84 34,61 8,1 8,9 22,5 41,82 17,211 63,49 19,299 39 42,9 18,1 0,549 5 FR26 Bourgogne 57,72 49,29 32,28 13,2 14,7 29,8 46,87 20,519 65,354 14,127 39,6 40,5 19,9 0,4339 5 FR3 Nord - Pas-de-
Calais 64,2 58,38 37,05 8,6 9,6 21,2 37,56 18,436 66,052 15,512 33,2 45,7 21,1 0,6154 FR4 Est 61,97 56,35 35,9 10,2 11,6 23,8 38,93 18,107 65,86 16,033 35,9 45 19,1 0,5779 5 FR41 Lorraine 67,6 62,79 41,77 7,1 7,2 18,7 36,26 18,705 67,014 14,28 26,9 48 25,2 0,6833 5 FR42
Alsace
63,25 55,7 32,6 7,9 9,6 20,1 36,02 18,686 64,925 16,389 38 43,6 18,4 0,5786 4 FR43 Franche-Comté 65,02 60,57 35,48 7,7 8,9 19,8 35,9 18,248 63,586 18,166 31 46,1 22,9 0,6189 FR5 Ouest 66,1 61,53 37,49 7,7 8,6 20,1 38,79 19,092 64,03 16,878 33,4 44,9 21,7 0,6089 4 FR51 Pays de la Loire 63,74 59,64 30,34 7,3 8,8 17,2 29,27 18,14 63,433 18,427 25,6 48 26,3 0,6126 3 FR52 Bretagne 64,99 60,22 39,92 8,4 9,6 23,8 39,68 16,769 62,979 20,252 35,2 45,2 19,7 0,6298 4 FR53 Poitou-
Charentes 64,68 58,84 39,18 7,7 9,6 16,8 37,76 16,571 63,826 19,603 30,1 45,9 24 0,6553 FR6 Sud-Ouest 62,6 56,98 38,95 8,3 10,3 17,6 36,5 16,762 64,07 19,168 32,1 45,6 22,3 0,6131 4 FR61 Aquitaine 66,03 59,81 39,87 7,5 9,8 15,7 39,99 16,847 63,984 19,169 27,6 46,1 26,3 0,7017 5 FR62 Midi-Pyrénées 67,77 62,72 37,85 6,4 6,2 17,4 33,88 14,714 62,187 23,099 31,7 46,4 21,9 0,616 4 FR63 Limousin 65,05 60,21 37,37 8,2 8,8 18,5 36,44 18,681 65,237 16,083 31,8 44,4 23,8 0,6746 FR7 Centre-Est 64,65 59,87 37,03 8,4 9 18,6 34,94 19,262 65,52 15,218 31,8 43,9 24,3 0,6728 5 FR71 Rhône-Alpes 66,75 61,69 38,68 7,3 8,1 17,9 43,57 16,098 63,978 19,924 31,5 46,6 21,8 0,6737 5 FR72 Auvergne 56,71 50,73 35,85 11,5 12,2 25,7 45,41 17,482 63,762 18,756 38,5 38,4 23,1 0,5239 FR8 Méditerranée 55,57 49,89 34,98 12,3 12,5 26,9 40,73 17,305 63,594 19,101 39,9 37,2 22,9 0,5124 4 FR81 Languedoc-
Roussillon
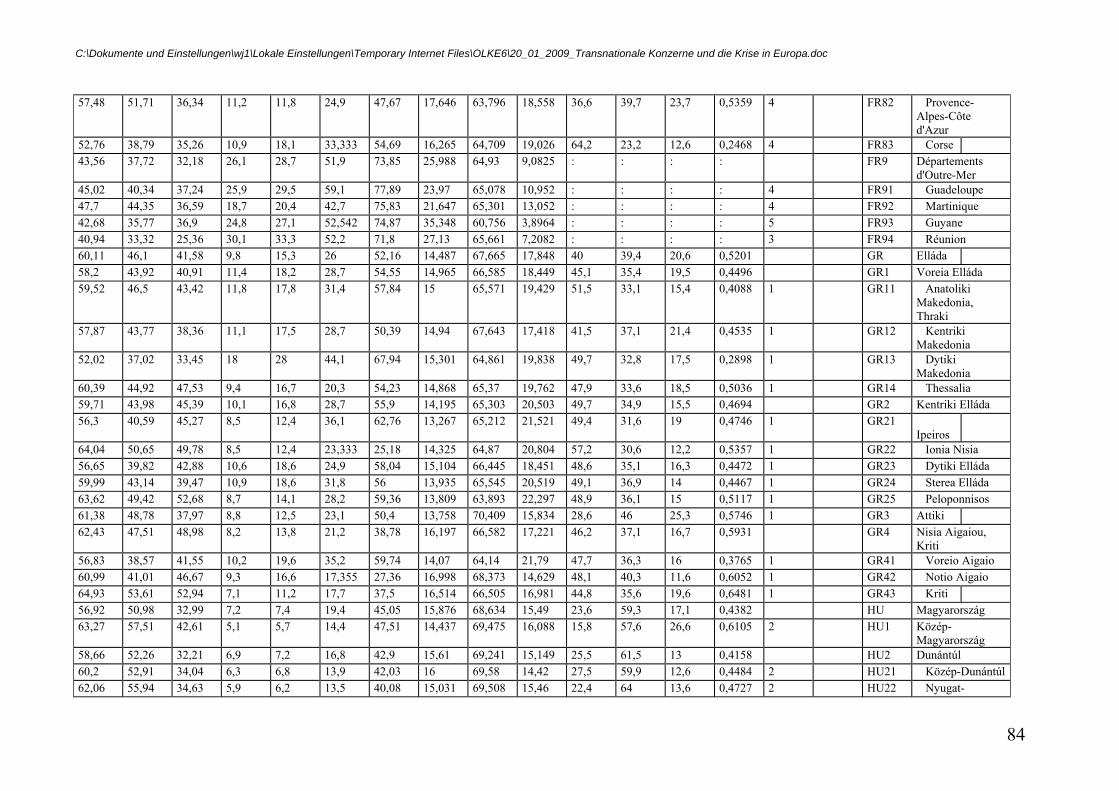
C:\Dokumente und Einstellungen\wj1\Lokale Einstellungen\Temporary Internet Files\OLKE6\20_01_2009_Transnationale Konzerne und die Krise in Europa.doc
84
57,48 51,71 36,34 11,2 11,8 24,9 47,67 17,646 63,796 18,558 36,6 39,7 23,7 0,5359 4 FR82 Provence-Alpes-Côte d'Azur
52,76 38,79 35,26 10,9 18,1 33,333 54,69 16,265 64,709 19,026 64,2 23,2 12,6 0,2468 4 FR83 Corse 43,56 37,72 32,18 26,1 28,7 51,9 73,85 25,988 64,93 9,0825 : : : : FR9 Départements
d'Outre-Mer 45,02 40,34 37,24 25,9 29,5 59,1 77,89 23,97 65,078 10,952 : : : : 4 FR91 Guadeloupe 47,7 44,35 36,59 18,7 20,4 42,7 75,83 21,647 65,301 13,052 : : : : 4 FR92 Martinique 42,68 35,77 36,9 24,8 27,1 52,542 74,87 35,348 60,756 3,8964 : : : : 5 FR93 Guyane 40,94 33,32 25,36 30,1 33,3 52,2 71,8 27,13 65,661 7,2082 : : : : 3 FR94 Réunion 60,11 46,1 41,58 9,8 15,3 26 52,16 14,487 67,665 17,848 40 39,4 20,6 0,5201 GR Elláda 58,2 43,92 40,91 11,4 18,2 28,7 54,55 14,965 66,585 18,449 45,1 35,4 19,5 0,4496 GR1 Voreia Elláda 59,52 46,5 43,42 11,8 17,8 31,4 57,84 15 65,571 19,429 51,5 33,1 15,4 0,4088 1 GR11 Anatoliki
Makedonia, Thraki
57,87 43,77 38,36 11,1 17,5 28,7 50,39 14,94 67,643 17,418 41,5 37,1 21,4 0,4535 1 GR12 Kentriki Makedonia
52,02 37,02 33,45 18 28 44,1 67,94 15,301 64,861 19,838 49,7 32,8 17,5 0,2898 1 GR13 Dytiki Makedonia
60,39 44,92 47,53 9,4 16,7 20,3 54,23 14,868 65,37 19,762 47,9 33,6 18,5 0,5036 1 GR14 Thessalia 59,71 43,98 45,39 10,1 16,8 28,7 55,9 14,195 65,303 20,503 49,7 34,9 15,5 0,4694 GR2 Kentriki Elláda 56,3 40,59 45,27 8,5 12,4 36,1 62,76 13,267 65,212 21,521 49,4 31,6 19 0,4746 1 GR21
Ipeiros
64,04 50,65 49,78 8,5 12,4 23,333 25,18 14,325 64,87 20,804 57,2 30,6 12,2 0,5357 1 GR22 Ionia Nisia 56,65 39,82 42,88 10,6 18,6 24,9 58,04 15,104 66,445 18,451 48,6 35,1 16,3 0,4472 1 GR23 Dytiki Elláda 59,99 43,14 39,47 10,9 18,6 31,8 56 13,935 65,545 20,519 49,1 36,9 14 0,4467 1 GR24 Sterea Elláda 63,62 49,42 52,68 8,7 14,1 28,2 59,36 13,809 63,893 22,297 48,9 36,1 15 0,5117 1 GR25 Peloponnisos 61,38 48,78 37,97 8,8 12,5 23,1 50,4 13,758 70,409 15,834 28,6 46 25,3 0,5746 1 GR3 Attiki 62,43 47,51 48,98 8,2 13,8 21,2 38,78 16,197 66,582 17,221 46,2 37,1 16,7 0,5931 GR4 Nisia Aigaiou,
Kriti 56,83 38,57 41,55 10,2 19,6 35,2 59,74 14,07 64,14 21,79 47,7 36,3 16 0,3765 1 GR41 Voreio Aigaio 60,99 41,01 46,67 9,3 16,6 17,355 27,36 16,998 68,373 14,629 48,1 40,3 11,6 0,6052 1 GR42 Notio Aigaio 64,93 53,61 52,94 7,1 11,2 17,7 37,5 16,514 66,505 16,981 44,8 35,6 19,6 0,6481 1 GR43 Kriti 56,92 50,98 32,99 7,2 7,4 19,4 45,05 15,876 68,634 15,49 23,6 59,3 17,1 0,4382 HU Magyarország 63,27 57,51 42,61 5,1 5,7 14,4 47,51 14,437 69,475 16,088 15,8 57,6 26,6 0,6105 2 HU1 Közép-
Magyarország 58,66 52,26 32,21 6,9 7,2 16,8 42,9 15,61 69,241 15,149 25,5 61,5 13 0,4158 HU2 Dunántúl 60,2 52,91 34,04 6,3 6,8 13,9 42,03 16 69,58 14,42 27,5 59,9 12,6 0,4484 2 HU21 Közép-Dunántúl 62,06 55,94 34,63 5,9 6,2 13,5 40,08 15,031 69,508 15,46 22,4 64 13,6 0,4727 2 HU22 Nyugat-
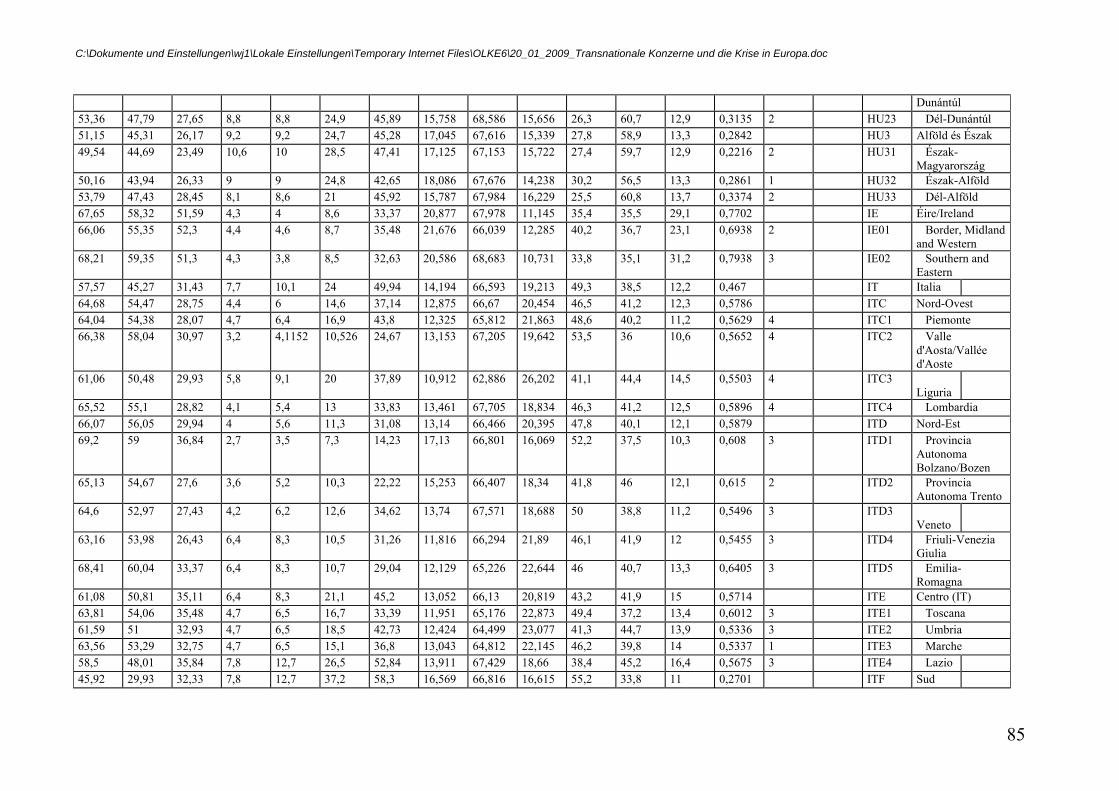
C:\Dokumente und Einstellungen\wj1\Lokale Einstellungen\Temporary Internet Files\OLKE6\20_01_2009_Transnationale Konzerne und die Krise in Europa.doc
85
Dunántúl 53,36 47,79 27,65 8,8 8,8 24,9 45,89 15,758 68,586 15,656 26,3 60,7 12,9 0,3135 2 HU23 Dél-Dunántúl 51,15 45,31 26,17 9,2 9,2 24,7 45,28 17,045 67,616 15,339 27,8 58,9 13,3 0,2842 HU3 Alföld és Észak 49,54 44,69 23,49 10,6 10 28,5 47,41 17,125 67,153 15,722 27,4 59,7 12,9 0,2216 2 HU31 Észak-
Magyarország 50,16 43,94 26,33 9 9 24,8 42,65 18,086 67,676 14,238 30,2 56,5 13,3 0,2861 1 HU32 Észak-Alföld 53,79 47,43 28,45 8,1 8,6 21 45,92 15,787 67,984 16,229 25,5 60,8 13,7 0,3374 2 HU33 Dél-Alföld 67,65 58,32 51,59 4,3 4 8,6 33,37 20,877 67,978 11,145 35,4 35,5 29,1 0,7702 IE Éire/Ireland 66,06 55,35 52,3 4,4 4,6 8,7 35,48 21,676 66,039 12,285 40,2 36,7 23,1 0,6938 2 IE01 Border, Midland
and Western 68,21 59,35 51,3 4,3 3,8 8,5 32,63 20,586 68,683 10,731 33,8 35,1 31,2 0,7938 3 IE02 Southern and
Eastern 57,57 45,27 31,43 7,7 10,1 24 49,94 14,194 66,593 19,213 49,3 38,5 12,2 0,467 IT Italia 64,68 54,47 28,75 4,4 6 14,6 37,14 12,875 66,67 20,454 46,5 41,2 12,3 0,5786 ITC Nord-Ovest 64,04 54,38 28,07 4,7 6,4 16,9 43,8 12,325 65,812 21,863 48,6 40,2 11,2 0,5629 4 ITC1 Piemonte 66,38 58,04 30,97 3,2 4,1152 10,526 24,67 13,153 67,205 19,642 53,5 36 10,6 0,5652 4 ITC2 Valle
d'Aosta/Vallée d'Aoste
61,06 50,48 29,93 5,8 9,1 20 37,89 10,912 62,886 26,202 41,1 44,4 14,5 0,5503 4 ITC3 Liguria
65,52 55,1 28,82 4,1 5,4 13 33,83 13,461 67,705 18,834 46,3 41,2 12,5 0,5896 4 ITC4 Lombardia 66,07 56,05 29,94 4 5,6 11,3 31,08 13,14 66,466 20,395 47,8 40,1 12,1 0,5879 ITD Nord-Est 69,2 59 36,84 2,7 3,5 7,3 14,23 17,13 66,801 16,069 52,2 37,5 10,3 0,608 3 ITD1 Provincia
Autonoma Bolzano/Bozen
65,13 54,67 27,6 3,6 5,2 10,3 22,22 15,253 66,407 18,34 41,8 46 12,1 0,615 2 ITD2 Provincia Autonoma Trento
64,6 52,97 27,43 4,2 6,2 12,6 34,62 13,74 67,571 18,688 50 38,8 11,2 0,5496 3 ITD3 Veneto
63,16 53,98 26,43 6,4 8,3 10,5 31,26 11,816 66,294 21,89 46,1 41,9 12 0,5455 3 ITD4 Friuli-Venezia Giulia
68,41 60,04 33,37 6,4 8,3 10,7 29,04 12,129 65,226 22,644 46 40,7 13,3 0,6405 3 ITD5 Emilia-Romagna
61,08 50,81 35,11 6,4 8,3 21,1 45,2 13,052 66,13 20,819 43,2 41,9 15 0,5714 ITE Centro (IT) 63,81 54,06 35,48 4,7 6,5 16,7 33,39 11,951 65,176 22,873 49,4 37,2 13,4 0,6012 3 ITE1 Toscana 61,59 51 32,93 4,7 6,5 18,5 42,73 12,424 64,499 23,077 41,3 44,7 13,9 0,5336 3 ITE2 Umbria 63,56 53,29 32,75 4,7 6,5 15,1 36,8 13,043 64,812 22,145 46,2 39,8 14 0,5337 1 ITE3 Marche 58,5 48,01 35,84 7,8 12,7 26,5 52,84 13,911 67,429 18,66 38,4 45,2 16,4 0,5675 3 ITE4 Lazio 45,92 29,93 32,33 7,8 12,7 37,2 58,3 16,569 66,816 16,615 55,2 33,8 11 0,2701 ITF Sud
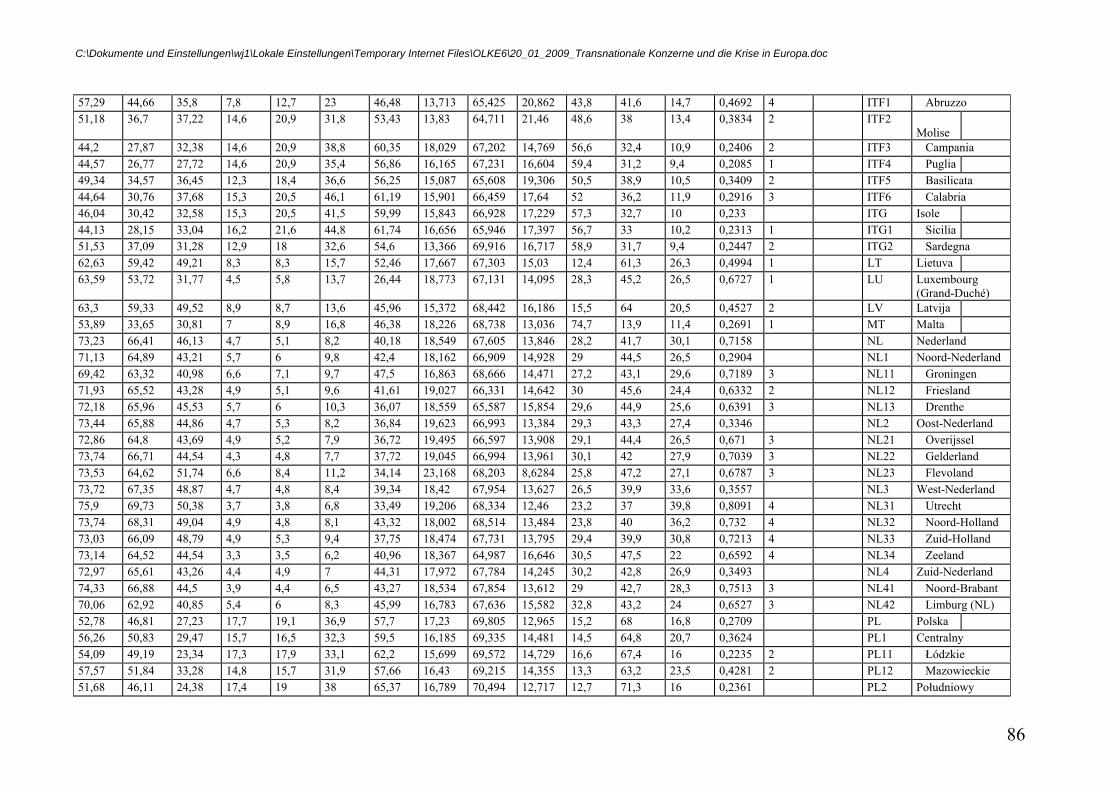
C:\Dokumente und Einstellungen\wj1\Lokale Einstellungen\Temporary Internet Files\OLKE6\20_01_2009_Transnationale Konzerne und die Krise in Europa.doc
86
57,29 44,66 35,8 7,8 12,7 23 46,48 13,713 65,425 20,862 43,8 41,6 14,7 0,4692 4 ITF1 Abruzzo 51,18 36,7 37,22 14,6 20,9 31,8 53,43 13,83 64,711 21,46 48,6 38 13,4 0,3834 2 ITF2
Molise
44,2 27,87 32,38 14,6 20,9 38,8 60,35 18,029 67,202 14,769 56,6 32,4 10,9 0,2406 2 ITF3 Campania 44,57 26,77 27,72 14,6 20,9 35,4 56,86 16,165 67,231 16,604 59,4 31,2 9,4 0,2085 1 ITF4 Puglia 49,34 34,57 36,45 12,3 18,4 36,6 56,25 15,087 65,608 19,306 50,5 38,9 10,5 0,3409 2 ITF5 Basilicata 44,64 30,76 37,68 15,3 20,5 46,1 61,19 15,901 66,459 17,64 52 36,2 11,9 0,2916 3 ITF6 Calabria 46,04 30,42 32,58 15,3 20,5 41,5 59,99 15,843 66,928 17,229 57,3 32,7 10 0,233 ITG Isole 44,13 28,15 33,04 16,2 21,6 44,8 61,74 16,656 65,946 17,397 56,7 33 10,2 0,2313 1 ITG1 Sicilia 51,53 37,09 31,28 12,9 18 32,6 54,6 13,366 69,916 16,717 58,9 31,7 9,4 0,2447 2 ITG2 Sardegna 62,63 59,42 49,21 8,3 8,3 15,7 52,46 17,667 67,303 15,03 12,4 61,3 26,3 0,4994 1 LT Lietuva 63,59 53,72 31,77 4,5 5,8 13,7 26,44 18,773 67,131 14,095 28,3 45,2 26,5 0,6727 1 LU Luxembourg
(Grand-Duché) 63,3 59,33 49,52 8,9 8,7 13,6 45,96 15,372 68,442 16,186 15,5 64 20,5 0,4527 2 LV Latvija 53,89 33,65 30,81 7 8,9 16,8 46,38 18,226 68,738 13,036 74,7 13,9 11,4 0,2691 1 MT Malta 73,23 66,41 46,13 4,7 5,1 8,2 40,18 18,549 67,605 13,846 28,2 41,7 30,1 0,7158 NL Nederland 71,13 64,89 43,21 5,7 6 9,8 42,4 18,162 66,909 14,928 29 44,5 26,5 0,2904 NL1 Noord-Nederland 69,42 63,32 40,98 6,6 7,1 9,7 47,5 16,863 68,666 14,471 27,2 43,1 29,6 0,7189 3 NL11 Groningen 71,93 65,52 43,28 4,9 5,1 9,6 41,61 19,027 66,331 14,642 30 45,6 24,4 0,6332 2 NL12 Friesland 72,18 65,96 45,53 5,7 6 10,3 36,07 18,559 65,587 15,854 29,6 44,9 25,6 0,6391 3 NL13 Drenthe 73,44 65,88 44,86 4,7 5,3 8,2 36,84 19,623 66,993 13,384 29,3 43,3 27,4 0,3346 NL2 Oost-Nederland 72,86 64,8 43,69 4,9 5,2 7,9 36,72 19,495 66,597 13,908 29,1 44,4 26,5 0,671 3 NL21 Overijssel 73,74 66,71 44,54 4,3 4,8 7,7 37,72 19,045 66,994 13,961 30,1 42 27,9 0,7039 3 NL22 Gelderland 73,53 64,62 51,74 6,6 8,4 11,2 34,14 23,168 68,203 8,6284 25,8 47,2 27,1 0,6787 3 NL23 Flevoland 73,72 67,35 48,87 4,7 4,8 8,4 39,34 18,42 67,954 13,627 26,5 39,9 33,6 0,3557 NL3 West-Nederland 75,9 69,73 50,38 3,7 3,8 6,8 33,49 19,206 68,334 12,46 23,2 37 39,8 0,8091 4 NL31 Utrecht 73,74 68,31 49,04 4,9 4,8 8,1 43,32 18,002 68,514 13,484 23,8 40 36,2 0,732 4 NL32 Noord-Holland 73,03 66,09 48,79 4,9 5,3 9,4 37,75 18,474 67,731 13,795 29,4 39,9 30,8 0,7213 4 NL33 Zuid-Holland 73,14 64,52 44,54 3,3 3,5 6,2 40,96 18,367 64,987 16,646 30,5 47,5 22 0,6592 4 NL34 Zeeland 72,97 65,61 43,26 4,4 4,9 7 44,31 17,972 67,784 14,245 30,2 42,8 26,9 0,3493 NL4 Zuid-Nederland 74,33 66,88 44,5 3,9 4,4 6,5 43,27 18,534 67,854 13,612 29 42,7 28,3 0,7513 3 NL41 Noord-Brabant 70,06 62,92 40,85 5,4 6 8,3 45,99 16,783 67,636 15,582 32,8 43,2 24 0,6527 3 NL42 Limburg (NL) 52,78 46,81 27,23 17,7 19,1 36,9 57,7 17,23 69,805 12,965 15,2 68 16,8 0,2709 PL Polska 56,26 50,83 29,47 15,7 16,5 32,3 59,5 16,185 69,335 14,481 14,5 64,8 20,7 0,3624 PL1 Centralny 54,09 49,19 23,34 17,3 17,9 33,1 62,2 15,699 69,572 14,729 16,6 67,4 16 0,2235 2 PL11 Łódzkie 57,57 51,84 33,28 14,8 15,7 31,9 57,66 16,43 69,215 14,355 13,3 63,2 23,5 0,4281 2 PL12 Mazowieckie 51,68 46,11 24,38 17,4 19 38 65,37 16,789 70,494 12,717 12,7 71,3 16 0,2361 PL2 Południowy
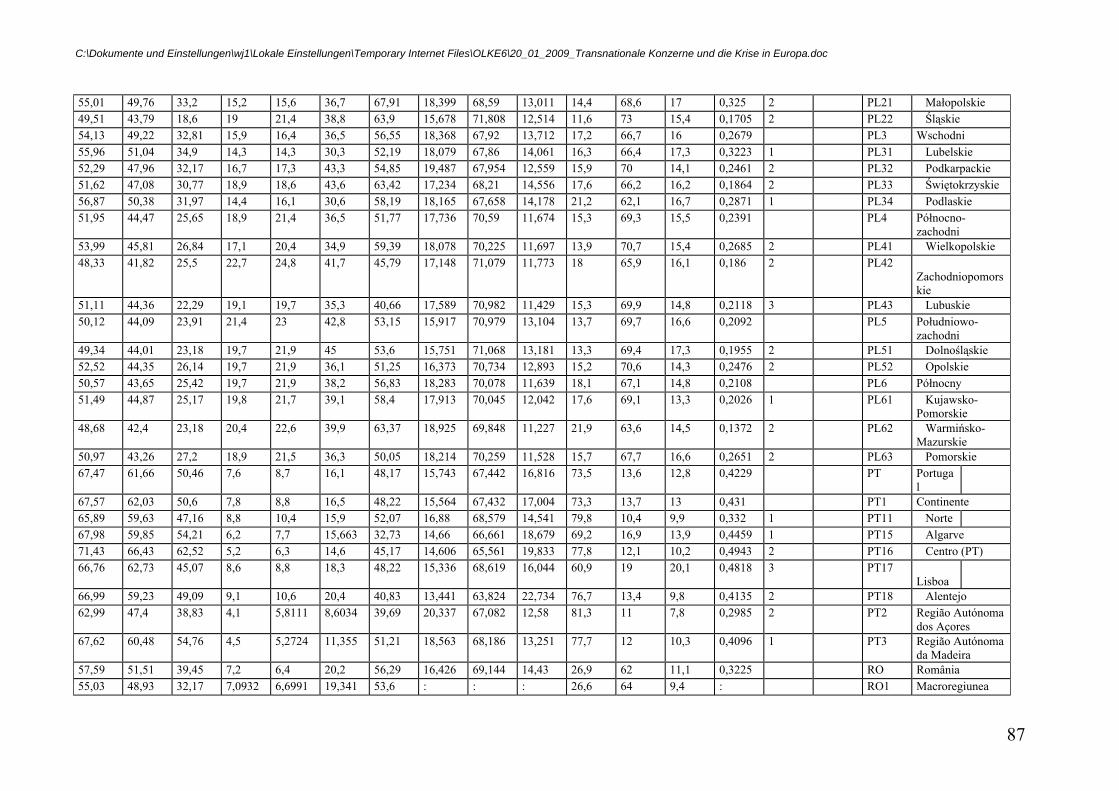
C:\Dokumente und Einstellungen\wj1\Lokale Einstellungen\Temporary Internet Files\OLKE6\20_01_2009_Transnationale Konzerne und die Krise in Europa.doc
87
55,01 49,76 33,2 15,2 15,6 36,7 67,91 18,399 68,59 13,011 14,4 68,6 17 0,325 2 PL21 Małopolskie 49,51 43,79 18,6 19 21,4 38,8 63,9 15,678 71,808 12,514 11,6 73 15,4 0,1705 2 PL22 Śląskie 54,13 49,22 32,81 15,9 16,4 36,5 56,55 18,368 67,92 13,712 17,2 66,7 16 0,2679 PL3 Wschodni 55,96 51,04 34,9 14,3 14,3 30,3 52,19 18,079 67,86 14,061 16,3 66,4 17,3 0,3223 1 PL31 Lubelskie 52,29 47,96 32,17 16,7 17,3 43,3 54,85 19,487 67,954 12,559 15,9 70 14,1 0,2461 2 PL32 Podkarpackie 51,62 47,08 30,77 18,9 18,6 43,6 63,42 17,234 68,21 14,556 17,6 66,2 16,2 0,1864 2 PL33 Świętokrzyskie 56,87 50,38 31,97 14,4 16,1 30,6 58,19 18,165 67,658 14,178 21,2 62,1 16,7 0,2871 1 PL34 Podlaskie 51,95 44,47 25,65 18,9 21,4 36,5 51,77 17,736 70,59 11,674 15,3 69,3 15,5 0,2391 PL4 Północno-
zachodni 53,99 45,81 26,84 17,1 20,4 34,9 59,39 18,078 70,225 11,697 13,9 70,7 15,4 0,2685 2 PL41 Wielkopolskie 48,33 41,82 25,5 22,7 24,8 41,7 45,79 17,148 71,079 11,773 18 65,9 16,1 0,186 2 PL42
Zachodniopomorskie
51,11 44,36 22,29 19,1 19,7 35,3 40,66 17,589 70,982 11,429 15,3 69,9 14,8 0,2118 3 PL43 Lubuskie 50,12 44,09 23,91 21,4 23 42,8 53,15 15,917 70,979 13,104 13,7 69,7 16,6 0,2092 PL5 Południowo-
zachodni 49,34 44,01 23,18 19,7 21,9 45 53,6 15,751 71,068 13,181 13,3 69,4 17,3 0,1955 2 PL51 Dolnośląskie 52,52 44,35 26,14 19,7 21,9 36,1 51,25 16,373 70,734 12,893 15,2 70,6 14,3 0,2476 2 PL52 Opolskie 50,57 43,65 25,42 19,7 21,9 38,2 56,83 18,283 70,078 11,639 18,1 67,1 14,8 0,2108 PL6 Północny 51,49 44,87 25,17 19,8 21,7 39,1 58,4 17,913 70,045 12,042 17,6 69,1 13,3 0,2026 1 PL61 Kujawsko-
Pomorskie 48,68 42,4 23,18 20,4 22,6 39,9 63,37 18,925 69,848 11,227 21,9 63,6 14,5 0,1372 2 PL62 Warmińsko-
Mazurskie 50,97 43,26 27,2 18,9 21,5 36,3 50,05 18,214 70,259 11,528 15,7 67,7 16,6 0,2651 2 PL63 Pomorskie 67,47 61,66 50,46 7,6 8,7 16,1 48,17 15,743 67,442 16,816 73,5 13,6 12,8 0,4229 PT Portuga
l
67,57 62,03 50,6 7,8 8,8 16,5 48,22 15,564 67,432 17,004 73,3 13,7 13 0,431 PT1 Continente 65,89 59,63 47,16 8,8 10,4 15,9 52,07 16,88 68,579 14,541 79,8 10,4 9,9 0,332 1 PT11 Norte 67,98 59,85 54,21 6,2 7,7 15,663 32,73 14,66 66,661 18,679 69,2 16,9 13,9 0,4459 1 PT15 Algarve 71,43 66,43 62,52 5,2 6,3 14,6 45,17 14,606 65,561 19,833 77,8 12,1 10,2 0,4943 2 PT16 Centro (PT) 66,76 62,73 45,07 8,6 8,8 18,3 48,22 15,336 68,619 16,044 60,9 19 20,1 0,4818 3 PT17
Lisboa
66,99 59,23 49,09 9,1 10,6 20,4 40,83 13,441 63,824 22,734 76,7 13,4 9,8 0,4135 2 PT18 Alentejo 62,99 47,4 38,83 4,1 5,8111 8,6034 39,69 20,337 67,082 12,58 81,3 11 7,8 0,2985 2 PT2 Região Autónoma
dos Açores 67,62 60,48 54,76 4,5 5,2724 11,355 51,21 18,563 68,186 13,251 77,7 12 10,3 0,4096 1 PT3 Região Autónoma
da Madeira 57,59 51,51 39,45 7,2 6,4 20,2 56,29 16,426 69,144 14,43 26,9 62 11,1 0,3225 RO România 55,03 48,93 32,17 7,0932 6,6991 19,341 53,6 : : : 26,6 64 9,4 : RO1 Macroregiunea
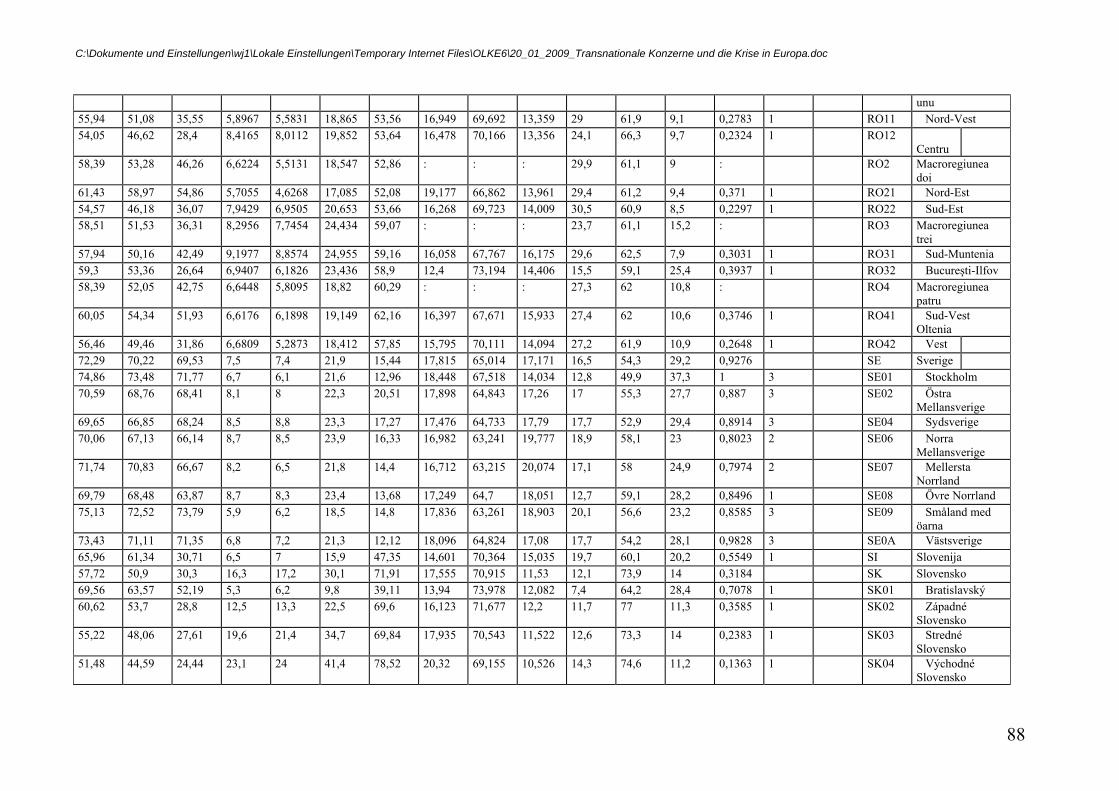
C:\Dokumente und Einstellungen\wj1\Lokale Einstellungen\Temporary Internet Files\OLKE6\20_01_2009_Transnationale Konzerne und die Krise in Europa.doc
88
unu 55,94 51,08 35,55 5,8967 5,5831 18,865 53,56 16,949 69,692 13,359 29 61,9 9,1 0,2783 1 RO11 Nord-Vest 54,05 46,62 28,4 8,4165 8,0112 19,852 53,64 16,478 70,166 13,356 24,1 66,3 9,7 0,2324 1 RO12
Centru
58,39 53,28 46,26 6,6224 5,5131 18,547 52,86 : : : 29,9 61,1 9 : RO2 Macroregiunea doi
61,43 58,97 54,86 5,7055 4,6268 17,085 52,08 19,177 66,862 13,961 29,4 61,2 9,4 0,371 1 RO21 Nord-Est 54,57 46,18 36,07 7,9429 6,9505 20,653 53,66 16,268 69,723 14,009 30,5 60,9 8,5 0,2297 1 RO22 Sud-Est 58,51 51,53 36,31 8,2956 7,7454 24,434 59,07 : : : 23,7 61,1 15,2 : RO3 Macroregiunea
trei 57,94 50,16 42,49 9,1977 8,8574 24,955 59,16 16,058 67,767 16,175 29,6 62,5 7,9 0,3031 1 RO31 Sud-Muntenia 59,3 53,36 26,64 6,9407 6,1826 23,436 58,9 12,4 73,194 14,406 15,5 59,1 25,4 0,3937 1 RO32 Bucureşti-Ilfov 58,39 52,05 42,75 6,6448 5,8095 18,82 60,29 : : : 27,3 62 10,8 : RO4 Macroregiunea
patru 60,05 54,34 51,93 6,6176 6,1898 19,149 62,16 16,397 67,671 15,933 27,4 62 10,6 0,3746 1 RO41 Sud-Vest
Oltenia 56,46 49,46 31,86 6,6809 5,2873 18,412 57,85 15,795 70,111 14,094 27,2 61,9 10,9 0,2648 1 RO42 Vest 72,29 70,22 69,53 7,5 7,4 21,9 15,44 17,815 65,014 17,171 16,5 54,3 29,2 0,9276 SE Sverige 74,86 73,48 71,77 6,7 6,1 21,6 12,96 18,448 67,518 14,034 12,8 49,9 37,3 1 3 SE01 Stockholm 70,59 68,76 68,41 8,1 8 22,3 20,51 17,898 64,843 17,26 17 55,3 27,7 0,887 3 SE02 Östra
Mellansverige 69,65 66,85 68,24 8,5 8,8 23,3 17,27 17,476 64,733 17,79 17,7 52,9 29,4 0,8914 3 SE04 Sydsverige 70,06 67,13 66,14 8,7 8,5 23,9 16,33 16,982 63,241 19,777 18,9 58,1 23 0,8023 2 SE06 Norra
Mellansverige 71,74 70,83 66,67 8,2 6,5 21,8 14,4 16,712 63,215 20,074 17,1 58 24,9 0,7974 2 SE07 Mellersta
Norrland 69,79 68,48 63,87 8,7 8,3 23,4 13,68 17,249 64,7 18,051 12,7 59,1 28,2 0,8496 1 SE08 Övre Norrland 75,13 72,52 73,79 5,9 6,2 18,5 14,8 17,836 63,261 18,903 20,1 56,6 23,2 0,8585 3 SE09 Småland med
öarna 73,43 71,11 71,35 6,8 7,2 21,3 12,12 18,096 64,824 17,08 17,7 54,2 28,1 0,9828 3 SE0A Västsverige 65,96 61,34 30,71 6,5 7 15,9 47,35 14,601 70,364 15,035 19,7 60,1 20,2 0,5549 1 SI Slovenija 57,72 50,9 30,3 16,3 17,2 30,1 71,91 17,555 70,915 11,53 12,1 73,9 14 0,3184 SK Slovensko 69,56 63,57 52,19 5,3 6,2 9,8 39,11 13,94 73,978 12,082 7,4 64,2 28,4 0,7078 1 SK01 Bratislavský 60,62 53,7 28,8 12,5 13,3 22,5 69,6 16,123 71,677 12,2 11,7 77 11,3 0,3585 1 SK02 Západné
Slovensko 55,22 48,06 27,61 19,6 21,4 34,7 69,84 17,935 70,543 11,522 12,6 73,3 14 0,2383 1 SK03 Stredné
Slovensko 51,48 44,59 24,44 23,1 24 41,4 78,52 20,32 69,155 10,526 14,3 74,6 11,2 0,1363 1 SK04 Východné
Slovensko
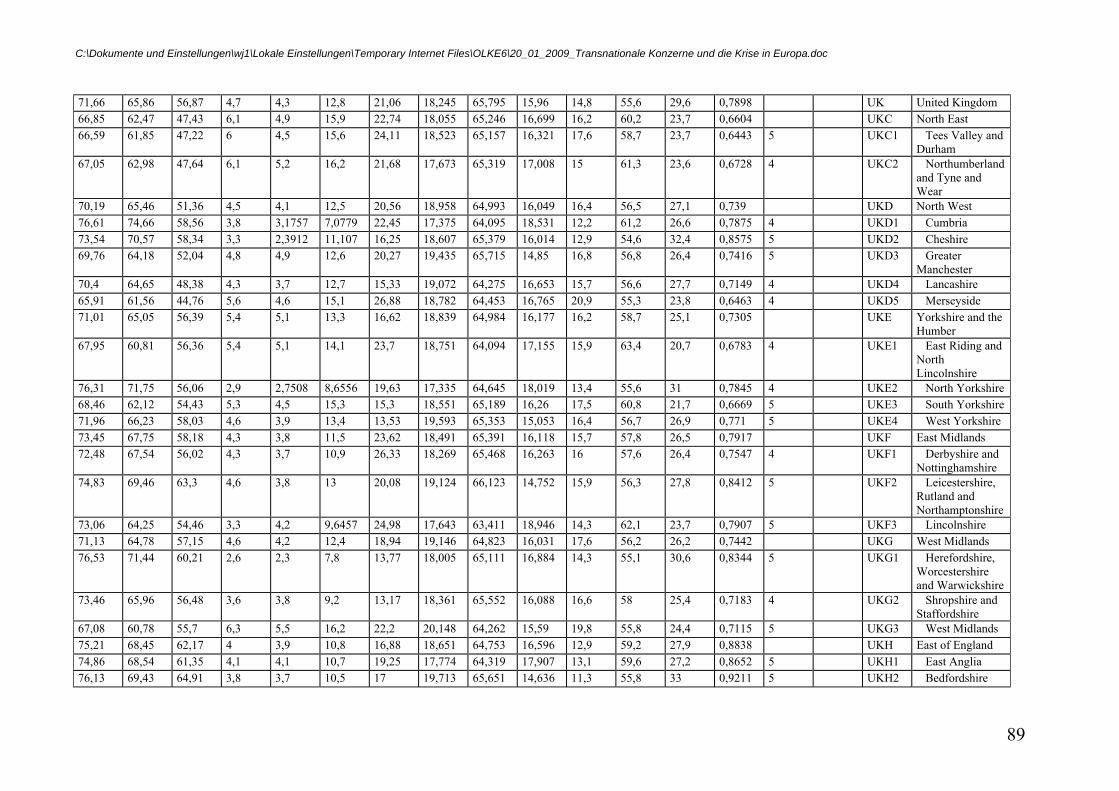
C:\Dokumente und Einstellungen\wj1\Lokale Einstellungen\Temporary Internet Files\OLKE6\20_01_2009_Transnationale Konzerne und die Krise in Europa.doc
89
71,66 65,86 56,87 4,7 4,3 12,8 21,06 18,245 65,795 15,96 14,8 55,6 29,6 0,7898 UK United Kingdom 66,85 62,47 47,43 6,1 4,9 15,9 22,74 18,055 65,246 16,699 16,2 60,2 23,7 0,6604 UKC North East 66,59 61,85 47,22 6 4,5 15,6 24,11 18,523 65,157 16,321 17,6 58,7 23,7 0,6443 5 UKC1 Tees Valley and
Durham 67,05 62,98 47,64 6,1 5,2 16,2 21,68 17,673 65,319 17,008 15 61,3 23,6 0,6728 4 UKC2 Northumberland
and Tyne and Wear
70,19 65,46 51,36 4,5 4,1 12,5 20,56 18,958 64,993 16,049 16,4 56,5 27,1 0,739 UKD North West 76,61 74,66 58,56 3,8 3,1757 7,0779 22,45 17,375 64,095 18,531 12,2 61,2 26,6 0,7875 4 UKD1 Cumbria 73,54 70,57 58,34 3,3 2,3912 11,107 16,25 18,607 65,379 16,014 12,9 54,6 32,4 0,8575 5 UKD2 Cheshire 69,76 64,18 52,04 4,8 4,9 12,6 20,27 19,435 65,715 14,85 16,8 56,8 26,4 0,7416 5 UKD3 Greater
Manchester 70,4 64,65 48,38 4,3 3,7 12,7 15,33 19,072 64,275 16,653 15,7 56,6 27,7 0,7149 4 UKD4 Lancashire 65,91 61,56 44,76 5,6 4,6 15,1 26,88 18,782 64,453 16,765 20,9 55,3 23,8 0,6463 4 UKD5 Merseyside 71,01 65,05 56,39 5,4 5,1 13,3 16,62 18,839 64,984 16,177 16,2 58,7 25,1 0,7305 UKE Yorkshire and the
Humber 67,95 60,81 56,36 5,4 5,1 14,1 23,7 18,751 64,094 17,155 15,9 63,4 20,7 0,6783 4 UKE1 East Riding and
North Lincolnshire
76,31 71,75 56,06 2,9 2,7508 8,6556 19,63 17,335 64,645 18,019 13,4 55,6 31 0,7845 4 UKE2 North Yorkshire 68,46 62,12 54,43 5,3 4,5 15,3 15,3 18,551 65,189 16,26 17,5 60,8 21,7 0,6669 5 UKE3 South Yorkshire 71,96 66,23 58,03 4,6 3,9 13,4 13,53 19,593 65,353 15,053 16,4 56,7 26,9 0,771 5 UKE4 West Yorkshire 73,45 67,75 58,18 4,3 3,8 11,5 23,62 18,491 65,391 16,118 15,7 57,8 26,5 0,7917 UKF East Midlands 72,48 67,54 56,02 4,3 3,7 10,9 26,33 18,269 65,468 16,263 16 57,6 26,4 0,7547 4 UKF1 Derbyshire and
Nottinghamshire 74,83 69,46 63,3 4,6 3,8 13 20,08 19,124 66,123 14,752 15,9 56,3 27,8 0,8412 5 UKF2 Leicestershire,
Rutland and Northamptonshire
73,06 64,25 54,46 3,3 4,2 9,6457 24,98 17,643 63,411 18,946 14,3 62,1 23,7 0,7907 5 UKF3 Lincolnshire 71,13 64,78 57,15 4,6 4,2 12,4 18,94 19,146 64,823 16,031 17,6 56,2 26,2 0,7442 UKG West Midlands 76,53 71,44 60,21 2,6 2,3 7,8 13,77 18,005 65,111 16,884 14,3 55,1 30,6 0,8344 5 UKG1 Herefordshire,
Worcestershire and Warwickshire
73,46 65,96 56,48 3,6 3,8 9,2 13,17 18,361 65,552 16,088 16,6 58 25,4 0,7183 4 UKG2 Shropshire and Staffordshire
67,08 60,78 55,7 6,3 5,5 16,2 22,2 20,148 64,262 15,59 19,8 55,8 24,4 0,7115 5 UKG3 West Midlands 75,21 68,45 62,17 4 3,9 10,8 16,88 18,651 64,753 16,596 12,9 59,2 27,9 0,8838 UKH East of England 74,86 68,54 61,35 4,1 4,1 10,7 19,25 17,774 64,319 17,907 13,1 59,6 27,2 0,8652 5 UKH1 East Anglia 76,13 69,43 64,91 3,8 3,7 10,5 17 19,713 65,651 14,636 11,3 55,8 33 0,9211 5 UKH2 Bedfordshire
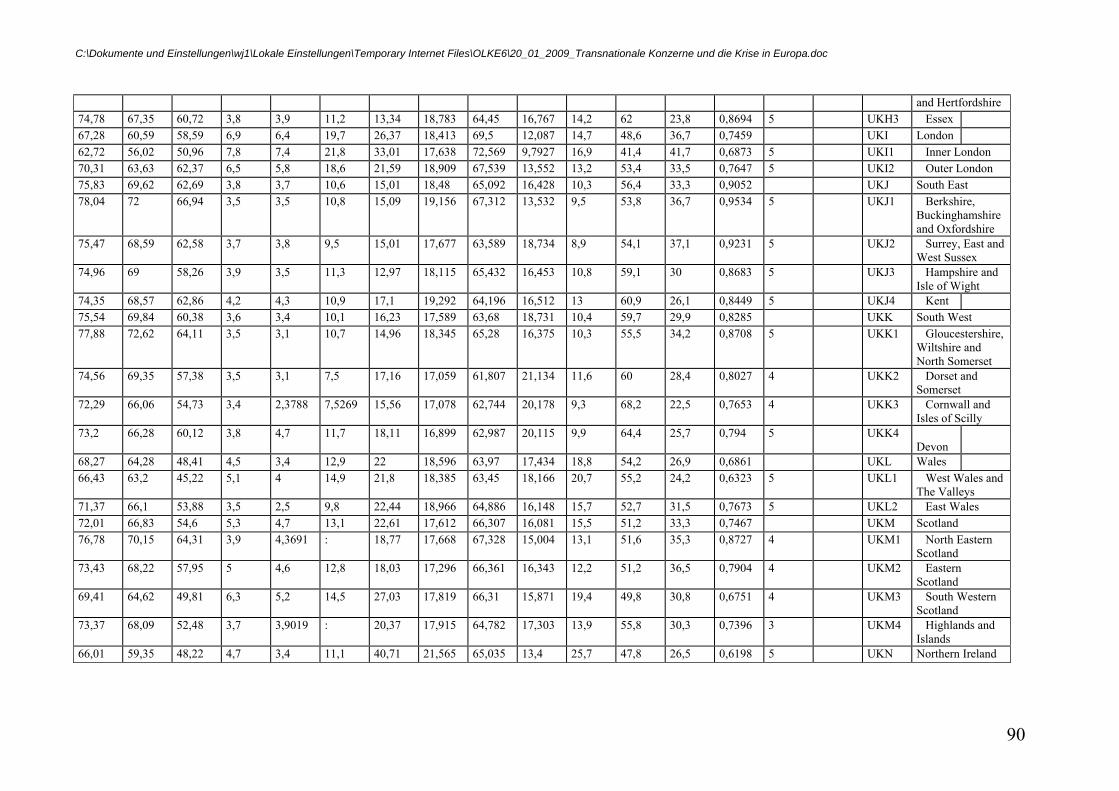
C:\Dokumente und Einstellungen\wj1\Lokale Einstellungen\Temporary Internet Files\OLKE6\20_01_2009_Transnationale Konzerne und die Krise in Europa.doc
90
and Hertfordshire 74,78 67,35 60,72 3,8 3,9 11,2 13,34 18,783 64,45 16,767 14,2 62 23,8 0,8694 5 UKH3 Essex 67,28 60,59 58,59 6,9 6,4 19,7 26,37 18,413 69,5 12,087 14,7 48,6 36,7 0,7459 UKI London 62,72 56,02 50,96 7,8 7,4 21,8 33,01 17,638 72,569 9,7927 16,9 41,4 41,7 0,6873 5 UKI1 Inner London 70,31 63,63 62,37 6,5 5,8 18,6 21,59 18,909 67,539 13,552 13,2 53,4 33,5 0,7647 5 UKI2 Outer London 75,83 69,62 62,69 3,8 3,7 10,6 15,01 18,48 65,092 16,428 10,3 56,4 33,3 0,9052 UKJ South East 78,04 72 66,94 3,5 3,5 10,8 15,09 19,156 67,312 13,532 9,5 53,8 36,7 0,9534 5 UKJ1 Berkshire,
Buckinghamshire and Oxfordshire
75,47 68,59 62,58 3,7 3,8 9,5 15,01 17,677 63,589 18,734 8,9 54,1 37,1 0,9231 5 UKJ2 Surrey, East and West Sussex
74,96 69 58,26 3,9 3,5 11,3 12,97 18,115 65,432 16,453 10,8 59,1 30 0,8683 5 UKJ3 Hampshire and Isle of Wight
74,35 68,57 62,86 4,2 4,3 10,9 17,1 19,292 64,196 16,512 13 60,9 26,1 0,8449 5 UKJ4 Kent 75,54 69,84 60,38 3,6 3,4 10,1 16,23 17,589 63,68 18,731 10,4 59,7 29,9 0,8285 UKK South West 77,88 72,62 64,11 3,5 3,1 10,7 14,96 18,345 65,28 16,375 10,3 55,5 34,2 0,8708 5 UKK1 Gloucestershire,
Wiltshire and North Somerset
74,56 69,35 57,38 3,5 3,1 7,5 17,16 17,059 61,807 21,134 11,6 60 28,4 0,8027 4 UKK2 Dorset and Somerset
72,29 66,06 54,73 3,4 2,3788 7,5269 15,56 17,078 62,744 20,178 9,3 68,2 22,5 0,7653 4 UKK3 Cornwall and Isles of Scilly
73,2 66,28 60,12 3,8 4,7 11,7 18,11 16,899 62,987 20,115 9,9 64,4 25,7 0,794 5 UKK4 Devon
68,27 64,28 48,41 4,5 3,4 12,9 22 18,596 63,97 17,434 18,8 54,2 26,9 0,6861 UKL Wales 66,43 63,2 45,22 5,1 4 14,9 21,8 18,385 63,45 18,166 20,7 55,2 24,2 0,6323 5 UKL1 West Wales and
The Valleys 71,37 66,1 53,88 3,5 2,5 9,8 22,44 18,966 64,886 16,148 15,7 52,7 31,5 0,7673 5 UKL2 East Wales 72,01 66,83 54,6 5,3 4,7 13,1 22,61 17,612 66,307 16,081 15,5 51,2 33,3 0,7467 UKM Scotland 76,78 70,15 64,31 3,9 4,3691 : 18,77 17,668 67,328 15,004 13,1 51,6 35,3 0,8727 4 UKM1 North Eastern
Scotland 73,43 68,22 57,95 5 4,6 12,8 18,03 17,296 66,361 16,343 12,2 51,2 36,5 0,7904 4 UKM2 Eastern
Scotland 69,41 64,62 49,81 6,3 5,2 14,5 27,03 17,819 66,31 15,871 19,4 49,8 30,8 0,6751 4 UKM3 South Western
Scotland 73,37 68,09 52,48 3,7 3,9019 : 20,37 17,915 64,782 17,303 13,9 55,8 30,3 0,7396 3 UKM4 Highlands and
Islands 66,01 59,35 48,22 4,7 3,4 11,1 40,71 21,565 65,035 13,4 25,7 47,8 26,5 0,6198 5 UKN Northern Ireland
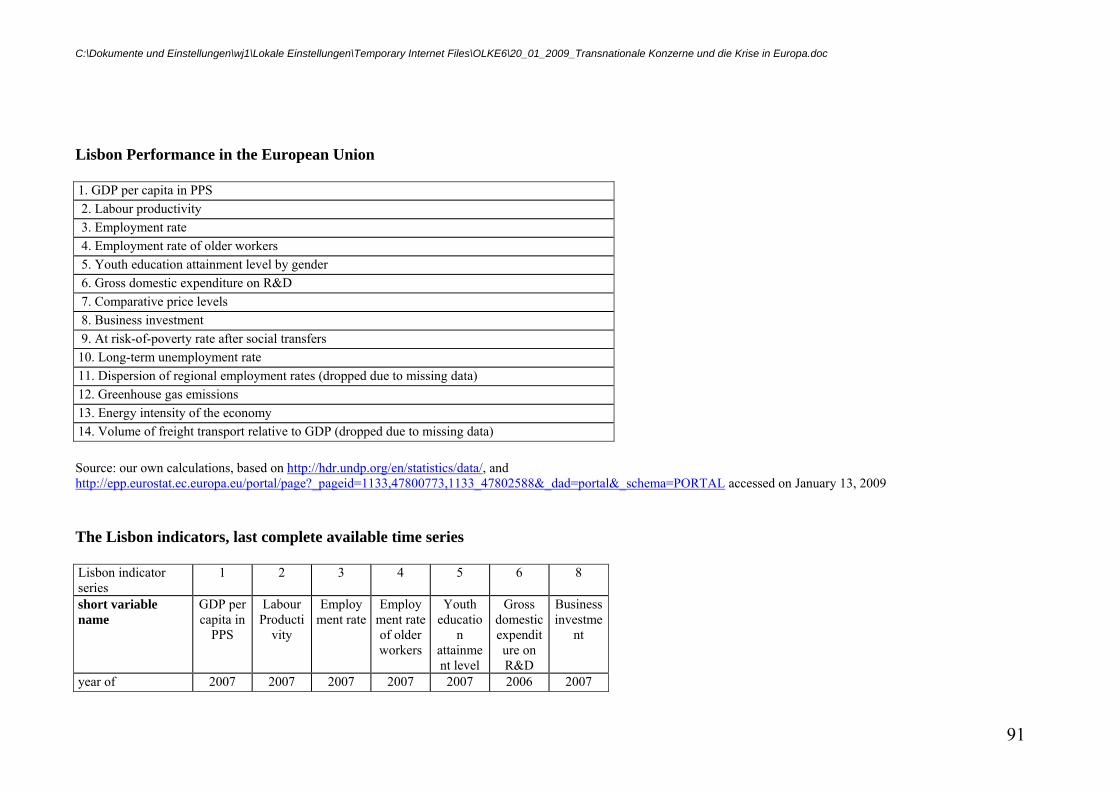
C:\Dokumente und Einstellungen\wj1\Lokale Einstellungen\Temporary Internet Files\OLKE6\20_01_2009_Transnationale Konzerne und die Krise in Europa.doc
91
Lisbon Performance in the European Union 1. GDP per capita in PPS 2. Labour productivity 3. Employment rate 4. Employment rate of older workers 5. Youth education attainment level by gender 6. Gross domestic expenditure on R&D 7. Comparative price levels 8. Business investment 9. At risk-of-poverty rate after social transfers 10. Long-term unemployment rate 11. Dispersion of regional employment rates (dropped due to missing data) 12. Greenhouse gas emissions 13. Energy intensity of the economy 14. Volume of freight transport relative to GDP (dropped due to missing data) Source: our own calculations, based on http://hdr.undp.org/en/statistics/data/, and http://epp.eurostat.ec.europa.eu/portal/page?_pageid=1133,47800773,1133_47802588&_dad=portal&_schema=PORTAL accessed on January 13, 2009 The Lisbon indicators, last complete available time series Lisbon indicator series
1 2 3 4 5 6 8
short variable name
GDP per capita in
PPS
Labour Producti
vity
Employment rate
Employment rate of older workers
Youth educatio
n attainment level
Gross domestic expenditure on R&D
Business investme
nt
year of 2007 2007 2007 2007 2007 2006 2007
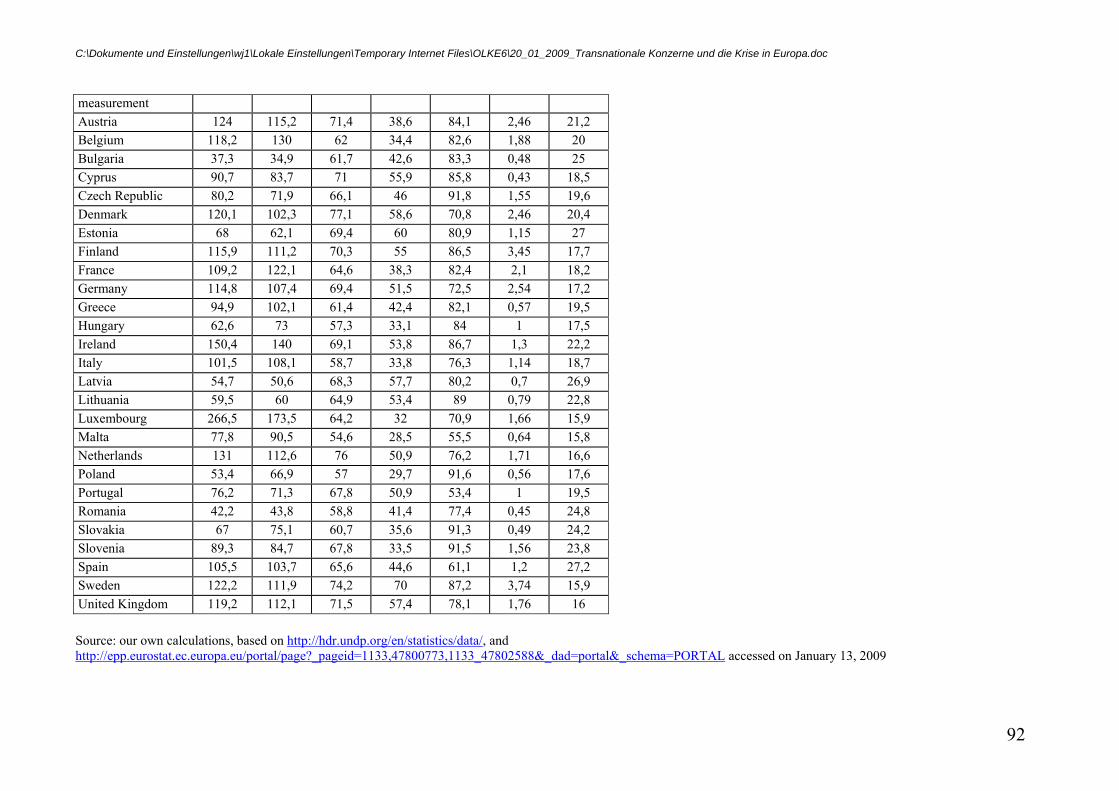
C:\Dokumente und Einstellungen\wj1\Lokale Einstellungen\Temporary Internet Files\OLKE6\20_01_2009_Transnationale Konzerne und die Krise in Europa.doc
92
measurement Austria 124 115,2 71,4 38,6 84,1 2,46 21,2 Belgium 118,2 130 62 34,4 82,6 1,88 20 Bulgaria 37,3 34,9 61,7 42,6 83,3 0,48 25 Cyprus 90,7 83,7 71 55,9 85,8 0,43 18,5 Czech Republic 80,2 71,9 66,1 46 91,8 1,55 19,6 Denmark 120,1 102,3 77,1 58,6 70,8 2,46 20,4 Estonia 68 62,1 69,4 60 80,9 1,15 27 Finland 115,9 111,2 70,3 55 86,5 3,45 17,7 France 109,2 122,1 64,6 38,3 82,4 2,1 18,2 Germany 114,8 107,4 69,4 51,5 72,5 2,54 17,2 Greece 94,9 102,1 61,4 42,4 82,1 0,57 19,5 Hungary 62,6 73 57,3 33,1 84 1 17,5 Ireland 150,4 140 69,1 53,8 86,7 1,3 22,2 Italy 101,5 108,1 58,7 33,8 76,3 1,14 18,7 Latvia 54,7 50,6 68,3 57,7 80,2 0,7 26,9 Lithuania 59,5 60 64,9 53,4 89 0,79 22,8 Luxembourg 266,5 173,5 64,2 32 70,9 1,66 15,9 Malta 77,8 90,5 54,6 28,5 55,5 0,64 15,8 Netherlands 131 112,6 76 50,9 76,2 1,71 16,6 Poland 53,4 66,9 57 29,7 91,6 0,56 17,6 Portugal 76,2 71,3 67,8 50,9 53,4 1 19,5 Romania 42,2 43,8 58,8 41,4 77,4 0,45 24,8 Slovakia 67 75,1 60,7 35,6 91,3 0,49 24,2 Slovenia 89,3 84,7 67,8 33,5 91,5 1,56 23,8 Spain 105,5 103,7 65,6 44,6 61,1 1,2 27,2 Sweden 122,2 111,9 74,2 70 87,2 3,74 15,9 United Kingdom 119,2 112,1 71,5 57,4 78,1 1,76 16 Source: our own calculations, based on http://hdr.undp.org/en/statistics/data/, and http://epp.eurostat.ec.europa.eu/portal/page?_pageid=1133,47800773,1133_47802588&_dad=portal&_schema=PORTAL accessed on January 13, 2009
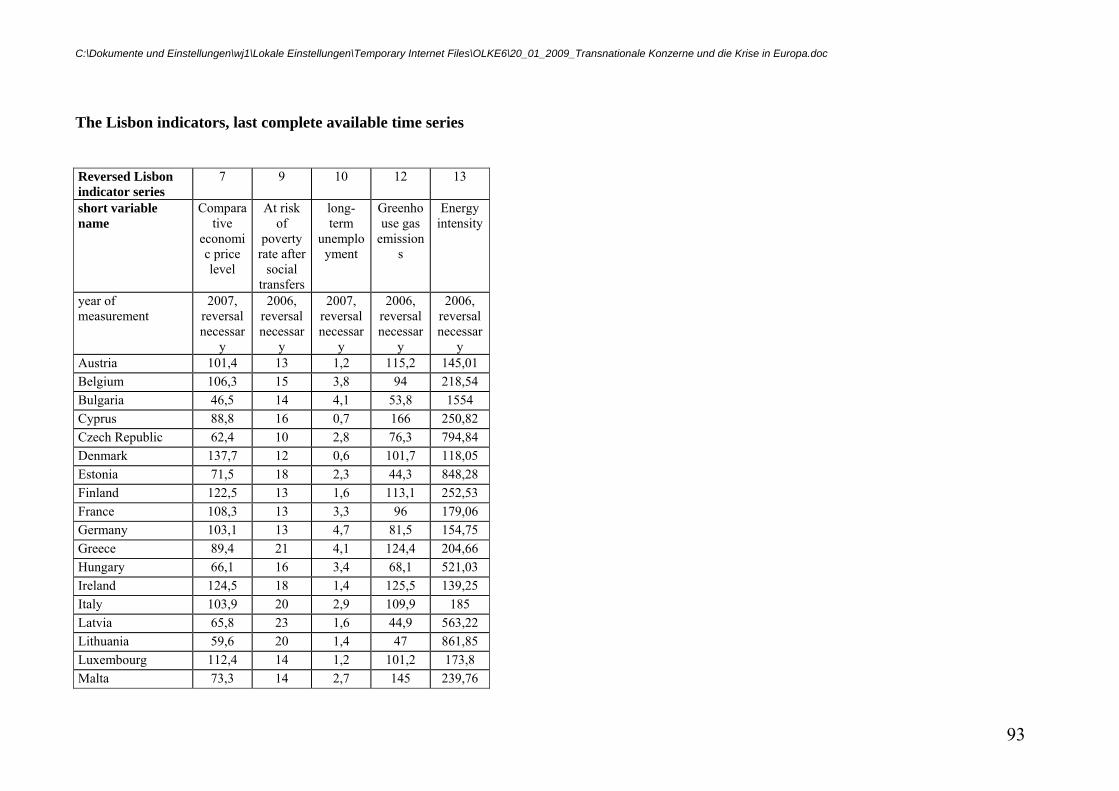
C:\Dokumente und Einstellungen\wj1\Lokale Einstellungen\Temporary Internet Files\OLKE6\20_01_2009_Transnationale Konzerne und die Krise in Europa.doc
93
The Lisbon indicators, last complete available time series Reversed Lisbon indicator series
7 9 10 12 13
short variable name
Comparative
economic price level
At risk of
poverty rate after
social transfers
long-term
unemployment
Greenhouse gas
emissions
Energy intensity
year of measurement
2007, reversal necessar
y
2006, reversal necessar
y
2007, reversal necessar
y
2006, reversal necessar
y
2006, reversal necessar
y Austria 101,4 13 1,2 115,2 145,01 Belgium 106,3 15 3,8 94 218,54 Bulgaria 46,5 14 4,1 53,8 1554 Cyprus 88,8 16 0,7 166 250,82 Czech Republic 62,4 10 2,8 76,3 794,84 Denmark 137,7 12 0,6 101,7 118,05 Estonia 71,5 18 2,3 44,3 848,28 Finland 122,5 13 1,6 113,1 252,53 France 108,3 13 3,3 96 179,06 Germany 103,1 13 4,7 81,5 154,75 Greece 89,4 21 4,1 124,4 204,66 Hungary 66,1 16 3,4 68,1 521,03 Ireland 124,5 18 1,4 125,5 139,25 Italy 103,9 20 2,9 109,9 185 Latvia 65,8 23 1,6 44,9 563,22 Lithuania 59,6 20 1,4 47 861,85 Luxembourg 112,4 14 1,2 101,2 173,8 Malta 73,3 14 2,7 145 239,76
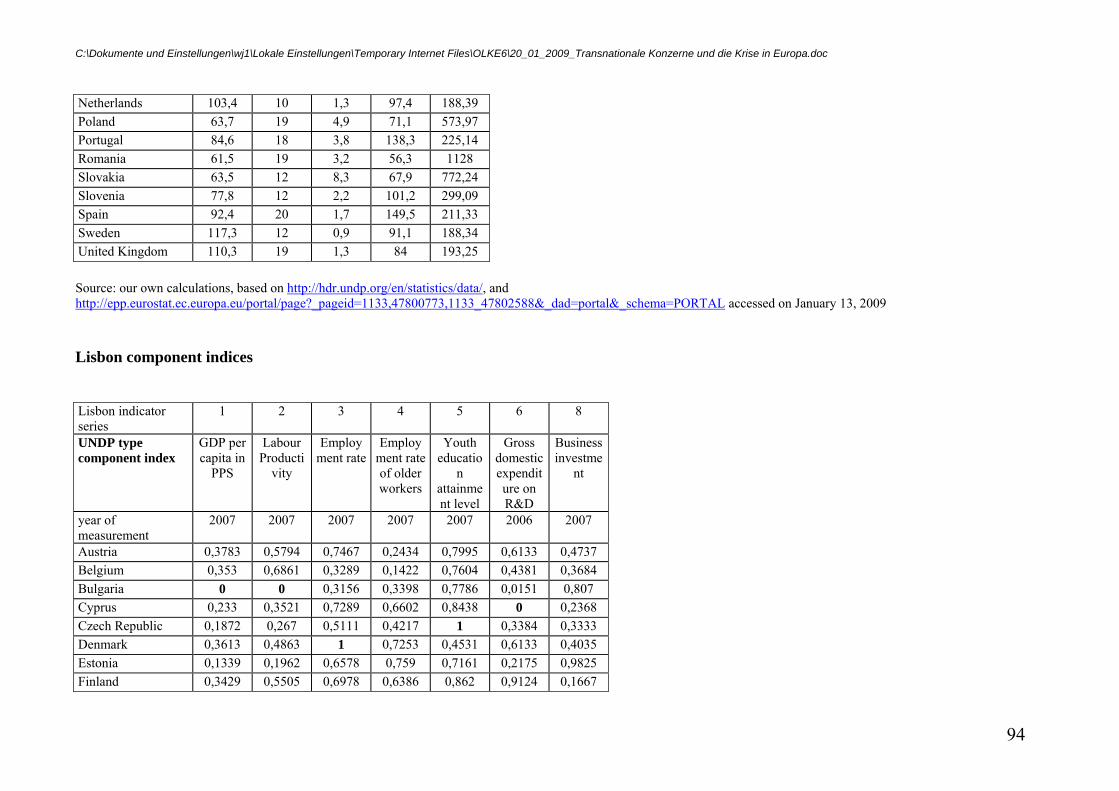
C:\Dokumente und Einstellungen\wj1\Lokale Einstellungen\Temporary Internet Files\OLKE6\20_01_2009_Transnationale Konzerne und die Krise in Europa.doc
94
Netherlands 103,4 10 1,3 97,4 188,39 Poland 63,7 19 4,9 71,1 573,97 Portugal 84,6 18 3,8 138,3 225,14 Romania 61,5 19 3,2 56,3 1128 Slovakia 63,5 12 8,3 67,9 772,24 Slovenia 77,8 12 2,2 101,2 299,09 Spain 92,4 20 1,7 149,5 211,33 Sweden 117,3 12 0,9 91,1 188,34 United Kingdom 110,3 19 1,3 84 193,25 Source: our own calculations, based on http://hdr.undp.org/en/statistics/data/, and http://epp.eurostat.ec.europa.eu/portal/page?_pageid=1133,47800773,1133_47802588&_dad=portal&_schema=PORTAL accessed on January 13, 2009 Lisbon component indices Lisbon indicator series
1 2 3 4 5 6 8
UNDP type component index
GDP per capita in
PPS
Labour Producti
vity
Employment rate
Employment rate of older workers
Youth educatio
n attainment level
Gross domestic expenditure on R&D
Business investme
nt
year of measurement
2007 2007 2007 2007 2007 2006 2007
Austria 0,3783 0,5794 0,7467 0,2434 0,7995 0,6133 0,4737 Belgium 0,353 0,6861 0,3289 0,1422 0,7604 0,4381 0,3684 Bulgaria 0 0 0,3156 0,3398 0,7786 0,0151 0,807 Cyprus 0,233 0,3521 0,7289 0,6602 0,8438 0 0,2368 Czech Republic 0,1872 0,267 0,5111 0,4217 1 0,3384 0,3333 Denmark 0,3613 0,4863 1 0,7253 0,4531 0,6133 0,4035 Estonia 0,1339 0,1962 0,6578 0,759 0,7161 0,2175 0,9825 Finland 0,3429 0,5505 0,6978 0,6386 0,862 0,9124 0,1667
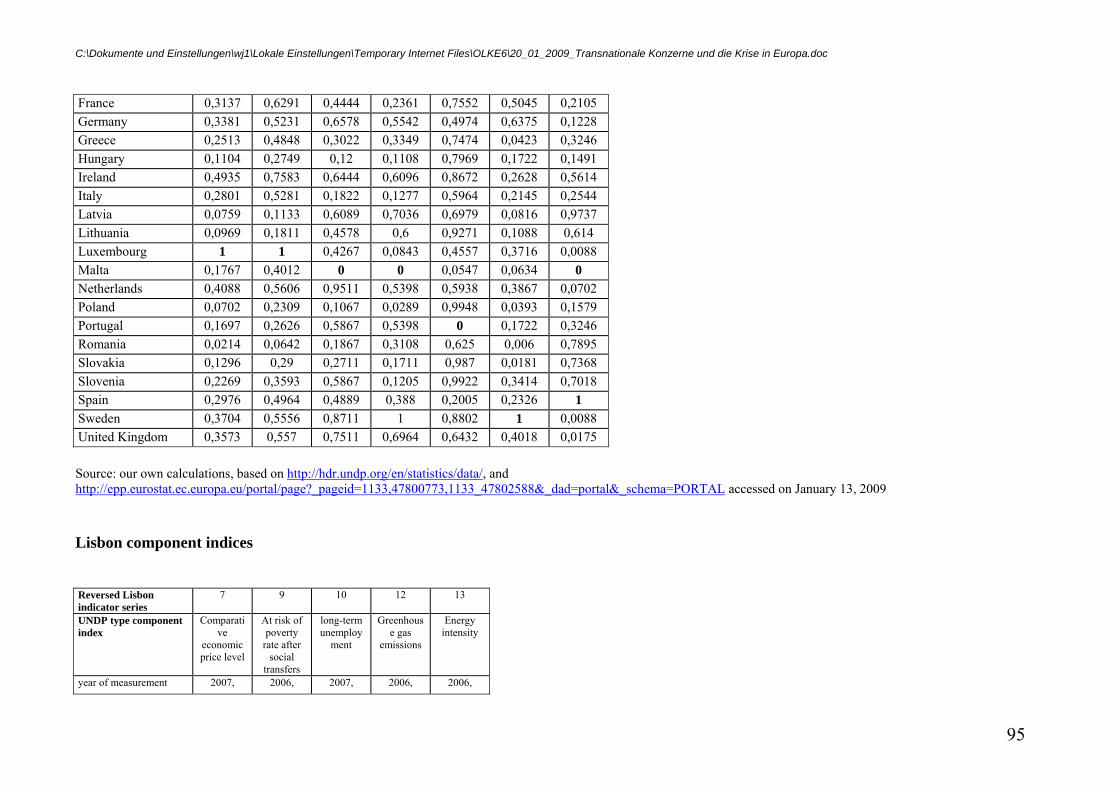
C:\Dokumente und Einstellungen\wj1\Lokale Einstellungen\Temporary Internet Files\OLKE6\20_01_2009_Transnationale Konzerne und die Krise in Europa.doc
95
France 0,3137 0,6291 0,4444 0,2361 0,7552 0,5045 0,2105 Germany 0,3381 0,5231 0,6578 0,5542 0,4974 0,6375 0,1228 Greece 0,2513 0,4848 0,3022 0,3349 0,7474 0,0423 0,3246 Hungary 0,1104 0,2749 0,12 0,1108 0,7969 0,1722 0,1491 Ireland 0,4935 0,7583 0,6444 0,6096 0,8672 0,2628 0,5614 Italy 0,2801 0,5281 0,1822 0,1277 0,5964 0,2145 0,2544 Latvia 0,0759 0,1133 0,6089 0,7036 0,6979 0,0816 0,9737 Lithuania 0,0969 0,1811 0,4578 0,6 0,9271 0,1088 0,614 Luxembourg 1 1 0,4267 0,0843 0,4557 0,3716 0,0088 Malta 0,1767 0,4012 0 0 0,0547 0,0634 0 Netherlands 0,4088 0,5606 0,9511 0,5398 0,5938 0,3867 0,0702 Poland 0,0702 0,2309 0,1067 0,0289 0,9948 0,0393 0,1579 Portugal 0,1697 0,2626 0,5867 0,5398 0 0,1722 0,3246 Romania 0,0214 0,0642 0,1867 0,3108 0,625 0,006 0,7895 Slovakia 0,1296 0,29 0,2711 0,1711 0,987 0,0181 0,7368 Slovenia 0,2269 0,3593 0,5867 0,1205 0,9922 0,3414 0,7018 Spain 0,2976 0,4964 0,4889 0,388 0,2005 0,2326 1 Sweden 0,3704 0,5556 0,8711 1 0,8802 1 0,0088 United Kingdom 0,3573 0,557 0,7511 0,6964 0,6432 0,4018 0,0175 Source: our own calculations, based on http://hdr.undp.org/en/statistics/data/, and http://epp.eurostat.ec.europa.eu/portal/page?_pageid=1133,47800773,1133_47802588&_dad=portal&_schema=PORTAL accessed on January 13, 2009 Lisbon component indices Reversed Lisbon indicator series
7 9 10 12 13
UNDP type component index
Comparative
economic price level
At risk of poverty
rate after social
transfers
long-term unemploy
ment
Greenhouse gas
emissions
Energy intensity
year of measurement 2007, 2006, 2007, 2006, 2006,
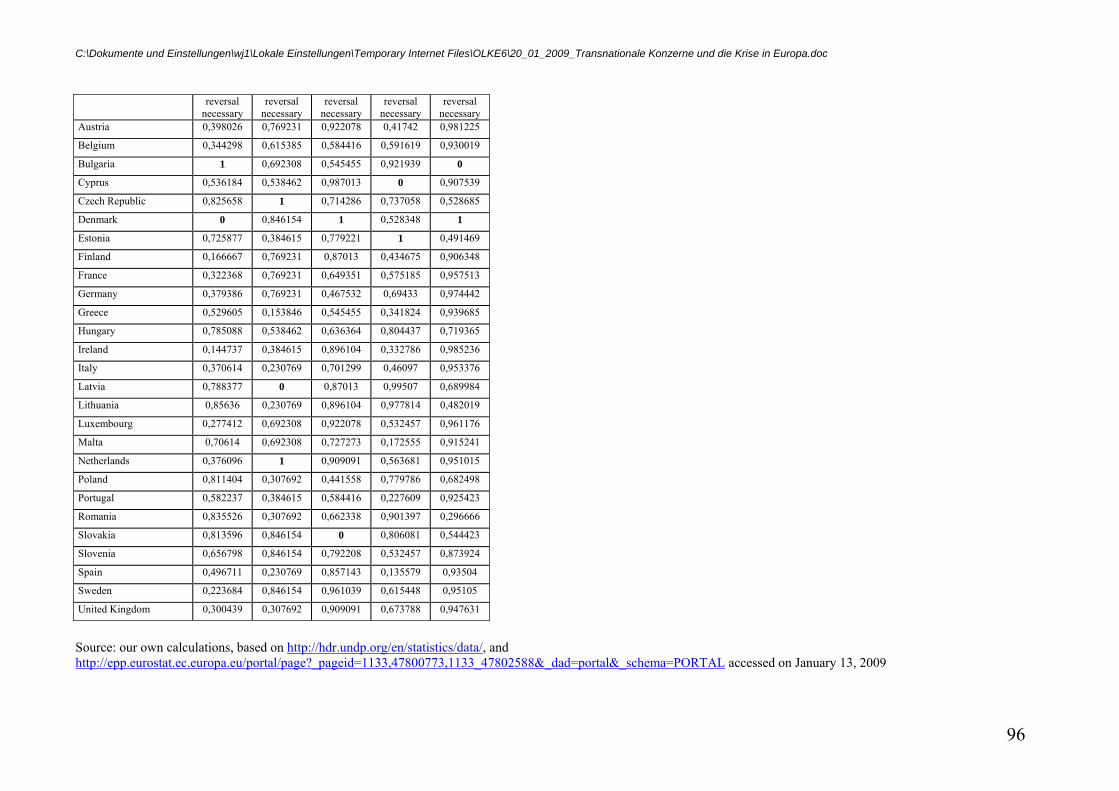
C:\Dokumente und Einstellungen\wj1\Lokale Einstellungen\Temporary Internet Files\OLKE6\20_01_2009_Transnationale Konzerne und die Krise in Europa.doc
96
reversal necessary
reversal necessary
reversal necessary
reversal necessary
reversal necessary
Austria 0,398026 0,769231 0,922078 0,41742 0,981225
Belgium 0,344298 0,615385 0,584416 0,591619 0,930019
Bulgaria 1 0,692308 0,545455 0,921939 0
Cyprus 0,536184 0,538462 0,987013 0 0,907539
Czech Republic 0,825658 1 0,714286 0,737058 0,528685
Denmark 0 0,846154 1 0,528348 1
Estonia 0,725877 0,384615 0,779221 1 0,491469
Finland 0,166667 0,769231 0,87013 0,434675 0,906348
France 0,322368 0,769231 0,649351 0,575185 0,957513
Germany 0,379386 0,769231 0,467532 0,69433 0,974442
Greece 0,529605 0,153846 0,545455 0,341824 0,939685
Hungary 0,785088 0,538462 0,636364 0,804437 0,719365
Ireland 0,144737 0,384615 0,896104 0,332786 0,985236
Italy 0,370614 0,230769 0,701299 0,46097 0,953376
Latvia 0,788377 0 0,87013 0,99507 0,689984
Lithuania 0,85636 0,230769 0,896104 0,977814 0,482019
Luxembourg 0,277412 0,692308 0,922078 0,532457 0,961176
Malta 0,70614 0,692308 0,727273 0,172555 0,915241
Netherlands 0,376096 1 0,909091 0,563681 0,951015
Poland 0,811404 0,307692 0,441558 0,779786 0,682498
Portugal 0,582237 0,384615 0,584416 0,227609 0,925423
Romania 0,835526 0,307692 0,662338 0,901397 0,296666
Slovakia 0,813596 0,846154 0 0,806081 0,544423
Slovenia 0,656798 0,846154 0,792208 0,532457 0,873924
Spain 0,496711 0,230769 0,857143 0,135579 0,93504
Sweden 0,223684 0,846154 0,961039 0,615448 0,95105
United Kingdom 0,300439 0,307692 0,909091 0,673788 0,947631
Source: our own calculations, based on http://hdr.undp.org/en/statistics/data/, and http://epp.eurostat.ec.europa.eu/portal/page?_pageid=1133,47800773,1133_47802588&_dad=portal&_schema=PORTAL accessed on January 13, 2009
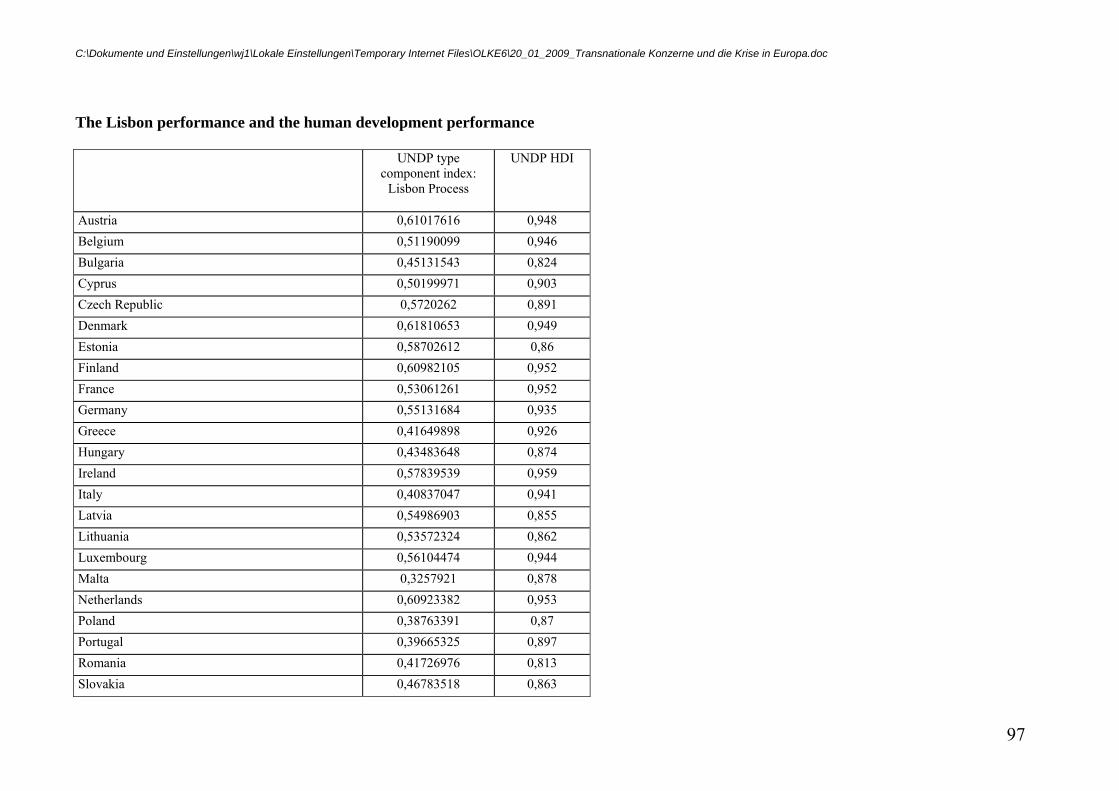
C:\Dokumente und Einstellungen\wj1\Lokale Einstellungen\Temporary Internet Files\OLKE6\20_01_2009_Transnationale Konzerne und die Krise in Europa.doc
97
The Lisbon performance and the human development performance
UNDP type component index:
Lisbon Process
UNDP HDI
Austria 0,61017616 0,948 Belgium 0,51190099 0,946 Bulgaria 0,45131543 0,824 Cyprus 0,50199971 0,903 Czech Republic 0,5720262 0,891 Denmark 0,61810653 0,949 Estonia 0,58702612 0,86 Finland 0,60982105 0,952 France 0,53061261 0,952 Germany 0,55131684 0,935 Greece 0,41649898 0,926 Hungary 0,43483648 0,874 Ireland 0,57839539 0,959 Italy 0,40837047 0,941 Latvia 0,54986903 0,855 Lithuania 0,53572324 0,862 Luxembourg 0,56104474 0,944 Malta 0,3257921 0,878 Netherlands 0,60923382 0,953 Poland 0,38763391 0,87 Portugal 0,39665325 0,897 Romania 0,41726976 0,813 Slovakia 0,46783518 0,863
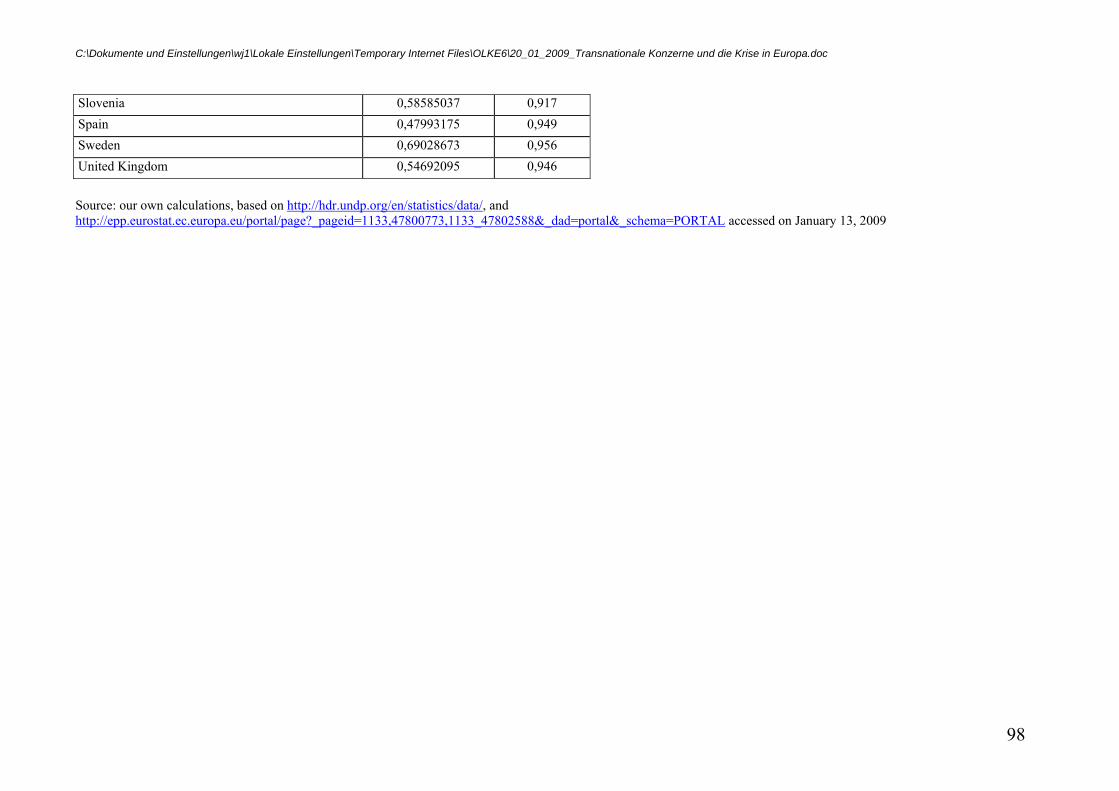
C:\Dokumente und Einstellungen\wj1\Lokale Einstellungen\Temporary Internet Files\OLKE6\20_01_2009_Transnationale Konzerne und die Krise in Europa.doc
98
Slovenia 0,58585037 0,917 Spain 0,47993175 0,949 Sweden 0,69028673 0,956 United Kingdom 0,54692095 0,946
Source: our own calculations, based on http://hdr.undp.org/en/statistics/data/, and http://epp.eurostat.ec.europa.eu/portal/page?_pageid=1133,47800773,1133_47802588&_dad=portal&_schema=PORTAL accessed on January 13, 2009
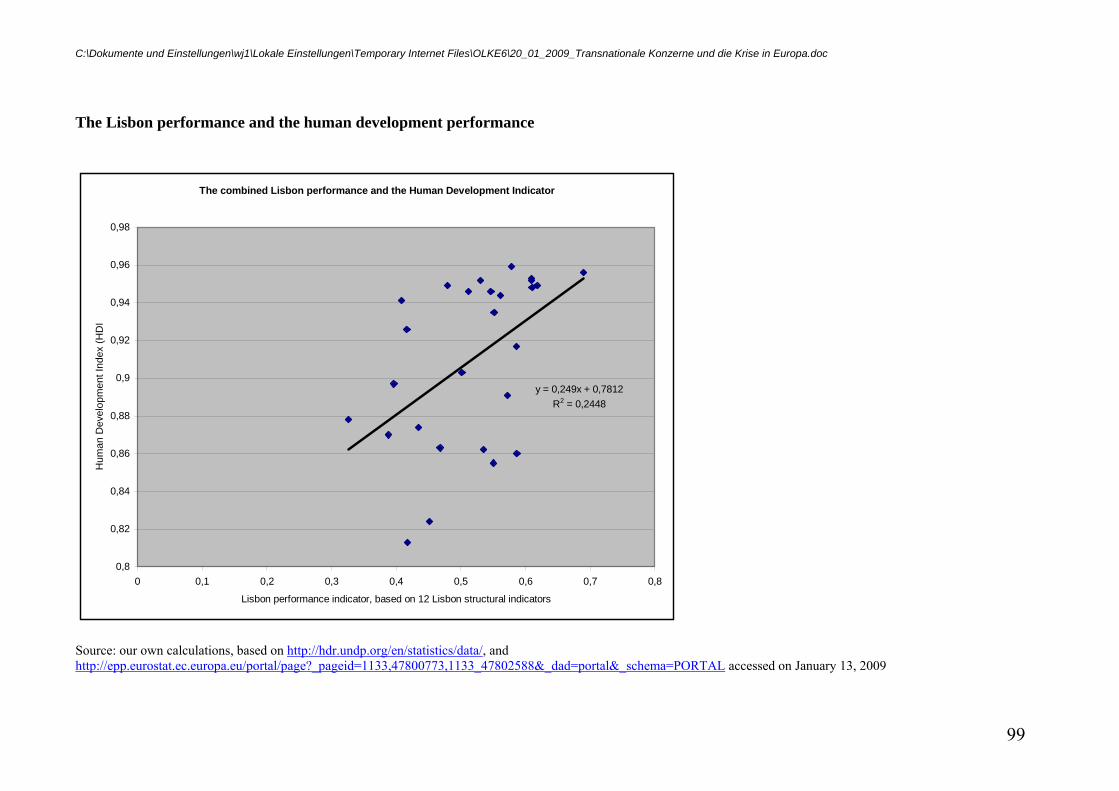
C:\Dokumente und Einstellungen\wj1\Lokale Einstellungen\Temporary Internet Files\OLKE6\20_01_2009_Transnationale Konzerne und die Krise in Europa.doc
99
The Lisbon performance and the human development performance
The combined Lisbon performance and the Human Development Indicator
y = 0,249x + 0,7812R2 = 0,2448
0,8
0,82
0,84
0,86
0,88
0,9
0,92
0,94
0,96
0,98
0 0,1 0,2 0,3 0,4 0,5 0,6 0,7 0,8
Lisbon performance indicator, based on 12 Lisbon structural indicators
Hum
an D
evel
opm
ent I
ndex
(HD
I
Source: our own calculations, based on http://hdr.undp.org/en/statistics/data/, and http://epp.eurostat.ec.europa.eu/portal/page?_pageid=1133,47800773,1133_47802588&_dad=portal&_schema=PORTAL accessed on January 13, 2009
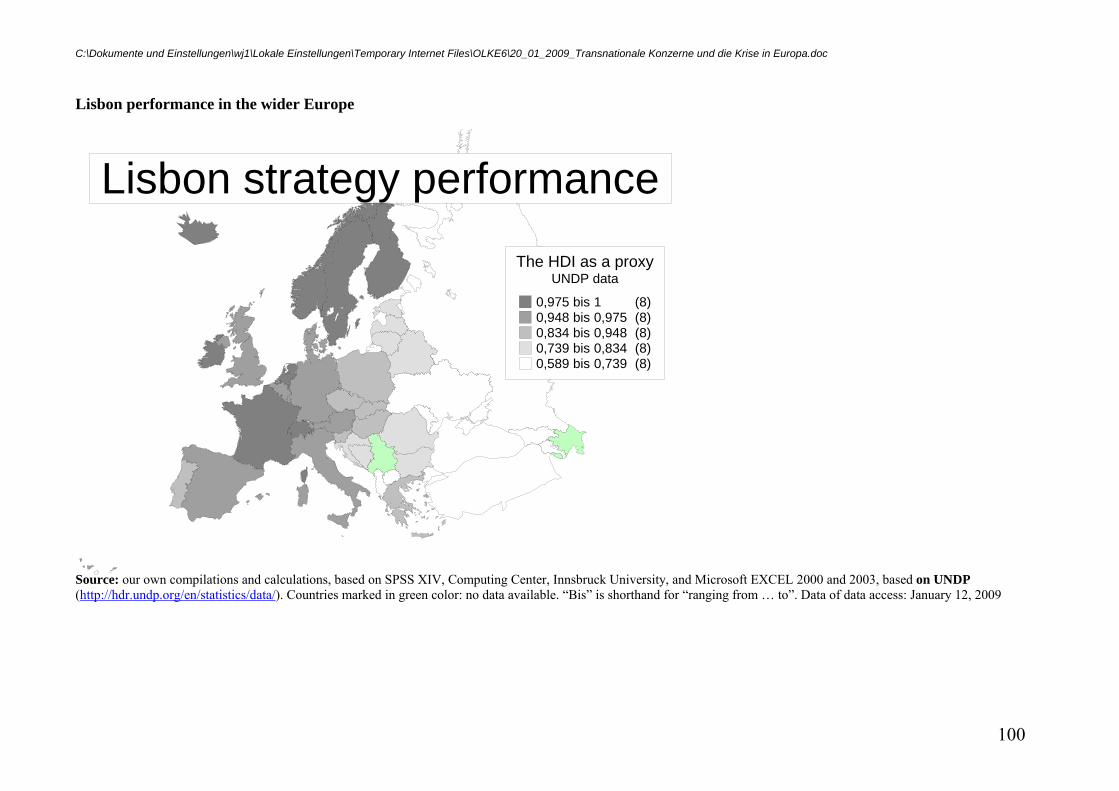
C:\Dokumente und Einstellungen\wj1\Lokale Einstellungen\Temporary Internet Files\OLKE6\20_01_2009_Transnationale Konzerne und die Krise in Europa.doc
100
Lisbon performance in the wider Europe
The HDI as a proxyUNDP data
0,975 bis 1 (8)0,948 bis 0,975 (8)0,834 bis 0,948 (8)0,739 bis 0,834 (8)0,589 bis 0,739 (8)
Lisbon strategy performance
Source: our own compilations and calculations, based on SPSS XIV, Computing Center, Innsbruck University, and Microsoft EXCEL 2000 and 2003, based on UNDP (http://hdr.undp.org/en/statistics/data/). Countries marked in green color: no data available. “Bis” is shorthand for “ranging from … to”. Data of data access: January 12, 2009
C:\Dokumente und Einstellungen\wj1\Lokale Einstellungen\Temporary Internet Files\OLKE6\20_01_2009_Transnationale
Konzerne und die Krise in Europa.doc
101
Elektronische Quellen:
• http://ec.europa.eu/regional_policy/sources/docoffic/official/reports/interim5_en.htm • • http://ec.europa.eu/regional_policy/sources/docoffic/official/repor_de.htm • • http://ec.europa.eu/regional_policy/sources/docoffic/official/reports/cohesion4/index_de.htm
• Lexis Nexis University International Press
• http://www.wiwi.uni-marburg.de/Lehrstuehle/VWL/FiWi/f2/Mitarbeiter/feld.html •
Berichtswesen der GD Regionalpolitik: Kohäsionsberichte Fünfter Zwischenbericht über den wirtschaftlichen und sozialen Zusammenhalt (18. Juni 2008) Vierter Bericht über den wirtschaftlichen und sozialen Zusammenhalt (30. Mai 2007) Vierter Zwischenbericht über den wirtschaftlichen und sozialen Zusammenhalt (12. Juni 2006) Dritter Zwischenbericht über den wirtschaftlichen und sozialen Zusammenhalt (17. Mai 2005) Dritter Bericht über den wirtschaftlichen und sozialen Zusammenhalt (Februar 2004) Zweiter Zwischenbericht über den wirtschaftlichen und sozialen Zusammenhalt (Januar 2003) Erster Zwischenbericht über den wirtschaftlichen und sozialen Zusammenhalt (Januar 2002)
C:\Dokumente und Einstellungen\wj1\Lokale Einstellungen\Temporary Internet Files\OLKE6\20_01_2009_Transnationale
Konzerne und die Krise in Europa.doc
102
Weiterführende Literatur
Abbott J. P. and Worth O. (2002), ‘Critical Perspectives on International Political Economy‘ London and Basingstoke: Palgrave Macmillan.
Afheldt H. (1994), ‘Wohlstand fuer niemand? Die Marktwirtschaft entlaesst ihre Kinder’ Munich: Kunstmann.
Aghion Ph. and Williamson J. G. (1998), ‘Growth, Inequality and Globalization. Theory, History and Policy’ Cambridge: at the University Press.
Agnew J. (2001), ‘The New Global Economy: Time-Space Compression, Geopolitics, and Global Uneven Development’ Journal of World-Systems Research, available at: http://jwsr.ucr.edu/index.phpVII, 2, Fall: 133-154.
Aiginger K. and Guger A. (2005a), ‘The European Socio-economic Model. Differences to the USA and Changes Over Time’, London School of Economics – European Social Model Programme – Tandem Project to the British EU Presidency, 42 pages, available at: http://publikationen.wifo.ac.at/pls/wifosite/wifosite.wifo_search.frameset?p_filename=MONOGRAPHIEN/PRIVATE26369/S_2005_EUROPEAN_MODEL_25777$.PDF .
Aiginger K. and Guger A. (2005b), ‚Das europäische Gesellschaftsmodell’ Austrian Institute for Economic Research (WIFO) (Studie im Auftrag des Bundesministeriums für Wirtschaft und Arbeit, restricted).
Alderson A. and Nielsen F. (1999), ‚Income Inequality, Development and Dependence: A Reconsideration’ American Sociological Review, 64, 4, August: 606 – 631.
Alderson A. S., Beckfield J. and Nielsen F. (2005), ‘Income Inequality Trends in Core Societies’ in ‘The Future of World Society’ (Herkenrath M. et al. (Eds.)) pp. 253 – 271; Sociological Institute, University of Zurich: Intelligent Book Production.
Alexandratos N., Bruinsma J. and Yotopoulos P. A. (1983), ‘Agriculture from the perspective of population growth: some results from "Agriculture: toward 2000"’ Rome: Food and Agriculture Organization of the United Nations, (FAO economic and social development paper; 30).
Amsden A. H. et al. (1994), 'From Pseudo - Socialism to Pseudo - Capitalism: Eastern Europe's First Five Years' Internationale Politik und Gesellschaft. International Politics and Society (Friedrich Ebert Foundation), 2: 107 - 116.
Angresano J. (1994), 'Evolving Socio - economic Conditions in Central and Eastern Europe: A Myrdalian View' Development Policy Review, 12: 251 - 275.
Arrighi G. (1989), 'The Developmentalist Illusion: A Reconceptualization of the Semiperiphery' paper, presented at the Thirteenth Annual Political Economy of the World System Conference, University of Illinois at Urbana - Champaign, April 28 - 30.
Arrighi G. (1991), 'World Income Inequalities and the Future of Socialism' Fernand Braudel Centre, State University of New York at Binghamton.
Arrighi G. et al. (1996b), ‘Modelling Zones of the World-Economy: A Polynomial Regression Analysis (1964-1994)’ State University of New York at Binghamton: Fernand Braudel Center.
Axtmann R. (1995) 'Kulturelle Globalisierung, kollektive Identitaet und demokratischer Nationalstaat' Leviathan, 1: 87 - 101.
Babones S. J. (2002), ‘Population and Sample Selection Effects in Measuring International Income Inequality’ Journal of World-Systems Research, available at: http://jwsr.ucr.edu/index.phpVIII, 1, Winter: 8 – 28.
Babones S. J. (2005), ‘The Country-Level Income Structure of the World Economy’ Journal of World-Systems Research, available at: http://jwsr.ucr.edu/index.phpXI, 1, July: 29 – 55.
Bailey P.; Parisotto A. and Renshaw G. (1993), 'Multinationals and Employment. The Global Economy of the 1990s' Geneva: International Labor Office.
Baran P. A. (1957), 'The Political Economy of Growth' New York: Monthly Review Press. Barta V. and Richter S. (1996), ‘Eastern Enlargement of the European Union from a Western
and an Eastern Persepctive’ Research Reports, 227, Vienna Institute for Comparative
C:\Dokumente und Einstellungen\wj1\Lokale Einstellungen\Temporary Internet Files\OLKE6\20_01_2009_Transnationale
Konzerne und die Krise in Europa.doc
103
Economic Studies. Bauer P. (1998), ‘Die Union vor der Osterweiterung. Die Transformationsstaaten - Von der
Startlinie ins Abseits?’ Oesterreichische Zeitschrift fuer Politikwissenschaft, 27, 4: 363 - 376.
Beaud M. (1990), 'Histoire du capitalisme de 1500 à nos jours' 4e édition revue et corrigée en 1990, Paris: Éditions du Seuil.
Beer L. (1999), ‘Income Inequality and Transnational Corporate Penetration’ Journal of World Systems Research, 5, 1: 1 – 25.
Beer L. and Boswell T. (2002), ‘The Resilience of Dependency Effects in Explaining Income Inequality in the Global Economy: A Cross-National Analysis, 1975 – 1995’. Journal of World-Systems Research, available at: http://jwsr.ucr.edu/index.phpVIII, 1, Winter 2002: 30 – 59.
Bergesen A. and Fernandez R. (1999), ‘Who Has the Most Fortune 500 Firms? A Network Analysis of Global Economic Competition, 1956 - 89’ in ‘The Future of Global Conflict’ (Bornschier V. and Chase-Dunn Ch. K. (Eds.)), pp. 151 - 173, London, Thousand Oaks and New Delhi: Sage Publications.
Bergesen A. J. and Bata M. (2002), ‘Global and National Inequality: Are They Connected?’ Journal of World-Systems Research, available at: http://jwsr.ucr.edu/index.phpVIII, 1, Winter: 130 – 144.
Berry A. et al. (1981), 'The Level of World Inequality: How Much Canada One Say?' Document 38, Laboratoire d'Economie Politique, CNRS, 45, rue d'Ulm, F - 75230 Paris Cedex 05.
Bhaduri A. and Laski K. (1996), ‘Lessons to be drawn from main mistakes in the transition strategy’ Paper, presented at the ‘Colloquium on Economic Transformation and Development of Central and Eastern Europe’, OECD, Paris, 29/30 May 1996.
Bitter C., Mulligan G. and Dall’erba S. (2007), Incorporating spatial variation in housing attribute prices: A comparison of geographically weighted regression and the spatial expansion method, Journal of Geographical Systems, 9 (1), 7-27.
Bornschier V. (1976), 'Wachstum, Konzentration und Multinationalisierung von Industrieunternehmen' Frauenfeld and Stuttgart: Huber.
Bornschier V. (2002), ‘Changing Income Inequality in the Second Half of the 20th Century: Preliminary Findings and Propositions For Explanations” Journal of World-Systems Research, available at: http://jwsr.ucr.edu/index.phpVIII, 1, Winter: 100 – 127.
Bornschier V. and Ballmer-Cao, T. H. (1979), ‘Income Inequality: A Cross-National Study of the Relationships Between MNC-Penetration, Dimensions of the Power Structure and Income Distribution.’ American Sociological Review, 44, pps. 438-506.
Bornschier V. and Chase-Dunn Ch. K (1985), 'Transnational Corporations and Underdevelopment' N.Y., N.Y.: Praeger.
Bornschier V. and Heintz P., reworked and enlarged by Th. H. Ballmer - Cao and J. Scheidegger (1979), 'Compendium of Data for World Systems Analysis' Machine readable data file, Zurich: Department of Sociology, Zurich University.
Bornschier V. et al. (1980), 'Multinationale Konzerne, Wirtschaftspolitik und nationale Entwicklung im Weltsystem' Frankfurt a.M.: Campus.
Bornschier V., Chase-Dunn Ch. and Rubinson R. (1977), ‘Cross-National Evidence of the Effects of Foreign Investment and Aid on Economic Growth and Inequality: A Survey of Findings and a Reanalysis.’ American Journal of Sociology, 84, pps. 487-506.
Boswell T. and Dixon W.J. (1990), 'Dependency and Rebellion: A Cross - National Analysis' American Sociological Review, 55, August: 540 - 559.
Botsford D. (1997), ‘Britain and the European Union: How we got in and why we should get out’ Foreign Policy Perspectives, 28; also available on the Internet at: http://www.capital.demon.co.uk/LA/foreign/briteuro.txt.
Boxberger G. and Klimenta H. (1998), ‘Die 10 Globalisierungslügen. Alternativen zur Allmacht des Marktes’ Munich: dtv.
Bradshaw Y. and Huang J. (1991), 'Intensifying Global Dependency. Foreign Debt, Structural Adjustment, and Third - World Underdevelopment' Sociological Quarterly, 32, 3: 321 - 342.
Breedlove W. L. and Armer J. M. (1996), ‘Economic Disarticulation and Social Development in
C:\Dokumente und Einstellungen\wj1\Lokale Einstellungen\Temporary Internet Files\OLKE6\20_01_2009_Transnationale
Konzerne und die Krise in Europa.doc
104
Less-Developed Nations: A Cross-National Study of Intervening Structures.’ Sociological focus, vol. 29, no. 4, pp. 359 ff.
Breedlove W. L. and Patrick N. D. (1988), ‘International Stratification and Inequality 1960-1980’. International journal of contemporary sociology, 1988, vol. 25, no. 3/4, pp. 105 .
Caminada K. and Goudswaard K. (2000), 'International trends in income inequality and social policy' ISSA Conference, Helsinki 'Social Security in the global village' available at: http://www.issa.int/pdf/helsinki2000/topic4/2goudswaard.PDF.
Caporaso J. A. (1978), ’Dependence, Dependency, and Power in the Global System: A Structural and Behavioral Analysis’ International Organization, 32: 13 - 43.
Centre for European olicy Studies (2008), “Is Social Europe Fit for Globalisation? A Study of the Social Impact of Globalisation in the European Union”, available at http://shop.ceps.eu/BookDetail.php?item_id=1630
Chan St. (1989). ‘Income Inequality Among LDCs: A Comparative Analysis of Alternative Perspectives.’ International Studies Quarterly, 33, pps. 45-65.
Chan St. and Clark C. (1992), ‘Flexibility, Foresight, and Fortuna in Taiwan's Development: Navigating between Scylla and Charybdis’. London and New York: Routledge.
Chase-Dunn Ch. (1999), ‘Globalization: A World-Systems Perspective’ Journal of World-Systems Research, available at: http://jwsr.ucr.edu/index.phpV, 2: 165 – 185.
Chase-Dunn Ch. K. (1975), 'The Effects of International Economic Dependence on Development and Inequality: a Cross - national Study' American Sociological Review, 40: 720 - 738.
Chase-Dunn Ch. K. (1984), 'The World - System Since 1950: What Has Really Changed?' in 'Labor in the Capitalist World - Economy' (Bergquist Ch. (Ed.)), pp. 75 - 104, Beverly Hills: Sage.
Chase-Dunn Ch. K. (1991), 'Global Formation: Structures of the World Economy' London, Oxford and New York: Basil Blackwell.
Chase-Dunn Ch. K. (1992a), 'The Changing Role of Cities in World Systems' in 'Waves, Formations and Values in the World System' (Bornschier V. and Lengyel P. (Eds.)), pp. 51 - 87, New Brunswick and London: Transaction Publishers.
Chase-Dunn Ch. K. (1992b), 'The National State as an Agent of Modernity' Problems of Communism, January - April: 29 - 37.
Chase-Dunn Ch. K. (2000), ‘World State Formation: Historical Processes and Emergent Necessity’ Department of Sociology, Johns Hopkins University, available from the Internet at http://www.jhu.edu/.
Chase-Dunn Ch. K. (Ed.), (1982), 'Socialist States in the World System' Beverly Hills and London: Sage.
Chase-Dunn Ch. K. and Grimes P. (1995), ‘World - Systems Analysis’ Annual Review of Sociology, 21: 387 - 417.
Chenery H. and Syrquin M. (1975), ‘Patterns of Development 1950-1970’. Oxford, London and New York: Oxford U. Press.
Chiti V. (1998), ‘Euroland/Civiland. Europe in Wonderland’ Rennes: editions l’Aube. Chow P. C. Y. (2002), ‘Taiwan's Modernization in Global Perspective’. New York: Frederic
Praeger. Corden W.M. (1987) ‘How Valid is International Keynesianism?’ International Monetary Fund,
Research Department: IMF Working Paper WP/87/56. Cornia G. A. (Ed.)(1993), 'Economies in Transition Studies, Regional Monitoring Report, 1'
Firenze: UNICEF. Cornia G. A. (Ed.)(1994), 'Economies in Transition Studies, Regional Monitoring Report, 2'
Firenze: UNICEF. Cornia G. A. (Ed.)(2004), ‘Inequality, growth, and poverty in an era of liberalization and
globalization’ Oxford; New York: Oxford University Press. Cornia G. A. and Kiiski S. (2002), ‘Trends in Income Distribution in the Post WWII Period:
Evidence and Interpretation’ UNI WIDER available at http://www.wider.unu.edu/conference/conference-2001-1/cornia%20and%20kiiski.pdf.
Cornia G. A. and Paniccia R. (Eds.)(2000), ‘Mortality crisis in transitional economies’ Oxford; New York: Oxford University Press.
C:\Dokumente und Einstellungen\wj1\Lokale Einstellungen\Temporary Internet Files\OLKE6\20_01_2009_Transnationale
Konzerne und die Krise in Europa.doc
105
Cornia G. A., Addison T. and Kiiski S. (2003), ‘Income Distribution Changes and their Impact in the Post-World War II Period’ United Nations University, WIDER Institute Helsinki, Discussion Paper Wdp, 2003, no. 28, (entire).
Cornwall J. and Cornwall W. (2001), ‘Capitalist Development in the Twentieth Century: An Evolutionary-Keynesian Analysis’ Cambridge: Cambridge University Press, 2001 .
Cox R.W. (1994) ‘Global Restructuring: Making Sense of the Changing International Political Economy,’ in: G. Stubbs and Underhill (eds.), Political Economy and the Changing Global Order.
Crenshaw E. M. (1991), 'Foreign Investment as a Dependent Variable: Determinants of Foreign and Capital Penetration in Developing Nations, 1967 - 1978' Social Forces, 69, 4: 1169 - 1182.
Crenshaw E. M. (1992), ‘Cross - National Determinants of Income Inequality: A Replication and Extension Using Ecological - Evolutionary Theory’ Social Forces, 71: 339 - 363.
Crenshaw E. M. (1993), ‘Polity, Economy and Technology: Alternative Explanations for Income Inequality.’ Social forces, vol. 71, no. 3, pp. 807 .
Crenshaw E. M. and Ansari A. (1994), ‘The Distribution of Income Across National Populations: Testing Multiple Paradigms.’ Social Science Research, 23, 1, March, pps. 1-22.
Dadush U. and Brahmbhatt M. (1995), ‘Anticipating Capital Flow Reversals’ Finance and Development, December: 3 - 5.
Dall’erba S. (2004), Regional Competition and Complementarity within Spain and Portugal, Revue d’Economie Régionale et Urbaine, 2, 311-330.
Dall’erba S. (2005), Distribution of Regional Income and Regional Funds in Europe 1989-1999: an Exploratory Spatial Data Analysis, Annals of Regional Science, 39 (1), 121- 148.
Dall’erba S. (2005), Productivity Convergence and Spatial Dependence Among Spanish Regions, Journal of Geographical Systems, 7 (2), 207-227.
Dall’erba S. and Le Gallo J. (2005), Dynamique du Processus de Convergence Régionale en Europe, Région et Développement, 21, 119-140.
Dall’erba S. and Le Gallo J. (2007), The Impact of EU Regional Support on Growth and Employment, Czech Journal of Economics and Finance, 57(7), 325-340.
Dall’erba S. and Le Gallo J. (2008), Regional Convergence and the Impact of Structural Funds over 1989-1999: a Spatial Econometric Analysis, Papers in Regional Science, forthcoming.
Dall’erba S. and Percoco M. (2003), North-South Disparities, Complementarity and Competition Within Italy, Scienze Regionali- Italian Journal of Regional Science, 2, 29-49.
Dall’erba S., Kamarianakis Y., Le Gallo J. and Plotnikova M. (2005), Regional Productivity Differentials in Three New Member Countries. What Can We Learn From the 1986 Enlargement to the South?, Review of Regional Studies, 35 (1), 97-116.
Dall'erba S., Percoco M. and Piras G. (2008), The European Regional Growth Process Revisited, Spatial Economic Analysis, 3(1), 7-25.
Deacon B. (1992a),'East European Welfare: Past, Present and Future in Comparative Context' in 'The New Eastern Europe. Social Policy Past, Present and Future' (Deacon B. (Ed.)), pp. 1 - 31, London and Newbury Park: Sage.
Deacon B. (1992b),'The Future of Social Policy in Eastern Europe' in 'The New Eastern Europe. Social Policy Past, Present and Future' (Deacon B. (Ed.)), pp. 167 - 191, London and Newbury Park: Sage.
Delacroix J. and Ragin Ch. (1981), ‘Structural Blockage: A Cross - National Study of Economic Dependency, State Efficacy, and Underdevelopment’ American Journal of Sociology, 86, 6: 1311 - 1347.
Denemark R. A., Modelski G., Gills B. K. and Friedman J. (2000), ‘World Systems History: The Social Science of Long-term Change’ London and New York: Routledge.
Die Presse (2005), ‘"Österreichs Sozialmodell ineffizient" VON FRANZISKA ANNERL (Die Presse)’ 28.10.2005, available at: http://www.diepresse.com/Artikel.aspx?channel=p&ressort=eu&id=515384&archiv=false .
C:\Dokumente und Einstellungen\wj1\Lokale Einstellungen\Temporary Internet Files\OLKE6\20_01_2009_Transnationale
Konzerne und die Krise in Europa.doc
106
Dixon C. J., Drakakis-Smith D. and Watts H. D. (1986), ‘Multinational Corporations and the Third World’ Boulder, CO: Westview Press.
Dixon W. J. and Boswell T. (1996b), ‘Differential Productivity, Negative Externalities, and Foreign Capital Dependency: Reply to Firebaugh.’ The american journal of sociology, vol. 102, no. 2, pp. 576 .
Dunaway W. A. and Wallerstein I. (Eds.)(2003), ‘Emerging Issues in the 21st Century World System’ New York: Frederic Praeger/Greenwood.
Dunning J. H. (2001), ‘Global Capitalism at Bay?’ London and New York: Palgrave Macmillan. Easterly W. (2001), “The Lost Decades. Develoiping Countries’ Stagnation In Spite of Policy
Reform, 1980-98”, Journal of Economic Growth, vol. 6, No.2, pp. 135-157. Easterly W. (2002), ‘Inequality does Cause Underdevelopment: New evidence’. Center for
Global Development, Working Paper 1, January 2002, available at: http://www.cgdev.org/wp/cgd_wp001_rev.pdf.
Emmanuel, A. (1972) ‘Unequal Exchange: A Study of the Imperialism of Trade.’ New York, USA: Monthly Review Press [translated from the 1969 French original].
Evans P. B. and Timberlake M. (1980), ‘Dependence, Inequality, and the Growth of the Tertiary: A Comparative Analysis of Less Developed Countries.’ American Sociological Review, 45, August, pps. 531-552.
Fiala R. (1992), 'The International System, Labor Force Structure, and the Growth and Distribution of National Income, 1950 - 1980' Sociological Perspectives, 35, 2: 249 - 282.
Floro S. L. and Yotopoulos P. A. (1991), ‘Informal credit markets and the new institutional economics: the case of Philippine agriculture’ Boulder, CO: Westview Press.
Frank A. G. (1978a), ‘Dependent accumulation and underdevelopment’ London: Macmillan. Frank A. G. (1978b), ‘World accumulation, 1492 - 1789’ London: Macmillan. Frank A. G. (1980), ‘Crisis in the world economy’ New York: Holmes & Meier Publishers. Frank A. G. (1981), ‘Crisis in the Third World’ New York: Holmes & Meier Publishers. Frank A. G. (1983), 'World System in Crisis' in 'Contending Approaches to World System
Analysis' (Thompson W.R. (Ed.)), pp. 27 - 42, Beverly Hills: Sage. Frank A. G. (1990), 'Revolution in Eastern Europe: lessons for democratic social movements
(and socialists?),' Third World Quarterly, 12, 2, April: 36 - 52. Frank A. G. (1992), 'Economic ironies in Europe: a world economic interpretation of East -
West European politics' International Social Science Journal, 131, February: 41 - 56. Frank A. G. (1994), ‘World System History”. University of Amsterdam, 23 April 1994,
Prepared for presentation at the annual meeting of The New England Historical Association, Bentley College, Waltham, Mass., April 23, 1994, available at: http://www.hartford-hwp.com/archives/10/034.html .
Frank A. G. (1998) ‘ReOrient: Global Economy in the Asian Age’. Ewing, USA: University of California Press .
Frank A. G. and Frank - Fuentes M. (1990), 'Widerstand im Weltsystem' Vienna: Promedia. Frank A. G. and Gills B. (Eds.)(1993), 'The World System: Five Hundred or Five Thousand
Years?' London and New York: Routledge, Kegan&Paul. Friedman M. (1997), ‘Monetary Unity, Political Disunity’ Transitions, December: 32 - 33. Fuest C. (1996), ’Die finanzielle Last der EU - Ausgaben. Bleibt Europa noch finanzierbar?’
Die Neue Gesellschaft. Frankfurter Hefte, 43, 7: 594 - 598. Galbraith J. K. (2002), ‘A perfect crime: global inequality’ Daedalus, 2002, vol. 131, no. 1, pp.
11-25 . Galbraith J. K. and Berner M. (2001), ‘Inequality and industrial change: a global view’
Cambridge; New York: Cambridge University Press. Galbraith J. K. and Kum H. (2005), ‘Estimating the Inequality of Household Incomes: A
Statistical Approach to the Creation of a Dense and Consistent Global Data Set.’ The Review of Income and Wealth, Volume 51, Number 1, March, pp. 115-143 .
Galbraith J. K. and Pitts J. W. (2002), ‘Is Inequality Decreasing?’ Foreign Affairs, 2002, vol. 81, no. 4, pp. 178-183 .
Galbraith, J.K. (1995) ‘Global Keynesianism in the Wings,’ World Policy Journal (USA). Galtung J. (1971), 'A Structural Theory of Imperialism' Journal of Peace Research, 8, 2: 81 -
118.
C:\Dokumente und Einstellungen\wj1\Lokale Einstellungen\Temporary Internet Files\OLKE6\20_01_2009_Transnationale
Konzerne und die Krise in Europa.doc
107
Galtung J., Chase-Dunn, Ch. K. et al. (1985), ‘Export Dependence and Economic Growth: a Reformulation and Respecification’ Social Forces, Vol. 64, pp. 857 - 894.
Gavin B. (2001), ‘European Union and Globalisation: Towards Global Democratic Governance’ Edward Elgar Publishing.
George S. and Gould E. (2000), ‘Liberalisierung kommt auf leisen Sohlen’ Le Monde Diplomatique, Deutschsprachige Ausgabe, Juli.
Gereffi G. and Miguel Korzeniewicz M. (1994), ‘Commodity Chains and Global Capitalism’ New York: Frederic Praeger.
Giering C. (1998), ‘Die Europaeische Union vor der Erweiterung - Reformbedarf der Institutionen und Verfahren nach Amsterdam’ Oesterreichische Zeitschrift fuer Politikwissenschaft, 27, 4: 391 - 405.
Gierus J. (1998), ‘Russia’s Road to Modernity’ Warsaw: Instytut Studiow Politycznych, Polskiej Akademii Nauk.
Goldfrank W. L. (1978), 'Fascism and the World Economy' in 'Social Change in the Capitalist World Economy' (Kaplan B.H. (Ed.)), pp. 75 - 117, Beverly Hills: Sage.
Goldfrank W. L. (1982), 'The Soviet Trajectory' in 'Socialist States in the World - System' (Chase-Dunn Ch. K. (Ed.)), pp. 147 - 156, Beverly Hills: Sage.
Goldfrank W. L. (1990), 'Fascism and the Great Transformation' in 'The Life and Work of Karl Polanyi' (Polanyi - Levitt K. (Ed.)), Montreal: Black Rose (quoted from the author's typescript).
Gosh P. K. (1984), ‘Multi-National Corporations and Third World Development’ Westport, CT: Greenwood Press.
Gradstein M and Milanovic B. (2004), ‘Does Liberte = Egalite? A Survey of the Empirical Links between Democracy and Inequality with Some Evidence on the Transition Economies’ Journal of Economic Surveys, Volume 18, Number 4, September 2004, pp. 515-537 .
Griffin K. (1996), ‘Studies in Globalization and Economic Transitons’ Basingstoke and New York: Macmillan/Saint Martin’s Press.
Gurr T. R. (1991), 'America as a Model for the World? A Skeptical View' PS: Political Science and Politics (Washington D.C.), 24, 4: 664 - 667.
Haddad M. (2002), ‘Export Competitiveness: Where does the Middle East and North Africa http://www.gdnet.org/tm-frame.html?http://www.popcouncil.org/pdfs/wp/132.pdf Region Stand?’ United Nations Economic Commission for West Asia, Working Paper 2030. Access via Global Development Network at: http://www.gdnet.org/tm-frame.html?http://www.erf.org.eg/database/2030.pdf.
Haller M. (Ed.)(2001), ‘The Making of the European Union. Contributions of the Social Sciences’ Berlin/Heidelberg/New York: Springer Verlag
Haller M. and Richter R. (Ed.)(1994), ‘Toward a European Nation? Political Trends in Europe. East and West, Center and Periphery’ Armonk, N.Y./London: M. E. Sharpe
Haller M. and Schachner-Blazizek P. (Ed.)(1999), ‘Beschäftigung in Europa. Ergebnisse eines interdisziplinären Symposiums des Europaforums Steiermark’ Graz: Leykam
Haller M. and Schachner-Blazizek P. (Eds.)(1994), ‘Europa wohin? Wirtschaftliche Integration, soziale Gerechtigkeit und Demokratie’ Graz: Leykam Verlag
Havlik P. (1996) ‘Exchange Rates, Competitiveness and Labour Costs in Central and Eastern Europe,’ WIIW Research Report No. 231 (October). Abstract available online: http://www.wiiw.at/summ231.html.
Heidenreich M (1997) Wirtschaftsregionen im weltweiten Innovationswettbewerb. In: "Kölner Zeitschrift für Soziologie und Sozialpsychologie", Jg. 49, Nr. 3, S. 500-527. 1997 Sammelbesprechung "Glo-balisierung: Neoliberaler Mythos oder politische Herausforderung?". In: "Soziologische Revue" Heft, Jg. 20, Nr. 3, S. 289-294.
Heidenreich M (1997), ‚Wirtschaftsregionen im weltweiten Innovationswettbewerb’. In: Kölner Zeitschrift für Soziologie und Sozialpsychologie, Jg. 49, Nr. 3, S. 500-527. .
Heidenreich M (1998 gemeinsam mit K. Töpsch): Die Organisation von Arbeit in der Wissensgesellschaft. In: "Industrielle Beziehungen", Jg. 5, Nr. 1, S. 13-44. (in gekürzter und überarbeiteter Form eben-falls erschienen in der norwegischen Zeitschrift "Sosiologi i dag" Nr. 3/1998)
C:\Dokumente und Einstellungen\wj1\Lokale Einstellungen\Temporary Internet Files\OLKE6\20_01_2009_Transnationale
Konzerne und die Krise in Europa.doc
108
Heidenreich M (1998) Die duale Berufsausbildung zwischen industrieller Prägung und wissensgesellschaft-lichen Herausforderungen. In: "Zeitschrift für Soziologie", Jg. 27, Nr. 5, S. 321-340.
Heidenreich M (1998) The changing system of European cities and regions. In: "European Planning Studies". Jg. 6, Nr. 3, S. 315-332. (unter dem Titel "Das europäische Städte- und Regionensystem im Wandel" auf deutsch erschienen in: H.-G. Brose und H. Voelzkow (Hrsg.), 1999: Institutioneller Kontext wirtschaftlichen Handelns und Globalisierung. Marburg: Metropolis, S. 291-317.)
Heidenreich M (1998a), ‘The changing system of European cities and regions’. "European Planning Studies". Jg. 6, Nr. 3, S. 315-332. .
Heidenreich M (1998b), ‚Die duale Berufsausbildung zwischen industrieller Prägung und wissensgesellschaftlichen Herausforderungen’. Zeitschrift für Soziologie, Jg. 27, Nr. 5, S. 321-340. .
Heidenreich M (2001a) Die Zukunftsfähigkeit der industriellen Beziehungen. Das Beispiel des VW-Tarifmodells. Gegenwartskunde Nr. 3/2001, S. 353-362.
Heidenreich M (2001b) Sammelbesprechung „Europäische Identität“. Erschienen in: Soziologische Revue 24, 2001, 301-308).
Heidenreich M (2003a) Regional Inequalities in the enlarged Europe. Journal of European Social Policy, Vol. 13, No 4, pp. 313-333.
Heidenreich M (2003b) Territoriale Ungleichheiten im erweiterten Europa. Kölner Zeitschrift für Soziolo-gie und Sozialpsychologie, Jg. 55, Heft 1, 2003, S. 1ff.
Heidenreich M (2004a) Beschäftigungsordnungen im internationalen Vergleich. In: „Zeitschrift für Sozio-logie“, Jg. 33, Nr. 3, 206-227.
Heidenreich M (2004b) Knowledge-Based Work: An International Comparison. In: International Mana-gement, Thematic Issue Cultures, nations and Management. Volume 8 No. 3, pp. 65-80.
Heidenreich M. (1999) Gibt es einen europäischen Weg in die Wissensgesellschaft? In: G. Schmidt und R. Trinczek (Hrsg.): Globalisierung. Ökonomische und soziale Herausforderungen am Ende des zwanzigsten Jahrhunderts. Sonderband 13 der "Sozialen Welt". Baden-Baden: Nomos, S. 293-323. (in gekürzter und überarbeiteter Form erschienen in C. Honegger, St. Hradil und F. Traxler (Hrsg.), 1999: Grenzenlose Gesellschaft? Teil 2, Opladen: Leske + Budrich, S. 403-419).
Heidenreich M. (1999), ‚Gibt es einen europäischen Weg in die Wissensgesellschaft?’ In: G. Schmidt und R. Trinczek (Eds.) ‚Globalisierung. Ökonomische und soziale Herausforderungen am Ende des zwanzigsten Jahrhunderts’. Sonderband 13 der "Sozialen Welt". Baden-Baden: Nomos, S. 293-323. .
Heidenreich M. (2001a), ‚Die Zukunftsfähigkeit der industriellen Beziehungen. Das Beispiel des VW-Tarifmodells’. Gegenwartskunde Nr. 3/2001, S. 353-362.
Heidenreich M. (2001b), ‚Europäische Identität’ in: Soziologische Revue 24, 2001, 301-308), . . Heidenreich M. (2003a), ‘Regional Inequalities in the enlarged Europe’. Journal of European
Social Policy, Vol. 13, No 4, pp. 313-333. Heidenreich M. (2003b), ‚Territoriale Ungleichheiten im erweiterten Europa.’ Kölner Zeitschrift
für Soziolo-gie und Sozialpsychologie, Jg. 55, Heft 1, 2003, S. 1ff. . Heidenreich M. (2004) ‚Mittel- und Osteuropa nach der EU-Erweiterung. Eine Gratwanderung
zwischen wirtschaftlicher Modernisierung und sozialer Integration’ (Vortrag, Bamberg 2004), available at: http://www.uni-bamberg.de/sowi/europastudien/dokumente/modernisierung_mitteleuropa.pdf
Heidenreich M. (2004a), ‘Knowledge-Based Work: An International Comparison’. International Mana-gement, Thematic Issue Cultures, nations and Management. Volume 8 No. 3, pp. 65-80.
Heidenreich M. (2004b), ‚Beschäftigungsordnungen im internationalen Vergleich’. „Zeitschrift für Soziologie“, Jg. 33, Nr. 3, 206-227.
Heidenreich M. (2004c), ‚Mittel- und Osteuropa nach der EU-Erweiterung. Eine Gratwanderung zwischen wirtschaftlicher Modernisierung und sozialer Integration’ (Vortrag, Bamberg 2004), available at: http://www.uni-bamberg.de/sowi/europastudien/dokumente/modernisierung_mitteleuropa.pdf.
C:\Dokumente und Einstellungen\wj1\Lokale Einstellungen\Temporary Internet Files\OLKE6\20_01_2009_Transnationale
Konzerne und die Krise in Europa.doc
109
Heidenreich M. and Töpsch K. (1998), ‚Die Organisation von Arbeit in der Wissensgesellschaft.’ Industrielle Beziehungen, Jg. 5, Nr. 1, S. 13-44.
Hettne B. (1989), 'Three Worlds of Crisis for the Nation State' in 'Crisis in Development' (Bablewski Z. and Hettne B. (Eds.)), pp. 45 - 77, Goeteborg: United Nations University: European Perspectives Project 1986 - 87, Peace and Development Research Institute, Gothenburg University, P.A.D.R.I.G.U Papers.
Hettne B. (1994), 'The Political Economy of Post - Communist Development' The European Journal of Development Research, 6, 1, June: 39 - 60.
Hettne B. (1995a), ‘Development theory and the three worlds: towards an international political economy of development’ 2nd ed. Essex, England: Longman Scientific & Technical; New York, NY. Copublished in the United States by John Wiley.
Hickmann Th. (1994), 'Wenn Ost und West zusammenwachsen sollen...' Osteuropa - Wirtschaft, 39, 2, Juni: 115 - 127.
Hilferding R. (1915), 'Europaer, nicht Mitteleuropaer' Der Kampf (Vienna), 8, 11 - 12: 357 - 365.
Hofbauer H and Komlosy A. (1994), ‘Eastern Europe: From "Second World" to First or Third World.’ Contention, 1994, vol. 3, no. 2, pp. 129 .
Hofbauer H and Komlosy A. (2000), ‘Capital Accumulation and Catching-Up Development in Eastern Europe’ Review, vol. 23, no. 4, pp. 459-502 .
Holmes L. (1999), ‘Corruption, Weak States and Economic Rationalism in Central and Eastern Europe’ International Anti-Corruption Conference (IAACC), 9th International Anti-Corruption Conference, published on the Internet: http://www.transparency.de/iacc/9th_papers/day1/ws2/d1ws2_lholmes.html.
Holtbruecke D. (1996), ’Oekonomische Voraussetzungen und Folgen einer Osterweiterung der Europaeischen Union’ Osteuropa, 46, 6: 537 - 547.
Holzmann R. (1999), ‘Mixed blessing of financial inflows: transition countries in comparative perspective’ (edited by János Gács, Robert Holzmann, Michael L. Wyzan). Northampton, Ma.; Cheltenham, UK: Edward Elgar Publishing.
Holzmann R. (Ed.)(1996), ‘Maastricht: monetary constitution without a fiscal constitution? / Empirica-Economic Policy Forum and European Institute workshop’, Saarbrucken, October 2-3, 1995; Robert Holzmann (ed.). Baden-Baden: Nomos Verlagsgesellschaft.
Hopkins T. K. (1982), 'The Study of the Capitalist World - Economy. Some Introductory Considerations' in 'World Systems Analysis. Theory and Methodology' (Hopkins T.K. and Wallerstein I. et al.), pp. 3 - 38, Beverly Hills: Sage.
Hopkins T. K. and Wallerstein I. et al. (1982), 'Patterns of Development of the Modern World System' in 'World Systems Analysis. Theory and Methodology' (Hopkins T. K. and Wallerstein I. et al.), pp. 41 - 82, Beverly Hills: Sage.
Huber P. (1999), ‘Labour Market Adjustment in Central and Eastern Europe: How Different?’ Austrian Institute for Economic Research (WIFO).
Huber P. (1999), ‘Wirtschaftliche und soziale Folgen der Erweiterung der EU’ in ‘Zukunft ohne Grenzen’ Wien: Institut für den Donauraum und Mitteleuropa.
Huebner K. (1994), 'Wege nach Nirgendwo: Oekonomische Theorie und osteuropaeische Transformation' Berliner Journal fuer Soziologie, 3: 345 - 364.
International Labor Office and United Nations Centre on Transnational Corporations (1988), 'Economic and social effects of multinational enterprises in export processing zones' Geneva: ILO.
International Labour Office (2000), 'World Labor Report 2000' Geneva: ILO (available at Amazon.com and Barnes & Noble).
Jenkins R. (1987), 'Transnational Corporations and Uneven Development: The Internationalization of Capital and the Third World' London and New York: Methuen.
Johnson R. B. (1986) ‘Income Inequality in the Third World: A Comparison of Three Theories.’ International Review of Modern Sociology, 16, pps. 69-81.
Juchler J. (1986), ‘Sozialistische Gesellschaftsformation: allgemeine Theorie und Fallstudie (Polen 1945-1984)’ Frankfurt [am Main]; New York: Campus.
Juchler J. (1992a), ‘Ende des Sozialismus - Triumph des Kapitalismus?: eine vergleichende Studie moderner Gesellschaftssysteme.’ Zurich: Seismo.
C:\Dokumente und Einstellungen\wj1\Lokale Einstellungen\Temporary Internet Files\OLKE6\20_01_2009_Transnationale
Konzerne und die Krise in Europa.doc
110
Juchler J. (1992b), 'The Socialist Societies: Rise and Fall of a Societal Formation' in 'Waves, Formations and Values in the World System' (Bornschier V. and Lengyel P. (Eds.)), pp. 145 - 174, New Brun-swick (USA),: Transaction Publishers.
Juchler J. (1992c), 'The Socialist Societies: Rise and Fall of a Societal Formation' in 'Waves, Formations and Values in the World System' (Bornschier V. and Lengyel P. (Eds.)), pp. 145 - 174, New Brunswick (USA),: Transaction Publishers.
Juchler J. (1992d), 'Zur Entwicklungsdynamik in den sozialistischen bzw. postsozialistischen Laendern' Schweizerische Zeitschrift fuer Soziologie, 17, 2: 273 - 307.
Juchler J. (1994), ‘Osteuropa im Umbruch: politische, wirtschaftliche und gesellschaftliche Entwicklungen 1989-1993: Gesamtueberblick und Fallstudien’ Zuerich: Seismo Verlag.
Juchler J. (1995), 'Kontinuitaet oder Wende? Polen seit dem Wahlsieg der 'Postkommunisten'' Osteuropa, 45, 1: 65 - 76.
Juchler J. (2001), ‘Zur Osterweiterung der EU - Gesellschaftliche Asymmetrien und ihre Risiken’ Europaische Rundschau, vol. 29, no. 1, pp. 121-134 .
Juchler J. (2003), ‘Polens Transformationsentwicklung und der EU-Beitritt.’ Wirtschaft und Gesellschaft, vol. 29, no. 1, pp. 103-130 .
Juchler J. (2004), ‘EU? Na gut Zur Akzeptanz der EU-Mitgliedschaft in Ostmitteleuropa’. Osteuropa, vol. 54, no. 7, pp. 52-64 .
Kalecki M. (1972), 'The Last Phase in the Transformation of Capitalism' New York: Monthly Review Press.
Kalecki M. (1979), 'Essays on Developing Economies. With an Introduction by Professor Joan Robinson' Hassocks, Sussex: The Harvester Press.
Kanbur R. (2001), ‘Income Distribution and Development’ World Development Report background paper at: http://www.worldbank.org/poverty/wdrpoverty/kanbur.htm.
Kanbur R. (2005), ‘Growth, Inequality and Poverty: Some Hard Questions’ Journal of International Affairs- Columbia University, vol. 58, no. 2, pp. 223-232 .
Kanbur R. and Squire L. (2001), ‘The Evolution of Thinking about Poverty: Exploring the Interactions’ World Development Report background paper at: http://www.worldbank.org/poverty/wdrpoverty/evolut.pdf.
Kentor J. D. (1998), ‘The Long-Term Effects of Foreign Investment Dependence on Economic Growth, 1940-1990’ American Journal of Sociology, 103, 4, January: 1024 - 46.
Kentor J. D. (2005), ‘Transnational Corporate Power. Expansion, Spatial Distribution, and Concentration, 1962 – 1998’ in ‘The Future of World Society’ (Herkenrath M. et al. (Eds.)) pp. 81 – 101; Sociological Institute, University of Zurich: Intelligent Book Production.
Kentor J. D. and Boswell T. (2003), ‘Foreign Capital Dependence and Development: A New Direction’ American sociological review. 68, no. 2, (2003): 301 (13 pages) .
Kick E. L. and Davis B. L. (2001), ‘World-System Structure and Change: An Analysis of Global Networks and Economic Growth Across Two Time Periods’ American Behavioral Scientist, vol. 44, no. 10, pp. 1561-1578.
Kiljunen K. (1987), ‘Changing patterns in the international division of labour and the implications for Finland’ Brighton, England: Institute of Development Studies at the University of Sussex.
Kiljunen K. (1988), ‘The World Bank and the world poverty’ Helsinki: University of Helsinki, Institute of Development Studies.
Kiljunen K. (1992), ‘Finland and the new international division of labour. Foreword by Charles P. Kindleberger.’ Houndmills, Basingstoke, Hampshire: Macmillan Press.
Kiljunen K. (2000), ‘Global Governance’ Draft, Finnish Parliament. Kiljunen K. (Ed.)(1984), ‘Kampuchea: decade of the genocide: report of a Finnish inquiry
commission’ London: Zed Books ; Totowa, N.J.: US Distributor, Biblio Distribution Center, 1984.
Kiljunen K. (Ed.)(1989), ‘Mini-NIEO: the potential of regional north-south cooperation’ Helsinki: Institute of Development Studies, University of Helsinki.
Kiljunen K. (Ed.)(1990), ‘Region-to-region cooperation between developed and developing countries: the potential for Mini-NIEO.’ Aldershot, Hants, England ; Brookfield, Vt., USA: Avebury.
C:\Dokumente und Einstellungen\wj1\Lokale Einstellungen\Temporary Internet Files\OLKE6\20_01_2009_Transnationale
Konzerne und die Krise in Europa.doc
111
Kiljunen K. and Avakov R. M. (Eds.)(1991), ‘World industrial restructuring and north-south cooperation’ Helsinki: University of Helsinki, Institute of Development Studies.
Kiljunen K. et al. (1987), ‘Finnish peace making’ [translator, Chris Mann]. Helsinki, Finland: Peace Union of Finland.
Kirby P. (1998), ‘Has Ireland a future?’ Cork, Irish Republic: Mercier Press. Kirby P. (2002), ‘Celtic tiger in distress: growth with inequality in Ireland’ Houndmills,
Basingstoke, Hampshire; New York: Palgrave. Köhler G. (1976a) ‘An Empirical Table of Structural Violence’ (with Norman Alcock) Journal
of Peace Research (Norway), 13: 343-356 [includes ‘plateau curve’ of life expectancy with income].
Köhler G. (1998a) ‘The Structure of Global Money and World Tables of Unequal Exchange’, Journal of World-Systems Research 4: 145:168; online: http://csf.colorado.edu/wsystems/jwsr.html .
Köhler G. (1998a), ‘Unequal Exchange 1965 - 1995: World Trend and World Tables’, World-Systems Archive, Working Papers, online: http://csf.colorado.edu/wsystems/archive/papers/Köhlertoc.htm.
Köhler G. (1999a) ‘A Theory of World Income’, World-Systems Archive, Working Papers, online: http://csf.colorado.edu/wsystems/archive/papers/Köhler.
Köhler G. (1999b) ‘Global Keynesianism and Beyond’, Journal of World-Systems Research, 5: 225-241, online: http://csf.colorado.edu/wsystems/jwsr.html .
Köhler G. and Tausch A. (2002) Global Keynesianism: Unequal exchange and global exploitation. Huntington NY, Nova Science. ISBN 1-59033-002-1.
Kohli A. et al. (1984) ‘Inequality in the Third World: An Assessment of Competing Explanations.’ Comparative Political Studies, 17, 3, October, pps. 283-318.
Korzeniewicz R. P. and Moran T. P. (1997), ‘World Economic Trends in the Distribution of Income, 1965-1992’. American Journal of Sociology, 102, 4, January, pps. 1000-1039.
Krahn H. and Gartrell J. W. (1985), ‘Effects of Foreign Trade, Government Spending, and World-System Status on Income Distribution.’ Rural Sociology, 50, 2, pps. 181-192.
Landesmann M. (1996), ‘Emerging Patterns of European Industrial Specialization: Implications for Labour Market Dynamics in Eastern and Western Europe’ Research Reports, 230, Vienna Institute for Comparative Economic Studies.
Landesmann M. and Burgstaller J. (1997), ‘Vertical Product Differentiation in EU Markets: the Relative Position of East European Producers’ Research Reports, 234a, Vienna Institute for Comparative Economic Studies.
Landesmann M. and Rosati D. (Eds.)(2004), ‘Shaping the new Europe: economic policy challenges of European Union enlargement’ Houndmills, Basingstoke, Hampshire; New York, N.Y.: Palgrave Macmillan.
Landesmann M. and Székely I. (Eds.)(1995) ‘Industrial restructuring and trade reorientation in Eastern Europe’ Cambridge; New York, NY: Cambridge University Press, 1995. .
Landesmann M. et al. (Eds.)(2003) ‘Prospects for further (South- )Eastern EU enlargement: from divergence to convergence?’ Wien: Wiener Institut fuer Internationale Wirtschaftsvergleiche .
Laxer G. (1993), 'Social Solidarity, Democracy and and Global Capitalism' The 1993 Porter Lecture, Canadian Sociology and Anthropology Association, available at: http://www.socsci.mcmaster.ca/soc/porterlectures/laxer.htm.
Laxer G. (2005), US Empire and Popular Sovereignty’ in ‘The Future of World Society’ (Herkenrath M. et al. (Eds.)) pp. 199 – 229; Sociological Institute, University of Zurich: Intelligent Book Production.
Le Gallo J. and Dall’erba S. (2006), Evaluating the Temporal and Spatial Heterogeneity of the European Convergence Process, 1980-1999, Journal of Regional Science, 46 (2), 269-288.
Le Gallo J. and Dall’erba S. (2008), Spatial and Sectoral Productivity Convergence between European Regions, 1975-2000, Papers in Regional Science, forthcoming.
Le Gallo J., Baumont C., Dall’erba S. and Ertur C. (2005), On the Property of Diffusion in the Spatial Error Model, Applied Economics Letters, 12 (9), 533-536.
Le Gallo J., Dall’erba S. and Guillain R. (2008), Fonds structurels, effets de débordement
C:\Dokumente und Einstellungen\wj1\Lokale Einstellungen\Temporary Internet Files\OLKE6\20_01_2009_Transnationale
Konzerne und die Krise in Europa.doc
112
géographique et croissance régionale en Europe, Revue de l’OFCE, 104, 241-270. Le Gallo J., Dall’erba S., Kamarianakis Y. and Plotnikova M. (2003), Les Différentiels de
Productivité Régionale dans les Pays en Transition par Rapport à l'Union Européenne: le cas de la Pologne, de la Hongrie et de la République Tchèque, Région et Développement, 18, 111-129.
Lewis Sir W.A. (1978), 'The Evolution of the International Economic Order' Princeton N.J.: Princeton University Press.
Liemt G. van (1992), 'Industry on the move. Causes and consequences of international relocation in the manufacturing industry' Geneva: International Labor Office.
Linnemann H. and Sarma A. (1991), 'Economic Transformation in Eastern Europe: Its Genesis, Adjustment Process, and Impact on Developing Countries' Development and Change, 22, 1: 69 - 92.
London B. (1987), 'Structural Determinants of Third World Urban Change: An Ecological and Political Economic Analysis' American Sociological Review, 52: 28 - 43.
London B. and Ross R. J. S. (1995), 'The Political Sociology of Foreign Direct Investment: Global Capitalism and Capital Mobility, 1965 - 1980' International Journal of Comparative Sociology, 36, 3 - 4: 198 - 218.
London B. and Smith D. A. (1988), ’Urban Bias, Dependence, and Economic Stagnation in Noncore Nations’ American Sociological Review, 53: 454 - 463.
Luttwak E. (1999), ‘Turbo-Capitalism. Winners and Losers in the Global Economy’ New York: Harper Perennial.
Malcolm N. (1995) 'The Case Against 'Europe'' Foreign Affairs, March, April: 52 - 68. McCallum C. (1999), ‘Globalisation, Developments and Trends in the New International
Division of Labour’ Centre for International Business Studies at South Bank University, London, available at: http://www.sbu.ac.uk/cibs/pdf/19-99.pdf.
Meier G.M. and Seers D. (Eds.)(1984), 'Pioneers in Development' New York and Oxford: Oxford University Press.
Milanovic B. (2002), True World Income Distribution, 1988 and 1993: First Calculations Based on Household Surveys Alone’ The Economic Journal, Volume 112, Number 476, January 2002, pp. 51-92 .
Milanovic B. (2003a), ‘Inequality in the World Economy-By the Numbers’. Multinational Monitor, 2003, vol. 24, no. 7/8, pp. 23-29.
Milanovic B. (2003b), ‘The Two Faces of Globalization: Against Globalization as We Know It’ World Development, Volume 31, Number 4, April 2003, pp. 667-683 .
Milanovic B. (2005), ‘Can We Discern the Effect of Globalization on Income Distribution? Evidence from Household Surveys’ World Bank Economic Review, 2005, vol. 19, no. 1, pp. 21-44 .
Milanovic B. and Squire L. (2005), ‘Does tariff liberalization increase wage inequality? Some empirical evidence’ NBER Working Paper Series, 2005, no. 11046, pp. (entire).
Mills J. (2002), ‘A Critical History of Economics: Missed Opportunities’ Basingstoke and London: Palgrave Macmillan.
Moaddel M. (1994), 'Political Conflict in the World Economy: A Cross - national Analysis of Modernization and World - System Theories' American Sociological Review, 59, April: 276 - 303.
Modigliani F. (1987), ‘European economic recovery: a need for new policies?’ Stockholm, Sweden: Industrial Institute for Economic and Social Research: Distribution, Almqvist & Wiksell International.
Morawetz R. (1991), 'Recent foreign direct investment in Eastern Europe: Towards a possible role for the Tripartite Declaration of Principles concerning Multinational Enterprises and Social Policy' Geneva: International Labor Office, Multinational Enterprises Programme, Working Paper 71.
Muller E. N. (1988), ‘Democracy, Economic Development, and Income Inequality.’ American Sociological Review, 54, pps. 868-871.
Muller E. N. (1993),. ‘Financial Dependence in the Capitalist World Economy and the Distribution of Income Within States.’ in ‘Development and Underdevelopment: The Political Economy of Inequality” (Seligson M. A. and Passe-Smith J. T. (Eds.)), pp. 267 –
C:\Dokumente und Einstellungen\wj1\Lokale Einstellungen\Temporary Internet Files\OLKE6\20_01_2009_Transnationale
Konzerne und die Krise in Europa.doc
113
293 – 39, Boulder CO: Lynne Rienner Publishers. Myrdal G. (1972), 'Politisches Manifest ueber die Armut in der Welt' Frankfurt a.M.: suhrkamp
TB. Myrdal G. (1974), 'Oekonomische Theorie und unterentwickelte Regionen. Weltproblem
Armut' Frankfurt a.M.: Fischer TB. Myrdal G. (1984), 'International Inequality and Foreign Aid in Retrospect' in 'Pioneers in
Development. A World Bank Publication' (Meier G.M. and Seers D. (Eds.)) pp. 151 - 165. New York and Oxford: Oxford University Press.
Nielsen F. (1995), ‘Income Inequality, Development and Dualism: Results from an Unbalanced Cross-National Panel.’ American Sociological Review, 60, pps. 674-701.
Nolan P. D. (1983), ‘Status in the World System, Income Inequality and Economic Growth’; American Journal of Sociology, 89, 410-419.
Nollert M. (1990), 'Social Inequality in the World System: An Assessment' in 'World Society Studies. Volume 1' (Bornschier V. and Lengyel P. (Eds.)), pp. 17 - 54, Frankfurt and New York: Campus.
Nollert M. (1996), ‘Verbandliche Interessenvertretung in der Europaeischen Union: Einflussressourcen und faktische Einflussnahme’ Zeitschrift fuer Politikwissenschaft (vormals Jahrbuch fuer Politik), 6, 3: 647 - 667.
Nollert M. (2005), ‘Transnational Corporate Networks. Theoretical Perspectives, Empirical Evidence, and Prospects’ in ‘The Future of World Society’ (Herkenrath M. et al. (Eds.)) pp. 103 – 127; Sociological Institute, University of Zurich: Intelligent Book Production.
Nollert M. and Fielder N. (1997), ‘Lobbying for a Europe of Big Business: the European Roundtable of Industrialists’ Department of Sociology, University of Zurich, Research paper (Raemistrasse 69, CH-8001, Zurich).
Nolte H. H. (1989), 'Tradition des Rueckstands. West - Ost - Technologietransfer in der Geschichte' Department of History, University of Hannover, FRG.
O’Hara P. A. (2000) Marx, Veblen and Contemporary Institutional Political Economy: Principles and Unstable Dynamics of Capitalism. Cheltenham, UK and Northampton, US: Edward Elgar. Pp. 266-291.
O’Hara P. A. (2003a) Principles of Political Economy: Integrating Themes from the Schools of Heterodoxy. Working Paper, Global Political Economy Research Unit, Economics Department, Curtin University. http://pohara.homestead.com/files/principles.doc.
O’Hara P. A. (2003b), ‘Recent changes to the IMF, WTO and SPD: emerging global mode of regulation or social structure of accumulation for long wave upswing?’ Review of International Political Economy, Volume 10, Number 3, August 2003, pp. 481-519 .
O’Hara P. A. (2005a), ‘Contradictions of Neoliberal Globalisation: The Importance of Ideologies and Values in Polical Economy’ Journal of Interdisciplinary Economics, vol. 16, no. 3, pp. 341-365 .
O’Hara P. A. (2005b), ‘Growth and Development in the Global Political Economy. Social Structures of Accumulation and Modes of Regulation’ Oxford and New York: Routledge, Taylor and Francis Group.
O’Hara P. A. (Ed.)(2001) Encyclopedia of Political Economy, London and New York: Routledge, Paper edition. 2 vols.
O’Hara P. A. (Ed.)(2004), ‘Global political economy and the weath of nations: performance, institutions, problems, and policies’ New York: Routledge.
Orenstein M. A. (1996), ‘The Failures of Neo - Liberal Social Policy in Central Europe’ Transition, 28 June 1996.
Orlowski L. T. (1996), ‘Fiscal Consolidation in Central Europe in Preparation for Accession to the European Union’ Center for Social and Economic Research, Bagatela 14, PL-00-585 Warsaw, Studies and Analyses, 77.
Palme J. (2005), ‘Why the Scandinavian Experience is Relevant for the Reform of ESM’ Stockholm, Institute for Future Studies (Discussion paper prepared for the UK Presidency, available at http://www.eu2005.gov.uk/servlet/Front?pagename=OpenMarket/Xcelerate/ShowPage&c=Page&cid=1107293391098&a=KArticle&aid=1119527321606).
Pepelasis A. and Yotopoulos P. A. (1962), ‘Surplus labor in Greek agriculture, 1953-1960’
C:\Dokumente und Einstellungen\wj1\Lokale Einstellungen\Temporary Internet Files\OLKE6\20_01_2009_Transnationale
Konzerne und die Krise in Europa.doc
114
Athens (Center of Economic Research. Research monograph series, 2). Perroux F. (1961), ‘L’économie du XXe siècle’ Paris: P.U.F. Petrella R. (1995), 'Europe between competitive innovation and a new social contract'
International Social Science Journal, 143: 11 - 23. Pfaller A. (2000), 'Social Democracy in the Globalized Post-Industrial Society' Politik und
Gesellschaft Online, Friedrich-Ebert-Stiftung, 2, available at: http://www.fes.de/IPG/ipg2_2000/artpfaller.html.
Piore M. (1990), 'Work, labor and action: Work experience in a system of flexible production' in 'Industrial Districts and Inter - Firm Cooperation in Italy' (Pyke F. et al. (Eds.)), pp. 52 - 74, Geneva: International Institute for Labor Studies.
Polany, K. (1979), 'Oekonomie und Gesellschaft' Frankfurt a.M.: suhrkamp taschenbuch wissenschaft.
Polanyi K. (1957), 'The Great Transformation' Boston: Beacon. Polanyi K., Lewis J. Kitchin D. (1972) ‘Christianity and the social revolution’ Freeport, N.Y.:
Books for Libraries Press. . Portillo M. (1999), ‘For a Global Britain’ Speech delivered by the Rt. Hon. Michael Portillo,
Westminster Hall, available from the Internet at http://www.keele.ac.uk/socs/ks40/port.htm.
Prechel H. (1985), ‘The Effects of Exports, Public Debt and Development on Income Inequality’. International Labor Review, 108, pps. 97-125.
Raffer K. (1987b), 'Unequal Exchange and the Evolution of the World System Reconsidering the Impact of Trade on North-South Relations' London, Basingstoke and New York: Macmillan and Saint Martin's Press. .
Raffer K. (1995) 'The Impact of the Uruguay Round on Developing Countries', in: F. Breuss (ed), The World Economy after the Uruguay Round, Service Fachverlag, Vienna, pp.169ff.
Raffer K. (1996) 'Exportorientierte Entwicklung und Weltmarkt - Das Beispiel der asiatischen 'Tiger'', in: E. Binderhofer, I. Getreuer-Kargl, H. Lukas (eds), Das pazifische Jahrhundert?, Brandes & Apsel/Südwind, Frankfurt aM/Wien, pp.41ff.
Raffer K. and Murshed S. M. (1993). ‘Trade, transfers, and development: problems and prospects for the twenty-first century’ Aldershot, Hants, England; Brookfield, Vt., USA: E. Elgar Pub. Co.
Raffer K. and Singer H. W. (1996) The Foreign Aid Business, Economic Assistance and Development Co-operation, E.Elgar, Cheltenham [paperback: 1997].
Raffer K. and Singer H. W. (2001), ‘Economic North-South divide: six decades of unequal development’ Cheltenham, UK; Northampton, MA: Edward Elgar.
Ramonet I. (1998), ‘Die neuen Herren der Welt. Internationale Politik an der Jahrtausendwende’ Zürich: Rotpunkt-Verlag.
Ray J. L. (1983), 'The 'World System' and the Global Political System: A Crucial Relationship?' in 'Foreign Policy and the Modern World - System' (Mc Gowan P. and Kegley Ch.W. Jr. (Eds.)), pp. 13 - 34, Beverly Hills: Sage.
Robinson R. D. (1987), ‘Direct Foreign Investment: Costs and Benefits’ New York: Praeger Publishers.
Rodrik D. (1997), ‘Globalization, Social Conflict and Economic Growth’ Harvard University. Available at: http://ksghome.harvard.edu/~.drodrik.academic.ksg/global.PDF.
Ross R. J. S. and Trachte K.C. (1990), 'Global Capitalism: The New Leviathan' Albany: State University of New York Press.
Rostow W. W. (1980) Why the Poor get Richer and the Rich Slow Down: Essays in the Marshallian Long Period. London and Basingstoke: Macmillan. .
Rothschild K. W. (1993a), ‘Employment, wages, and income distribution: critical essays in economics’ London; New York: Routledge.
Rothschild K. W. (1993b), ‘Ethics and economic theory: ideas, models, dilemmas’ Aldershot, Hants., England; Brookfield, Vt.: E. Elgar.
Rothschild K. W. (1997), ‘Some Considerations on the Economics and Politics of the EU and the Maastricht Treaty’ Vienna: quoted from the author’s typescript.
Rubinson R. (1976), ‘The World - Economy and the Distribution of Income within States: A
C:\Dokumente und Einstellungen\wj1\Lokale Einstellungen\Temporary Internet Files\OLKE6\20_01_2009_Transnationale
Konzerne und die Krise in Europa.doc
115
Cross - National Study’ American Sociological Review, 41: 638 - 659. Russett B. (1983a), 'International Interactions and Processes: The Internal versus External
Debate Revisited' in 'Political Science: The State of the Discipline' (Finifter A. (Ed.)), pp. 541 - 68, Washington D.C.: American Political Science Association.
Russett B. (1983b), 'The Peripheral Economies. Penetration and Economic Distortion, 1970 - 75' in 'Contending Approaches to World System Analysis' (Thompson W.R. (Ed.)), pp. 79 - 114, Beverly Hills: Sage.
Sapir A. (2005a), ‚Globalisation and the Reform of European Social Models’. Brussels, BRUEGEL Institute (Background document for the presentation at ECOFIN Informal Meeting in Manchester, 9 September 2005), available at: http://www.bruegel.org/Repositories/Documents/publications/working_papers/SapirPaper080905.pdf .
Sapir A. (2005b), ‚Globalisation and the Reform of European Social Models’ Brussels, BRUEGEL Institute, bruegel policy brief, 01, November (restricted).
Sawada Y. and Yotopoulos P. A. (1999). "Currency Substitution, Speculation, and Financial Crisis: Theory and Empirical Analysis." SIEPR Policy Paper Series No. 99- 5.
Sawada Y. and Yotopoulos P. A. (2002), ‘On the Missing Link between Currency Substitution and Crises’ Zagreb International Review of Economics and Business, vol. 5, no. VOL 2, pp. 83-104.
Schmidt M. G. (1983), 'The Welfare State and the Economy in Periods of Economic Crisis: A Comparative Study of Twenty - three OECD Nations' European Journal of Political Research, 11, 1: 1 - 26.
Schmidt M. G. (1986), 'Politische Bedingungen erfolgreicher Wirtschaftspolitik. Eine vergleichende Analyse westlicher Industrielaender (1960 - 1985),' Journal fuer Sozialforschung, 26, 3: 251 - 273.
Schultz T. P. (1998), `Inequality in the Distribution of Personal Income in the World: How it is Changing and Why', Journal of Population Economics, 11: 3 pp 307-344. Available at: http://www.econ.yale.edu/growth_pdf/cdp784.pdf.
Schumpeter J. A. (1950), Capitalism, Socialism and Democracy. Third Edition. New York & London: Harper & Row, 1975.
Schumpeter J. A. (1969), The Theory of Economic Development: An Inquiry into Profits, Capital, Credit, Interest, and the Business Cycle. London and Oxford: Oxford University Press, 1969. Translated by Redvers Opie.
Schumpeter J. A. (1980), 'Kapitalismus, Sozialismus und Demokratie' Munich: A. Francke, 5th printing, 1980 ('Capitalism, Socialism and Democracy' New York: Harper and Brothers).
Schumpeter J. A. (1982), ‘Business cycles: a theoretical, historical, and statistical analysis of the capitalist process’ Philadelphia: Porcupine Press.
Schwartz H. (2000), 'Social Democracy Going Down or Down Under: Institutions, Internationalized Capital and Indebted States' University of Virginia, Department of Government and Foreign Affairs, available at: http://www.people.virginia.edu/~hms2f/social.html.
Seers D. (Ed.)(1978), 'Underdeveloped Europe' Hassocks: Harvester Press. Shandra J. M., Ross R. J. S., London B. (2003), ‘Global Capitalism and the Flow of Foreign
Direct Investment to Non-Core Nations, 1980-1996: A Quantitative, Cross-National Analysis’ International Journal of Comparative Sociology, Vol. 44, 199-238.
Shandra J. M.; London B.; Whooley O. P; Williamson J. B. (2004), ‘International Nongovernmental Organizations and Carbon Dioxide Emissions in the Developing World: A Quantitative, Cross-National Analysis’ Sociological Inquiry, Volume 74, Number 4, November, pp. 520-545 .
Shandra J. M.; Nobles, J. E.; London B.; Williamson, J. B. (2005), ‘Multinational Corporations, Democracy and Child Mortality: A Quantitative, Cross-National Analysis of Developing Countries’ Social Indicators Research, vol. 73, no. 2, pp. 267-293 .
Shandra J., London B, Whooley O. P., et al. (2004), ‘International Nongovernmental Organizations and Carbon Dioxide Emissions in the Developing World: A Quantitative, Cross-National Analysis.’ Sociological Inquiry 74, no. 4 (2004): 520-545.
Shaw T. M. (1994), ‘The South at the end of the twentieth century: rethinking the political
C:\Dokumente und Einstellungen\wj1\Lokale Einstellungen\Temporary Internet Files\OLKE6\20_01_2009_Transnationale
Konzerne und die Krise in Europa.doc
116
economy of foreign policy in Africa, Asia, the Caribbean, and Latin America’ New York: St. Martin's Press.
Shaw T. M. (1995), ‘Globalization, Regionalisms and the South in the 1990s: Towards a New Political Economy of Development’ The European Journal of Development Research, 7, 2, Dec.: 257 - 275.
Soete L. (2005), ‘Activating Knowledge’ Maastricht, NL: United Nations University (Discussion paper prepared for the UK Presidency, available at http://www.eu2005.gov.uk/servlet/Front?pagename=OpenMarket/Xcelerate/ShowPage&c=Page&cid=1107293391098&a=KArticle&aid=1119527321606).
Spiesberger M. (1998), ‘Uebergangsregime zur Abfederung von Differenzen bei EG/EU-Beitritten’ Oesterreichische Zeitschrift fuer Politikwissenschaft, 27, 4: 407 - 423.
Stack St and Zimmerman D. (1982), ‘The Effect of World Economy on Income Inequality: A Reassessment.’ Sociological Quarterly, 23(Summer): 345-358. .
Stack St. (1978), ‘The Effect of Direct Government Involvement in the Economy on the Degree of Income Inequality: A Cross-National Study.’ American Sociological Review, 43 (December): 880-888. .
Stack St. (1980), ‘The Political Economy of Income Inequality: A Comparative Analysis.’ Canadian Journal of Political Science, 13, pps. 273-286.
Stiglitz J. (1998), ‘The Role of International Financial Institutions in the Current Global Economy’ World Bank, Address to the Chicago Council on Foreign Relations, available at: http://www.gdnet.org/tm-frame.html?http://www.worldbank.org/html/extdr/extme/jssp022798.htm.
Stilwell F. (2000), 'Globalization: How did we get to where we are? (and where can we go now?)' available at: http://www.phaa.net.au/conferences/stilwell.htm.
Streissler E. (2002), ‘Exchange Rates and International Finance Markets: An Asset-Theoretic Perspective with Schumpeterian Innovation’ London and New York: Routledge.
Suter Ch. (2005), ‘Research on World Society and the Zurich School’ in ‘The Future of World Society’ (Herkenrath M. et al. (Eds.)) pp. 377 – 383; Sociological Institute, University of Zurich: Intelligent Book Production.
Tausch A. (1998a), ‘Globalization and European Integration’ Electronic book publication at the World Systems Archive (Coordinator: Christopher K. Chase-Dunn, Johns Hopkins University), http://csf.colorado.edu/wsystems/archive/books/tausch/tauschtoc.htm.
Tausch A. (1998b), ‚Transnational Integration and National Disintegration.’ Electronic book publication, World Systems Archive, University of California at Riverside, available at: http://wsarch.ucr.edu/archive/papers/tausch/t1/tausch1.htm and http://wsarch.ucr.edu/archive/papers/tausch/t2/tausch2.htm .
Tausch A. (2002b), ‘The European Union and the World System’. In: ‘The European Union in the World System Perspective’ (The Polish Institute for International Affairs, Ryszard Stemplowski (Ed.)), Warsaw: Collections PISM (Polish Institute for International Affairs): 45 – 93. .
Tausch A. (2003), ‘The European Union: Global Challenge or Global Governance? 14 World System Hypotheses and Two Scenarios on the Future of the Union’ in ‘Globalization: Critical Perspectives’ (Gernot Kohler and Emilio José Chaves (Editors)), pp. 93 – 197, Hauppauge, New York: Nova Science Publishers.
Tausch A. (2004a), ‘Die EU-Erweiterung und die soziale Konvergenz. Ein „Working Paper“ zur Globalisierung und wachsenden Ungleichheit im neuen und alten Europa’ Studien von Zeitfragen, ISSN-1619-8417, 38(2): 1 – 185 http://druckversion.studien-von-zeitfragen.net/Soziale%20Konvergenz%20EU-Erweiterung.pdf.
Tausch A. (2005a), ‘The ‘Evropeiskii Sojus”, the ‘City on the Hill” and the ‘Lisbon Gap”. Electronic Book Publication, Series: Reports, Luxembourg Institute for European and International Studies (Luxembourg), available at http://www.ieis.lu/Documents/PUB_LONG_TAUSCH_KIRCHBERG.pdf .
Tausch A. (2005b), ‚Did recent trends in world society make multinational corporations penetration irrelevant? Looking back on Volker Bornschier's development theory in the light of recent evidence’. Historia Actual On-Line, 6 (2005), available at http://www.hapress.com/abst.php?a=n06a05.
C:\Dokumente und Einstellungen\wj1\Lokale Einstellungen\Temporary Internet Files\OLKE6\20_01_2009_Transnationale
Konzerne und die Krise in Europa.doc
117
Tausch A. and Peter Herrmann (2002), Globalization and European Integration. Huntington NY, Nova Science. ISBN: 1-560729295. .
Therborn G. (1985), 'Arbeitslosigkeit. Strategien und Politikansaetze in OECD - Laendern' Hamburg: VSA.
Therborn G. (1986), 'Karl Marx Returning. The Welfare State and Neo - Marxist, Corporatist and Statist Theories' International Political Science Review, 7, 2, April: 131 - 164.
Timberlake M. and Kantor J. (1983), 'Economic Growth: A Study of the Less Developed Countries' Sociological Quarterly, 24: 489 - 507.
Trezzini B. and Bornschier V. (2001), 'Social Stratification and Mobility in the World System: Different Approaches and Recent Research' Department of Sociology, University of Zurich, available at: http://www.suz.unizh.ch/bornschier/publikationen.pdf.
Tsai P-L. (1995), ‘Foreign Direct Investment and Income Inequality: Further Evidence.’ World Development, 23, 3, pps. 469-483.
Tsoukalis L. (2005), ‘2005), ‘Why we Need a Globalisation and Adjustment Fund’ Athens: Hellenic Foundation for European and Foreign Policy (Discussion paper prepared for the UK Presidency, available at http://www.eu2005.gov.uk/servlet/Front?pagename=OpenMarket/Xcelerate/ShowPage&c=Page&cid=1107293391098&a=KArticle&aid=1119527321606).
Twomey M. J. (1993), ‘Multinational Corporations and the North American Free Trade Agreement’ New York: Frederic Praeger Publishers.
United Nations Centre on Transnational Corporations (1983), 'Transnational Corporations in World Development' New York: United Nations.
United Nations Conference on Trade and Development (current issues), ‘World Investment Report.’ New York and Geneva: United Nations.
United Nations Economic Commission for Latin America, ECLAC/CEPAL, (2002), ‘Globalización y desarrollo”. available at: http://www.eclac.cl/cgi-bin/getProd.asp?xml=/publicaciones/xml/6/10026/P10026.xml&xsl=/tpl/p9f.xsl&base=/MDG/tpl/top-bottom.xsl .
Van Apeldoom B. (2002), ‘Transnational Capitalism and the Struggle over European Integration’ London and New York: Routledge.
Vickrey W. (1996), ‘Fifteen Fatal Fallacies of Financial Fundamentalism. A Disquisition on Demand Side Economics’ New York: Columbia University, Web-Site: http://www.columbia.edu/dlc/wp/econ/vickrey.htm.
Wallerstein I. (1974) The Modern World-System 1: Capitalist Agriculture and the Origins of the European World-Economy in the Sixteenth Century. New York & London: Academic Press.
Wallerstein I. (1976), 'Semi - Peripheral Countries and the Contemporary World Crisis' Theory and Society, 4: 461 - 483.
Wallerstein I. (1978) ‘World-System Analysis: Theoretical and Interpretive Issues,’ in: Kaplan, B.H. (ed.), Social Change in the Capitalist World Economy. Beverly Hills, USA: SAGE Publishing, p. 219-235.
Wallerstein I. (1979a), ’The Capitalist World Economy’ Cambridge, England: Cambridge University Press.
Wallerstein I. (1979b), 'Underdevelopment and Phase B: Effect of the Seventeenth - Century Stagnation on Core and Periphery of the European World - Economy' in 'The World - System of Capitalism: Past and Present' (Goldfrank W.L. (Ed.)), pp. 73 - 85, Beverly Hills: Sage.
Wallerstein I. (1980) The Modern World-System II: Mercantilism and the Consolidation of the European World-economy, 1600-1750. New York & London: Academic Press.
Wallerstein I. (1982), 'Socialist States: Mercantilist Strategies and Revolutionary Objectives' in 'Ascent and Decline in the World - System' (Friedman E. (Ed.)), pp. 289 - 300, Beverly Hills: Sage.
Wallerstein I. (1983a), 'Crises: The World Economy, the Movements, and the Ideologies' in 'Crises in the World - System' (Bergesen A. (Ed.)), pp. 21 - 36, Beverly Hills: Sage.
Wallerstein I. (1983b), 'Historical Capitalism' London: Verso. Wallerstein I. (1984), 'Der historische Kapitalismus. Uebersetzt von Uta Lehmann - Grube mit
C:\Dokumente und Einstellungen\wj1\Lokale Einstellungen\Temporary Internet Files\OLKE6\20_01_2009_Transnationale
Konzerne und die Krise in Europa.doc
118
einem Nachwort herausgegeben von Hans Heinrich Nolte' Westberlin: Argument - Verlag.
Wallerstein I. (1986), ''Krise als Uebergang' in 'Dynamik der globalen Krise' (Amin S. and associates), pp. 4 - 35, Opladen: Westdeutscher Verlag.
Wallerstein I. (1989a) The Modern World-System III: The Second Era of Great Expansion of the Capitalist World-Economy, 1730-1840s. New York & London: Academic Press.
Wallerstein I. (1989b), 'The National and the Universal: Canada There Be Such a Thing as World Culture?'. Fernand Braudel Centre for the Study of Economies, Historical Systems, and Civilizations, Binghamton, New York: Suny Binghamton.
Wallerstein I. (1990), 'America and the World: Today, Yesterday, and Tomorrow' Fernand Braudel Centre for the Study of Economies, Historical Systems, and Civilizations, Binghamton, New York: Suny Binghamton.
Wallerstein I. (1991a), 'The Concept of National Development, 1917 - 1989: Elegy and Requiem' Fernand Braudel Centre for the Study of Economies, Historical Systems, and Civilizations, Binghamton, New York: Suny Binghamton.
Wallerstein I. (1991b), 'Who Excludes Whom? or The Collapse of Liberalism and the Dilemmas of Antisystemic Strategy' Fernand Braudel Centre for the Study of Economies, Historical Systems, and Civilizations, Binghamton, New York: Suny Binghamton.
Wallerstein I. (1997), ‘The Rise of East Asia, or The World-System in the Twenty-First Century’ SUNY Binghamton, http://fbc.binghamton.edu/iwrise-htm.
Wallerstein I. (1998), ‘Is Japan Rising or Declining?’ Commentary 3, 1, Fernand Braudel Center, Binghamton University.
Wallerstein I. (2000), ‘The Essential Wallerstein’ New York: The New Press. Weil P. (2005), ‚A Flexible Framework for a Plural Europe’ Paris: CNRS (Discussion paper
prepared for the UK Presidency, available at http://www.eu2005.gov.uk/servlet/Front?pagename=OpenMarket/Xcelerate/ShowPage&c=Page&cid=1107293391098&a=KArticle&aid=1119527321606).
Went R. (2002), ‘The Enigma of Globalisation: A Journey to a New Stage of Capitalism’ London and New York: Routledge.
Wheelwright T. (2001), 'Developments in the Global Economy and their Effects on Australia' available at: http://www.angelfire.com/ma/rank/tedw.html.
Wimberley D. W. and Bello R. (1992), Effects of Foreign Investment, Exports, and Economic Growth on Third World Food Consumption. Social Forces, 70:895-921.
Wood A. (1994), 'Structural Unemployment in the North: Global Causes, Domestic Cures' Vienna: Kreisky Commission Symposion, 21 - 22 March.
Woods A. (2000), ‘A socialist alternative to the European Union’ Available from the Internet at http://www.newyouth.com/archives/westerneurope/a_socialist_alternative_to_the_e.html.
Woodward A. and Kohli M. (2001), ‘Inclusions and Exclusions in European Societies.” London and New York: Routledge.
Yotopoulos P. A. (1966), ‘Economic analysis and economic policy’. Edited by Pan A. Yotopoulos. Contributors: Arthur S. Goldberger [and others]. Athens [Center of Planning and Economic Research] (Center of Planning and Economic Research. Training seminar series, 6).
Yotopoulos P. A. (1967), ‘Allocative efficiency in economic development; a cross section analysis of Epirus farming’ Athens [Center of Planning and Economic Research] (Center of Planning and Economic Research. Research monograph series, 18).
Yotopoulos P. A. (1977), ‘The population problem and the development solution’ Stanford, Calif.: Food Research Institute, Stanford University, (Food Research Institute studies ; v. 16, no. 1).
Yotopoulos P. A. (1984), ‘Middle income classes and food crises’ Athens: Centre of Planning and Economic Research, (Papers / Centre of Planning and Economic Research; 5).
Yotopoulos P. A. (1989a), ‘Distributions of real income: Within countries and by world income classes’. The Review of income and wealth, no. 4, pp. 357 ff. .
Yotopoulos P. A. (1989b), ‘The (Rip) Tide of Privatization: Lessons from Chile.’ World development, vol. 17, no. 5, pp. 683 ff. .
Yotopoulos P. A. (1989c), ‘The meta-production function approach to technological change in
C:\Dokumente und Einstellungen\wj1\Lokale Einstellungen\Temporary Internet Files\OLKE6\20_01_2009_Transnationale
Konzerne und die Krise in Europa.doc
119
world agriculture.’ Journal of development economics, vol. 31, no. 2, pp. 241 ff. . Yotopoulos P. A. (1996), ‘Exchange rate parity for trade and development: theory, tests, and
case studies’ Cambridge [England]; New York: Cambridge University Press. Yotopoulos P. A. (1997a), ‘Financial crises and the benefits of mildly repressed exchange rates’
Stockholm: Stockholm School of Economics, Economic Research Institute, (Working paper series in economics and finance ; no. 202, October 1997).
Yotopoulos P. A. (1997b), ‘Food security, gender and population’ New York, NY: United Nations Population Fund, "E/850/1997".
Yotopoulos P. A. and Floro S. L. (1992), ‘Income distribution, transaction costs and market fragmentation in informal credit markets.’ Cambridge journal of economics, 1992 , vol. 16, no. 3, pp. 303 ff.
Yotopoulos P. A. and Lin J. Y. (1993), ‘Purchasing Power Parities for Taiwan: The Basic Data for 1985 and International Comparisons.’ Journal of economic development, 1993 , vol. 18, no. 1, pp. 7 ff.
Yotopoulos P. A., Nugent J. B. (1976), ‘Economics of development: empirical investigations’ New York: Harper & Row.
Yotopoulos P. and Sawada Y. (2005), ‘Exchange Rate Misalignment: A New test of Long-Run PPP Based on Cross-Country Data’ CIRJE Discussion Paper CIRJE-F-318, February 2005, Faculty of Economics, University of Tokyo, available at: http://www.e.u-tokyo.ac.jp/cirje/research/dp/2005/2005cf318.pdf .