Embed Size (px)
Citation preview

Discussiedocument
Cindy van Rijswick – 28 januari 2016
Grenzen verleggen: naar slimmere sierteeltclusters
2
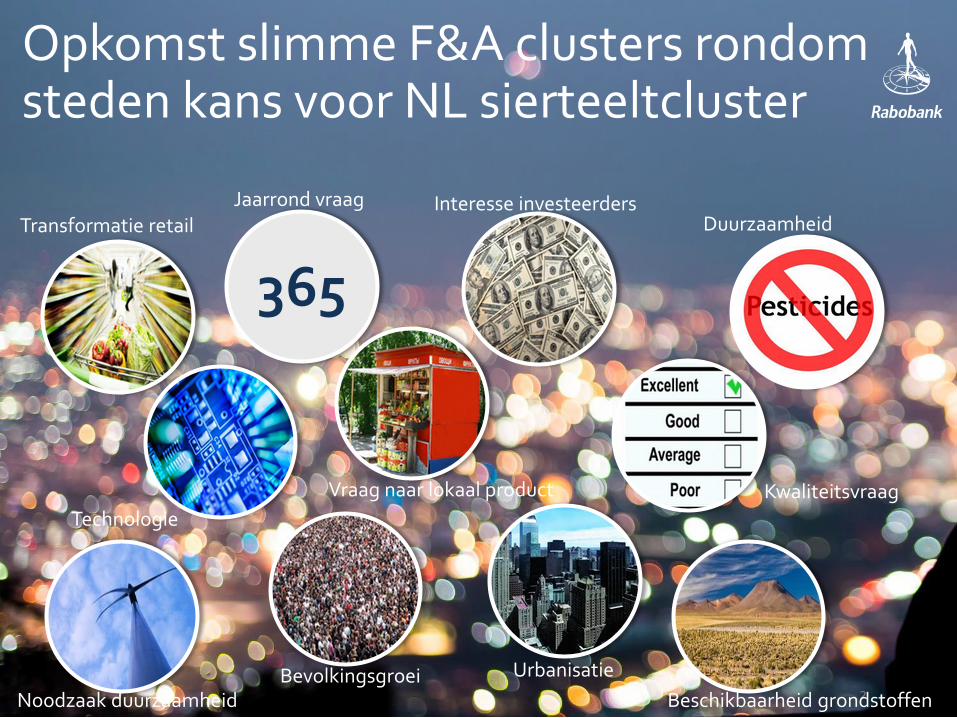
Opkomst slimme F&A clusters rondom steden kans voor NL sierteeltcluster
365
Transformatie retailJaarrond vraag
Kwaliteitsvraag
Duurzaamheid
Noodzaak duurzaamheidBevolkingsgroei Urbanisatie
Beschikbaarheid grondstoffen
Vraag naar lokaal product
Interesse investeerders
Technologie

Forse groei in investeringen F&A technologie
3Source: AgFunder, Rabobank, 2015
Behalve in startups wordt er
ook door bestaande F&A
bedrijven geïnvesteerd in:
1. Primaire productie
2. Verwerking
3. Handel, logistiek,
verpakkingen
Investeringen in F&A startups
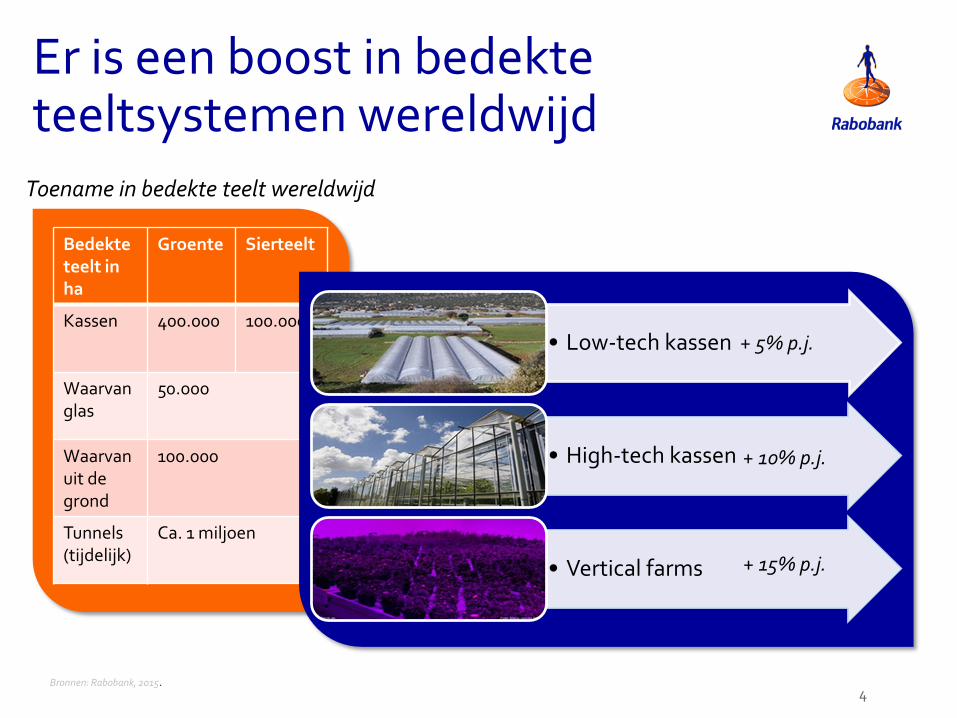
Bedekteteelt in ha
Groente Sierteelt
Kassen 400.000 100.000
Waarvanglas
50.000
Waarvanuit de grond
100.000
Tunnels (tijdelijk)
Ca. 1 miljoen
Er is een boost in bedekte teeltsystemen wereldwijd
4
• Low-tech kassen
• High-tech kassen
• Vertical farms
+ 5% p.j.
+ 1o% p.j.
+ 15% p.j.
Bronnen: Rabobank, 2015.
Toename in bedekte teelt wereldwijd

5Source: Rabobank, 2015
Het schap van de
toekomst?
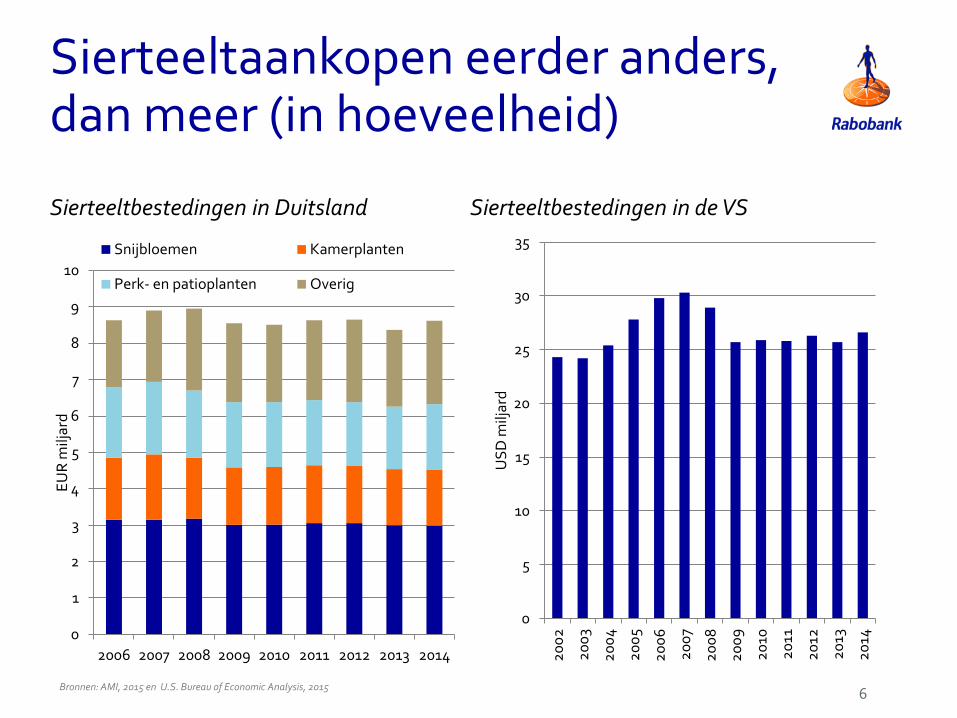
Sierteeltaankopen eerder anders, dan meer (in hoeveelheid)
6
Sierteeltbestedingen in Duitsland Sierteeltbestedingen in de VS
0
1
2
3
4
5
6
7
8
9
10
2006 2007 2008 2009 2010 2011 2012 2013 2014
EU
R m
iljar
d
Snijbloemen Kamerplanten
Perk- en patioplanten Overig
0
5
10
15
20
25
30
35
20
02
20
03
20
04
20
05
20
06
20
07
20
08
20
09
20
10
20
11
20
12
20
13
20
14
US
D m
iljar
d
Bronnen: AMI, 2015 en U.S. Bureau of Economic Analysis, 2015

Voorbeeld van toename in diversiteit in VK-retailmarkt
Source: Rabobank analysis based on EPOS and KANTAR, 12 w\e 13th October, 2014
0 50 100 150 200
Co-op
Asda
Sainsbury’s
Tesco
Morrison’s
Waitrose
Aldi
Fair share van food retailers in bloemenverkoop

Traditionele retail staat aan de vooravond van grote veranderingen
8
Trend in EBIT-marges van West-Europese supermarktketens, 2006-14
Omzet bloemenspeciaalzaken in Nederland (EUR mln)
Opmerking: linker grafiek bevat data van Ahold, Carrefour, Colruyt, Delhaize, Kesko Grocery, Mercadona, Morrisons, Sainsbury’s, Tesco. Bronnen: jaarverslagen, Bloomberg, Amadeus, Rabobank, 2015.
800
810
820
830
840
850
860
870
880
890
2012 2013 2014

Online retail is een ‘game changer’ voor de gehele ketenImpact van online boodschappen doen op de keten
Ander schap
Meer concurrentie
Meer retailer controle
Andere marketing
Complexiteit: consistentie, verpakking, rijpheid
Ketenverkorting
In 2030 ca. 25% van de supermarkt- boodschappen
online

Grote internationale partijen krijgen macht over scherm en data
10

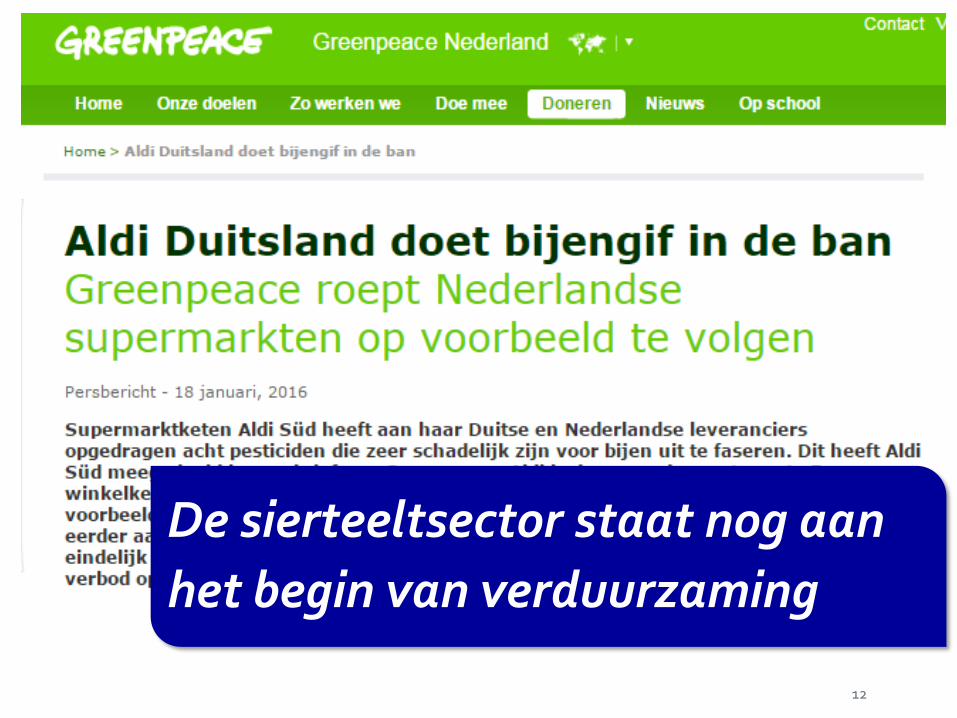
Sierteeltbedrijven krijgen meer te maken met maatschappelijke eisen
11
Wat doen
we met
afval?
Zijn deze
planten
duurzaam?
Wie bezit
mijn
gegevens?Is GMO wel
veilig?
12
De sierteeltsector staat nog aan
het begin van verduurzaming

Toename lokale teelt een factor om rekening mee te houden
13
-12
-10
-8
-6
-4
-2
0
2
4
6
8
2008 2009 2010 2011 2012 2013 2014
% j-o-j
Snijbloemen glas Snijbloemen open teelt Bloeiende kamerplanten Perkplanten
Areaaluitbreiding Duitse sierteelt (groei ten opzicht van voorgaande jaar)
Bron: AMI, 2015.

Marktgroei en exportgroei zijn geen vanzelfsprekendheden
14
-6
-4
-2
0
2
4
6
8
10
12
0
500
1000
1500
2000
2500
3000
3500
4000
2000 2001 2002 2003 2004 2005 2006 2007 2008 2009 2010 2011 2012 2013 2014 2015
% j-
o-j
EU
R m
iljo
en
Snijbloemen Planten Groei j-o-j
Export snijbloemen en pot- en perkplanten vanuit Nederland
Bron: Rabobank op basis van HBAG, Floridata en VGB.

Nederlands sierteeltcluster houdt zich knap staande in internationale handel
15
0
20
40
60
80
100
120
140
160
180
Gemiddelde 2005-2009 Gemiddelde 2010-2014
CEP index planten CEP index snijbloemen
0
2
4
6
8
10
12
14
16
Gemiddelde 2005-09 Gemiddelde 2010-14
CEP= comparative export performance. CEP = (Xij / Xit) / (Xnj / Xnt) = (Xij / Xnj ) / (Xit / Xnt) where X represents exports, i is a country, j is a commodity, t is total commodity trade, n is world total. Bron: Rabobank op basis van UN-Comtrade, 2016.

Teelt in Nederland is een belangrijke pijler voor het sierteeltcluster…
16
0
100
200
300
400
500
600
700
800
900
1000
Are
aal i
n N
eder
lan
d (h
a)
Groene planten Bloeiende planten
0
500
1000
1500
2000
2500
3000
3500
4000
20
00
20
01
20
02
20
03
20
04
20
05
20
06
20
07
20
08
20
09
20
10
20
11
20
12
20
13
20
14
20
15*
Anthurium Chrysanten Fresia's
Gerbera's Lelies Orchideeën
Rozen Overig
Bron: CBS, 2015
Anders dan bij snijbloemen is er wel een verschuiving maar geen daling in teelt van potplanten geweest in Nederland

… maar verdere stappen in internationalisering onvermijdelijk
Opzetten van Local-for-Local productie en local-for-local toelevering en kennisontwikkeling
Export vanuit Nederland
Lage-kostenproductie elders
Bron: Rabobank, 2016.
Export van techniek en kennis
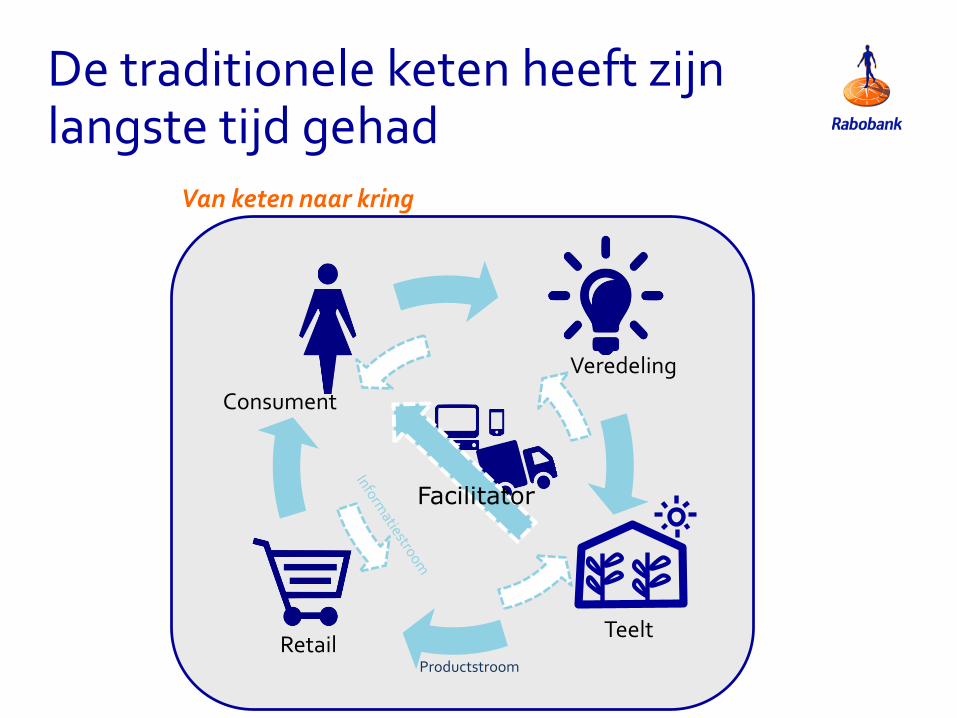
De traditionele keten heeft zijn langste tijd gehad
Veredeling
TeeltRetail
Consument
Productstroom
Facilitator
Van keten naar kring

19
Duurzameinternationale
kringlopen
Nieuwetechnologie
Diversiteit in product-
markt-kanaalcombinaties
Slimmer sierteelt-
cluster
Naar een slimmer
sierteeltcluster

Rabobank: dichtbij en internationaal bankieren met kennis
20
Global Food & Agribusiness Research and advisory team
Grains andOilseeds
F&A SupplyChains
Animal Protein
Beverages Dairy Farm Inputs
SugarConsumer Foods
Fresh Produce
21
This document has been prepared exclusively for your benefit and does not carry any right of publication or disclosure other than to Coöperatieve Rabobank U.A. (“Rabobank”), registered in Amsterdam. Neither this document nor any of its contents may be distributed, reproduced or used for any other purpose without the prior written consent of Rabobank. The information in this document reflects prevailing market conditions and our judgement as of this date, all of which may be subject to change. This document is based on public information. The information and opinions contained in this document have been compiled or derived from sources believed to be reliable, without independent verification. The information and opinions contained in this document are indicative and for discussion purposes only. No rights may be derived from any potential offers, transactions, commercial ideas et cetera contained in this document. This document does not constitute an offer or invitation. This document shall not form the basis of or cannot be relied upon in connection with any contract or commitment whatsoever.The information in this document is not intended and may not be understood as an advice (including without limitation an advice within the meaning of article 1:1 and article 4:23 of the Dutch Financial Supervision Act). This document is governed by Dutch law. The competent court in Amsterdam, The Netherlands has exclusive jurisdiction to settle any dispute which may arise out of or in connection with this document and/or any discussions or negotiations based on it. This report has been published in line with Rabobank’s long-term commitment to international food and agribusiness. It is one of a series of publications undertaken by the global department of Food & Agribusiness Research and Advisory. ©2016 - All Rights Reserved.
Bedankt voor uw [email protected]
21


![[Webinar] Office 365:Slimmer samenwerken in een project](https://img.pdfslide.tips/doc/110x75/55cf1665bb61eb2c718b470d/webinar-office-365slimmer-samenwerken-in-een-project.jpg)