Embed Size (px)
Citation preview
Measurement of Muon Annual Modulation and Muon-Induced Phosphorescence inNaI(Tl) Crystals with DM-Ice17
J. Cherwinka,1 D. Grant,2 F. Halzen,3 K. M. Heeger,4 L. Hsu,5 A. J. F. Hubbard,3, 4, ∗ A. Karle,3 M. Kauer,3, 4
V. A. Kudryavtsev,6 K. E. Lim,4 C. Macdonald,6 R. H. Maruyama,4, † S. M. Paling,7 W. Pettus,3, 4
Z. P. Pierpoint,3, 4 B. N. Reilly,3, 4, ‡ M. Robinson,6 P. Sandstrom,3 N. J. C. Spooner,6 S. Telfer,6 and L. Yang8
(The DM-Ice Collaboration)1Physical Sciences Laboratory, University of Wisconsin-Madison, Stoughton, WI 53589, USA
2Department of Physics, University of Alberta, Edmonton, Alberta, Canada3Department of Physics and Wisconsin IceCube Particle Astrophysics Center,
University of Wisconsin-Madison, Madison, WI 53706, USA4Department of Physics, Yale University, New Haven, CT 06520, USA
5Fermi National Accelerator Laboratory, Batavia, IL 60510, USA6Department of Physics and Astronomy, University of Sheffield, Sheffield, UK
7STFC Boulby Underground Science Facility, Boulby Mine, Cleveland, UK8Department of Physics, University of Illinois at Urbana-Champaign, Urbana, IL 61801, USA
(Dated: February 29, 2016)
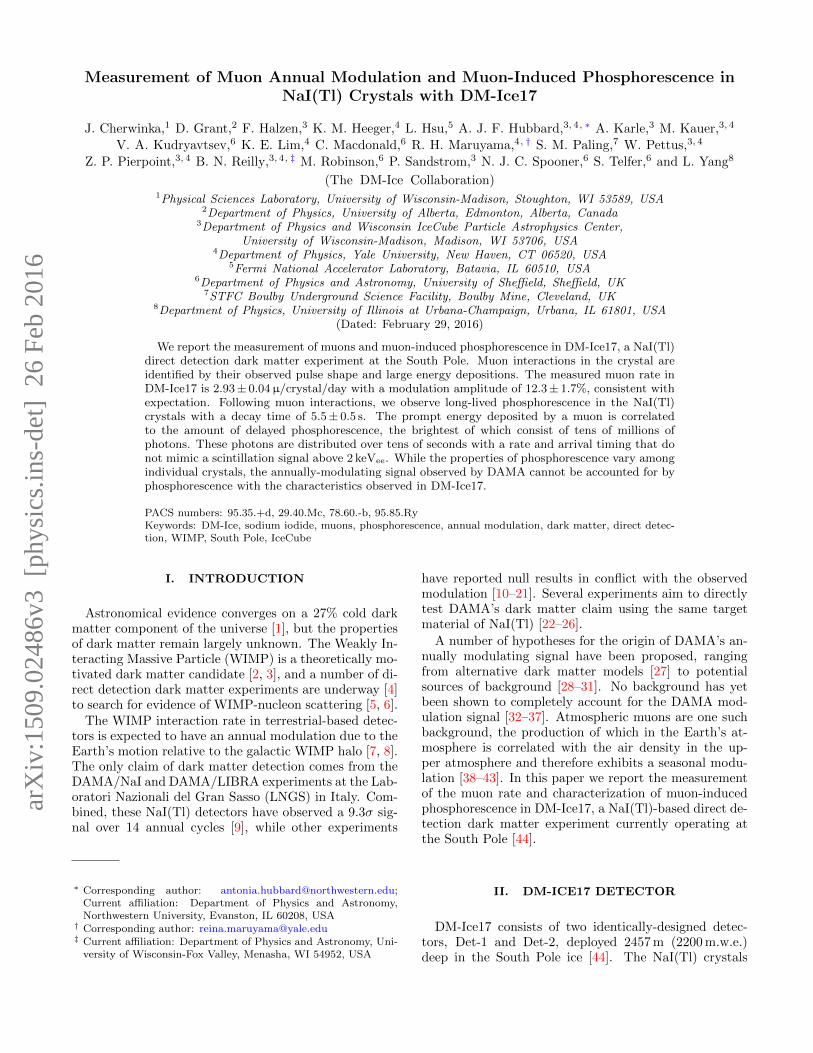
We report the measurement of muons and muon-induced phosphorescence in DM-Ice17, a NaI(Tl)direct detection dark matter experiment at the South Pole. Muon interactions in the crystal areidentified by their observed pulse shape and large energy depositions. The measured muon rate inDM-Ice17 is 2.93± 0.04µ/crystal/day with a modulation amplitude of 12.3± 1.7%, consistent withexpectation. Following muon interactions, we observe long-lived phosphorescence in the NaI(Tl)crystals with a decay time of 5.5± 0.5 s. The prompt energy deposited by a muon is correlatedto the amount of delayed phosphorescence, the brightest of which consist of tens of millions ofphotons. These photons are distributed over tens of seconds with a rate and arrival timing that donot mimic a scintillation signal above 2 keVee. While the properties of phosphorescence vary amongindividual crystals, the annually-modulating signal observed by DAMA cannot be accounted for byphosphorescence with the characteristics observed in DM-Ice17.
PACS numbers: 95.35.+d, 29.40.Mc, 78.60.-b, 95.85.RyKeywords: DM-Ice, sodium iodide, muons, phosphorescence, annual modulation, dark matter, direct detec-tion, WIMP, South Pole, IceCube
I. INTRODUCTION
Astronomical evidence converges on a 27% cold darkmatter component of the universe [1], but the propertiesof dark matter remain largely unknown. The Weakly In-teracting Massive Particle (WIMP) is a theoretically mo-tivated dark matter candidate [2, 3], and a number of di-rect detection dark matter experiments are underway [4]to search for evidence of WIMP-nucleon scattering [5, 6].
The WIMP interaction rate in terrestrial-based detec-tors is expected to have an annual modulation due to theEarth’s motion relative to the galactic WIMP halo [7, 8].The only claim of dark matter detection comes from theDAMA/NaI and DAMA/LIBRA experiments at the Lab-oratori Nazionali del Gran Sasso (LNGS) in Italy. Com-bined, these NaI(Tl) detectors have observed a 9.3σ sig-nal over 14 annual cycles [9], while other experiments
∗ Corresponding author: [email protected];Current affiliation: Department of Physics and Astronomy,Northwestern University, Evanston, IL 60208, USA† Corresponding author: [email protected]‡ Current affiliation: Department of Physics and Astronomy, Uni-
versity of Wisconsin-Fox Valley, Menasha, WI 54952, USA
have reported null results in conflict with the observedmodulation [10–21]. Several experiments aim to directlytest DAMA’s dark matter claim using the same targetmaterial of NaI(Tl) [22–26].
A number of hypotheses for the origin of DAMA’s an-nually modulating signal have been proposed, rangingfrom alternative dark matter models [27] to potentialsources of background [28–31]. No background has yetbeen shown to completely account for the DAMA mod-ulation signal [32–37]. Atmospheric muons are one suchbackground, the production of which in the Earth’s at-mosphere is correlated with the air density in the up-per atmosphere and therefore exhibits a seasonal modu-lation [38–43]. In this paper we report the measurementof the muon rate and characterization of muon-inducedphosphorescence in DM-Ice17, a NaI(Tl)-based direct de-tection dark matter experiment currently operating atthe South Pole [44].
II. DM-ICE17 DETECTOR
DM-Ice17 consists of two identically-designed detec-tors, Det-1 and Det-2, deployed 2457 m (2200 m.w.e.)deep in the South Pole ice [44]. The NaI(Tl) crystals
arX
iv:1
509.
0248
6v3
[ph
ysic
s.in
s-de
t] 2
6 Fe
b 20
16
2
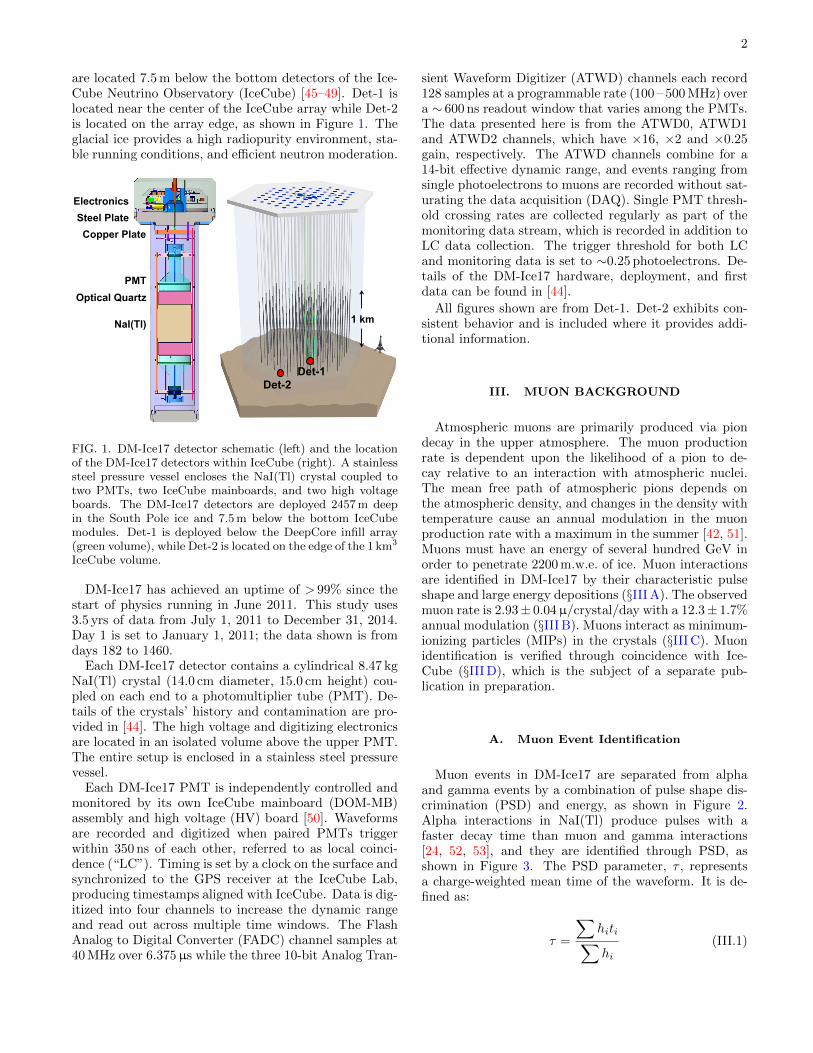
are located 7.5 m below the bottom detectors of the Ice-Cube Neutrino Observatory (IceCube) [45–49]. Det-1 islocated near the center of the IceCube array while Det-2is located on the array edge, as shown in Figure 1. Theglacial ice provides a high radiopurity environment, sta-ble running conditions, and efficient neutron moderation.
Det-1 Det-2
2’’ Optical Quartz
NaI(Tl)
5’’ ETL PMT
1’’ Copper Plate 2’’ Steel Plate
Electronics
Optical Quartz
NaI(Tl)
PMT
Copper Plate
Electronics Steel Plate
1 km
FIG. 1. DM-Ice17 detector schematic (left) and the locationof the DM-Ice17 detectors within IceCube (right). A stainlesssteel pressure vessel encloses the NaI(Tl) crystal coupled totwo PMTs, two IceCube mainboards, and two high voltageboards. The DM-Ice17 detectors are deployed 2457 m deepin the South Pole ice and 7.5 m below the bottom IceCubemodules. Det-1 is deployed below the DeepCore infill array(green volume), while Det-2 is located on the edge of the 1 km3
IceCube volume.
DM-Ice17 has achieved an uptime of > 99% since thestart of physics running in June 2011. This study uses3.5 yrs of data from July 1, 2011 to December 31, 2014.Day 1 is set to January 1, 2011; the data shown is fromdays 182 to 1460.
Each DM-Ice17 detector contains a cylindrical 8.47 kgNaI(Tl) crystal (14.0 cm diameter, 15.0 cm height) cou-pled on each end to a photomultiplier tube (PMT). De-tails of the crystals’ history and contamination are pro-vided in [44]. The high voltage and digitizing electronicsare located in an isolated volume above the upper PMT.The entire setup is enclosed in a stainless steel pressurevessel.
Each DM-Ice17 PMT is independently controlled andmonitored by its own IceCube mainboard (DOM-MB)assembly and high voltage (HV) board [50]. Waveformsare recorded and digitized when paired PMTs triggerwithin 350 ns of each other, referred to as local coinci-dence (“LC”). Timing is set by a clock on the surface andsynchronized to the GPS receiver at the IceCube Lab,producing timestamps aligned with IceCube. Data is dig-itized into four channels to increase the dynamic rangeand read out across multiple time windows. The FlashAnalog to Digital Converter (FADC) channel samples at40 MHz over 6.375µs while the three 10-bit Analog Tran-
sient Waveform Digitizer (ATWD) channels each record128 samples at a programmable rate (100 – 500 MHz) overa ∼ 600 ns readout window that varies among the PMTs.The data presented here is from the ATWD0, ATWD1and ATWD2 channels, which have ×16, ×2 and ×0.25gain, respectively. The ATWD channels combine for a14-bit effective dynamic range, and events ranging fromsingle photoelectrons to muons are recorded without sat-urating the data acquisition (DAQ). Single PMT thresh-old crossing rates are collected regularly as part of themonitoring data stream, which is recorded in addition toLC data collection. The trigger threshold for both LCand monitoring data is set to ∼0.25 photoelectrons. De-tails of the DM-Ice17 hardware, deployment, and firstdata can be found in [44].
All figures shown are from Det-1. Det-2 exhibits con-sistent behavior and is included where it provides addi-tional information.
III. MUON BACKGROUND
Atmospheric muons are primarily produced via piondecay in the upper atmosphere. The muon productionrate is dependent upon the likelihood of a pion to de-cay relative to an interaction with atmospheric nuclei.The mean free path of atmospheric pions depends onthe atmospheric density, and changes in the density withtemperature cause an annual modulation in the muonproduction rate with a maximum in the summer [42, 51].Muons must have an energy of several hundred GeV inorder to penetrate 2200 m.w.e. of ice. Muon interactionsare identified in DM-Ice17 by their characteristic pulseshape and large energy depositions (§III A). The observedmuon rate is 2.93± 0.04µ/crystal/day with a 12.3± 1.7%annual modulation (§III B). Muons interact as minimum-ionizing particles (MIPs) in the crystals (§III C). Muonidentification is verified through coincidence with Ice-Cube (§III D), which is the subject of a separate pub-lication in preparation.
A. Muon Event Identification
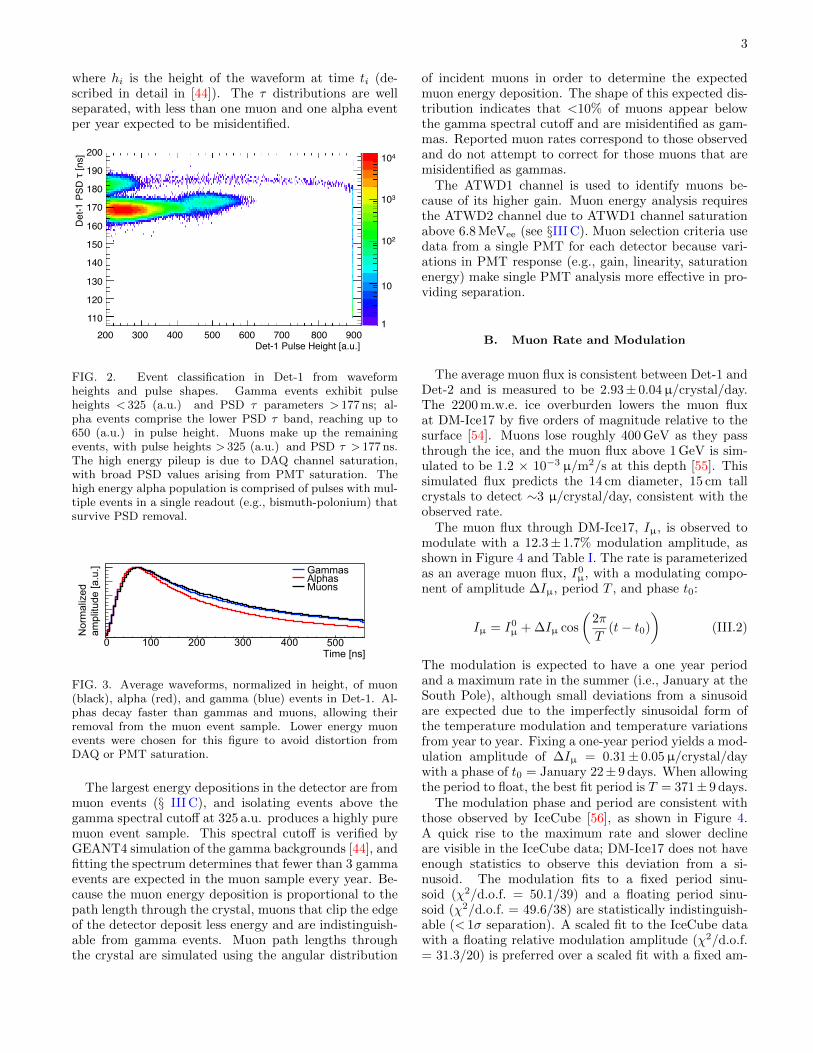
Muon events in DM-Ice17 are separated from alphaand gamma events by a combination of pulse shape dis-crimination (PSD) and energy, as shown in Figure 2.Alpha interactions in NaI(Tl) produce pulses with afaster decay time than muon and gamma interactions[24, 52, 53], and they are identified through PSD, asshown in Figure 3. The PSD parameter, τ , representsa charge-weighted mean time of the waveform. It is de-fined as:
τ =
∑hiti∑hi
(III.1)
3
where hi is the height of the waveform at time ti (de-scribed in detail in [44]). The τ distributions are wellseparated, with less than one muon and one alpha eventper year expected to be misidentified.
200
190
180
170
160
150
140
130
120
110200 300 400 500 600 700 800 900
Det-1 Pulse Height [a.u.]
Det
-1 P
SD τ
[ ns] 104
103
102
10
1
FIG. 2. Event classification in Det-1 from waveformheights and pulse shapes. Gamma events exhibit pulseheights < 325 (a.u.) and PSD τ parameters > 177 ns; al-pha events comprise the lower PSD τ band, reaching up to650 (a.u.) in pulse height. Muons make up the remainingevents, with pulse heights > 325 (a.u.) and PSD τ > 177 ns.The high energy pileup is due to DAQ channel saturation,with broad PSD values arising from PMT saturation. Thehigh energy alpha population is comprised of pulses with mul-tiple events in a single readout (e.g., bismuth-polonium) thatsurvive PSD removal.
Time [ns]0 100 200 300 400
Nor
mal
ized
am
plitu
de [a
.u.] Gammas
Alphas Muons
500
FIG. 3. Average waveforms, normalized in height, of muon(black), alpha (red), and gamma (blue) events in Det-1. Al-phas decay faster than gammas and muons, allowing theirremoval from the muon event sample. Lower energy muonevents were chosen for this figure to avoid distortion fromDAQ or PMT saturation.
The largest energy depositions in the detector are frommuon events (§ III C), and isolating events above thegamma spectral cutoff at 325 a.u. produces a highly puremuon event sample. This spectral cutoff is verified byGEANT4 simulation of the gamma backgrounds [44], andfitting the spectrum determines that fewer than 3 gammaevents are expected in the muon sample every year. Be-cause the muon energy deposition is proportional to thepath length through the crystal, muons that clip the edgeof the detector deposit less energy and are indistinguish-able from gamma events. Muon path lengths throughthe crystal are simulated using the angular distribution
of incident muons in order to determine the expectedmuon energy deposition. The shape of this expected dis-tribution indicates that <10% of muons appear belowthe gamma spectral cutoff and are misidentified as gam-mas. Reported muon rates correspond to those observedand do not attempt to correct for those muons that aremisidentified as gammas.
The ATWD1 channel is used to identify muons be-cause of its higher gain. Muon energy analysis requiresthe ATWD2 channel due to ATWD1 channel saturationabove 6.8 MeVee (see §III C). Muon selection criteria usedata from a single PMT for each detector because vari-ations in PMT response (e.g., gain, linearity, saturationenergy) make single PMT analysis more effective in pro-viding separation.
B. Muon Rate and Modulation
The average muon flux is consistent between Det-1 andDet-2 and is measured to be 2.93± 0.04µ/crystal/day.The 2200 m.w.e. ice overburden lowers the muon fluxat DM-Ice17 by five orders of magnitude relative to thesurface [54]. Muons lose roughly 400 GeV as they passthrough the ice, and the muon flux above 1 GeV is sim-ulated to be 1.2 × 10⁻³ µ/m2/s at this depth [55]. Thissimulated flux predicts the 14 cm diameter, 15 cm tallcrystals to detect ∼3 µ/crystal/day, consistent with theobserved rate.
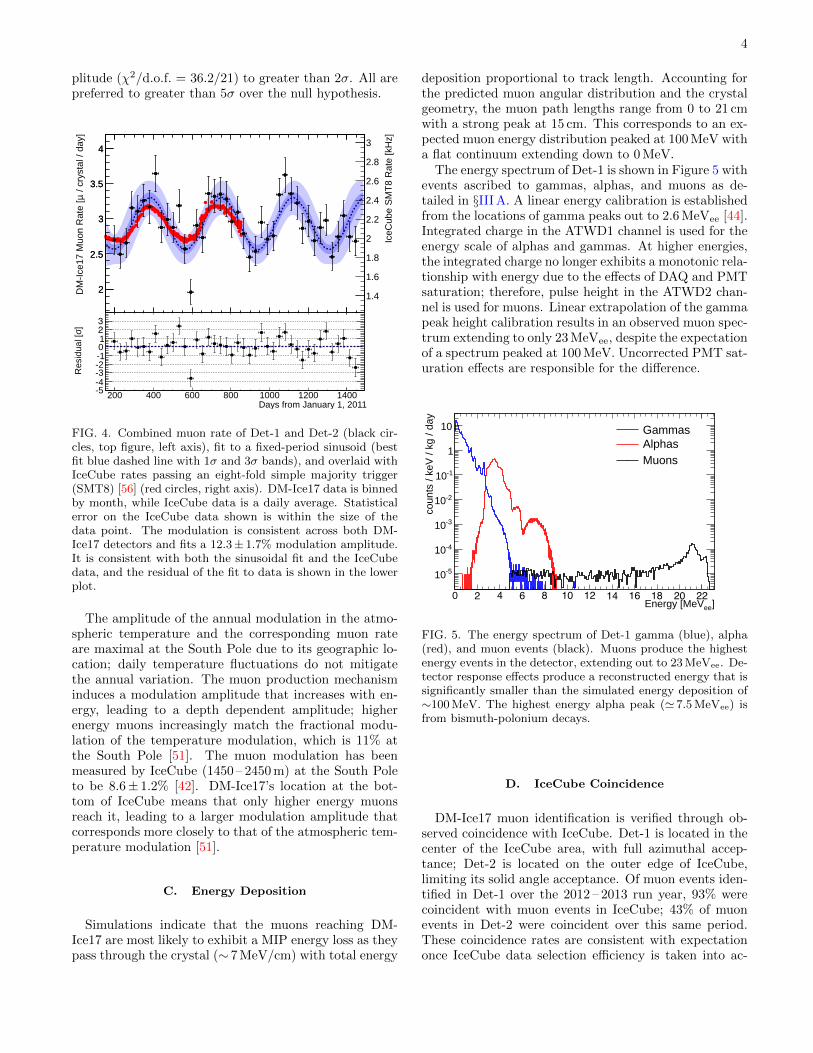
The muon flux through DM-Ice17, Iµ, is observed tomodulate with a 12.3± 1.7% modulation amplitude, asshown in Figure 4 and Table I. The rate is parameterizedas an average muon flux, I0µ, with a modulating compo-nent of amplitude ∆Iµ, period T , and phase t0:
Iµ = I0µ + ∆Iµ cos
(2π
T(t− t0)
)(III.2)
The modulation is expected to have a one year periodand a maximum rate in the summer (i.e., January at theSouth Pole), although small deviations from a sinusoidare expected due to the imperfectly sinusoidal form ofthe temperature modulation and temperature variationsfrom year to year. Fixing a one-year period yields a mod-ulation amplitude of ∆Iµ = 0.31± 0.05µ/crystal/daywith a phase of t0 = January 22± 9 days. When allowingthe period to float, the best fit period is T = 371± 9 days.
The modulation phase and period are consistent withthose observed by IceCube [56], as shown in Figure 4.A quick rise to the maximum rate and slower declineare visible in the IceCube data; DM-Ice17 does not haveenough statistics to observe this deviation from a si-nusoid. The modulation fits to a fixed period sinu-soid (χ2/d.o.f. = 50.1/39) and a floating period sinu-soid (χ2/d.o.f. = 49.6/38) are statistically indistinguish-able (< 1σ separation). A scaled fit to the IceCube datawith a floating relative modulation amplitude (χ2/d.o.f.= 31.3/20) is preferred over a scaled fit with a fixed am-
4
plitude (χ2/d.o.f. = 36.2/21) to greater than 2σ. All arepreferred to greater than 5σ over the null hypothesis.
Days from January 1, 2011200 400 600 800 1000 1200 1400
/ cr
ysta
l / d
ay]
µD
M-I
ce17
Muo
n R
ate
[
2
2.5
3
3.5
4
Days from January 1, 2011200 400 600 800 1000 1200 1400
IceC
ube
SM
T8
Rat
e [k
Hz]
1.4
1.6
1.8
2
2.2
2.4
2.6
2.8
3
200 400 600 800 1000 1200 1400
2
2.5
3
3.5
4
Days from January 1, 2011200 400 600 800 1000 1200 1400
]σR
esid
ual [
-5-4-3-2-101
32
FIG. 4. Combined muon rate of Det-1 and Det-2 (black cir-cles, top figure, left axis), fit to a fixed-period sinusoid (bestfit blue dashed line with 1σ and 3σ bands), and overlaid withIceCube rates passing an eight-fold simple majority trigger(SMT8) [56] (red circles, right axis). DM-Ice17 data is binnedby month, while IceCube data is a daily average. Statisticalerror on the IceCube data shown is within the size of thedata point. The modulation is consistent across both DM-Ice17 detectors and fits a 12.3± 1.7% modulation amplitude.It is consistent with both the sinusoidal fit and the IceCubedata, and the residual of the fit to data is shown in the lowerplot.
The amplitude of the annual modulation in the atmo-spheric temperature and the corresponding muon rateare maximal at the South Pole due to its geographic lo-cation; daily temperature fluctuations do not mitigatethe annual variation. The muon production mechanisminduces a modulation amplitude that increases with en-ergy, leading to a depth dependent amplitude; higherenergy muons increasingly match the fractional modu-lation of the temperature modulation, which is 11% atthe South Pole [51]. The muon modulation has beenmeasured by IceCube (1450 – 2450 m) at the South Poleto be 8.6± 1.2% [42]. DM-Ice17’s location at the bot-tom of IceCube means that only higher energy muonsreach it, leading to a larger modulation amplitude thatcorresponds more closely to that of the atmospheric tem-perature modulation [51].
C. Energy Deposition
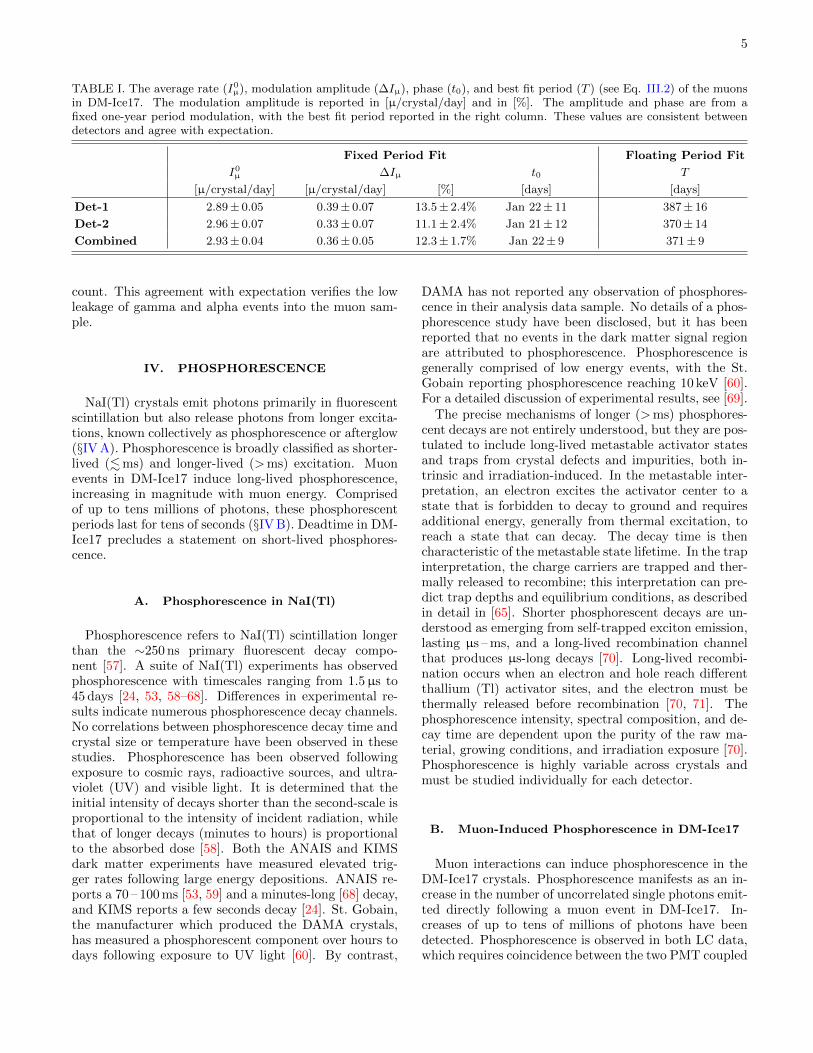
Simulations indicate that the muons reaching DM-Ice17 are most likely to exhibit a MIP energy loss as theypass through the crystal (∼ 7 MeV/cm) with total energy
deposition proportional to track length. Accounting forthe predicted muon angular distribution and the crystalgeometry, the muon path lengths range from 0 to 21 cmwith a strong peak at 15 cm. This corresponds to an ex-pected muon energy distribution peaked at 100 MeV witha flat continuum extending down to 0 MeV.
The energy spectrum of Det-1 is shown in Figure 5 withevents ascribed to gammas, alphas, and muons as de-tailed in §III A. A linear energy calibration is establishedfrom the locations of gamma peaks out to 2.6 MeVee [44].Integrated charge in the ATWD1 channel is used for theenergy scale of alphas and gammas. At higher energies,the integrated charge no longer exhibits a monotonic rela-tionship with energy due to the effects of DAQ and PMTsaturation; therefore, pulse height in the ATWD2 chan-nel is used for muons. Linear extrapolation of the gammapeak height calibration results in an observed muon spec-trum extending to only 23 MeVee, despite the expectationof a spectrum peaked at 100 MeV. Uncorrected PMT sat-uration effects are responsible for the difference.
]eeEnergy [MeV0
coun
ts /
keV
/ kg
/ da
y
-510
-410
-310
-210
-110
1
10 GammasAlphasMuons
2 64 8 10 12 14 16 18 20 22
FIG. 5. The energy spectrum of Det-1 gamma (blue), alpha(red), and muon events (black). Muons produce the highestenergy events in the detector, extending out to 23 MeVee. De-tector response effects produce a reconstructed energy that issignificantly smaller than the simulated energy deposition of∼100 MeV. The highest energy alpha peak (' 7.5 MeVee) isfrom bismuth-polonium decays.
D. IceCube Coincidence
DM-Ice17 muon identification is verified through ob-served coincidence with IceCube. Det-1 is located in thecenter of the IceCube area, with full azimuthal accep-tance; Det-2 is located on the outer edge of IceCube,limiting its solid angle acceptance. Of muon events iden-tified in Det-1 over the 2012 – 2013 run year, 93% werecoincident with muon events in IceCube; 43% of muonevents in Det-2 were coincident over this same period.These coincidence rates are consistent with expectationonce IceCube data selection efficiency is taken into ac-
5
TABLE I. The average rate (I0µ), modulation amplitude (∆Iµ), phase (t0), and best fit period (T ) (see Eq. III.2) of the muonsin DM-Ice17. The modulation amplitude is reported in [µ/crystal/day] and in [%]. The amplitude and phase are from afixed one-year period modulation, with the best fit period reported in the right column. These values are consistent betweendetectors and agree with expectation.
Fixed Period Fit Floating Period Fit
I0µ ∆Iµ t0 T
[µ/crystal/day] [µ/crystal/day] [%] [days] [days]
Det-1 2.89± 0.05 0.39± 0.07 13.5± 2.4% Jan 22± 11 387± 16
Det-2 2.96± 0.07 0.33± 0.07 11.1± 2.4% Jan 21± 12 370± 14
Combined 2.93± 0.04 0.36± 0.05 12.3± 1.7% Jan 22± 9 371± 9
count. This agreement with expectation verifies the lowleakage of gamma and alpha events into the muon sam-ple.
IV. PHOSPHORESCENCE
NaI(Tl) crystals emit photons primarily in fluorescentscintillation but also release photons from longer excita-tions, known collectively as phosphorescence or afterglow(§IV A). Phosphorescence is broadly classified as shorter-lived (.ms) and longer-lived (>ms) excitation. Muonevents in DM-Ice17 induce long-lived phosphorescence,increasing in magnitude with muon energy. Comprisedof up to tens millions of photons, these phosphorescentperiods last for tens of seconds (§IV B). Deadtime in DM-Ice17 precludes a statement on short-lived phosphores-cence.
A. Phosphorescence in NaI(Tl)
Phosphorescence refers to NaI(Tl) scintillation longerthan the ∼250 ns primary fluorescent decay compo-nent [57]. A suite of NaI(Tl) experiments has observedphosphorescence with timescales ranging from 1.5µs to45 days [24, 53, 58–68]. Differences in experimental re-sults indicate numerous phosphorescence decay channels.No correlations between phosphorescence decay time andcrystal size or temperature have been observed in thesestudies. Phosphorescence has been observed followingexposure to cosmic rays, radioactive sources, and ultra-violet (UV) and visible light. It is determined that theinitial intensity of decays shorter than the second-scale isproportional to the intensity of incident radiation, whilethat of longer decays (minutes to hours) is proportionalto the absorbed dose [58]. Both the ANAIS and KIMSdark matter experiments have measured elevated trig-ger rates following large energy depositions. ANAIS re-ports a 70 – 100 ms [53, 59] and a minutes-long [68] decay,and KIMS reports a few seconds decay [24]. St. Gobain,the manufacturer which produced the DAMA crystals,has measured a phosphorescent component over hours todays following exposure to UV light [60]. By contrast,
DAMA has not reported any observation of phosphores-cence in their analysis data sample. No details of a phos-phorescence study have been disclosed, but it has beenreported that no events in the dark matter signal regionare attributed to phosphorescence. Phosphorescence isgenerally comprised of low energy events, with the St.Gobain reporting phosphorescence reaching 10 keV [60].For a detailed discussion of experimental results, see [69].
The precise mechanisms of longer (>ms) phosphores-cent decays are not entirely understood, but they are pos-tulated to include long-lived metastable activator statesand traps from crystal defects and impurities, both in-trinsic and irradiation-induced. In the metastable inter-pretation, an electron excites the activator center to astate that is forbidden to decay to ground and requiresadditional energy, generally from thermal excitation, toreach a state that can decay. The decay time is thencharacteristic of the metastable state lifetime. In the trapinterpretation, the charge carriers are trapped and ther-mally released to recombine; this interpretation can pre-dict trap depths and equilibrium conditions, as describedin detail in [65]. Shorter phosphorescent decays are un-derstood as emerging from self-trapped exciton emission,lasting µs – ms, and a long-lived recombination channelthat produces µs-long decays [70]. Long-lived recombi-nation occurs when an electron and hole reach differentthallium (Tl) activator sites, and the electron must bethermally released before recombination [70, 71]. Thephosphorescence intensity, spectral composition, and de-cay time are dependent upon the purity of the raw ma-terial, growing conditions, and irradiation exposure [70].Phosphorescence is highly variable across crystals andmust be studied individually for each detector.
B. Muon-Induced Phosphorescence in DM-Ice17
Muon interactions can induce phosphorescence in theDM-Ice17 crystals. Phosphorescence manifests as an in-crease in the number of uncorrelated single photons emit-ted directly following a muon event in DM-Ice17. In-creases of up to tens of millions of photons have beendetected. Phosphorescence is observed in both LC data,which requires coincidence between the two PMT coupled
6
to the same crystal within 350 ns, and single PMT thresh-old crossings registered in monitoring data (see §II).
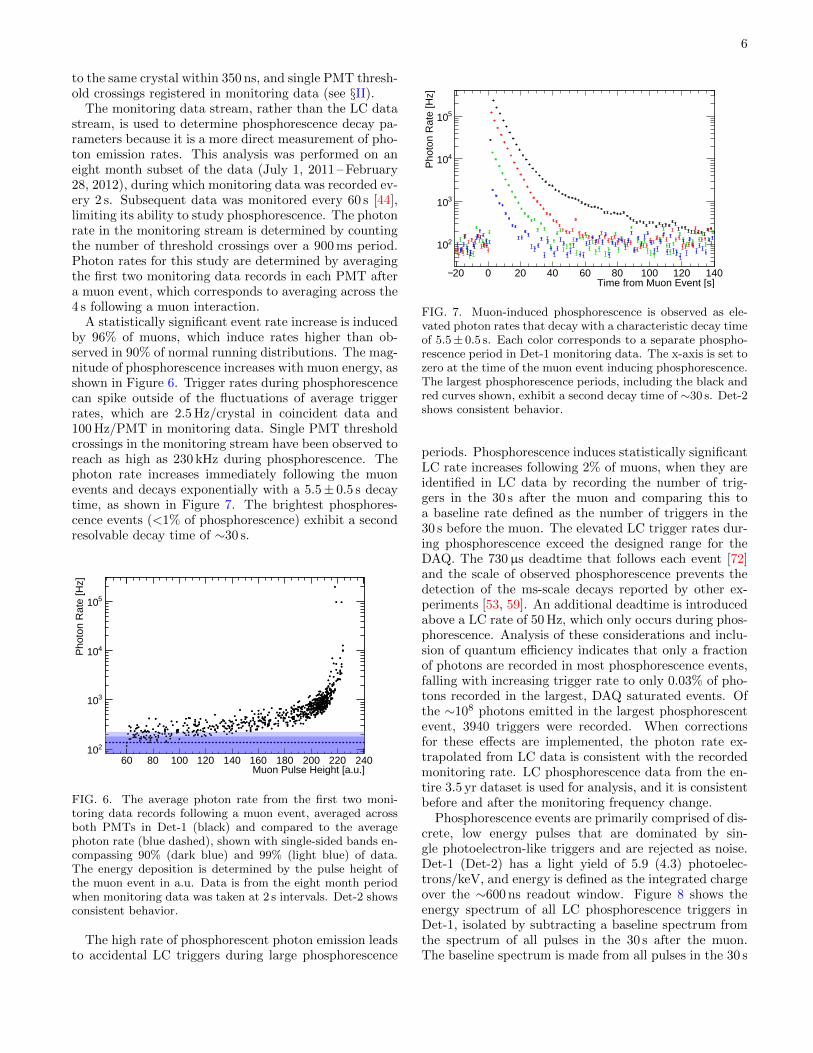
The monitoring data stream, rather than the LC datastream, is used to determine phosphorescence decay pa-rameters because it is a more direct measurement of pho-ton emission rates. This analysis was performed on aneight month subset of the data (July 1, 2011 – February28, 2012), during which monitoring data was recorded ev-ery 2 s. Subsequent data was monitored every 60 s [44],limiting its ability to study phosphorescence. The photonrate in the monitoring stream is determined by countingthe number of threshold crossings over a 900 ms period.Photon rates for this study are determined by averagingthe first two monitoring data records in each PMT aftera muon event, which corresponds to averaging across the4 s following a muon interaction.
A statistically significant event rate increase is inducedby 96% of muons, which induce rates higher than ob-served in 90% of normal running distributions. The mag-nitude of phosphorescence increases with muon energy, asshown in Figure 6. Trigger rates during phosphorescencecan spike outside of the fluctuations of average triggerrates, which are 2.5 Hz/crystal in coincident data and100 Hz/PMT in monitoring data. Single PMT thresholdcrossings in the monitoring stream have been observed toreach as high as 230 kHz during phosphorescence. Thephoton rate increases immediately following the muonevents and decays exponentially with a 5.5± 0.5 s decaytime, as shown in Figure 7. The brightest phosphores-cence events (<1% of phosphorescence) exhibit a secondresolvable decay time of ∼30 s.
Muon Pulse Height [a.u.]60 80 100 120 140 160 180 200 220 240
Pho
ton
Rat
e [H
z]
210
310
410
510
FIG. 6. The average photon rate from the first two moni-toring data records following a muon event, averaged acrossboth PMTs in Det-1 (black) and compared to the averagephoton rate (blue dashed), shown with single-sided bands en-compassing 90% (dark blue) and 99% (light blue) of data.The energy deposition is determined by the pulse height ofthe muon event in a.u. Data is from the eight month periodwhen monitoring data was taken at 2 s intervals. Det-2 showsconsistent behavior.
The high rate of phosphorescent photon emission leadsto accidental LC triggers during large phosphorescence
Time from Muon Event [s]20− 0 20 40 60 80 100 120 140
Pho
ton
Rat
e [H
z]
210
310
410
510
FIG. 7. Muon-induced phosphorescence is observed as ele-vated photon rates that decay with a characteristic decay timeof 5.5± 0.5 s. Each color corresponds to a separate phospho-rescence period in Det-1 monitoring data. The x-axis is set tozero at the time of the muon event inducing phosphorescence.The largest phosphorescence periods, including the black andred curves shown, exhibit a second decay time of ∼30 s. Det-2shows consistent behavior.
periods. Phosphorescence induces statistically significantLC rate increases following 2% of muons, when they areidentified in LC data by recording the number of trig-gers in the 30 s after the muon and comparing this toa baseline rate defined as the number of triggers in the30 s before the muon. The elevated LC trigger rates dur-ing phosphorescence exceed the designed range for theDAQ. The 730µs deadtime that follows each event [72]and the scale of observed phosphorescence prevents thedetection of the ms-scale decays reported by other ex-periments [53, 59]. An additional deadtime is introducedabove a LC rate of 50 Hz, which only occurs during phos-phorescence. Analysis of these considerations and inclu-sion of quantum efficiency indicates that only a fractionof photons are recorded in most phosphorescence events,falling with increasing trigger rate to only 0.03% of pho-tons recorded in the largest, DAQ saturated events. Ofthe ∼108 photons emitted in the largest phosphorescentevent, 3940 triggers were recorded. When correctionsfor these effects are implemented, the photon rate ex-trapolated from LC data is consistent with the recordedmonitoring rate. LC phosphorescence data from the en-tire 3.5 yr dataset is used for analysis, and it is consistentbefore and after the monitoring frequency change.
Phosphorescence events are primarily comprised of dis-crete, low energy pulses that are dominated by sin-gle photoelectron-like triggers and are rejected as noise.Det-1 (Det-2) has a light yield of 5.9 (4.3) photoelec-trons/keV, and energy is defined as the integrated chargeover the ∼600 ns readout window. Figure 8 shows theenergy spectrum of all LC phosphorescence triggers inDet-1, isolated by subtracting a baseline spectrum fromthe spectrum of all pulses in the 30 s after the muon.The baseline spectrum is made from all pulses in the 30 s
7
before the muon. LC phosphorescence triggers producea spectrum that is peaked below 1 keVee with no statis-tically significant component above 2 keVee even beforenoise rejection. Phosphorescence events do not mimicnormal scintillation events and are therefore rejected bythe standard noise removal procedures described in [44].This rejection leaves a spectrum that is consistent withthe average, non-phosphorescence background spectrumat all energies. Muon-induced phosphorescence thereforedoes not impact the dark matter analysis sample in DM-Ice17.
]eeEnergy [keV0 5 10 15 20
]µR
ate
[cou
nts
/ keV
/
0
5
10
15
20
25
30
] eeEnergy [keV0 5 10 15 20
]
µR
ate
[cou
nts
/ keV
/
-0.02
0
0.02
0.04
0.06
0.08 µAfter
Baseline
Residual
FIG. 8. ATWD0 energy spectrum of phosphorescent LC trig-gers in Det-1 (black), isolated by subtracting the baselinespectrum derived from all pulses in the 30 s before the muon(blue) from the spectrum of the 30 s after the muon (red).Muons that saturate the DAQ or are within 30 s of a runtransition have not been included. The residual indicates theadditional events due to phosphorescence, which appear aslow energy noise. The inset shows the spectral comparison,with statistical error bars, after the application of noise cutsand illustrates the rejection of phosphorescence events withnoise removal.
Phosphorescence is consistent across both PMTs oneach crystal and across PMT high voltage settings in DM-Ice17. This indicates that it is not the result of an effectfrom the PMT dynode chain.
V. IMPLICATIONS FOR SODIUM IODIDEEXPERIMENTS
Phosphorescence induced by muons has been proposedas a potential modulating background in the region ofinterest for NaI(Tl) dark matter experiments [29–31].Such an effect requires a sufficient photon rate follow-ing a muon to produce photoelectron pileup that re-constructs above 2 keVee. Muon-induced phosphores-cence is not rejected by traditional muon tagging andcan evade multi-crystal and energy cuts. This must beconsidered when assessing the feasibility of muons andmuon-induced phosphorescence to mimic a low energyscintillation-like signal.
The observed phosphorescence in DM-Ice17 indi-cates that this is unlikely to be the sole source ofthe annual modulation signal observed in DAMA/NaIand DAMA/LIBRA, consistent with those experiments’statements [32–34], although variations in detector de-tails and in phosphorescence across crystals complicatea comparison between experiments. In order for phos-phorescence to be the sole source of DAMA signals, theevents in the region of interest must be entirely muon-induced, and this is highly improbable [32, 33]. Applyingthe phosphorescence observed in DM-Ice17 to DAMA’smuon background indicates that the event rate wouldbe too small to produce the observed modulation, evenbefore noise removal. Production of the DAMA modula-tion signal would require a significantly higher numberof phosphorescent photons with a time structure con-ducive to photoelectron pileup. Additionally, the phaseof the modulation would have to precede that of muonsby 45 days [9, 43]. A second annually modulating back-ground with a different phase could alter the apparentamplitude and phase of the combined signal [30], but nosuch background has been established [34, 36].
DAMA has reported that muons and associated phos-phorescence cannot produce their observed annual mod-ulation signal [32–34]. The observations of DM-Ice17presented here provide no indication that muon-inducedphosphorescence is responsible for the modulating signalobserved in DAMA/NaI and DAMA/LIBRA. However,variations in the properties of phosphorescence amongcrystals [59, 70] require that each NaI(Tl) experimentstudy the possible signal leakage of its phosphorescencebackground.
VI. CONCLUSIONS
We have identified and characterized muons andmuon-induced phosphorescence in DM-Ice17. Muonevents are identified by their pulse shape and en-ergy deposition, yielding an average observed flux of2.93± 0.04 µ/crystal/day. The muon rate, correlated toatmospheric temperature, modulates with a 12.3± 1.7%amplitude and a phase corresponding to a maximum fluxon January 22± 9 days. Muon identification is validatedwith observed coincidence in IceCube, indicating a highlypure muon sample in DM-Ice17. Muon events induce along-lived phosphorescence that is comprised of up totens of millions of photons. The rate of photons fromphosphorescence falls off exponentially with a 5.5± 0.5 sdecay time. While this effect provides a mechanism formuons to induce a modulation at low energies that es-capes muon removal cuts, the phosphorescence pulsesobserved in DM-Ice17 appear primarily below 2 keVee.These events are rejected as noise, and they do not havethe event rate in DM-Ice17 required to produce a mod-ulation consistent with the DAMA signal, even beforenoise removal. Variations in detector details and in theproperties of phosphorescence between crystals render an
8
inter-experimental comparison difficult and motivate de-tailed studies by all experiments on the potential impactof phosphorescence in the region of interest. We con-clude, however, that the annually-modulating signal re-ported by the DAMA experiments cannot be accountedfor by phosphorescence with the specific characteristicsobserved in DM-Ice17.
VII. ACKNOWLEDGMENTS
We thank the Wisconsin IceCube Particle AstrophysicsCenter (WIPAC) and the IceCube collaboration for theiron-going experimental support and data management,Benedikt Riedel for assisting in the implementation of the
IceCube rate information, and Paolo Desiati for usefulconversations about muon modulations. This work wassupported in part by the Alfred P. Sloan Foundation Fel-lowship, NSF Grants No. PLR-1046816, PHY-1151795,and PHY-1457995, WIPAC, the Wisconsin Alumni Re-search Foundation, Yale University, the Natural Sciencesand Engineering Research Council of Canada, and Fer-milab, operated by Fermi Research Alliance, LLC un-der Contract No. DE-AC02-07CH11359 with the UnitedStates Department of Energy. W. P. and A. H. were sup-ported by the DOE/NNSA Stewardship Science Grad-uate Fellowship (Grant No. DE-FC52-08NA28752) andNSF Graduate Research Fellowship (Grant No. DGE-1256259) respectively.
[1] P. A. R. Ade et al. (Planck), Astron. Astrophys. 571,A16 (2014), arXiv:1303.5076 [astro-ph.CO].
[2] G. Steigman and M. S. Turner, Nucl. Phys. B 253, 375(1985).
[3] G. Bertone, D. Hooper, and J. Silk, Phys. Rep. 405, 279(2005), arXiv:hep-ph/0404175 [hep-ph].
[4] P. Cushman et al., in Community Summer Study2013: Snowmass on the Mississippi (CSS2013) Min-neapolis, MN, USA, July 29-August 6, 2013 (2013)arXiv:1310.8327 [hep-ex].
[5] M. W. Goodman and E. Witten, Phys. Rev. D 31, 3059(1985).
[6] A. K. Drukier, K. Freese, and D. N. Spergel, Phys. Rev.D 33, 3495 (1986).
[7] K. Freese, J. A. Frieman, and A. Gould, Phys. Rev. D37, 3388 (1988).
[8] K. Freese, M. Lisanti, and C. Savage, Rev. Mod. Phys.85, 1561 (2013), arXiv:1209.3339 [astro-ph.CO].
[9] R. Bernabei et al., Eur. Phys. J. C 73, 2648 (2013),arXiv:1308.5109 [astro-ph.GA].
[10] D. Akerib et al. (LUX), Phys. Rev. Lett. 112, 091303(2014), arXiv:1310.8214 [astro-ph.CO].
[11] Z. Ahmed et al. (CDMS, EDELWEISS), Phys. Rev. D84, 011102 (2011), arXiv:1105.3377 [astro-ph.CO].
[12] E. Aprile et al. (XENON100), Phys. Rev. Lett. 109,181301 (2012), arXiv:1207.5988 [astro-ph.CO].
[13] R. Agnese et al. (SuperCDMS), Phys. Rev. Lett. 112,241302 (2014), arXiv:1402.7137 [hep-ex].
[14] G. Angloher et al. (CRESST-II), Eur. Phys. J. C 74,3184 (2014), arXiv:1407.3146 [astro-ph.CO].
[15] X. Xiao et al. (PandaX), Phys. Rev. D 92, 052004 (2015),arXiv:1505.00771 [hep-ex].
[16] C. Amole et al. (PICO), Phys. Rev. Lett. 114, 231302(2015), arXiv:1503.00008 [astro-ph.CO].
[17] S. Archambault et al. (PICASSO), Phys. Lett. B 711,153 (2012), arXiv:1202.1240 [hep-ex].
[18] S. C. Kim et al., Phys. Rev. Lett. 108, 181301 (2012),arXiv:1204.2646 [astro-ph.CO].
[19] E. Behnke et al. (COUPP), Phys. Rev. D 86, 052001(2012), [Erratum: Phys. Rev.D90,no.7,079902(2014)],arXiv:1204.3094 [astro-ph.CO].
[20] E. Aprile et al. (XENON100), Phys. Rev. Lett. 111,021301 (2013), arXiv:1301.6620 [astro-ph.CO].
[21] M. Felizardo et al. (SIMPLE), Phys. Rev. D 89, 072013(2014), arXiv:1404.4309 [hep-ph].
[22] J. Cherwinka et al., Astropart. Phys. 35, 749 (2012),arXiv:1106.1156 [astro-ph.HE].
[23] J. Amare et al., Proceedings, 13th International Con-ference on Topics in Astroparticle and UndergroundPhysics (TAUP 2013), Phys. Procedia 61, 157 (2015),arXiv:1404.3564 [astro-ph.IM].
[24] K. W. Kim et al., Astropart. Phys. 62, 249 (2015),arXiv:1407.1586 [astro-ph.IM].
[25] E. Shields, J. Xu, and F. Calaprice, Proceedings, 13thInternational Conference on Topics in Astroparticle andUnderground Physics (TAUP 2013), Phys. Procedia 61,169 (2015).
[26] K. Fushimi et al., Proceedings, 13th International Confer-ence on Topics in Astroparticle and Underground Physics(TAUP 2013), Phys. Procedia 61, 67 (2015).
[27] R. W. Schnee, in Physics of the Large and the Small,TASI 09, Proceedings of the Theoretical Advanced StudyInstitute in Elementary Particle Physics, Boulder, Col-orado, USA, 1-26 June 2009 (2011) pp. 775–829.
[28] J. P. Ralston, (2010), arXiv:1006.5255 [hep-ph].[29] K. Blum, (2011), arXiv:1110.0857 [astro-ph.HE].[30] J. H. Davis, Phys. Rev. Lett. 113, 081302 (2014),
1407.1052.[31] D. Nygren, (2011), arXiv:1102.0815 [astro-ph.IM].[32] R. Bernabei et al., Eur. Phys. J. C 72, 2064 (2012),
arXiv:1202.4179 [astro-ph.GA].[33] R. Bernabei et al., Proceedings, 2nd International Con-
ference on Technology and Instrumentation in ParticlePhysics 2011, Phys. Procedia 37, 1095 (2012).
[34] R. Bernabei, P. Belli, F. Cappella, V. Caracciolo,R. Cerulli, et al., Eur. Phys. J. C 74, 3196 (2014),arXiv:1409.3516 [hep-ph].
[35] E. Fernandez-Martinez and R. Mahbubani, JCAP 1207,029 (2012), arXiv:1204.5180 [astro-ph.HE].
[36] J. Klinger and V. A. Kudryavtsev, Phys. Rev. Lett. 114,151301 (2015), arXiv:1503.07225 [hep-ph].
[37] V. A. Kudryavtsev, M. Robinson, and N. J. C. Spooner,Astropart. Phys. 33, 91 (2010), arXiv:0912.2983 [hep-ex].
[38] P. H. Barrett, L. M. Bollinger, G. Cocconi, Y. Eisenberg,and K. Greisen, Rev. Mod. Phys. 24, 133 (1952).
9
[39] M. Ambrosio et al. (MACRO), Astropart. Phys. 7, 109(1997).
[40] P. Adamson et al. (MINOS), Phys. Rev. D 81, 012001(2010), arXiv:0909.4012 [hep-ex].
[41] N. Y. Agafonova et al. (LVD), Bull. Russ. Acad. Sci.,Phys. 75, 427 (2011).
[42] P. Desiati, T. Kuwabara, T. K. Gaisser, S. Tilav, andD. Rocco (IceCube), in Proceedings, 32nd InternationalCosmic Ray Conference (ICRC 2011), Vol. 1 (2011) pp.78–81.
[43] G. Bellini et al. (Borexino Collaboration), JCAP 1205,015 (2012), arXiv:1202.6403 [hep-ex].
[44] J. Cherwinka et al. (DM-Ice17), Phys. Rev. D 90, 092005(2014), arXiv:1401.4804 [astro-ph.IM].
[45] T. Gaisser and F. Halzen, Ann. Rev. Nucl. Part. Sci. 64,101 (2014).
[46] M. G. Aartsen et al. (IceCube), Phys. Rev. Lett. 115,081102 (2015), arXiv:1507.04005 [astro-ph.HE].
[47] M. G. Aartsen et al. (IceCube), Phys. Rev. Lett. 111,021103 (2013), arXiv:1304.5356 [astro-ph.HE].
[48] M. G. Aartsen et al. (IceCube), Phys. Rev. Lett. 110,131302 (2013), arXiv:1212.4097 [astro-ph.HE].
[49] M. G. Aartsen et al. (IceCube), Science 342, 1242856(2013), arXiv:1311.5238 [astro-ph.HE].
[50] R. Abbasi et al. (IceCube), Nucl. Instrum. Meth. A601,294 (2009), arXiv:0810.4930 [physics.ins-det].
[51] P. Desiati and T. K. Gaisser, Phys. Rev. Lett. 105,121102 (2010), arXiv:1008.2211 [astro-ph.HE].
[52] R. Bernabei et al. (DAMA), Nucl. Instrum. Meth. A592,297 (2008), arXiv:0804.2738 [astro-ph].
[53] C. Cuesta et al., Opt. Mater. 36, 316 (2013),arXiv:1307.1398 [astro-ph.IM].
[54] X. Bai, T. K. Gaisser, A. Karle, K. Rawlins, G. M.Spiczak, and T. Stanev, Astropart. Phys. 25, 361 (2006),arXiv:astro-ph/0602381 [astro-ph].
[55] V. A. Kudryavtsev, Comput. Phys. Commun. 180, 339(2009), arXiv:0810.4635 [physics.comp-ph].
[56] P. Desiati, in International Cosmic Ray Conference, In-ternational Cosmic Ray Conference (2015).
[57] G. F. Knoll, Radiation Detection and Measurement , 3rded. (John Wiley and Sons, New York, 2000).
[58] V. Volkov, Instrum. Exp. Tech. (USSR) 2, 65 (1981).[59] C. Cuesta et al., Eur. Phys. J. C 74, 3150 (2014),
arXiv:1407.5125 [astro-ph.IM].[60] S.-G. Crystals, Effects of Ultraviolet (UV) Light on NaI,
CsI and BGO Crystals, Tech. Rep. (Saint-Gobain, 2012).[61] J. C. Robertson and J. G. Lynch, Proc. Phys. Soc. 77,
751 (1961).[62] S. Koicki, A. Koicki, and V. Ajdacic, Nucl. Instrum.
Methods 108, 297 (1973).[63] J. Bonanomi and J. Rossel, Helv. Phys. Acta 25, 725
(1952), (French).[64] O. Fronka, Physica Status Solidi (A) 6, K89 (1971).[65] C. R. Emigh and L. R. Megill, Phys. Rev. 93, 1190
(1954).[66] W. W. Managan, IRE Trans. Nucl. Sci. 5, 171 (1958).[67] C. Delaney and A. Lamki, Int. J. Appl. Radiat. Isotopes
19, 169 (1968).[68] C. Cuesta, ANAIS-0: Feasibility study for a 250 kg
NaI(Tl) dark matter search experiment at the CanfrancUnderground Laboratory, Ph.D. thesis, Universidad deZaragoza (2013).
[69] A. Hubbard, Muon-Induced Backgrounds in the DM-Ice17 NaI(Tl) Dark Matter Detector, Ph.D. thesis, Uni-versity of Wisconsin (2015).
[70] P. Rodnyi, Physical Processes in Inorganic Scintillators,Laser & Optical Science & Technology (Taylor & Francis,1997).
[71] H. Dietrich and R. Murray, J. Lumin. 5, 155 (1972).[72] W. Pettus, Cosmogenic Activation in NaI Detectors for
Dark Matter Searches, Ph.D. thesis, University of Wis-consin (2015).


![arXiv:1810.04081v1 [cond-mat.mtrl-sci] 9 Oct 2018 · arXiv:1810.04081v1 [cond-mat.mtrl-sci] 9 Oct 2018 Coherent spin dynamics of electrons and holes in CsPbBr3 perovskite crystals](https://img.pdfslide.tips/doc/110x75/5fb73a8a430e41541f541fc4/arxiv181004081v1-cond-matmtrl-sci-9-oct-2018-arxiv181004081v1-cond-matmtrl-sci.jpg)