Embed Size (px)
Citation preview
This document is downloaded at: 2019-03-21T00:51:13Z
TitleOne-stage, simultaneous skin grafting with artificial dermis and basicfibroblast growth factor successfully improves elasticity with maturation ofscar formation
Author(s) Hamuy Ortega, Luis Rodrigo
Citation Nagasaki University (長崎大学), 博士(医学) (2013-09-19)
Issue Date 2013-09-19
URL http://hdl.handle.net/10069/35428
Right
© 2012 by the Wound Healing Society; This is the accepted version of thefollowing article: Wound Repair and Regeneration, 21(1), pp.141-154;2013, which has been published in final form athttp://dx.doi.org/10.1111/j.1524-475X.2012.00864.x
NAOSITE: Nagasaki University's Academic Output SITE
http://naosite.lb.nagasaki-u.ac.jp
1
One-stage, simultaneous skin grafting with artificial dermis and basic fibroblast growth factor successfully improves elasticity with maturation of scar formation
Hamuy Rodrigo, MD¹; Naoshi Kinoshita, MD, PhD¹; Hiroshi Yoshimoto, MD, PhD¹; Kenji Hayashida, MD, PhD¹; Seiji Houbara, MD¹, Masahiro Nakashima, MD, PhD²; Keiji Suzuki, PhD ³; Norisato Mitsutake, MD, PhD³ ; Zhanna Mussazhanova, MD²; Kazuya Kashiyama, MD, PhD¹ ³; Akiyoshi Hirano, MD¹; Sadanori Akita, MD, PhD¹.
¹Division of Plastic and Reconstructive Surgery, Department of Developmental and Reconstructive Medicine
²Division of Tumor and Diagnostic Pathology, Atomic Bomb Disease Institute
³Department of Radiation Medical Sciences, Atomic Bomb Disease Institute
Nagasaki University Research Centre for Genomic Instability and Carcinogenesis (NRGIC)
Nagasaki University Graduate School of Biomedical Sciences, 1-12-4 Sakamoto, Nagasaki, 8528523, Japan
Corresponding author: Sadanori Akita, MD, PhD
Division of Plastic and Reconstructive Surgery, Department of Developmental and Reconstructive Medicine, Nagasaki University Graduate School of Biomedical Sciences, Nagasaki University Hospital, 1-7-1 Sakamoto, Nagasaki, 8528501, Japan
Tel.: +81 95 819 7327; Fax: +81 95 819 7330; Email: [email protected]
2
Abstract
The efficacy of one-stage artificial dermis and skin grafting was tested in a nude rat model. Reconstruction with artificial dermis is usually a two-stage procedure with 2- to 3-week intermission. If one-stage use of artificial dermis and split-thickness skin grafting are effective, the overall burden on patients and the medical cost will markedly decrease.
The graft take rate, contraction rate, tissue elasticity, histology, morphometric analysis of the dermal thickness, fibroblast counting, immunohistochemistry of α-smooth muscle actin (α-SMA), matrix metalloproteinase-2 (MMP-2), CD31, F4/80, as well as gelatin zymography, real-time reverse transcriptase polymerase chain reaction (RT-PCR) for MMP-2, and electron microscopy were investigated from day 3 to 3 months postoperatively.
The graft take rate was good overall in one-stage artificial dermis and skin grafting groups up to 3 weeks, and the contraction rate was greater in the two-staged artificial dermis and skin grafting group than in the skin grafting alone or one-stage of artificial dermis and skin grafting groups. Split-thickness skin grafting with artificial dermis and basic fibroblast growth factor (bFGF) at a concentration of 1 μg/cm2 demonstrated significantly greater elasticity by Cutometer and the dermal thickness was significantly thinner, fibroblast counting was significantly greater, the α-SMA expression level was more notable with a more mature blood supply in the dermis and more organized dermal fibrils by electron microscopy at 3 weeks. Thus, one-stage artificial dermis and split-thickness skin grafting with bFGF demonstrate a high graft take rate and better tissue elasticity determined by Cutometer analysis, maturity of the dermis and increased fibroblast number and blood supply.
Running title
bFGF, one-stage artificial dermis with skin grafting, elasticity, graft survival, α-SMA, MMP-2
3
Introduction
Bilayer medical devices for covering skin defects are referred to as “artificial dermis”. Artificial dermis consisting of highly organized porous collagen and other amino acids as a scaffold induces dermis regeneration in the case of full-thickness skin defects.
Artificial dermis, a dermal regeneration template, has been used effectively in acute and reconstructive surgery and this has now been extended to chronic wounds (1). It provides optimal dermal wound bed preparation as regenerated skin with extensive formation of rete ridges and capillary loops but with the absence of skin appendages (2) and is ready for relatively thinner subsequent skin grafting; thus, donor site morbidity is minimized. This low donor site morbidity is especially beneficial for large skin defects in children, who usually lack sufficient donor skin. Several combined procedures have been attempted in reconstruction with artificial dermis including cultured autologous keratinocytes (3) and composite biocompatible epidermal graft, which composes autologous keratinocytes cultured over a hyaluroate-derived membrane using dermal fibroblasts as a feeder layer (4); however, the use of cultured cells yields inconsistent graft take rates. Thus, two-stage surgery is the standard for large skin defect coverage using artificial dermis. In two-stage surgery, secondary split-thickness skin grafting is undertaken at 13 to 19 days (5), 14 to 21 days (6), 21 days (7) or 28 days (8) depending on the product or the patients’ systemic and local wound conditions. Even though the use of artificial dermis in reconstruction avoids greater surgeries such as free flaps or distant flaps and may bring about a better scar outcome in terms of softness, pliability and stratum corneum function of the epidermis (5), the clinical application of artificial dermis is rather limited due to the higher cost of using this procedure. Despite the product cost, there are indirect costs due to increased hospitalization, requiring two independent surgeries per case, the risk of a higher infection rate and lengthy dressing changes (9). In an elderly person with a poor systemic condition, one-stage skin grafting and cellular human dermis over the exposed skull demonstrated an excellent outcome (10) and the use of a dermal matrix based on bovine collagen I, III, and V, elastin hydrolysate and split-thickness skin grafting was safe and feasible, demonstrating markedly better clinical results in elasticity (11).
We therefore sought to investigate the efficacy of one-stage simultaneous skin grafting and artificial dermis in the reconstruction of skin defects using a nude rat
4
model, and fixing a frame device to avoid skin contracture from the surrounding skin in the course of wound healing with an angiogenic growth factor. In this one-stage procedure, the artificial dermis is made in a monolayer devoid of the outer silicone membrane In order to effectively facilitate the graft take by basic fibroblast growth factor, the only
angiogenic factor available currently in Japan, which accelerates burn wound skin graft healing (12) and is used alone in second degree burns (13), combined use with artificial dermis was also tested.
Materials and Methods
Animals
A total of 78 male F344/NJCl-rnu nude rats (CLEA JAPAN, Inc., Tokyo, Japan), deficient in T-cell function, aged 7 to 9 weeks, weighing 150-210 g, were used in this experiment, and housed in the Laboratory Animal Center for Biomedical Research, Nagasaki University School of Medicine, Nagasaki, Japan. They were handled according to the guidelines established for animal care at the center and the protocol was approved by the institutional animal care and use committee (IACUC) of Nagasaki University (#1008030872). Each rat had free access to sterile water and standard rodent soft chow ad libitum.
Study Design
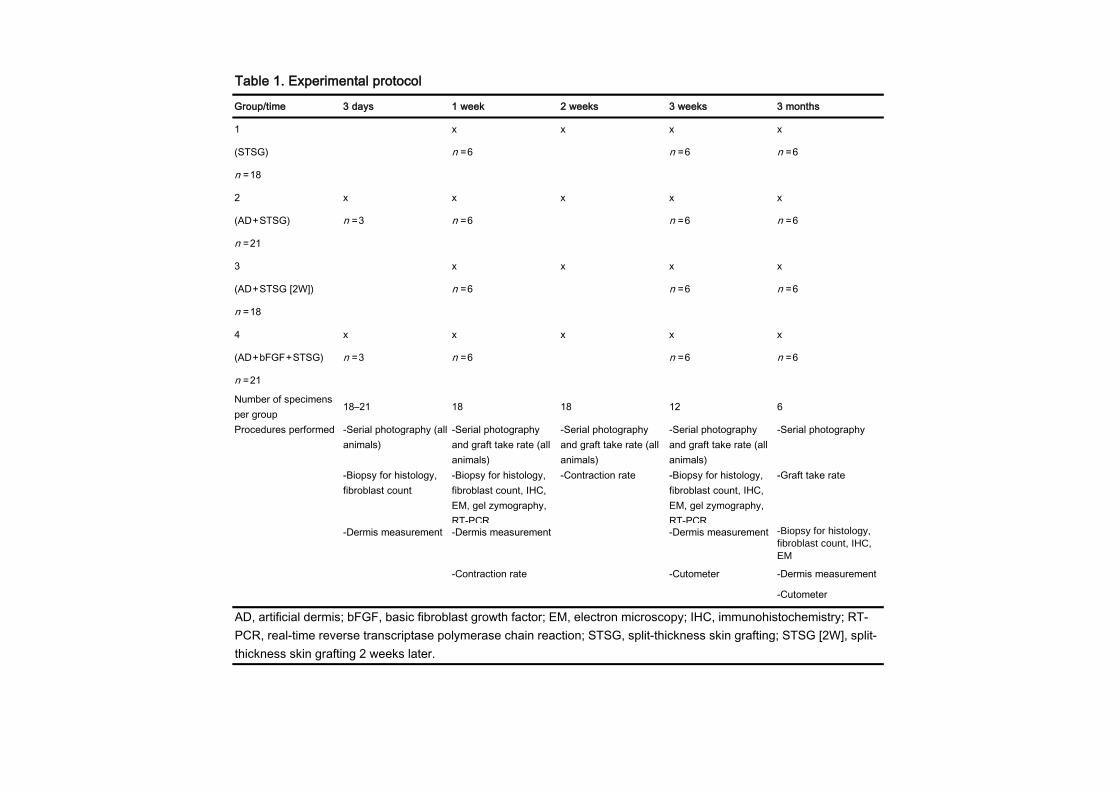
Rats were divided into the following groups:
1. Group 1 (n = 18): split-thickness skin grafting alone (STSG), 2. Group 2 (n = 21): one-stage; simultaneous, artificial dermis and split-
thickness skin grafting (AD + STSG), 3. Group 3 (n = 18): two-staged; artificial dermis grafting alone, and 2 weeks
later: split-thickness skin grafting [AD + STSG(2W)],
5
4. Group 4 (n=21): one-staged; simultaneous, artificial dermis, basic fibroblast growth factor (bFGF), and split-thickness skin grafting (AD + bFGF + STSG).
The parameters to be evaluated were; the macroscopic aspect of the grafts through serial photography, the measurement and calculation of graft take rates, analysis of the measurements obtained with the Cutometer, and biopsy taken for histological, immunohistochemical, zymographic, RT-PCR, and electron microscopic analyses (Table 1).
Serial photographs were taken 3 days, 1 week, 2 weeks, 3 weeks and at 3 months, respectively, after the initial procedure, of all specimens.
Graft take rates were determined at 1 week, 2 weeks, 3 weeks and at 3 months for all specimens.
Cutometer measurements were performed at 3 weeks and 3 months, from 6 specimens of each group each time.
From the middle and healthy part of the grafted area, samples were taken at 3 days (n = 6; 3 specimens from groups 2 and 4), 1 week (6 specimens of each group from all four groups), 3 weeks (6 specimens of each group from all four groups), and at 3 months (6 specimens of each group from all four groups). After taking samples, animals were euthanized (Table 1).
As an internal control, the contraction rates of the graft “beds” were measured at 1 week and 2 weeks.
Surgical Procedure
Animals were anesthetized with a 40 mg/kg body weight intra-peritoneal injection of sodium pentobarbital, (Somnopenthyl; Kyoritsu Seiyaku, Tokyo, Japan). All procedures were performed under sterile conditions.
A circular (2.5 cm diameter, thus 4.9 cm2), full-thickness skin defect was created on the back of each rat at one side of the spine. Split-thickness skin grafts were harvested with an electric dermatome (Zimmer; Zimmer Orthopaedic Surgical Products, Inc., Warsaw,
6
IN, USA) from the opposite side of the rat’s back, and an intermediate split-thickness skin graft (15/1,000-inch) was implanted into the same-sized full-thickness skin defect and fixed on its border to the full-thickness surrounding skin with non-absorbable sutures.
An artificial dermis, Terudermis (Olympus Terumo Biomaterials Corp., Tokyo, Japan), is a collagen monolayer type, 2 mm thick, is made of a low antigenic fibrillar atelocollagen and heat-denatured atelocollagen cross-linked dehydrothermally, produced from a calf tendon collagen, eliminated the telopeptide by a preparation of protease. A 1:1 mesh type of “drainage” type, artificial dermis, collagen monolayer type was placed to fit and cover the entire surface of the skin defect and skin grafting.
For group 3, 2 weeks after grafting with artificial dermis alone, an STSG was harvested from the opposite site of the graft on the back and placed into an STSG in the same way.
To prevent wound closure from the surrounding skin, and to protect, isolate, and monitor the evolution precisely, polypropylene rings, 2.5 cm in diameter, with a total inner area of 4.9 cm², were designed from commercially available and highly standardized pet bottles. The rings were fixed on top and covering the full extension of the graft bed by non-absorbable sutures (mono-nylon 4-0; Ethicon; Ethicon, Inc., Somerville, NJ, USA).
Ointment-impregnated gauze (Sofra-Tulle Dressing 1%; Hoechst Marion Roussel Ltd., Germany) was applied on top of the grafts and inside the polypropylene ring in all cases, removed after 7 days and exchanged when necessary. Polypropylene rings were closed with their respective perforated plastic caps.
All animals were euthanized by anesthetic overdose.
bFGF (Trafermin, Fiblast Spray)
Genetically recombinant bFGF (Fiblast Spray; Kaken Pharmaceutical Co., Ltd., Tokyo, Japan) was sprayed onto the surface of the full-skin defect after the artificial dermis was placed in group 4 specimens at day 0. The concentration of the bFGF spray was 1µg/cm² in the graft bed and was prepared according to the manufacturer’s recommendations.
7
Photographic monitoring of take rate
Serial photographs of the grafts were taken by a digital camera (Olympus SH-25MR, Tokyo, Japan) at 3 days, 1 week, 2 weeks, 3 weeks and at 3 months, respectively, for all specimens, and when taking a photograph, the axis to the object (grafted area) was adjusted to be perpendicular.
Analysis of graft take and contraction rate
The measurement tool of Adobe Photoshop CS5 Extended software was applied to the relative areas of the graft take and contraction, and the graft take rate (%) was obtained by the visible graft take area divided by the initial total implantation area; the results were multiplied by 100 and expressed as a percentage.
The contraction rate was determined by subtracting the initial grafted area including the graft take and non-take areas divided by the initial area size of 4.9 cm2 from 1, and multiplied by 100 and expressed as a percentage. Measurements were taken by 3 independent observers, averaged, and the means were determined. Values obtained were used for further statistical comparison and analysis.
Cutometer analysis
A Cutometer MPA 580 (Courage + Khazaka Electronic GmbH, Cologne, Germany) was used to evaluate skin elasticity parameters at 3 weeks and 3 months. The Cutometer is able to measure vertical deformation of the skin by suctioning into a round probe, 6 mm in diameter. Measurements were taken in mode 1. A vacuum load of 500 mbar was used over the healthy graft’s surface for 2 seconds (on-time), followed by a normal pressure (relaxation) of 2 seconds (off-time). Each measurement was repeated 4 times in 2 cycles, taken from the center of the graft and assessed at 25ºC room temperature, and 50% humidity with air conditioning. Two parameters of the Cutometer were used in this investigation. The Uf (depicted as R0) stands for the maximal skin extension deformation at the end of the vacuum period (skin firmness); Ur/Uf (R7) stands for the ratio of the retraction (Ur) to the maximal extension (Uf) and reflects the elasticity of the measured tissues.
8
Histology
Tissue samples were resected from the center of the grafts at 3 days, 1 week, 3 weeks, and 3 months, respectively, and subjected to immediate fixation with 10% buffered formalin, then paraffin-embedded and sectioned at 4 µm thickness for hematoxylin and eosin (H & E) staining and further examination and analysis by light microscopy.
Dermal/Artificial-Dermal thickness
Dermal thickness was measured from each slide (all specimens), at a magnification of 25×, from 5 different, randomly selected, fields per specimen, from the epidermal-dermal junction to the dermal-subdermal junction, using AxioVision 4.8 software (Carl Zeiss MicroImaging, GmbH, 07740, Jena, Germany), at the determined given time points. Results, expressed in micrometers (µm), were used for further statistical analysis.
Number of fibroblasts in the dermis/artificial dermis
The number of dermal fibroblasts was also counted from 5 randomly selected fields (5 specimens of each group), taken from a half-point line traced on the full-thickness dermal layer, equivalent in all cases, at a magnification of 630×, with H&E staining using the aforementioned software. Results of the fibroblast count per field were used for statistical analysis.
Macrophage assessment with F4/80
Representative paraffin-embedded tissue samples of each group (2 tissue samples per group) at 1 week, 3 weeks, and 3 months were taken in order to determine macrophage presence and distribution analysis using the F4/80 marker. A Rabbit polyclonal antibody to F4/80, with reactivity to rat (Anti-F4/80 antibody, ab74383, Abcam Ltd., Cambridge, UK), was used.
After deparaffinization of the tissue samples with xylene, 100% ethanol, 90% ethanol, 80% ethanol, and ddH₂O, respectively, antigen was retrieved in microwave for 20 minutes, slides were washed in ddH₂O for 10 min on a shaker, and then internal
9
peroxidase activity was blocked with 3% H₂O₂ for 10 min. Sections were washed in ddH₂O and PBS respectively, incubated with blocking solution (1% BSA) for 30 min at room temperature, and then the primary antibody was added with blocking solution at a concentration of 1:100 (1% BSA) for 1 hour at room temperature. Slides were washed with PBS, followed by incubation with the secondary antibody (Goat polyclonal Secondary Antibody to Rabbit IgG - H&L (HRP), ab6721, Abcam Ltd., Cambridge, UK) for 2 hours at room temperature. DAB (diaminobenzidine) was added for chromogen colorization until it turned brown over 3-20 min.
The results were evaluated using a strong positive, weak positive and negative staining/reactivity scale as determined by trained experienced pathologists.
Alpha Smooth Muscle Actin (α-SMA)
Representative tissue samples of each group (2 tissue samples per group) at 1 week, 3 weeks, and 3 months were taken in order to determine α-SMA (α-smooth muscle actin). A rabbit monoclonal antibody, to α-SMA, was used (Epitomics, Inc., Burlingame, CA, USA).
After deparaffinization of the tissue samples with xylene, 100% ethanol, 90% ethanol, 80% ethanol, and ddH2O, respectively, slides were washed in PBS (protein blocking solution) for 5 min on a shaker, and then internal peroxidase activity was blocked with 3% H2O2 for 15 min. Sections were washed in PBS for 5 min, 3 consecutive times, incubated with blocking solution (5% BSA) for 15 min at room temperature, and then the primary antibody was added with blocking solution at a concentration of 1:1000 (5% BSA) and left overnight at 4˚C. The next day, slides were washed with PBS for 5 min, 3 times, followed by incubation with the secondary antibody (Universal goat anti-mouse IgG biotinylated secondary antibody) for 60 min at room temperature. DAB (diaminobenzidine) was added for chromogen colorization until it turned brown over 3-20 min.
Vessels with positive staining/reactivity in the dermal layer were counted at 200× magnification in 10 different fields. Results were compared among groups.
10
CD31
Representative paraffin-embedded tissue samples of each group (2 tissue samples per group) at 1 week, 3 weeks, and 3 months were taken in order to determine and assess neo-vessels. A rabbit polyclonal antibody to CD31, with reactivity to rat (Anti-CD31 antibody, ab28364, Abcam Ltd., Cambridge, UK), was used.
After deparaffinization of the tissue samples with xylene, 100% ethanol, 90% ethanol, 80% ethanol, and ddH₂O, respectively, antigen was retrieved in microwave for 20 minutes, slides were washed in ddH₂O for 10 min on a shaker, and then internal peroxidase activity was blocked with 3% H₂O₂ for 10 min. Sections were washed in ddH₂O and PBS respectively, incubated with blocking solution (1% BSA) for 30 min at room temperature. Then the primary antibody was added at a 1:50 concentration with BSA 1% and left overnight at 4˚C. The next day, slides were incubated with the secondary antibody (Goat polyclonal Secondary Antibody to Rabbit IgG - H&L (HRP), ab6721, Abcam Ltd., Cambridge, UK), for 2 hours at room temperature. DAB was added for chromogen colorization until it turned brown over 3-20 minutes.
Vessels with positive staining/reactivity in the dermal layer were counted at 200× magnification in 5 different fields. Count was assessed, and results were quantitatively used for statistical comparison amongst groups.
Matrix MetalloProteinase- 2 (MMP-2) Immunohistochemistry
Representative tissue samples of each group (2 tissue samples per group) at 1 week, 3 weeks, and 3 months were taken in order to determine MMP-2 (matrix metalloproteinase-2) reactivity to mouse/rat MMP-2 antibody (Antigen Affinity-purified Polyclonal Goat IgG, Catalog Number: AF1488, R&D Systems).
After deparaffinization of the tissue samples with xylene, 100% ethanol, 90% ethanol, 80% ethanol, and ddH2O, respectively, antigen was retrieved with pepsin for 30 min at 37°C, then washed in ddH2O for 5 min twice (on shaker), and proteinase K was added for 6 min at room temperature. Slides were washed in PBS for 5 min (on a shaker) and internal peroxidase activity was blocked with 3% H2O2 for 15 min. Sections were washed
11
in PBS for 5 min, 3 times, and incubated with blocking solution (BSA 1%) for 30 minutes at room temperature. Primary antibody was added at a 1:1 concentration with BSA 1% and left overnight at 4˚C. The next day, slides were incubated with the secondary antibody for 1 hour at room temperature. DAB was added for chromogen colorization until it turned brown over 3-20 minutes.
The results were evaluated using a strong positive, weak positive and negative staining/reactivity scale as determined by trained pathologists.
Gelatin Zymography
Gelatinolytic activity of MMP-2 was determined by zymography.
Fresh representative skin samples (2 samples per group), corresponding to 1 week and 3 weeks, were immediately frozen in dry ice after harvested, and stored at -80°C. Proteins were extracted with lysis buffer (50 mM Tris-HCl, pH7.4, 150 mM NaCl, 1% sodium deoxycholate, 1% Nonidet P-40 and 0.05% sodium dodecyl sulfate (SDS)). The supernatant was collected after centrifugation at 15,000 rpm for 10min at 4°C, and the protein concentration was quantified by BCA assay (Pierce® BCA Protein Assay Kit, Pierce Biotechnology, Rockford, IL, USA).
Protein samples (40 µg) were then re-suspended in SDS-polyacrylamide gel electrophoresis sample buffer, without beta-mercaptoethanol and were loaded on polyacrylamide gels containing 0.1% gelatin (Sigma). After electrophoresis, the gels were washed with wash buffer (10 mM Tris-HCl, pH 7.4, 2% Triton X-100) for 1 hour, equilibrated in 10 mM Tris-HCl, pH 7.4, and incubated in reaction buffer (10 mM Tris-HCl, pH 7.4, 5mM CaCl2, 1% Triton X-100) in a CO₂ incubator overnight. Then, the gels were stained with 0.2% Coomassie Brilliant Blue and de-stained in a solution of methanol and acetic acid.
Gels were photographed and pictures were converted into grayscale and assessed for quantitative analysis using Adobe Photoshop CS5 Extended software, for band intensity determination using color densitometry in pixels as a relative unit of measure for comparison. Results were interpreted adopting a scale of strongly positive, weakly positive and negative, and focus was centered on the band of 72 kDa (kiloDalton); corresponding to MMP-2.
12
Real-time Reverse Transcriptase Polymerase Chain Reaction (RT-PCR) for MMP-2
Total RNA was extracted using an RNeasy lipid tissue mini kit (QIAGEN, Tokyo, Japan) according to the manufacturer’s instruction. A measure of 500 ng of total RNA was reverse transcribed using a High-capacity RNA-to-cDNA kit (Applied Biosystems, Life Technologies Japan, Tokyo, Japan). The following PCR amplification was carried out in a Thermal Cycler Dice Real-time system using SYBR Premix Ex Taq II (TaKaRa Bio, Ohtsu, Japan). β-actin was used as an internal control. The cycle threshold value, which was determined using second derivative, was used to calculate the normalized expression of the indicated genes using the Q-Gene software (14).
The primer sequence used for MMP-2 was 5’-CCG AGG ACT ATG ACC GGG ATA A-3’, and 5’-CTT GTT GCC CAG GAA AGT GAA G-3’ (15-17), and for β-actin 5’-CTG AAC CCT AAG GCC AAC CGT G-3’ and 5’-GGC ATA CAG GGA CAG CAC AGC C-3’(18).
Electron Microscopy
Tissue samples were taken, as described previously (at 1 week, 3 weeks, and 3 months), from the center of the grafts and fixed in 2.5% buffered glutaraldehyde in order to be examined by electron microscopy.
Statistical Analysis
All statistical analyses were conducted with IBM SPSS 19 software. All data are expressed as the mean ± SD. Data between groups were evaluated by one-way analysis of variance (ANOVA), followed by Bonferroni post-hoc tests for multiple comparisons. A value of p <0.05 was considered significant.
13
Results
In groups 1 (STSG), 2 (AD+STSG), 3 [AD+STSG (2W)], and 4 (AD+bFGF+STSG), there were no animal deaths throughout experiment and all animals were healthy.
Graft Take Rate
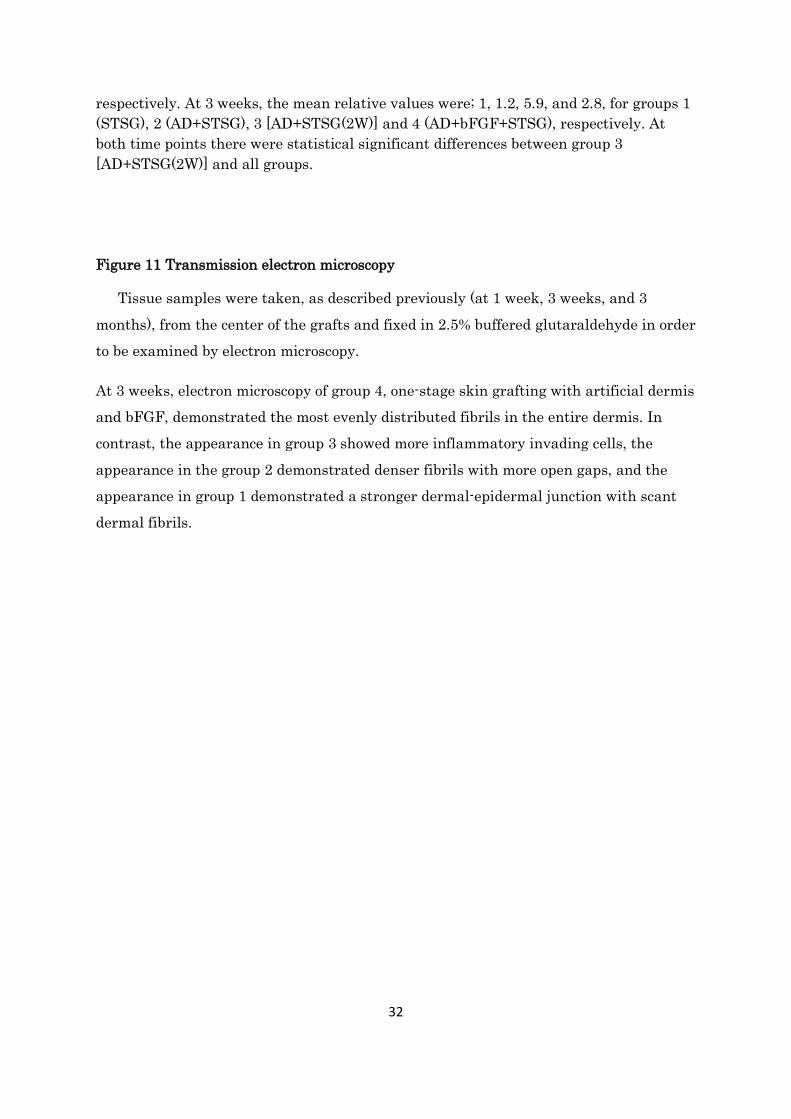
The mean graft take rates at 1 week were 84 ± 9.0 %, 86 ± 5.9 %, 68 ± 8.1 %, and 83 ± 6.4 % for groups 1 (STSG), 2 (AD+STSG), 3 [AD+STSG(2W)] and 4 (AD+bFGF+STSG), respectively. Group 3 was significantly lower than the rest of the groups (p <0.001), and group 2 was significantly greater than group 4 (p = 0.02).
At 2 weeks, the mean percentages of graft take rates were 88 ± 8.1 %, 81 ± 9.8 %, 74 ± 7.9 %, and 78 ± 8.3 % for groups 1 (STSG), 2 (AD+STSG), 3 [AD+STSG(2W)] and 4 (AD+bFGF+STSG), respectively. Group 1 was significantly greater than the other groups (p <0.001), and group 2 was significantly greater than group 3 (p <0.001).
At 3 weeks the mean graft take rates were 99 ± 1.2 %, 93 ± 4.2 %, 87 ± 10.6 %, and 92 ± 5.4 % for groups 1 (STSG), 2 (AD+STSG), 3 [AD+STSG(2W)] and 4 (AD+bFGF+STSG), respectively. Group 1 was significantly greater than the other groups (p <0.001) and group 3 was significantly lower than any other group (p <0.001)(Figure 1).
At 3 months all graft take rates were 100% in all groups.
Contraction Rate
The mean percentages of grafting contraction at 1 week were 21 ± 6.8 %, 24 ± 10.5 %, 49 ± 11.5 %, and 26 ± 8.8 % for groups 1 (STSG), 2 (AD+STSG), 3 [AD+STSG(2W)] and 4 (AD+bFGF+STSG), respectively. Group 3 was significantly greater than all other groups (p <0.001). At 2 weeks, the means of the percentages were 23 ± 5.7 %, 31 ± 14.6 %, 51 ± 12.3 %, and 35 ± 13.0 %, for groups 1 (STSG), 2 (AD+STSG), 3 [AD+STSG(2W)] and 4 (AD+bFGF+STSG), respectively. Groups 3 was significantly greater than group 1 (p = 0.001) and group 2 (p = 0.018)(Figure 2).
14
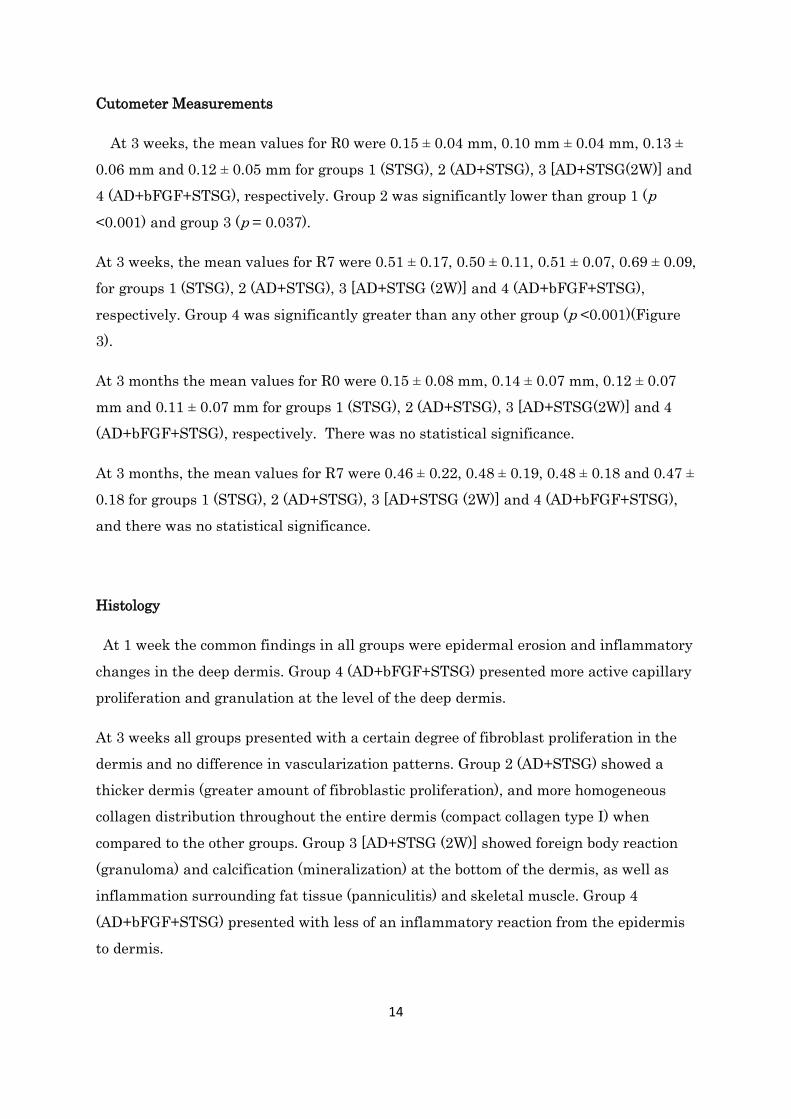
Cutometer Measurements
At 3 weeks, the mean values for R0 were 0.15 ± 0.04 mm, 0.10 mm ± 0.04 mm, 0.13 ± 0.06 mm and 0.12 ± 0.05 mm for groups 1 (STSG), 2 (AD+STSG), 3 [AD+STSG(2W)] and 4 (AD+bFGF+STSG), respectively. Group 2 was significantly lower than group 1 (p <0.001) and group 3 (p = 0.037).
At 3 weeks, the mean values for R7 were 0.51 ± 0.17, 0.50 ± 0.11, 0.51 ± 0.07, 0.69 ± 0.09, for groups 1 (STSG), 2 (AD+STSG), 3 [AD+STSG (2W)] and 4 (AD+bFGF+STSG), respectively. Group 4 was significantly greater than any other group (p <0.001)(Figure 3).
At 3 months the mean values for R0 were 0.15 ± 0.08 mm, 0.14 ± 0.07 mm, 0.12 ± 0.07 mm and 0.11 ± 0.07 mm for groups 1 (STSG), 2 (AD+STSG), 3 [AD+STSG(2W)] and 4 (AD+bFGF+STSG), respectively. There was no statistical significance.
At 3 months, the mean values for R7 were 0.46 ± 0.22, 0.48 ± 0.19, 0.48 ± 0.18 and 0.47 ± 0.18 for groups 1 (STSG), 2 (AD+STSG), 3 [AD+STSG (2W)] and 4 (AD+bFGF+STSG), and there was no statistical significance.
Histology
At 1 week the common findings in all groups were epidermal erosion and inflammatory changes in the deep dermis. Group 4 (AD+bFGF+STSG) presented more active capillary proliferation and granulation at the level of the deep dermis.
At 3 weeks all groups presented with a certain degree of fibroblast proliferation in the dermis and no difference in vascularization patterns. Group 2 (AD+STSG) showed a thicker dermis (greater amount of fibroblastic proliferation), and more homogeneous collagen distribution throughout the entire dermis (compact collagen type I) when compared to the other groups. Group 3 [AD+STSG (2W)] showed foreign body reaction (granuloma) and calcification (mineralization) at the bottom of the dermis, as well as inflammation surrounding fat tissue (panniculitis) and skeletal muscle. Group 4 (AD+bFGF+STSG) presented with less of an inflammatory reaction from the epidermis to dermis.
15
At 3 months there were no major differences in vascularization patterns or in dermal thickness (milder fibroblast proliferation when compared to 3 weeks) among groups as well as an overall decrease in the inflammatory reaction. Groups 2 (AD+STSG) and 4 (AD+bFGF+STSG) showed a fibrotic reaction at the subcutaneous tissue level. Group 3 [AD+STSG (2W)] still showed granuloma with calcification at the border of the dermis-subcutaneous fat tissue, but to a lesser extent than at 3 weeks. When groups 1 and 4 were compared, group 4 (AD+bFGF+STSG) exhibited more mature collagen (closer to normal) even though it had fewer fibroblasts and collagen fibers overall.
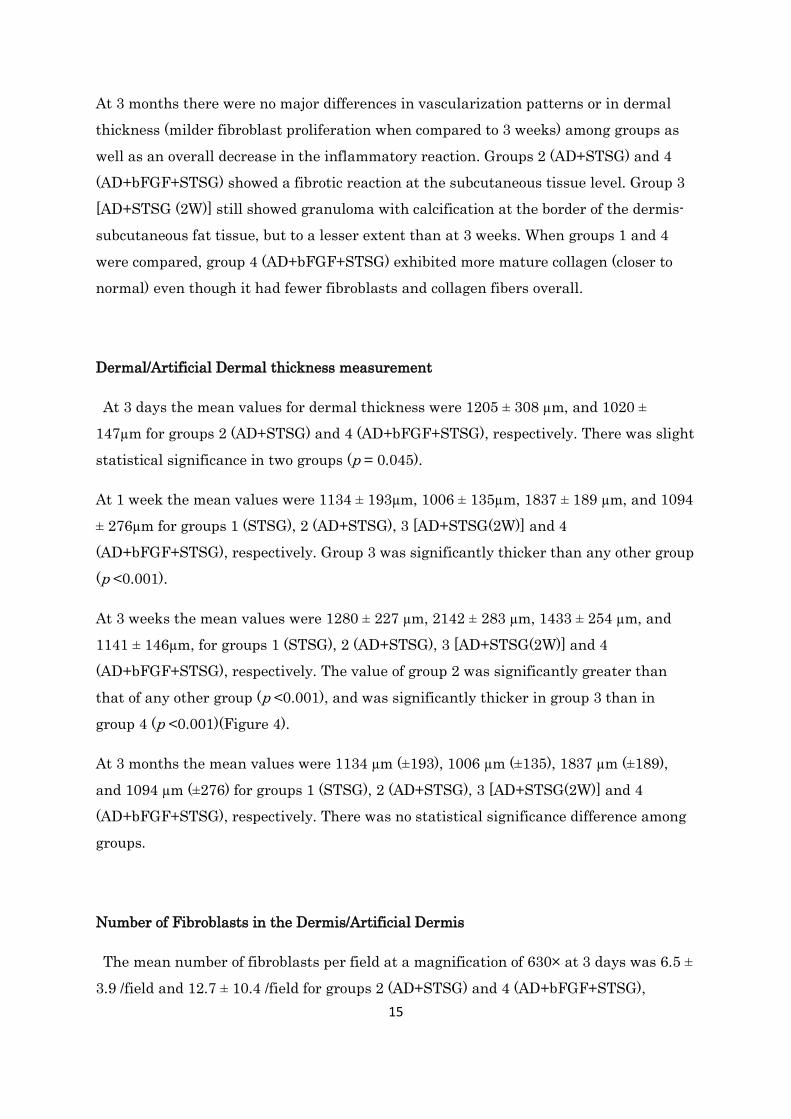
Dermal/Artificial Dermal thickness measurement
At 3 days the mean values for dermal thickness were 1205 ± 308 µm, and 1020 ± 147µm for groups 2 (AD+STSG) and 4 (AD+bFGF+STSG), respectively. There was slight statistical significance in two groups (p = 0.045).
At 1 week the mean values were 1134 ± 193µm, 1006 ± 135µm, 1837 ± 189 µm, and 1094 ± 276µm for groups 1 (STSG), 2 (AD+STSG), 3 [AD+STSG(2W)] and 4 (AD+bFGF+STSG), respectively. Group 3 was significantly thicker than any other group (p <0.001).
At 3 weeks the mean values were 1280 ± 227 µm, 2142 ± 283 µm, 1433 ± 254 µm, and 1141 ± 146µm, for groups 1 (STSG), 2 (AD+STSG), 3 [AD+STSG(2W)] and 4 (AD+bFGF+STSG), respectively. The value of group 2 was significantly greater than that of any other group (p <0.001), and was significantly thicker in group 3 than in group 4 (p <0.001)(Figure 4).
At 3 months the mean values were 1134 µm (±193), 1006 µm (±135), 1837 µm (±189), and 1094 µm (±276) for groups 1 (STSG), 2 (AD+STSG), 3 [AD+STSG(2W)] and 4 (AD+bFGF+STSG), respectively. There was no statistical significance difference among groups.
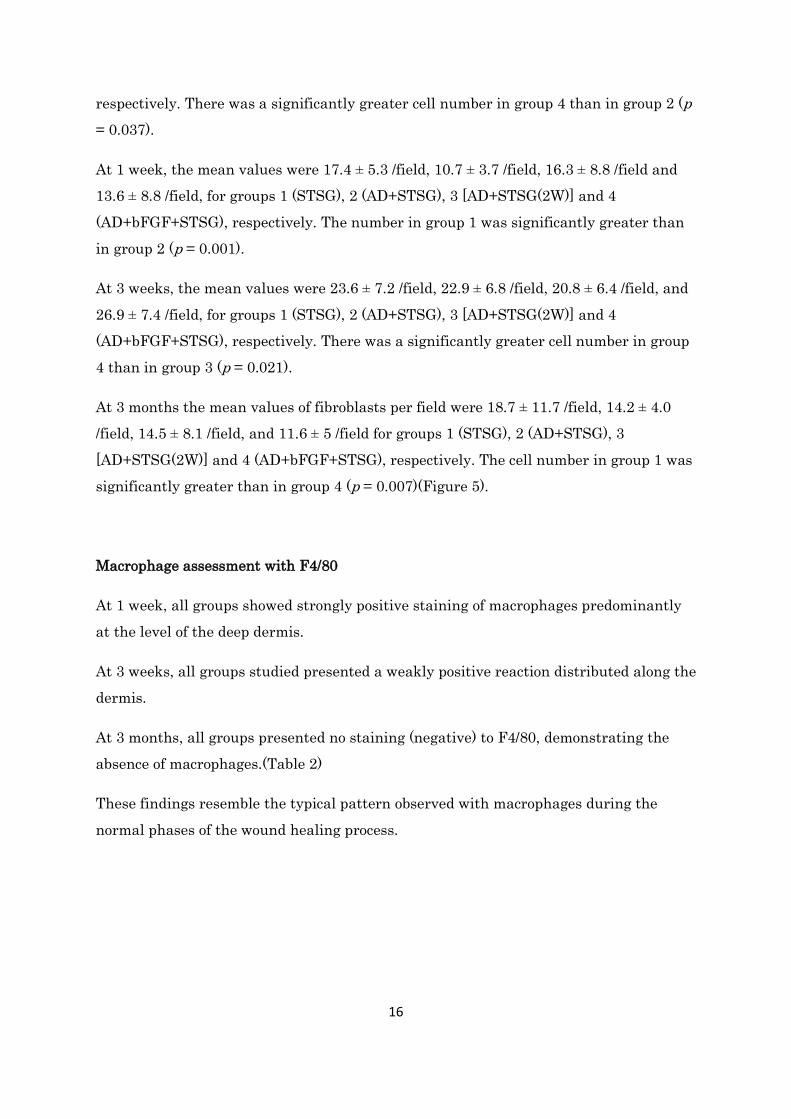
Number of Fibroblasts in the Dermis/Artificial Dermis
The mean number of fibroblasts per field at a magnification of 630× at 3 days was 6.5 ± 3.9 /field and 12.7 ± 10.4 /field for groups 2 (AD+STSG) and 4 (AD+bFGF+STSG),
16
respectively. There was a significantly greater cell number in group 4 than in group 2 (p = 0.037).
At 1 week, the mean values were 17.4 ± 5.3 /field, 10.7 ± 3.7 /field, 16.3 ± 8.8 /field and 13.6 ± 8.8 /field, for groups 1 (STSG), 2 (AD+STSG), 3 [AD+STSG(2W)] and 4 (AD+bFGF+STSG), respectively. The number in group 1 was significantly greater than in group 2 (p = 0.001).
At 3 weeks, the mean values were 23.6 ± 7.2 /field, 22.9 ± 6.8 /field, 20.8 ± 6.4 /field, and 26.9 ± 7.4 /field, for groups 1 (STSG), 2 (AD+STSG), 3 [AD+STSG(2W)] and 4 (AD+bFGF+STSG), respectively. There was a significantly greater cell number in group 4 than in group 3 (p = 0.021).
At 3 months the mean values of fibroblasts per field were 18.7 ± 11.7 /field, 14.2 ± 4.0 /field, 14.5 ± 8.1 /field, and 11.6 ± 5 /field for groups 1 (STSG), 2 (AD+STSG), 3 [AD+STSG(2W)] and 4 (AD+bFGF+STSG), respectively. The cell number in group 1 was significantly greater than in group 4 (p = 0.007)(Figure 5).
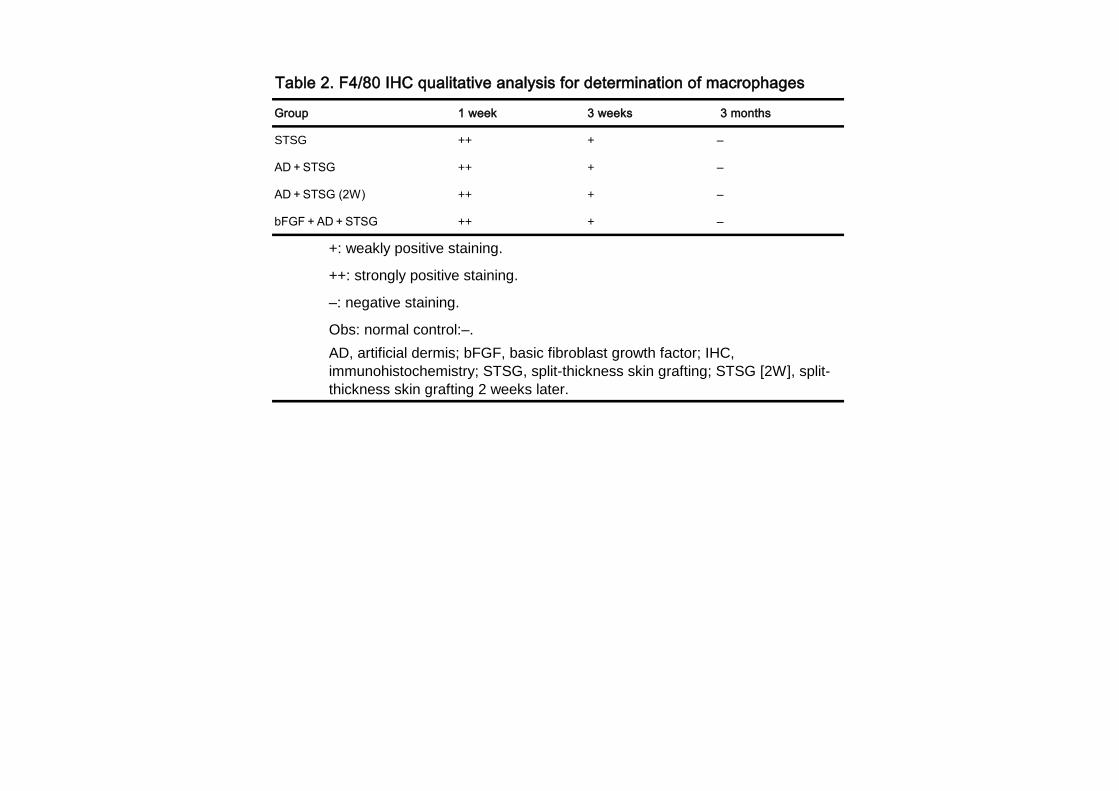
Macrophage assessment with F4/80
At 1 week, all groups showed strongly positive staining of macrophages predominantly at the level of the deep dermis.
At 3 weeks, all groups studied presented a weakly positive reaction distributed along the dermis.
At 3 months, all groups presented no staining (negative) to F4/80, demonstrating the absence of macrophages.(Table 2)
These findings resemble the typical pattern observed with macrophages during the normal phases of the wound healing process.
17
Alpha Smooth Muscle Actin (α-SMA)
At 1 week, the dermal vessels expressed by α-SMA demonstrated that group 3 [AD+STSG (2W)] had the highest number of vessels in the dermis, followed by groups 1 (STSG), 4 (AD+bFGF+STSG) and 2 (AD+STSG), respectively.
At 3 weeks group 4 (AD+bFGF+STSG) had the highest number of vessels in the dermis, followed by groups 1 (STSG), 2 (AD+STSG) and 3 [AD+STSG (2W)], respectively.
There was a steep increase in α-SMA expression between 1 and 3 weeks(Figure 6). At 3 months all groups had a similar number of dermal vessels. Overall, the number of vessels in all groups was higher at 3 weeks, followed by 3 months and 1 week, respectively.
CD31
At 1 week, the mean number of vessels positively stained with anti-CD31 per field of 200x magnification was; 7.6 ± 3.24 /field, 6.3 ± 3.02 /field, 8.5 ± 2.64 /field and 10.2 ± 1.69 /field, for groups 1 (STSG), 2 (AD+STSG), 3 [AD+STSG(2W)] and 4 (AD+bFGF+STSG), respectively. The number in group 4 was significantly greater than in group 2 (p = 0.016).
At 3 weeks, the mean values were 15.1 ± 5.11 /field, 19.1 ± 5.11 /field, 17.3 ± 6.91 /field, and 19.9 ± 7.84 /field, for groups 1 (STSG), 2 (AD+STSG), 3 [AD+STSG(2W)] and 4 (AD+bFGF+STSG), respectively. There were no statistical differences between groups.
As observed with α-SMA there was an important increment in vessel count from weeks 1 to 3.
At 3 months the mean values were 8.2 ± 4.61 /field, 8.0 ± 3.86 /field, 14.8 ± 9.29 /field, and 13.4 ± 3.89 /field for groups 1 (STSG), 2 (AD+STSG), 3 [AD+STSG(2W)] and 4 (AD+bFGF+STSG), respectively. There were no significant differences amongst groups (Figure 7).
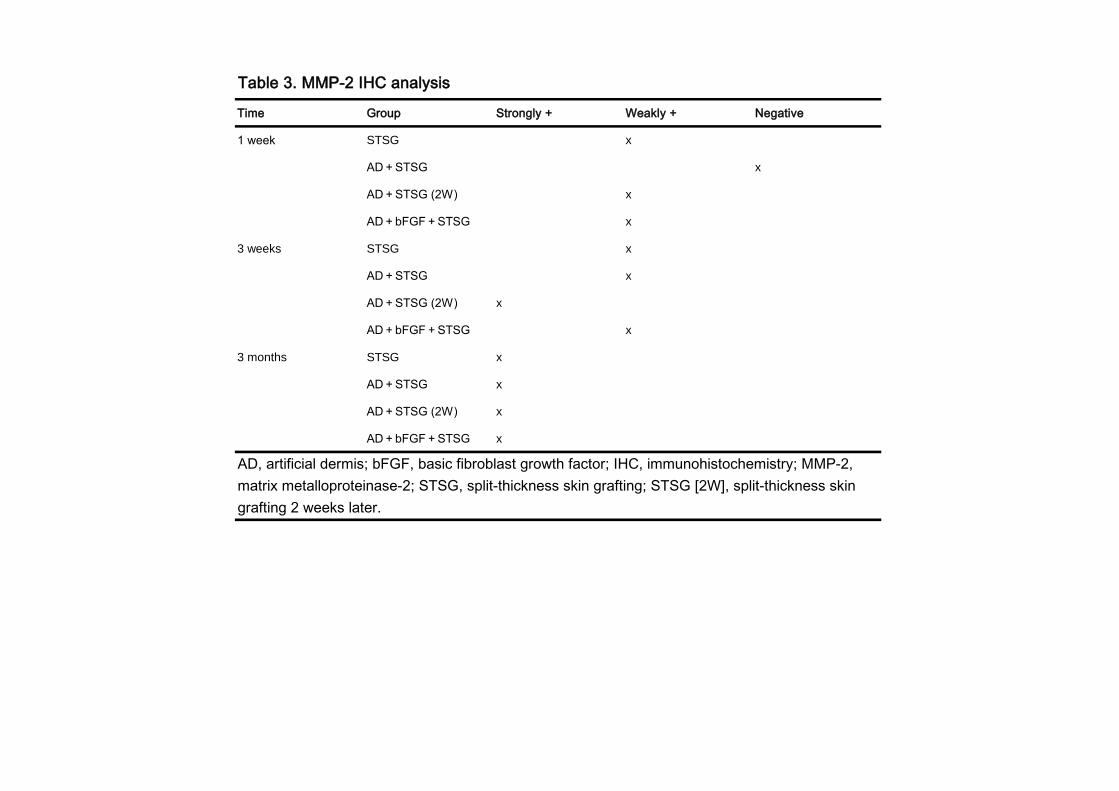
Matrix MetalloProteinase-2 (MMP-2) Immunohistochemistry
18
At 1 week groups 1 (STSG), 3 [AD+STSG (2W)] and 4 (AD+bFGF+STSG) showed a weak positive reaction, and group 2 (AD+STSG) a negative reaction to the MMP-2 antibody. No groups showed a strongly positive reaction.
At 3 weeks groups 1 (STSG), 2 (AD+STSG) and 4 (AD+bFGF+STSG) exhibited a weak positive reaction, and group 3 [AD+STSG (2W)] a strong positive reaction to the MMP-2 antibody. No groups showed a negative reaction.
At 3 months all groups exhibited a strongly positive reaction to the MMP-2 antibody (Figure 8)(Table 3).
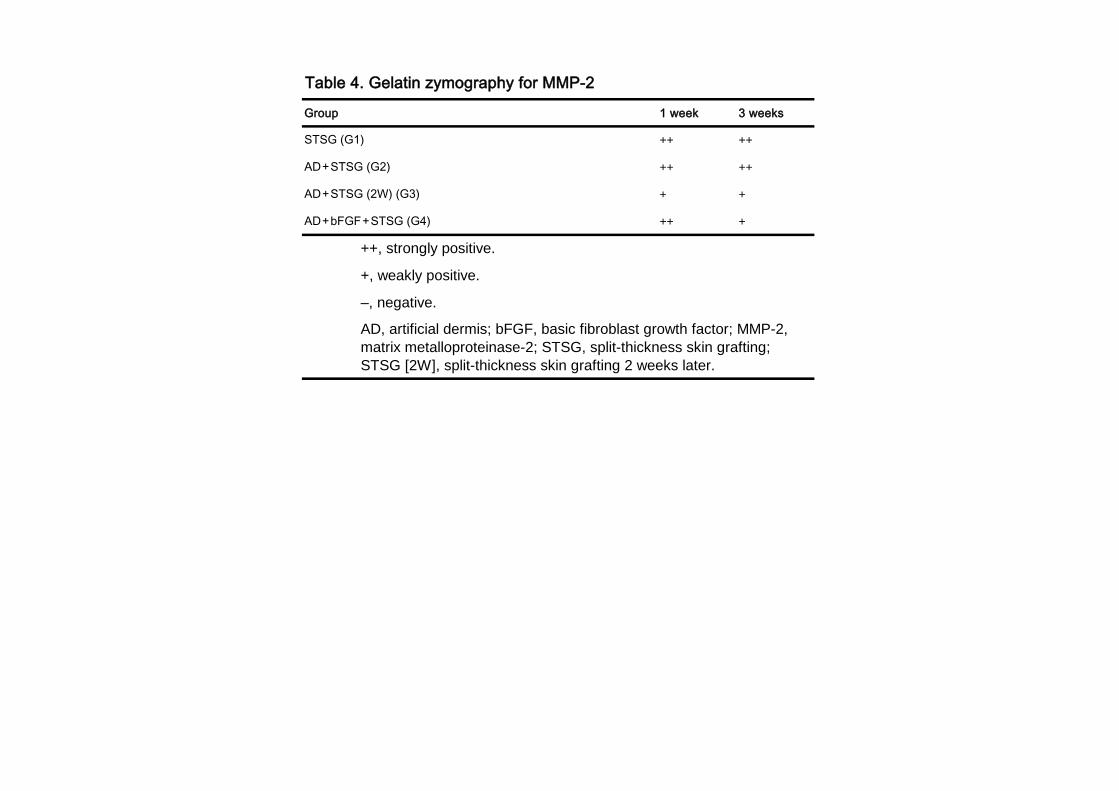
Gelatin Zymography
At the 72 kDa (kiloDalton) band corresponding to MMP-2 (Gelatinase A), the activity at 1 week was strongly positive for groups 1 (STSG), 2 (AD+STSG) and 4 (AD+bFGF+STSG), and weakly positive for group 3 [AD+STSG (2W)].
At 3 weeks, a higher activity (strongly positive) was observed for groups 1 (STSG) and 2 (AD+STSG), whereas groups 3 [AD+STSG (2W)] and 4 (AD+bFGF+STSG) showed less activity (weakly positive) when compared (Figure 9)(Table 4).
Overall there was a higher activity at 1 week when compared to 3 weeks.
Real-time Reverse Transcriptase Polymerase Chain Reaction (RT-PCR) for MMP-2
The mean relative mRNA expression values of RT-PCR for MMP-2 at 1 week were as follows; 2.7 ± 0.97, 2.4 ± 1.47, 5.4 ± 1.36 and 2.1 ± 0.98, for groups 1 (STSG), 2 (AD+STSG), 3 [AD+STSG(2W)] and 4 (AD+bFGF+STSG), respectively. There were statistically significant differences between group 3 [AD+STSG(2W)] and the rest of the groups (p = 0.036).
At 3 weeks, the mean relative values were; 1 ± 0.28, 1.2 ± 0.31, 5.9 ± 2.66, and 2.8 ± 0.44, for groups 1 (STSG), 2 (AD+STSG), 3 [AD+STSG(2W)] and 4 (AD+bFGF+STSG), respectively. There’s was a highly statistical significant difference between group 3 [AD+STSG(2W)] and all other groups (p = 0.008)(Figure 10).
19
When the total expression was compared between groups in regards of time, it showed to be higher at 1 week.
Transmission Electron Microscopy
At 3 weeks, electron microscopy of group 4, one-stage skin grafting with artificial dermis and bFGF, demonstrated the most evenly distributed fibrils in the entire dermis. In contrast, the appearance in group 3 denotes more inflammatory invading cells, the appearance in group 2 demonstrated denser fibrils with more open gaps, and the appearance in group 1 demonstrated a stronger dermal-epidermal junction with scant dermal fibrils (Figure 11). By 3 months, electron microscopy from all groups showed that they had matured.
Discussion
Skin grafting experiments using rodents are sometimes a concern as the micro-skin graft results in greater contraction of the wound area (19). Contraction of the wound area is an integral part of the wound bed, the interface between the skin and graft. Thus, we adopted a system to prevent wound closure from the surrounding tissue as well as to observe the natural progress of the interface between the graft and wound bed and the graft itself.
A similar system using Matriderm® and the dermal part of Integra® but different in study design was used to clarify the engraftment rate and vascularization in these two artificial dermis’ using a neonatal Wistar rat epidermis over a nude rat recipient (20). In this comparative experimental study, however, neonatal epidermal skin grafting was performed 1 or 2 weeks after transferring the artificial dermis. Matriderm® was superior to the dermal part of Integra® at 1 week in terms of graft take, but the graft take at 2 weeks after the 2 week-waiting period of Integra® demonstrated the best among 4 groups.
Matriderm® as a transport carrier of cultured keratinocytes and melanocytes successfully demonstrated viable, metabolically active keratinocytes and melanocytes and resulted in pigmented reconstructed epidermis in vitro (21).
20
In our experiment, we tested the efficacy of one-stage artificial dermis and skin grafting and this procedure may reduce the frequency of surgery, diminishing the intermission between the artificial dermis and split-thickness skin grafting and thus shortening the patients’ treatment days and overall medical costs. The graft rate sequentially improved in groups 1 and 3 from 1 week to 3 months, whereas the graft rates in groups 2 and 4, which had artificial dermis with or without bFGF in one step, demonstrated sagging at 2 weeks. By 3 months, graft take rates in all groups seemed to be 100% because the tissue that had not taken had fallen off and the surrounding tissue had contracted to cover the defects. The contraction rate in group 3 was significantly greater than in groups 2 and 4 at 1 week and group 2 at 2 weeks. As the contraction rate increases, the graft seems to be masked by surrounding tissue replacing the original defect, and so the graft take rate is relatively increased. The dermal or artificial dermal thickness increases 2-fold between 1 week and 3 weeks in group 2 but decreases 20 % between 1 week and 3 weeks in group 3, while it is almost consistent from day 3, 1 week and 3 weeks in group 4. Skin graft survival with insertion of artificial dermis is determined at day 14 (22).
Thus, gross and histological evaluations at 2 weeks and 3 weeks are reasonable. Fibroblast counting at 3 weeks in group 4 was statistically greater than in group 3 and the immunohistochemical expression of α-SMA was greatest in the number of cells and intensity. The immunohistochemistry of F4/80 demonstrated the gradual regression from 1 week, 3 weeks to 3 months probably due to the decrease or attenuation of macrophages in the wound healing process. α-SMA-positive and vessel-forming cells are considered to be mature blood vessels, thus indicating functional blood vessels (23). The dermal tissue from group 4 in the 3 weeks demonstrated the highest expression of α-SMA, thus showing highly and more matured blood vessels in the dermis. CD31, reflecting neo-vessel formation, expressed greatest in Group 4, with bFGF than other groups and reaches its peak at 3 weeks in all groups and decreases at 3 months.
Tissue elasticity denoted by R7 obtained by Cutometer in group 4 demonstrated significantly 27.5% more elasticity than group 2, the difference being no bFGF; thus, bFGF affects elasticity in the one-stage artificial dermis and skin grafting model. In our previous clinical measurement, although it was measured in human clinical cases, and used a different procedure of two-stage skin grafting and different measurement device, a durometer, of bFGF-treated artificial dermis and skin grafting showed more than 50% better tissue hardness (5). The tissue extensibility denoted by R0 is determined by the dermal thickness; thus, the thinnest tissue from group 1 demonstrated the greatest value and was especially more significantly extensible than group 2.
21
The expression of matrix metalloproteinase-2 (MMP-2) was somewhat weak at 3 weeks, except in group 3, in which the intensity was stronger than in other groups. MMP-2 expression was inversely correlated with concentrated collagen hydrogel in an in vitro assay (24), and the effective collagen content in group 3 may be attenuated compared to other groups.
Also in immunohistochemistry, MMP-2 levels gradually increase from 1 week, 3 weeks to 3 months. MMP-2 is constitutively synthesized (25). The expression levels of MMP-2 between RT-PCR and gelatin zymography are different. The values of Group 3, which is staged skin grafting demonstrated higher in transcript levels and lower in gelatinolytic activity when compared to other groups both; at 1 week and 3 weeks. The post-transcriptional mRNA stabilization of MMP-2 is controlled, and the protein level is not reflected (26). Apparently in Group 3, the tissue inflammation is prolonged due to less graft take and more continued wound healing process due to staged skin grafting.
Electron microscopic findings at 3 weeks showed comparable functional elasticity and light microscopic findings to group 4, so one-stage artificial dermis and split-thickness skin grafting with bFGF may bring about the most elasticity, maturity of fibroblasts and more blood supply as the fibrils are organized, with less invasive cells.
We therefore reach the conclusion that one-stage artificial dermis and split-thickness skin grafting has a graft take rate almost as high as split-thickness skin grafting alone and with more fibroblasts and blood vessels and greater elasticity. Thus, this method is recommended because it is faster, easier, and less invasive, with shorter hospitalization.
ACKNOWLEDGMENTS
Conflict of interest

22
All authors disclose any financial and personal relationships with other people or organizations that could inappropriately influence (bias) their work.
Financial support
This study was mainly supported by grants from the Japanese Ministry of Education, Sports and Culture, #21390479 and #22406030, and partly funded by Olympus Terumo Biomaterials Corp. (Tokyo, Japan).
Abbreviations
AD: Artificial Dermis
STSG: Split-Thickness Skin Graft

23
α-SMA: α-smooth muscle actin
MMP-2: matrix metalloproteinase-2
b-FGF: Basic Fibroblast Growth Factor
H & E: Hematoxylin and Eosin staining
RT-PCR: Real-time reverse transcriptase polymerase chain reaction
IHC: Immunohistochemistry
Gel Zymography: Gelatin Zymography
References
1. Rizzi SC, Upton Z, Bott K, Dargaville TR. Recent advances in dermal wound
24
healing: biomedical device approaches. Expert Rec med Devices. 7: 143-154, 2010.
2. Yannas IV, Orgill DP, BUrker JF. Template for skin regeneration. Plast Reconstr Surg. 127 Suppl: 60S-70S, 2011.
3. Pandya AN, Woodward B, Parkhouse N. The use of cultured autologous
keraninocytes with integra in the resurfacing of acute burns. Plast Reconstr Surg. 10: 825-828, 1998.
4. Chan ES, Lam PK, Liew CT, Lau HC, Yen RS, King WW. A new technique to
resurface wounds with composite biocompatible epidermal graft and artificial dermis. J Truama. 50: 358-362, 2001.
5. Akita S, Akino K, Tanaka K, Anraku K, Hirano A. A basic fibroblast growth factor
improves lower extremity wound healing with a porcine-derived skin substitute. J Trauma. 64: 809-815, 2008.
6. Akita S, Tanaka K, Hirano A. Lower extremity reconstruction after necrotizing
fasciitis and necrotic skin lesions using a porcine-derived skin substitute. J Plast Reconstr Aesthet Surg. 59: 759-763, 2006.
7. Wain RA, Shah SH, Senarath-Yapa K, Laitung JK. Dermal substitutes do well on
dura: comparison of split skin grafting+/-artificial dermis for reconstruction of full-thickness calvarial defects. J Plast Reconstr Aesthet Surg. 63: e826-8, 2010.
8. Moiemen N, Yarrow J, Hodgson E, Constantinides J, Chipp E, Oakley H, Shale E,
Freeth M. Long-term clinical and histological analysis of Integra dermal regeneration template. Plast Reconstr Surg. 127: 1149-54. 2011.
9. Atiyeh BS, Hayek SN, Gunn SW. New technologies for burn wound closure and
healing-review of the literature. Burns. 31: 944-956. 2005.
10. Jung SN, Chung JW, Yim YM, Kwon H. One-stage skin grafting of the exposed skull with acellular human dermis (AlloDerm). J Craniofac Surg. 19: 1660-1662, 2008.
25
11. Ryssel H, Gazyakan E, Germann G, Ohlbauer M. The use of Matriderm® in early excision and simultaneous autologous skin grafting in burns-A pilot study. Burns. 34: 93-97, 2008.
12. Akita S, Akino K, Imaizumi T, et al. A basic fibroblast growth factor improved the
quality of skin grafting in burn patients. Burns. 2005; 31:855-858.
13. Akita S, Akino K, Imaizumi T, Hirano A. Basic fibroblast growth factor accelerate and improves second-degree burn wound healing. Wound Repair Regen. 16: 635-641, 2008.
14. Muller PY, Janovjak H, Miserez AR, Dobbie Z. Processing of gene expression data
generated by quantitative real-time RT-PCR. Biotechniques. 32:1372–1379, 2002.
15. Nakamura T, Torimura T, Sakamoto M, Hashimoto O, Taniguchi E, Inoue K,
Sakata R, Kumashiro R, Murohara T, Ueno T, Sata M. Significance and therapeutic potential of endothelial progenitor cell transplantation in a cirrhotic liver rat model. Gastroenterology. 133:91–107 e101, 2007.
16. Nakamura T, Ueno T, Sakamoto M, Sakata R, Torimura T, Hashimoto O, Ueno H, Sata M. Suppression of transforming growth factor-beta results in upregulation of transcription of regeneration factors after chronic liver injury. J Hepatol. 41:974–982, 2004.
17. Nakamura T, Tsutsumi V, Torimura T, Naitou M, Iwamoto H, Masuda H, Hashimoto O, Koga H, Abe M, Ii M, Kawamoto A, Asahara T, Ueno T, Sata M. Human Peripheral Blood CD34-Positive Cells Enhance Therapeutic Regeneration of Chronically Injured Liver in Nude Rats. J. Cell. Physiol. 227: 1538–1552, 2012.
18. Mitsutake N, Miyagishi M, Mitsutake S, Akeno N, Mesa C, Jr, Knauf J, Zhang L, Taira K, Fagin J. BRAF Mediates RET/PTC-Induced Mitogen-Activated Protein Kinase Activation in Thyroid Cells: Functional Support for Requirement of the RET/PTC-RAS-BRAF Pathway in Papillary Thyroid Carcinogenesis. Endocrinology. 147(2):1014–1019, 2006.
19. Rissin Y, Fodor L, Talmon G, Fishelson O, Ullmann Y. Investigating human microskin grafting technique in a new experimental model. Burns. 35: 681-686, 2009.
26
20. Schneider J, Biedermann T, Widmer D, Montano I, Meuli M, Reichmann E, Schiestl C. Matriderm® versus Integra®: a comparative experimental study. Burns. 35: 51-5, 2009.
21. Waaijman T, Breetveld M, Ulrich M, Middelkoop E, Scheper RJ, Gibbs S. Use of a
collagen-elastin matrix as transport carrier system to transfer proliferating epidermal cells to human dermis in vitro. Cell Transplant. 19:1339-48, 2010.
22. Bottcher-Haberzeth S, Biedermann T, Schiestl C, Hartmann-Fritsch F, Schneider J, Reichmann E, Meuli M. Matriderm 1 mm versus Integra single layer 1.3 mm for one-step closure of full thickness skin defects: a comparative experimental study in rats. Pediatr Surg Int. 28: 171-177, 2012.
23. Guo R, Xu S, Ma L, Huang A, Gao C. The Healing of full-thickness burns treated by
using plasmid DNA encoding VEGF-165 activated collagen-chitosan dermal equivalents. Biomaterials. 32: 1019-1931, 2010.
24. Helary C, Bataille I, Abed A, Illoul C, Anglo A, Louedec L, Letourneur D, Meddahi-
Pelle A, Giraud-Guille MM. Concentrated collagen hydrogels as dermal substitutes. Biomaterials. 31: 481-490, 2010.
25. Agren MS. Gelatinase activity during wound healing. Br J Dermatol. 131: 634-640,
1994. 26. Overall CM, Wrana JL, Sodek J. Transcriptional and post-transcriptional
regulation of 72-kDa gelatinase/Type IV collagenase by transforming growth factor-beta-1 in human fibroblasts. Comparisons with collagenase and tissue inhibitor of matrix mettaloproteinase gene expression. J Bio Chem. 266: 14064-14071, 1991.
27
Figure legends
Figure 1 Graft take rate
Serial graft take rate for each group at 1 week, 2 weeks, 3 weeks and 3 months. When taking a photograph, the axis to the object (grafted area) was adjusted to be perpendicular by the digital camera.
The measurement tool of Adobe Photoshop CS5 Extended software was applied to relative areas of the graft take and contraction, and the graft take rate (%) was obtained by the visible graft take area divided by the initial total implantation area, the results were multiplied by 100 and expressed as a percentage.
The mean graft take rates at 1 week were 84 ± 9.0 %, 86 ± 5.9 %, 68 ± 8.1 %, and 83 ± 6.4 % for groups 1 (STSG), 2 (AD+STSG), 3 [AD+STSG(2W)] and 4 (AD+bFGF+STSG), respectively. Group 3 was significantly lower than the other groups (p <0.001), and group 2 was significantly greater than group 4 (p = 0.02).
At 2 weeks, the mean percentages of the graft take rates were 88 ± 8.1 %, 81 ± 9.8 %, 74 ± 7.9 %, and 78 ± 8.3 % for groups 1, 2, 3 and 4, respectively. Group 1 was significantly greater than the other groups (p <0.001), group 2 was significantly greater than group 3 (p <0.001).
At 3 weeks the mean graft take rates were 99 ± 1.2 %, 93 ± 4.2 %, 87 ± 10.6 %, and 92 ± 5.4 % for groups 1, 2, 3 4, respectively. Group 1 was significantly greater than all other groups (p <0.001) and group 3 was significantly smaller than any other group (p <0.001).
At 3 months all graft take rates were 100% in all groups.
28
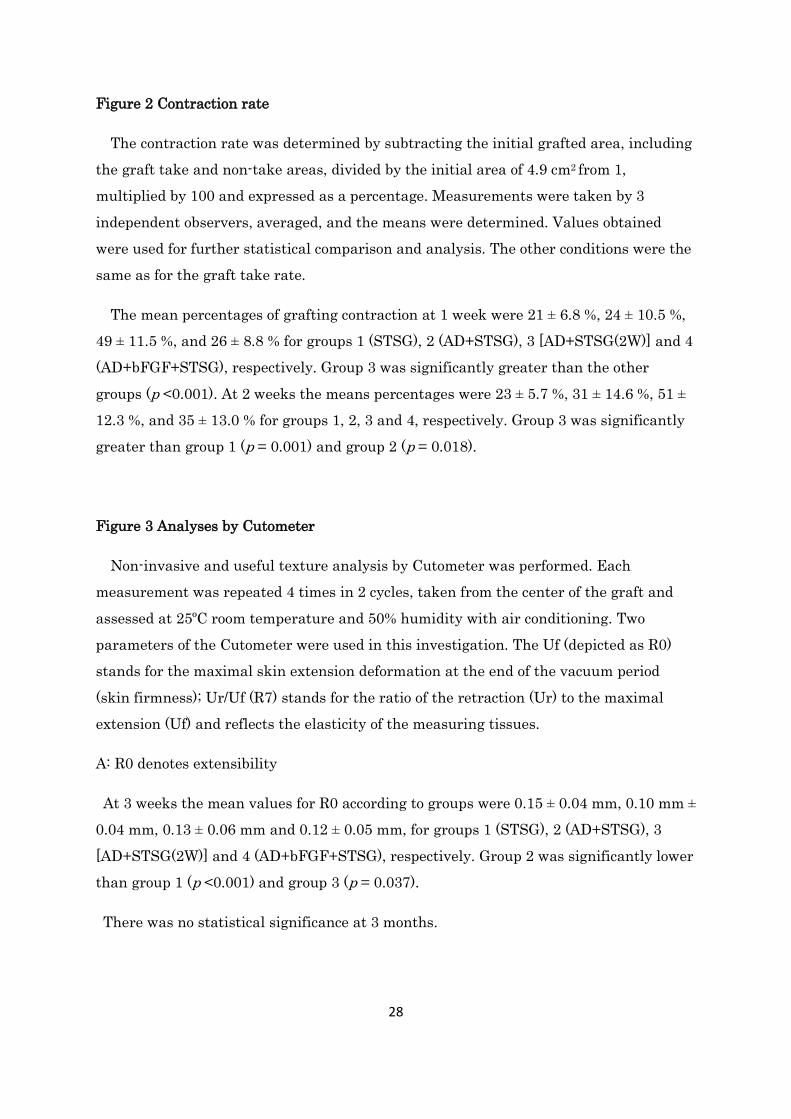
Figure 2 Contraction rate
The contraction rate was determined by subtracting the initial grafted area, including the graft take and non-take areas, divided by the initial area of 4.9 cm2 from 1, multiplied by 100 and expressed as a percentage. Measurements were taken by 3 independent observers, averaged, and the means were determined. Values obtained were used for further statistical comparison and analysis. The other conditions were the same as for the graft take rate.
The mean percentages of grafting contraction at 1 week were 21 ± 6.8 %, 24 ± 10.5 %, 49 ± 11.5 %, and 26 ± 8.8 % for groups 1 (STSG), 2 (AD+STSG), 3 [AD+STSG(2W)] and 4 (AD+bFGF+STSG), respectively. Group 3 was significantly greater than the other groups (p <0.001). At 2 weeks the means percentages were 23 ± 5.7 %, 31 ± 14.6 %, 51 ± 12.3 %, and 35 ± 13.0 % for groups 1, 2, 3 and 4, respectively. Group 3 was significantly greater than group 1 (p = 0.001) and group 2 (p = 0.018).
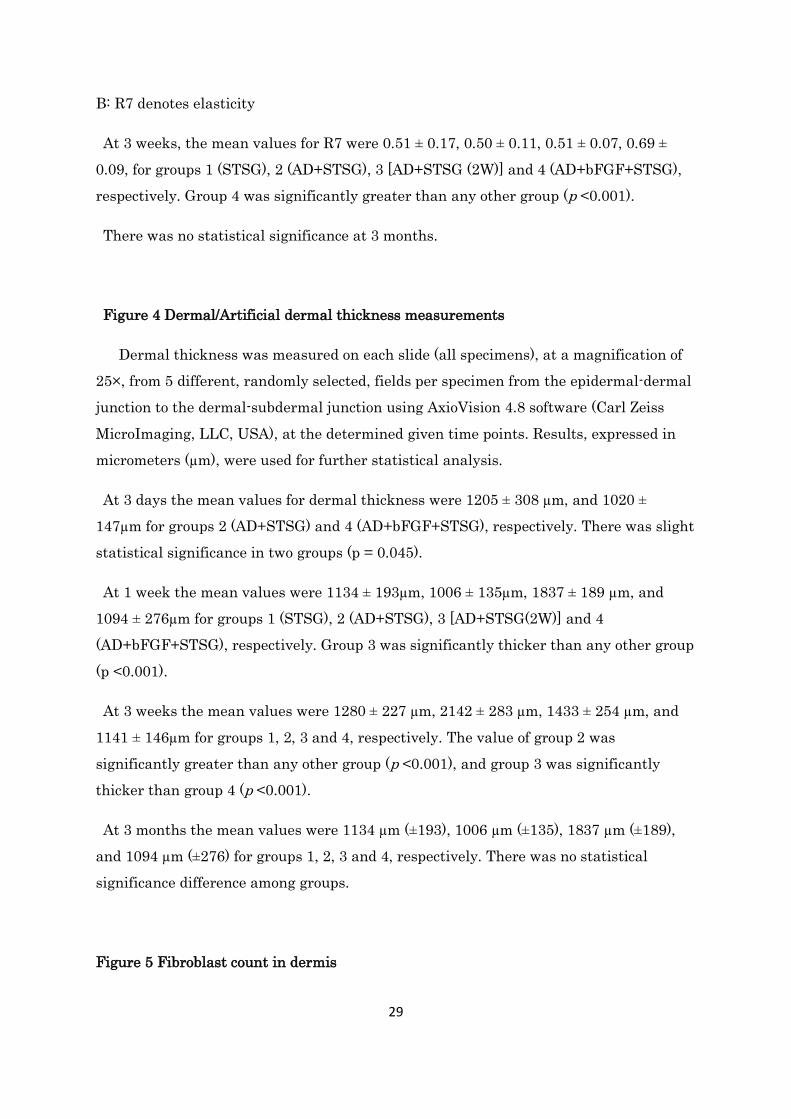
Figure 3 Analyses by Cutometer
Non-invasive and useful texture analysis by Cutometer was performed. Each measurement was repeated 4 times in 2 cycles, taken from the center of the graft and assessed at 25ºC room temperature and 50% humidity with air conditioning. Two parameters of the Cutometer were used in this investigation. The Uf (depicted as R0) stands for the maximal skin extension deformation at the end of the vacuum period (skin firmness); Ur/Uf (R7) stands for the ratio of the retraction (Ur) to the maximal extension (Uf) and reflects the elasticity of the measuring tissues.
A: R0 denotes extensibility
At 3 weeks the mean values for R0 according to groups were 0.15 ± 0.04 mm, 0.10 mm ± 0.04 mm, 0.13 ± 0.06 mm and 0.12 ± 0.05 mm, for groups 1 (STSG), 2 (AD+STSG), 3 [AD+STSG(2W)] and 4 (AD+bFGF+STSG), respectively. Group 2 was significantly lower than group 1 (p <0.001) and group 3 (p = 0.037).
There was no statistical significance at 3 months.
29
B: R7 denotes elasticity
At 3 weeks, the mean values for R7 were 0.51 ± 0.17, 0.50 ± 0.11, 0.51 ± 0.07, 0.69 ± 0.09, for groups 1 (STSG), 2 (AD+STSG), 3 [AD+STSG (2W)] and 4 (AD+bFGF+STSG), respectively. Group 4 was significantly greater than any other group (p <0.001).
There was no statistical significance at 3 months.
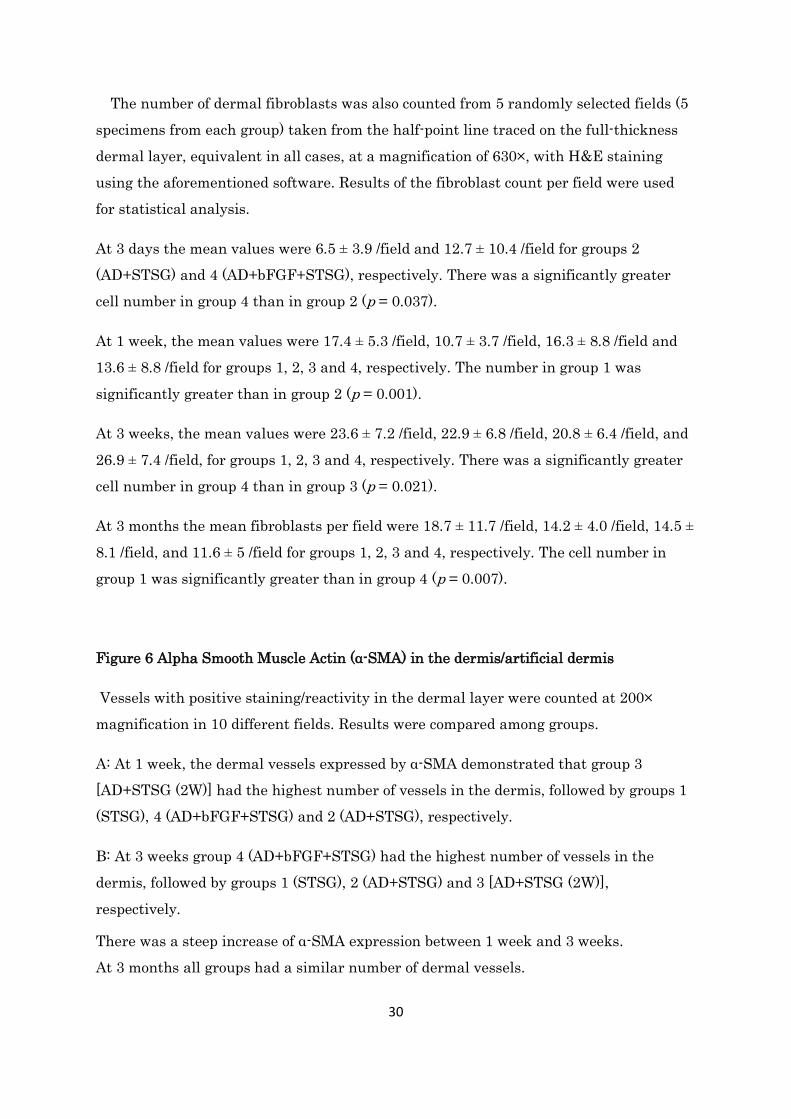
Figure 4 Dermal/Artificial dermal thickness measurements
Dermal thickness was measured on each slide (all specimens), at a magnification of 25×, from 5 different, randomly selected, fields per specimen from the epidermal-dermal junction to the dermal-subdermal junction using AxioVision 4.8 software (Carl Zeiss MicroImaging, LLC, USA), at the determined given time points. Results, expressed in micrometers (µm), were used for further statistical analysis.
At 3 days the mean values for dermal thickness were 1205 ± 308 µm, and 1020 ± 147µm for groups 2 (AD+STSG) and 4 (AD+bFGF+STSG), respectively. There was slight statistical significance in two groups (p = 0.045).
At 1 week the mean values were 1134 ± 193µm, 1006 ± 135µm, 1837 ± 189 µm, and 1094 ± 276µm for groups 1 (STSG), 2 (AD+STSG), 3 [AD+STSG(2W)] and 4 (AD+bFGF+STSG), respectively. Group 3 was significantly thicker than any other group (p <0.001).
At 3 weeks the mean values were 1280 ± 227 µm, 2142 ± 283 µm, 1433 ± 254 µm, and 1141 ± 146µm for groups 1, 2, 3 and 4, respectively. The value of group 2 was significantly greater than any other group (p <0.001), and group 3 was significantly thicker than group 4 (p <0.001).
At 3 months the mean values were 1134 µm (±193), 1006 µm (±135), 1837 µm (±189), and 1094 µm (±276) for groups 1, 2, 3 and 4, respectively. There was no statistical significance difference among groups.
Figure 5 Fibroblast count in dermis
30
The number of dermal fibroblasts was also counted from 5 randomly selected fields (5 specimens from each group) taken from the half-point line traced on the full-thickness dermal layer, equivalent in all cases, at a magnification of 630×, with H&E staining using the aforementioned software. Results of the fibroblast count per field were used for statistical analysis.
At 3 days the mean values were 6.5 ± 3.9 /field and 12.7 ± 10.4 /field for groups 2 (AD+STSG) and 4 (AD+bFGF+STSG), respectively. There was a significantly greater cell number in group 4 than in group 2 (p = 0.037).
At 1 week, the mean values were 17.4 ± 5.3 /field, 10.7 ± 3.7 /field, 16.3 ± 8.8 /field and 13.6 ± 8.8 /field for groups 1, 2, 3 and 4, respectively. The number in group 1 was significantly greater than in group 2 (p = 0.001).
At 3 weeks, the mean values were 23.6 ± 7.2 /field, 22.9 ± 6.8 /field, 20.8 ± 6.4 /field, and 26.9 ± 7.4 /field, for groups 1, 2, 3 and 4, respectively. There was a significantly greater cell number in group 4 than in group 3 (p = 0.021).
At 3 months the mean fibroblasts per field were 18.7 ± 11.7 /field, 14.2 ± 4.0 /field, 14.5 ± 8.1 /field, and 11.6 ± 5 /field for groups 1, 2, 3 and 4, respectively. The cell number in group 1 was significantly greater than in group 4 (p = 0.007).
Figure 6 Alpha Smooth Muscle Actin (α-SMA) in the dermis/artificial dermis
Vessels with positive staining/reactivity in the dermal layer were counted at 200× magnification in 10 different fields. Results were compared among groups.
A: At 1 week, the dermal vessels expressed by α-SMA demonstrated that group 3 [AD+STSG (2W)] had the highest number of vessels in the dermis, followed by groups 1 (STSG), 4 (AD+bFGF+STSG) and 2 (AD+STSG), respectively.
B: At 3 weeks group 4 (AD+bFGF+STSG) had the highest number of vessels in the dermis, followed by groups 1 (STSG), 2 (AD+STSG) and 3 [AD+STSG (2W)], respectively.
There was a steep increase of α-SMA expression between 1 week and 3 weeks. At 3 months all groups had a similar number of dermal vessels.
31
Overall, the number of vessels in all groups was higher at 3 weeks, followed by 3 months and 1 week, respectively.
Figure 7 Count of CD31 positive (+) vessels
At 1 week, the mean number of vessels CD31-positive per field of 200x magnification was; 7.6 ± 3.24 /field, 6.3 ± 3.02 /field, 8.5 ± 2.64 /field and 10.2 ± 1.69 /field, for groups 1 (STSG), 2 (AD+STSG), 3 [AD+STSG(2W)] and 4 (AD+bFGF+STSG), respectively. The number in group 4 was significantly greater than in group 2 (p = 0.016).
At 3 weeks, the mean values were 15.1 ± 5.11 /field, 19.1 ± 5.11 /field, 17.3 ± 6.91 /field, and 19.9 ± 7.84 /field, for groups 1 (STSG), 2 (AD+STSG), 3 [AD+STSG(2W)] and 4 (AD+bFGF+STSG), respectively. No statistical difference between groups was observed.
At 3 months the mean values were 8.2 ± 4.61 /field, 8 ± 3.86 /field, 14.8 ± 9.29 /field, and 13.4 ± 3.89 /field for groups 1 (STSG), 2 (AD+STSG), 3 [AD+STSG(2W)] and 4 (AD+bFGF+STSG), respectively. There were no significant differences amongst groups.
Figure 8 Matrix metalloproteinase-2 (MMP-2) expression
A: At 1 week groups 1 (STSG), 3 [AD+STSG (2W)] and 4 (AD+bFGF+STSG) showed a weak positive reaction, and group 2 (AD+STSG) a negative reaction to the MMP-2 antibody. No groups showed a strongly positive reaction.
B: At 3 weeks groups 1 (STSG), 2 (AD+STSG) and 4 (AD+bFGF+STSG) exhibited a weak positive reaction, and group 3 [AD+STSG (2W)] a strong positive reaction to the MMP-2 antibody. No groups showed a negative reaction.
C: At 3 months all groups exhibited a strongly positive reaction to the MMP-2 antibody
Figure 9 Gelatin Zymography
At the 72 kDa band corresponding to MMP-2 (Gelatinase A), the activity at 1 week was strongly positive for groups 1 (STSG), 2 (AD+STSG) and 4 (AD+bFGF+STSG), and weakly positive for group 3 [AD+STSG (2W)].
At 3 weeks, higher activity was observed for groups 1 (STSG) and 2 (AD+STSG), whereas groups 3 [AD+STSG (2W)] and 4 (AD+bFGF+STSG) showed less activity.
Figure 10 RT-PCR for MMP-2
At 1 week the mean relative mRNA expression values for MMP-2 were of 2.7, 2.4, 5.4 and 2.1, for groups 1 (STSG), 2 (AD+STSG), 3 [AD+STSG(2W)] and 4 (AD+bFGF+STSG),
32
respectively. At 3 weeks, the mean relative values were; 1, 1.2, 5.9, and 2.8, for groups 1 (STSG), 2 (AD+STSG), 3 [AD+STSG(2W)] and 4 (AD+bFGF+STSG), respectively. At both time points there were statistical significant differences between group 3 [AD+STSG(2W)] and all groups.
Figure 11 Transmission electron microscopy
Tissue samples were taken, as described previously (at 1 week, 3 weeks, and 3 months), from the center of the grafts and fixed in 2.5% buffered glutaraldehyde in order to be examined by electron microscopy.
At 3 weeks, electron microscopy of group 4, one-stage skin grafting with artificial dermis and bFGF, demonstrated the most evenly distributed fibrils in the entire dermis. In contrast, the appearance in group 3 showed more inflammatory invading cells, the appearance in the group 2 demonstrated denser fibrils with more open gaps, and the appearance in group 1 demonstrated a stronger dermal-epidermal junction with scant dermal fibrils.
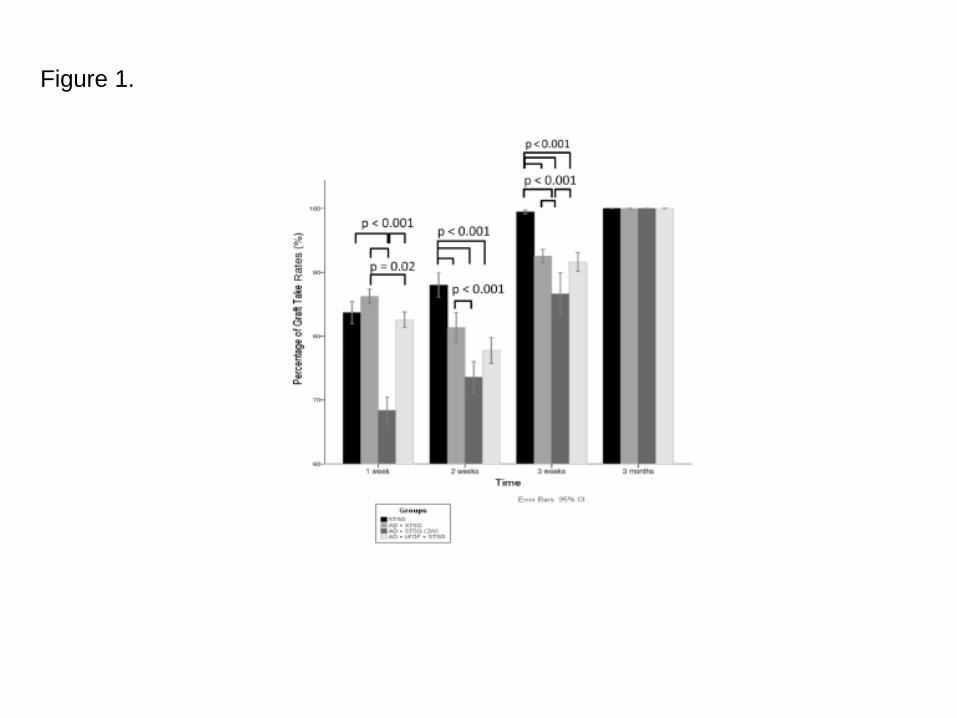
Figure 1.
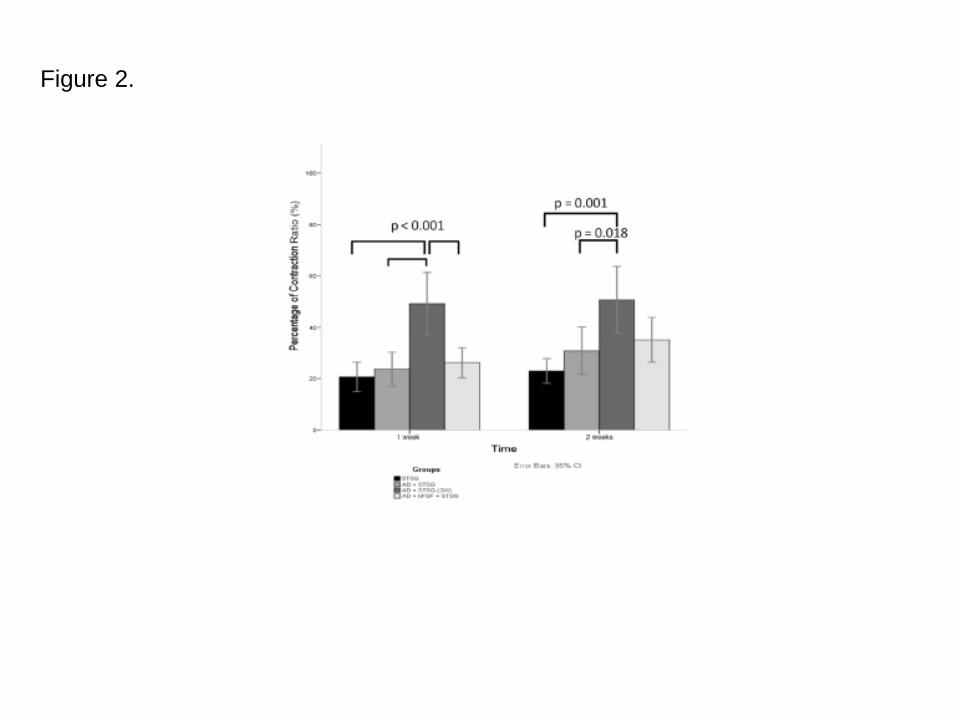
Figure 2.
Figure 3.
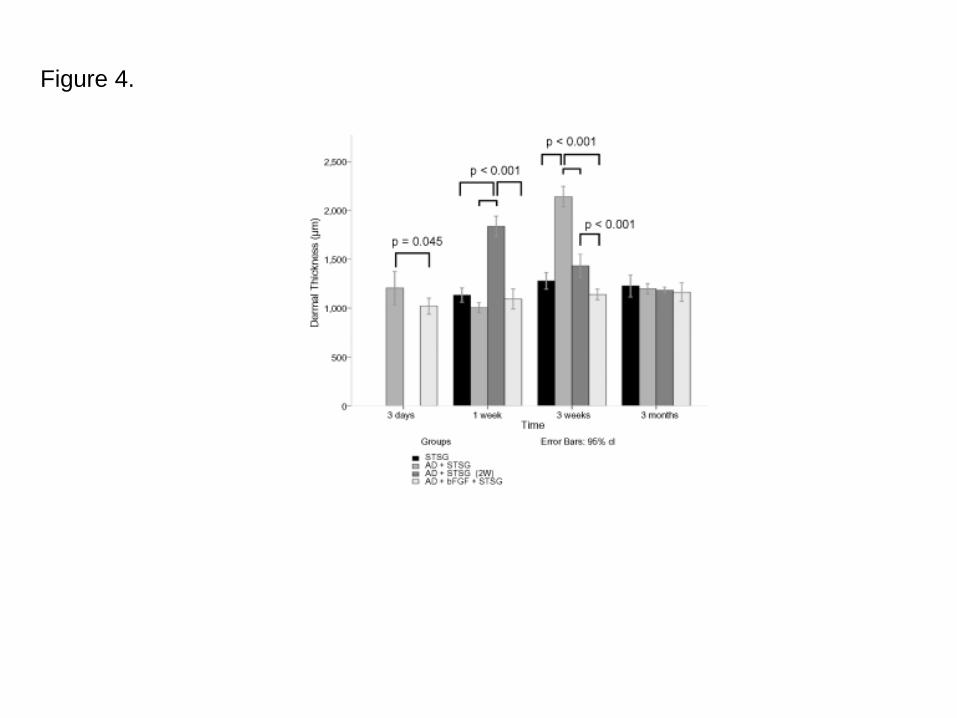
Figure 4.
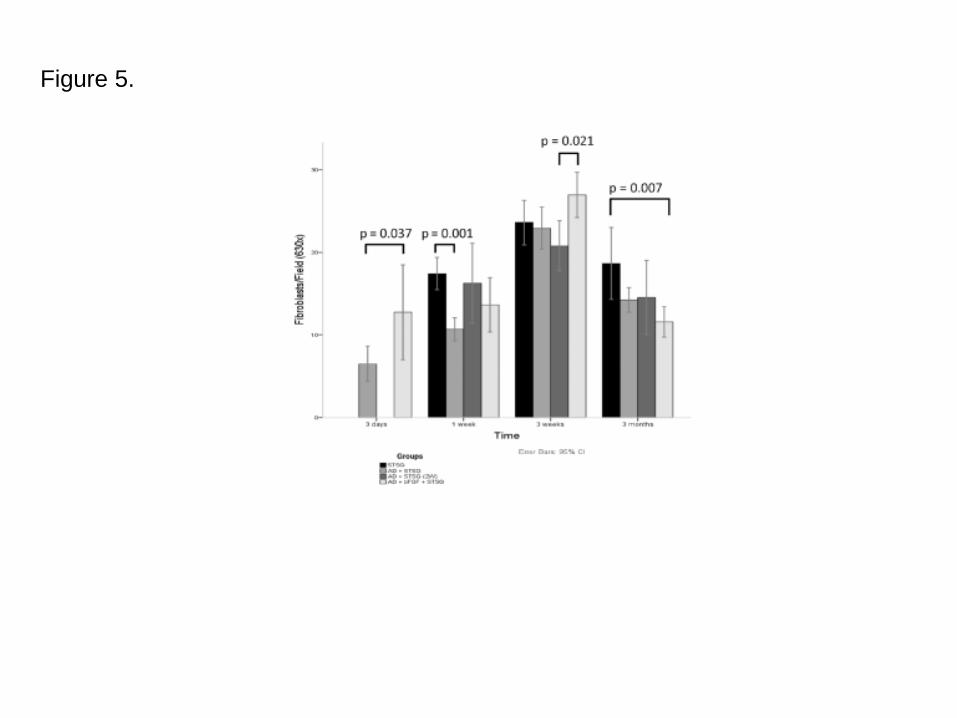
Figure 5.
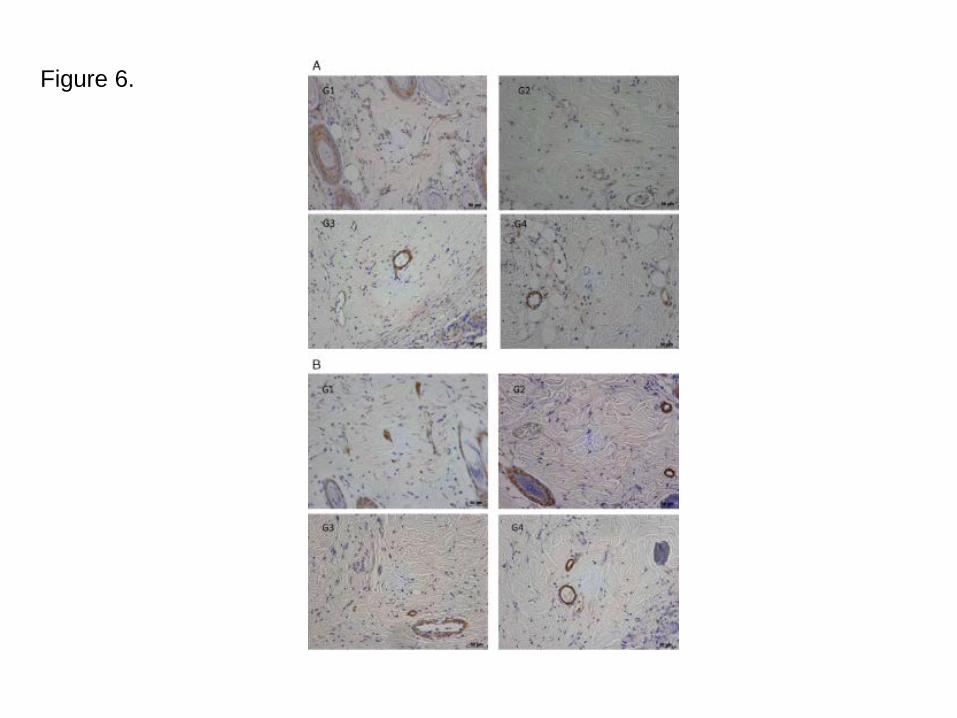
Figure 6.
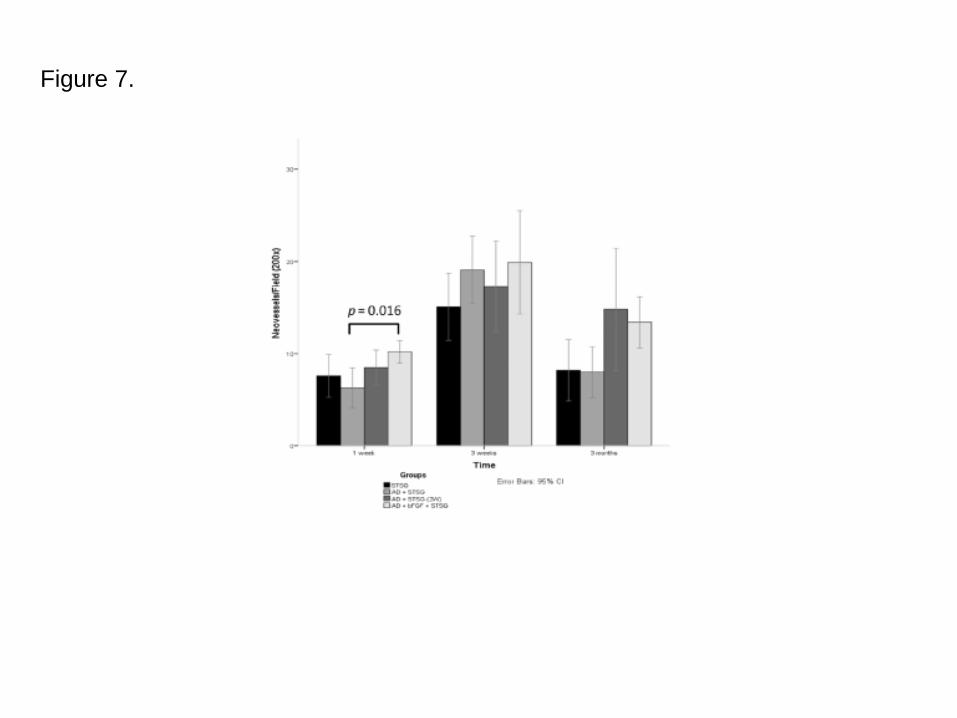
Figure 7.
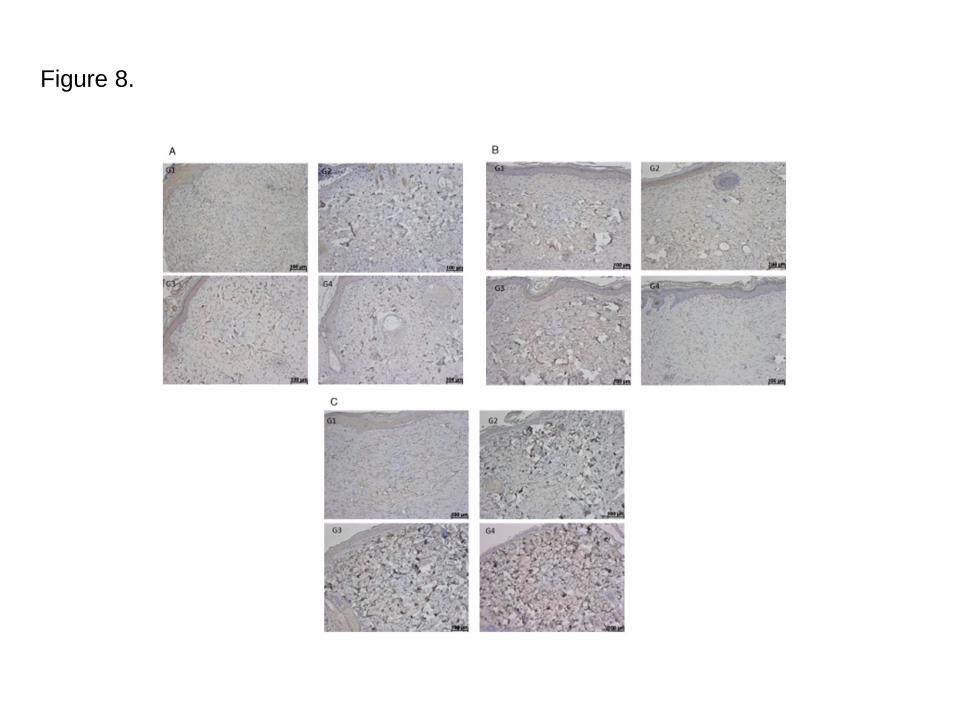
Figure 8.
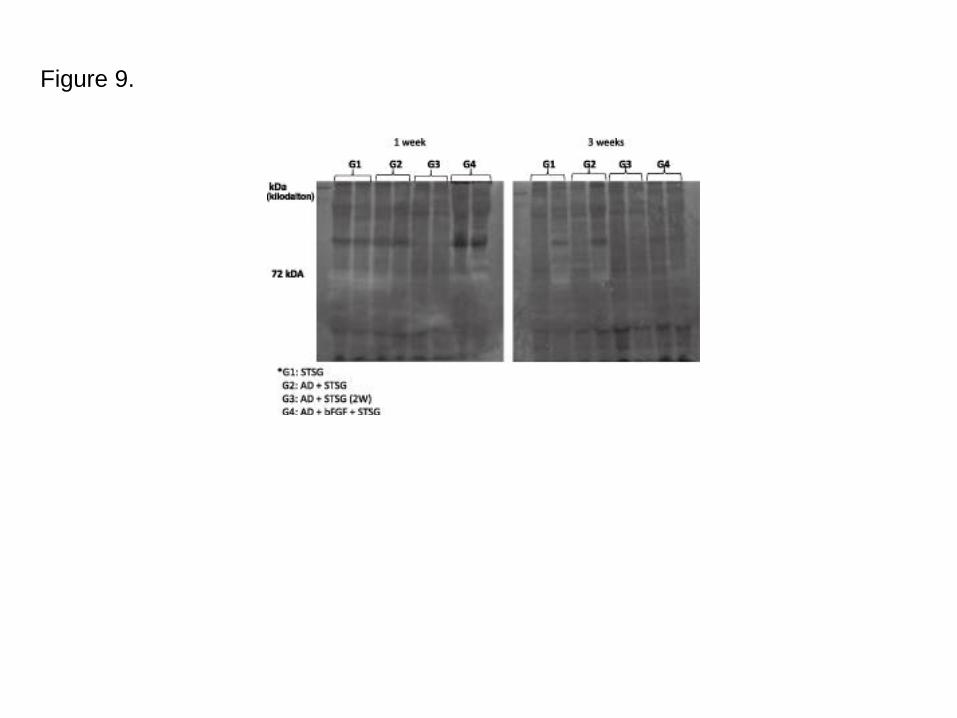
Figure 9.
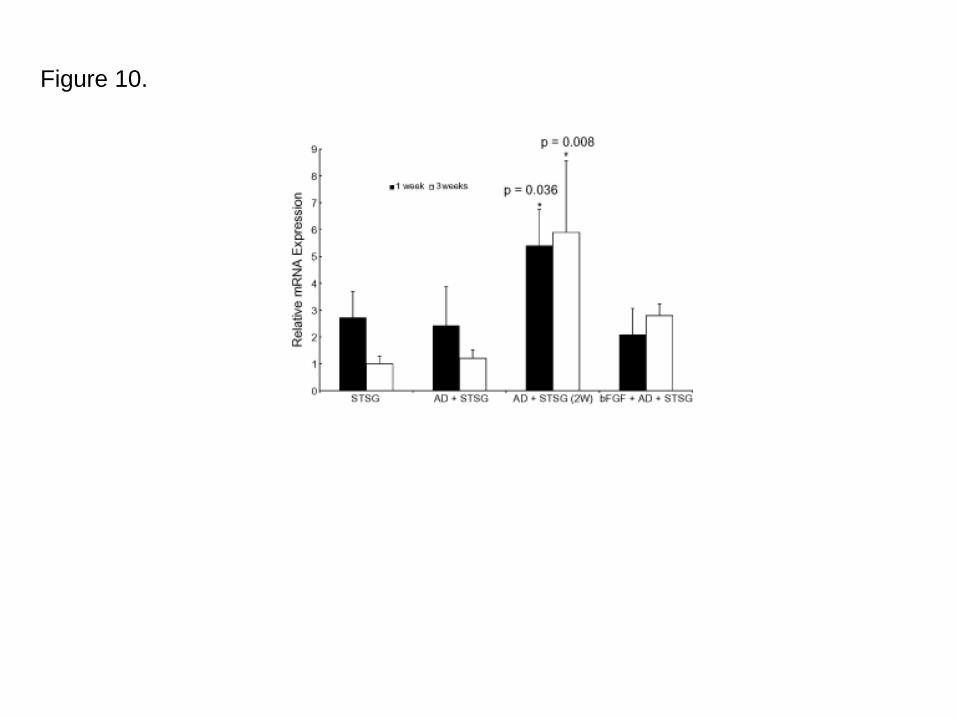
Figure 10.
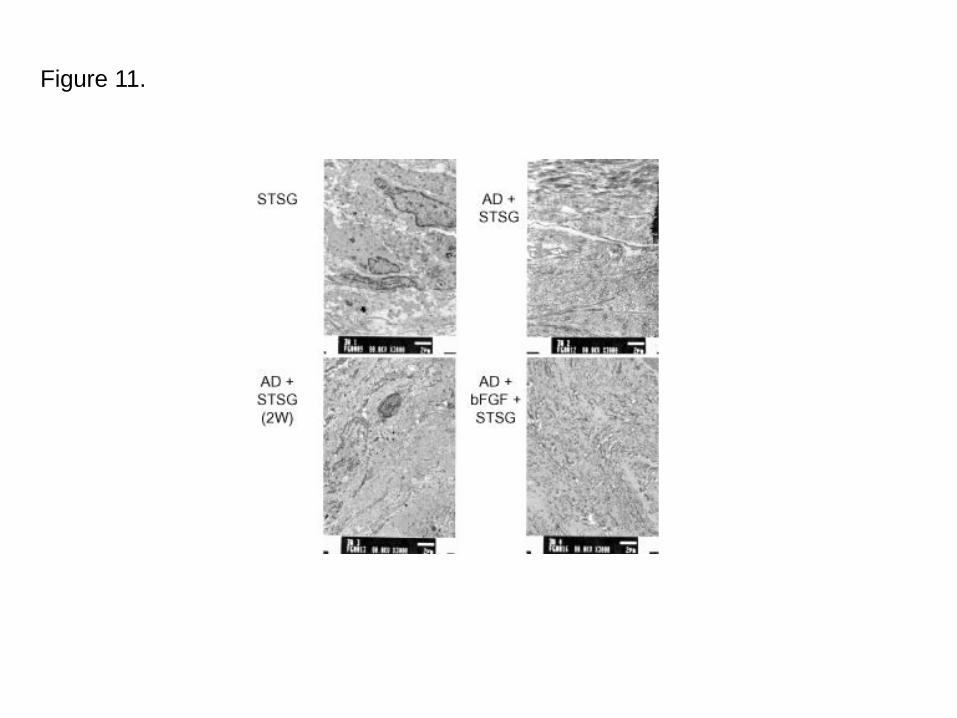
Figure 11.
Group/time 3 days 1 week 2 weeks 3 weeks 3 months
1 x x x x
(STSG) n = 6 n = 6 n = 6
n = 18
2 x x x x x
(AD + STSG) n = 3 n = 6 n = 6 n = 6
n = 21
3 x x x x
(AD + STSG [2W]) n = 6 n = 6 n = 6
n = 18
4 x x x x x
(AD + bFGF + STSG) n = 3 n = 6 n = 6 n = 6
n = 21
Number of specimensper group
18–21 18 18 12 6
Procedures performed -Serial photography (allanimals)
-Serial photographyand graft take rate (allanimals)
-Serial photographyand graft take rate (allanimals)
-Serial photographyand graft take rate (allanimals)
-Serial photography
-Biopsy for histology,fibroblast count
-Biopsy for histology,fibroblast count, IHC,EM, gel zymography,RT-PCR
-Contraction rate -Biopsy for histology,fibroblast count, IHC,EM, gel zymography,RT-PCR
-Graft take rate
-Dermis measurement -Dermis measurement -Dermis measurement -Biopsy for histology,fibroblast count, IHC,EM
-Contraction rate -Cutometer -Dermis measurement
-Cutometer
Table 1. Experimental protocol
AD, artificial dermis; bFGF, basic fibroblast growth factor; EM, electron microscopy; IHC, immunohistochemistry; RT-PCR, real-time reverse transcriptase polymerase chain reaction; STSG, split-thickness skin grafting; STSG [2W], split-thickness skin grafting 2 weeks later.
Group 1 week 3 weeks 3 months
STSG ++ + –
AD + STSG ++ + –
AD + STSG (2W) ++ + –
bFGF + AD + STSG ++ + –
AD, artificial dermis; bFGF, basic fibroblast growth factor; IHC,immunohistochemistry; STSG, split-thickness skin grafting; STSG [2W], split-thickness skin grafting 2 weeks later.
Table 2. F4/80 IHC qualitative analysis for determination of macrophages
+: weakly positive staining.
++: strongly positive staining.
–: negative staining.
Obs: normal control:–.
Time Group Strongly + Weakly + Negative
1 week STSG x
AD + STSG x
AD + STSG (2W) x
AD + bFGF + STSG x
3 weeks STSG x
AD + STSG x
AD + STSG (2W) x
AD + bFGF + STSG x
3 months STSG x
AD + STSG x
AD + STSG (2W) x
AD + bFGF + STSG x
Table 3. MMP-2 IHC analysis
AD, artificial dermis; bFGF, basic fibroblast growth factor; IHC, immunohistochemistry; MMP-2,matrix metalloproteinase-2; STSG, split-thickness skin grafting; STSG [2W], split-thickness skingrafting 2 weeks later.
Group 1 week 3 weeks
++ ++
++ ++
+ +
++ +
Table 4. Gelatin zymography for MMP-2
AD, artificial dermis; bFGF, basic fibroblast growth factor; MMP-2,matrix metalloproteinase-2; STSG, split-thickness skin grafting;STSG [2W], split-thickness skin grafting 2 weeks later.
–, negative.
+, weakly positive.
++, strongly positive.
STSG (G1)
AD + STSG (G2)
AD + STSG (2W) (G3)
AD + bFGF + STSG (G4)


![LEGRABOX BLUMOTION runner40 kg - [Blum Connect]connect.blum.com/files/memos/LEGRABOX BLUMOTION runner_40kg... · Julius Blum GmbH Furniture Fittings Mfg. 6973 Hoechst, Austria | Tel.:](https://img.pdfslide.tips/doc/110x75/5c70c4e109d3f20d2f8bf5bc/legrabox-blumotion-runner40-kg-blum-connect-blumotion-runner40kg-julius.jpg)