Embed Size (px)
Citation preview
1
NASA Renewable Energy
Assessment
Summary for NASA Facilities Engineering
and Real Property Conference
5/11/11
Wayne Thalasinos, HQ FED

2
Agenda
1.0 Background
2.0 Introduction
3.0 Consistency
4.0 RETScreen Software
5.0 Project Metrics
6.0 Site Summaries
7.0 Summary & Ranking
8.0 Path Forward

3
Agenda
1.0 Background
2.0 Introduction
3.0 Consistency
4.0 RETScreen Software
5.0 Project Metrics
6.0 Site Summaries
7.0 Summary & Ranking
8.0 Path Forward
4
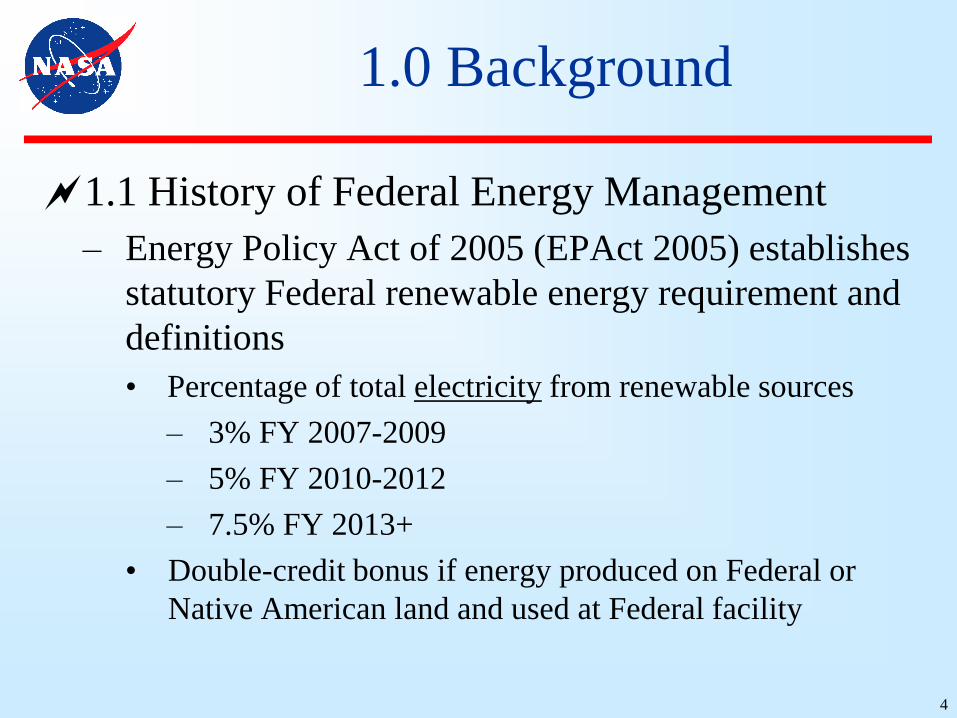
1.0 Background
1.1 History of Federal Energy Management
– Energy Policy Act of 2005 (EPAct 2005) establishes
statutory Federal renewable energy requirement and
definitions
• Percentage of total electricity from renewable sources
– 3% FY 2007-2009
– 5% FY 2010-2012
– 7.5% FY 2013+
• Double-credit bonus if energy produced on Federal or
Native American land and used at Federal facility

5
1.0 Background
1.1 History of Federal Energy Mgmt. (cont’d)
– Executive Order (EO) 13423 expands requirement
• Half of renewable energy to fulfill statutory requirement
must be from new renewable sources built after 1/1/1999
– Thermal renewable energy counts toward new
– Department of Energy (DOE) guidance clarifies
requirement
• http://www1.eere.energy.gov/femp/pdfs/epact05_fedrenew
energyguid.pdf
– White House Office of Management and Budget
monitors compliance via Sustainability/Energy
Scorecard

6
1.0 Background
1.2 Sustainable Approach to Energy
– Less than 1% of world’s annual energy use from
renewable sources
1.3 Renewable Technologies and US Renewable
Development
– Shaded blocks for wide commercial use

7
1.0 Background
1.3 Renewable Technologies and US Renewable
Development (continued)
– Tax-based Federal subsidies vary by technology and
require private ownership (versus Federal)
• Investment Tax Credit (ITC) 30% or 10% of installed cost
• Production Tax Credit $0.02 or 0.01 per KiloWatthour
(KWh) generated
– First 10 years of operation
– May opt for ITC or US Treasury equivalent cash grant
• Accelerated (5-year) depreciation

8
1.0 Background
1.3 Renewable Technologies and US Renewable
Development (continued)
– State subsidies
• Electricity generation Renewable Portfolio Standard (RPS)
creates Renewable Energy Credits (RECs) demand
– “Green” generation attribute, but not energy, of one
MegaWatthour (MWh) electricity
– Sold as commodity to produce additional revenue
– Remaining energy MWh is “brown”
• Rebates and grants
9
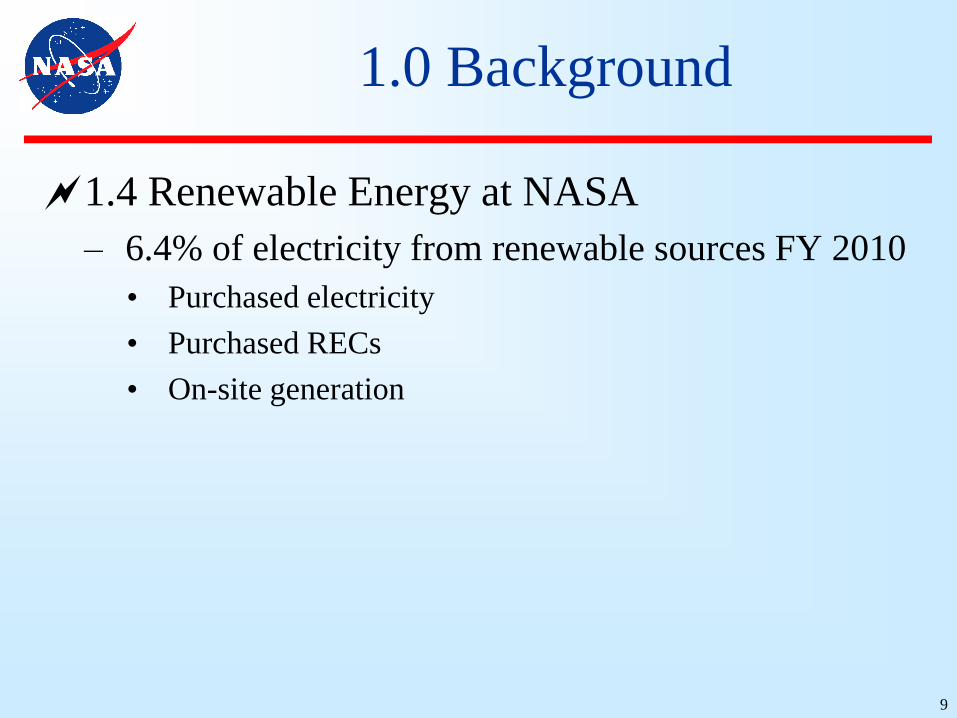
1.0 Background
1.4 Renewable Energy at NASA
– 6.4% of electricity from renewable sources FY 2010
• Purchased electricity
• Purchased RECs
• On-site generation

10
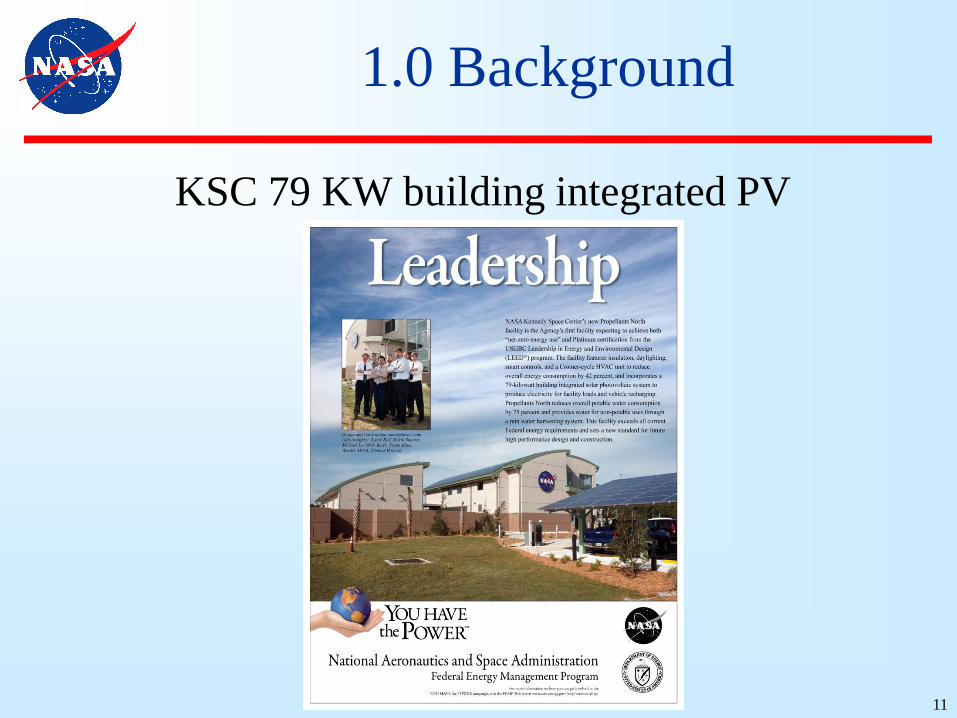
1.0 Background
JPL-GDSCC 4 KW solar photovoltaic (PV)
11
1.0 Background
KSC 79 KW building integrated PV
12
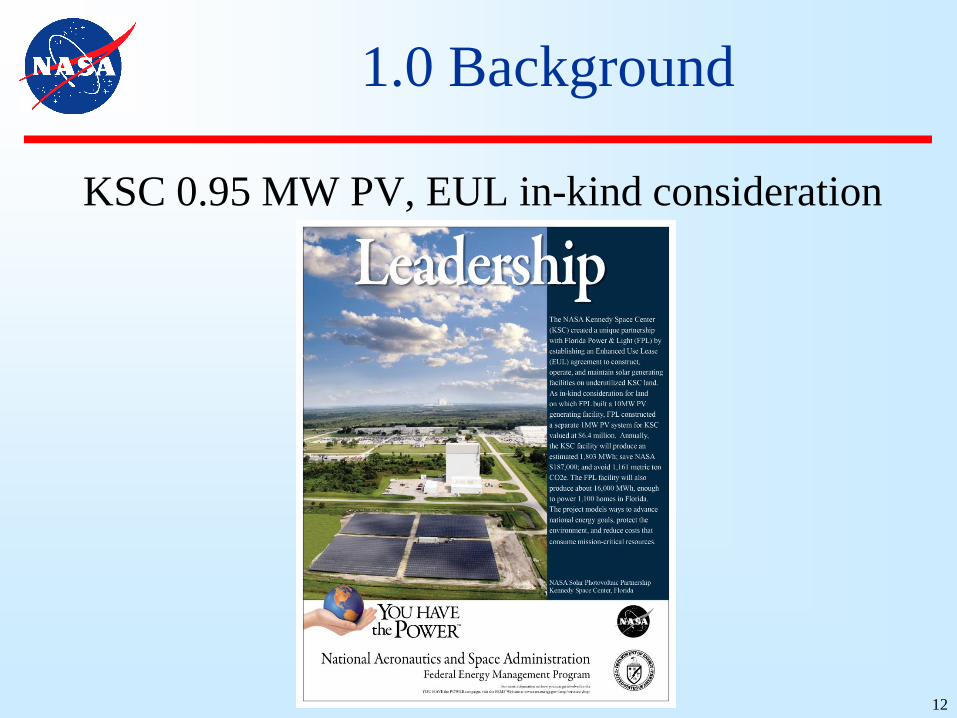
1.0 Background
KSC 0.95 MW PV, EUL in-kind consideration

13
1.0 Background
1.4 Renewable Energy at NASA (continued)
– Also using renewable energy that does not “count”
• Purchased waste-to-steam
• Purchased landfill gas (LFG) for steam
• Solar thermal water heating
• Wind mechanical
• Daylighting

14
1.0 Background
GSFC LFG

15
1.0 Background
JSC 213 MBtu/yr solar thermal water heating

16
1.0 Background
JSC-WSTF sewage lagoon aerators

17
1.0 Background
JSC daylighting

18
1.0 Background
1.5 Advancing Clean and Renewable Energy at
NASA
– All NASA sites have one or more renewable
resources that could be developed for energy
– Recommend policy change because practically
developable resources unequally distributed
• Agency renewable goals should not be driven to sites
• Direct attention to identifying and developing best projects
with economic viability and clear path forward

19
1.0 Background
1.5 Advancing Clean and Renewable Energy at
NASA (continued)
– Financial barriers
• NASA Enhanced Use Lease authority lacks in-kind
consideration
• Challenging to obtain Federal tax incentives
• Federal agencies must replace sold RECs in order to
“count” toward Federal renewable energy requirement
– REC swap

20
Agenda
1.0 Background
2.0 Introduction
3.0 Consistency
4.0 RETScreen Software
5.0 Project Metrics
6.0 Site Summaries
7.0 Summary & Ranking
8.0 Path Forward

21
2.0 Introduction
2.1 Reason for the Project
– Need approach to prioritizing investment and
leveraging potential funding mechanisms
• Agency-wide assessment that seeks to identify financially
viable renewable projects
• Prefeasibility screening with consistent comparison
• Address financial tools to capture incentives

22
2.0 Introduction
2.2 Guidance for Developing Project Approach
– Identify most economically viable projects
– Projects must have viable path to implementation
– Employ only proven commercialized technologies
– Consider each technology at each site; analyze 1 to 2
projects with economic viability per site
– Apply metrics consistently
– Consider all scales of projects including utility-scale
– Consider opportunities for development on satellite
facilities and/or in collaboration with other agencies
– Consider potential projects already in review

23
2.0 Introduction
2.3 Technologies for Evaluation (14)
– Wind turbines for electrical generation
– Wind-driven mechanical power
– Solar PV electrical generation
– Ground source heat pumps (GSHP)
– Biomass thermal
– Combined heat & power (CHP) with renewable fuel
– LFG
– Waste to energy

24
2.0 Introduction
2.3 Technologies for Evaluation (continued)
– Solar thermal water heating
– Concentrating solar electrical generation
– Biodigester gas
– Low-impact hydro-electric generation
– Geothermal electrical generation
– Solar thermal air heating
25
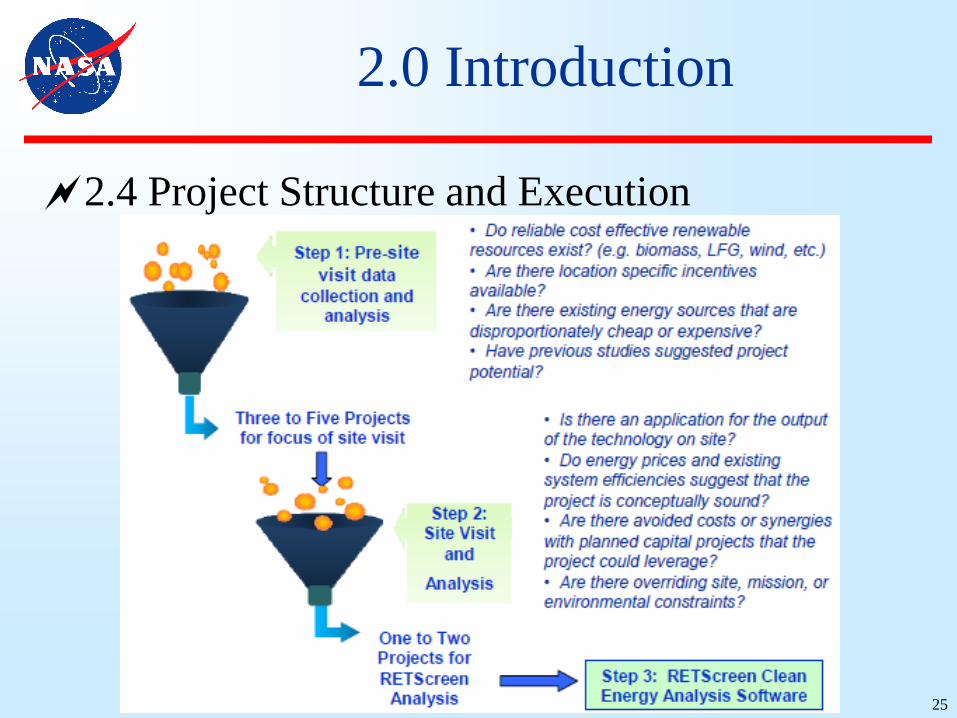
2.0 Introduction
2.4 Project Structure and Execution
26
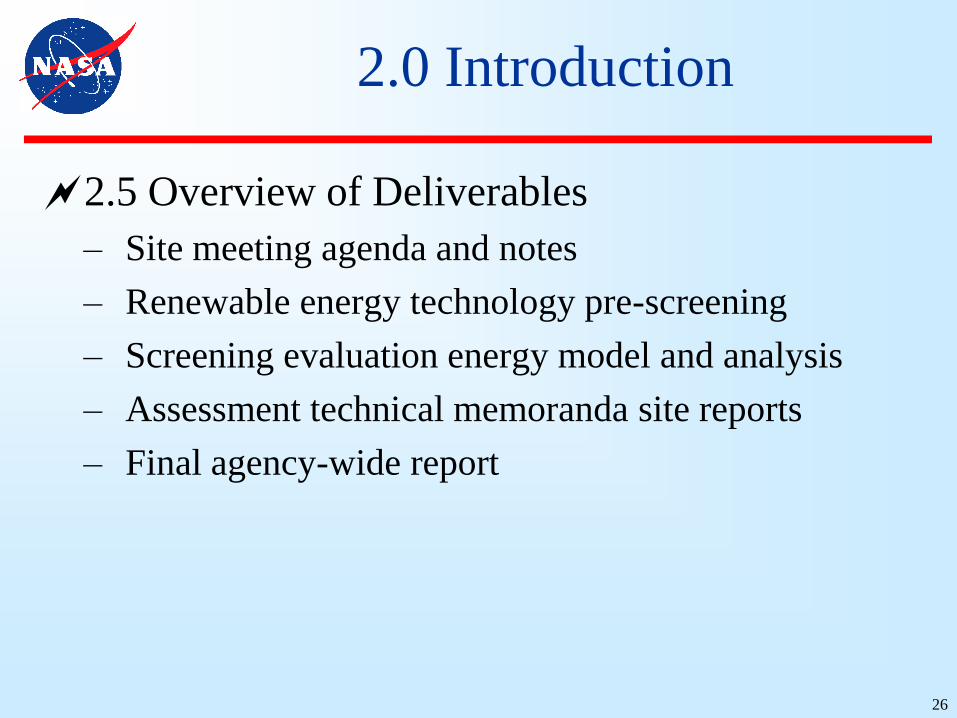
2.0 Introduction
2.5 Overview of Deliverables
– Site meeting agenda and notes
– Renewable energy technology pre-screening
– Screening evaluation energy model and analysis
– Assessment technical memoranda site reports
– Final agency-wide report

27
Agenda
1.0 Background
2.0 Introduction
3.0 Consistency
4.0 RETScreen Software
5.0 Project Metrics
6.0 Site Summaries
7.0 Summary & Ranking
8.0 Path Forward

28
3.0 Consistency
3.0 Consistency of Assessments
3.1 Overview
– Documented approach, methods, and adjustments
3.2 Alternative to the Proposed Project:
Avoided Costs
– Compared renewable project to status quo or
required capital project

29
3.0 Consistency
3.3 Life Cycle Costing and Timing of Projects
– Expenditures and revenues brought to present value
– Simplified costing and discounting for prefeasibility
– Used nominal discount rate in 10 CFR 436
– Energy prices started with 2008 and assumed
escalation rate unless better site data available
– Implementation costs inflated to June 2009
– Labor costs adjusted by region

30
3.0 Consistency
3.4 Project Configuration and Ownership
– “Behind the meter” (energy used on-site) project’s
electricity valued at cost of avoided retail purchase
– Utility-scale development project’s electricity valued
at wholesale value of generation in grid region
– Typically assumed electricity projects as Power
Purchase Agreement (PPA)
• Private investor provides capital, owns system, sells
electricity to host site per agreed price schedule, and
realizes tax benefits and REC revenue
– Assumed non-electricity projects NASA owned

31
3.0 Consistency
3.5 Renewable Energy Produced from Projects
– For comparing electric/thermal/mechanical,
converted electric into source energy using DOE
national factor 11.85 MMBtu/MWh
• Thermal equivalent of energy required to generate grid
electricity
– Assessment considered GSHP gross heating and
cooling as renewable
• Too generous
• Not consistent with DOE reporting instructions email of
incremental improvement versus 13 SEER air-to-air heat
pump (see Section 5.1)

32
Agenda
1.0 Background
2.0 Introduction
3.0 Consistency
4.0 RETScreen Software
5.0 Project Metrics
6.0 Site Summaries
7.0 Summary & Ranking
8.0 Path Forward
33
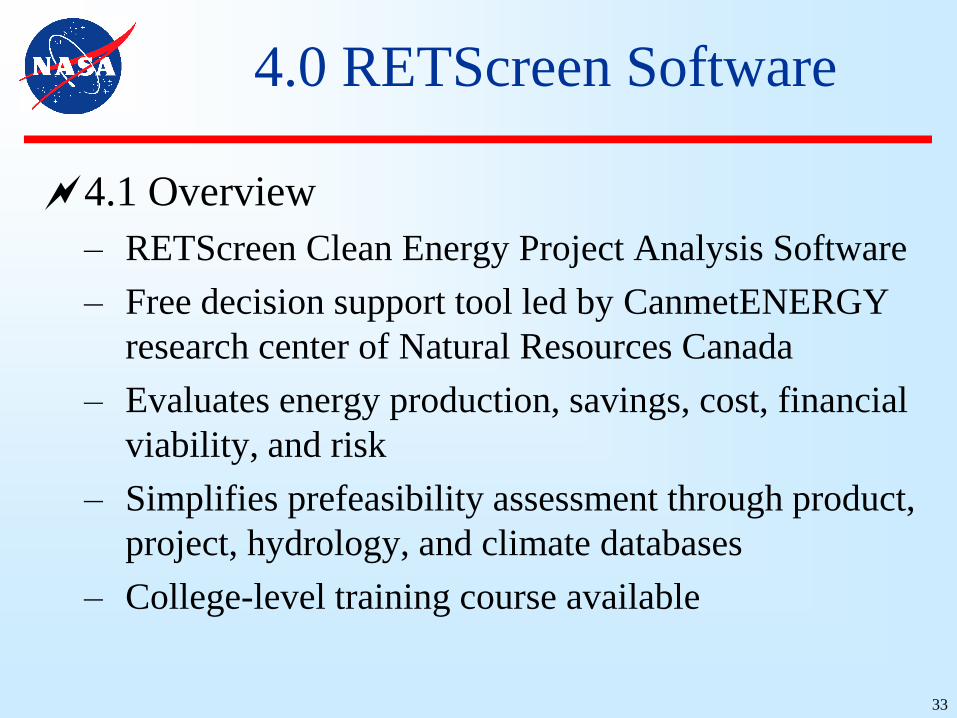
4.0 RETScreen Software
4.1 Overview
– RETScreen Clean Energy Project Analysis Software
– Free decision support tool led by CanmetENERGY
research center of Natural Resources Canada
– Evaluates energy production, savings, cost, financial
viability, and risk
– Simplifies prefeasibility assessment through product,
project, hydrology, and climate databases
– College-level training course available

34
4.0 RETScreen Software
4.1 Overview (continued)
– Microsoft Excel-based worksheets
• Input
– Start: Defines project type and location
– Load & Network: Electricity usage and cost
– Energy Model: Renewable technology details and
energy it displaces
– Cost Analysis: Capital and operation & maintenance
(O&M)
• Output
– Financial Analysis
– Risk Analysis

35
4.0 RETScreen Software
4.2 Cost Analysis
– Used Method 1 simplified approach
– Can reevaluate with Method 2 detailed costing
– Costs and credits categories:
• Initial capital feasibility through installation
• O&M including energy from Energy Model worksheet
• Periodic costs and credits
– Used equipment characteristics and costs from
RETScreen Product Database and RETScreen Online
User Manual unless better site data available
– Example worksheet in Appendix D-1

36
4.0 RETScreen Software

37
4.0 RETScreen Software
4.3 Financial Analysis
– Models financial performance
– Input financial variables
• Used nominal discount rate 4.9% in 10 CFR 436
• Assumed 3% energy escalation rate unless better site data
• Project life based on life of most costly component
• Incentives and revenue streams
– Grants
– Tax credits
– Rebates
– REC revenue

38
4.0 RETScreen Software
4.3 Financial Analysis (continued)
– Outputs cash flows and financial measures
• Net present value (NPV): estimated lifetime worth of
annual net cash flows discounted to current dollars
• Internal rate of return (IRR): interest rate that project
returns (calculated by producing zero NPV)
• Payback period: number of years necessary for savings to
recover initial investment
• Benefit-to-cost ratio: present value of net cash flows
divided by present value of initial cost
– Example worksheet in Appendix D-2

39
4.0 RETScreen Software

40
4.0 RETScreen Software
4.4 Risk Analysis
– Sensitivity Analysis
• Varied inputs within sensitivity range +/- 20 & 40%
– Costs: Capital, fuel
– Incentive revenue
• Calculates impact to financial indicators
– IRR
– Payback
– NPV
• Recommend leverage tool capability to compare scenarios
• Example worksheet in Appendix D-3

41
4.0 RETScreen Software

42
4.0 RETScreen Software
4.5 Using RETScreen to Evaluate Alternatives
– Valuable capability to change variable, recalculate
financial results, and save alternate scenario
• System costs
• System capacity
• Incentives
• Project life

43
Agenda
1.0 Background
2.0 Introduction
3.0 Consistency
4.0 RETScreen Software
5.0 Project Metrics
6.0 Site Summaries
7.0 Summary & Ranking
8.0 Path Forward
44
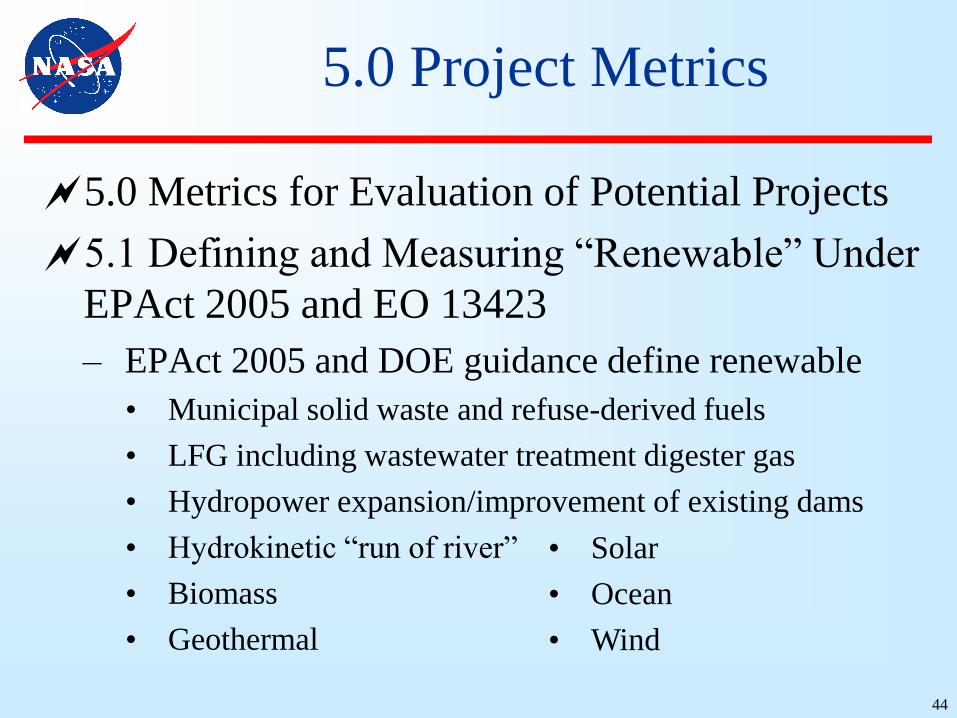
5.0 Project Metrics
5.0 Metrics for Evaluation of Potential Projects
5.1 Defining and Measuring “Renewable” Under
EPAct 2005 and EO 13423
– EPAct 2005 and DOE guidance define renewable
• Municipal solid waste and refuse-derived fuels
• LFG including wastewater treatment digester gas
• Hydropower expansion/improvement of existing dams
• Hydrokinetic “run of river”
• Biomass
• Geothermal
• Solar
• Ocean
• Wind

45
5.0 Project Metrics
5.2 Credit Toward EPAct Goals
– Based on electricity or non-electricity producing
Credit Score Site Reports Agency Report
Credit Credit
Needs REC swap did not use
No credit No credit

46
5.0 Project Metrics
5.3 Renewable Energy Contribution
– Based on energy production amount
Contribution
Score
Site Reports
relative to site
Agency Report
relative to agency
Large ≥ 5% ≥ 1%
Medium ≥ 1%, < 5% ≥ 0.01%, < 1%
Small < 1% < 0.01%
47
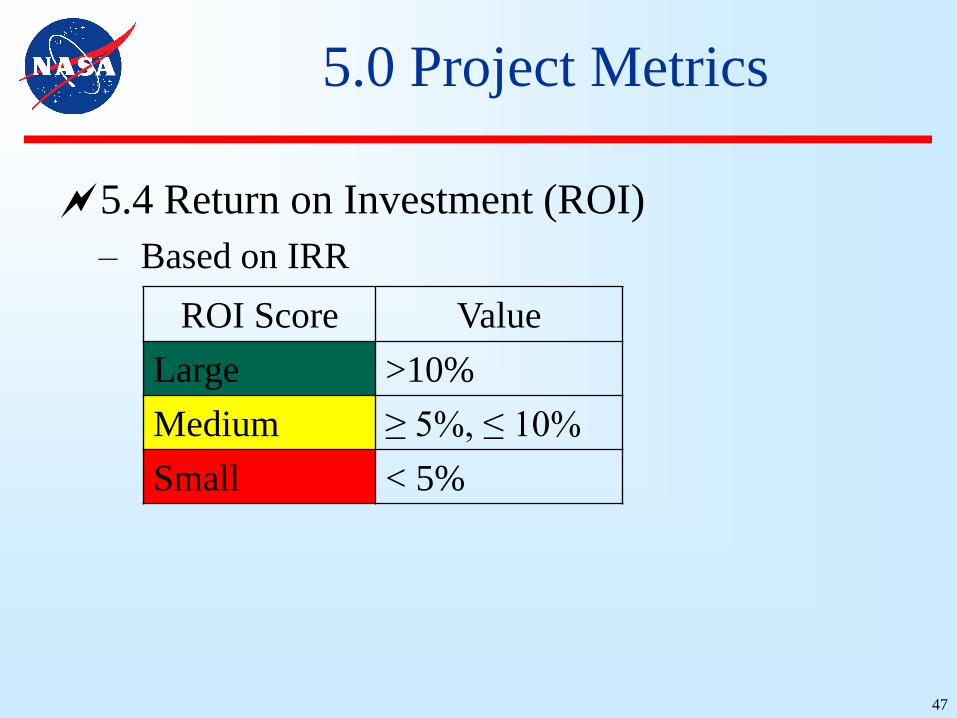
5.0 Project Metrics
5.4 Return on Investment (ROI)
– Based on IRR
ROI Score Value
Large >10%
Medium ≥ 5%, ≤ 10%
Small < 5%

48
5.0 Project Metrics
5.5 Clear Path Forward
– Based on time period for capital recovery and
barriers to implementation
• Permitting, technology, resource, mission
Path Score Time Period Barriers
Clear, 1 Directly fundable, or
finance ≤ 10 years
No significant
issues
Intermediate, 2 Finance > 10 years
and < 25 years
Issues to resolve
At Risk, 3 Finance ≥ 25 years Major issues or air
permit new source

49
Agenda
1.0 Background
2.0 Introduction
3.0 Consistency
4.0 RETScreen Software
5.0 Project Metrics
6.0 Site Summaries
7.0 Summary & Ranking
8.0 Path Forward
50
6.0 Site Summaries
6.0 Individual Site Summaries
– Types of projects
• Electricity producing
– Dependent on incentives to compete with grid
» Exception: GSFC LFG CHP
– Financial performance typically improves with scale
– Modeled PV as 1 MW PPA
• Thermal
– Scale typically limited specific to niche application
– Too small to access incentives
– Lower capital and risk
51
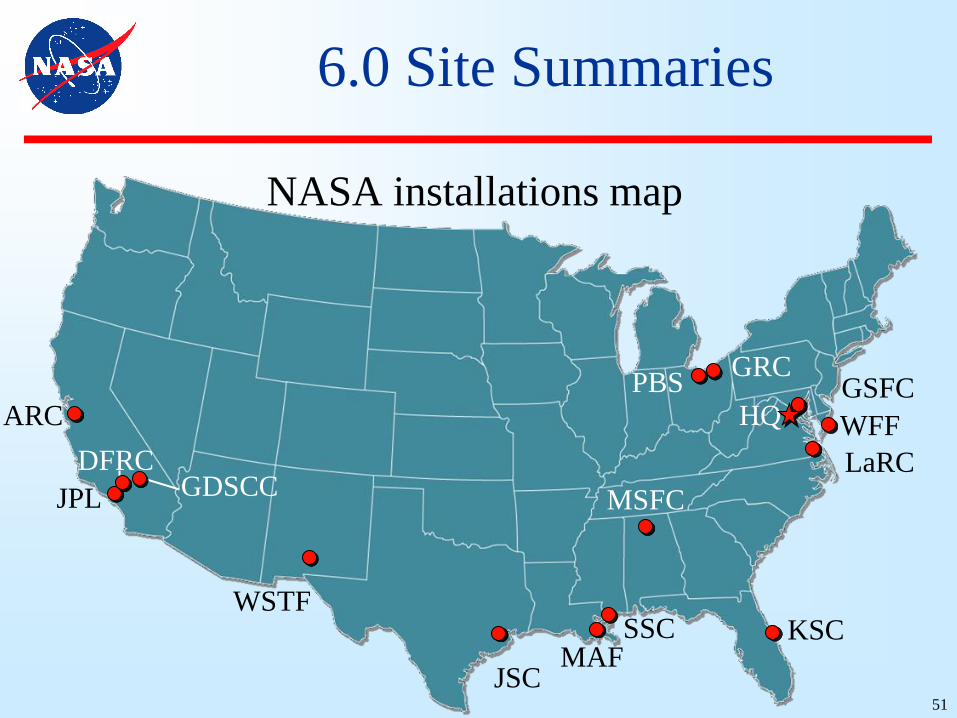
6.0 Site Summaries
NASA installations map
ARC
JPL
DFRC
JSC
SSC KSC
MSFC
LaRC
HQGSFC
GRCPBS
MAF
WFF
WSTF
GDSCC

52
6.0 Site Summaries
6.1 GSFC-GB
– GSHP not cost-effective alternative for steam line
replacement in particular case evaluated
– CHP with natural gas and cheap LFG blend
economically viable without private ownership
• Recommend consider PPA or Design-Build-Own Operate-
Maintain (DBOOM) to leverage ITC & rapid depreciation
6.2 JSC
– Solar thermal water heating at Sonny Carter Training
Facility largest & best economics of solar thermal
• Recommend validate capital and consider DBOOM/PPA

53
6.0 Site Summaries
6.3 MSFC
– Waste-to-steam price unlikely to drop enough to
support expanding use of steam
• Recommend determine maximum steam price that would
enable economic micro steam turbine, then explore
potential for procurement at that price
– PV lighting off-grid avoids high trenching costs
• Recommend validate costs
6.4 KSC
– Solar thermal water heating marginal ROI
– PV PPA potential
54
6.0 Site Summaries
6.5 LaRC
– GSHP viable in new construction/major renovation
• Recommend evaluate gas furnaces and air conditioners
– Waste-to-steam electricity project uncertain to
compete with cheap grid electricity
• Recommend consider exploring alternate waste disposal
options with county to determine impacts on economics
– For PV, recommend monitor state regulations in case
voluntary RPS becomes requirement
6.6 MSFC-MAF
– Solar thermal water heating not economical
55
6.0 Site Summaries
6.7 GSFC-WFF
– Two wind turbines unlikely to recover cost
– GSHP near harsh beach conditions weak economics
but improves reliability
– For PV, recommend monitor state regulations in case
voluntary RPS becomes requirement
6.8 SSC
– Recommend evaluate feasibility of recovering and
reusing $1.5 M/year waste hydrogen
– Third best solar thermal water heating economics in
assessment

56
6.0 Site Summaries
6.9 DFRC
– At Edwards Air Force Base, solar thermal air heating
project reasonable economics
– At Palmdale, PV PPA potential
6.10 JPL
– Solar thermal water heating weak economics
– PV PPA potential, but higher than average installed
cost due to small systems on multiple roofs
6.11 JPL-GDSCC
– PV PPA potential

57
6.0 Site Summaries
6.12 GRC
– Solar thermal air heating weak economics but low
risk
6.13 JSC-WSTF
– Power export constraints preclude utility scale
– Second best solar thermal water heating economics
in assessment
– PV PPA potential

58
6.0 Site Summaries
6.14 GRC-PBS
– Wind resource DOE lab estimate appears utility-scale
developable; not yet proven by meteorological study
– For PV, recommend monitor state solar REC market
in case value supports PV project
6.15 ARC
– Solar thermal water heating not cost effective

59
Agenda
1.0 Background
2.0 Introduction
3.0 Consistency
4.0 RETScreen Software
5.0 Project Metrics
6.0 Site Summaries
7.0 Summary & Ranking
8.0 Path Forward
60
7.0 Summary & Ranking
7.1 Ranking by Metrics
– Figures of electricity producing and non-electricity
producing renewable energy contribution

61
7.0 Summary & Ranking
7.1 Ranking by Metrics (continued)

62
7.0 Summary & Ranking

63
7.0 Summary & Ranking
7.1 Ranking by Metrics (continued)
– Rank order determined for each metric; lowest best
– Summed rank order for overall ranking; lowest best
– Table of rank order by metrics

64
7.0 Summary & Ranking

65
7.0 Summary & Ranking
7.2 Project Financial Performance Relative to
Renewable Energy Production and Project Scale
– Table of financial indicators by project
– Figure of financial performance, production, and
capital investment

66
7.0 Summary & Ranking

67
7.0 Summary & Ranking
capital: < $100K, $100K to $1.5M, > $1.5M

68
7.0 Summary & Ranking
7.3 Projects Contributing to EPAct Goals
– 7 potential projects using 3 electricity technologies

69
7.0 Summary & Ranking
7.3 Projects Contributing to EPAct Goals (cont’d)
– Key factors
• Wind
– PTC
– Quality of wind resource
– Scale (1 to 4 turbines virtually impossible economics)
» Large land area
» Access for heavy equipment
» Ability to export power
» Away from radar

70
7.0 Summary & Ranking
7.3 Projects Contributing to EPAct Goals
– Key factors (continued)
• PV entirely incentive dependent; evaluated in states with
existing or emerging REC market
• CHP with biofuel
– Central steam plant
– Substantial year-round requirement for thermal energy
that coincides with electrical energy requirements
– “Spark spread”: biofuel cost low compared to electricity
» Electric rates below $0.07 should not be considered
• Waste to energy depends on collaboration for supply
71
7.0 Summary & Ranking
7.3 Projects Contributing to EPAct Goals
– Key factors (continued)
• Concentrating solar thermal electricity
– Solar resource
– Land
– Ability to export power
• Micro hydro
– Water resource with substantial perennial flow plus
significant head pressure
• Geothermal electricity
– High-quality geothermal resource
– Ability to export power
72
7.0 Summary & Ranking
7.4 Discussion
– Recommend drop bottom 5 projects
• Do not produce renewable electricity
• Very small and/or negative ROI
• Not NASA’s best opportunities
– Remaining 15 fall into groups
• Large, more certainty
• Large, less certainty
• Small to medium, more certainty

73
7.0 Summary & Ranking
7.4 Discussion (continued)
– Recommend GSFC CHP stands out with strong
financials and dispatchable power
– Recommend focus PV where NASA purchases grid
electricity directly from utility; consider bundling

74
7.0 Summary & Ranking
7.4 Discussion (continued)
– JSC solar thermal water heating best economics in
group but vulnerable to capital costs

75
Agenda
1.0 Background
2.0 Introduction
3.0 Consistency
4.0 RETScreen Software
5.0 Project Metrics
6.0 Site Summaries
7.0 Summary & Ranking
8.0 Path Forward

76
8.0 Path Forward
8.0 Path Forward
– Recommend institutionalizing process for project
identification, development, and execution to
implement best projects in most efficient and least-
cost manner
• Validate resource and characterize project
– Location and land area available for development
– Maximum potential energy production
– Constraints on utilization of energy (i.e. uses for
thermal or mechanical energy)
– Expected energy production and order of magnitude
cost

77
8.0 Path Forward
8.0 Path Forward
– Recommend institutionalizing process…(continued)
• Follow likely pathway based on capital and production
– Tier I: Small to medium thermal or mechanical projects
or “demonstration scale” electrical projects
» Goal: Validate economics to justify appropriated
funds
» Too small to attract third-party project owners
seeking to capture tax benefits for renewables
» Likely traditional development and funding through
appropriations, UESC/ESPC, or EUL

78
8.0 Path Forward
8.0 Path Forward
– Follow likely pathway…(continued)
– Tier II: Behind the meter renewable electric projects or
large-scale thermal projects
» Goal: Validate economics to attract private
developers and negotiate favorably
» Ownership by taxable entity essential to leverage
significant tax benefits; PV PPA, non-PV DBOOM
» NASA’s best opportunities because standalone basis,
no NASA capital, and major goal contributions
» Rule: Payback <5 years to obtain private equity
» Key: Resolve procurement constraints

79
8.0 Path Forward
8.0 Path Forward
– Follow likely pathway…(continued)
– For Tier I and II, validating economics includes
developing data:
» Site energy usage
» Forward energy costs
» State net metering rules
» Project specific incentives
» More refined estimate of capital cost

80
8.0 Path Forward
8.0 Path Forward
– Follow likely pathway…(continued)
– Tier III: Utility-scale electric projects that enable
Independent Power Producer to export power to grid
» Goal: At least possible cost to NASA, garner
interest from developers to continue project
development process with private equity
» Determine road access and power export constraints;
rule: transmission within 5 miles of site
» Large capital investment dictates expensive
feasibility diligence; understand minimum
prefeasibility diligence required from NASA to
obtain capital commitment

81
8.0 Path Forward

82
8.0 Path Forward
8.1 Approaches to Implementation for Type I
Projects

83
8.0 Path Forward
81. Approaches…for Type I Projects (cont’d)
– Recommend incorporate in construction/renovation
8.2 Type II Project Implementation: Behind
the Meter
– PPA most common financing structure
• Typically 15 years contract length
– Presenter’s note: challenging for Federal sites to
exceed 10 years
• DOE info
– http://www1.eere.energy.gov/femp/financing/power_
purchase_agreements.html

84
8.0 Path Forward
8.3 Type III Renewable Projects: Utility Scale
– Recommend negotiate compensation considering
EPAct 2005
• Electricity and RECs could allow EPAct credit with bonus
– Presenter’s note: Restoring EUL in-kind consideration
appears key
85
8.0 Path Forward
8.4 Meeting EPAct Goals
– Meeting energy intensity requirement decreases
amount of renewable energy needed for compliance
• Illustrated by two figures

86
8.0 Path Forward

87
8.0 Path Forward

88
8.0 Path Forward
8.4 Meeting EPAct Goals (continued)
– Exploring solutions mix to meet renewable goal

89
8.0 Path Forward
8.5 Institutional Barriers
– Goals currently pushed out to site level; lack formal
agency-wide approach
– Site energy managers often lack technical and
financial know-how to screen renewable potential
– Lack systematic approach to project development
– Need Agency guidance for navigating Federal
acquisition regulations on financing approaches
– Need standardized approach for evaluating project
financial performance in order to direct effort to most
promising opportunities

90
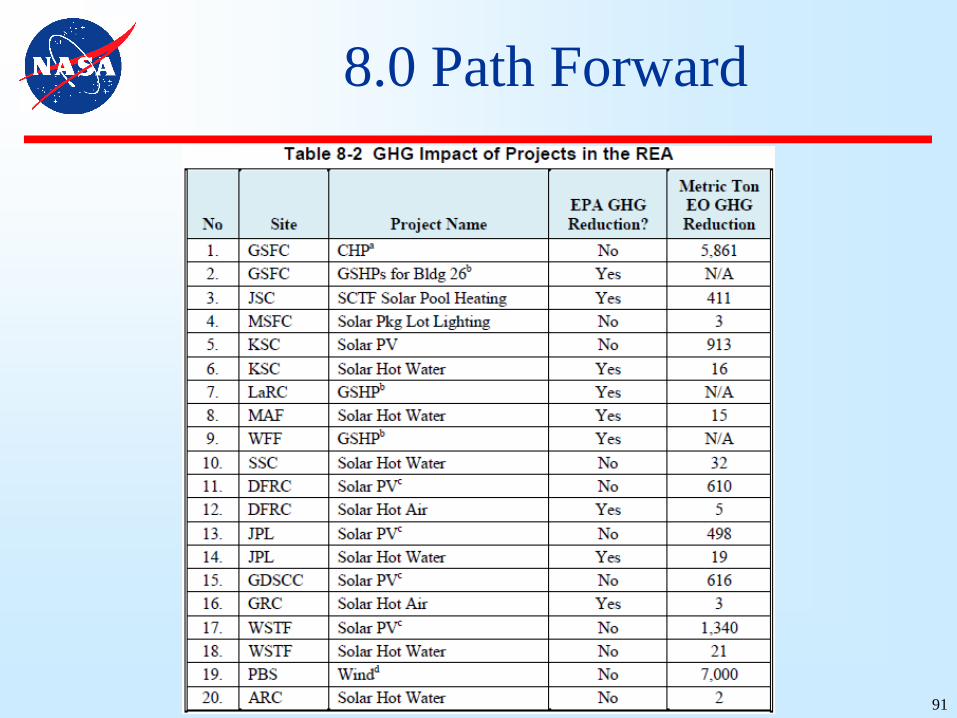
8.0 Path Forward
8.6 The GHG Reporting Rule and EO 13514
– Renewable energy projects contribute to meeting
greenhouse gas (GHG) emission reduction
requirements
• Different impact for Environmental Protection Agency
GHG Reporting Rule versus EO 13514
• Table of impacts by project
91
8.0 Path Forward