Embed Size (px)
Citation preview

2017 NASS RIVER SALMON STOCK ASSESSMENT UPDATE – MONDAY, 19 JUNE
The following is the first general public update for 2017 of Nass River salmon and summer‐run steelhead stock assessments from the Nisga’a Lisims Government Fisheries and Wildlife Department. All data presented in this update are preliminary and subject to change with further assessment information that becomes available and should be interpreted cautiously. For in‐season assessment purposes only. NASS RIVER ASSESSMENT OPERATIONS UPDATE OPERATIONAL ASSESSMENT INFORMATION FOR 2017
1. Fishwheel Assessment data: 31 May to 18 June (see below) 2. Meziadin Fishway data: Operation will begin on 1 July 3. Kwinageese Weir data: Operation will begin in mid‐July GITWINKSIHLKW (GW) FISHWHEELS (NASS TEST FISHERY –STARTED IN 1994 [24th year]):
The Nass River test fishery fishwheels began operation on 31 May for tagging and historical catch index assessments for salmon and summer‐run steelhead. All fish caught in the GW fishwheels to date were released alive after tagging and/or counting. Fishwheels 1 and 2 are currently operating at 0.9 m lower than average water levels (2.3 m vs. 3.2 m) based on 1994–2016 operations after operating at high water levels, peaking at just under 6 m (4000 m3/s). A chart of the water levels at the test fishery follows the text summary that compares current levels to historical levels. The Nass River water temperature is 0.2 °C above average (8.6°C vs. 8.4°C) based on the 1994–2016 operations. GREASE HARBOUR (GH) FISHWHEELS:
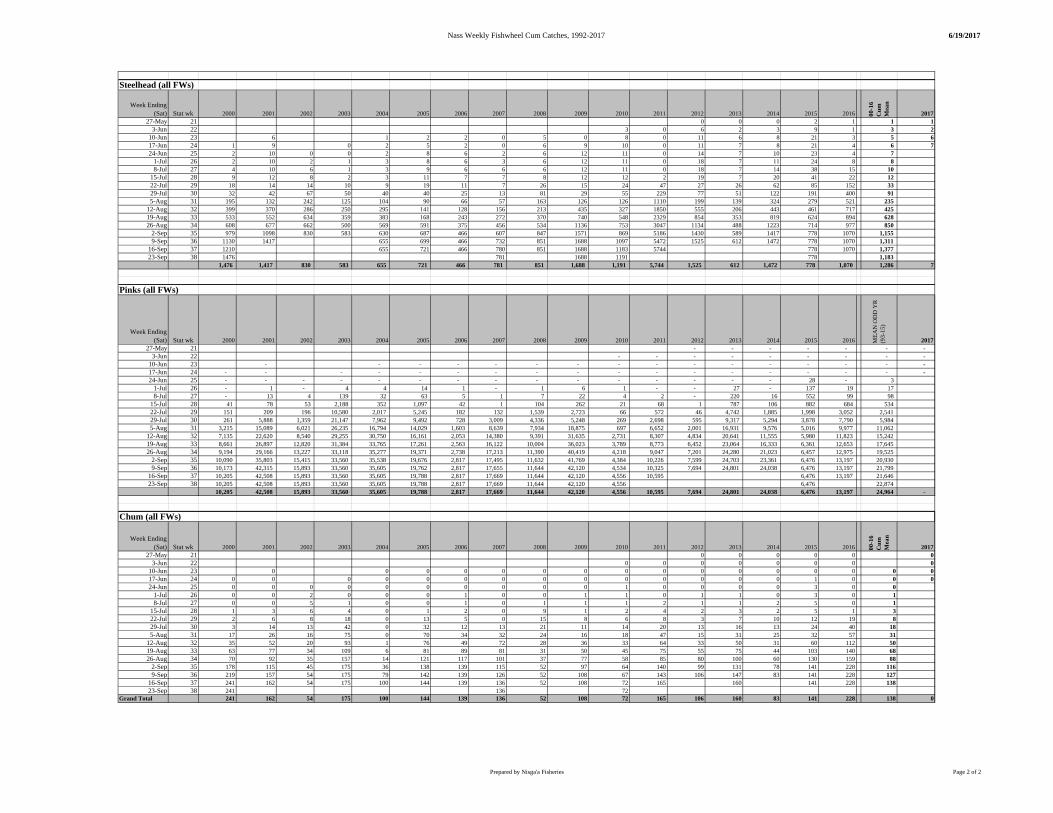
Start‐up dates of the GH fishwheels were 6 June (FW3 and FW6), 7 June (FW5), and 15 June (FW4). Four fishwheels are currently operating at Grease Harbour (upstream of Ts'im Anwiihlist). The GH fishwheels are used for in‐season mark‐recapture tag recoveries, abundance estimates passing upstream, additional tagging (adult Chinook and Chum salmon, and Pacific Lamprey), and for selective harvesting when permitted by NLG. Of the 133 Sockeye caught at all fishwheels to date, all have been released. The Nass fishwheel catches are currently below average for Sockeye and Chinook, about average for steelhead, and above average for Pacific Lamprey. Weekly comparisons of salmon and steelhead catches at the Gitwinksihlkw and all fishwheels to historical levels since 1994 follow the text summary as well as a catch summary of all fish species. Total fishwheel catches of salmon, steelhead, and Pacific Lamprey to date are shown below including tagging results and jacks caught.

Nisga’aFisheriesWeeklyUpdate–19June2017Page2
Other adult species and juvenile salmon catches at the fishwheels to date include: 17 Rainbow Trout, 6 Dolly Varden, 6 Whitefish sp., 4 Pike Minnow, 2 Cutthroat Trout, 1 Peamouth Chub, 1 Sucker, and 20 salmon smolts (10 Coho and 10 Chinook). RUN SIZE AND ESCAPEMENT ESTIMATES FOR NASS SALMON & SUMMER‐RUN STEELHEAD
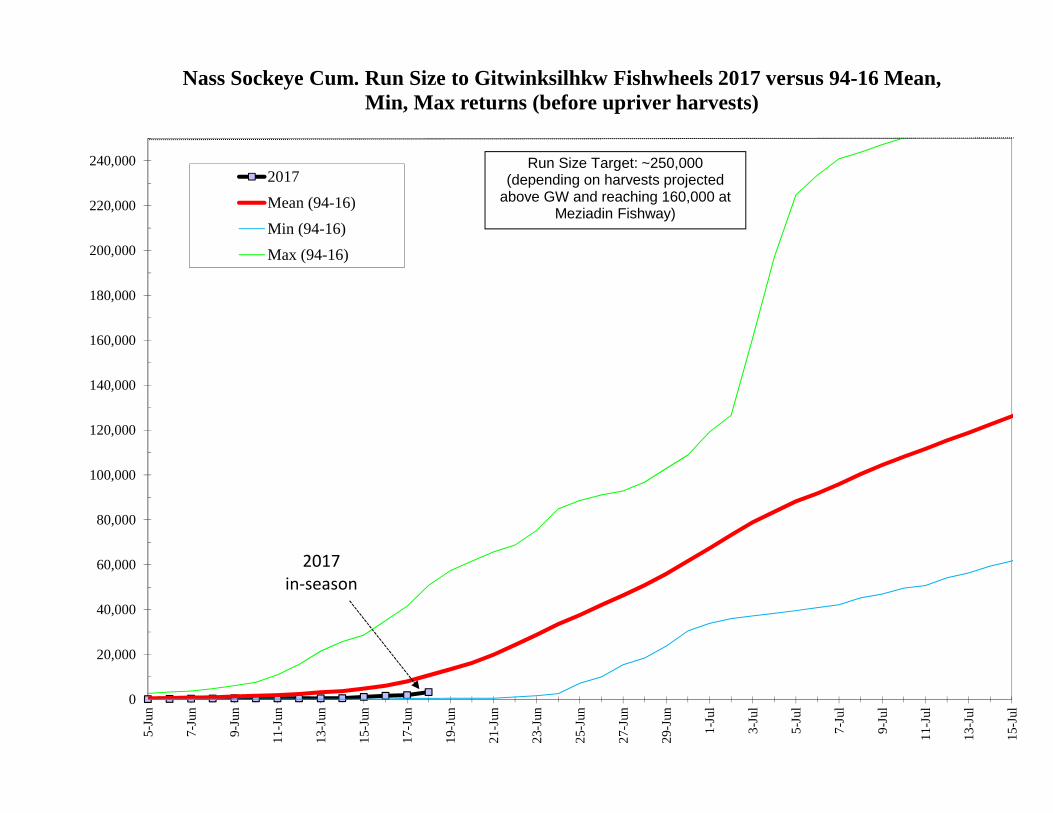
In‐season estimates of run size and projected forecasts to Gitwinksihlkw fishwheels for adult Nass salmon and summer‐run steelhead are shown below and currently based on historical catch index methods. The current run sizes for 2017 are currently below average for Nass Sockeye and Chinook salmon when compared to means to date from 1994 to 2016. Summer‐run steelhead estimates begin on 1 July.
In‐season projected return forecasts to date are shown below. Estimates to GW are based on two methods, mean run timing and log‐regression of the in‐season to final estimates. The run size projections for Chinook and Sockeye are currently below target to reach the run size goal based on the mean run timing method with approximately 3.9% and 3.1% of runs entering the Nass River, respectively; but projections are early and the in‐season to final method indicates targets could be reached. The mean run‐timing projections are highly uncertain at this time with wide projected bounds for Chinook (13,000 – 25,000) and Sockeye (229,000 – 326,000).
Net Escapement Estimates for adult Nass salmon and summer‐run steelhead to date are shown below and relative to the Upper Nass escapement goals.
HARVEST ESTIMATES FOR ADULT NASS SALMON & STEELHEAD
ALASKAN FISHERIES IN SE ALASKA (information courtesy from ADFG’s website):
Alaskan gillnet fisheries start dates in 2017: District 101 (Tree Point) and District 106 (Sumner and Upper Clarence) opened on 18 June. Alaskan seine fisheries start dates in 2017: District 101 (Lower Clarence/Revilla) – not open yet; District 102 (Middle Clarence) on 18 June; District 103 (Cordova) – not open yet, and District
SOCK CHIN COHO STEEL PINK‐ODD CHUM LAMP133 57 0 7 0 0 18410 140 0 5 0 0 4
43,000 4,900 13,000 1,300 25,000 140 500
18 5 0 0 0 0 14 4 0 1 0 0 1
107 57 0 1 NA 0 169 9 0 NA NA NA NA3 3 0 NA NA NA NA
FISHWHEEL CATCH SUMMARIES
HISTORICAL AVG CUM CATCH (00‐16) TO DATE
HISTORICAL AVG CUM TOTAL CATCH (00‐16)
FISHWHEEL TOTAL JACKS ‐ GW ONLYHISTORICAL MEAN JACKS AT GW (94‐16) TO DATE
FISHWHEEL TOTAL TAGGED (OR ADIPOSE FIN MARKED)
FISHWHEEL TOTAL CATCH OF ADULTS
AVERAGE DAILY CATCH (5 D) OF ADULTS ‐ GWAVERAGE DAILY CATCH (5 D) OF ADULTS ‐ GH
SOCK CHIN COHO STEEL3,214 1,062 ‐ ‐ 11,000 2,100 ‐ ‐ 250,000 13,000 65,000 4,200 RUN SIZE TARGET 2017 (MIN. FOR STEELHEAD)
IN‐SEASON RUN SIZE ESTIMATE TO DATEHISTORICAL MEAN RUN SIZE TO GW FOR DATE (94‐16)
SOCK CHIN COHO STEEL87,000 10,000 Too Early Too Early29,000 4,000 Too Early Too Early175,000 20,000 Too Early Too Early277,000 19,000 Too Early Too Early r2 (CH) = 0.13229,000 13,000 Too Early Too Early r2 (SO) = 0.05326,000 25,000 Too Early Too Early r2 (CO)=250,000 13,000 65,000 4,200 r2 (ST)=
In‐season to Final
95% CI ‐ upper
IN‐SEASON FORECASTS TO GW ‐ METHODS: 18‐Jun‐17
GW RUN SIZE TARGET (DEPENDING ON HARVESTS ABOVE GW)
95% CI ‐ lower
Upper (+2 S.D.)2. IN‐SEASON TO FINAL (regression):
Lower (‐2 S.D.)1. RUN TIMING METHOD (94‐16) ‐ Mean Run timing
SOCK CHIN COHO STEEL21 24 ‐ ‐
3,193 1,038 ‐ ‐ 200,000 13,000 60,000 4,000
NET ESCAPEMENT (ABOVE GW):HARVEST ESTIMATES ABOVE GW TO DATE
NET ESCAPEMENT TARGET (UPPER RIVER ONLY)
IN‐SEASON NET ESCAPEMENT ESTIMATES

Nisga’aFisheriesWeeklyUpdate–19June2017Page3
104 (Noyes/Dall) – not open yet. No catches of salmon in Alaskan net fisheries in Districts 101–104 have been reported to date for week ending 17 JUNE. The average total mean harvest of Nass Sockeye in Alaskan fisheries from 2000 to 2016 was 126,000 (range: 47,000‐300,000). CANADIAN COMMERCIAL NET FISHERIES IN AREA 3 (information courtesy from DFO Prince Rupert):
Area 3 commercial net fisheries started on 6 June 2017 for gillnets. Total net fisheries conducted in Area 3 to date are four gillnet fisheries. Next fisheries in Area 3 are 19 June and 20 June for gillnets. Commercial net harvest and release data to 18 June 2017 for salmon and steelhead in Area 3 are shown below:
LABELS: SO=SOCKEYE, PK=PINK, CO=COHO, CH=CHINOOK; STEEL=STEELHEAD, HARV=HARVESTED, AND REL=RELEASED; VESSELS=BOAT DAYS.
DFO plan to implement management actions in Area 3 to reduce harvest impacts on the Kwinageese Sockeye stock during their migration through Area 3 in mid‐July. The Sockeye stock requires rebuilding from a past spawning barrier detected in 2011 and poor returns from 2012 (<4,000 fish), 2013 (<400 fish), and 2014 (<500 fish). Sockeye retention will not be permitted in commercial fisheries in Area 3 from approximately 9‐22 July (WK 28 & 29), the anticipated peak of the Kwinageese Sockeye migration, as documented in DFO’s 2017 Integrated Fisheries Management Plan (IFMP). Sub‐area breakout of catch is as follows:
*Sub‐area catches reporting fewer than 5 boats are not shown by sub area but included in totals by gear type.
Of the total commercial catch (8,600) of Sockeye in Area 3, NFWD is estimating approximately 8,599 are of Nass origin (100%) based on stock composition modeling. The average total mean harvest of Nass Sockeye in Canadian commercial net fisheries from 2000 to 2016 is 211,000 (range: 25,000‐725,000). The table below shows hail data comparisons by week.
GEAR DATEVessel
days SO-harv SO-Rel CO-HARV CO-Rel PK-HARV PK-Rel Chum-harv Chum-Rel CH-harv CH-Rel STEEL-RelGN 6/6/2017 61 1,263 0 1 0 0 0 0 2 85 27 22
6/7/2017 49 440 0 0 0 0 0 0 4 11 22 146/12/2017 121 4,778 0 1 0 0 0 0 8 403 79 256/13/2017 124 2,118 0 11 0 0 0 0 30 144 13 13
GN Total 355 8,599 0 13 0 0 0 0 44 643 141 74Grand Total 355 8,599 0 13 0 0 0 0 44 643 141 74
GEAR AREA 3Vessel
days SO-harv SO-Rel CO-HARV CO-Rel PK-HARV PK-Rel Chum-harv Chum-Rel CH-harv CH-Rel STEEL-RelGN 3-7B 114 2,505 0 12 0 0 0 0 40 143 26 12
3-7A 73 1,481 0 1 0 0 0 0 2 71 43 223-12 168 4,613 0 0 0 0 0 0 2 429 72 40
GN Total 355 8,599 0 13 0 0 0 0 44 643 141 74Grand Total 355 8,599 0 13 0 0 0 0 44 643 141 74
IN‐SEASON AREA 3 WEEKLY SALMON GILLNET HARVEST ESTIMATES VS. WEEKLY HISTORICAL HAIL ESTIMATES ‐ 2017
AREA 3 FISHERYWK END
BOAT DAYS
AVG (00‐16)
SOCK HARVEST
AVG (00‐16)
CHIN HARVEST
AVG (00‐16)
PINK HARVEST
ODD AVG (00‐15)
COHO HARVEST
AVG (00‐16)
CHUM HARVEST
AVG (00‐16)
GILLNET 24 110 33 1,703 7,000 96 300 0 0 1 1 0 20025 245 68 6,896 11,000 547 400 0 0 12 30 0 20026 145 20,000 700 1,000 200 1,20027 267 36,000 400 21,000 200 6,40028 208 23,000 200 18,000 200 6,50029 293 19,000 100 28,000 100 6,80030 256 13,000 0 49,000 300 3,10031 395 9,000 0 30,000 300 2,00032 97 9,000 0 30,000 300 1,20033 16 7,000 0 19,000 400 50034 1 0 0 24,000 0 200
GILLNET TOTAL 355 1,779 8,599 154,000 643 2,100 0 220,000 13 2,031 0 28,300
CUM TO DATE 25 355 101 8,599 18,000 643 700 0 0 13 31 0 400

Nisga’aFisheriesWeeklyUpdate–19June2017Page4
NISGA’A DOMESTIC (FSC) AND SALE FISHERIES:
Nisga’a domestic and sale fisheries are monitored by the Nisga’a Fisheries and Wildlife Department and began on 7 May 2017. Cumulative harvests to week ending 10 JUNE are shown in the table below for FSC catches. For the same week ending period, mean cumulative harvests from 2000 to 2016 are shown for comparison. The current total harvests estimated in 2017 are below average for all salmon and steelhead to date with exception of Pink.
Nisga’a Sale fishery information to date:
NFWD announced two 16 hour marine IS fishery openings for Friday, 23 June and Saturday, 24 June. The Nisga’a sale fisheries closure periods to allow the Kwinageese Sockeye stock to pass upriver are
planned for approximately: 9‐22 July for Marine and 13–26 July for In‐river sale fisheries. The total harvest summary of Nass salmon and steelhead to date in all of the Nisga’a harvest fisheries is as follows:
TOTAL RETURN TO CANADA (TRTC) AND NISGA’A ENTITLEMENT ESTIMATES FOR NASS SALMON
Pre‐season TRTC forecasts: Based on the preliminary Nass salmon return and age information from 2016, preliminary forecasts for Nass salmon and Nisga’a entitlement allocations for 2017 were calculated using pre‐season forecast models. Forecast models used were a combination of sibling (Sockeye and Chinook only) and 5‐year mean returns that project 25%, 50%, and 75% probability point estimates. Pre‐season TRTC forecasts (50% probability estimates) for 2017 predict a below average return forecast for Nass Sockeye (454,000 vs. 580,000), Nass Area odd‐year Pink (355,000 vs. 770,000), Nass Chinook (24,000 vs. 32,000), and Nass Chum (24,000 vs. 44,000), and above average return forecast for Nass Coho (276,000 vs. 210,000) based on mean TRTC estimates from 1994 to 2016. When reviewing Nass salmon returns over a 33
NASS SPECIES Wk end Harvest Mean* Harvest MeanCHINOOK 10-Jun-17 453 700 453 700SOCKEYE 10-Jun-17 137 1,000 137 2,500PINK 10-Jun-17 2 0 2 0COHO 10-Jun-17 0 0 0 0CHUM 10-Jun-17 0 0 0 0STEELHEAD 10-Jun-17 24 60 24 60
TOTAL HARVESTS TO DATE INCLUDING SALE FISHERIES -
2017
DOMESTIC (FSC) HARVESTS TO WK END -
2017
FSC Reported Week Ending Period
NISGA'A NATION CUMULATIVE DOMESTIC (FSC) AND TOTAL CATCH SUMMARY FOR NASS SALMON AND STEELHEAD, 2017.
* Mean harvests from 2000-2016 for week end periods. Harvests include all gear types estimates (net, angling, seine, fishwheels, etc.).
SOCK CHIN COHO PINK‐ODD CHUM0 0 0 0 00 0 0 0 00 0 0 0 0
CLOSED CLOSED CLOSED CLOSED CLOSEDCLOSED CLOSED CLOSED CLOSED CLOSED
137 453 0 2 0137 453 0 2 00 CLOSED CLOSED CLOSED CLOSED0 CLOSED CLOSED CLOSED CLOSED
137 453 0 2 0
24
CLOSED
MARINE SALE FISHERY TOTAL
DOMESTIC (FSC) GILLNET FISHERY ‐ WK END: JUNE 10
NLG SOCK DEMONSTRATION FISHERY HARVEST ‐ DFO INVENTORYNLG SOCK DEMONSTRATION FISHERY HARVEST ‐ NNFC LICENCES CLOSED
CLOSED
SUB TOTAL (NLG TREATY FISHERIES) 24
NLG COMMUNAL SELECTIVE TREATY FISHERY ‐ GH FISHWHEELS
24
STEELCLOSEDCLOSED
CLOSEDNLG COMMUNAL SELECTIVE TREATY FISHERY ‐ SEINE
CLOSEDIN‐RIVER SALE FISHERY TOTAL
GRAND TOTAL
INDIVIDUAL SALE (IS) FISHERY TOTAL
NISGA'A TOTAL HARVEST SUMMARY

Nisga’aFisheriesWeeklyUpdate–19June2017Page5
year period (1985–2016), the forecasted returns in 2017 are projected to be poor for Chinook (26th), Chum (24th) and Pink (22nd); fair for Sockeye (19th); and good for Coho (6th).
SOCK CHIN COHO PINK‐ODD CHUM 580,000 32,000 210,000 770,000 44,000454,000 24,000 276,000 355,000 24,00074,493 5,040 19,200 21,311 No surplus16,000 1,000 3,000 ‐3,000 50090,000 6,000 22,000 18,000 500
HISTORICAL MEAN TRTC (1994‐2016)PRE‐SEASON TRTC FORECAST (50% PROBABILITY)PRE‐SEASON NISGA'A ENTITLEMENT
PRE‐SEASON TRTC & ENTITLEMENT FORECASTS
TOTAL PRE‐SEASON NISGA'A CATCH POTENTIALCUM NISGA'A UNDERAGE (+)/OVERAGE (‐): 2000‐16
YEAR SOCKEYE PINK CHINOOK COHO CHUM TRTC SOCKEYE PINK CHINOOK COHO CHUM1985 660,000 1,230,000 32,500 190,000 73,000 1985 10 6 18 13 101986 378,000 580,000 64,400 205,000 84,000 1986 27 16 1 11 41987 413,000 911,000 35,800 128,000 75,000 1987 24 9 14 23 91988 259,000 335,000 28,100 43,000 47,000 1988 33 23 23 32 161989 363,000 1,501,000 48,700 130,000 79,000 1989 28 3 2 22 61990 286,000 304,000 44,200 242,000 76,000 1990 32 27 6 9 81991 727,000 1,680,000 16,300 46,000 58,000 1991 7 1 31 31 131992 1,572,000 333,000 35,400 160,000 54,000 1992 2 24 15 18 151993 1,586,000 884,000 45,400 62,000 241,000 1993 1 11 5 30 11994 590,000 182,000 42,800 351,000 107,000 1994 13 31 9 3 31995 855,000 838,000 21,700 68,000 84,000 1995 5 12 28 29 41996 694,000 653,000 41,600 126,000 41,000 1996 8 15 10 24 181997 574,000 419,000 36,300 33,000 31,000 1997 14 19 13 33 211998 446,000 144,000 45,700 72,000 184,000 1998 20 32 4 28 21999 645,000 1,265,000 29,000 107,000 69,000 1999 11 5 21 26 112000 539,000 301,000 32,800 134,000 26,000 2000 15 28 16 19 232001 380,000 1,005,000 48,000 243,000 36,000 2001 26 8 3 8 192002 1,279,000 799,000 28,400 314,000 18,000 2002 3 14 22 4 272003 1,024,000 1,024,000 43,600 172,000 78,000 2003 4 7 7 16 72004 681,000 1,582,000 32,500 131,000 58,000 2004 9 2 18 21 132005 522,000 1,368,000 27,700 211,000 34,000 2005 16 4 24 10 202006 637,000 307,000 43,000 125,000 61,000 2006 12 25 8 25 122007 351,000 899,000 39,100 175,000 13,000 2007 30 10 11 14 302008 333,000 107,000 30,100 132,000 4,000 2008 31 33 20 20 332009 425,000 815,000 38,900 423,000 22,000 2009 22 13 12 2 262010 392,000 408,000 27,200 200,000 9,000 2010 25 20 25 12 312011 458,000 187,000 18,200 101,000 7,000 2011 18 30 29 27 322012 419,000 565,000 15,300 171,000 17,000 2012 23 17 33 17 282013 434,000 423,000 15,500 726,000 15,000 2013 21 18 32 1 292014 485,000 307,000 22,200 264,000 27,000 2014 17 25 27 7 222015 752,000 246,000 32,800 175,000 47,000 2015 6 29 16 14 162016 362,000 384,000 17,500 279,000 24,000 2016 29 21 30 5 242017 454,000 355,000 24,000 276,000 24,000 2017 19 22 26 6 24
AVERAGES: Year colors: Good: 1‐1085+ 610,000 687,000 34,000 186,000 56,000 Fair: 11‐2100+ 557,000 631,000 30,000 234,000 29,000 Poor: 22‐32
NASS SALMON TOTAL RETURN TO CANADA ESTIMATES, 1985‐2016 & 2017 FORECAST.
NASS TRTC RANKINGS BY YEAR FOR SALMON, 1985‐2016 & 2017 Forecast

Nisga’aFisheriesWeeklyUpdate–19June2017Page6
In‐season TRTC and Nisga’a entitlement estimates: Preliminary in‐season TRTC estimates estimated by NFWD for Nass Sockeye and Chinook are 424,000 (200,000–1,500,000) and 27,000 (10,000–55,000), respectively, based on harvest and run size data and mean run timing to date (Sockeye 3.1% and Chinook 3.9%) with standard deviation range estimates from 1994 to 2016 returns. The current in‐season TRTC estimates are currently tracking below the pre‐season forecasts for Sockeye and above for Nass Chinook salmon; but estimate ranges are large and uncertain until more of the returns enter the Nass River.
The next Nass River general stock assessment update from Nisga’a Fisheries is planned for: Monday, 26 June 2017. Nass stock assessment updates are available at the following links (no passwords are required): Weekly updates are posted after each Monday’s update to DFO and NLG’s websites:
DFO: http://www.pac.dfo‐mpo.gc.ca/fm‐gp/northcoast‐cotenord/nass‐eng.html NLG: http://www.nisgaanation.ca/stock‐assessments
Daily and weekly run size information are posted on Mondays and Fridays to the following site:
ftp://ftp.lgl.com/Nass%20Stock%20Assessment%20Updates/
SOCK CHIN COHO PINK‐ODD CHUM 424,000 27,000 Pre‐season Pre‐season Pre‐season
3.1% 3.9% 0% 0% 0%200,000 10,000 Pre‐season Too early Too early
1,500,000 55,000 Pre‐season Too early Too early68,000 5,700 16,000 1,000 3,000‐ ‐ 84,000 6,700 22,000 18,000 ‐ 21,000 2,100 Pre‐season Too early Too early224,000 11,600 Pre‐season Too early Too early
IN‐SEASON UNDERAGE (+)/OVERAGE (‐)
MINIMUM ENTITLEMENT FORECAST
PROJECTED TRTC BASED ON MEAN RUN % & MR EST.
Upper (+2 S.D.)
ESTIMATED %TRTC TO DATE: MEAN. RUN TIMINGLower (‐2 S.D.)
TOTAL IN‐SEASON NISGA'A TREATY CATCH POTENTIAL
MAXIMUM ENTITLEMENT FORECAST
IN‐SEASON TRTC & ENTITLEMENT ESTIMATES
IN‐SEASON NISGA'A ENTITLEMENT TARGET

Prepared by Nisga'a Fisheries 6/19/2017
0.00.51.01.52.02.53.03.54.04.55.05.56.06.57.07.58.08.59.09.5
10.030
-May
2-Ju
n5-
Jun
8-Ju
n11
-Jun
14-J
un17
-Jun
20-J
un23
-Jun
26-J
un29
-Jun
2-Ju
l5-
Jul
8-Ju
l11
-Jul
14-J
ul17
-Jul
20-J
ul23
-Jul
26-J
ul29
-Jul
1-A
ug4-
Aug
7-A
ug10
-Aug
13-A
ug16
-Aug
19-A
ug22
-Aug
25-A
ug28
-Aug
31-A
ug3-
Sep
6-Se
p9-
Sep
12-S
ep15
-Sep
Leve
l (m
)Daily Water Level at Gitwinksihlkw Fishwheels 2017
2017
2016
Mean (94-16)
Min (94-16)
Max (94-16) Typical high water shutdown level for
GW fishwheels
GW fishwheels started 31 May 2017

6/19/2017
Cumulative Daily Run Sizes of Adult Nass River Sockeye Salmon (≥ 45 cm NFL) to Gitwinksihlkw Fishwheels, 2000‐2017.
Date 2000 2001 2002 2003 2004 2005 2006 2007 2008 2009 2010 2011 2012 2013 2014 2015 2016 2017 Cum Mean (94‐16) 2017 Daily1‐Jun 216 0 0 0 0 0 0 02‐Jun 175 119 809 0 0 0 0 0 200 03‐Jun 175 119 1,173 93 275 0 0 0 200 04‐Jun 175 158 1,609 278 687 0 128 22 400 225‐Jun 40 175 238 2,646 432 824 283 193 113 500 916‐Jun 40 207 175 360 25 3,245 494 1,510 534 324 205 600 917‐Jun 121 326 175 401 75 3,682 572 2,060 1,069 455 357 800 1528‐Jun 864 229 47 533 175 441 275 4,754 788 3,444 1,699 618 423 900 669‐Jun 1,326 229 209 741 175 645 524 6,136 1,070 5,060 1,983 749 446 1,300 23
10‐Jun 1,505 229 419 1,127 175 645 699 7,027 1,523 7,644 2,141 1,010 446 1,600 011‐Jun 1,521 174 364 419 1,542 175 849 1,024 7,398 2,071 10,921 2,487 1,239 446 1,900 012‐Jun 111 1,814 1,059 836 419 1,928 175 1,134 1,322 7,413 3,136 15,583 3,811 1,827 446 2,400 013‐Jun 111 2,577 1,783 1,196 419 2,314 175 1,294 1,620 7,413 4,137 21,491 5,102 2,317 446 3,200 014‐Jun 111 2,756 1,511 2,375 1,723 419 2,551 175 1,414 2,366 8,430 5,436 25,737 7,208 2,839 537 3,700 9115‐Jun 111 3,032 5,204 3,328 2,250 419 2,758 175 1,733 3,484 10,465 7,174 28,694 9,911 3,002 1,085 4,800 54816‐Jun 553 3,877 10,343 4,973 3,776 419 154 3,466 1,773 2,092 5,671 12,009 8,441 34,958 14,815 3,263 1,571 6,100 48717‐Jun 2,517 4,832 15,268 8,689 6,161 419 488 4,587 4,447 2,691 6,690 12,082 9,108 41,540 20,661 3,492 1,876 8,000 30418‐Jun 4,342 6,216 20,996 17,734 9,656 419 561 6,210 8,336 4,327 9,126 12,446 10,816 50,857 26,413 3,851 3,214 10,700 1,33819‐Jun 7,799 6,687 27,393 23,851 11,760 605 561 9,868 13,233 6,282 10,577 13,478 12,777 57,344 34,868 4,373 13,40020‐Jun 11,781 7,033 39,866 24,670 13,426 2,630 561 13,792 17,748 9,109 12,107 13,711 13,684 61,573 40,714 5,287 16,20021‐Jun 17,506 7,075 29,917 49,020 24,670 15,863 4,702 659 19,605 23,523 12,059 13,836 14,572 15,845 65,738 46,705 6,691 19,90022‐Jun 24,476 7,075 53,842 52,179 24,670 21,386 7,844 1,077 23,216 31,305 16,811 16,598 17,368 18,620 68,743 56,095 9,042 24,30023‐Jun 32,662 7,075 75,318 55,636 24,670 26,505 12,966 1,616 24,852 40,581 23,210 19,996 17,866 24,605 70,093 65,771 11,883 28,80024‐Jun 42,231 7,741 84,932 63,106 24,670 31,011 17,086 2,573 30,400 53,871 28,552 24,229 17,866 32,181 73,868 75,066 14,169 33,50025‐Jun 55,229 10,934 88,616 70,810 24,670 33,641 20,461 7,209 36,366 65,154 33,615 26,911 17,866 34,456 75,537 82,174 17,303 37,60026‐Jun 72,182 16,443 91,072 76,530 26,511 35,773 23,347 10,058 40,975 72,579 39,888 30,271 17,866 44,050 78,019 88,498 20,960 42,10027‐Jun 79,898 22,058 91,072 80,990 29,568 38,720 25,582 15,416 45,804 79,358 45,962 35,037 17,888 51,420 87,281 92,872 25,459 46,30028‐Jun 79,898 25,084 91,072 84,831 35,665 42,868 27,728 22,065 50,633 86,952 51,354 39,940 18,832 77,165 91,753 96,785 29,051 50,90029‐Jun 79,898 26,779 98,717 86,966 41,467 48,063 32,777 29,196 54,242 91,203 55,440 43,995 31,382 91,289 94,676 102,875 34,029 55,90030‐Jun 79,898 30,487 102,127 89,501 48,006 54,382 38,689 36,770 58,643 94,237 58,436 48,384 42,726 96,013 97,207 108,877 38,181 61,6001‐Jul 85,966 33,888 108,610 92,734 51,160 58,517 42,023 43,172 67,993 97,871 61,322 52,772 55,482 100,305 98,557 119,099 41,031 67,3002‐Jul 103,938 35,981 126,584 93,814 56,227 61,515 45,858 45,336 76,305 102,054 62,848 55,662 75,066 104,651 101,507 126,156 42,798 73,2003‐Jul 112,961 37,197 160,994 96,537 62,259 63,453 51,443 48,452 76,305 105,208 63,774 58,654 88,722 108,543 103,801 132,554 44,816 78,9004‐Jul 115,310 38,313 196,911 99,056 65,054 64,892 58,362 53,305 76,305 107,865 64,777 60,738 95,873 111,235 104,522 139,039 47,276 83,6005‐Jul 117,760 39,513 224,762 101,438 69,166 67,550 64,793 59,239 76,305 110,495 66,514 62,650 98,807 112,684 106,109 145,982 49,066 88,2006‐Jul 117,760 40,914 233,579 103,953 74,438 69,271 68,722 62,785 76,305 112,850 68,813 65,152 103,551 113,873 108,589 153,038 52,046 91,8007‐Jul 117,958 42,161 240,891 106,318 79,176 72,042 71,557 64,873 86,686 115,714 73,241 69,761 105,938 116,880 110,309 159,675 55,012 95,9008‐Jul 120,535 45,210 243,807 109,093 88,294 75,611 75,379 71,881 96,917 117,862 80,018 72,385 107,844 119,621 112,591 165,412 57,096 100,4009‐Jul 126,179 46,974 247,158 111,492 94,159 77,789 78,285 76,646 105,678 122,393 83,125 73,734 109,302 122,422 114,737 171,704 59,973 104,400
10‐Jul 132,168 49,577 250,162 113,304 100,632 81,564 81,203 81,381 112,694 125,670 87,773 74,808 110,104 125,989 116,806 178,531 63,656 108,10011‐Jul 135,632 50,732 255,678 115,573 104,618 85,967 85,121 85,702 117,038 129,196 93,589 76,521 110,617 128,878 118,206 184,230 66,808 111,60012‐Jul 140,067 54,206 259,269 117,890 108,888 90,486 89,920 86,278 119,205 131,682 98,109 79,745 111,188 131,649 120,808 194,202 70,047 115,40013‐Jul 142,248 56,301 261,891 119,333 115,590 95,442 94,695 86,278 122,817 134,647 101,199 85,035 113,917 132,769 123,616 200,631 72,877 118,80014‐Jul 145,873 59,389 264,572 122,672 121,616 100,230 98,327 86,278 126,974 137,077 103,602 95,295 117,312 134,614 127,659 207,687 75,658 122,50015‐Jul 147,184 61,634 267,697 124,472 128,259 102,695 100,895 86,278 131,854 139,073 106,100 104,110 120,872 137,242 132,123 212,945 81,378 126,10016‐Jul 149,032 66,920 270,225 127,797 130,229 104,339 104,774 86,278 137,633 141,826 106,863 112,758 124,421 141,659 136,082 218,285 86,476 129,70017‐Jul 150,546 72,272 276,077 130,616 133,526 108,093 108,037 86,278 142,705 144,324 107,740 117,770 126,835 147,866 141,276 221,173 90,853 133,50018‐Jul 151,917 79,555 281,561 134,275 137,506 115,877 111,915 86,278 145,257 146,419 110,337 124,416 131,634 155,582 146,751 226,540 96,399 137,80019‐Jul 153,443 83,510 286,433 136,231 141,050 123,640 114,997 90,356 147,135 147,982 113,473 133,203 137,302 162,850 150,907 229,559 100,385 141,80020‐Jul 154,540 87,412 291,060 142,802 146,018 133,291 119,238 93,290 150,432 150,540 118,716 142,564 145,152 170,566 157,059 232,455 106,275 146,70021‐Jul 155,565 87,412 298,146 146,769 149,068 138,063 124,476 96,029 154,763 154,254 124,889 150,394 152,975 179,125 161,865 234,426 114,234 151,50022‐Jul 157,711 87,412 303,763 155,140 153,585 141,224 130,022 98,444 160,692 159,775 129,446 157,389 156,631 185,644 168,786 239,499 119,947 156,30023‐Jul 160,552 87,412 312,922 162,777 157,073 145,381 135,369 104,582 166,548 165,073 134,395 164,784 163,011 192,810 174,522 247,385 123,543 161,70024‐Jul 164,377 90,640 327,029 169,680 162,273 149,641 140,499 109,959 170,288 168,584 140,324 170,836 170,726 198,234 178,271 258,659 127,894 167,40025‐Jul 166,023 105,836 341,720 178,156 168,096 156,127 146,226 115,406 174,224 172,279 147,993 178,246 177,785 201,618 183,173 271,453 131,571 173,80026‐Jul 167,250 115,745 350,102 184,640 172,054 159,454 152,371 122,367 176,586 175,539 154,849 185,612 183,755 204,355 187,531 280,462 135,699 179,10027‐Jul 169,235 123,371 363,712 193,640 177,124 162,134 156,195 126,666 180,074 180,032 163,274 190,781 186,195 207,341 192,399 289,282 141,329 184,50028‐Jul 171,236 129,728 372,164 200,701 180,082 167,328 161,633 131,250 184,998 186,305 171,932 195,089 188,864 212,549 196,658 300,099 146,842 190,00029‐Jul 172,366 140,409 380,138 208,176 182,136 172,461 167,106 136,809 187,783 192,649 177,858 200,366 195,124 215,940 201,096 308,476 151,623 195,30030‐Jul 175,368 147,982 389,306 218,780 184,304 175,767 172,272 140,439 192,150 196,068 182,855 205,449 198,678 218,059 204,568 321,783 156,267 200,20031‐Jul 178,241 156,115 399,998 229,746 187,131 181,258 177,184 144,996 196,898 202,306 187,793 211,923 202,672 219,876 209,256 327,311 161,070 205,500
Note: In‐season cum. values with shading are preliminary and will change with more data.
IN‐SEASON (FW‐MR)Cumulative run size
Prepared by Nisga'a Fisheries Page 1 of 1

Cumulative Daily Run Sizes of Adult Nass River Chinook Salmon (≥ 50 cm NFL) to Gitwinksihlkw Fishwheels, 2000‐2017.
Date 2000 2001 2002 2003 2004 2005 2006 2007 2008 2009 2010 2011 2012 2013 2014 2015 2016 2017 CumMean (94‐
16)2017 Daily
5‐Jun‐17 46 205 466‐Jun‐17 14 23 488 24 0 0 0 0 175 205 1297‐Jun‐17 23 72 69 548 24 17 97 0 46 239 205 648‐Jun‐17 168 72 47 115 731 24 50 97 0 68 253 205 149‐Jun‐17 306 72 141 138 914 47 67 161 60 91 261 205 8
10‐Jun‐17 345 72 157 208 975 71 67 290 90 114 261 277 011‐Jun‐17 352 16 101 157 600 1,219 21 71 84 483 134 228 261 364 012‐Jun‐17 32 559 49 173 157 669 1,280 106 95 134 772 179 319 261 450 013‐Jun‐17 32 1,248 98 404 157 669 1,524 212 102 167 901 179 410 289 583 2814‐Jun‐17 32 1,409 31 147 505 157 715 1,645 212 126 301 1,030 179 547 354 681 6415‐Jun‐17 32 1,471 279 245 549 157 738 1,828 212 134 318 1,287 254 707 611 814 25716‐Jun‐17 161 1,731 1,164 636 664 157 25 853 159 2,499 276 142 318 1,706 493 912 740 994 12917‐Jun‐17 850 2,252 2,513 1,908 1,141 157 37 1,222 319 2,742 467 142 351 2,092 821 1,322 869 1,436 12918‐Jun‐17 1,410 2,903 5,042 3,946 2,065 157 37 1,315 546 3,352 616 142 485 2,478 2,000 1,527 1,062 2,123 19319‐Jun‐17 2,013 3,209 6,035 4,386 2,628 173 37 1,730 865 4,083 722 300 619 2,768 2,433 1,573 2,69620‐Jun‐17 2,928 3,278 7,059 4,418 2,859 361 37 2,168 1,275 5,058 892 457 686 2,929 2,657 1,687 3,18521‐Jun‐17 4,188 3,278 866 11,838 4,418 3,148 896 86 2,629 2,345 6,643 977 457 686 3,315 3,209 1,801 3,76422‐Jun‐17 5,480 3,278 2,553 16,771 4,418 3,725 1,760 86 2,883 4,484 8,471 1,253 489 719 3,701 3,403 2,006 4,57223‐Jun‐17 7,450 3,278 4,421 18,974 4,418 4,592 3,284 210 2,883 6,738 9,933 1,401 505 803 3,991 3,777 2,165 5,32024‐Jun‐17 9,452 3,286 5,816 20,510 4,418 6,122 5,357 1,479 3,114 11,109 11,335 1,593 520 837 4,280 4,224 2,553 6,16525‐Jun‐17 11,659 3,692 6,144 21,240 4,418 7,826 9,662 1,886 3,483 15,388 12,615 1,869 528 937 4,474 5,150 2,826 7,05126‐Jun‐17 12,746 6,380 6,354 21,519 4,418 9,270 12,553 2,613 4,475 15,912 13,834 2,187 544 1,054 4,860 6,852 3,100 7,83727‐Jun‐17 12,972 9,827 6,354 21,798 4,484 9,949 13,024 3,919 5,766 16,686 14,992 2,718 552 1,104 4,924 8,076 3,373 8,43928‐Jun‐17 12,972 10,546 6,354 22,093 4,516 10,454 13,134 5,201 6,873 20,100 15,845 3,164 552 1,221 5,600 9,374 3,738 9,00329‐Jun‐17 12,972 10,738 8,168 22,512 4,908 11,003 13,590 5,571 7,289 22,172 16,454 3,461 552 1,238 5,697 10,748 4,331 9,57730‐Jun‐17 12,972 11,067 9,864 22,776 5,658 11,249 16,292 6,076 7,496 23,447 16,637 3,843 552 1,389 5,761 11,822 4,923 10,3591‐Jul‐17 13,134 13,495 10,821 22,900 6,130 11,494 19,340 6,187 8,027 24,198 16,759 4,311 552 1,506 6,276 12,300 5,334 11,2432‐Jul‐17 13,747 19,538 11,933 22,915 7,370 11,711 21,414 6,434 8,811 24,721 16,820 4,757 568 3,079 6,855 12,987 5,676 12,2943‐Jul‐17 14,727 24,501 12,544 23,117 9,163 12,028 22,419 7,679 8,811 24,949 17,003 5,181 828 5,287 7,531 14,345 6,542 13,3014‐Jul‐17 15,244 25,688 13,291 23,427 10,761 12,360 23,001 11,968 8,811 25,382 17,124 5,861 1,135 6,592 8,143 15,077 7,020 14,1485‐Jul‐17 15,405 26,110 13,829 23,877 12,408 12,635 23,535 13,287 8,811 25,837 17,124 6,901 1,506 7,061 8,625 16,047 7,431 14,7196‐Jul‐17 15,405 26,393 14,385 24,637 13,337 12,649 23,786 13,521 8,811 26,087 17,246 7,475 2,578 7,479 9,108 17,211 7,750 15,1517‐Jul‐17 15,416 26,860 14,786 25,211 13,386 12,707 24,053 15,924 8,857 26,224 17,307 8,324 4,233 7,646 9,526 17,987 7,864 15,6028‐Jul‐17 15,545 29,418 15,051 25,956 13,467 13,010 24,116 19,807 9,872 26,338 17,734 8,515 5,574 8,115 9,526 18,853 7,909 16,2269‐Jul‐17 15,911 30,008 15,124 26,189 13,630 13,487 24,242 21,878 12,224 26,543 17,917 8,685 6,062 8,684 9,687 19,316 8,046 16,675
10‐Jul‐17 16,406 30,958 15,224 26,406 13,859 14,079 24,367 23,110 15,799 26,747 18,039 8,812 6,819 8,935 10,234 19,629 8,183 17,16211‐Jul‐17 16,826 31,379 15,279 26,530 14,169 14,526 24,587 23,172 18,152 26,952 18,160 9,046 7,434 9,219 10,428 19,824 8,570 17,50212‐Jul‐17 18,161 32,221 15,306 26,654 14,690 14,728 25,137 23,172 19,190 26,998 18,282 9,195 7,671 9,286 10,653 19,988 8,753 17,82113‐Jul‐17 18,753 32,681 15,370 26,732 15,342 14,858 26,064 23,172 19,351 27,066 18,404 9,301 7,789 9,387 10,975 20,003 8,981 18,04714‐Jul‐17 19,345 32,911 15,406 26,840 15,783 15,017 26,661 23,172 19,513 27,294 18,465 9,471 7,797 9,420 11,168 20,018 9,163 18,22215‐Jul‐17 19,582 32,987 15,443 26,996 15,946 15,104 26,834 23,172 19,836 27,521 18,587 9,556 7,797 9,504 11,297 20,077 9,231 18,33216‐Jul‐17 19,776 33,148 15,452 27,058 16,027 15,133 26,944 23,172 20,043 27,544 18,587 9,640 7,797 9,520 11,747 20,301 9,322 18,42417‐Jul‐17 19,970 33,317 15,507 27,213 16,027 15,219 27,148 23,172 20,159 27,749 18,648 9,768 7,805 9,537 11,876 20,540 9,414 18,51618‐Jul‐17 20,013 33,508 15,534 27,476 16,092 15,277 27,227 23,283 20,228 27,863 18,648 9,895 7,915 9,587 12,005 20,749 9,482 18,60619‐Jul‐17 20,077 33,608 15,543 27,709 16,174 15,364 27,352 23,369 20,274 27,954 18,770 10,023 7,994 9,604 12,069 20,839 9,505 18,68020‐Jul‐17 20,153 33,654 15,580 27,926 16,223 15,407 27,384 23,542 20,297 28,022 18,770 10,108 8,018 9,604 12,101 20,913 9,550 18,74021‐Jul‐17 20,163 33,654 15,607 28,082 16,272 15,479 27,478 23,862 20,343 28,159 18,953 10,235 8,025 9,621 12,101 20,973 9,550 18,80822‐Jul‐17 20,163 33,654 15,625 28,159 16,288 15,479 27,525 24,257 20,389 28,318 19,014 10,362 8,120 9,704 12,165 21,048 9,550 18,87123‐Jul‐17 20,239 33,654 15,671 28,268 16,304 15,595 27,525 24,700 20,412 28,432 19,014 10,426 8,286 9,738 12,230 21,062 9,573 18,93724‐Jul‐17 20,325 33,700 15,680 28,361 16,386 15,624 27,541 25,082 20,412 28,477 19,014 10,490 8,609 9,755 12,262 21,077 9,573 18,99925‐Jul‐17 20,368 33,769 15,707 28,438 16,516 15,653 27,541 25,551 20,459 28,500 19,014 10,554 9,082 9,771 12,294 21,092 9,596 19,07226‐Jul‐17 20,411 33,853 15,707 28,531 16,533 15,696 27,572 25,748 20,528 28,591 19,075 10,596 9,184 9,805 12,455 21,107 9,642 19,12827‐Jul‐17 20,422 33,960 15,735 28,563 16,630 15,739 27,588 25,994 20,574 28,637 19,075 10,660 9,271 9,838 12,584 21,197 9,687 19,18228‐Jul‐17 20,433 34,021 15,744 28,609 16,647 15,739 27,604 26,192 20,620 28,705 19,136 10,702 9,531 9,855 12,616 21,271 9,710 19,23029‐Jul‐17 20,443 34,075 15,753 28,656 16,696 15,768 27,604 26,266 20,666 28,728 19,196 10,787 9,768 9,855 12,616 21,301 9,710 19,26730‐Jul‐17 20,486 34,167 15,789 28,764 16,728 15,783 27,667 26,364 20,689 28,751 19,257 10,830 9,870 9,888 12,713 21,391 9,710 19,31131‐Jul‐17 20,529 34,282 15,808 28,857 16,777 15,797 27,714 26,438 20,689 28,842 19,257 10,872 9,933 9,888 12,745 21,421 9,710 19,347
IN‐SEASON
Prepared by Nisga'a Fisheries 6/19/2017
0
20,000
40,000
60,000
80,000
100,000
120,000
140,000
160,000
180,000
200,000
220,000
240,0005-
Jun
7-Ju
n
9-Ju
n
11-J
un
13-J
un
15-J
un
17-J
un
19-J
un
21-J
un
23-J
un
25-J
un
27-J
un
29-J
un
1-Ju
l
3-Ju
l
5-Ju
l
7-Ju
l
9-Ju
l
11-J
ul
13-J
ul
15-J
ul
Nass Sockeye Cum. Run Size to Gitwinksilhkw Fishwheels 2017 versus 94-16 Mean, Min, Max returns (before upriver harvests)
2017Mean (94-16)Min (94-16)Max (94-16)
Run Size Target: ~250,000(depending on harvests projected
above GW and reaching 160,000 at Meziadin Fishway)
2017in‐season

6/19/2017
01,0002,0003,0004,0005,0006,0007,0008,0009,000
10,00011,00012,00013,00014,00015,00016,00017,00018,00019,00020,00021,00022,00023,00024,00025,00026,00027,00028,00029,00030,00031,00032,00033,00034,00035,000
5-Ju
n
7-Ju
n
9-Ju
n
11-J
un
13-J
un
15-J
un
17-J
un
19-J
un
21-J
un
23-J
un
25-J
un
27-J
un
29-J
un
1-Ju
l
3-Ju
l
5-Ju
l
7-Ju
l
9-Ju
l
11-J
ul
13-J
ul
15-J
ul
Cumulative Nass Adult Chinook Run Size to Gitwinksihlkw 2017 vs 94-16 Mean, Minimum and Maximum returns (before up river harvests)
2017Mean (94-16)Min (94-16)Max (94-16)
Run-size Target to Upper Nass:
~13,000 In‐season 2017

0
50,000
100,000
150,000
200,000
250,000
300,000
350,000
400,000
450,000
500,000
0
50
100
150
200
250
300
350
400
450
500
1-Ju
n4-
Jun
7-Ju
n10
-Jun
13-J
un16
-Jun
19-J
un22
-Jun
25-J
un28
-Jun
1-Ju
l4-
Jul
7-Ju
l10
-Jul
13-J
ul16
-Jul
19-J
ul22
-Jul
25-J
ul28
-Jul
31-J
ul3-
Aug
6-A
ug9-
Aug
12-A
ug15
-Aug
18-A
ug21
-Aug
24-A
ug27
-Aug
30-A
ug2-
Sep
5-Se
p8-
Sep
11-S
ep
Fore
cast
of N
ass S
ocke
ye to
Ret
urn
to G
itwin
ksih
lkw
Cat
ch o
f Soc
keye
in F
ishw
heel
sNass Sockeye (≥ 45 cm NFL) Run Forecasts to Gitwinksihlkw Fishwheels 2017
(Mean Run timing - 1994-16)
Grease Harbour fishwheel catch - released (n = 25)
Gitwinksihlkw fishwheel catch - released (n = 108)
2017 Cumulative In-season Escapement (n = 3,214)
In-season Esc. Forecast - Upper (+2 S.D.)
In-season Esc. Forecast - Mean Run Timing (94-16)
In-season Esc. Forecast - Lower (-2 S.D.)
Mid-season Esc. Forecast using Mez. Mark Rate (18 d lag; 70% tag retention)
RUN SIZE GOAL: ~250,000(assumes no more than 50,000 harvested
above GW):
6/19/2017

0
5,000
10,000
15,000
20,000
25,000
30,000
35,000
40,000
0
20
40
60
80
100
120
1-Ju
n4-
Jun
7-Ju
n10
-Jun
13-J
un16
-Jun
19-J
un22
-Jun
25-J
un28
-Jun
1-Ju
l4-
Jul
7-Ju
l10
-Jul
13-J
ul16
-Jul
19-J
ul22
-Jul
25-J
ul28
-Jul
31-J
ul3-
Aug
6-A
ug9-
Aug
12-A
ug15
-Aug
18-A
ug21
-Aug
24-A
ug27
-Aug
30-A
ug2-
Sep
5-Se
p8-
Sep
11-S
ep
Fore
cast
of N
ass C
hino
ok to
Ret
urn
to G
itwin
ksih
lkw
Cat
ch in
Fis
hwhe
els
Nass Chinook (≥ 50 cm NFL) Forecasts to Gitwinksihlkw Fishwheels 2017(Mean Run timing - 1994-16)
Gitwinksihlkw fishwheel catch - released (n = 36)
Grease Harbour fishwheel catch - released (n = 21)
2017 Cumulative In-season Escapement (n = 1,062)
In-season Esc. Forecast - Upper (+2 S.D.)
In-season Esc. Forecast - Mean Run Timing (94-16)
In-season Esc. Forecast - Lower (-2 S.D.)
RUN SIZE GOAL~13,000
6/19/2017

0
1,000
2,000
3,000
4,000
5,000
6,000
7,000
8,000
9,000
10,000
11,000
12,000
13,000
14,000
15,000
16,000
17,000
18,000
0
250
500
750
1000
1250
1500
1750
2000
2250
2500
2750
3000
1‐Jun3‐Jun5‐Jun7‐Jun9‐Jun11‐Jun13‐Jun15‐Jun17‐Jun19‐Jun21‐Jun23‐Jun25‐Jun27‐Jun29‐Jun1‐Jul3‐Jul5‐Jul7‐Jul9‐Jul11‐Jul13‐Jul15‐Jul17‐Jul19‐Jul21‐Jul23‐Jul25‐Jul27‐Jul29‐Jul31‐Jul2‐Aug4‐Aug6‐Aug8‐Aug10‐Aug12‐Aug14‐Aug16‐Aug18‐Aug20‐Aug22‐Aug24‐Aug26‐Aug28‐Aug30‐Aug1‐Sep3‐Sep5‐Sep7‐Sep9‐Sep11‐Sep13‐Sep15‐Sep
Daily Escapem
ent
Daily FW Catch
DAILY CATCHES OF NASS SALMON AND STEELHEAD AT THE FISHWHEELS 2017
Pink FW Catch 2017
Coho FW. Catch 2017
Sock. FW Catch 2017
Chin. FW Catch 2017
Steel FW Catch 2017
Sock. Run to GW 2017
2017 daily Sockeye run size
estimate
0
1,000
2,000
3,000
4,000
5,000
6,000
7,000
8,000
9,000
10,000
11,000
12,000
13,000
14,000
15,000
16,000
17,000
18,000
0
250
500
750
1,000
1,250
1,500
1,750
2,000
2,250
2,500
2,750
3,000
1‐Jun3‐Jun5‐Jun7‐Jun9‐Jun11‐Jun13‐Jun15‐Jun17‐Jun19‐Jun21‐Jun23‐Jun25‐Jun27‐Jun29‐Jun1‐Jul3‐Jul5‐Jul7‐Jul9‐Jul11‐Jul13‐Jul15‐Jul17‐Jul19‐Jul21‐Jul23‐Jul25‐Jul27‐Jul29‐Jul31‐Jul2‐Aug4‐Aug6‐ Aug8‐Aug10‐Aug12‐Aug14‐Aug16‐Aug18‐Aug20‐Aug22‐Aug24‐Aug26‐Aug28‐Aug30‐Aug1‐Sep3‐Sep5‐Sep7‐Sep9‐Sep11‐Sep13‐Sep15‐Sep
Daily Escapem
ent
Daily FW Catch
MEAN DAILY CATCHES OF NASS SALMON AND STEELHEAD AT THE FISHWHEELS ‐ 2000‐2016
Pink FW Catch MEANCoho FW. Catch MEANSock. FW Catch MEANChin. FW Catch MEANSteel FW Catch MEANSock. Run to GW MEANSteel Run to GW MEANChin Run to GW MEANCoho Run to GW MEAN
6/19/2017

2017 Nass Fishwheel Catches
GW GW Total GH GH Total Grand TotalData FW1 FW2 FW3 FW4 FW5 FW6Chin-adult catch 5 31 36 9 2 5 5 21 57Chin-tagged 5 31 36 9 2 5 5 21 57Chin-recaps 0 0 0 0 0 0 0 0 0Chin-Jacks 1 8 9 4 0 1 6 11 20Sum of CH Harv 0 0 0 0 0 0 0 0 0Sockeye-adult catch 13 95 108 7 3 7 8 25 133Sockeye-tagged 12 95 107 0 0 0 0 0 107Sockeye-recaps 1 2 3 0 1 1 0 2 5Sockeye_ jacks 0 9 9 0 0 0 0 0 9Sum of Sk Harv 0 0 0 0 0 0 0 0 0Coho-adult catch 0 0 0 0 0 0 0 0 0Coho-tagged 0 0 0 0 0 0 0 0 0Coho-recaps 0 0 0 0 0 0 0 0 0Coho-jack 0 0 0 0 0 0 0 0 0Sum of CO Harv 0 0 0 0 0 0 0 0 0Steel-adult catch 1 1 2 2 0 2 1 5 7Steel-Adipose marked 0 1 1 0 0 0 0 0 1Steel-unmarked 1 0 1 2 0 2 1 5 6Steel-recap-total 0 0 0 0 0 0 0 0 0Pacific Lamprey-catch 0 10 10 1 0 3 4 8 18Lamprey-tagged 0 9 9 1 0 3 3 7 16Lamprey-released 0 1 1 0 0 0 1 1 2Lamprey-recaps 0 0 0 0 0 0 0 0 0River Lamprey 0 0 0 0 0 0 0 0 0Pink-adult-catch 0 0 0 0 0 0 0 0 0Chum-adult-catch 0 0 0 0 0 0 0 0 0Chum-tagged 0 0 0 0 0 0 0 0 0Chum-punched 0 0 0 0 0 0 0 0 0Chum-recaps 0 0 0 0 0 0 0 0 0Rainbow Trout 10 3 13 2 0 2 0 4 17Dolly Varden 1 3 4 1 0 0 1 2 6Whitefish sp. 2 1 3 2 1 0 0 3 6Pike Minnow 0 0 0 2 2 0 0 4 4Cutthroat Trout 0 1 1 0 0 0 1 1 2Peamouth Chub 0 0 0 1 0 0 0 1 1Sucker 1 0 1 0 0 0 0 0 1Sculpin 0 0 0 0 0 0 0 0 0Red-Side Shiner 0 0 0 0 0 0 0 0 0Sum of chin_smolt 5 5 10 0 0 0 0 0 10Sum of co_smolt 3 3 6 0 0 4 0 4 10Sum of sk_smolt 0 0 0 0 0 0 0 0 0
Prepared by Nisga'a Fisheries 6/19/2017

Nass Weekly Fishwheel Cum Catches, 1992-2017 6/19/2017
Chinook (all FWs)
Week Ending (Sat) Stat wk 2000 2001 2002 2003 2004 2005 2006 2007 2008 2009 2010 2011 2012 2013 2014 2015 2016 00
-16
Cum
M
ean
201727-May 21 3 - - 6 3 2 -
3-Jun 22 5 - 15 8 15 70 40 22 13 10-Jun 23 169 6 30 10 - 41 - 50 10 68 62 171 478 144 89 46 17-Jun 24 277 454 568 424 321 23 3 349 56 170 134 80 118 422 1,344 484 327 57 24-Jun 25 1,631 1,421 736 3,339 428 1,992 2,002 914 1,172 822 555 391 167 471 638 2,581 832 1,182
1-Jul 26 1,954 5,589 3,835 3,923 1,076 2,770 5,791 2,337 1,390 5,839 782 793 2,349 1,728 1,120 2,886 1,095 2,662 8-Jul 27 2,355 8,812 6,284 4,921 2,300 3,552 6,270 5,512 3,490 6,107 885 1,410 2,586 1,862 1,458 3,118 1,197 3,654
15-Jul 28 4,305 11,373 6,525 5,276 3,001 3,863 8,735 5,610 4,150 6,415 948 1,514 3,067 1,911 1,552 3,166 1,231 4,273 22-Jul 29 4,576 11,458 6,606 5,579 3,092 3,940 8,781 8,464 4,223 6,823 985 1,592 3,594 1,940 1,615 3,276 1,299 4,579 29-Jul 30 4,628 11,860 6,692 5,712 3,164 4,003 8,952 9,173 4,272 6,902 1,004 1,644 3,895 1,948 1,639 3,322 1,338 4,715 5-Aug 31 4,881 11,996 6,746 5,754 3,220 4,040 9,038 9,324 4,287 7,037 1,025 1,662 4,003 1,960 1,660 3,341 1,358 4,784
12-Aug 32 4,969 12,070 6,760 5,778 3,280 4,053 9,058 9,385 4,300 7,093 1,049 1,667 4,035 1,966 1,665 3,367 1,371 4,816 19-Aug 33 4,986 12,084 6,777 5,791 3,300 4,062 9,075 9,413 4,308 7,115 1,053 1,668 4,053 1,974 1,676 3,392 1,383 4,830 26-Aug 34 4,993 12,098 6,778 5,798 3,312 4,095 9,081 9,421 4,322 7,129 1,057 1,669 4,058 1,979 1,685 3,397 1,385 4,839
2-Sep 35 4,999 12,103 6,784 5,802 3,314 4,101 9,089 9,431 4,331 7,133 1,060 1,686 4,059 1,981 1,690 3,397 1,389 4,844 9-Sep 36 5,001 12,106 6,785 5,802 3,314 4,107 9,089 9,437 4,331 7,135 1,065 1,688 4,059 1,981 1,693 3,397 1,389 4,846
16-Sep 37 5,002 12,106 6,785 5,802 3,314 4,111 9,089 9,440 4,331 1,068 1,691 3,397 1,389 5,194 23-Sep 38 5,002 12,106 6,785 5,802 3,314 4,111 9,089 9,440 4,331 1,068 3,397 5,859
Grand Total 5,003 12,106 6,785 5,802 3,293 4,111 9,089 9,440 4,331 7,135 1,068 1,691 4,059 1,981 1,693 3,397 1,389 4,845 57
Sockeye (all Fws)
Week Ending (Sat) Stat wk 2000 2001 2002 2003 2004 2005 2006 2007 2008 2009 2010 2011 2012 2013 2014 2015 2016 00
-16
Cum
M
ean
201727-May 21 45 - - 12 4 12 -
3-Jun 22 6 - 359 42 45 131 41 89 20 10-Jun 23 130 46 43 - 46 43 5 39 42 829 569 918 1,405 148 305 81 17-Jun 24 433 484 1,507 934 676 1,507 934 676 565 209 611 1,122 1,853 4,234 4,583 719 1,315 133 24-Jun 25 3,232 1,635 5,168 5,920 1,191 3,138 5,920 1,191 3,138 3,489 1,510 1,814 3,640 13,059 8,820 10,821 2,071 4,456
1-Jul 26 7,217 3,874 17,629 9,581 4,614 8,347 9,581 4,614 8,347 8,822 3,120 4,172 20,109 25,114 14,107 16,580 4,057 9,993 8-Jul 27 13,877 6,673 31,153 15,454 14,338 12,567 15,454 14,338 12,567 12,283 6,846 6,715 22,987 26,860 16,933 22,500 6,934 15,205
15-Jul 28 19,067 12,191 35,667 20,671 20,687 16,755 20,671 20,687 16,755 17,206 9,941 11,167 30,501 28,814 19,838 27,403 10,653 19,922 22-Jul 29 21,208 15,132 41,182 27,655 24,373 21,095 27,655 24,373 21,095 21,113 12,096 19,093 42,668 32,224 23,898 39,195 16,563 25,330 29-Jul 30 22,744 25,158 48,601 36,940 28,086 26,082 36,940 28,086 26,082 24,552 15,290 26,789 52,768 34,712 26,846 48,769 22,574 31,236 5-Aug 31 27,862 29,355 52,663 41,714 32,420 29,180 41,714 32,420 29,180 34,100 18,738 30,375 58,536 36,866 29,666 56,655 28,293 35,867
12-Aug 32 29,803 31,182 55,063 44,953 38,616 31,862 44,953 38,616 31,862 40,019 22,047 31,918 61,066 38,150 32,526 63,066 32,683 39,317 19-Aug 33 30,477 31,816 57,336 46,745 41,213 33,507 46,745 41,213 33,507 41,726 23,658 32,773 62,047 38,785 34,975 67,738 35,525 41,164 26-Aug 34 31,060 32,100 57,737 47,350 42,819 38,699 47,350 42,819 38,699 42,719 24,237 33,548 62,292 39,040 37,100 70,099 37,605 42,663
2-Sep 35 31,968 32,666 58,598 47,556 43,470 39,880 47,556 43,470 39,880 43,264 24,496 36,409 62,365 39,170 38,205 70,737 38,677 43,433 9-Sep 36 32,780 24,980 43,782 40,138 47,556 43,782 40,138 43,426 24,782 36,825 62,385 39,184 38,345 70,737 38,677 41,834
16-Sep 37 33,334 43,782 40,320 47,556 43,782 40,320 43,426 24,838 36,915 70,737 38,677 42,153 23-Sep 38 33,879 40,320 43,426 24,840 70,737
Grand Total 33,879 32,821 58,598 47,556 43,782 40,320 47,556 43,782 40,320 43,426 24,840 36,915 62,385 39,184 38,345 70,737 38,677 43,713 133
Coho (all FWs)
Week Ending (Sat) Stat wk 2000 2001 2002 2003 2004 2005 2006 2007 2008 2009 2010 2011 2012 2013 2014 2015 2016 00
-16
Cum
M
ean
201727-May 21 - - - - - -
3-Jun 22 - - - - - - - - 10-Jun 23 - - - - - - - - - - - - - - - 17-Jun 24 - - - 1 - - - - - - - - - - - - - 24-Jun 25 - - - - 1 - - - - - - - - - - - -
1-Jul 26 - - - - 2 - - - - - - - - - - 1 1 8-Jul 27 - - - - 2 1 - - - 2 - - - 1 - 30 9 3
15-Jul 28 1 - 3 6 12 8 15 - 6 12 7 2 8 82 5 103 96 22 22-Jul 29 18 3 39 150 105 143 126 31 144 140 68 47 81 601 190 328 704 172 29-Jul 30 137 216 329 840 442 736 731 385 594 635 443 229 899 2,174 1,165 1,431 2,793 834 5-Aug 31 2,143 1,748 1,900 2,212 1,090 1,923 2,590 1,625 2,498 4,478 2,313 1,110 4,482 5,521 4,579 2,762 5,698 2,863
12-Aug 32 3,577 8,257 3,616 4,516 2,355 3,737 5,155 4,152 4,393 7,588 6,443 1,850 9,470 8,638 7,314 4,391 10,278 5,631 19-Aug 33 4,486 11,656 8,607 7,419 3,372 5,700 7,797 6,413 7,960 12,171 9,964 2,329 12,580 11,593 12,111 5,503 13,315 8,410 26-Aug 34 5,878 13,847 9,457 8,916 3,869 12,229 8,837 8,929 11,066 16,411 11,245 3,047 14,204 13,386 14,719 6,473 14,863 10,434
2-Sep 35 7,511 19,916 13,835 9,460 4,064 13,977 9,671 10,358 14,589 19,405 11,821 5,186 15,185 14,270 16,603 6,616 15,690 12,245 9-Sep 36 8,185 22,630 4,142 14,328 9,671 11,477 14,640 20,270 12,587 5,472 15,608 14,555 17,137 6,616 15,690 12,867
16-Sep 37 8,395 4,142 14,508 9,671 11,638 14,640 20,270 12,877 5,744 6,616 15,690 11,290 23-Sep 38 8,529 11,638 20,270 12,927 6,616 11,996
Grand Total 8,529 22,705 13,835 9,460 4,142 14,508 9,671 11,638 14,640 20,270 12,927 5,744 15,608 14,555 17,137 6,616 15,690 12,804 -
Prepared by Nisga'a Fisheries Page 1 of 2
Nass Weekly Fishwheel Cum Catches, 1992-2017 6/19/2017
Steelhead (all FWs)
Week Ending (Sat) Stat wk 2000 2001 2002 2003 2004 2005 2006 2007 2008 2009 2010 2011 2012 2013 2014 2015 2016 00
-16
Cum
M
ean
201727-May 21 0 0 0 2 1 1 1
3-Jun 22 3 0 6 2 3 9 1 3 210-Jun 23 6 1 2 2 0 5 0 8 0 11 6 8 21 3 5 617-Jun 24 1 9 0 2 5 2 0 6 9 10 0 11 7 8 21 4 6 724-Jun 25 2 10 0 0 2 8 6 2 6 12 11 0 14 7 10 23 4 7
1-Jul 26 2 10 2 1 3 8 6 3 6 12 11 0 18 7 11 24 8 8 8-Jul 27 4 10 6 1 3 9 6 6 6 12 11 0 18 7 14 38 15 10
15-Jul 28 9 12 8 2 3 11 7 7 8 12 12 2 19 7 20 41 22 12 22-Jul 29 18 14 14 10 9 19 11 7 26 15 24 47 27 26 62 85 152 33 29-Jul 30 32 42 67 50 40 40 25 13 81 29 55 229 77 51 122 191 400 91 5-Aug 31 195 132 242 125 104 90 66 57 163 126 126 1110 199 139 324 279 521 235
12-Aug 32 399 370 286 250 295 141 128 156 213 435 327 1850 555 206 443 461 717 425 19-Aug 33 533 552 634 359 383 168 243 272 370 740 548 2329 854 353 819 624 894 628 26-Aug 34 608 677 662 500 569 591 375 456 534 1136 753 3047 1134 488 1223 714 977 850
2-Sep 35 979 1098 830 583 630 687 466 607 847 1571 869 5186 1430 589 1417 778 1070 1,155 9-Sep 36 1130 1417 655 699 466 732 851 1688 1097 5472 1525 612 1472 778 1070 1,311
16-Sep 37 1210 655 721 466 780 851 1688 1183 5744 778 1070 1,377 23-Sep 38 1476 781 1688 1191 778 1,183
1,476 1,417 830 583 655 721 466 781 851 1,688 1,191 5,744 1,525 612 1,472 778 1,070 1,286 7
Pinks (all FWs)
Week Ending (Sat) Stat wk 2000 2001 2002 2003 2004 2005 2006 2007 2008 2009 2010 2011 2012 2013 2014 2015 2016 M
EAN
OD
D Y
R
(93-
15)
201727-May 21 - - - - - - -
3-Jun 22 - - - - - - - - - 10-Jun 23 - - - - - - - - - - - - - - - - 17-Jun 24 - - - - - - - - - - - - - - - - - - 24-Jun 25 - - - - - - - - - - - - - - - 28 - 3
1-Jul 26 - 1 - 4 4 14 1 - 1 6 1 - - 27 - 137 19 17 8-Jul 27 - 13 4 139 32 63 5 1 7 22 4 2 - 220 16 552 99 98
15-Jul 28 41 78 53 2,188 352 1,097 42 1 104 262 21 68 1 787 106 882 684 534 22-Jul 29 151 209 196 10,580 2,017 5,245 182 132 1,539 2,723 66 572 46 4,742 1,885 1,998 3,052 2,541 29-Jul 30 261 5,888 1,359 21,147 7,962 9,492 728 3,009 4,336 5,248 269 2,698 595 9,317 5,294 3,878 7,790 5,984 5-Aug 31 3,215 15,089 6,021 26,235 16,794 14,029 1,603 8,639 7,934 18,875 697 6,652 2,001 16,931 9,576 5,016 9,977 11,062
12-Aug 32 7,135 22,620 8,540 29,255 30,750 16,161 2,053 14,380 9,391 31,635 2,731 8,307 4,834 20,641 11,555 5,980 11,823 15,242 19-Aug 33 8,661 26,897 12,820 31,384 33,765 17,261 2,563 16,122 10,004 36,023 3,789 8,773 6,452 23,064 16,333 6,361 12,653 17,645 26-Aug 34 9,194 29,166 13,227 33,118 35,277 19,371 2,738 17,213 11,390 40,419 4,218 9,047 7,201 24,280 21,023 6,457 12,975 19,525
2-Sep 35 10,090 35,803 15,415 33,560 35,538 19,676 2,817 17,495 11,632 41,769 4,384 10,226 7,599 24,703 23,361 6,476 13,197 20,930 9-Sep 36 10,173 42,315 15,893 33,560 35,605 19,762 2,817 17,655 11,644 42,120 4,534 10,325 7,694 24,801 24,038 6,476 13,197 21,799
16-Sep 37 10,205 42,508 15,893 33,560 35,605 19,788 2,817 17,669 11,644 42,120 4,556 10,595 6,476 13,197 21,646 23-Sep 38 10,205 42,508 15,893 33,560 35,605 19,788 2,817 17,669 11,644 42,120 4,556 6,476 22,874
10,205 42,508 15,893 33,560 35,605 19,788 2,817 17,669 11,644 42,120 4,556 10,595 7,694 24,801 24,038 6,476 13,197 24,964 -
Chum (all FWs)
Week Ending (Sat) Stat wk 2000 2001 2002 2003 2004 2005 2006 2007 2008 2009 2010 2011 2012 2013 2014 2015 2016 00
-16
Cum
M
ean
201727-May 21 0 0 0 0 0 0
3-Jun 22 0 0 0 0 0 0 0 010-Jun 23 0 0 0 0 0 0 0 0 0 0 0 0 0 0 0 017-Jun 24 0 0 0 0 0 0 0 0 0 0 0 0 0 0 1 0 0 024-Jun 25 0 0 0 0 0 0 0 0 0 0 1 0 0 0 0 3 0 0
1-Jul 26 0 0 2 0 0 0 1 0 0 1 1 0 1 1 0 3 0 18-Jul 27 0 0 5 1 0 0 1 0 1 1 1 2 1 1 2 5 0 1
15-Jul 28 1 3 6 4 0 1 2 0 9 1 2 4 2 3 2 5 1 322-Jul 29 2 6 8 18 0 13 5 0 15 8 6 8 3 7 10 12 19 829-Jul 30 3 14 13 42 0 32 12 13 21 11 14 20 13 16 13 24 40 185-Aug 31 17 26 16 75 0 70 34 32 24 16 18 47 15 31 25 32 57 31
12-Aug 32 35 52 20 93 1 76 49 72 28 36 33 64 33 50 31 60 112 5019-Aug 33 63 77 34 109 6 81 89 81 31 50 45 75 55 75 44 103 140 6826-Aug 34 70 92 35 157 14 121 117 101 37 77 58 85 80 100 60 130 159 88
2-Sep 35 178 115 45 175 36 138 139 115 52 97 64 140 99 131 78 141 228 1169-Sep 36 219 157 54 175 79 142 139 126 52 108 67 143 106 147 83 141 228 127
16-Sep 37 241 162 54 175 100 144 139 136 52 108 72 165 160 141 228 13823-Sep 38 241 136 72
Grand Total 241 162 54 175 100 144 139 136 52 108 72 165 106 160 83 141 228 138 0
Prepared by Nisga'a Fisheries Page 2 of 2