Embed Size (px)
Citation preview
Universität Bayreuth
Lehrstuhl Didaktik der Biologie
Natur- und Umweltschutzbewusstsein:
Dimensionalität und Validität beim Messen
von Einstellungen und Verhalten
Dissertation
zur Erlangung des Grades
- Dr. rer. nat. -
der Fakultät für Biologie, Chemie und Geowissenschaften
an der Universität Bayreuth
vorgelegt von
Dipl.-Biol. und Dipl.-Psych.
Britta Oerke
2007
Diese Arbeit wurde von Oktober 2004 bis September 2007 am Lehrstuhl für Didaktik der
Biologie an der Universität Bayreuth unter der Leitung von Prof. Dr. Franz X. Bogner
angefertigt.
Vollständiger Abdruck der von der Fakultät für Biologie, Chemie und Geowissenschaften der
Universität Bayreuth genehmigten Dissertation zur Erlangung des akademischen Grades
Doktor der Naturwissenschaften (Dr. rer. nat.).
Tag der Einreichung: 24. Oktober 2007
Tag der mündlichen Prüfung: 18. Februar 2008
Erster Gutachter: Prof. Dr. Franz X. Bogner
Zweiter Gutachter: Prof. Dr. Ludwig Haag
Prüfungsvorsitz: Prof. Dr. Ingolf Steffan-Dewenter
Danksagung
Ich möchte mich an dieser Stelle bei allen bedanken, die zum Gelingen dieser Arbeit
beigetragen haben.
Herrn Prof. Dr. Bogner danke ich für die gute Betreuung während meiner Promotion, für
seinen Optimismus, die Anleitung zum selbstständigen wissenschaftlichen Arbeiten und seine
Verfügbarkeit für Fragen auch während Auslandsaufenthalten.
Prof. Dr. Florian Kaiser danke ich für die gute und freundliche Zusammenarbeit, viele nütz-
liche Anregungen und dafür, dass er für inhaltliche Diskussionen stets ein offenes Ohr hatte.
Ferner bedanke ich mich bei Sabine Hübner, Christine Geier und allen anderen Mitarbeitern
des Lehrstuhls Didaktik der Biologie für Ratschläge und Hilfestellungen. Mein besonderer
Dank gilt dabei Dr. Franz-Josef Scharfenberg für die Geduld und Kompetenz, mit der er stets
auf inhaltliche und methodische Fragen eingegangen ist.
Nicht zuletzt möchte ich mich bei allen Schüler/innen und Studierenden, die an meinen
Untersuchungen teilgenommen haben, für ihr Mitwirken bedanken. Ganz besonders danke ich
auch allen Lehrern und Lehrerinnen, die ihre knappe Zeit geopfert haben, um mich bei
meinen Untersuchungen zu unterstützen.
Das Projekt BIOHEAD-Citizen (Biology, Health and Environmental Education for better
Citizenship) stellte für diese Arbeit die finanziellen Mittel zur Verfügung.
Für ihren Beistand in der letzten Phase der Arbeit (Korrekturlesen) bedanke ich mich
außerdem bei meiner Schwester Kristina. Mein besonderer Dank gilt meinem Freund Kai für
seine liebevolle und kulinarische Unterstützung und meinen Eltern für ihre Geduld und dafür,
dass sie immer an mich geglaubt haben.
Inhaltsverzeichnis
1. Summary…………………………………………………………………………...
2. Zusammenfassung………………………………………………………………....
3. Ausführliche Zusammenfassung………………………………………….……....
3.1 Einleitung: Ziele und Konzepte der Umweltbildung und deren Evaluation...……...
3.2 Das EU-Projekt Biohead-Citizen: Analyse von Lehrereinstellungen……………....
3.3 Theoretische Grundlagen……...……………………………………………….…...
3.3.1 Messen von Umwelteinstellungen………………………………………………….
3.3.2 Einflussfaktoren auf Umwelteinstellungen………………………………………....
3.3.3 Messen von Umweltverhalten ……………………………………………………...
3.3.4 Messen von sozialer Erwünschtheit………………………………………………...
3.4 Fragestellungen und Ziele der Studien……………………………………………...
3.5 Ergebnisse und Diskussion………………………………………………………….
3.5.1 Dimensionalität von Umwelteinstellungen (Teilarbeit A) …………………………
3.5.2 Differenzierung der Faktoren Preservation und Utilisation durch Unterrichtsfach,
Alter und Geschlecht………………………………………………………………..
3.5.3 Dimensionalität von Umweltverhalten (Teilarbeit B) ……………………………...
3.5.4 Allgemeines Umweltverhalten als verhaltensbasierte Einstellung…………………
3.5.5 Einflussfaktoren auf sozial erwünschtes Antworten (Teilarbeit C)…
3.5.6 Einfluss sozialer Erwünschtheit auf Umwelteinstellungen und -verhalten…………
3.6 Allgemeine Diskussion und Ausblick………....……………………………………
4. Literaturverzeichnis der Zusammenfassung…………………………………….
5. Liste der Publikationen…………………………………………………………....
6. Darstellung des Eigenanteils……………………………………………………...
7. Teilarbeiten………………………………………………………………………...
7.1 Teilarbeit A…………………………………………………………………………
7.2 Teilarbeit B………………………………………………………………………….
7.3 Teilarbeit C………………………………………………………………………….
Anhang……………………………………………………………………………..
1
2
3
3
4
6
6
9
11
13
15
17
17
19
22
23
25
26
29
32
40
41
42
42
69
80
115
1. Summary
1
1. Summary
In this study, two existing measures for environmental attitude (1) and behaviour (2)
were devolved to new target groups (pupils and teachers, respectively) and validated.
Since in the past, similar concepts were measured with different numbers of subscales,
clarifying the dimensionality of the analysed scales was an important aim of the studies.
1. In the frame of the EU-project BIOHEAD-Citizen, the two scales Utilisation and
Preservation of the 2-factor model of environmental values (2-MEV) from Bogner and
Wiseman (2006) being explicitly addressed to adolescents, were applied to the new
target group of adults. Both factors were confirmed. However, in the adult sample, a
smaller amount of variance was explained compared to previous studies with pupils’
samples. Both factors were differentiated by the socio-demographic variables gender,
age and education, especially subject matter (biology versus language).
2. Based on the General Ecological Behaviour (GEB) scale developed for adults by
Kaiser and Wilson (Kaiser, 1998; Kaiser and Wilson, 2004), an appropriate scale for
adolescents was calibrated. It was shown that environmental behaviour can be represen-
ted by one dimension, though in earlier studies different types of behaviour were distin-
guished. The content validity of the new scale for adolescents and traditional measures
was revealed by developing four behaviour type measures based on the same items used
in the one-dimensional scale. The frequently discussed attitude-behaviour gap was not
approved. The conception of attitude as behaviour disposition and the concept of the
scale as behaviour-based environmental attitude were supported by a good deal of
variance explained by the two attitude scales Preservation and Utilisation.
3. Last but not least, the potential influence of social desirability responding on validity
was tested for both measures. Behaviour scores as well as Preservation scores were
slightly overestimated because of social desirability impact. Utilisation scores were not
affected by social desirability. Likewise, the prediction of the behaviour scores by
means of the two attitude scores was hardly impaired.
4. Both measures capture environmental attitudes on different levels. Whereas there is a
high correlation between Preservation and behaviour based attitude, the impact of
Utilisation on environmental behaviour still has to be surveyed.
2. Zusammenfassung
2
2. Zusammenfassung
In dieser Arbeit wurden zwei bestehende Maße für Umwelteinstellungen (1) und -ver-
halten (2) auf neue Zielgruppen (Schüler/innen bzw. Lehrer/innen) übertragen und vali-
diert. Da in der Vergangenheit ähnliche Konzepte mit unterschiedlichen Subskalen er-
fasst wurden, stand bei der Validierung die Dimensionalität der Skalen im Vordergrund.
1. Im Rahmen des EU-Projekts BIOHEAD-Citizen wurden die für Jugendliche ent-
wickelten Skalen Utilisation und Preservation aus dem Zwei-Werte-Modell der Um-
welteinstellung von Bogner und Wiseman (2006) erstmals auf Erwachsene übertragen.
Die beiden Faktoren des Modells ließen sich erfolgreich replizieren, obwohl ein Verlust
an Varianzaufklärung gegenüber den Schülerstudien zu verzeichnen war. Die beiden
Faktoren wurden anhand des Geschlechts, des Alters und der Ausbildung, insbesondere
des Unterrichtsfachs (Biologie versus Deutsch), differenziert.
2. Auf Basis der für Erwachsene entwickelten Skala Allgemeinen Ökologischen Verhal-
tens von Kaiser und Kollegen (Kaiser, 1998; Kaiser und Wilson, 2004) wurde eine ent-
sprechende Skala für Jugendliche kalibriert. Dabei wurde gezeigt, dass Umweltverhal-
ten auf einer Dimension abgebildet werden kann, obwohl in früheren Untersuchungen
verschiedene Verhaltenstypen unterschieden wurden. Die inhaltliche Vergleichbarkeit
der neuen Skala für Jugendliche mit traditionellen Maßen wurde durch Entwicklung von
vier Verhaltenstypen gezeigt, die auf Basis derselben Items wie in der eindimensionalen
Skala entwickelt wurden. Die in der Forschungsliteratur oft berichtete „Kluft“ zwischen
Einstellung und Verhalten wurde nicht bestätigt. Eine hohe Varianzaufklärung durch die
Einstellungsskalen Preservation und Utilisation unterstützt eine Konzeption von Einstel-
lung als Verhaltensdisposition bzw. das Konzept der Skala als verhaltensbasiertes
Einstellungsmaß.
3. Schließlich wurde die potentielle Beeinträchtigung der Validität beider Maße durch
soziale Erwünschtheit untersucht. Sowohl die Werte der Verhaltens- als auch der Ein-
stellungsskala Preservation wurden aufgrund sozial erwünschten Antwortens etwas zu
hoch eingeschätzt. Die Utilisation-Werte wurden nicht beeinflusst, und auch die Vor-
hersage der Verhaltens- aus den Einstellungswerten wurde kaum beeinträchtigt.
4. Beide Messinstrumente erfassen Umwelteinstellungen auf verschiedenen Ebenen.
Während zwischen Preservation und dem Verhaltensmaß ein hoher Zusammenhang
besteht, muss der Einfluss von Utilisation auf Verhalten noch näher untersucht werden.
3. Ausführliche Zusammenfassung
3
3. Ausführliche Zusammenfassung
3.1 Einleitung: Ziele und Konzepte der Umweltbildung und deren Evaluation
In den Lehrplänen für Biologie nimmt die Umweltbildung schon lange einen wichtigen
Platz ein. Während zunächst die Vermittlung rein fachlicher Kenntnisse im
Vordergrund stand, wurde in den 1980er und 1990er Jahren die affektive Komponente
der Umweltbildung immer stärker betont, mit dem Ziel, bei den Schüler/innen eine
positive, wertschätzende Beziehung zur Natur zu entwickeln und ethische Überlegungen
anzuregen (vertreten z. B. durch Cornell, 1979; Göpfert, 1994). Die „Wertschätzung
einer intakten Natur“ (KMK, 2005, S. 12) und das ethische Beurteilen von
menschlichen Eingriffen in Ökosysteme wird auch in den geltenden Bildungsstandards
für das Fach Biologie als Thema der zu erreichenden Bewertungskompetenz angeführt.
Eine positive, wertschätzende Einstellung zur Umwelt, unterstützt durch bewusstes
Naturerleben und -wahrnehmen, soll gleichzeitig zum Interesse an der Umwelt und zu
verantwortungsvollem Handeln motivieren (z. B. Göpfert, 1994).
Andere Ansätze fordern ein stärker problemorientiertes, interdisziplinäres Vorgehen,
um der Komplexität der heutigen Umweltprobleme gerecht zu werden. Im sozio-
ökologischen Ansatz (z. B. Kyburz-Graber, 1997, 2004) beispielsweise werden
insbesondere die sozialen und wirtschaftlichen Handlungssysteme mit einbezogen,
innerhalb derer Umweltprobleme auftreten.
Die längerfristigen Effekte der verschiedenen Konzepte und Maßnahmen in der
Umweltbildung sind jedoch umstritten (Leeming, Dwyer, Porter und Cobern, 1993; de
Haan et al., 1997), sofern sie überhaupt überprüft wurden. Hungerford und Volk (1990)
kamen zu dem Schluss, dass die Umweltbildung, gemessen an der gegenwärtigen
Umweltzerstörung, nur geringe Erfolge vorzuweisen habe: „We seem to be losing the
battle for the environment“ (S. 15). Auch wurde vielfach in Frage gestellt, ob überhaupt
ein Kausalzusammenhang zwischen Umwelteinstellung und Umwelthandeln existiert
(z. B. Vining und Ebreo, 2002; Hines, Hungerford und Tomera, 1987). Oft wird sogar
von einer „Kluft“ zwischen beiden gesprochen (z. B. Diekmann und Preisendörfer,
1992).
Der Zusammenhang zwischen Umwelteinstellungen und Umweltverhalten sowie der
Erfolg einzelner Konzepte der Umweltbildung können jedoch nur unter Einsatz valider
3.1 Einleitung: Ziele und Konzepte der Umweltbildung und deren Evaluation
4
Messinstrumente sinnvoll evaluiert werden (Bogner und Wiseman, 2006; Leeming et
al., 1993). Diese müssen an die einzelnen Zielgruppen der Evaluation angepasst werden.
Dazu zählen auf der einen Seite die Schüler/innen als Teilnehmer, und andererseits die
Lehrer/innen und außerschulischen Umwelterzieher als Handelnde der Umwelterzie-
hung. Die Letzteren dienen selbst als Vorbilder für einen wertschätzenden Umgang mit
der Natur und für umweltgerechtes Handeln (siehe z. B. Hungerford und Volk, 1990).
Ihre Einstellungen wirken sich mit hoher Wahrscheinlichkeit auf ihre Motivation im
Unterricht und ihre Fähigkeit aus, Schüler für Fragen des Umweltschutzes zu
interessieren (z. B. Legault und Pelletier, 2000).
Ziel meiner Doktorarbeit war die Weiterentwicklung zweier Messinstrumente der Um-
welteinstellungen (Bogner und Wiseman, 2006) bzw. des Umweltverhaltens (Kaiser
und Wilson, 2004) für neue Zielgruppen (Lehrer/innen, Lehramtsstudierende, bzw.
Schüler/innen). Dabei lag ein Schwerpunkt auf der Überprüfung der Dimensionalität der
Skalen und der gemessenen Konstrukte, um deren valide und gleichzeitig ökonomische
Erfassung zu gewährleisten. Gleichzeitig sollte der fragliche Zusammenhang zwischen
Einstellung und Verhalten neu bewertet und ein alternatives Konzept von
verhaltensbasierter Umwelteinstellung entwickelt werden. Schließlich sollte die
Beeinträchtigung der Validität der beiden Skalen durch sozial erwünschtes Antworten
überprüft werden.
Zu diesem Zweck wurden drei empirischen Studien durchgeführt (siehe 3.4: Teilstudien
A, B und C). Die erste Studie, in der die Umwelteinstellungen von deutschen Lehrer-
/innen und Lehramtsstudierenden analysiert wurden, stellte eine Teiluntersuchung des
EU-Projekts BIOHEAD-Citizen dar. Das Projekt wird im Folgenden vorgestellt.
3.2 Das EU-Projekt BIOHEAD-Citizen: Analyse von Lehrereinstellungen
Ziel des EU-Projekts BIOHEAD-Citizen (Biology, Health and Environmental
Education for better Citizenship1), in dessen Rahmen die Teilarbeit A meiner Doktor-
arbeit durchgeführt wurde, war die Analyse von ausgewählten Konzepten und Wertvor-
stellungen im Unterrichtsfach Biologie. Die Teilnahme von Partnern aus 16 verschiede-
nen europäischen Staaten und Drittländern (siehe Anhang A.2) ermöglichte einen
1 Die Idee der Bildung for better Citizenship bezeichnet in diesem Fall eine Erziehung, die Schülerinnen und Schüler zu selbständigem, sozial und moralisch verantwortlichem Handeln als aktive Mitglieder der Gesellschaft befähigt. Als wichtige Voraussetzung dafür gilt ein bewusster und kritischer Umgang mit den Werten unserer Gesellschaft.
3.2 Das EU-Projekt BIOHEAD-Citizen: Analyse von Lehrereinstellungen
5
Vergleich unterschiedlicher Kulturräume (siehe Schwartz, 1997), repräsentiert durch
unterschiedliche Staatengruppen. Der inhaltliche Schwerpunkt lag unter anderem auf
der Umweltbildung und Gesundheitserziehung.
Die Intention des Projekts bestand in der Erfassung eines Ist-Zustandes des Unterrichts
auf allen Ebenen. Als Leitgedanke diente das sozialpsychologische Konzept der
sozialen Repräsentationen, also der von den Mitgliedern einer sozialen Gruppe geteilten
Vorstellungen (Moscovici, 1984). Das Konzept impliziert, dass Wissen nicht individuell
erworben, sondern sozial konstruiert wird und somit in Abhängigkeit von den sozialen
Strukturen einer Gemeinschaft variiert. Auch Umweltbewusstsein kann als individuelle
soziale Repräsentation verstanden (Fuhrer, 1995) und von der Zugehörigkeit zu
bestimmten sozialen Gruppen (z. B. Geschlecht oder Beruf) beeinflusst werden (siehe
3.3.2). Untersucht werden sollte, inwieweit die zu unterrichtenden wissenschaftlichen
Inhalte der Biologie mit sozialen Repräsentationen von Lehrer/innen und Lehramtsstu-
dierenden interagieren. Die sozialen Repräsentationen kommen im Prozess der didakti-
schen Transposition zum Tragen, also der Anpassung der Fachinhalte an den
Schulunterricht (Chevallard, 1985). Diese umfasst sowohl die Auswahl und Reihung
der Inhalte, als auch deren Reduktion und Anpassung an die kognitive Struktur des
Kindes und an den Kontext.
Zur Erfassung der Konzepte und Einstellungen wurden Fragebögen entwickelt, in die
jeweiligen Landessprachen übersetzt und, nach einem speziellen Vortest, in einer Unter-
suchung mit insgesamt gut 6800 Probanden eingesetzt. Jede Teilnehmergruppe befragte
mindestens 300 Lehrer/innen und Lehramtsstudierende, darunter mindestens 100 Fach-
kräfte für das Fach Biologie und mindestens 100 Fachkräfte für das Fach (Mutter-)Spra-
che2.
Aufgrund des erfassten Ist-Zustandes sollten Mängel und Probleme aufgezeigt und
sowohl im Bildungs- als auch im Forschungsbereich kommuniziert werden. Erste
Ergebnisse wurden auf der 7th biannial conference of Environmental Psychology (EP
2007) und auf einer themenspezifischen Tagung der International Organisation of
Science and Technology Education (IOSTE 2007) vorgestellt. Nach weiterführenden
Auswertungen sollen in einem Folgeprojekt didaktische Vorschläge für eine langfristige
Verbesserung des Unterrichts entwickelt werden.
2 Das Fach Sprache wurde ausgewählt, um eine Vergleichsgruppe zu erhalten, die nicht für den Biologie-unterricht ausgebildet wurde.
3.3.1 Theoretische Grundlagen: Messen von Umwelteinstellungen
6
In meiner Arbeit werden die Ergebnisse für einen Teilbereich der Umweltbildung, die
Umwelteinstellungen der Lehrer/innen und Lehramtsstudierenden, insbesondere der
deutschen Teilstichprobe vorgestellt (siehe Teilarbeit A). Entsprechende Ergebnisse der
internationalen Stichprobe, dargestellt im Anhang (Anhang, A.2), werden ebenfalls kurz
diskutiert.
3.3 Theoretische Grundlagen
3.3.1 Messen von Umwelteinstellungen
Als Umwelteinstellung eines Menschen definieren Schultz, Shriver, Tabanico und
Khazian (2004, S. 31) „the collection of beliefs, affect, and behavioural intentions a
person holds regarding environmentally related activities or issues“. Dieses Konzept
entspricht dem traditionellen Drei-Komponenten-Modell der Einstellung als Bewer-
tungstendenz gegenüber einem Objekt oder einer Situation mit einem kognitiven
(Wissen, Überzeugungen), einem affektiven (Gefühle, Bewertungen) und einem
konativen (Handlungsintention/ Verhalten) Anteil (Eagly und Chaiken, 1993).
Zahllose Ansätze wurden entwickelt, um Umwelteinstellungen und verwandte Kon-
zepte3 zu messen. Sie variieren einerseits in der Auswahl der gemessenen Einstellungs-
komponenten, andererseits im Objekt der Einstellung (die Umwelt selbst, bestimmte
Aspekte der Umwelt oder Umweltverhalten). Der Vielzahl der Ansätze entspricht eine
Vielzahl an Skalen, die meist mit Hilfe von Faktorenanalysen entwickelt und evaluiert,
zum Großteil aber nicht ausreichend auf Reliabilität und Validität überprüft oder nicht
in Replikationsstudien bestätigt wurden (siehe hierzu z. B. Dunlap und Jones, 2003).
Zudem bestehen die einzelnen Fragebögen aus einer, je nach Messabsicht des Autors,
unterschiedlichen Anzahl von Subskalen mit unterschiedlicher Bedeutung. Beispielhaft
werden im Folgenden mehrere bekannte Messinstrumente vorgestellt, die ähnliche Kon-
zepte mit einer unterschiedlichen Anzahl an Subskalen erheben.
Die New Ecological Paradigm (NEP)- Skala von Dunlap, Van Liere, Mertig und Jones
(2000, entwickelt aus der NEP-Skala von Dunlap und Van Liere, 1978) misst eine
Weltsicht, welche die Grenzen des ökonomischen Wachstums und die Notwendigkeit 3 Ein oft zu Umwelteinstellung synonym verwendetes Konzept ist im Englischen z. B. „environmental concern“, von Schultz et al. (2004) definiert als, auf Überzeugungen über Umweltprobleme bezogener, Affekt. Concern beinhaltet also mehr oder weniger die affektive Komponente der Umwelteinstellungen.
3.3.1 Messen von Umwelteinstellungen
7
der Einschränkung menschlicher Eingriffe in die Natur betont, unter anderem durch
Bewahrung der natürlichen Umwelt oder Bevölkerungskontrolle. Ein niedriger NEP-
Wert entspricht automatisch einer utilitaristischen Sichtweise, welche die Fähigkeit und
das Recht des Menschen zur Ausbeutung und Kontrolle der natürlichen Ressourcen und
unbegrenztes Wachstum propagiert. Diese Skala ist somit eindimensional.
Gagnon-Thompson und Barton (1994) entwickelten ein Instrument, welches einer
gleichgültigen Haltung gegenüber der Umwelt (Apathie) zwei voneinander unabhängige
Motivationen für den Umweltschutz gegenüberstellte: zum einen eine Wertschätzung
der Natur um ihrer selbst willen (Ökozentrismus), zum anderen den Nutzen des
Umweltschutzes für den Menschen (Anthropozentrismus).
Stern, Dietz, Kalof und Guagnano (1995) sowie Schultz (2001) unterschieden ebenfalls
zwischen biospheric values (entsprechend der ökozentrischen Sichtweise) und anthro-
pocentric values. Die anthropozentrische Haltung wird jedoch in eine egoistische oder
utilitaristische und eine altruistische aufgeteilt, welche eine mögliche Schädigung
anderer Menschen durch einen eigenen wenig ökologischen Lebensstil berücksichtigt
(sozial-ökologisches Dilemma).
Bogner und Wilhelm (1996) führten, einem Ansatz von Blaikie (1992) folgend, Fakto-
renanalysen mit einer großen Zahl von Items aus bestehenden Messinstrumenten durch,
um vor allem für die Altersgruppe von Jugendlichen eine relevante Skala zu erlangen.
In einer Reihe von Studien mit Jugendlichen aus verschiedenen europäischen Stichpro-
ben (Bogner und Wilhelm, 1996; Bogner und Wiseman, 1997b, 1998, 2002) reduzierten
sie einen Satz von 70 Items auf eine Zahl von 19 Items, welche fünf Primärfaktoren
abbildeten. Das erklärte Ziel dieser Untersuchungen war, aus der Vielzahl an vorhande-
nen Skalen diejenigen Faktoren zu extrahieren, die eine den bisher gemessenen Einzel-
aspekten der ökologischen Sichtweise übergeordnete Gültigkeit besitzen. Die Analyse
von Primärfaktoren erwies sich mittelfristig jedoch als wenig fruchtbar, vor allem weil
die Ursprungsfragebögen der verwendeten Items zur Erfassung recht spezifischer Kon-
zepte, nicht übergeordneter Werthaltungen, konstruiert worden waren.
Wiseman und Bogner selbst (2003) kritisierten die Vielzahl der in der Forschung zu den
Umwelteinstellungen existierenden Ansätze unter Verweis auf ähnliche Probleme in der
Persönlichkeitspsychologie: „(…) at trait level, there are as many descriptions of
3.3.1 Messen von Umwelteinstellungen
8
personality as there are batteries, each assessing its own set of traits“ (Wiseman und
Bogner, 2003, S. 784).
In einem zweiten Schritt analysierten sie daher die übergeordnete Struktur der Faktoren
auf Grundlage nicht der Inter-Item-, sondern der Inter-Faktorkorrelationen (Bogner und
Wiseman, 1999; Wiseman und Bogner, 2003). Dabei fanden sie zwei voneinander weit-
gehend unabhängige Faktoren höherer Ordnung. Da diese „set[s] of closely related
attitudes“ darstellen (Bogner und Wiseman, 2006, S. 249), bezeichneten sie die
Faktoren zweiter Ordnung unter Bezug auf Rokeach (1968, 1973) im Folgenden als
Werte und ihr zweidimensionales Modell als Model of Ecological Values (2-MEV). Der
Faktor Preservation (P) oder Umweltschutz entspricht einer biozentrischen Sichtweise,
welche – basierend auf einer wertschätzenden Beziehung zur Natur – den Schutz der na-
türlichen Umwelt beinhaltet und der ökozentrischen Sichtweise von Gagnon-Thompson
und Barton (1994) ähnelt. Der Faktor Utilisation (U) oder Umweltnutzung entspricht da-
gegen einer Sichtweise, die, über eine anthropozentrische Begründung für den Umwelt-
schutz hinausgehend, den Menschen als der Natur übergeordnet betrachtet und sein
Recht auf die Ausbeutung der natürlichen Ressourcen reflektiert. Entsprechend der nur
geringen negativen Korrelation zwischen P und U (r = -.17, Wiseman und Bogner,
2003) erlaubt das Modell eine hohe Ausprägung beider Werte, die somit nicht als ge-
gensätzlich angesehen werden. In einer weiteren Untersuchung optimieren Bogner und
Wiseman (2006) beide Skalen für die Werte P und U, welche voneinander unabhängige
(orthogonale) Faktoren darstellen. Theoretische Unterstützung für das Modell findet
sich sowohl in existierenden Ansätzen für die Charakterisierung der Beziehung zwi-
schen Mensch und Natur (z. B. Harmony versus Mastery values, bipolar) als auch in der
Nachhaltigkeitsdebatte, die auf eine erhaltende Nutzung der Natur abzielt (Schwartz,
1994).
Alle Studien von Bogner und Kollegen wurden mit Jugendlichen durchgeführt und das
Instrument somit explizit für Jugendliche entwickelt. Milfont und Duckitt (2004) bestä-
tigten das 2-Komponenten-Modell mit einer Gruppe neuseeländischer Studenten, basie-
rend auf einer erweiterten Itemstichprobe. Abgesehen von dieser Arbeit liegen bislang
keine Belege für die Gültigkeit des zweidimensionalen Modells ökologischer Werte für
Erwachsene vor. Im Rahmen des Projekts BIOHEAD-Citizen (siehe 3.2) wurde nun
erstmals, anhand einer großen internationalen Stichprobe von Lehrer/innen und Lehr-
3.3.2 Einflussfaktoren auf Umwelteinstellungen
9
amtsstudierenden, die Struktur der Umwelteinstellungen Erwachsener mit Hilfe der
Skalen von Bogner und Wiseman (2006) untersucht.
3.3.2 Einflussfaktoren auf Umwelteinstellungen
Der Einfluss soziodemographischer Variablen auf Umwelteinstellungen wurde in den
vergangenen Jahrzehnten ausführlich analysiert. Diese Untersuchungen zielten darauf
ab, mehr über die Bedingungen der Entstehung unterschiedlicher Ausprägungen zu er-
fahren. Im Folgenden werden hauptsächlich die Variablen näher beleuchtet, die in der
Teilstudie A als Einflussfaktoren auf die Umwelteinstellung der deutschen Teilstichpro-
be des BIOHEAD-Projekts untersucht wurden: Alter, Geschlecht und (Aus-)Bildung.
In den 1970er und 1980er Jahren wurde mehrfach gezeigt, dass weibliche, junge,
gebildete und politisch liberale Menschen, die in der Stadt lebten, das höchste Umwelt-
bewusstsein besaßen (Lowe und Pinhey, 1982; Mohai und Twight, 1987, Van Liere und
Dunlap, 1980, 1981). Die Bedeutung einzelner Variablen veränderte sich jedoch mit zu-
nehmender Popularität des Umweltschutzgedankens in der Bevölkerung. So wurde der
negative Effekt des Alters mit der Zeit geringer oder war gar nicht mehr nachweisbar
(Howell und Laska, 1992, Stern, Dietz & Guagnano, 1995), während der positive Effekt
der Bildung an Bedeutung gewann (Howell und Laska, 1992, Olofsson und Öhman,
2006). Des Weiteren verlor sich der ausgeprägte Stadt/ Land-Unterschied (Bogner und
Wiseman, 1997a). Im Folgenden werden ausschließlich die Effekte von Alter,
Geschlecht und Bildung diskutiert.
Alter: Alterseffekte auf Einstellungen werden meist durch die größere Offenheit der
Jugend gegenüber neuen Ideen erklärt, bedingt durch deren geringere Integration in das
bestehende soziale System (Buttel, 1979; Glenn, 1974). Generelle, altersunabhängige
Veränderungen in der Bevölkerung, wie z. B. eine allgemeine Zunahme des Umweltbe-
wusstseins, sind so genannten Periodeneffekten zuzurechnen. Eine dritte Möglichkeit
stellen schließlich die Kohorteneffekte dar. Diese entstehen durch die für eine Genera-
tion typischen, prägenden historischen und ökonomischen Erfahrungen und Lebensbe-
dingungen und sind somit nicht vom absoluten Alter abhängig, sondern vom Geburts-
jahr (siehe z. B. Glenn, 2003). Alle drei Effekte sind oft miteinander konfundiert und in
Untersuchungen nur schwer zu trennen.
Aufgrund von Belegen gegen die propagierten Ursachen für den Effekt des Älterwer-
dens (Integration in bestehende Systeme) favorisierten Mohai und Twight (1987) jedoch
3.3.2 Einflussfaktoren auf Umwelteinstellungen
10
den Kohorteneffekt. Sie fanden mit zunehmendem Alter abnehmendes Umweltbewusst-
sein unabhängig von Einkommen und beruflichem Ansehen. Privates Engagement im
Umweltbereich war im mittleren Alter (40 – 45 Jahre) am stärksten ausgeprägt. Blaikie
(1992) vermutete aufgrund eigener Ergebnisse eine Überlappung eines Kohorteneffekts,
bedingt durch das Aufwachsen in einer Zeit des erwachenden Umweltbewusstseins in
den 1960er Jahren4, mit einem Effekt des Älterwerdens. Er fand ebenfalls die höchsten
Werte der Umwelteinstellungen (Ecological World View) im mittleren Alter (25 – 35,
bzw. bei den Frauen 35 – 44), während in der jüngsten Generation (jünger als 25) Pro-
bleme des ökonomischen Wachstums sogar geringer eingeschätzt wurden als in der
Gruppe der über 65-Jährigen. Ebenfalls geringere Werte bei den unter 25-Jährigen fan-
den Ewert und Baker (2001).
Geschlecht: In vielen Studien erhalten Frauen die höheren Werte der Umwelteinstellun-
gen. Stern, Dietz und Kalof (1993) führten dieses Phänomen auf ein höheres Bewusst-
sein für die negativen Konsequenzen der Umweltbelastungen zurück. In anderen Studi-
en wurden höhere Ausprägungen einer Wertschätzung aller Lebewesen identifiziert, ge-
messen als biospheric values (Stern, Dietz, Kalof und Guagnano, 1995) oder als der
Wert Preservation, verbunden mit niedrigeren Utilisation-Werten (Bogner und
Wiseman, 1999, 2002; Milfont und Duckitt, 2004). Nach Blocker und Eckberg (1989)
achten Frauen stärker auf eine mögliche Gefährdung der Gesundheit durch Umweltver-
schmutzung, weshalb die Globalität der jeweiligen Umweltprobleme und eine Eltern-
schaft der befragten Frauen und Männer wichtige Moderatorvariablen für die Größe des
Geschlechtseffekts darstellten. Auch das Alter kann einen Einfluss haben: Nach Blaikie
(1992) lagen die größten Geschlechtsunterschiede in der Gruppe der 35- bis 44-Jährigen
vor. In einigen Studien wirkte sich das Geschlecht dagegen gar nicht auf die Höhe der
Umwelteinstellungen aus (z. B. Scott und Willits, 1994, Van Liere und Dunlap, 1980).
Ausbildung/ Studienfach: Nur wenige Studien über den Einfluss des beruflichen Fach-
gebiets auf die Umwelteinstellung existieren. Ein höheres Umweltbewusstsein und ge-
ringere anthropozentrische Werte fanden Ewert und Baker (2001) für Studenten im Be-
4 Die Altersgruppe der 35-44-Jährigen (geboren in den 1950er Jahren) erlebte als junge Erwachsene die zunehmende Umweltverschmutzung und ein erwachendes Bewusstsein für die „Grenzen des Wachstums“ in den 1970ern. Die Altersgruppe der 24-34-Jährigen (geboren in den 1960er Jahren) erlebte den zweiten „Höhepunkt“ der Umweltbewegung in den 1980ern – mit der Gründung der Grünen in der BRD und aufkommenden neuen Problemen wie dem Waldsterben, Tschernobyl oder dem Ozonloch – als junge Erwachsene.
3.3.3 Messen von Umweltverhalten
11
reich der Umweltwissenschaften oder Biologie verglichen mit Studenten der Forstwis-
senschaften und nicht naturwissenschaftlichen Fächer. Ähnliches ergab der Vergleich
von Biologie- und Sozialkundelehrern (Pettus, Frary und Teates, 1978).
Generell sind jedoch die genannten Effekte soziodemographischer Variablen nicht über-
zubewerten, da sie meist eher schwach ausgeprägt sind, mit Korrelationen im Bereich
zwischen r = .10 und r = .25 und Mittelwertsunterschieden zwischen .20 und .30 (z. B.
Ewert und Baker, 2001; Howell und Laska, 1992; Mohai und Twight, 1987).
3.3.3 Messen von Umweltverhalten
„The ultimate aim of education is shaping human behavior“ (Hungerford und Volk,
1990, S. 8). Eine wertschätzende Einstellung gegenüber der Umwelt soll grundsätzlich
auch zum Handeln motivieren. Empirische Ergebnisse zeigen jedoch sehr unterschied-
liche Korrelationen zwischen Umwelteinstellung und -verhalten, die von schwach (z. B.
r ≤ .21 [Scott und Willits, 1994]) über mittel (z. B. r = .45 [Meinhold und Malkus,
2005]) bis stark (z. B. r = .62 [Weigel und Weigel, 1978]) variieren, was sich in
verschiedenen Metaanalysen in einer moderaten korrigierten Durchschnittskorrelation
ausdrückt (r = .35 [Hines et al., 1987], r = .42 [Bamberg und Möser, 2007]).
Tatsächlich wird die Inkonsistenz oder „Kluft“ zwischen Einstellung und Verhalten
(attitude-behaviour gap) von einigen Wissenschaftlern als „Pseudo-Gap“ bezeichnet, die
durch methodische Probleme erklärt werden kann (z. B. Campbell, 1963).
(1) Ein bekanntes Problem betrifft die mangelnde Messkorrespondenz. Die Konsistenz
zwischen Einstellung und Verhalten ist demnach umso geringer, je weniger die Maße in
ihrer Spezifität übereinstimmen (Ajzen und Fishbein, 1977). Ein generelles Maß der
Umwelteinstellungen (z. B. die NEP-Skala) ist somit meist ein besserer Prädiktor für
allgemeines Umweltverhalten, gemessen mit einer Vielzahl an Verhaltensweisen, als für
spezifisches Umweltverhalten, z. B. Recycling oder Energiesparen (siehe Newhouse,
1990, Diekmann und Preisendörfer, 2003).
(2) Die Ergebnisse von Faktorenanalysen unterstützen jedoch die Differenzierung
mehrerer Typen des Umweltverhaltens, die nur gering miteinander korrelieren. Beispie-
le findet man bei Diekmann und Preisendörfer (1998: Konsumverhalten, Recycling,
Energiesparen, Mobilität) oder bei Stern et al. (1999: Konsumverhalten, engagiertes
Bürgerverhalten, willingness to sacrifice economically). Die scheinbare Inkonsistenz,
3.3.3 Messen von Umweltverhalten
12
mit der Menschen einmal ökologisch korrekt handeln und ein anderes Mal nicht (z. B.
Granzin und Olsen, 1991), wird zum Teil durch die unterschiedlichen Kosten ökolo-
gischen Verhaltens in Form von Geld, Zeit, Verlust an Komfort oder Mühe erklärt,
welche verschiedene Handlungen somit unterschiedlich schwierig machen. Die Höhe
der Kosten eines bestimmten Verhaltens hängt auch von zahlreichen Situationsein-
flüssen ab, z. B. von finanziellen Anreizen für das Energiesparen oder von der Erreich-
barkeit von Recycling-Sammelcontainern. Unterstützende oder behindernde externe
Bedingungen können somit ebenfalls den Zusammenhang zwischen Einstellung und
Verhalten beeinflussen. Diekmann und Preisendörfer (1992, 1998) vertreten in ihrer
Low-Cost-Hypothese die Auffassung, dass ein bedeutsamer Einfluss der
Umwelteinstellung auf ökologisches Verhalten nur bei den „leichten“ Verhaltensweisen
(z. B. Recycling) vorliegt. Die „Kluft“ wäre somit in Abhängigkeit von der Schwierig-
keit des Verhaltens unterschiedlich groß.
Kaiser und Wilson (2004) sehen dagegen, unter Bezug auf Ferguson (1941), in dem
Problem der geringen Interkorrelation von unterschiedlich schwierigen Verhaltenswei-
sen ein statistisches Artefakt (siehe auch Bond und Fox, 2001). Die scheinbare Inkon-
sistenz des menschlichen Umwelthandelns erklären sie in ihrem Modell des goal-
directed behaviour damit, dass dasselbe Verhalten unterschiedlich motiviert sein kann,
was aber zunächst von außen nicht ersichtlich ist: Jemand kann mit dem Fahrrad fahren,
um die Umwelt zu schützen, genauso denkbar sei aber die Absicht, Geld zu sparen oder
etwas für die eigene Gesundheit zu tun. Durch das Betrachten einer Vielzahl umwelt-
freundlicher Verhaltensweisen werde die generelle Einstellung einer Person deutlicher:
Je mehr Unannehmlichkeiten jemand in Kauf nimmt, um die Umwelt zu schützen, umso
wichtiger wird ihm dieses Ziel auch sein.
Kaiser und Wilson (2004) schlagen daher ein probabilistisches Messmodell vor, in dem
den Menschen die Möglichkeit zugestanden wird, zwischen mehreren Handlungen zu
wählen, beispielsweise statt eine energiesparende Waschmaschine anzuschaffen, auf
einen Wäschetrockner zu verzichten. Da im Allgemeinen die „kostengünstigeren“
Handlungen bevorzugt werden, sollte die Schwierigkeit eines bestimmten Verhaltens in
dessen Gesamtpopularität zum Ausdruck kommen, d. h. in der relativen Anzahl an Per-
sonen, die entsprechend handeln.
Diese Gesamtpopularität oder Wahrscheinlichkeit für das Ausführen eines bestimmten
Verhaltens, wird im Folgenden als Funktion der Differenz zweier Komponenten be-
3.3.4 Messen von sozialer Erwünschtheit
13
trachtet: (a) der Verhaltensdisposition der jeweiligen Personen und (b) der Gesamtheit
aller (materiellen, physischen oder sozialen) Kosten, die durch das Verhalten entstehen.
Diese Beziehung wird mathematisch im Rasch-Modell ausgedrückt, einem Modell
innerhalb der probabilistischen Testtheorie (Item Response Theorie).
Kaiser und Kollegen (Kaiser, 1998; Kaiser und Wilson, 2004) kalibrierten auf Basis des
Rasch-Modells eine Skala Allgemeinen Ökologischen Verhaltens von Erwachsenen
(GEB: General Ecological Behavior). Da die Schwierigkeit der einzelnen Items syste-
matisch in die Berechnung der Personenwerte einbezogen wird, können die erfragten
Verhaltensweisen auf nur einer Dimension abgebildet werden, obwohl sie aus verschie-
denen Verhaltensdomänen stammen. Dabei konnten Kaiser und Wilson (2004) zeigen,
dass die Daten mit einem ökonomischen eindimensionalen Modell mit einer ähnlichen
Präzision vorhergesagt werden können wie mit einem mehrdimensionalen Modell, in
dem für jede Verhaltensdomäne ein eigener Wert berechnet wird. Ein vergleichbares
Verhaltensmaß für Kinder ist nicht bekannt.
(3) Wie viele Messinstrumente zum Umweltverhalten, stützt sich die GEB-Skala von
Kaiser und Kollegen (Kaiser, 1998; Kaiser und Wilson, 2004) auf selbst berichtetes
Verhalten, da nur auf diese Weise eine große Anzahl verschiedener Verhaltensweisen
erfasst werden kann. Dies bringt jedoch ein weiteres methodisches Problem mit sich:
selbst berichtetes Umweltverhalten kann anfällig sein für systematische Messfehler, vor
allem die soziale Erwünschtheit.
3.3.4 Messen von sozialer Erwünschtheit
Sozial erwünschtes Antworten (SE) beschreibt die Tendenz, „entsprechend der
Erwartung zu reagieren, dass die Art der Reaktion die Zustimmung einer sozialen
Gruppe findet“ (Mummendey, 1981, S. 199). Nicht nur beim Messen von Umweltver-
halten, sondern auch von Umwelteinstellungen wird ein Effekt sozialer Erwünschtheit
vermutet, der als Suppressor-Variable die Korrelation beider Variablen miteinander
reduzieren könnte (z. B. Ewert und Baker, 2001; Scott und Willits, 1994). In diesem
Fall beinhaltet sozial erwünschtes Antworten, die eigene „ökologische Korrektheit“ zu
übertreiben, um damit sozialen Normen zu entsprechen.
Die Tendenz, sozial erwünscht zu antworten, wurde sowohl im Sinne eines situations-
übergreifenden Persönlichkeitsmerkmals (Response Style) untersucht, das mit Hilfe
3.3.4 Messen von sozialer Erwünschtheit
14
einer „Lügenskala“ gemessen werden kann, als auch im Sinne situations- und metho-
denabhängiger Response Sets (siehe z. B. Crowne und Marlow, 1964; Mummendey,
1981; Schmitt und Steyer, 1993). Wenngleich bei der Einschätzung der SE von Items
und Adjektiven (SE-Ratings) einerseits eine hohe gruppenübergreifende, interkulturelle
Beurteilerübereinstimmung gefunden wurde, konnten andererseits auch Unterschiede in
Abhängigkeit vom Untersuchungssetting und von den Eigenschaften der Beurteiler (z.
B. dem Alter, Geschlecht oder der Bildung) festgestellt werden.
Nederhof (1985; siehe auch Paulhus, 1991) gibt einen Überblick über die bekannten
Methoden, die Effekte sozialer Erwünschtheit zu kontrollieren. Dazu gehören bezüglich
sozialer Erwünschtheit ausbalancierte Antwortkombinationen (z. B. die Forced-Choice-
Technik) und eine Gestaltung der Rahmensituation, die den Probanden entweder
Anonymität zusichert oder ihnen vorgaukelt, Unehrlichkeit ihrerseits könne entlarvt
werden. Diese Methoden sind jedoch aus Aufwands- oder ethischen Gründen (vor allem
in Schüleruntersuchungen) nicht immer einsetzbar. Daher kann auch die Verwendung
spezieller Kontrollskalen oder die Identifizierung besonders sozial erwünschter Items
mithilfe von SE-Ratings sinnvoll sein.
Auf der Item-Ebene wurde ein recht hoher Einfluss sozialer Erwünschtheit auf Umwelt-
einstellungen gefunden (25 – 30% Aufklärung der Varianz der Itemmittelwerte durch
SE-Expertenratings [Schahn, 2002]). Mithilfe von so genannten „Lügenskalen“ wurden
kleine und eher inkonsistente Effekte der sozialen Erwünschtheit auf Umwelteinstellun-
gen und –verhalten beobachtet (z. B. Wiseman und Bogner, 2003; Kaiser, 1998; Kaiser,
Wölfing und Fuhrer, 1999). Über den Einfluss der sozialen Erwünschtheit auf das
Umweltverhalten von Kindern ist bisher nichts bekannt.
Auch wurden nur wenige SE-Skalen systematisch für Kinder entwickelt. Dazu gehören
die aus 48 Items bestehende Children’s Social Desirability Scale (CSD, Crandall,
Crandall und Katkovsky, 1965) und die Lügenskala der Revidierten Manifesten Angst-
skala für Kinder (Boehnke, Silbereisen, Reynolds und Richmond, 1986), welche aus
neun Items besteht. Ein bekanntes Instrument für Erwachsene von Crowne und
Marlowe (1960) unterscheidet einerseits die Tendenz zur (unbewussten) Selbsttäu-
schung (Self-deceptive Enhancement) und andererseits die Tendenz zur (bewussten)
Fremdtäuschung (Impression Management), wobei die letztere eher der klassischen
Lügenskala entspricht. Eine Skala für Kinder, die beide Aspekte der sozialen
Erwünschtheit misst, ist nicht bekannt.
3.4 Fragestellungen und Ziele der Studien
15
3.4 Fragestellungen und Ziele der Studien
Das erklärte Ziel meiner Doktorarbeit war die Spezifizierung und Weiterentwicklung
valider Messinstrumente. Ein besonderes Augenmerk lag dabei auf der Dimensionalität
der Skalen und auf ihrer Anfälligkeit für soziale Erwünschtheit. Zudem wurde ein
alternatives, verhaltensbasiertes Einstellungskonzept entwickelt, validiert und dem
traditionellen Einstellungskonzept gegenübergestellt.
Ziele der ersten Studie (Teilarbeit A)
Den Ausgangspunkt für die erste Untersuchung bildete das Messinstrument für die Um-
welteinstellungen von Schülern (Bogner und Wiseman, 2006; Wiseman und Bogner,
2003). Die bei Schülern gefundene zweidimensionale Struktur der Umwelteinstellungen
(2-MEV) wurde anhand einer adulten Stichprobe überprüft und dabei die beiden Fakto-
ren Preservation und Utilisation mittels des Zusammenhangs mit verschiedenen Ein-
flussvariablen differenziert. Hierfür wurden Lehrer/innen und Lehramtsstudierende aus
der deutschen Teilstichprobe des BIOHEAD-Citizen-Projekts ausgewählt.
1) Die Faktorenstruktur sollte mittels Faktorenanalyse mit dem auf 15 Items reduzier-
ten Fragebogen nach Bogner und Wiseman (2006) untersucht werden. Zu dieser
Frage werden im Anhang (A.2) auch ergänzende erste Ergebnisse der BIOHEAD-
Citizen-Gesamtstichprobe vorgestellt.
2) Die Untersuchung möglicher Einflussfaktoren auf die beiden Skalen P und U diente
einerseits dazu, die beiden Faktoren zu differenzieren. Andererseits sollten die Ein-
stellungen von Lehrkräften, welche in die Umweltbildung involviert sind, miteinan-
der verglichen werden. Ermittelt wurde der Zusammenhang mit dem Alter, dem Ge-
schlecht, dem Unterrichtsfach und dem Stadium der Ausbildung (Lehrer/in versus
Student/in).
Ziele der zweiten Studie (Teilarbeit B)
In der zweiten Studie wurden Schüler/innen untersucht. Auf Basis der Skala Allgemei-
nen Ökologischen Verhaltens für Erwachsene (GEB) (Kaiser, 1998, siehe 3.3.3) musste
eine entsprechende Skala für Jugendliche entwickelt werden, da viele Handlungen aus
der Originalskala auf Kinder nicht übertragbar waren (z. B. das Praktizieren eines öko-
logischen Fahrstils beim Autofahren). Die systematische Einbeziehung der Item-
3.4 Fragestellungen und Ziele der Studien
16
schwierigkeiten in der Rasch-Analyse ermöglichte es, die Überlegenheit eines mehr-
dimensionalen Modells gegenüber einem eindimensionalen Modell infrage zu stellen.
(1) Wie bei Kaiser und Wilson (2004) wurde daher die Vorhersagegüte eines eindimen-
sionalen Rasch-Modells mit der eines mehrdimensionalen Rasch-Modells
verglichen (siehe Teilarbeit B).
Weiterhin sollte gezeigt werden, dass das neue Messinstrument als Maß für Verhaltens-
disposition sowohl als Skala für allgemeines Umweltverhalten als auch als verhaltens-
basiertes Maß für die Umwelteinstellung dienen kann.
(2) Dafür wurde erstens die inhaltliche Vergleichbarkeit des allgemeinen Verhaltens-
maßes mit einem traditionellen Verhaltensmaß ermittelt. Das Letztere wurde mit
Faktorenanalysen aus demselben Itempool wie die eindimensionale Rasch-Skala
entwickelt und bestand aus mehreren Verhaltenstypen.
(3) Zweitens wurde die Eignung der Verhaltensskala als Maß für verhaltensbasierte
Umwelteinstellung durch Korrelation mit dem traditionellen Einstellungsmaß von
Bogner und Wiseman (2006) überprüft.
Die Idee einer alternativen, verhaltensbasierten Einstellungsskala setzt voraus, dass eine
in anderen Untersuchungen gefundene Einstellungs-Verhaltens-„Kluft“ methodisch
bedingt war und durch alternative Messkonzepte überwunden werden kann.
Ziele der dritten Studie (Teilarbeit C)
Das Thema der dritten Studie war die Beeinflussung der gemessenen Umweltein-
stellungs- und Umweltverhaltensmaße durch soziale Erwünschtheit. Die Untersuchung
wurde wiederum mit einer Schüler/innen-Stichprobe überprüft.
(1) Untersucht wurde der Zusammenhang zwischen der Lügenskala von Boehnke et al.
(1986) und den beiden Skalen zur Umwelteinstellung von Bogner und Wiseman
(2006) bzw. dem verhaltensbasierten Maß aus der Teilarbeit B (Kaiser, Oerke und
Bogner, 2007).
(2) Weiterhin wurde überprüft, ob die Vorhersage des verhaltensbasierten Maßes
durch die beiden Einstellungsskalen von Bogner und Wiseman (2006) durch
Berücksichtigung der sozialen Erwünschtheit verbessert werden kann. Damit
wurde auch die soziale Erwünschtheit auf ihre mögliche Beteiligung an dem inkon-
sistenten Zusammenhang zwischen Einstellung und Verhalten hin überprüft.
3.5 Ergebnisse und Diskussion
17
3.5 Ergebnisse und Diskussion
Die im Rahmen dieser Arbeit vorgestellten Studien zielten darauf ab, die
Dimensionalität und Validität von Umwelteinstellungen und Umweltverhalten sowie
deren Zusammenhang zu untersuchen. Im Folgenden werden die Ergebnisse der drei
Teilarbeiten vorgestellt und diskutiert.
3.5.1 Dimensionalität von Umwelteinstellungen (Teilarbeit A)
Ziel der ersten Studie (siehe Teilarbeit A) war die Übertragung des 2-Faktoren-Modells
der Umweltwerte von Bogner und Kollegen (Bogner und Wiseman, 2006) auf eine Er-
wachsenenstichprobe bestehend aus Lehrer/innen und Lehramtsstudierenden für die
Primarstufe sowie für die Sekundarstufe mit den Hauptfächern Biologie oder Deutsch.
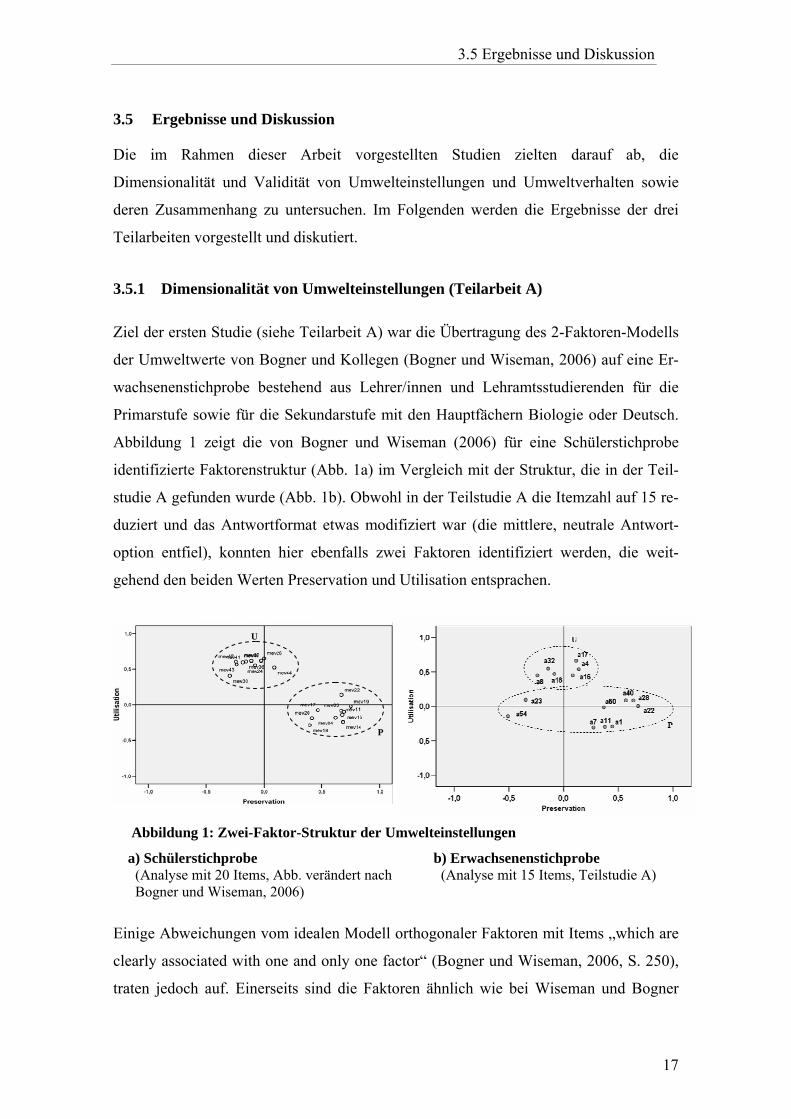
Abbildung 1 zeigt die von Bogner und Wiseman (2006) für eine Schülerstichprobe
identifizierte Faktorenstruktur (Abb. 1a) im Vergleich mit der Struktur, die in der Teil-
studie A gefunden wurde (Abb. 1b). Obwohl in der Teilstudie A die Itemzahl auf 15 re-
duziert und das Antwortformat etwas modifiziert war (die mittlere, neutrale Antwort-
option entfiel), konnten hier ebenfalls zwei Faktoren identifiziert werden, die weit-
gehend den beiden Werten Preservation und Utilisation entsprachen.
Abbildung 1: Zwei-Faktor-Struktur der Umwelteinstellungen
a) Schülerstichprobe (Analyse mit 20 Items, Abb. verändert nach Bogner und Wiseman, 2006)
b) Erwachsenenstichprobe (Analyse mit 15 Items, Teilstudie A)
Einige Abweichungen vom idealen Modell orthogonaler Faktoren mit Items „which are
clearly associated with one and only one factor“ (Bogner und Wiseman, 2006, S. 250),
traten jedoch auf. Einerseits sind die Faktoren ähnlich wie bei Wiseman und Bogner
U
P
3.5.1 Dimensionalität von Umwelteinstellungen (Teilarbeit A)
18
(2003) nicht vollständig unabhängig voneinander, sondern geringfügig negativ
korreliert. Bedeutsamer ist jedoch die Abweichung, dass zwei Items, die vorher positiv
auf dem Faktor Utilisation luden nun negativ auf dem Faktor Preservation laden (a23,
a54, siehe Abb. 1b). Zwei weitere Items laden auf beiden Faktoren ähnlich hoch. Drei
der genannten Items und ein weiteres zeigen zudem Faktorladungen niedriger als .40,
der Anteil der durch die beiden Faktoren aufgeklärten Varianz ist somit nicht besonders
hoch. Die geringeren Werte könnten zunächst durch die Itemauswahl erklärt werden:
Die für Schüler kalibrierten Skalen könnten Items enthalten, die für Lehrer/innen nicht
mehr trennscharf sind. Auch wurden wenige Items geringfügig abgewandelt, um in der
internationalen Stichprobe anwendbar zu sein. Wahrscheinlich stehen folgende
Ursachen jedoch im Vordergrund:
(1) Die Reduktion der Itemzahl (bedingt durch die Länge des Gesamtfragebogens): Eine
Überprüfung mit ähnlich reduzierter Itemzahl anhand einer Schülerstichprobe (siehe
Teilarbeit A, 3.1) ergab ähnliche Probleme wie bei den Lehrer/innen und Lehramts-
studierenden, d. h. es traten korrekte Ladungen auf dem jeweils anderen Faktor bzw.
Doppelladungen mit gegensätzlichem Vorzeichen auf.
(2) Die Homogenität der Stichprobe: Lehrer/innen und Lehramtsstudierende stellen eine
zwar wichtige, aber doch recht spezifische Subgruppe der deutschen Bevölkerung dar,
die deutlich homogener sein sollte als Stichproben von Schüler/innen. So berichtete
Schumacher (1999), dass Primarstufenlehrer/innen mehrheitlich einem liberal-intellek-
tuellen Milieu zuzuordnen seien, geprägt durch Einstellungen wie z. B. Offenheit, Mit-
verantwortung und Mitgestaltung. Die relative Homogenität der Stichprobe wird
deutlich anhand der geringen Varianz der Skalenmittelwerte5 (Preservation: M = 3,46,
SD = 0,36, Utilisation: M = 1,58, SD = 0,39). Drei Items wurden zudem sehr einheitlich
beantwortet und wiesen sehr hohe oder sehr niedrige Mittelwerte auf (Bodeneffekt: M
< 1.20 bzw. Deckeneffekt: M > 3.80). Ein Beispiel ist die Aussage „Unser Planet hat
unbegrenzte Ressourcen“, die fast ausnahmslos abgelehnt wurde (M = 1,06, SD = 0,35).
5 Die Skalenmittelwerte wurden nur zur Verdeutlichung der absoluten Werte ermittelt. Sämtliche Rech-nungen wurden jedoch mit den Bartlett-Faktorwerten durchgeführt, welche standardisiert sind und daher einen Mittelwert von 0 und eine Standardabweichung von 1 besitzen. Die Faktorwerte entsprechen der Summe der (nach den Faktorladungen) gewichteten standardisierten Variablenwerte.
3.5.2 Differenzierung der Faktoren Preservation und Utilisation
19
(3) Die Veränderung des Antwortformats: Wie Martin, Fruchter und Mathis (1974)
zeigten, kann die Reduktion des Antwortformats auch zu einer Reduktion der
Faktorladungen und Kommunalitäten führen.
Auf die Bedeutung der ersten beiden Aspekte weisen auch die Ergebnisse der wesent-
lich größeren internationalen Gesamtstichprobe des BIOHEAD-Projekts hin (Anhang,
A.2): Hier wurden insgesamt 19 Items mit einer skalierten Hauptkomponentenanalyse
ausgewertet6. In dieser deutlich heterogeneren Stichprobe mit Lehrer/innen und Lehr-
amtsstudierenden aus 16 verschiedenen Ländern konnte das 2-Werte-Modell ebenfalls
identifiziert werden. In diesem Fall waren die Faktoren jedoch orthogonal, und alle
Items ließen sich der Vorhersage entsprechend einem der Faktoren zuordnen.
Eine höhere Itemzahl scheint somit empfehlenswert, um eine eindeutige Zuordnung al-
ler erprobten Items zu den beiden Werten Preservation und Utilisation zu ermöglichen.
3.5.2 Differenzierung der Faktoren Preservation und Utilisation durch
Unterrichtsfach, Alter und Geschlecht
Zur Differenzierung der beiden Faktoren wurden diese zu soziodemographischen
Variablen in Beziehung gesetzt: dem Alter, dem Geschlecht und der Bildung, in diesem
Fall dem Unterrichtsfach bzw. der Ausbildung als Primar- oder Sekundarstufenlehrer/in.
Trotz der erwähnten relativen Homogenität der Gruppen zeigte sich für den Umwelt-
schutzfaktor (Preservation) ein kleiner Effekt der Bildung bzw. des Unterrichtsfachs:
Fachlehrer/innen und –studierende (der Sekundarstufe) für Biologie hatten etwas höhere
Umweltschutzwerte als Fachlehrer/innen und –studierende für das Fach Deutsch (siehe
Teilarbeit A, Abb. 6). Ähnliche Ergebnisse wurden für den Vergleich der Einstellungen
von Lehrern der Natur- bzw. Sozialwissenschaften berichtet (Pettus et al., 1978) sowie
für den Vergleich der Einstellungen von Studierenden der Umweltwissenschaften bzw.
Studierenden der Sozial- und Sprachwissenschaften (Ewert und Baker, 2001).
Sehr wahrscheinlich handelt es sich hierbei um einen Selektionseffekt. Gegen einen
Effekt der Ausbildung spricht, dass zwischen den Studierenden für das Fach Biologie
und den entsprechenden Lehrer/innen keine bedeutsamen Preservation-Unterschiede
auftraten (Siehe Teilarbeit A, Abb.5a). Erwartungsgemäß entscheiden sich Menschen,
6 Die vier zusätzlichen Items stammen nicht aus der Skala von Bogner und Wiseman (2006), sondern erfragten mehrheitlich die Einstellung zur Gentechnologie. Sie wurden daher in der Teilarbeit A nicht eingeschlossen.
3.5.2 Differenzierung der Faktoren Preservation und Utilisation
20
die sich für die Natur interessieren und diese wertschätzen, eher für das Unterrichtsfach
Biologie als für das Unterrichtsfach Deutsch.
Weiterhin wurden niedrigere Umweltnutzungswerte gefunden, erstens generell bei Stu-
dierenden im Vergleich zu Lehrer/innen (Teilarbeit A, Abb. 5b) und zweitens bei Leh-
rer/innen und Studierenden der Primarstufe im Vergleich zu Lehrer/innen und Studie-
renden für Biologie der Sekundarstufe (Teilarbeit A, Abb. 7). Die letzteren sind jedoch
mit hoher Wahrscheinlichkeit auf einen Effekt des Geschlechts zurückzuführen, da im
Primarstufenbereich der Frauenanteil sehr hoch ist. Dasselbe gilt für den Vergleich zwi-
schen Studierenden (83% Frauen) und Lehrer/innen (57% Frauen), wobei hier zusätz-
lich ein Effekt des Alters hinzukommt.
Alters- und Geschlechtseffekte traten zwar für beide Faktoren auf, diejenigen für den
Utilisation-Faktor waren jedoch deutlicher ausgeprägt. Dadurch, dass mit zunehmen-
dem Alter der Befragten auch der Männeranteil zunahm, sind Geschlecht und Alter teil-
weise miteinander konfundiert. Der Frauenanteil bei den Studierenden war um gut 25%
höher als bei den Lehrer/innen.
Frauen hatten niedrigere Umweltnutzungswerte als Männer. In der Gruppe der Älteren
waren bei den Frauen außerdem die Umweltschutzwerte signifikant erhöht. Die Ge-
schlechtsunterschiede in den Umwelteinstellungen sind somit bei den Älteren, geboren
in den 1940er und 1950er Jahren, größer als in den jüngeren Gruppen, vergleichbar dem
Ergebnis von Blaikie (1992, vgl. 3.3.2), der in der Gruppe der 1945-1955 Geborenen
die größten Geschlechtsunterschiede in der Umwelteinstellung fand. Auch Stern, Dietz
und Kalof (1993) berichteten höhere biospärisch-altruistische Werte bei Frauen und,
was teilweise dem Utilsation-Faktor entspricht, ein größeres Bewusstsein für die Konse-
quenzen der Umweltgefährdung für die Biosphäre.7
Blocker und Eckberg (1989) fanden bei Frauen eine geringere Bevorzugung ökonomi-
schen Gewinns auf Kosten der Umwelt und bei Männern eine geringere Bereitschaft
zum Schutz der Umwelt bei Gefahr wirtschaftlicher Verluste, allerdings nur unter der
Voraussetzung, dass die Befragten Eltern kleiner Kinder seien. Da Studierende in der
Regel noch keine Kinder haben, könnte hier eine Erklärung für die geringeren Ge-
7 Erklärt wird die weniger kritische Haltung von Männern gegenüber der menschlichen Nutzung der Natur und deren möglichen Folgen durch die unterschiedliche Sozialisation der Geschlechter (siehe z. B. Blocker und Eckberg, 1989), in der Männer in der Rolle als ökonomischer Versorger erzogen und ermutigt würden, eine wettbewerbsorientierte Haltung einzunehmen, welche die Welt als auszubeutende Ressource betrachte. Frauen würden dagegen stärker in einer Rolle als Bewahrerin und Pflegerin sozialisiert, die eher auf den Erhalt von Leben und Beziehungen ausgerichtet sei.
3.5.2 Differenzierung der Faktoren Preservation und Utilisation
21
schlechtsunterschiede innerhalb der jüngeren Generation liegen. Diese können auch
Ausdruck einer generellen Annäherung der Geschlechter in der jüngeren Generation
sein.
Die Unterstützung der Umweltschutzwerte ist über alle Altersgruppen hinweg sehr
hoch. Gleichzeitig werden die Umweltnutzungswerte generell eher abgelehnt. Für einen
Periodeneffekt durch ein weit verbreitetes Bewusstsein für Umweltprobleme in der
deutschen Bevölkerung sprechen auch die von Kuckartz, Rheingans-Heintze und
Rädiker (2007) berichteten Ergebnisse zur Bewertung des Klimawandels.
Dennoch zeigte sich ein Trend für zunehmende Preservation- und Utilisation-Werte mit
zunehmendem Alter (r = .15**, r = .17**, siehe auch Teilarbeit A, Abb. 3). Die höheren
Preservation-Werte der Älteren gehen hauptsächlich auf ein erhöhtes Umweltschutzbe-
wusstsein der Frauen zurück (r = .23**, siehe auch Teilarbeit A, Abb. 4). Hier könnte
eine Tendenz zu sozial erwünschtem Antworten bei älteren Erwachsenen zum Ausdruck
kommen (Loehlin und Martin, 2001; Ray, 1988). Bei australischen Frauen wurde ein
Anstieg der sozialen Erwünschtheit im Alter von etwa 30 Jahren und ein weiterer An-
stieg im Alter von 50 Jahren festgestellt (Ray und Lovejoy, 2003), entsprechend den
beiden älteren Gruppen in Studie A. Dies würde die gleichzeitig erhöhten Utilisation-
Werten erklären, die von sozialer Erwünschtheit kaum beeinträchtigt werden, wie in
Teilstudie C für Kinder gezeigt wurde (siehe 3.5.6).
Andererseits entspricht die Gruppe der Älteren derjenigen Kohorte (geboren in den
1950er Jahren), die schon in anderen Untersuchungen die höchsten Werte der Umwelt-
einstellungen hatte (Blaikie, 1992). Die Gruppe der Jüngeren entspricht dagegen einer
Kohorte Heranwachsender, die von Brämer (2006) als „geprägt von Naturdistanz“ be-
schrieben wurde. Diese Generation, die im Medienzeitalter aufgewachsen ist, verbringt
nur einen geringen Teil ihrer Freizeit in der freien Natur, betrachtet diese höchstens als
Kulisse beim Sport, interessiert sich kaum für Natur und weiß wenig darüber. Insofern
ist eine geringere Wertschätzung der Natur im Vergleich zur älteren Generation ver-
ständlich. Die Biologiestudenten bilden hier eine Ausnahme (Teilarbeit A, Abb. 5a).
Gleichzeitig lehnen die beiden jüngeren Gruppen (geboren in den 1960er bis 1980er
Jahren) die Utilisation-Werte etwas stärker ab als die älteste Gruppe. Hier gibt es zwei
Möglichkeiten: Der Effekt könnte zumindest teilweise auf den größeren Männeranteil
der Gruppen höheren Alters zurückgehen. Andererseits ist der Trend auch innerhalb der
3.5.3 Dimensionalität von Umweltverhalten (Teilarbeit B)
22
Gruppe der Männer und tendenziell auch bei den Frauen vorhanden. Hier könnte also
erneut ein Kohorteneffekt zum Ausdruck kommen. Die Generationen, die in den 1980er
und 1990er Jahren geboren wurden bzw. aufwuchsen, erlebten eine Zeit besonders in-
tensiv, in der die Gefährdung der Umwelt innerhalb der Gesellschaft schon akzeptiert
war und die Gefährdung des Menschen durch neue, globale Umweltprobleme deutlicher
wurde (Tschernobyl, Klimawandel, Ozonloch, schwindende Energieressourcen). Diese
neuen Umweltprobleme könnten sich in der Betonung etwas anderer Umweltwerte aus-
drücken, bei denen weniger der Natur- als der Umweltschutz im Vordergrund steht.
Diese Ergebnisse stützen die Unterscheidung von zwei unabhängigen Faktoren der Um-
welteinstellung. Sie sind jedoch nicht auf die Gesamtbevölkerung übertragbar, da in der
Studie eine recht spezifische Stichprobe untersucht wurde (Lehrer/innen und Lehramts-
studierende). Mögliche Konsequenzen aus den beobachteten Unterschieden zwischen
Gruppen verschiedener Lehrer/innen und Lehramtsstudierenden werden im Ausblick
diskutiert.
3.5.3 Dimensionalität von Umweltverhalten (Teilarbeit B)
Während in der Teilstudie A die übergeordnete Struktur der Umwelteinstellungen von
Erwachsenen im Vordergrund stand, wurde in der Teilstudie B die Dimensionalität und
Validität einer neu entwickelten Skala Allgemeinen Ökologischen Verhaltens für Ju-
gendliche (GEB) untersucht. Diese fragt selbst berichtetes Umweltverhalten aus sechs
verschiedenen Verhaltensdomänen ab (Energiesparen, Mobilität, Müllvermeidung,
Recycling, Konsumverhalten und indirektes Umweltverhalten, siehe Teilarbeit B).
Zur Konstruktvalidierung wurden im Folgenden, ähnlich wie bei Kaiser und Wilson
(2004), sechs alternative, domänespezifische Verhaltenswerte ermittelt (einer für Recyc-
ling, einer für Mobilität usw.) und die Vorhersagegüte dieses sechsdimensionalen Mo-
dells mit der eines eindimensionalen Modells (ein Wert allgemeinen ökologischen Ver-
haltens) verglichen. Das statistische Maß G2 für den allgemeinen Modell-Fit (Güte des
Modells) zeigte, dass das sechsdimensionale Modell dem eindimensionalen Modell sig-
nifikant überlegen war. Die Differenz der Fit-Indizes (ΔG2(20) = 316,8) entspricht in et-
wa den von Kaiser und Wilson (2004) berichteten Werten (ΔG2 (20) = 316,4; bzw.
ΔG2(20) = 266,1). Die Messwerte für die sechs verschiedenen Domänen waren jedoch
nicht voneinander unabhängig: Nach einer Minderungskorrektur für mangelnde
Reliabilität waren fast alle domänespezifischen Werte hoch korreliert (r = .54 bis r =
3.5.3 Dimensionalität von Umweltverhalten (Teilarbeit B)
23
.86). Lediglich das Mobilitätsverhalten bildete eine Ausnahme mit Korrelationen
zwischen r = .21 und r = .42. Dies könnte mit einer geringen Entscheidungsfreiheit der
Jugendlichen in diesem Bereich zusammenhängen. Möglicherweise haben einige gar
nicht die Wahl, sich mit dem Auto zur Schule bringen zu lassen, so dass ihre Antwort
stärker durch äußere Umstände als durch ihre Einstellung bestimmt wird. Die anderen
domänespezifischen Verhaltenswerte können aber zum großen Teil aus den Werten
anderer Verhaltensdomänen vorhergesagt werden.
Um herauszufinden, um wie viel präziser das sechsdimensionale Modell tatsächlich ist,
wurden die absoluten Residuen (Differenz zwischen beobachteten und vorhergesagten
Werten) beider Modelle berechnet und verglichen. Im Durchschnitt sagte das mehrdi-
mensionale Modell das Auftreten einer bestimmten Verhaltensweise um .02 Einheiten
genauer vorher8. Auch dieses Ergebnis ist den Ergebnissen von Kaiser und Wilson
(2004) sehr ähnlich. Der Modell-Fit für die einzelnen Items wurde ebenfalls bestimmt
und in beiden Modellen anhand der Fit-Statistiken (Mean Square-Statistik, siehe Teil-
arbeit B, Tabelle 1) als sehr akzeptabel befunden.
Das sechsdimensionale Modell ist somit etwas präziser als das eindimensionale Modell
des Umweltverhaltens. Jedoch ist die Passung der Items für beide Modelle sehr gut und
der praktische Gewinn an Vorhersagegenauigkeit durch Verwendung des multidimen-
sionalen Modells ist sehr gering. Da gleichzeitig das eindimensionale Modell sehr viel
ökonomischer ist, soll ihm hier der Vorzug gegeben werden.
3.5.4 Allgemeines Umweltverhalten als verhaltensbasierte Einstellung
In der Teilarbeit B wurde jedoch nicht nur ein eindimensionales Maß für das ökologi-
sche Verhalten von Jugendlichen entwickelt. Es sollte weiterhin gezeigt werden, dass
diese Skala sowohl allgemeines Umweltverhalten misst, als auch ein verhaltensbasier-
tes Maß für Umwelteinstellung entsprechend der Definition als „acquired behavioral
disposition“ (Campbell, 1963) darstellt. Zu diesem Zweck wurde die konvergente Vali-
dität durch Korrelation mit traditionell entwickelten Maßen zum Umweltverhalten und
zur Umwelteinstellung (in diesem Fall den Skalen Preservation und Utilisation von
Bogner und Wiseman, 2006) überprüft.
8 Beispiel: Wenn der beobachtete Wert = 1 ist (das Verhalten wird ausgeführt) und mit dem eindimensio-nalen Modell eine Wahrscheinlichkeit für die Ausführung des Verhaltens p = .69 berechnet wird, dann liegt die mit dem 6-dimensionale Modell berechnete Wahrscheinlichkeit durchschnittlich bei p = .71.
3.5.4 Allgemeines Umweltverhalten als verhaltensbasierte Einstellung
24
Zunächst wurden hierfür auf Basis von 33 Items9 der neu entwickelten Skala für
Jugendliche Faktorenanalysen durchgeführt und so auf traditionelle Art vier domäne-
spezifische Verhaltensmaße entwickelt. Hier wurde also der Verhaltenstyp nicht von
vornherein festgelegt wie beim sechsdimensionalen Rasch-Modell. Die vier Maße ent-
sprechen inhaltlich vier der sechs Domänen (siehe Tabelle 2, Teilarbeit B) und sind wie
zu erwarten nur gering bis mäßig untereinander korreliert (minderungskorrigiert: von r
= .13 bis r = .36). Dennoch korrelieren die vier spezifischen Verhaltensmaße moderat
bis hoch mit dem allgemeinen Verhaltensmaß. Nach Berechnung der Minderungskor-
rektur erreichen alle Korrelationen Werte von mindestens .60.
Das Maß allgemeinen ökologischen Verhaltens überschneidet sich somit stark mit
traditionell entwickelten typenbasierten Verhaltensmaßen. Gleichzeitig korreliert es
aber auch hoch positiv mit dem Preservation-Maß von Bogner und Wiseman (2006) und
gering negativ mit dem Utilisation-Maß, beide traditionell über bewertende Aussagen
erfasst. Nach Minderungskorrektur liegen die Korrelationen bei .72 bzw. bei -.22. Bei
einer Kombination der beiden unabhängigen Skalen erklären diese etwa 56% der
Varianz des allgemeinen Verhaltensmaßes, davon fast 52% allein durch den
Preservation-Faktor. Diese hohe Übereinstimmung wird als Beleg für den Charakter des
Maßes als verhaltensbasierte Einstellungsskala gewertet.
Somit kann, entgegen der Vorstellung von einer Kluft zwischen Einstellung und Verhal-
ten, die anhand bewertender Aussagen gewonnene Umwelteinstellung eines Menschen
aus dessen Verhaltensberichten abgeleitet werden. Das neu entwickelte Verhaltensmaß
spiegelt wieder, in welchem Ausmaß Menschen ihre Umwelteinstellungen tatsächlich in
die Tat umsetzen. Da es mit beiden traditionellen Einstellungsfaktoren korreliert, besitzt
es sowohl eine nutzenorientierte als auch eine altruistische Komponente. Der Zusam-
menhang mit dem Umweltschutzmaß ist allerdings deutlich stärker.
Die Verwendung von ausschließlich selbst berichtetem Verhalten anstelle von explizit
bewertenden Aussagen bringt zwei Vorteile mit sich: erstens den Verzicht auf jegliche
Introspektion, die über Erinnerung hinausgeht, und zweitens die Möglichkeit eines spä-
teren Wechsels zu beobachtetem Verhalten. Einige Forscher zweifeln die externe Vali-
dität von Verhaltensberichten an (z. B. Corral-Verdugo, 1997). Es gibt aber auch anders
lautende Berichte. Insbesondere wenn lediglich dichotom das Ausführen oder
9 Die 7 Items mit einem dichotomen Antwortformat wurden nicht eingeschlossen.
3.5.5 Einflussfaktoren auf sozial erwünschtes Antworten (Teilarbeit C)
25
Nicht-Ausführen des Verhaltens abgefragt wird, – wie auch zum Teil in dieser Skala –
werden gute Übereinstimmungen zwischen beobachtetem und selbst berichtetem Ver-
halten erzielt (Hirst und Goeltz, 1985, Kaiser, Frick und Stoll-Kleemann, 2001).
Dennoch können systematische Antwortverzerrungen (Response Biases) nicht ausge-
schlossen werden. Dazu gehören auch Einflüsse sozialer Erwünschtheit, die z. B. die Er-
gebnisse verfälschen können, indem sie die Stärke des Zusammenhangs zwischen den
verschiedenen Skalen mitbestimmen. Der Einfluss sozialer Erwünschtheit auf die Ein-
stellungsskalen von Bogner und Wiseman (2006) und auf das neu entwickelte
verhaltensbasierte Maß wurde in Teilarbeit C untersucht. Trotz der Überlegungen zu
seiner Eigenschaft als alternatives Einstellungsmaß, werde ich in den folgenden beiden
Abschnitten von der Skala als Verhaltensmaß sprechen.
3.5.5 Einflussfaktoren auf sozial erwünschtes Antworten (Teilarbeit C)
In der Teilarbeit C wurde anhand einer Schüler/innen-Stichprobe überprüft, inwiefern
die Validität der in den Teilarbeiten A und B verwendeten Einstellungs- bzw. Verhal-
tensskalen durch sozial erwünschtes Antworten gefährdet ist. Um den Effekt der
sozialen Erwünschtheit von Effekten möglicher Störvariablen zu trennen, wurde auch
der Einfluss von Alter, Geschlecht und Schultyp (Realschule oder Gymnasium bzw. auf
Englisch: B-Level und A-Level) auf die Einstellungs- und Verhaltenswerte sowie auf
die „Lügenwerte“ untersucht.
Durchschnittlich stimmten die Schüler etwa drei Items auf der Lügenskala zu. Mädchen
und Jungen unterschieden sich, anders als bei Boehnke et al. (1986), nicht voneinan-
der10. Allerdings hatten Alter und Schultyp einen Einfluss auf die Höhe der Lügenwerte
(siehe Teilarbeit C, Abb. 2a und 2b). In Übereinstimmung mit mehreren Studien
(Boehnke et al., 1986; Brown und Kodadek, 1987; Richmond und Millar, 1984) nahmen
die Lügenwerte mit zunehmendem Alter stetig ab: die unter 11-Jährigen kreuzten im
Mittel zwei Items mehr auf der Lügenskala an als die über 12-Jährigen.
Gleichzeitig waren die Lügenwerte der Gymnasiasten im Vergleich zu denen der
Realschüler im Durchschnitt ebenfalls um fast 2 Punkte erhöht.11
10 Bei den 12 – 13-Jährigen hatten die Jungen höhere Lügenwerte als die Mädchen. Dieser Effekt ist aber vermutlich ein Effekt des Schultyps, da die Stichprobe der Gymnasiasten keine Mädchen dieses Alters enthielt. 11 Dies gilt auch dann noch, wenn berücksichtigt wird, dass die befragten Realschüler im Durchschnitt etwa neun Monate älter waren als die Gymnasiasten.
3.5.5 Einflussfaktoren auf sozial erwünschtes Antworten (Teilarbeit C)
26
Brown und Kodadek (1987) erklären die Abnahme der sozialen Erwünschtheit mit zu-
nehmendem Alter mithilfe von Piagets Theorie über die kognitive Entwicklung von
Kindern (Piaget 1965)12. Demnach nimmt der Lügenwert bei Kindern immer dann ab,
wenn der Altersstufe gemäß ein Sprung in der kognitiven Entwicklung zu erwarten ist.
Demnach wären die 10-Jährigen in der Schülerstichprobe aus Teilarbeit C einfach noch
nicht so gut in der Lage, korrekt über ihr eigenes Verhalten und ihre eigenen Einstel-
lungen zu berichten.
Nach dieser Erklärung wären für die Gymnasiasten niedrigere Lügenwerte zu erwarten,
da sie zumindest im Durchschnitt zu höheren kognitiven Leistungen fähig sein sollten
als die Realschüler. Wie oben bereits erwähnt, war es jedoch genau umgekehrt. Mög-
liche Einflussfaktoren wie Bildungsgrad der Eltern oder Intelligenz wurden in anderen
Studien kaum untersucht. In der einzigen mir bekannten Untersuchung zum Einfluss
von Intelligenz und sozioökonomischem Status der Eltern auf die soziale Erwünschtheit
von Kindern (Crandall et al., 1965) erreichten die intelligenteren Kinder tatsächlich nie-
drigere Erwünschtheitswerte. Dasselbe gilt für Kinder von Eltern mit höherem Status.
Warum die Teilstudie C gegenläufige Ergebnisse erbrachte, ob die Gymnasiasten z. B.
generell angepasster sind als die Realschüler, kann hier nicht festgestellt werden, sollte
aber untersucht werden, da Ergebnisse der einen Gruppe in diesem Fall nicht ohne
weiteres auf die Gruppe übertragbar wären.
3.5.6 Einfluss sozialer Erwünschtheit auf Umwelteinstellungen und -verhalten
Der Einfluss sozialer Erwünschtheit auf Einstellungs- und Verhaltensskalen wurde er-
stens mit Hilfe einer MANOVA überprüft (siehe Teilarbeit C, Tabelle 1). Hierfür wur-
den drei „Lügengruppen“ gebildet, die jeweils ein Drittel der Schüler enthielten. Zusätz-
lich zu dieser Gruppenvariablen wurde der Schultyp als unabhängige Variable einge-
setzt. Zweitens wurden drei multiple Regressionen gerechnet, in denen der Lügenwert
(Summenwert der Lügenskala) als Prädiktor für die beiden Einstellungswerte und den
Verhaltenswert eingesetzt wurde (siehe Teilarbeit C, Tabelle 2). Dies erschien
12 Im Alter von etwa 7 bis 8 Jahren, also etwa in der zweiten Schulklasse, erreichen Kinder demnach eine höhere kognitive Entwicklungsstufe (die Stufe des konkret-operativen Denkens), in der sie die Bedeutung von Wahrheit und Lüge besser unterscheiden können. In diesem Alter sei auch eine Abnahme des Wertes auf der Lügenskala zu beobachten. Ein ähnlicher Sprung finde von der fünften zur sechsten Klasse, also im Alter von etwa 11 bis 12 Jahren statt, wenn die Kinder die Stufe des formalen Denkens erreichten, die sie zum abstrakten Denken und zur Selbstreflexion befähige (Kritikfähigkeit).
3.5.6 Einfluss sozialer Erwünschtheit auf Umwelteinstellungen und -verhalten
27
notwendig, da die Zugehörigkeit zu den Lügengruppen mit dem Schultyp konfundiert
war. Zur Kontrolle möglicher Störeinflüsse wurden daher in jeder Regression zusätzlich
Alter, Geschlecht und Schultyp als Prädiktoren eingesetzt.
Die wichtigsten Ergebnisse können wie folgt zusammengefasst werden:
1) Übereinstimmend ergaben beide Analyseansätze einen Einfluss des Lügenwertes und
des Schultyps auf den Preservation-Wert und auf den Wert des allgemeinen ökologi-
schen Verhaltens (GEB). Schüler mit höheren Lügenwerten hatten tatsächlich auch
höhere Umweltschutzwerte und höhere Werte des allgemeinen Umweltverhaltens
(Teilarbeit C, Abb. 3a und 4a). Dem Resultat entsprechend, dass Realschüler weniger
zur sozialen Erwünschtheit tendierten (siehe 3.5.5), erreichten sie auch niedrigere
Umweltschutz- und Umweltverhaltenswerte als Gymnasiasten (Abb. 3b und 4b). Eine
signifikante Interaktion zwischen Schultyp und sozialer Erwünschtheit konnte in der
MANOVA jedoch nicht festgestellt werden.
2) Weiterhin war der Einfluss der Lügenskala auf den Preservation-Wert in beiden
Rechnungen insgesamt höher als der Einfluss der Lügenskala auf den Wert des allge-
meinen Umweltverhaltens. Einer Varianzaufklärung durch die Lügengruppen von 9%
für Preservation steht eine Varianzaufklärung von 4% für das allgemeine Umweltver-
halten gegenüber. Gleichzeitig ist in der multiplen Regression das Beta-Gewicht13 des
Lügenwertes für die Vorhersage des Preservation-Wertes höher (β = .32***) als für die
Vorhersage des Verhaltenswertes (β = .20**).
3) Die Utilisation-Werte konnten dagegen nicht mithilfe der Lügenskala vorhergesagt
werden. Sie wurden allein durch das Geschlecht beeinflusst. Etwas untypisch hatten in
diesem Fall die Mädchen (M = 2,57) um 0,26 höhere Utilisation-Mittelwerte als die
Jungen (M = 2,31). Der fehlende Einfluss der sozialen Erwünschtheit deutet darauf hin,
dass keine starken sozialen Normen für Utilisation existieren, oder dass sie zumindest
den Kindern nicht bekannt sind. Dafür spricht auch, dass für Utilisation keine schiefe
Verteilung vorliegt, der Mittelwert ist mit 2,4 beinahe im neutralen Bereich.
13 Beta-Gewichte sind standardisierte Regressionskoeffizienten. Sie geben die Gewichtung der einzelnen Prädiktoren (in diesem Fall der Lügenskala, des Alters etc.) bei der Vorhersage eines Kriteriumswertes (in diesem Fall Preservation, Utilisation und Verhalten) an, jedoch immer nur für genau diese Kombination von Prädiktoren und für die jeweilige Stichprobe.
3.5.6 Einfluss sozialer Erwünschtheit auf Umwelteinstellungen und -verhalten
28
In einer letzten Untersuchungsfrage ging es darum, ob der gemessene Zusammenhang
zwischen den beiden Einstellungsskalen von Bogner und Wiseman (2006) und der neu
entwickelten Verhaltensskala für Jugendliche durch Einbeziehen einer Lügenskala ver-
bessert werden kann. Zu diesem Zweck wurden die Ergebnisse von zwei Regressionen
miteinander verglichen: Während in der ersten Rechnung das allgemeine ökologische
Verhalten der Schüler/innen nur anhand ihrer Umweltschutz- und Umweltnutzungswer-
te vorhergesagt wurde, wurde in der zweiten Rechnung zusätzlich die Lügenskala als
Prädiktor eingesetzt.
Ganster, Hennessey und Luthans (1983) beschrieben drei mögliche Konsequenzen der
Verwendung von Messinstrumenten, die durch soziale Erwünschtheit (SE) beeinflusst
werden, von denen zwei hier vorgestellt werden sollen: 1) irreführende Korrelationen
(spuriousness) zwischen zwei Variablen, wenn beide mit SE korreliert sind, 2) Maskie-
rung einer vorhandenen Beziehung zwischen Variablen, durch unterschiedliche Korre-
lation der Variablen mit SE. In diesem Fall trat eine kleine „irreführende Korrelation“
zwischen Preservation und Verhalten auf (siehe Teilarbeit C, Tabelle 3). Tatsächlich ist
die Differenz der Beta-Gewichte mit und ohne Einbeziehung der Lügenskala minimal
(Δβ = .06). Beide Ergebnisse unterscheiden sich kaum, und der bei Utilisation angedeu-
tete Suppressionseffekt kann ebenfalls vernachlässigt werden. Durch die Verwendung
einer Lügenskala wird der Zusammenhang zwischen Umwelteinstellung und -verhalten
somit nicht verändert.
Wie sind die Ergebnisse einzuordnen? Im Vergleich zu den Ergebnissen anderer Stu-
dien, wo zum Teil nur 1% Verhaltensvarianz durch Skalen zur sozialen Erwünschtheit
aufgeklärt wurde (Kaiser 1998; Kaiser et al., 1999), war der Einfluss sozialer Er-
wünschtheit hier relativ hoch (4% Varianzaufklärung in der MANOVA). Einerseits
wurden diese Studien mit Erwachsenen durchgeführt. Andererseits kann die absolute
Höhe des SE-Einflusses durch die Untersuchungssituation verändert werden. Eine
Erhöhung des wahrgenommenen Drucks zur sozialen Erwünschtheit in Teilarbeit C
durch Lehrer kann trotz strikter Instruktionen und Zusicherung der Anonymität nicht
völlig ausgeschlossen werden. Generell gilt die Höhe der gemessenen Werte nur für
schriftliche Befragungen im Klassenzimmer. Schließlich war die Stichprobe mit etwa
200 Schülern relativ klein und nicht repräsentativ für ganz Deutschland. Allein
hierdurch sind Abweichungen zu früheren Untersuchungen möglich.
3.6 Allgemeine Diskussion und Ausblick
29
Eine Erklärung für den höheren Effekt sozialer Erwünschtheit auf Einstellungen bietet
Schahn (2002), der bei SE-Ratings von Items einen hohen Einfluss auf Umweltein-
stellungen, aber keinen solchen auf Umweltverhalten fand. Er interpretierte dies als
Hinweis auf eine Selbsttäuschung, die bei Aussagen über das eigene Verhalten nicht so
leicht möglich sei. Auch fand er einen höheren Einfluss der sozialen Erwünschtheit auf
Items, die Verhaltensweisen mit geringen Kosten abfragten (Schahn und Möllers
(2002). In eine Rasch-Skala, wie sie in Teilarbeit B entwickelt wurde, können besonders
gut auch sehr schwierige Items integriert werden, anders als bei mit der Faktorenanalyse
entwickelten Skalen. Möglicherweise bietet dieser Umstand auch eine Erklärung für den
vergleichsweise geringeren Zusammenhang mit der Lügenskala.
3.6 Allgemeine Diskussion und Ausblick
Zu Beginn dieser Arbeit wurde auf die Notwendigkeit valider Messinstrumente
hingewiesen, um das Verhältnis von Einstellung und Verhalten evaluieren und die
Wirksamkeit von Umweltbildungsmaßnahmen bewerten zu können.
Zwei Skalen, entwickelt für Schüler/innen (Bogner und Wilhelm, 1996; Bogner und
Wiseman, 2006), wurden auf ihre Eignung für Lehrer/innen und Lehramtsstudierende
überprüft. Dabei wurde deutlich, dass die 2-Faktorenstruktur zwar grundsätzlich bestä-
tigt werden konnte, dass aber eine direkte Übertragung von der einen Zielgruppe auf die
andere nicht ohne Güteverluste möglich war. Die Faktorstruktur klärte deutlich weniger
Varianz auf als in der Schülerstichprobe und die Faktoren waren nicht durch exakt die-
selben Items repräsentiert. Dies ist zum einen wahrscheinlich auf die Reduktion der
Itemzahl zurückzuführen, die in zukünftigen Untersuchungen vermieden werden sollte.
Eine Reduktion auf 18 Items stellt dagegen kein Problem dar, wie Teilarbeit B zeigte.
Zum anderen könnte hier ein generelles Problem der Skalenkonstruktion mit Faktoren-
analysen zum Tragen kommen: die Stichprobenabhängigkeit der berechneten Werte. In
der deutlich heterogeneren internationalen Stichprobe konnte mit denselben (plus vier
ergänzten) Items eine eindeutige orthogonale 2-Faktor-Struktur identifiziert werden. In
weiteren Auswertungen können hier auch weitere Einflussfaktoren der Umweltein-
stellung untersucht werden.
In der Item-Response-Theorie (probabilistische Testtheorie) gilt das Prinzip der Spezi-
fischen Objektivität als Eigenschaft eines erfolgreich umgesetzten Modells. Es bein-
haltet unter anderem die Unabhängigkeit der Itemeigenschaften von der Personenstich-
3.6 Allgemeine Diskussion und Ausblick
30
probe (Embretson und Reise, 2000). Inwiefern dieser Anspruch von der in der Teilarbeit
B entwickelten Skala für Jugendliche erfüllt wird, muss sich erst noch zeigen. Aller-
dings gelang bereits in der Teilarbeit C eine Replikation in einer deutlich kleineren
Stichprobe.
Beide hier untersuchten Messinstrumente beanspruchen für sich, Umwelteinstellungen
zu messen, jedoch auf unterschiedlichen Ebenen. Während die Skalen Preservation und
Utilisation übergeordnete Werte erfassen, ermittelt die neue Skala für Jugendliche
Umwelteinstellung sehr verhaltensnah. Die verhaltensbasierte Skala hat den Vorteil,
weniger stark von sozialer Erwünschtheit beeinflusst zu werden, wie in Teilarbeit C
gezeigt wurde. Dieses Ergebnis müsste jedoch noch für Erwachsene bestätigt werden.
Der starke Zusammenhang insbesondere zwischen der Preservation- und der Verhal-
tensskala macht deutlich, dass Umweltwerte und –verhalten hoch korreliert sind, wenn
sie mit derselben Spezifität gemessen werden. An diesem Punkt wird aber auch die un-
klare Bedeutung des Utilisation-Faktors deutlich. Bei den U-Werten treten die größten
Unterschiede zwischen den Geschlechtern und zwischen den Altersgruppen auf. Dieser
Faktor korreliert jedoch nur niedrig mit dem allgemeinen Umweltverhalten, ein
Ergebnis, das auch von Gagnon-Thompson und Barton (1994) bestätigt wird. Dass sich
der Utilisation-Faktor gar nicht auf Umweltverhalten auswirkt, ist unwahrscheinlich,
sollte aber überprüft werden, insbesondere welche Art Verhalten er beeinflusst.
Ein weiterer Diskussionspunkt ist die Korrelation zwischen Preservation und
Utilisation, die in den meisten Untersuchungen leicht negativ war. Milfont und Duckitt
(2004) fanden jedoch eine recht hohe negative Korrelation (r = -.72). Sie interpretieren
diese als kulturell bedingt. Solche Unterschiede geben uns wichtige Informationen über
das wahrgenommene Ausmaß des Konflikts zwischen menschlichen Interessen und dem
Naturschutz. Dass gleichermaßen hohe Nutzungs- und Schutzwerte den Nachhaltig-
keitsgedanken einer schonenden Nutzung abbilden, kann jedoch nicht vorausgesetzt
werden. Ebenso wird der Spezialfall einer Nutzung zum Erhalt von Kulturlandschaften
(z. B. die Weide von Kalkmagerrasen) nicht abgefragt.
Dennoch wäre eine Überprüfung der Korrelation zwischen beiden Faktoren auch in
Abhängigkeit vom Umweltwissen oder vom Alter bestimmter Bevölkerungsstich-
proben, z. B. Fachlehrern oder Umweltschutzexperten interessant, auch unter Berück-
sichtigung kulturell beeinflusster Werte.
3.6 Allgemeine Diskussion und Ausblick
31
Welche Schlussfolgerungen kann man für die Umweltbildung, insbesondere in der
Schule ziehen? Die generell hohen Preservation-Werte, insbesondere der Befragten aus
dem Biologiebereich können nur positiv gewertet werden. Aufgrund der oben diskutier-
ten Unsicherheit über die Bedeutung des Utilisation-Faktors ist eine Beurteilung der,
insbesondere in der Primarstufe aufgrund des hohen Frauenanteils, geringen Utilisation-
Werte schwierig. Wehrmeyer und McNeil (2000) weisen darauf hin, dass bei Frauen ein
Glaube daran, dass technische Neuerungen die Umweltprobleme lösen werden, geringer
ausgeprägt sei, als bei Männern. In der Tat konnten die zahlreichen technischen Neue-
rungen der letzen Jahrzehnte allein die existierenden Umweltprobleme, bedingt z. B.
durch zu hohen CO2-Ausstoß, nicht lösen.
Eine Forschungslücke, die auch in dieser Arbeit nicht untersucht wurde, betrifft das
Selbstbild der Biologielehrer als Umweltbildner. Eine Untersuchung von Cotton (2006)
über die Bewertungen von Geographielehrern zeigt aber, dass diese sich vielleicht eher
in der Rolle neutraler Personen sehen, die alle Sichtweisen gleichermaßen beleuchten,
statt eindeutig Stellung zu beziehen, wie es oft gefordert wird (Blumstein und Saylan,
2007; Fien, 1999). Insbesondere das in neueren Ansätzen der Umweltbildung geforderte
Bearbeiten realer, lokaler Umweltsituationen (z. B. Kyburz-Graber, 2004) trifft auf
Widerstände bei Lehrern (z. B. Ballantyne, 1999), ob aus Angst vor Konflikten mit
Eltern oder Behörden oder aus einem Gefühl mangelnder Kompetenz heraus. Für
Biologielehrer dürfte dies noch stärker zutreffen, da diese eine rein
naturwissenschaftliche Ausbildung genossen haben und mit den sozialen, politischen
und wirtschaftlichen Aspekten der Umweltproblematik somit leicht überfordert sein
könnten. Hier wird besonders deutlich, dass die Ausbildung für Lehrer, die
Umweltbildung betreiben sollen, mehr Schwerpunkte auf Praxisnähe und die interdiszi-
plinäre Zusammenarbeit setzen sollte.
4. Literaturverzeichnis der Zusammenfassung
32
4. Literaturverzeichnis der Zusammenfassung
Ajzen, I., & Fishbein, M. (1977). Attitude-behaviour relations: A theoretical analysis
and review of empirical research. Psychological Bulletin, 84, 888-918.
Ballantyne, R. (1999). Teaching environmental concepts, attitudes and behaviour
through geography education: Findings of an international survey. International
Research in Geographical and Environmental Education, 8(1), 40-58.
Bamberg, S., & Möser, G. (2007). Twenty years after Hines, Hungerford, and Tomera:
A new meta-analysis of psycho-social determinants of pro-environmental
behaviour. Journal of Environmental Psychology, 27, 14-25.
Blaikie, N. W. H. (1992). The nature and origins of ecological world views: An
Australian study. Social Science Quarterly, 73(1), 144-165.
Blocker, T. J., & Eckberg, D. L. (1989). Environmental issues as women's issues:
General concerns and local hazards. Social Science Quarterly, 70(3), 586-593.
Blumstein, D. T., & Saylan, C. (2007). The failure of environmental education (and
how we can fix it). PLoS Biology, 5(5), 1-5.
Boehnke, K., Silbereisen, R. K., Reynolds, C. R., & Richmond, B. (1986). What I think
and feel - German experience with the revised form of the Children's Manifest
Anxiety Scale. Personality and Individual Differences, 7(4), 553-560.
Bogner, F. X., & Wilhelm, M., G. (1996). Environmental perspectives of pupils: the
development of an attitude and behaviour scale. The Environmentalist, 16(95-
110), 95-110.
Bogner, F. X., & Wiseman, M. (1997a). Environmental perception of rural and urban
pupils. Development of an attitude and behaviour scale. Journal of
Environmental Psychology, 17, 111-122.
Bogner, F. X., & Wiseman, M. (1997b). Environmental perspectives of Danish and
Bavarian pupils: towards a methodological framework. Scandinavian Journal of
Educational Research, 41(1), 53-71.
Bogner, F. X., & Wiseman, M. (1998). Environmental perception of Swiss and
Bavarian pupils: An empirical evaluation. Swiss Journal of Sociology, 24(3),
547-566.
Bogner, F. X., & Wiseman, M. (1999). Towards measuring adolescent environmental
perception. European Psychologist, 4, 139-151.
4. Literaturverzeichnis der Zusammenfassung
33
Bogner, F. X., & Wiseman, M. (2002). Environmental perception of French and some
Western European secondary school students. European Journal of Psychology
of Education, 17, 3-18.
Bogner, F. X., & Wiseman, M. (2006). Adolescent's attitudes towards nature and
environment: Quantifying the 2-MEV model. Environmentalist, 26, 231-237.
Bond, T. G., & Fox, C. M. (2001). Applying the Rasch Model: Fundamental
measurement in the human sciences. Mahwah, New Jersey: LEA.
Brämer, R. (2006). Natur obskur - Wie Jugendliche heute Natur erfahren [Nature
obscure - How today's adolescents experience nature]. München: oekom verlag.
Brown, M. S., & Kodadek, S. M. (1987). The use of lie scales in psychometric measures
of children. Research in Nursing & Health, 10, 87-92.
Buttel, F. H. (1979). Age and environmental concern: A multivariate analysis. Youth
and Society, 10(March), 237-256.
Campbell, D., T. (1963). Social attitudes and other acquired behavioral dispositions. In
S. Koch (Ed.), Psychology: A study of science (Vol. 6, pp. 94-172). New York:
McGraw-Hill.
Chevallard, Y. (1985). La transposition didactique - du savoir savant au savoir
enseigné. Grenoble: Ed. La Pensée Sauvage.
Cornell, J. B. (1979). Mit Kindern die Natur erleben (Sharing nature with children: A
parents' and teachers' nature awareness guidebook).
Corral-Verdugo, V. (1997). Dual `realities´ of conservation behavior: Self-reports vs
observations of re-use and recycling behavior. Journal of Environmental
Psychology, 17, 135-145.
Cotton, D. R. E. (2006). Implementing curriculum guidance on environmental
education: the importance of teachers' beliefs. Journal of Curriculum Studies,
38(1), 67-83.
Crandall, V. C., Crandall, V. J., & Katkovsky, W. (1965). A children's social
desirability questionnaire. Journal of Consulting Psychology, 29(1), 27-36.
Crowne, D. P., & Marlow, D. (1960). A new scale of social desirability independent of
psychopathology. Journal of Consulting Psychology, 24, 349-354.
Crowne, D. P., & Marlowe, D. (1964). The approval motive: Studies in evaluative
dependence. New York: John Wiley.
4. Literaturverzeichnis der Zusammenfassung
34
de Haan, G., Jungk, D., Kutt, K., Michelsen, G., Nitschke, C., Schnurpel, U., et al.
(1997). Umweltbildung als Innovation: Bilanzierungen und Empfehlungen zu
Modellversuchen und Forschungsvorhaben (Environmental education as
innovation). Berlin: Springer.
Diekmann, A., & Preisendörfer, P. (1992). Persönliches Umweltverhalten:
Diskrepanzen zwischen Anspruch und Wirklichkeit [Individual ecological
behavior: Discrepancy between claim and performance]. Kölner Zeitschrift für
Soziologie und Sozialpsychologie, 44(2), 226-251.
Diekmann, A., & Preisendörfer, P. (1998). Environmental behavior: discrepancies
between aspirations and reality. Rationality and Society, 10(1), 79-102.
Diekmann, A., & Preisendörfer, P. (2003). Green and Greenback. The Behavioral
Effects of Environmental Attitudes in Low-Cost and High-Cost Situations.
Rationality and Society, 15, 441-472.
Dunlap, R. E., & Jones, R. E. (2003). Environmental attitudes and values. In R.
Fernández-Ballesteros (Ed.), Encyclopaedia of Psychological Assessment (Vol.
1, pp. 364-369). London: Sage.
Dunlap, R. E., & Van Liere, K. D. (1978). The "New Environmental Paradigm": A
proposed measuring instrument and preliminary results. Journal of
Environmental Education, 9, 10-19.
Dunlap, R. E., Van Liere, K. D., Mertig, A. G., & Jones, R. E. (2000). Measuring
endorsement of the New Ecological Paradigm: A revised NEP scale. Journal of
Social Issues, 56(3), 425-442.
Eagly, A. H., & Chaiken, S. (1993). The nature of attitudes. In The psychology of
attitudes (pp. 1-21). Fort Worth: Harcourt Brace Jovanovich.
Embretson, S. E., & Reise, S. P. (2000). Item response theory for psychologists. New
Jersey: Mahwah.
Ewert, A., & Baker, D. (2001). Standing for where you sit: An exploratory analysis of
the relationship between academics major and environment beliefs. Environment
and Behavior, 33(5), 687-707.
Ferguson, G. A. (1941). The factoral interpretation of test difficulty. Psychometrika,
6(5), 323-329.
4. Literaturverzeichnis der Zusammenfassung
35
Fien, J. (1999). Towards a map of commitment: A socially critical approach to
geographical education. International Research in Geographical and
Environmental Education, 8(2), 140-158.
Fuhrer, U. (1995). Sozialpsychologisch fundierter Theorierahmen für eine Umwelt-
bewußtseinsforschung. Psychologische Rundschau, 46(2), 93-103.
Gagnon-Thompson, S. C., & Barton, M. A. (1994). Ecocentric and anthropocentric
attitudes toward the environment. Journal of Environmental Psychology, 14(2),
149-157.
Ganster, D. C., Hennessey, H. W., & Luthans, F. (1983). Social desirability response
effects: Three different models Academy of Management Journal, 26(2), 955-
966
Glenn, N. D. (1974). Aging and conservatism. Annals of the American Academy of
Social and Political Science, 175, 176-186.
Glenn, N. D. (2003). Distinguishing age, period, and cohort effects. In J. T. Mortimer &
M. J. Shanahan (Eds.), Handbook of the life course (pp. 465-476). New York:
Kluwer Academic/ Plenum Publishers.
Göpfert, H. (1994). Naturbezogene Pädagogik. Weinheim: Deutscher Studien-Verlag.
Granzin, K. L., & Olsen, J. E. (1991). Characterizing participants in activities protecting
the environment: A focus on donating, recycling, and conservation behaviors.
Journal of Public Policy & Marketing, 10(2), 1-27.
Hines, J. M., Hungerford, H. R., & Tomera, A. N. (1987). Analysis and synthesis of
research on responsible environmental behavior: A meta-analysis. The Journal
of Environmental Education, 18, 1-8.
Hirst, E., & Goeltz, R. (1985). Accuracy of self-reports: Energy conservation surveys.
The Social Science Journal, 22, 19-30.
Howell, S. E., & Laska, S. B. (1992). The changing face of the environmental coalition:
A research note. Environment and Behavior, 24(1), 134 -144.
Hungerford, H. R., & Volk, T. L. (1990). Changing learner behavior through
environmental education. Journal of Environmental Education, 21, 8-21.
Kaiser, F. G. (1998). A general measure of ecological behavior. Journal of Applied
Social Psychology, 28(5), 395-422.
4. Literaturverzeichnis der Zusammenfassung
36
Kaiser, F. G., Frick, J., & Stoll-Kleemann, S. (2001). Zur Angemessenheit
selbstberichteten Verhaltens: Eine Validitätsuntersuchung der Skala
Allgemeinen Ökologischen Verhaltens. Diagnostica, 47(2), 88-95.
Kaiser, F. G., Oerke, B., & Bogner, F. X. (2007). Behavior-based environmental
attitude: Development of an instrument for adolescents. Journal of
Environmental Psychology, 27(3), 242-251
Kaiser, F. G., & Wilson, M. (2004). Goal-directed conservation behavior: The specific
composition of a general performance. Personality and Individual Differences,
36, 1531-1544.
Kaiser, F. G., Wölfing, S., & Fuhrer, U. (1999). Environmental attitude and ecological
behaviour. Journal of Environmental Psychology, 19, 1-19.
KMK (2005). Bildungsstandards im Fach Biologie für den Mittleren Schulabschluss
(Jahrgangsstufe 10) (1 ed.). München: Luchterhand.
Kuckartz, U., Rheingans- Heintze, A., & Rädiker, S. (2007). Klimawandel aus der Sicht
der deutschen Bevölkerung [Climate change from the view of the German
population] [Electronic Version]. Umweltbewusstsein in Deutschland, 2007
from http://www.umweltbewusstsein.de/ub/deutsch/2006.
Kyburz-Graber, R., Rigendinger, L., Hirsch Hadorn, G., & Werner Zentner, K. (1997).
Sozio-ökologische Umweltbildung. Hamburg: Krämer.
Kyburz-Graber, R. (2004). Welches Wissen, welche Bildung? Aktuelle Entwicklungen
in der Umweltbildung. Beiträge zur Lehrerbildung, 22(1), 83-94.
Leeming, F. C., Dwyer, W. O., Porter, B. E., & Cobern, M. K. (1993). Outcome
research in environmental education: A critical review. Journal of
Environmental Education, 24(4), 8-21.
Legault, L., & Pelletier, L. G. (2000). Impact of an environmental education program on
students' and parents' attitudes, motivation, and behaviors. Canadian Journal of
Behavioural Science, 32(4), 243-250.
Loehlin, J. C., & Martin, N. G. (2001). Age changes in personality traits and their
heritabilities during the adult years: evidence from Australian twin registry
samples. Personality and Individual Differences, 30, 1147-1160.
Lowe, G. D., & Pinhey, T. K. (1982). Rural-urban differences in support for
environmental protection. Rural Sociology, 47(1), 114-128.
4. Literaturverzeichnis der Zusammenfassung
37
Martin, W. S., Fruchter, B., & Mathis, W. J. (1974). An investigation of the effect of the
number of scale intervals on Principle Component Factor Analysis. Educational
and Psychological Measurement, 34(3), 537-545.
Meinhold, J. L., & Malkus, A. J. (2005). Adolescent environmental behaviors: Can
knowledge, attitudes, and self-efficacy make a difference? Environment and
Behavior, 37(4), 511-532.
Milfont, T. L., & Duckitt, J. (2004). The structure of environmental attitudes: A first-
and second-order confirmatory factor analysis. Journal of Environmental
Psychology, 24, 289-303.
Mohai, P., & Twight, B. W. (1987). Age and environmentalism: An elaboration of the
Buttel model using national survey evidence. Social Science Quarterly, 68(4),
798-815.
Moscovici, S. (1984). The phenomenon of social representation. In R. M. Farr & S.
Moscovici (Eds.), Social Representations (pp. 3-70). Cambridge: Cambridge
University Press.
Mummendey, H. D. (1981). Methoden und Probleme der Kontrolle sozialer
Erwünschtheit [Methods and problems of social desirability control]. Zeitschrift
für Differentielle und Diagnostische Psychologie, 2(3), 199-218.
Nederhof, A. J. (1985). Methods of coping with social desirability bias: a review.
European Journal of Social Psychology, 15(3), 263-280.
Newhouse, N. (1990). Implications of attitude and behavior research for environmental
conservation. Journal of Environmental Education, 22, 26-32.
Olofsson, A., & Öhman, S. (2006). General beliefs and environmental concern:
transatlantic comparisons. Environment and Behavior, 38(6), 768-790.
Paulhus, D. L. (1991). Measurement and control of response bias. In J. P. Robinson, P.
Shaver & L. S. Wrightsman (Eds.), Measures of Personality and Social
Psychological Attitudes. San Diego: Academic Press.
Pettus, A. M., Frary, R. B., & Teates, T. G. (1978). The attitudes of science and social
studies teachers toward environmental issues. Journal of Research in Science
Teaching, 15(5), 367-372.
Piaget, J. (1965). The moral judgement of the child. New York: The Free Press.
Ray, J. J. (1988). Lie scales and the elderly. Personality and Individual Differences,
9(2), 417-418.
4. Literaturverzeichnis der Zusammenfassung
38
Ray, J. J., & Lovejoy, F. H. (2003). Age-related social desirability responding among
Australian women. The Journal of Social Psychology, 143(5), 669-671.
Richmond, B. O., & Millar, G. W. (1984). What I think and feel: A cross-cultural study
of anxiety in children. Psychology in the Schools, 21(2), 255-257.
Rokeach, M. (1968). Beliefs, attitudes, and values: A theory of organisation and
change. San Francisco: Jossey-Bass.
Rokeach, M. (1973). The nature of human values. New York: Free Press.
Schahn, J. (2002). Aufwand und soziale Erwünschtheit als Prädiktoren von
Itemmittelwerten: Analysen auf Aggregat- und Individualdatenebene im Bereich
Umwelteinstellung und -verhalten [The role of behavioral costs and social
desirability as predictors of environmental attitudes and conservation behavior:
An analysis on aggregate and on individual data level]. Zeitschrift für
Differentielle und Diagnostische Psychologie, 23(1), 45-54.
Schahn, J., & Möllers, D. (2002). Aufwand, Soziale Erwünschtheit und
Umweltbewusstsein: Replikation und neue Befunde [Costs, social desirability
and environmental consciousness: replication and new findings].
Diskussionspapier, 86.
Schmitt, M. J., & Steyer, R. (1993). A latent state-trait model (not only) for social
desirability. Personality and Individual Differences, 14(4), 519-529.
Schumacher, E. (1999). Widersprüche - Selbsttäuschungen - Flexibilität?
(Inconsistencies - self-deceptions - flexibility?). Pädagogik, 9, 36-40.
Schultz, P. W. (2001). The structure of environmental concern: Concern for self, other
people, and the biosphere. Journal of Environmental Psychology, 21, 327-339.
Schultz, P. W., Shriver, C., Tabanico, J. J., & Khazian, A. M. (2004). Implicit
connections with nature. Journal of Environmental Psychology, 24(1), 31-42.
Schwartz, S. H. (1994). Are there universal aspects in the structure and contents of
human values? Journal of Social Issues, 50, 19-45.
Schwartz, S. H. (1997). Values and culture. In D. Munro, S. Carr & J. Schumaker
(Eds.), Motivation and Culture (pp. 69-84). New York: Routledge.
Scott, D., & Willits, F. K. (1994). Environmental attitudes and behaviour: A
Pennsylvania survey. Environment and Behavior, 26(2), 239-260.
4. Literaturverzeichnis der Zusammenfassung
39
Stern, P. C., Dietz, T., Abel, T., Guagnano, G. A., & Kalof, L. (1999). A value-belief-
norm theory of support for social movements: The case of environmentalism.
Human Ecology Review, 6(2), 81-97.
Stern, P. C., Dietz, T., & Guagnano, G. A. (1995). The New Ecological Paradigm in
social-psychological context. Environment and Behavior, 27(6), 723-743.
Stern, P. C., Dietz, T., & Kalof, L. (1993). Value orientations, gender, and
environmental concern. Environment and Behavior, 25(3), 322-348.
Stern, P. C., Dietz, T., Kalof, L., & Guagnano, G. A. (1995). Values, beliefs, and
proenvironmental action: Attitude formation toward emergent attitude objects.
Journal of Applied Social Psychology, 25(18), 1611-1636.
Van Liere, K. D., & Dunlap, R. E. (1980). Social bases of environmental concern: A
review of hypotheses, explanations and empirical evidence. Public Opinion
Quarterly, 44(181-197).
Van Liere, K. D., & Dunlap, R. E. (1981). Environmental concern: does it make a
difference how it's measured? . Environment and Behavior, 13(6), 651-676.
Vining, J., & Ebreo, A. (2002). Emerging theoretical and methodological perspectives
on conservation behavior In R. B. Bechtel & A. Churchman (Eds.), Handbook of
Environmental Psychology (pp. 541–558). New York: Wiley.
Wehrmeyer, W., & McNeil, M. (2000). Activists, Pragmatists, Technophiles and Tree-
huggers? Gender Differences in Employees´ Environmental Attitudes. Journal
of Business Ethics, 28, 211-222.
Weigel, R., & Weigel, J. (1978). Environmental concern: The development of a
measure. Environment and Behavior, 10(1), 3-15.
Wiseman, M., & Bogner, F. X. (2003). A higher-order model of ecological values and
its relationship to personality. Personality and Individual Differences, 34, 783-
794.
5. Liste der Publikationen
40
5. Liste der Publikationen
A. Britta Oerke & Franz X. Bogner.
Gender, age and subject matter: Impact on teachers’ ecological values.
Journal of Teacher Education (submitted for publication)
B. Florian G. Kaiser, Britta Oerke, & Franz X. Bogner (2007).
Behavior-based environmental attitude: Development of an instrument for
adolescents. Journal of Environmental Psychology 27, 242-251.
C. Britta Oerke & Franz X. Bogner. Social desirability, environmental attitudes and general ecological behavior.
Journal of Applied Social Psychology (submitted for publication)
Im Zeitrahmen der Doktorarbeit entstand außerdem folgende Publikation über meine
Diplomarbeit, die nicht Teil der Dissertation ist:
D. Markus Lappe, Simone Kuhlmann, Britta Oerke, & Marcus Kaiser (2006).
The fate of object features during perisaccadic mislocalization. Journal of Vision,
6(11):11, 1282-1293, http://journalofvision.org/6/11/11/, doi:10.1167/6.11.11.
6. Darstellung des Eigenanteils
41
6. Darstellung des Eigenanteils
A. Die Untersuchung wurde innerhalb des Projekts BIOHEAD-Citizen geplant und
durchgeführt. Die Daten der deutschen Stichprobe wurden von mir gesammelt und
ausgewertet. Die Konzeption und Ausführung der Publikation wurde größtenteils
von mir erstellt.
B. Der Fragebogen des Allgemeinen Umweltverhaltens für Jugendliche wurde von
mir konzipiert (auf Basis des Fragebogens für Erwachsene von Kaiser [1998]). Die
Daten wurden von mir anhand bayerischer Schülerstichproben erhoben und ana-
lysiert. Die Publikation wurde zusammen mit Florian Kaiser geschrieben, wobei,
abgesehen von der Ergebnisdarstellung, die Hauptverantwortung bei ihm lag.
C. Die Konzeption für die Untersuchung wurde von mir entwickelt und umgesetzt.
Die statistische Auswertung der Daten und die Konzeption und Ausführung der
Veröffentlichung lagen in erster Linie in meiner Verantwortung.
7. Teilarbeiten
42
7. Teilarbeiten
7.1 Teilarbeit A
A Britta Oerke & Franz X. Bogner.
Gender, age and subject matter: Impact on teachers’ ecological values.
Journal of Teacher Education (submitted for publication)
Teilarbeit A
43
Gender, age and subject matter:
Impact on teachers’ ecological values
Britta Oerke & Franz X. Bogner
University of Bayreuth, Germany
Correspondence concerning this article should be addressed to Britta Oerke, University
of Bayreuth, Department Didactics of Biology (NWI), D- 95447 Bayreuth, Germany; e-
mail: [email protected]
Teilarbeit A 44
Abstract
By means of environmental education, teachers are supposed to intervene in pupils’
awareness and concern of environmental issues. Teachers’ environmental attitudes,
however, have been rarely studied. We analysed 367 pre- and in-service teachers’
environmental attitudes for their structure and socio-economic correlates within the
frame of a European project. Thus, we retrieved for adults the 2-Factor Model of
Ecological Values presented for adolescents by Bogner and Wiseman (2004). For the
two domains, Preservation and Utilisation, the psychometric structure was confirmed
and discriminative correlations with age, gender and teaching subject were unveiled.
Further research is needed to deduce implications for teaching practice.
Keywords: Environmental attitudes, teachers, student teachers, gender, age, 2-MEV
model
Teilarbeit A
45
1 Introduction
By means of environmental education (EE), teachers are supposed to develop pupils’
awareness and concern of environmental issues. A variety of relevant educational
approaches has been developed and implemented within the last decades. Additionally,
a specific age-appropriate instrument to measure environmental attitudes of pupils has
recently been developed by Bogner and Wiseman (e.g., 1997, 1999, 2002), comprising
two independent scales. In the meantime, the bi-dimensional model was confirmed by
Milfont and Duckitt (2004) although with a small sample containing only undergraduate
students. Whether the two-dimensional structure does also meet other age groups of the
population still has to be shown. Therefore, we focused on the environmental attitudes
of pre- and in-service teachers, especially Biology and primary school teachers as the
main providers of EE.
The study we present in this paper was done in the frame of the EU project BIOHEAD-
Citizen (Biology, Health and Environmental Education for better Citizenship) whose
focus was to acquire and compare various variables of science teaching in European
school systems and to associate them with controlled parameters such as gender, social
context and religion. Of specific interest were 1) simplifications of dynamic interactions
for didactical reasons that may induce obsolete implicit ideas (e.g., a narrow physical
concept of health and its paramount curative perspective), and 2) rapidly changing
knowledge, e.g. in Environmental Education, that meets pre- and in-service teachers’
attitudes and values (e.g., moral principles like that of precaution) and, thus, can be
diverse among countries with its different cultural and social contexts. Altogether,
questionnaire studies for six different topics in 16 European and North African
countries were applied. The questionnaires were translated to each country’s native
language. Each participant provided a sample of at least 100 primary school pre- and in-
service teachers and 200 of secondary schools, the latter for the subjects Biology and
(native) Language.
1.1 Measurement of Environmental Attitudes (EA) and Ecological Values
The term “attitude” commonly means the tendency of evaluating a particular object or
situation, the evaluative response consisting of three components: cognition, affect and
behaviour (Eagly & Chaiken, 1993). Thus, “Environmental Attitude” (EA) in a recent
definition is characterised as “the collection of beliefs, affect, and behavioural intentions
Teilarbeit A 46
a person holds regarding environmentally related activities or issues” (Schultz, Shriver,
Tabanico, & Khazian, 2004, p. 31). In the research literature, the specificity of EA
varies from attitudes towards concrete ecological behaviours (e.g., environmental
spending by the government [Van Liere & Dunlap, 1981]) to others measuring a general
worldview (e.g., Dunlap & Van Liere, 1978) or ecological values (Blaikie, 1992;
Bogner & Wiseman, 2006; Stern, Dietz & Guagnano, 1995). In this paper, we will focus
on the measurement of the more general concepts of EA.
A popular example for an EA instrument, the one-dimensional New Environmental
(Ecological) Paradigm (NEP) (Dunlap & Van Liere, 1978; Dunlap, Van Liere, Mertig &
Jones, 2000) ranges from unconcerned to concerned about the environment. Multidi-
mensional value-based approaches presented two- or three-dimensional scales
contrasting general concern for humans (anthropocentric), and concern for self
(egoistic) and others (altruistic) respectively, with concern for all living beings
(ecocentric and biospheric concern respectively: Gagnon Thompson and Barton, 1994;
Stern et al., 1995). Factor-analytic approaches led to a variety of measurement
instruments with accordingly varying factor structure.
Wiseman and Bogner (2003) criticised this by pointing to personality research where
the study of first-order factors generated as many batteries as investigators. However,
Bogner and colleges originally followed a similar approach when developing attitude
measures for the age-group of adolescents and factor-analysing a great pool of items
with six different adolescent populations across five language barriers (Bogner &
Wiseman, 1997, 1998, 2002). Thus, they reduced an originally 70 item-scale to a 19-
item scale reflecting five primary order factors appropriate for the entire European
sample. However, to identify a generic model of environmental attitudes, they
subsequently investigated the second-order structure of environmental attitudes using
inter-factor instead of inter-item correlations (e.g., Bogner & Wiseman, 1999; Wiseman
& Bogner, 2003). Two orthogonal higher-order factors resulted, characterising the
conflict between enjoyment and protection of nature, Preservation (P), on the one hand,
and the necessity to exploit natural resources for human needs, emphasising the human
right and ability to control and manage the environment, Utilisation (U), on the other
hand.
This “two-dimensional Model of Ecological Values” (2-MEV, Bogner and Wiseman,
2006, Wiseman & Bogner, 2003) permits high scores on both values, implying no
general conflict between the nature protection and utilisation. Consequently the two
Teilarbeit A
47
factors were found to be only marginally negatively correlated (r = -.17). The model
was independently confirmed by Milfont & Duckitt (2004) in a study with even more
items and more different established scales applied to undergraduate students in New
Zealand. They see theoretical support for the model in already existing theories of
human-nature-relationship (e.g., harmony values versus mastery values, characterised as
unidimensional [Schwartz, 1994]) as well as in the current sustainability debate. Lately,
Bogner and Wiseman (2006) optimised the measurement of the two factors for the age-
group of adolescents.
However, the direct measurement of the 2-MEV model still needs a confirmation with
an adult sample and the differentiation of the two factors by socio-demographic
variables. We are going to close this gap in this present study.
1.2 Impact factors on EA
Socio-demographic variables have been widely investigated as potential correlates of
EA to learn about the circumstances that may develop or inhibit concern. In the
following, we will review the most important findings about the associations of EA
especially with gender, age and education or major and deduce expectations for our
study. During the 1970s and 1980s, it was repeatedly shown that the young and high
educated, females and liberals were more concerned about environmental issues
compared to the old and low educated, males and conservatives (e.g., Mohai & Twight;
Van Liere & Dunlap, 1980, 1981). A shift in the significance of age was observed by
Howell and Laska (1992) who found only for the 1980 but not in the 1984 and 1988
data any more a significant negative association between age and concern, probably
because of the also reported general increase of environmental concern in the
population. On the other hand, their results evidenced the development of a significant
effect of education in the 1980s. Lately, the alteration, in this case disappearance, of
association between age and EA was confirmed by Stern and associates (Stern, Dietz &
Guagnano, 1995). Olofsson and Öhman (2006) investigating resigned attitudes to the
environment confirmed the positive association with education (the higher, the less
resigned).
Recent studies point to a shift in the impact of age (Blaikie, 1992, Ewert and Baker,
2001) that, more probably than being an effect of aging, may be a cohort effect,
depending on similar early socialisation of generations (Mohai & Twight, 1987).
Teilarbeit A 48
Considering different age groups, Blaikie (1992) as well as Ewert and Baker (2001)1
located the highest scores now in the group of young middle-aged, born in the 1960s
(25 to 34, and students older than 25) compared to younger and much older groups. In
the survey of Blaikie (1992), besides, some sub-scale scores peaked in the 35-44-
category where, additionally, gender differences were greatest. Correspondingly, female
scores peaked in the older middle-aged group (35 to 44). The young group (18 to 24)
was found to be least sensible to problems of Economic Growth even compared to their
grandparents older than 65. Blaikie (1992) concluded that “aging” and “cohort”
influences may have produced a middle-aged cohort with strongest commitment:
If youth in the late 1960s and early 1970s were the age cohort most susceptible
to developing a high level of environmental awareness and concern, as a result
of the attention which environmental issues received at that time, then they are
most likely either to have maintained something of this commitment, or to have
responded favourably to the “second wave” of environmental consciousness in
the late 1980s. While the data in this study are consistent with this hypothesis,
there is evidence that this commitment also extends back to the younger cohort
(25-34). . . . which had the highest level of environmental awareness . . . (p.162)
With the sub-scales conservation of natural environment and natural resources however,
people agreed strongly independent of their age.
An explanation for the gender differences in EA and for variations of their emergence
was provided by Blocker and Eckberg (1989) who found support for the theory that
gender socialisation leads women to focus on children’s health whereas men focus more
on children’s economic well-being. They accentuate that being parents of small children
moderates and enlarges gender differences in environmental concern. Stern, Dietz and
Kalof (1993) give support to this specific hypothesis by showing that women are
particularly more aware of negative consequences as well for themselves as for others
or the biosphere. In a later study, Stern, Dietz, Kalof & Guagnano (1995) amended that
indeed female biospheric values were more pronounced than male ones. Milfont and
Duckitt (2004) reported higher Preservation scores and lower Utilisation scores for
women. A similar pattern for 11 to 16 year old children was found by Bogner and
Wiseman (1999, 2002), who showed for girls lower scores than for boys in some
1 Ewert and Baker (2001) applied the NEP Scale in studies from 1993 and 1995.
Teilarbeit A
49
Utilisation sub-scales and higher scores in Preservation sub-scales (e.g., enjoyment of
nature, human dominance).
Ewert and Baker (2001) investigated major as a potential impact factor on pro-
environmental attitude. They surveyed undergraduate students and found the highest
pro-environment and lowest con-environment and anthropocentric attitudes in natural
resource management students (e.g., biology, or environmental studies) compared to
social science, language and forestry students. The effect was weak to moderate with
mean differences of 0.2 or 0.3. However, in conformity with the above discussion, the
gender and age effect - higher pro-environment and lower con-environment responses
were reported for females and older students – appeared irrespective of major.
1.3 Objectives
The present study focused on two main objectives. Firstly, it aimed at analysing (and
confirming) the structure of pre- and in-service teachers’ Environmental Attitudes (EA).
Secondly, potential socio-demographic correlates of EA and the impact of school
subject for in-service teachers and major for pre-service teachers are investigated
(especially still these variables are difficult to monitor in the age-group of school
pupils). Next to information about the development of EA we hope to find additional
hints about the distinctiveness of the scales P and U in adults.
We analysed the impact of gender, age, status of education (teacher or student), school
subject (Biology or German language) and school level (primary school or secondary
school) on EA. In part, it is difficult to make exact predictions for the two scales P and
U, because no or only few studies were done with a two-dimensional model or because
the results are not consistent, especially for the impact of age.
We expect an effect of gender, with women showing lower Utilisation scores and higher
Preservation scores than men. We expect an effect of the teaching subject, Biology pre-
and in-service teachers being more concerned about the environment than those for
German language (lower U and/ or higher P scores), that may be led by selection or
Biology relevant education. If education is crucial, Biology teachers should show
different attitudes than Biology pre-service teachers. Additionally, we compare primary
school teachers, doing an important early part of environmental education, with
secondary school teachers. With regard to an age effect, we expect a low association
with P and U respectively, without prognosticating the direction of effect (positive or
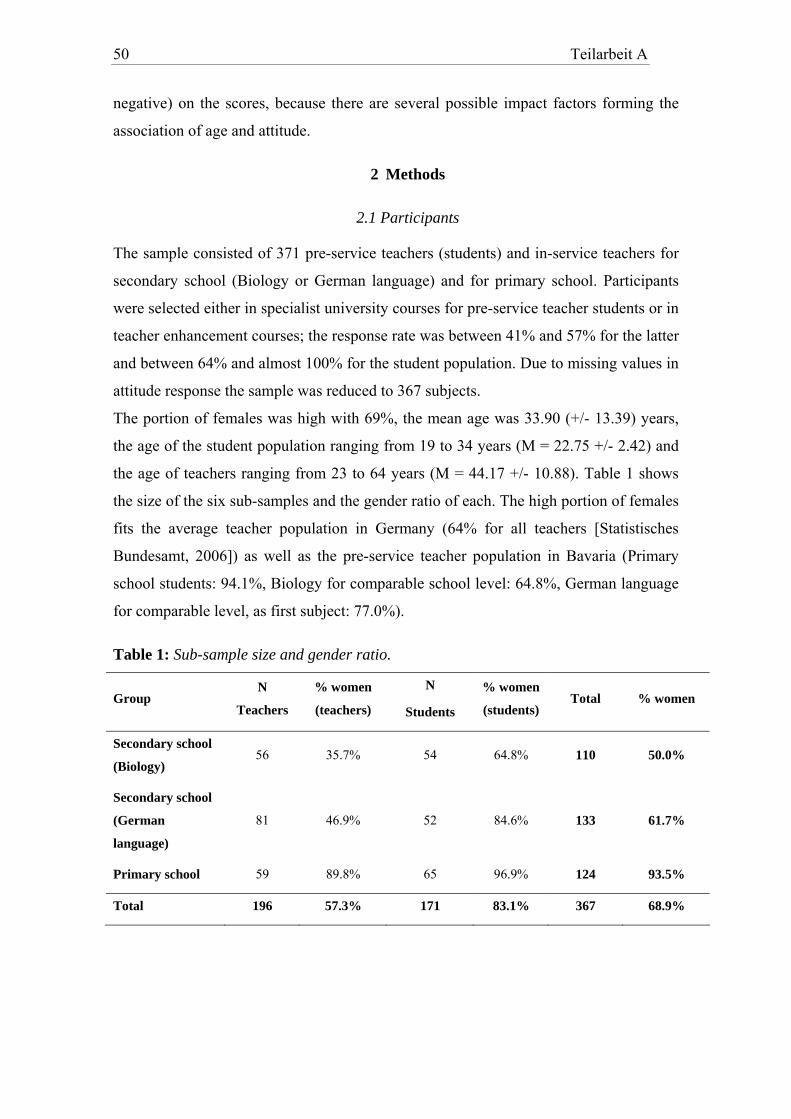
Teilarbeit A 50
negative) on the scores, because there are several possible impact factors forming the
association of age and attitude.
2 Methods
2.1 Participants
The sample consisted of 371 pre-service teachers (students) and in-service teachers for
secondary school (Biology or German language) and for primary school. Participants
were selected either in specialist university courses for pre-service teacher students or in
teacher enhancement courses; the response rate was between 41% and 57% for the latter
and between 64% and almost 100% for the student population. Due to missing values in
attitude response the sample was reduced to 367 subjects.
The portion of females was high with 69%, the mean age was 33.90 (+/- 13.39) years,
the age of the student population ranging from 19 to 34 years (M = 22.75 +/- 2.42) and
the age of teachers ranging from 23 to 64 years (M = 44.17 +/- 10.88). Table 1 shows
the size of the six sub-samples and the gender ratio of each. The high portion of females
fits the average teacher population in Germany (64% for all teachers [Statistisches
Bundesamt, 2006]) as well as the pre-service teacher population in Bavaria (Primary
school students: 94.1%, Biology for comparable school level: 64.8%, German language
for comparable level, as first subject: 77.0%).
Table 1: Sub-sample size and gender ratio.
Group N
Teachers
% women
(teachers)
N
Students
% women
(students) Total % women
Secondary school
(Biology) 56 35.7% 54 64.8% 110 50.0%
Secondary school
(German
language)
81 46.9% 52 84.6% 133 61.7%
Primary school 59 89.8% 65 96.9% 124 93.5%
Total 196 57.3% 171 83.1% 367 68.9%
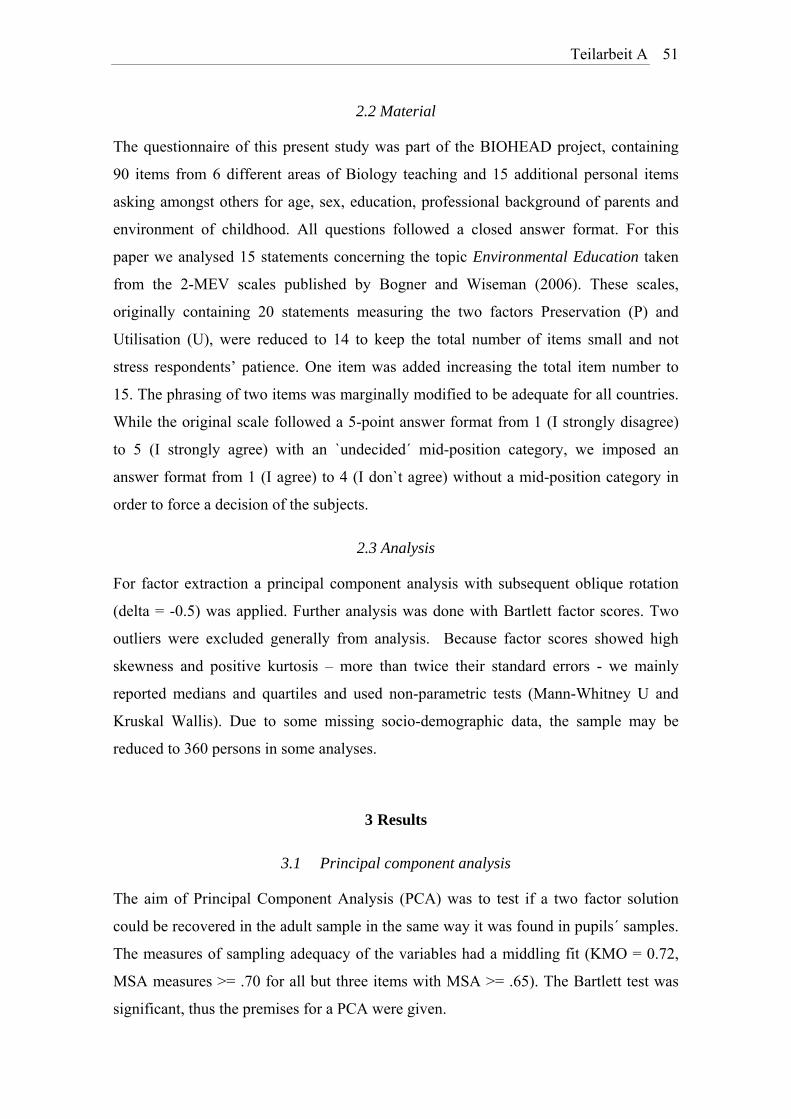
Teilarbeit A
51
2.2 Material
The questionnaire of this present study was part of the BIOHEAD project, containing
90 items from 6 different areas of Biology teaching and 15 additional personal items
asking amongst others for age, sex, education, professional background of parents and
environment of childhood. All questions followed a closed answer format. For this
paper we analysed 15 statements concerning the topic Environmental Education taken
from the 2-MEV scales published by Bogner and Wiseman (2006). These scales,
originally containing 20 statements measuring the two factors Preservation (P) and
Utilisation (U), were reduced to 14 to keep the total number of items small and not
stress respondents’ patience. One item was added increasing the total item number to
15. The phrasing of two items was marginally modified to be adequate for all countries.
While the original scale followed a 5-point answer format from 1 (I strongly disagree)
to 5 (I strongly agree) with an `undecided´ mid-position category, we imposed an
answer format from 1 (I agree) to 4 (I don`t agree) without a mid-position category in
order to force a decision of the subjects.
2.3 Analysis
For factor extraction a principal component analysis with subsequent oblique rotation
(delta = -0.5) was applied. Further analysis was done with Bartlett factor scores. Two
outliers were excluded generally from analysis. Because factor scores showed high
skewness and positive kurtosis – more than twice their standard errors - we mainly
reported medians and quartiles and used non-parametric tests (Mann-Whitney U and
Kruskal Wallis). Due to some missing socio-demographic data, the sample may be
reduced to 360 persons in some analyses.
3 Results
3.1 Principal component analysis
The aim of Principal Component Analysis (PCA) was to test if a two factor solution
could be recovered in the adult sample in the same way it was found in pupils´ samples.
The measures of sampling adequacy of the variables had a middling fit (KMO = 0.72,
MSA measures >= .70 for all but three items with MSA >= .65). The Bartlett test was
significant, thus the premises for a PCA were given.
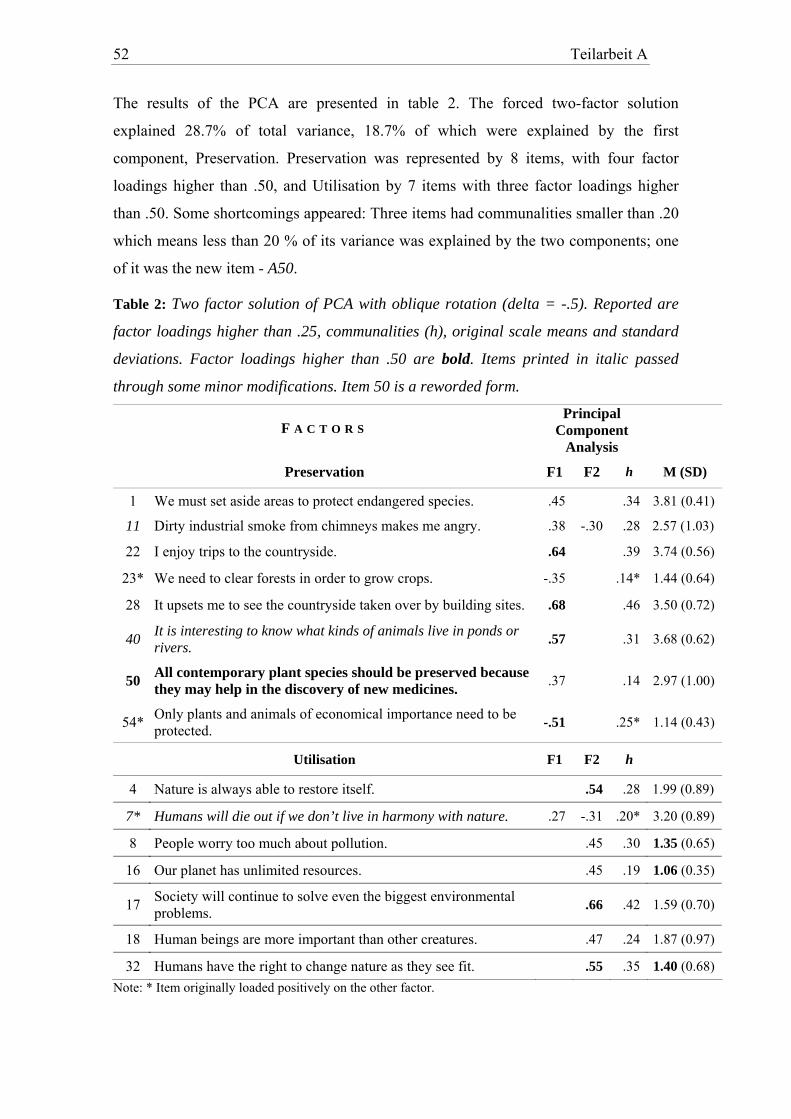
Teilarbeit A 52
The results of the PCA are presented in table 2. The forced two-factor solution
explained 28.7% of total variance, 18.7% of which were explained by the first
component, Preservation. Preservation was represented by 8 items, with four factor
loadings higher than .50, and Utilisation by 7 items with three factor loadings higher
than .50. Some shortcomings appeared: Three items had communalities smaller than .20
which means less than 20 % of its variance was explained by the two components; one
of it was the new item - A50.
Table 2: Two factor solution of PCA with oblique rotation (delta = -.5). Reported are
factor loadings higher than .25, communalities (h), original scale means and standard
deviations. Factor loadings higher than .50 are bold. Items printed in italic passed
through some minor modifications. Item 50 is a reworded form.
F A C T O R S Principal
Component Analysis
Preservation F1 F2 h M (SD)
1 We must set aside areas to protect endangered species. .45 .34 3.81 (0.41)
11 Dirty industrial smoke from chimneys makes me angry. .38 -.30 .28 2.57 (1.03)
22 I enjoy trips to the countryside. .64 .39 3.74 (0.56)
23* We need to clear forests in order to grow crops. -.35 .14* 1.44 (0.64)
28 It upsets me to see the countryside taken over by building sites. .68 .46 3.50 (0.72)
40 It is interesting to know what kinds of animals live in ponds or rivers. .57 .31 3.68 (0.62)
50 All contemporary plant species should be preserved because they may help in the discovery of new medicines. .37 .14 2.97 (1.00)
54* Only plants and animals of economical importance need to be protected. -.51 .25* 1.14 (0.43)
Utilisation F1 F2 h
4 Nature is always able to restore itself. .54 .28 1.99 (0.89)
7* Humans will die out if we don’t live in harmony with nature. .27 -.31 .20* 3.20 (0.89)
8 People worry too much about pollution. .45 .30 1.35 (0.65)
16 Our planet has unlimited resources. .45 .19 1.06 (0.35)
17 Society will continue to solve even the biggest environmental problems. .66 .42 1.59 (0.70)
18 Human beings are more important than other creatures. .47 .24 1.87 (0.97)
32 Humans have the right to change nature as they see fit. .55 .35 1.40 (0.68) Note: * Item originally loaded positively on the other factor.
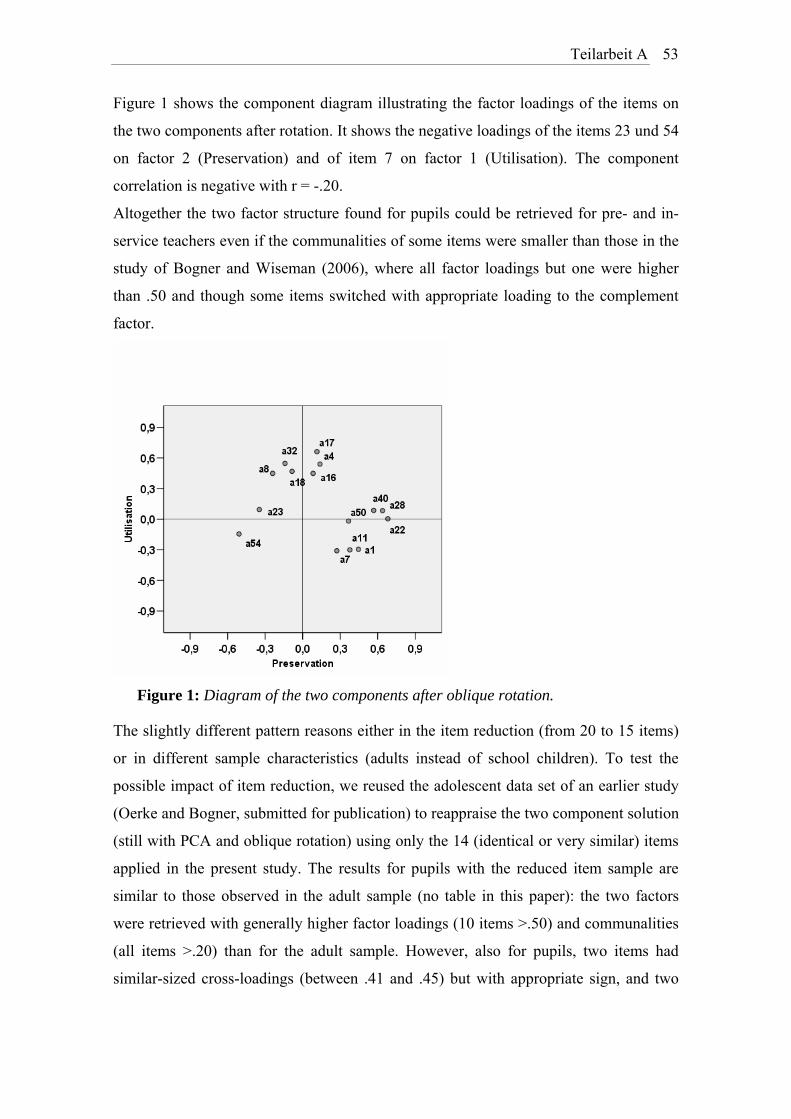
Teilarbeit A
53
Figure 1 shows the component diagram illustrating the factor loadings of the items on
the two components after rotation. It shows the negative loadings of the items 23 und 54
on factor 2 (Preservation) and of item 7 on factor 1 (Utilisation). The component
correlation is negative with r = -.20.
Altogether the two factor structure found for pupils could be retrieved for pre- and in-
service teachers even if the communalities of some items were smaller than those in the
study of Bogner and Wiseman (2006), where all factor loadings but one were higher
than .50 and though some items switched with appropriate loading to the complement
factor.
Figure 1: Diagram of the two components after oblique rotation.
The slightly different pattern reasons either in the item reduction (from 20 to 15 items)
or in different sample characteristics (adults instead of school children). To test the
possible impact of item reduction, we reused the adolescent data set of an earlier study
(Oerke and Bogner, submitted for publication) to reappraise the two component solution
(still with PCA and oblique rotation) using only the 14 (identical or very similar) items
applied in the present study. The results for pupils with the reduced item sample are
similar to those observed in the adult sample (no table in this paper): the two factors
were retrieved with generally higher factor loadings (10 items >.50) and communalities
(all items >.20) than for the adult sample. However, also for pupils, two items had
similar-sized cross-loadings (between .41 and .45) but with appropriate sign, and two
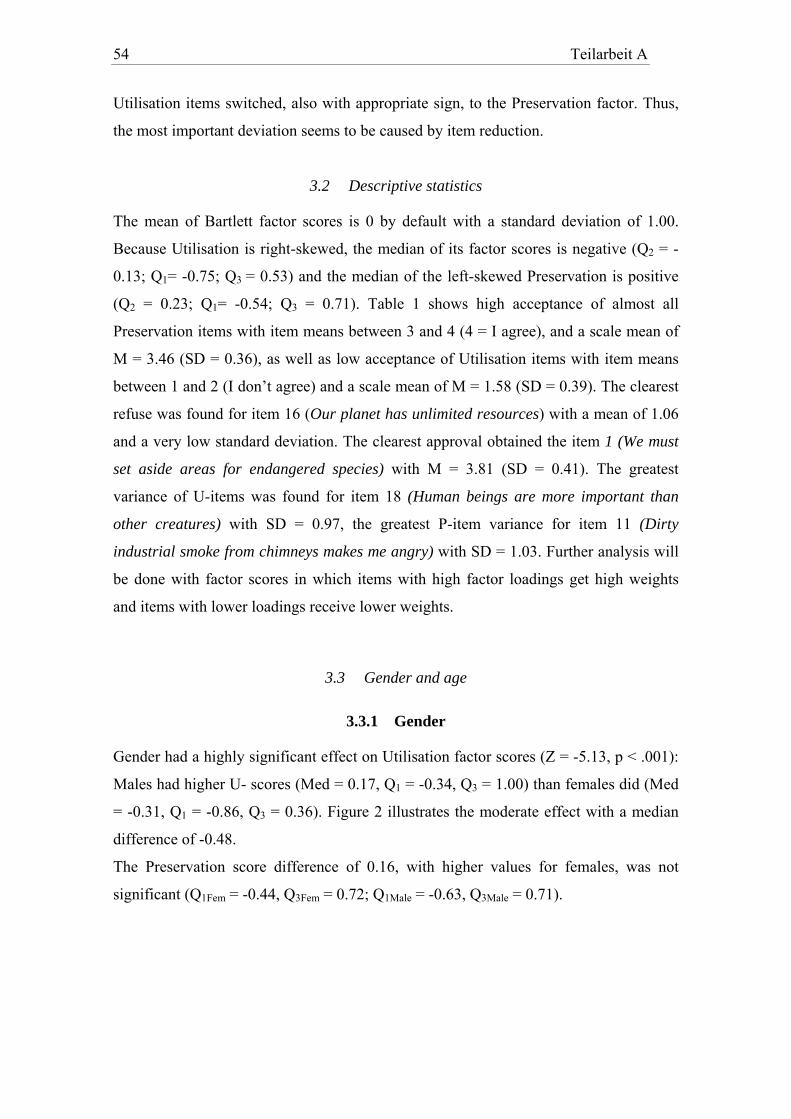
Teilarbeit A 54
Utilisation items switched, also with appropriate sign, to the Preservation factor. Thus,
the most important deviation seems to be caused by item reduction.
3.2 Descriptive statistics
The mean of Bartlett factor scores is 0 by default with a standard deviation of 1.00.
Because Utilisation is right-skewed, the median of its factor scores is negative (Q2 = -
0.13; Q1= -0.75; Q3 = 0.53) and the median of the left-skewed Preservation is positive
(Q2 = 0.23; Q1= -0.54; Q3 = 0.71). Table 1 shows high acceptance of almost all
Preservation items with item means between 3 and 4 (4 = I agree), and a scale mean of
M = 3.46 (SD = 0.36), as well as low acceptance of Utilisation items with item means
between 1 and 2 (I don’t agree) and a scale mean of M = 1.58 (SD = 0.39). The clearest
refuse was found for item 16 (Our planet has unlimited resources) with a mean of 1.06
and a very low standard deviation. The clearest approval obtained the item 1 (We must
set aside areas for endangered species) with M = 3.81 (SD = 0.41). The greatest
variance of U-items was found for item 18 (Human beings are more important than
other creatures) with SD = 0.97, the greatest P-item variance for item 11 (Dirty
industrial smoke from chimneys makes me angry) with SD = 1.03. Further analysis will
be done with factor scores in which items with high factor loadings get high weights
and items with lower loadings receive lower weights.
3.3 Gender and age
3.3.1 Gender
Gender had a highly significant effect on Utilisation factor scores (Z = -5.13, p < .001):
Males had higher U- scores (Med = 0.17, Q1 = -0.34, Q3 = 1.00) than females did (Med
= -0.31, Q1 = -0.86, Q3 = 0.36). Figure 2 illustrates the moderate effect with a median
difference of -0.48.
The Preservation score difference of 0.16, with higher values for females, was not
significant (Q1Fem = -0.44, Q3Fem = 0.72; Q1Male = -0.63, Q3Male = 0.71).
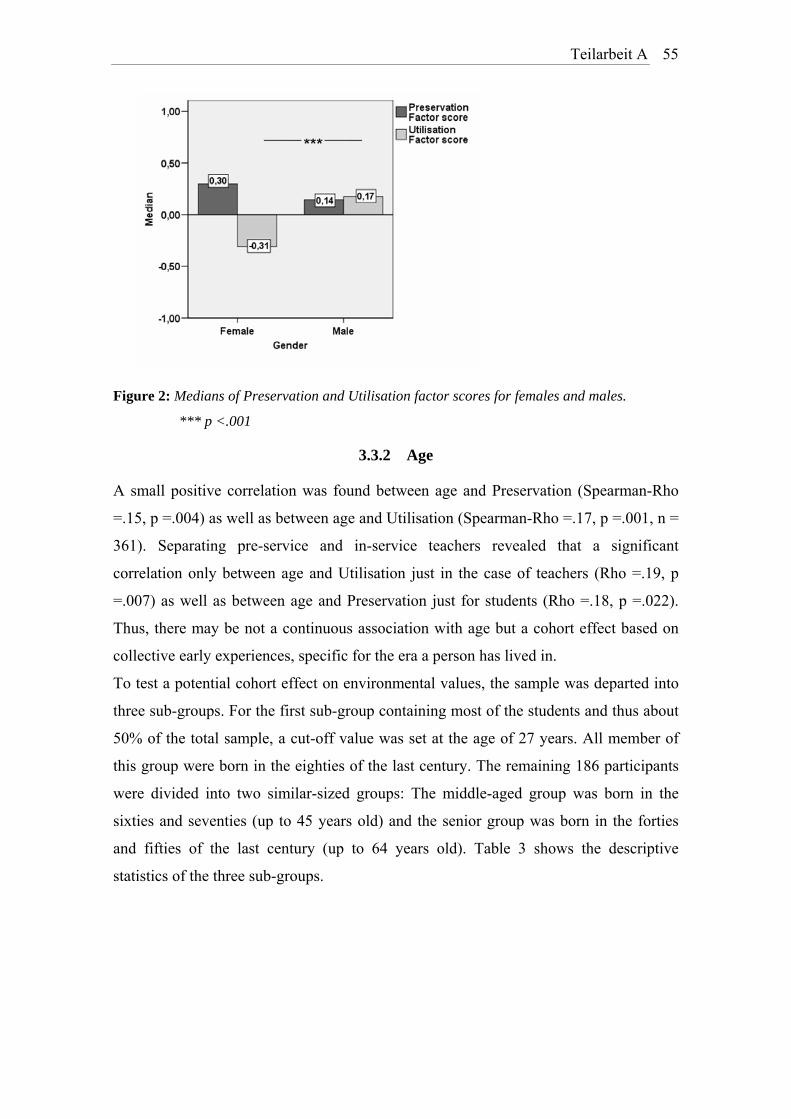
Teilarbeit A
55
Figure 2: Medians of Preservation and Utilisation factor scores for females and males.
*** p <.001
3.3.2 Age
A small positive correlation was found between age and Preservation (Spearman-Rho
=.15, p =.004) as well as between age and Utilisation (Spearman-Rho =.17, p =.001, n =
361). Separating pre-service and in-service teachers revealed that a significant
correlation only between age and Utilisation just in the case of teachers (Rho =.19, p
=.007) as well as between age and Preservation just for students (Rho =.18, p =.022).
Thus, there may be not a continuous association with age but a cohort effect based on
collective early experiences, specific for the era a person has lived in.
To test a potential cohort effect on environmental values, the sample was departed into
three sub-groups. For the first sub-group containing most of the students and thus about
50% of the total sample, a cut-off value was set at the age of 27 years. All member of
this group were born in the eighties of the last century. The remaining 186 participants
were divided into two similar-sized groups: The middle-aged group was born in the
sixties and seventies (up to 45 years old) and the senior group was born in the forties
and fifties of the last century (up to 64 years old). Table 3 shows the descriptive
statistics of the three sub-groups.
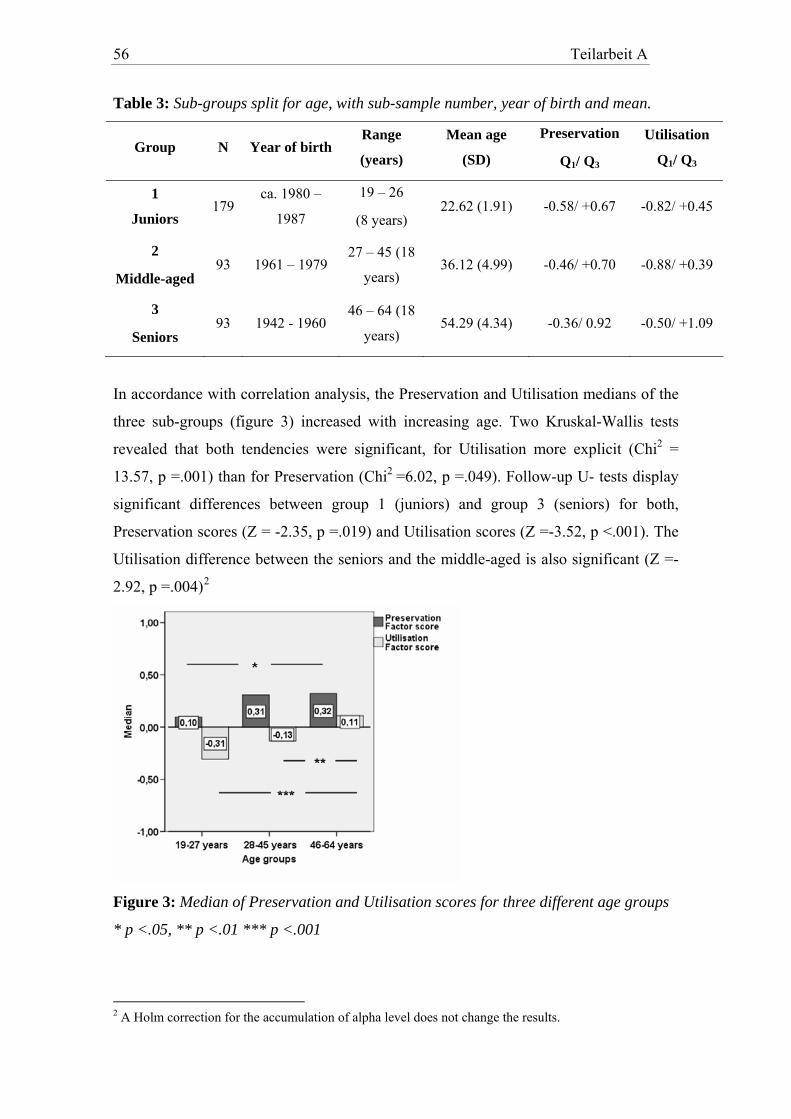
Teilarbeit A 56
Table 3: Sub-groups split for age, with sub-sample number, year of birth and mean.
Group N Year of birthRange
(years)
Mean age
(SD)
Preservation
Q1/ Q3
Utilisation
Q1/ Q3
1
Juniors 179
ca. 1980 –
1987
19 – 26
(8 years) 22.62 (1.91) -0.58/ +0.67 -0.82/ +0.45
2
Middle-aged 93 1961 – 1979
27 – 45 (18
years) 36.12 (4.99) -0.46/ +0.70 -0.88/ +0.39
3
Seniors 93 1942 - 1960
46 – 64 (18
years) 54.29 (4.34) -0.36/ 0.92 -0.50/ +1.09
In accordance with correlation analysis, the Preservation and Utilisation medians of the
three sub-groups (figure 3) increased with increasing age. Two Kruskal-Wallis tests
revealed that both tendencies were significant, for Utilisation more explicit (Chi2 =
13.57, p =.001) than for Preservation (Chi2 =6.02, p =.049). Follow-up U- tests display
significant differences between group 1 (juniors) and group 3 (seniors) for both,
Preservation scores (Z = -2.35, p =.019) and Utilisation scores (Z =-3.52, p <.001). The
Utilisation difference between the seniors and the middle-aged is also significant (Z =-
2.92, p =.004)2
Figure 3: Median of Preservation and Utilisation scores for three different age groups
* p <.05, ** p <.01 *** p <.001
2 A Holm correction for the accumulation of alpha level does not change the results.
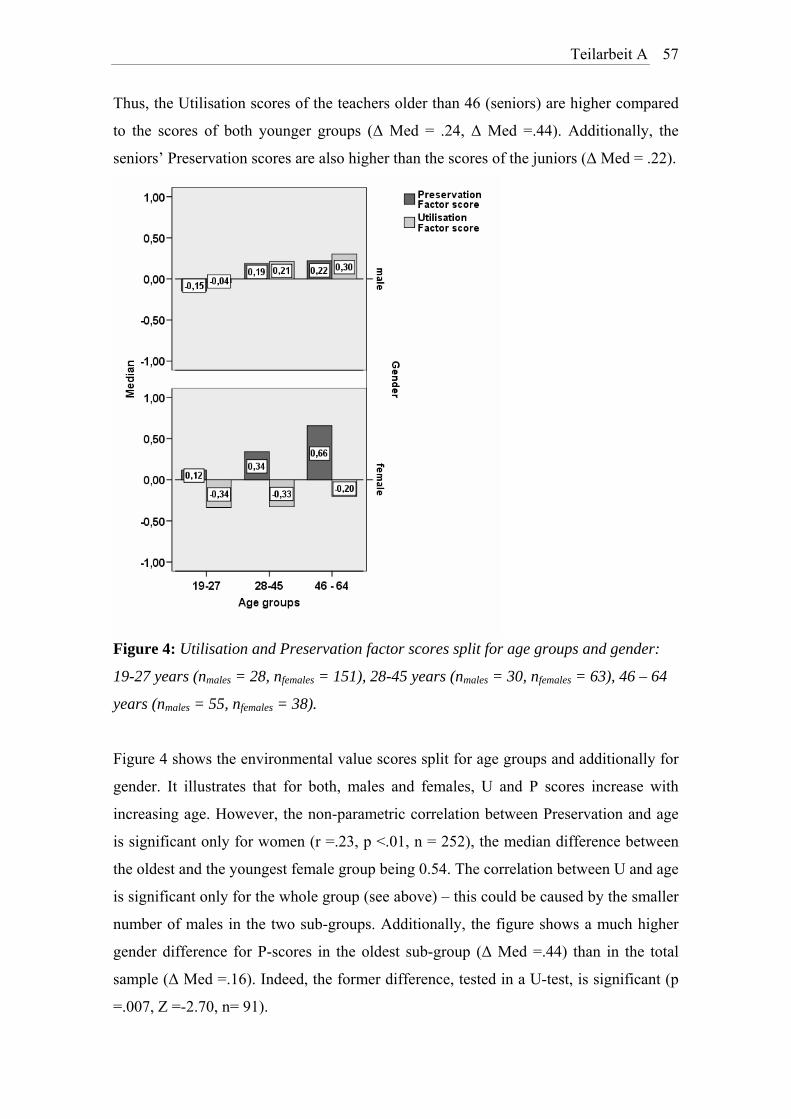
Teilarbeit A
57
Thus, the Utilisation scores of the teachers older than 46 (seniors) are higher compared
to the scores of both younger groups (Δ Med = .24, Δ Med =.44). Additionally, the
seniors’ Preservation scores are also higher than the scores of the juniors (Δ Med = .22).
Figure 4: Utilisation and Preservation factor scores split for age groups and gender:
19-27 years (nmales = 28, nfemales = 151), 28-45 years (nmales = 30, nfemales = 63), 46 – 64
years (nmales = 55, nfemales = 38).
Figure 4 shows the environmental value scores split for age groups and additionally for
gender. It illustrates that for both, males and females, U and P scores increase with
increasing age. However, the non-parametric correlation between Preservation and age
is significant only for women (r =.23, p <.01, n = 252), the median difference between
the oldest and the youngest female group being 0.54. The correlation between U and age
is significant only for the whole group (see above) – this could be caused by the smaller
number of males in the two sub-groups. Additionally, the figure shows a much higher
gender difference for P-scores in the oldest sub-group (Δ Med =.44) than in the total
sample (Δ Med =.16). Indeed, the former difference, tested in a U-test, is significant (p
=.007, Z =-2.70, n= 91).
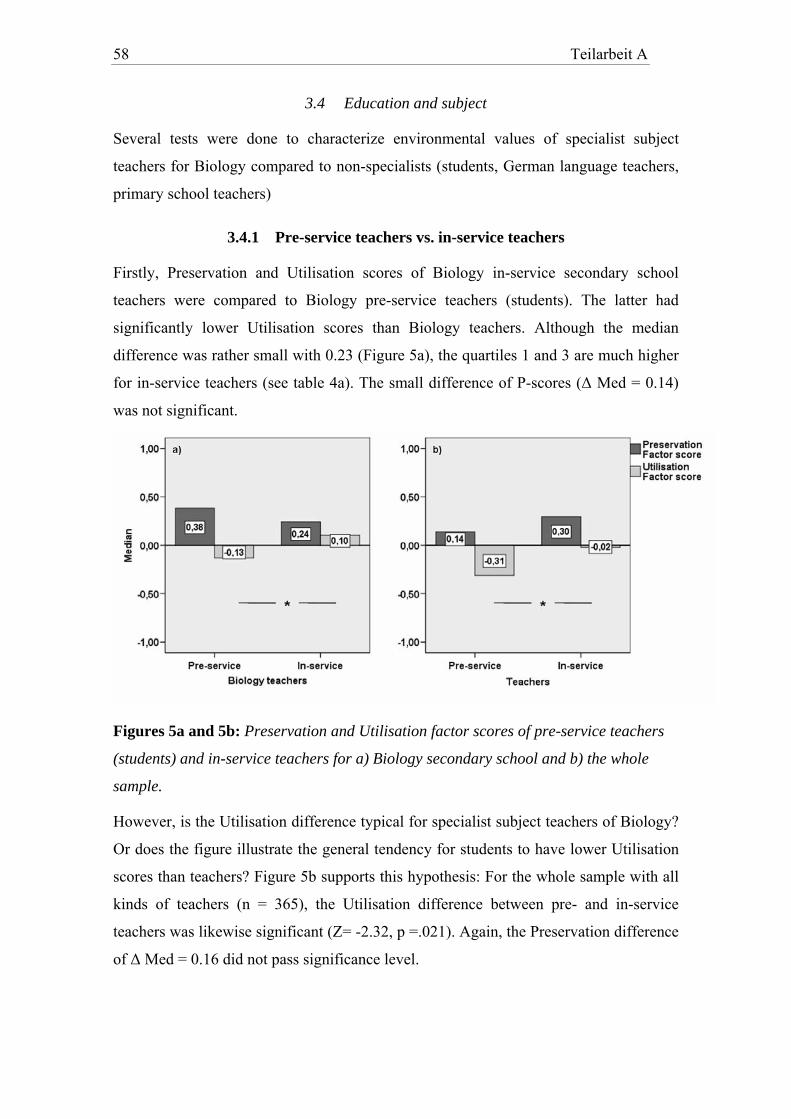
Teilarbeit A 58
3.4 Education and subject
Several tests were done to characterize environmental values of specialist subject
teachers for Biology compared to non-specialists (students, German language teachers,
primary school teachers)
3.4.1 Pre-service teachers vs. in-service teachers
Firstly, Preservation and Utilisation scores of Biology in-service secondary school
teachers were compared to Biology pre-service teachers (students). The latter had
significantly lower Utilisation scores than Biology teachers. Although the median
difference was rather small with 0.23 (Figure 5a), the quartiles 1 and 3 are much higher
for in-service teachers (see table 4a). The small difference of P-scores (Δ Med = 0.14)
was not significant.
Figures 5a and 5b: Preservation and Utilisation factor scores of pre-service teachers
(students) and in-service teachers for a) Biology secondary school and b) the whole
sample.
However, is the Utilisation difference typical for specialist subject teachers of Biology?
Or does the figure illustrate the general tendency for students to have lower Utilisation
scores than teachers? Figure 5b supports this hypothesis: For the whole sample with all
kinds of teachers (n = 365), the Utilisation difference between pre- and in-service
teachers was likewise significant (Z= -2.32, p =.021). Again, the Preservation difference
of Δ Med = 0.16 did not pass significance level.
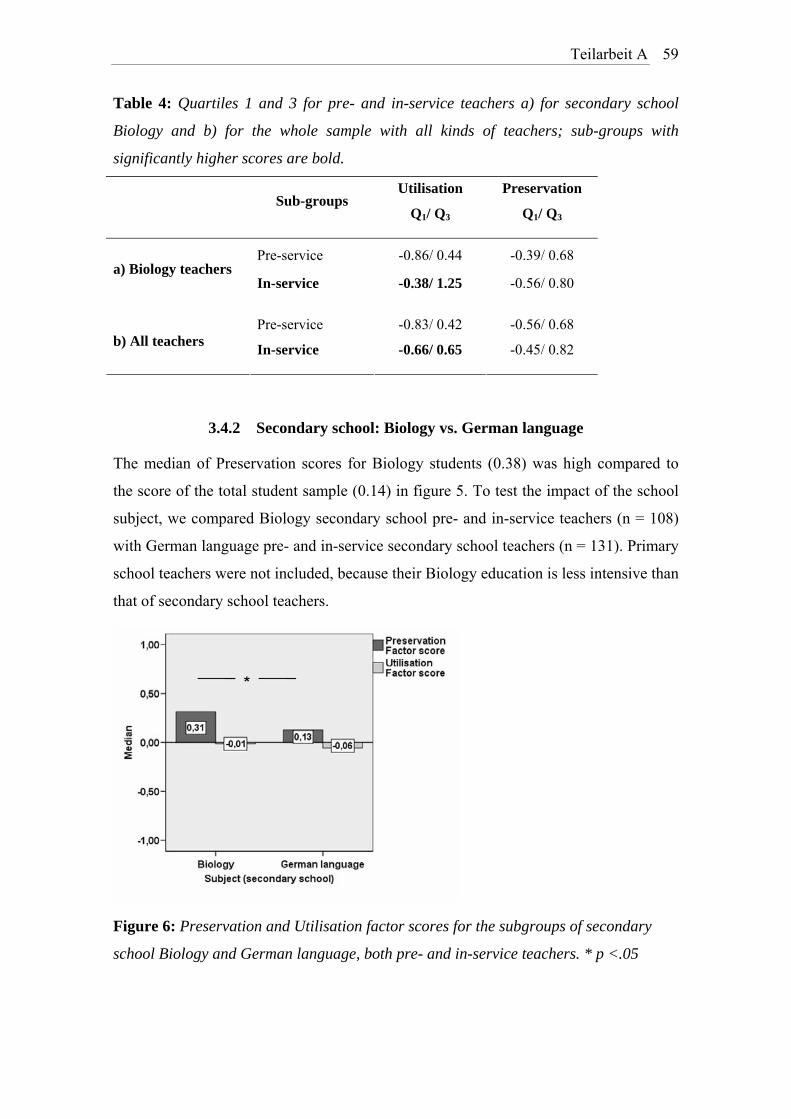
Teilarbeit A
59
Table 4: Quartiles 1 and 3 for pre- and in-service teachers a) for secondary school
Biology and b) for the whole sample with all kinds of teachers; sub-groups with
significantly higher scores are bold.
Sub-groups Utilisation
Q1/ Q3
Preservation
Q1/ Q3
Pre-service -0.86/ 0.44 -0.39/ 0.68 a) Biology teachers
In-service -0.38/ 1.25 -0.56/ 0.80
Pre-service -0.83/ 0.42 -0.56/ 0.68 b) All teachers In-service -0.66/ 0.65 -0.45/ 0.82
3.4.2 Secondary school: Biology vs. German language
The median of Preservation scores for Biology students (0.38) was high compared to
the score of the total student sample (0.14) in figure 5. To test the impact of the school
subject, we compared Biology secondary school pre- and in-service teachers (n = 108)
with German language pre- and in-service secondary school teachers (n = 131). Primary
school teachers were not included, because their Biology education is less intensive than
that of secondary school teachers.
Figure 6: Preservation and Utilisation factor scores for the subgroups of secondary
school Biology and German language, both pre- and in-service teachers. * p <.05
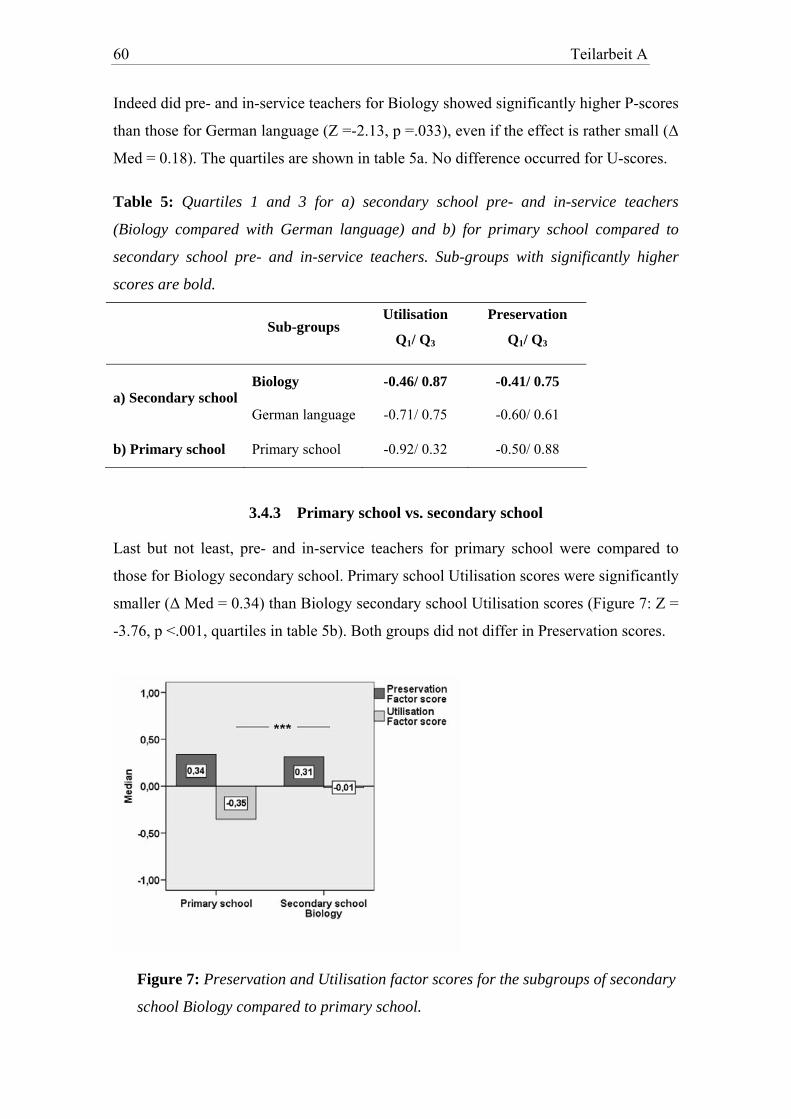
Teilarbeit A 60
Indeed did pre- and in-service teachers for Biology showed significantly higher P-scores
than those for German language (Z =-2.13, p =.033), even if the effect is rather small (Δ
Med = 0.18). The quartiles are shown in table 5a. No difference occurred for U-scores.
Table 5: Quartiles 1 and 3 for a) secondary school pre- and in-service teachers
(Biology compared with German language) and b) for primary school compared to
secondary school pre- and in-service teachers. Sub-groups with significantly higher
scores are bold.
Sub-groups
Utilisation
Q1/ Q3
Preservation
Q1/ Q3
Biology -0.46/ 0.87 -0.41/ 0.75 a) Secondary school
German language -0.71/ 0.75 -0.60/ 0.61
b) Primary school Primary school -0.92/ 0.32 -0.50/ 0.88
3.4.3 Primary school vs. secondary school
Last but not least, pre- and in-service teachers for primary school were compared to
those for Biology secondary school. Primary school Utilisation scores were significantly
smaller (Δ Med = 0.34) than Biology secondary school Utilisation scores (Figure 7: Z =
-3.76, p <.001, quartiles in table 5b). Both groups did not differ in Preservation scores.
Figure 7: Preservation and Utilisation factor scores for the subgroups of secondary
school Biology compared to primary school.
Teilarbeit A
61
4 Discussion
One important aim of this study was to test, whether a two-dimensional model of
ecological values could be found for adults as is was found for pupils. Indeed, the model
was confirmed, although with a few shortcomings: double loadings and loadings with
correct sign but on the complement factor (three items) can be explained by the reduced
number of items (15 instead of 20), the reanalysis of pupils’ data from a previous study
showing similar weaknesses.
Remaining lower factor loadings and communalities in the adult sample may in part be
due to minor changes in item formulation, but may also be a hint that the factors P and
U are optimally represented in adults by other items than in pupils. For example, was
the variance of the item 16 extremely reduced in the adult sample (M = 1.06, SD =
0.35): a great majority strictly opposed the claim of limitless resources, whereas in the
pupil sample the variance was much higher (M = 2.27, SD = 1.11). Further differed the
answer format in this study (a 4-point scale) from that in pupil studies (a 5-point scale)
to force a decision of the subjects. However, it was shown, that a reduction of scale
divisions may also diminish factor loadings and communalities (Martin, Fruchter &
Mathis, 1974).
Additionally, pre- and in-service teachers constitute a relatively specific and homo-
geneous sub-group as for example was shown in a study about the social background
and attitudes of primary school teachers in Germany (Schumacher, 1999): A liberal and
intellectual milieu was characterised as predominant, supporting amongst others
openness and share of responsibility and shaping. Thus, teachers in general may
compose a sub-group with higher ecological values than the public at large. Indeed, the
sample accepts to a high degree the Preservation values (M = 3.46), and rather does not
accept the Utilisation values (M = 1.58). Both scale means show low variance (smaller
than 0.40). Thus, a generalisation to other groups of the population is not possible.
4.1 Association of socio-demographic variables with Environmental Attitudes
Which impact factors were found and did they differ for both scales? The Utilisation
factor scores were generally lower in females and younger persons, also in primary
school pre- and in-service teachers. Preservation factor scores were also lower in
younger persons and, for the senior group, higher in females. Additionally, the school
Teilarbeit A 62
subject Biology was a predictor for higher Preservation scores compared to the subject
German language. Thus, both scales are distinct from each other concerning the impact
of socio-economic variables.
4.1.1 Gender and age
The gender differences in our sample followed our expectations, women showing a
lower U- score than men. Preservation scores of women were significantly higher only
in the age group over 45 years. This is in line with Stern, Dietz, Kalof et al. (1995) who
reported stronger biospheric-altruistic values and higher awareness of consequences to
the biosphere of environmental problems in females. Low Utilisation scores also imply
some awareness of nature endangerment by humans, which is also compatible with
Stern and colleges. Thus, in line with Blaikie (1992), the gender difference was larger in
the senior group, born in the forties and fifties than in juniors.
The differences between age groups may be explained by three different hypotheses. (a)
The “aging” hypothesis claims that younger people, being less integrated in the existing
social order, are more ready to accept legal or life style changes that are supposed to
stop environmental deterioration (Blaikie, 1992; Fransson and Gärling, 1999). (b) The
“cohort” hypothesis assumes that people of the same generation have undergone similar
early socialisation and formative experiences, e.g. the time of the early environmental
movement in the 70ies, forming similar beliefs about environmental issues. (c) The
“period” hypothesis claims that both, aging and cohort processes can be over-ridden by
adaptations to changing circumstances, e.g. changing publicity about the consequences
of environmental change for humans and the biosphere (Stern et al., 1993).
First of all, there are hints to a period effect (c): All three age groups agree with the
Preservation scale, the general item mean averaging at about 3.5, and do slightly
disagree with Utilisation, the item mean scoring about 1.6. In some items there is almost
no variance, e.g. that of the resource problem or that of necessity of conservation. The
low variance may be a consequence of the specificity of our selected sample (only pre-
and in-service teachers, see 4.1), but changing in public awareness of environmental
issues is also a probable interpretation. Nowadays, in Germany, a very high awareness
e.g., of problems related to climate change is given, as reported by Kuckartz,
Rheingans-Heintze and Rädiker (2006).
Furthermore, there are some hints supporting the cohort hypothesis: We found a
tendency of both, Preservation values and Utilisation values to decrease with decreasing
Teilarbeit A
63
age. The senior group, born in the forties and fifties, thus presenting the youth or young
adults in the 60s and 70s - in Blakie’s study (1992) peaking in some sub-scales and in
the female sub-sample - also scored highest in Preservation in our investigation
(significantly compared to the juniors). Indeed as shown in figure 4, this is mainly due
to very high female scores.
On the other hand, this group scores highest in Utilisation, compared as well to the
middle-aged as to the young. Our middle-aged, born in the sixties and seventies, – thus,
in part including Blaikie’s younger cohort showing the highest level of environmental
awareness - scores similar (not significantly different from) to the older ones in
Preservation but significantly lower in Utilisation. An Utilisation item analysis (not
reported here) revealed for older persons to accept to a higher degree than younger ones
human dominance, human right to change nature and human ability to solve environ-
mental problems – which is in line with Blaikie (1992) who found the 25 to 34 year olds
to be most sensible to human use of nature. Our middle-aged and junior persons deny
more clearly than the seniors do that humans were more important than other creatures.
This additional loss of trust in human predominance, occurring between the old and
both younger groups, may in part present an aging effect. However, in part it might
indicate that values, formed by the environmental movement in the seventies and
eighties, had a stronger impact on following generations than on the generation who
developed it. The latter grew up with new global environmental problems in the 80s and
90s, seemingly difficult to be solved like the reduction of the ozone layer or climate
change. This, however, is not consistent with the study of Kuckartz et al. (2006), where
the greatest concern about the endangerment by climate change is shown by older
persons (40 to 69 years old). An alternative interpretation for high Preservation scores
in the elder persons is social desirable responding that was found to increase with
increasing age by some researchers (e. g., Ray and Lovejoy, 2003).
How can we explain that the pre- and in-service teachers of 27 years and less show a
less anthropocentric view, but at the same time in some aspects also detail lower care
and interest about nature than the older groups? Some surveys about the attitudes of
teenagers to nature done in the late 1990s and early 2000s by Brämer (2006) may give a
hint: He describes several seemingly not compatible phenomena in the adolescents of
the last decade. He described them as highly valuing nature as something to be
conserved and vulnerable combined with deprecation of economic usage of nature,
without understanding for the idea of sustainability. On the other hand, he found nature
Teilarbeit A 64
distance: low interest, lack of knowledge about nature and natural products and,
although nature was accessible to most, only little time spent in nature beyond the view
of nature as scenery e.g., for sports. Media, in contrast, have become very important in
their lives. Here we find the tendency of reprobation of nature usage and low interest in
nature on the other hand.
4.1.2 School subject matter and major
The impact of teaching subject and school profile was another important variable: The
decline of Preservation in young people was not found for Biology students. Comparing
Biology pre-and in-service teachers, we do not find a decline in the scores. Selection as
explanation is plausible, as Biology pre- and in-service teachers generally show higher
P-scores than pre- and in-service teachers of German language. The latter result is
consistent with those reported by Pettus, Frary and Teates (1978), comparing science
and social studies teachers’ attitudes toward environmental issues.
That Biology teachers do not show higher P-scores compared to Biology students is to
be said against a potential impact of Biology studies on attitudes. Instead, Biology in-
service teachers have higher Utilisation scores - a result being also found in the whole
pre- and in-service teacher sample, and thus, being very probably a consequence of the
age effect (teachers as the older persons showing higher Utilisation scores than
students) and additionally of gender effect, because the portion of males is higher in
teachers (43%) than in students (17%). Similarly, score pre- and in-service teachers for
primary school lower in Utilisation than those for Biology secondary school – being
probably to a high degree an effect of gender: More than 90% in primary school
teaching are females compared to only 50% females for Biology secondary school.
Altogether, the impact of school subject or major (0.18) was rather small compared to
that of gender and age.
4.2 Outlook
Pre- and in-service teachers to a high degree show pro-environmental attitudes
reflecting enjoyment and conservation of nature on the one hand and awareness of the
endangerment of nature by human activities on the other hand. The two factors
Preservation and Utilisation were retrieved. However, to measure the factors adequately
in future, the full scales developed by Bogner and Wiseman (2006) should be applied,
Teilarbeit A
65
for item reduction brings problems e.g., with double loadings. Still, it may be necessary
to exclude some items showing almost no variance and include new ones, if the scale is
to be applied to teachers.
For adults, as for pupils, we found a low negative correlation for the two factors.
Milfont and Duckitt (2004) claimed that a bi-dimensional model was consistent with the
sustainability debate: We have to find a balance between usage and conservation of
nature. Especially Biology secondary school and primary school teachers have to
develop pupils’ understanding of environmental problems and of a sustainable resource
usage. On the other hand, they need to be careful, not to make nature something
forbidden – because it seems so fragile – and boring due to lots of admonitions and
because it is connected with being instructed as Brämer (2006) has educators consider.
Especially young persons and females, presenting the major part of primary school
teachers, reject an anthropocentric view on nature as an object to be utilised by humans.
It is not clear, however, if and how utilisation values are related to sustainable use of
nature. Gagnon Thompson and Barton (1994) did not find any significant relationship
between anthropocentrism and ecological behaviour (self-reported and observed)
however, they did find a positive one between ecological behaviour and ecocentrism.
We do not know the meaning of an anthropocentric view for teaching environmental
education. It would be interesting to learn about the impact of the Utilisation values on
teachers’ ability to help pupils developing a view on nature not only respectful but also
realistic and not separated from own life style, as is still exemplified through the
average adults’ own lives.
Teilarbeit A 66
References
Blaikie, N. W. H. (1992). The nature and origins of ecological world views: An
Australian study. Social Science Quarterly, 73(1), 144-165.
Blocker, T. J., & Eckberg, D. L. (1989). Environmental issues as women's issues:
General concerns and local hazards. Social Science Quarterly, 70(3), 586-593.
Bogner, F. X., & Wiseman, M. (1997). Environmental perspectives of Danish and
Bavarian pupils: towards a methodological framework. Scandinavian Journal of
Educational Research, 41(1), 53-71.
Bogner, F. X., & Wiseman, M. (1998). Environmental perception of Swiss and
Bavarian pupils: An empirical evaluation. Schweizer Zeitschrift für Soziologie/
Swiss Journal of Sociology, 24(3), 547-566.
Bogner, F. X., & Wiseman, M. (1999). Towards measuring adolescent environmental
perception. European Psychologist, 4, 139-151.
Bogner, F. X., & Wiseman, M. (2002). Environmental perception of French and some
Western European secondary school students. European Journal of Psychology
of Education, 17, 3-18.
Bogner, F. X., & Wiseman, M. (2004). Outdoor Ecology Education and Pupils'
Environmental Perception in Preservation and Utilisation. Science Education
International, 15(1), 27-48.
Bogner, F. X., & Wiseman, M. (2006). Adolescent's attitudes towards nature and
environment: Quantifying the 2-MEV model. Environmentalist, 26, 231-237.
Brämer, R. (2006). Natur obskur - Wie Jugendliche heute Natur erfahren [Nature
obscure - How today's adolescents experience nature]. München: oekom verlag.
Bundesamt, S. (2006). Fast zwei Drittel der Lehrkräfte sind Frauen Pressemitteilung
(Vol. 416). Wiesbaden: © Statistisches Bundesamt, Pressestelle
Dunlap, R. E., & Van Liere, K. D. (1978). The "New Environmental Paradigm": A
proposed measuring instrument and preliminary results. Journal of
Environmental Education, 9, 10-19.
Dunlap, R. E., Van Liere, K. D., Mertig, A. G., & Jones, R. E. (2000). Measuring
endorsement of the New Ecolgical Paradigm: A revised NEP scale. Journal of
Social Issues, 56(3), 425-442.
Eagly, A. H., & Chaiken, S. (1993). The nature of attitudes. In The psychology of
attitudes (pp. 1-21). Fort Worth: Harcourt Brace Jovanovich.
Teilarbeit A
67
Ewert, A., & Baker, D. (2001). Standing for where you sit: An exploratory analysis of
the relationship between academics major and environment beliefs. Environment
and Behavior, 33(5), 687-707.
Fransson, N., & Gärling, T. (1999). Environmental concern: Conceptual definitions,
measurement methods, and research findings. Journal of Environmental
Psychology, 19, 369-382.
Gagnon-Thompson, S. C., & Barton, M. A. (1994). Ecocentric and anthropocentric
attitudes toward the environment. Journal of Environmental Psychology, 14(2),
149-157.
Howell, S. E., & Laska, S. B. (1992). The changing face of the environmental coalition:
A research note. Environment and Behavior, 24(1), 134 -144.
Kuckartz, U., Rheingans- Heintze, A., & Rädiker, S. (2007). Klimawandel aus der Sicht
der deutschen Bevölkerung [Climate change from the view of the German
population] [Electronic Version]. Umweltbewusstsein in Deutschland, 2007
from http://www.umweltbewusstsein.de/ub/deutsch/2006.
Martin, W. S., Fruchter, B., & Mathis, W. J. (1974). An investigation of the effect of the
number of scale intervals on Principle Component Factor Analysis. Educational
and Psychological Measurement, 34(3), 537-545.
Milfont, T. L., & Duckitt, J. (2004). The structure of environmental attitudes: A first-
and second-order confirmatory factor analysis. Journal of Environmental
Psychology, 24, 289-303.
Mohai, P., & Twight, B. W. (1987). Age and environmentalism: An elaboration of the
Buttel model using national survey evidence. Social Science Quarterly, 68(4),
798-815.
Olofsson, A., & Öhman, S. (2006). General beliefs and environmental concern:
transatlantic comparisons. Environment and Behavior, 38(6), 768-790.
Pettus, A. M., Frary, R. B., & Teates, T. G. (1978). The attitudes of science and social
studies teachers toward environmental issues. Journal of Research in Science
Teaching, 15(5), 367-372.
Ray, J. J., & Lovejoy, F. H. (2003). Age-related social desirability responding among
Australian women. The Journal of Social Psychology, 143(5), 669-671.
Schultz, P. W., Shriver, C., Tabanico, J. J., & Khazian, A. M. (2004). Implicit
connections with nature. Journal of Environmental Psychology, 24(1), 31-42.
Teilarbeit A 68
Schumacher, E. (1999). Widersprüche - Selbsttäuschungen - Flexibilität?
(Inconsistencies - self-deceptions - flexibility?). Pädagogik, 9, 36-40.
Schwartz, S. H. (1994). Are there universal aspects in the structure and contents of
human values? . Journal of Social Issues, 50, 19-45.
Stern, P. C., Dietz, T., & Guagnano, G. A. (1995). The New Ecological Paradigm in
social-psychological context. Environment and Behavior, 27(6), 723-743.
Stern, P. C., Dietz, T., & Kalof, L. (1993). Value orientations, gender, and
environmental concern. Environment and Behavior, 25(3), 322-348.
Stern, P. C., Dietz, T., Kalof, L., & Guagnano, G. A. (1995). Values, beliefs, and
proenvironmental action: Attitude formation toward emergent attitude objects.
Journal of Applied Social Psychology, 25(18), 1611-1636.
Van Liere, K. D., & Dunlap, R. E. (1980). Social bases of environmental concern: A
review of hypotheses, explanations and empirical evidence. Public Opinion
Quarterly, 44(181-197).
Van Liere, K. D., & Dunlap, R. E. (1981). Environmental concern: does it make a
difference how it’s measured?. Environment and Behavior, 13(6), 651-676.
Wiseman, M., & Bogner, F. X. (2003). A higher-order model of ecological values and
its relationship to personality. Personality and Individual Differences, 34, 783-
794.
7.2 Teilarbeit B
69
7.2 Teilarbeit B
B Florian G. Kaiser, Britta Oerke, & Franz X. Bogner, F. X. (2007).
Behavior-based environmental attitude: Development of an instrument for adolescents.
Journal of Environmental Psychology 27, 242-251.
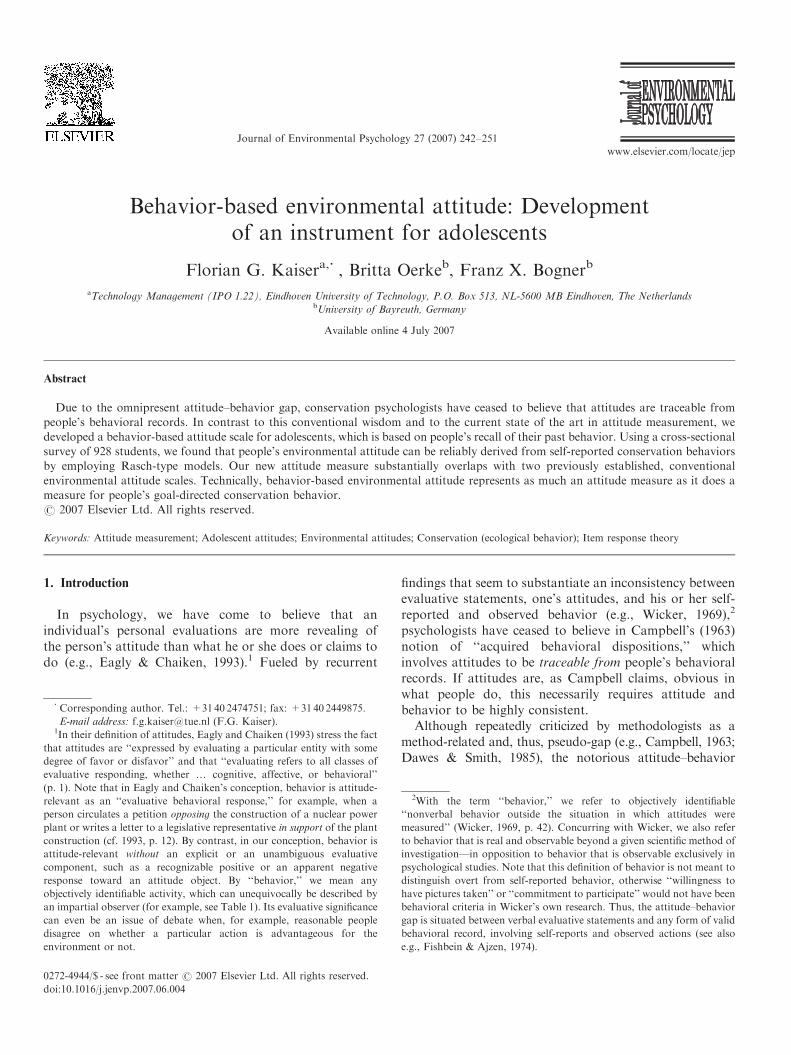
Journal of Environmental Psychology 27 (2007) 242–251
Behavior-based environmental attitude: Developmentof an instrument for adolescents
Florian G. Kaisera,�, Britta Oerkeb, Franz X. Bognerb
aTechnology Management (IPO 1.22), Eindhoven University of Technology, P.O. Box 513, NL-5600 MB Eindhoven, The NetherlandsbUniversity of Bayreuth, Germany
Available online 4 July 2007
Abstract
Due to the omnipresent attitude–behavior gap, conservation psychologists have ceased to believe that attitudes are traceable from
people’s behavioral records. In contrast to this conventional wisdom and to the current state of the art in attitude measurement, we
developed a behavior-based attitude scale for adolescents, which is based on people’s recall of their past behavior. Using a cross-sectional
survey of 928 students, we found that people’s environmental attitude can be reliably derived from self-reported conservation behaviors
by employing Rasch-type models. Our new attitude measure substantially overlaps with two previously established, conventional
environmental attitude scales. Technically, behavior-based environmental attitude represents as much an attitude measure as it does a
measure for people’s goal-directed conservation behavior.
r 2007 Elsevier Ltd. All rights reserved.
Keywords: Attitude measurement; Adolescent attitudes; Environmental attitudes; Conservation (ecological behavior); Item response theory
1. Introduction
In psychology, we have come to believe that anindividual’s personal evaluations are more revealing ofthe person’s attitude than what he or she does or claims todo (e.g., Eagly & Chaiken, 1993).1 Fueled by recurrent
findings that seem to substantiate an inconsistency betweenevaluative statements, one’s attitudes, and his or her self-reported and observed behavior (e.g., Wicker, 1969),2
psychologists have ceased to believe in Campbell’s (1963)notion of ‘‘acquired behavioral dispositions,’’ whichinvolves attitudes to be traceable from people’s behavioralrecords. If attitudes are, as Campbell claims, obvious inwhat people do, this necessarily requires attitude andbehavior to be highly consistent.Although repeatedly criticized by methodologists as a
method-related and, thus, pseudo-gap (e.g., Campbell, 1963;Dawes & Smith, 1985), the notorious attitude–behavior
ARTICLE IN PRESS
www.elsevier.com/locate/jep
0272-4944/$ - see front matter r 2007 Elsevier Ltd. All rights reserved.
doi:10.1016/j.jenvp.2007.06.004
�Corresponding author. Tel.: +3140 2474751; fax: +31 40 2449875.
E-mail address: [email protected] (F.G. Kaiser).1In their definition of attitudes, Eagly and Chaiken (1993) stress the fact
that attitudes are ‘‘expressed by evaluating a particular entity with some
degree of favor or disfavor’’ and that ‘‘evaluating refers to all classes of
evaluative responding, whether y cognitive, affective, or behavioral’’
(p. 1). Note that in Eagly and Chaiken’s conception, behavior is attitude-
relevant as an ‘‘evaluative behavioral response,’’ for example, when a
person circulates a petition opposing the construction of a nuclear power
plant or writes a letter to a legislative representative in support of the plant
construction (cf. 1993, p. 12). By contrast, in our conception, behavior is
attitude-relevant without an explicit or an unambiguous evaluative
component, such as a recognizable positive or an apparent negative
response toward an attitude object. By ‘‘behavior,’’ we mean any
objectively identifiable activity, which can unequivocally be described by
an impartial observer (for example, see Table 1). Its evaluative significance
can even be an issue of debate when, for example, reasonable people
disagree on whether a particular action is advantageous for the
environment or not.
2With the term ‘‘behavior,’’ we refer to objectively identifiable
‘‘nonverbal behavior outside the situation in which attitudes were
measured’’ (Wicker, 1969, p. 42). Concurring with Wicker, we also refer
to behavior that is real and observable beyond a given scientific method of
investigation—in opposition to behavior that is observable exclusively in
psychological studies. Note that this definition of behavior is not meant to
distinguish overt from self-reported behavior, otherwise ‘‘willingness to
have pictures taken’’ or ‘‘commitment to participate’’ would not have been
behavioral criteria in Wicker’s own research. Thus, the attitude–behavior
gap is situated between verbal evaluative statements and any form of valid
behavioral record, involving self-reports and observed actions (see also
e.g., Fishbein & Ajzen, 1974).
inconsistency continues to be psychology’s and, correspond-ingly, conservation psychology’s conventional wisdom(e.g., Vining & Ebreo, 2002). Unsurprisingly, evaluativestatements, such as a behavior’s subjective utilities and costs,are regularly employed in the assessment of people’sattitudes, which in turn are used to predict people’sbehavioral responses (cf. Ajzen, 1991). By employing sucha planned behavior framework in the conservation domain,Kaiser and colleagues found evaluative statements toaccount for behavior with an accuracy of about 70–80%(e.g., Kaiser, Hubner, & Bogner, 2005; Kaiser, Schultz, &Scheuthle, 2007). In opposition to the state of the art, theyadopted a special kind of behavior criterion, which webelieve can also be used as a behavior-based attitudemeasure.
In this paper, we extend previous research in threedirections. First, we develop an environmental attitudescale for adolescents exclusively based on behavioral self-reports, employing Kaiser and colleagues’ goal-directedbehavior approach (e.g., Kaiser, 2004; Kaiser & Wilson,2004), which is fully based on people’s recall of theconservation behaviors they engage in. To our knowledge,no such measure is presently available. Second, we examinewhether our new behavior-based measure shares substan-tial amounts of variance with a conventional environ-mental attitude instrument for adolescents—based onevaluative statements—consisting of two scales: Preserva-tion and Utilization (e.g., Bogner & Wiseman, 1999;Wiseman & Bogner, 2003). Third, since behavior-basedattitude is necessarily a composite of various behavioralresponses and since conservation behaviors are, tradition-ally, regarded as falling on several dimensions (e.g.,Gatersleben, Steg, & Vlek, 2002), we explore whether amore parsimonious one-dimensional model would beempirically feasible regardless of prior findings to thecontrary.
2. Environmental attitude
Traditionally, the object of one’s environmental attitudeis either the natural environment itself, some aspects of it(such as air quality), or conservation behavior (e.g.,recycling). While attitude toward behavior normally refersto research within planned behavior theory (e.g., Staats,2003), attitude toward the environment is commonlyrelated to a multiple component approach in which severalattitude aspects are distinguished (for an overview seeDunlap & Jones, 2002). The former attitude traditionoriginates in Icek Ajzen’s popular social psychologicalmodel (e.g., Ajzen, 1991). The latter, by contrast, can betraced back to research by Maloney and Ward (1973) inwhich the distinction was made between affective, inten-tional, and behavioral attitude components.
Schultz (2001) classifies environmental attitude usingegoistic, biospheric, and altruistic concern. Each concernidentifies a potential beneficiary of a more conservational,or a potential victim of a less conservational lifestyle:
oneself, the biosphere, or other people. In the so-calledNew Environmental (Ecological) Paradigm (Dunlap, VanLiere, Mertig, & Jones, 2000), we find a similar splitbetween people’s egoistic or utilitarian concerns, and theirmore altruistic (including biospheric) ones. Here, thedecision to behave in a conservational manner is maximallyreduced to a conflict between one’s self-interest and that ofothers (the biosphere and other people). This is logicallysensible, because environmental assets are a collective butlimited good. Each person’s consumption of thoseresources necessarily diminishes them at the expense ofothers, either people or the entire biosphere.Milfont and Duckitt (2004) likewise concluded that the
themes in most contemporary environmental attitudemodels form a two-dimensional space. This space repre-sents either an egoistic/utilitarian or an altruistic-type ofconcern, which they call utilization and preservation inagreement with earlier research (e.g., Bogner & Wiseman,1999; Wiseman & Bogner, 2003). Expectedly, preservationaddresses a more or less selfless conserving and protectingof the natural environment (grounded in either altruistic orbiospheric values). Utilization, by contrast, describes theuse of the natural environment with oneself as the corebeneficiary (i.e., grounded in self-interest and egoisticvalues). To our knowledge, Bogner and Wiseman’s (1999)instrument is the only traditional attitude measurespecifically designed for adolescents. Moreover, it isdeliberately designed to assess environmental attitude inits two components: preservation and utilization.
3. Behavior-based environmental attitude
Conceptualizing environmental attitude as the behavior-al means by which people implement these beliefs implies asolid link between a person’s attitude and his or herbehavior. Not surprisingly, an attitude–behavior gapseriously compromises any ambition to identify a person’sattitude by means of behavior inspection. The coreproblem with behavior is that, for example, bike ridingcan superficially look the same regardless of what attitudethe bike rider has; whether bike riding is used as a means(a) to stay healthy, (b) to save money, or (c) to actconservationally. Fortunately though, an individual atti-tude behind a specific behavior can be identified with asystematic inspection of a set of a person’s behavioralresponses theoretically implied by the particular attitude.If a person holds a particular attitude object in high
regard, for example the environment, we can expect thisperson to engage in all sorts of activities (conventionallyrecognized as environment-relevant). Such a composite ofactivities also implies that people can select from variousbehavioral alternatives to realize their individual level ofenvironmental attitude, which leaves them with choices.Instead of running energy-efficient washing programs,people can abstain from using a dryer or focus more onwhat washing detergents they use. A person’s appreciationfor a certain attitude object is most obvious in the face of
ARTICLE IN PRESSF.G. Kaiser et al. / Journal of Environmental Psychology 27 (2007) 242–251 243
increasingly demanding hurdles or progressively intoler-able sacrifices (cf. Schultz & Oskamp, 1996). Necessarily,the more obstacles someone overcomes and the more efforta person expends along the way to implement his or herattitude, the more evident a person’s commitment is to theparticular cause. Why would someone suffer every morningon a bike through rain and snow, switch to a vegetariandiet, struggle with his or her kids to save warm water, and,at the same time, spend money on home insulation if onewas not committed to environmental preservation? Like-wise, when the tiniest difficulty or resistance is enough tostop a person from taking behavioral steps, the devotion tothe attitude-implied goal must be rather low. When aperson, for instance, admits to be environmentally or-iented, but insists on car use or avoids recycling, he or sheprobably does not care about environmental preservationthat much.
Furthermore, any behavior being performed, figurativelyspeaking, involves costs as it requires personal resources,such as time, money, or effort. If one’s attitude level can beexpressed by a variety of different acts, we can anticipate aprudent selection of the behavioral means to its manifesta-tion. Naturally, people commonly prefer the more con-venient, less socially sanctioned actions over the morecomplicated, strenuous, or pricey ones. Thus, we canassume that people favor less demanding actions over moredemanding ones. This becomes tangible in the relativepopularity of various conservation behaviors (i.e., therelative number of persons who act accordingly). Thisoverall popularity of a behavior is, in turn, anticipated tobe a function of two components: (a) people’s dispositionto act, their environmental attitude, and (b) the compositionof all the figurative costs of a particular act. Kaiser andcolleagues corroborated that the Rasch model can be usedto describe this functional relationship (e.g., Kaiser, 1998;Kaiser & Wilson, 2000).
By using the Rasch model (named after the Danishmathematician Georg Rasch), Kaiser and Wilson (2004)describe the probability (technically the odds ratio) toengage in a specific behavior as the arithmetic difference
between a person’s attitude and the figurative costs (i.e., thedifficulty) of a specific behavior. The classical Rasch modeland, thus, the functional link between a person’s disposi-tion and his or her probability to engage in a specificbehavior is mathematically depicted with the followingformula (for more details see e.g., Bond & Fox, 2001):
lnpki
1� pki
� �¼ yk � di
In this model, the natural logarithm of the odds ratio ofthe probability (pki) of person k’s engagement relative tothe probability of nonengagement (1�pki) in a specificconservation behavior i is given by the difference betweenk’s disposition to act (i.e., his or her environmentalattitude, yk) and the difficulty of behavior i (i.e., thecomposite of all the figurative costs of a behavior, di). Notethat in this mathematical formalization people are distin-
guishable with respect to their attitude levels, andbehaviors are distinguishable by how difficult they are torealize. By applying the Rasch model and by systematicallyemploying the difficulty-dependent order of the variousconservation behaviors in its measurement, Kaiser andcolleagues were additionally able to circumvent some well-known technical problems of traditional factor analyticalapproaches when involving behavior in a compositemeasure. The most prominent of these problems arisesfrom the fact that behavior is notorious for its remarkablevariability in difficulty. For example, it is rather unlikelypeople own solar panels, while it is very probable that theyrecycle glass (cf. Kaiser, Frick, & Stoll-Kleemann, 2001).Conventional factor analyses typically result in so-calleddifficulty factors when dealing with extremely differentitem difficulties (Ferguson, 1941; see also Bond & Fox,2001).
4. Research goals
Our study aims to develop an environmental attitudeinstrument for adolescents that is exclusively based onbehavioral self-reports. Since behavior-based environmen-tal attitude necessarily is a composite of various behaviors,we empirically compared a one-dimensional measureagainst a six-dimensional one to explore whether the moreparsimonious model would be empirically worse atpredicting the data. Moreover, we validate our newbehavior-based attitude scale with a traditional, well-established environmental attitude instrument for adoles-cents entirely based on evaluative statements.
5. Method
5.1. Participants and procedures
Late 2004 and early 2005, a convenience sample of ninesecondary schools (three of medium and six of highestcertification) was selected in Bavaria, Germany. The latterschools represented 69.1% of the students. Three schoolswere situated in municipalities with less than 25,000residents, five in mid-sized towns (25,000–100,000 resi-dents), and one school was located in a city with more than100,000 residents. Questionnaires were distributed to theteachers, who had their classes fill in the surveys at theirconvenience. Of the questionnaires that were sent out, 928(89.8%) were completed. The pupils’ mean age was 13.3(S.D. ¼ 1.8, range: 9.5–18.3); 60.3% of the pupils weremale. Overall, our sample cannot be regarded as repre-sentative. However, for the purpose of our research, that isscale development and the comparison of the strengths ofrelationships, representativity is less of an issue as long asthe participants reflect a wide range of variability in theexplored variables.
ARTICLE IN PRESSF.G. Kaiser et al. / Journal of Environmental Psychology 27 (2007) 242–251244
5.2. Measures
We calibrated three different instruments: (a) a tradi-tional two-dimensional environmental attitude measure foradolescents previously established, (b) two novel Rasch-model-based instruments representing behavior-based en-vironmental attitude, and (c) a set of distinct conventionalconservation behavior scales. For the latter, we factoranalyzed 33 of the 40 behavior items that we employed inthe Rasch-scale calibrations.
Traditional environmental attitude consists of the twoorthogonal preservation and utilization factors (e.g.,Wiseman & Bogner, 2003). Preservation was derived fromstudents’ responses to eight items, such as ‘‘smokingchimneys make me angry, because they indicate pollution.’’Utilization was measured with 11 items, such as ‘‘onlyuseful plants and animals deserve protection.’’ All itemsinvolved a five-point Likert scale (1 ¼ totally incorrect,5 ¼ totally correct). Conventional principal factors’ ex-traction with varimax rotation confirmed the proposedtwo-factor solution. Overall, the two-factor model ac-counted for 39.1% of the common variance in the data; 26(i.e., 15%) of the residuals exceeded a value of .05 (withonly two above .10, yet still below .15). Both scales are inline with previous calibrations and reveal acceptableinternal consistencies (Preservation a ¼ .81; Utilizationa ¼ .78).
Behavior-based environmental attitude is a composite of40 behavior items (see Table 1), of which 20 were adoptedfrom Kaiser and Wilson (2004). The behaviors can begrouped into six domains: energy conservation, mobilityand transportation, waste avoidance, recycling, consumer-ism, and vicarious behaviors toward conservation. In thequestionnaire, there were no domain labels introduced, andwe noncommittally referred to the behaviors as ‘‘a list ofactions.’’ Also, the behaviors were haphazardly arrangedwithin blocks of items with identical response options.
Seven more routine or customary types of behaviors,such as refusing battery-operated appliances (item #17 inTable 1) were examined with a yes/no format (indicatingeither ‘‘ecological engagement’’ or ‘‘nonengegement’’).Others (n ¼ 33), such as buying certified organic foods(item #24), were later recoded from a polytomous responseformat to a dichotomous one by collapsing the responses‘‘never,’’ ‘‘seldom,’’ and ‘‘occasionally’’ into negativeresponses (indicating ‘‘unreliable ecological engagement’’)and ‘‘often’’ and ‘‘always’’ into positive responses (indicat-ing ‘‘reliable ecological engagement’’). This recoding is inline with previous similar scale calibrations (e.g., Kaiser,1998; Kaiser & Wilson, 2004). The measure had to be takento make individual responses more predictable. In otherwords, participants were found to be inconsistent in usingthe more diverse response alternatives; what one personcalls ‘‘seldom’’ is ‘‘occasionally’’ for another and what is‘‘often’’ for one can be ‘‘always’’ for another (for a moredetailed discussion, see Kaiser & Wilson, 2000). Of allitems, 14 were negatively formulated. Negative responses
to negatively formulated items (i.e., unecological beha-viors) were recoded as ‘‘ecological engagement’’ responsesand vice versa. For all items, ‘‘I don’t know’’ was aresponse alternative when an answer was not possible: suchresponses were treated as missing values. Of all behaviorstatements, 7.0% were found to be missing. Note thatRasch model calibrations and, thus, person score estima-tions can be achieved even with incomplete data records asthis estimation is based on a maximum likelihoodapproach (for more details see e.g., Embretson & Reise,2000).
Traditional conservation behavior was established with 33of the 40 behaviors, which originally had a five-pointresponse format, using exploratory factor analyses, whichare based on Pearson correlations. This was done for tworeasons: (a) to reflect the conventional way of calibrating ascale in this research tradition (e.g., Gatersleben et al.,2002), and (b) to avoid artificially reducing variance bymeans of dichotomization.
5.3. Statistical analysis
Analogous to Kaiser and Wilson (2004), we postulated asix-dimensional model and compared it to a one-dimen-sional solution by applying the multidimensional randomcoefficient multinomial logit (MRCML) model, beinga multidimensional extension of the traditional Raschmodel introduced by Adams, Wilson, and Wang (1997).Similar to a confirmatory factor analysis, the MRCMLmodel allows us to test a specific, predicted item-factornetwork. In the current case, each item is assigned toonly one dimension (called a domain in Table 1).Thus, multidimensionality solely exists on the conceptlevel and not on the item level, equivalent to a simplestructure in factor analysis. Except for the split into sixdimensions, the model used is identical to the classicalRasch model.
6. Results
The present findings are reported in three sections. First,we compare the calibrations of the 40 conservationbehaviors in Table 1 based on two Rasch-type models asa classical one-dimensional and as an MRCML-based six-dimensional attitude measure. Second, we calibrate 33 ofthe 40 behaviors of Table 1 as conventional conservationbehavior measures by means of exploratory factor ana-lyses. Third, we present data in support of our hypothesisthat behavior-based attitude substantially shares informa-tion with traditional environmental attitude measures andconsiderably overlaps with conventionally composed con-servation behavior scales.
6.1. Structure of behavior-based environmental attitude
General model fit was assessed based on the G2 statistic,which is a log-likelihood statistic that is approximately
ARTICLE IN PRESSF.G. Kaiser et al. / Journal of Environmental Psychology 27 (2007) 242–251 245
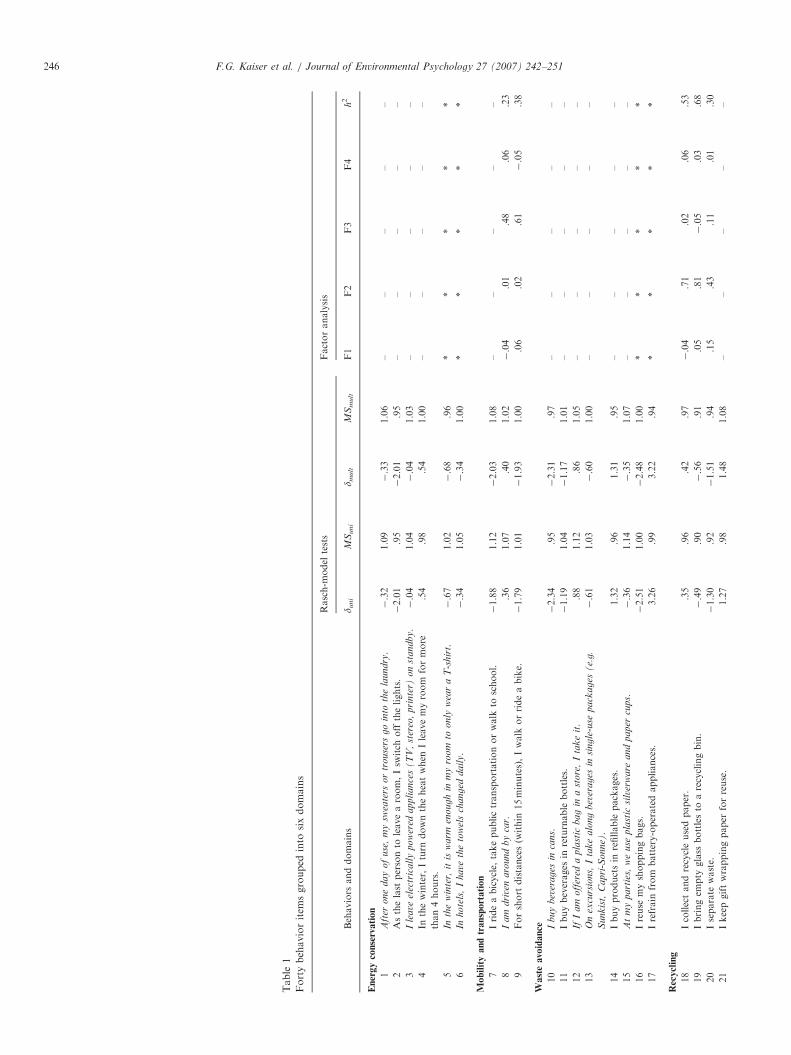
ARTICLE IN PRESS
Table
1
Fortybehavioritem
sgrouped
into
sixdomains
Rasch-m
odel
tests
Factoranalysis
Behaviors
anddomains
d uni
MS
uni
d mult
MS
mult
F1
F2
F3
F4
h2
Energyconservation
1A
fter
one
day
of
use
,m
ysw
eate
rsor
trouse
rsgo
into
the
laundry.
�.32
1.09
�.33
1.06
––
––
–
2Asthelast
personto
leavearoom,Isw
itch
off
thelights.
�2.01
.95
�2.01
.95
––
––
–
3I
leave
elec
tric
all
ypow
ered
appli
ance
s(T
V,
ster
eo,
pri
nte
r)on
standby.
�.04
1.04
�.04
1.03
––
––
–
4In
thewinter,Iturn
downtheheatwhen
Ileavemyroom
formore
than4hours.
.54
.98
.54
1.00
––
––
–
5In
the
win
ter,
itis
warm
enough
inm
yro
om
toonly
wea
ra
T-s
hir
t.�.67
1.02
�.68
.96
**
**
*
6In
hote
ls,
Ihave
the
tow
els
changed
dail
y.
�.34
1.05
�.34
1.00
**
**
*
Mobilityandtransportation
7Irideabicycle,
takepublictransportationorwalk
toschool.
�1.88
1.12
�2.03
1.08
––
––
–
8I
am
dri
ven
aro
und
by
car.
.36
1.07
.40
1.02
�.04
.01
.48
.06
.23
9Forshort
distances(w
ithin
15minutes),Iwalk
orrideabike.
�1.79
1.01
�1.93
1.00
.06
.02
.61
�.05
.38
Wasteavoidance
10
Ibuy
bev
erages
inca
ns.
�2.34
.95
�2.31
.97
––
––
–
11
Ibuybeverages
inreturnable
bottles.
�1.19
1.04
�1.17
1.01
––
––
–
12
IfI
am
off
ered
apla
stic
bag
ina
store
,I
tak
eit.
.88
1.12
.86
1.05
––
––
–
13
On
excu
rsio
ns,
Ita
ke
alo
ng
bev
erages
insi
ngle
-use
pack
ages
(e.
g.
Sunk
ist,
Capri
-Sonne).
�.61
1.03
�.60
1.00
––
––
–
14
Ibuyproductsin
refillable
packages.
1.32
.96
1.31
.95
––
––
–
15
At
my
part
ies,
we
use
pla
stic
silv
erw
are
and
paper
cups.
�.36
1.14
�.35
1.07
––
––
–
16
Ireuse
myshoppingbags.
�2.51
1.00
�2.48
1.00
**
**
*
17
Irefrain
from
battery-operatedappliances.
3.26
.99
3.22
.94
**
**
*
Recycling
18
Icollectandrecycleusedpaper.
.35
.96
.42
.97
�.04
.71
.02
.06
.53
19
Ibringem
pty
glass
bottlesto
arecyclingbin.
�.49
.90
�.56
.91
.05
.81
�.05
.03
.68
20
Iseparate
waste.
�1.30
.92
�1.51
.94
.15
.43
.11
.01
.30
21
Ikeepgiftwrappingpaper
forreuse.
1.27
.98
1.48
1.08
––
––
–
F.G. Kaiser et al. / Journal of Environmental Psychology 27 (2007) 242–251246
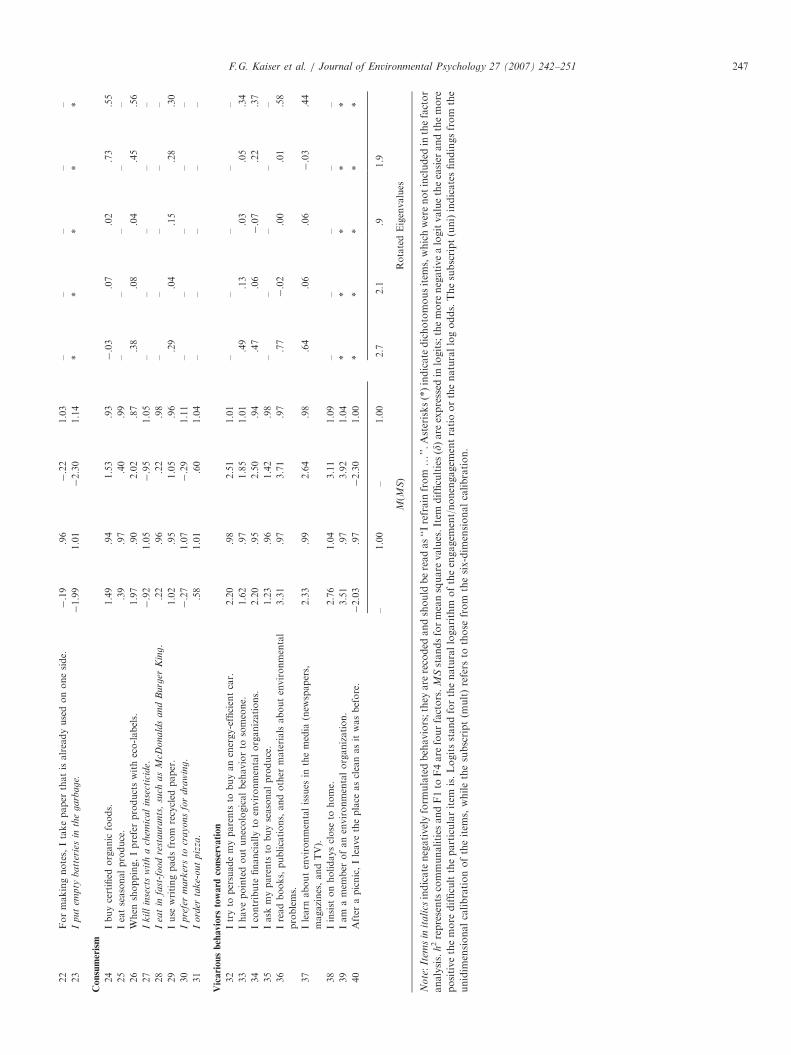
ARTICLE IN PRESS22
Formakingnotes,Itakepaper
thatisalreadyusedononeside.
�.19
.96
�.22
1.03
––
––
–
23
Iput
empty
batt
erie
sin
the
garb
age.
�1.99
1.01
�2.30
1.14
**
**
*
Consumerism
24
Ibuycertified
organic
foods.
1.49
.94
1.53
.93
�.03
.07
.02
.73
.55
25
Ieatseasonalproduce.
.39
.97
.40
.99
––
––
–
26
When
shopping,Ipreferproductswitheco-labels.
1.97
.90
2.02
.87
.38
.08
.04
.45
.56
27
Ik
ill
inse
cts
wit
ha
chem
ical
inse
ctic
ide.
�.92
1.05
�.95
1.05
––
––
–
28
Iea
tin
fast
-food
rest
aura
nts
,su
chas
McD
onald
sand
Burg
erK
ing.
.22
.96
.22
.98
––
––
–
29
Iuse
writingpadsfrom
recycled
paper.
1.02
.95
1.05
.96
.29
.04
.15
.28
.30
30
Ipre
fer
mark
ers
tocr
ayons
for
dra
win
g.
�.27
1.07
�.29
1.11
––
––
–
31
Iord
erta
ke-
out
piz
za.
.58
1.01
.60
1.04
––
––
–
Vicariousbehaviors
toward
conservation
32
Itryto
persuademyparents
tobuyanenergy-efficientcar.
2.20
.98
2.51
1.01
––
––
–
33
Ihavepointedoutunecologicalbehaviorto
someone.
1.62
.97
1.85
1.01
.49
.13
.03
.05
.34
34
Icontribute
financiallyto
environmentalorganizations.
2.20
.95
2.50
.94
.47
.06
�.07
.22
.37
35
Iask
myparents
tobuyseasonalproduce.
1.23
.96
1.42
.98
––
––
–
36
Ireadbooks,publications,andother
materialsaboutenvironmental
problems.
3.31
.97
3.71
.97
.77
�.02
.00
.01
.58
37
Ilearn
aboutenvironmentalissues
inthemedia
(new
spapers,
magazines,andTV).
2.33
.99
2.64
.98
.64
.06
.06
�.03
.44
38
Iinsist
onholidaysclose
tohome.
2.76
1.04
3.11
1.09
––
––
–
39
Iam
amem
ber
ofanenvironmentalorganization.
3.51
.97
3.92
1.04
**
**
*
40
After
apicnic,Ileavetheplace
ascleanasitwasbefore.
�2.03
.97
�2.30
1.00
**
**
*
–1.00
–1.00
2.7
2.1
.91.9
M(M
S)
RotatedEigenvalues
No
te:
Item
sin
ita
lics
indicate
negativelyform
ulatedbehaviors;they
are
recoded
andshould
bereadas‘‘Irefrain
from
y’’.Asterisks(*)indicate
dichotomousitem
s,whichwerenotincluded
inthefactor
analysis.
h2representscommunalities
andF1to
F4are
fourfactors.
MSstandsformeansquare
values.Item
difficulties(d)are
expressed
inlogits;themore
negativealogitvaluetheeasier
andthemore
positivethemore
difficulttheparticularitem
is.Logitsstandforthenaturallogarithm
oftheengagem
ent/nonengagem
entratioorthenaturallogodds.Thesubscript(uni)indicatesfindingsfrom
the
unidim
ensionalcalibrationoftheitem
s,whilethesubscript(m
ult)refers
tothose
from
thesix-dim
ensionalcalibration.
F.G. Kaiser et al. / Journal of Environmental Psychology 27 (2007) 242–251 247
w2-distributed (cf. Adams et al., 1997). Overall, the data-modelprediction fit of a six-dimensional structure was G2(61) ¼33800.4. The comparable fit for a one-dimensional model wasG2(41) ¼ 34117.2. Evidently, the distinction of six-dimensionsresults in a significantly better model fit (DG2(20) ¼ 316.8,po.001).
However, despite the statistical significance, distinguish-ing six attitudinal dimensions could still be of onlymarginal practical relevance. This notion is fueled by thefact that the six-dimensional attitude space is highlyoblique. Accordingly, we found—of the 15 bivariatecorrelations corrected for measurement error attenua-tion—11 to be high, between r ¼ .54 and r ¼ .86. In otherwords, deriving recycling attitude from another one, suchas attitude toward consumerism, is largely possible. Onlyattitude toward mobility appears to be less strongly linkedto four of the other five types of behavior-based attitudes:waste avoidance (r ¼ .42), consumerism (r ¼ .41), recycling(r ¼ .40), and vicarious behavior (r ¼ .21).
To come up with a more conclusive picture regardingpractical relevance, we compared the average residuals ofthe six- and the one-dimensional model, which representsthe two models’ concrete ability to predict the responses ofthe participants. Technically, we averaged the absolute (i.e.,ignoring the sign) difference of the model-implied, expectedresponses and the observed person responses (i.e., zero orone) per model. Then, we contrasted the two numbers witheach other (for a similar approach, see Kaiser & Wilson,2004). Overall, the six-dimensional model turned out to havean average residual value of Mres ¼ .288, whereas the one-dimensional model shows a mean residual of Mres ¼ .308. Insum, the accuracies of the model predictions seem very muchalike. On average, the more complex model raised theprobability .02 units closer to the data. In other words, if theactual number was a one (i.e., acting accordingly) and theone-dimensional model would have predicted an expectedvalue of p ¼ .692, then the six-dimensional model wouldhave anticipated a value of p ¼ .712. Evidently, it is ofnegligible practical relevance that the different behaviors arecategorized into different attitudinal dimensions. A one-dimensional scale is almost as good at predicting the data.A similar conclusion can be drawn if we inspect the fitstatistics for the specific items (see Table 1).
Due to the relatively large sample sizes, we rely on the meansquare (MS) statistics—weighted by the item variance—in theassessment of fit (for more details, see Bond & Fox, 2001). Forexample, the averaged MS of .90 corresponds to a 10% lack ofand a MS of 1.10 signifies a 10% excess of variation in themodel prediction compared to what is in the data. Three items(7.5%) do not fit the one-dimensional 40-item Rasch scale withMS-values above 1.10 or below .90, namely, MS#7 ¼ 1.12,MS#12 ¼ 1.12, and MS#15 ¼ 1.14 (see Table 1, column MSuni).Yet, none of the behaviors falls outside the tolerable range offit (i.e., .80oMSo1.20; cf. Wright, Linacre, Gustafson, &Martin-Lof, 1994).
When the 40 conservation behaviors are calibrated as asix-dimensional measure using the MRCML model, then
the fit statistics of the items are as follows. Again, threebehaviors (7.5%) had MS-values above 1.10 or below .90,namely, MS#23 ¼ 1.14, MS#26 ¼ .87, and MS#30 ¼ 1.11(see Table 1, column MSmult). Once more, all behaviors fallwithin the acceptable range of fit (i.e., .80oMSo1.20).Generally, the MS fit statistics for the 40 behaviors are veryreasonable for both the one and the six-dimensional model.They are certainly not worse for the one-dimensionalmeasure. Moreover, the estimated behavior difficulties forboth solutions seem fairly comparable (see Table 1). Notsurprisingly, a multidimensional set of behavior-basedenvironmental attitudes can be collapsed into a singleattitude dimension without a noteworthy loss of fit. Inother words, assessing environmental attitude based on aone-dimensional, classical Rasch model is possible. Thismeasure has a ‘‘separation reliability’’ of r ¼ .80, and aninternal consistency of a ¼ .78 (N ¼ 928). Note that theseparation reliability represents the ratio between the trueand estimated variance of people’s environmental attitudeand, thus, is in line with a classical definition of reliability(for more details, see e.g., Bond & Fox, 2001).
6.2. Conventional measures of conservation behavior
Principal factors’ extraction with a direct obliminrotation was used to find a robust solution with a solidproportion of explained variance that also reflects thedomains of the 33 analyzed behaviors (the rotationcriterion was set at a conventional weight of �.5).Behaviors were retained if the communality (h2) was atleast .20, and if the item had a non-trivial loading (i.e.,aX.25) on the a priori anticipated factor (see Table 1).Overall, the final four-factor solution covers 61.9% of
the common variance of the remaining 12 behaviors. None
of the residuals exceeded a value of .05. Two items loadedon more than one factor. The factor intercorrelationestimates range from r ¼ .17 for mobility and consumerismto r ¼ .45 for vicarious behavior and consumerism. Over-all, correlations are small to moderate, which also shows inthe bivariate correlations of the person scores in Table 2a.Except for the mobility factor, the behavior measuresreveal acceptable internal consistencies (see Table 2). Notethat the solution remains practically unaffected by theextraction (principal factor or maximum likelihood) orrotation method (direct oblimin or varimax) that isemployed.The multiple regression model corrected with the Bartlett
method was used to calculate person scores; that means, wecalculated individual factor scores as the sum of theweighted (with factor-loadings) z-standardized variablevalues (cf. Table 2a). Due to excessive missing values ofthe first approach and as a benchmark, we also calculatedthe behavior measures as mean variable scores. Inother words, we calculated individual factor scores as theaverage of the (unweighted) variable values of all thevariables that were theoretically assigned to a particularfactor (cf. Table 2b).
ARTICLE IN PRESSF.G. Kaiser et al. / Journal of Environmental Psychology 27 (2007) 242–251248
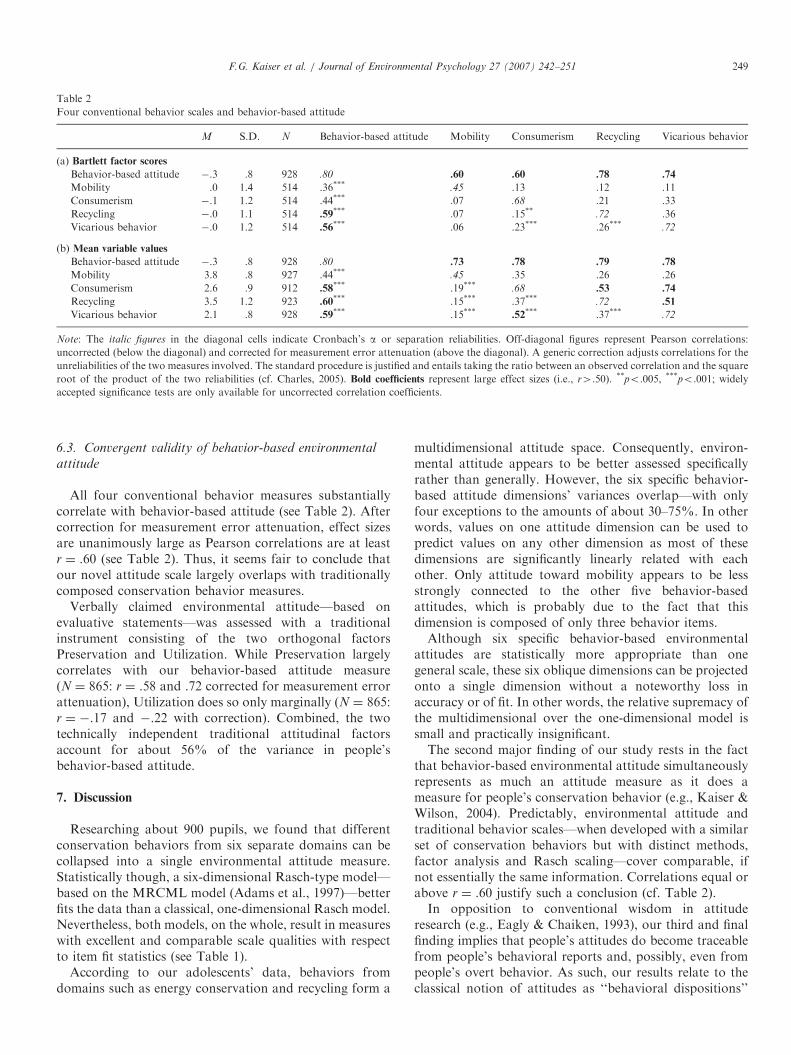
6.3. Convergent validity of behavior-based environmental
attitude
All four conventional behavior measures substantiallycorrelate with behavior-based attitude (see Table 2). Aftercorrection for measurement error attenuation, effect sizesare unanimously large as Pearson correlations are at leastr ¼ .60 (see Table 2). Thus, it seems fair to conclude thatour novel attitude scale largely overlaps with traditionallycomposed conservation behavior measures.
Verbally claimed environmental attitude—based onevaluative statements—was assessed with a traditionalinstrument consisting of the two orthogonal factorsPreservation and Utilization. While Preservation largelycorrelates with our behavior-based attitude measure(N ¼ 865: r ¼ .58 and .72 corrected for measurement errorattenuation), Utilization does so only marginally (N ¼ 865:r ¼ �.17 and �.22 with correction). Combined, the twotechnically independent traditional attitudinal factorsaccount for about 56% of the variance in people’sbehavior-based attitude.
7. Discussion
Researching about 900 pupils, we found that differentconservation behaviors from six separate domains can becollapsed into a single environmental attitude measure.Statistically though, a six-dimensional Rasch-type model—based on the MRCML model (Adams et al., 1997)—betterfits the data than a classical, one-dimensional Rasch model.Nevertheless, both models, on the whole, result in measureswith excellent and comparable scale qualities with respectto item fit statistics (see Table 1).
According to our adolescents’ data, behaviors fromdomains such as energy conservation and recycling form a
multidimensional attitude space. Consequently, environ-mental attitude appears to be better assessed specificallyrather than generally. However, the six specific behavior-based attitude dimensions’ variances overlap—with onlyfour exceptions to the amounts of about 30–75%. In otherwords, values on one attitude dimension can be used topredict values on any other dimension as most of thesedimensions are significantly linearly related with eachother. Only attitude toward mobility appears to be lessstrongly connected to the other five behavior-basedattitudes, which is probably due to the fact that thisdimension is composed of only three behavior items.Although six specific behavior-based environmental
attitudes are statistically more appropriate than onegeneral scale, these six oblique dimensions can be projectedonto a single dimension without a noteworthy loss inaccuracy or of fit. In other words, the relative supremacy ofthe multidimensional over the one-dimensional model issmall and practically insignificant.The second major finding of our study rests in the fact
that behavior-based environmental attitude simultaneouslyrepresents as much an attitude measure as it does ameasure for people’s conservation behavior (e.g., Kaiser &Wilson, 2004). Predictably, environmental attitude andtraditional behavior scales—when developed with a similarset of conservation behaviors but with distinct methods,factor analysis and Rasch scaling—cover comparable, ifnot essentially the same information. Correlations equal orabove r ¼ .60 justify such a conclusion (cf. Table 2).In opposition to conventional wisdom in attitude
research (e.g., Eagly & Chaiken, 1993), our third and finalfinding implies that people’s attitudes do become traceablefrom people’s behavioral reports and, possibly, even frompeople’s overt behavior. As such, our results relate to theclassical notion of attitudes as ‘‘behavioral dispositions’’
ARTICLE IN PRESS
Table 2
Four conventional behavior scales and behavior-based attitude
M S.D. N Behavior-based attitude Mobility Consumerism Recycling Vicarious behavior
(a) Bartlett factor scores
Behavior-based attitude �.3 .8 928 .80 .60 .60 .78 .74
Mobility .0 1.4 514 .36*** .45 .13 .12 .11
Consumerism �.1 1.2 514 .44*** .07 .68 .21 .33
Recycling �.0 1.1 514 .59*** .07 .15** .72 .36
Vicarious behavior �.0 1.2 514 .56*** .06 .23*** .26*** .72
(b) Mean variable values
Behavior-based attitude �.3 .8 928 .80 .73 .78 .79 .78
Mobility 3.8 .8 927 .44*** .45 .35 .26 .26
Consumerism 2.6 .9 912 .58*** .19*** .68 .53 .74
Recycling 3.5 1.2 923 .60*** .15*** .37*** .72 .51
Vicarious behavior 2.1 .8 928 .59*** .15*** .52*** .37*** .72
Note: The italic figures in the diagonal cells indicate Cronbach’s a or separation reliabilities. Off-diagonal figures represent Pearson correlations:
uncorrected (below the diagonal) and corrected for measurement error attenuation (above the diagonal). A generic correction adjusts correlations for the
unreliabilities of the two measures involved. The standard procedure is justified and entails taking the ratio between an observed correlation and the square
root of the product of the two reliabilities (cf. Charles, 2005). Bold coefficients represent large effect sizes (i.e., r4.50). **po.005, ***po.001; widely
accepted significance tests are only available for uncorrected correlation coefficients.
F.G. Kaiser et al. / Journal of Environmental Psychology 27 (2007) 242–251 249
(Campbell, 1963). To validate our supposition, we estab-lished that our novel behavior-based attitude measuresubstantially overlaps with two previously developed,environmental attitude scales based on evaluative state-ments, Utilization and Preservation (e.g., Bogner & Wise-man, 1999). Jointly, the two conventional attitudes share56% of the variance of behavior-based attitude. Predic-tably, behavior-based environmental attitude containsutilitarian and altruistic considerations as both utilizationand preservation correlate significantly but differentiallywith our new scale (cf. Milfont & Duckitt, 2004).
Since our measures are exclusively based on self-reports,three possible shortcomings are worth mentioning. First,neither common method variance (including all sorts ofresponse biases) nor social desirability effects can entirelybe ruled out as an alternative explanation with cross-sectional survey research. Second, we exclusively usedbehavioral self-reports with our new measure, although wecould have used evaluative statements as well. This self-inflicted restriction to behavioral self-reports not onlyallows us to abstain from introspection—apart fromrecollection—but also to technically switch to observationas a means of data collection in future research. Third, self-reported behavior’s external validity remains controversial.While some conclude that self-reports of conservationbehavior cannot be trusted as proxies for overt behavior(e.g., Corral-Verdugo, 1997), others corroborate self-reports’ satisfactory correspondence with actual behavior(despite some possible overstatement; e.g., Gamba &Oskamp, 1994), particularly, when self-reports representdichotomized practices (i.e., ‘‘ecological engagement’’ vs.‘‘ecological nonengagement’’) as in our case (Hirst &Goeltz, 1985; Kaiser et al., 2001).
As we predicted, environmental attitude can be directlyderived from what people claim to do and probably doconservationally. Essentially, such a behavior score standsfor the extent to which people realize their attitudes. Ournew measure, which implies a mathematically formalizedlink between a person’s attitude and his or her behaviorrecord, has extensive application potential as a psycholo-gical science-based policy support tool (see Kaiser, Mid-den, & Cervinka, in press).
Acknowledgments
This research was supported by the BIOHEAD Grant#CIT2-CT-2004-506015 from the European Commission.
We wish to thank Steven Ralston for his languagesupport, and Katarzyna Byrka, Teddy McCalley, WesleySchultz, and three anonymous reviewers for their com-ments on earlier drafts of this paper.
References
Adams, R. J., Wilson, M., & Wang, W. C. (1997). The multidimensional
random coefficients multinomial logit model. Applied Psychological
Measurement, 21, 1–23.
Ajzen, I. (1991). The theory of planned behavior. Organizational Behavior
and Human Decision Processes, 50, 179–211.
Bogner, F. X., & Wiseman, M. (1999). Toward measuring adolescent
environmental perception. European Psychologist, 4, 139–151.
Bond, T. G., & Fox, C. M. (2001). Applying the Rasch model: Fundamental
measurement in the human sciences. Mahwah, NJ: Lawrence Erlbaum.
Campbell, D. T. (1963). Social attitudes and other acquired behavioral
dispositions. In S. Koch (Ed.), Psychology: A study of a science, Vol. 6
(pp. 94–172). New York: McGraw-Hill.
Charles, E. P. (2005). The correction for attenuation due to measurement
error: Clarifying concepts and creating confidence sets. Psychological
Methods, 10, 206–226.
Corral-Verdugo, V. (1997). Dual ‘realities’ of conservation behavior: Self-
reports vs. observations of reuse and recycling behavior. Journal of
Environmental Psychology, 17, 135–145.
Dawes, R. M., & Smith, T. L. (1985). Attitude and opinion measurement.
In G. Lindsey, & E. Aronsson (Eds.), Handbook of social psychology,
Vol. 1 (3rd ed. pp. 509–566). New York: Random House.
Dunlap, R. E., & Jones, R. E. (2002). Environmental concern: Conceptual
and measurement issues. In R. E. Dunlap, & W. Michelson (Eds.),
Handbook of environmental sociology (pp. 482–524). Westport, CT:
Greenwood.
Dunlap, R. E., Van Liere, K. D., Mertig, A. G., & Jones, R. E. (2000).
Measuring endorsement of the New Ecological Paradigm: A revised
NEP scale. Journal of Social Issues, 56, 425–442.
Eagly, A. H., & Chaiken, S. (1993). The psychology of attitudes. Fort
Worth, TX: Harcourt Brace Jovanovich.
Embretson, S. E., & Reise, S. P. (2000). Item response theory for
psychologists. Mahwah, NJ: Lawrence Erlbaum.
Ferguson, G. A. (1941). The factorial interpretation of test difficulty.
Psychometrika, 6, 323–329.
Fishbein, M., & Ajzen, I. (1974). Attitudes towards objects as predictors of
single and multiple behavioral criteria. Psychological Review, 81, 59–74.
Gamba, R. J., & Oskamp, S. (1994). Factors influencing community
residents’ participation in commingled curbside recycling programs.
Environment and Behavior, 26, 587–612.
Gatersleben, B., Steg, L., & Vlek, C. (2002). Measurement and
determinants of environmentally significant consumer behavior.
Environment and Behavior, 34, 335–365.
Hirst, E., & Goeltz, R. (1985). Accuracy of self-reports: Energy
conservation surveys. The Social Science Journal, 22, 19–30.
Kaiser, F. G. (1998). A general measure of ecological behavior. Journal of
Applied Social Psychology, 28, 395–422.
Kaiser, F. G. (2004). Conservation behavior. In Ch. Spielberger (Ed.),
Encyclopedia of applied psychology, Vol. 1 (pp. 473–477). San Diego,
CA: Academic Press.
Kaiser, F. G., Frick, J., & Stoll-Kleemann, S. (2001). Zur Angemessenheit
selbstberichteten Verhaltens: Eine Validitatsuntersuchung der Skala
Allgemeinen Okologischen Verhaltens [Accuracy of self-reports:
Validating the General Ecological Behavior scale]. Diagnostica, 47,
88–95.
Kaiser, F. G., Hubner, G., & Bogner, F. X. (2005). Contrasting the theory
of planned behavior with the value-belief-norm model in explaining
conservation behavior. Journal of Applied Social Psychology, 35,
2150–2170.
Kaiser, F. G., Midden, C. J. H., Cervinka, R. (in press). Evidence for a
data-based environmental policy: Induction of a behavior-based
decision support system. Applied Psychology: An International Review.
Kaiser, F. G., Schultz, P. W., & Scheuthle, H. (2007). The theory of
planned behavior without compatibility? Beyond method bias and past
trivial associations. Journal of Applied Social Psychology, 37,
1522–1544.
Kaiser, F. G., & Wilson, M. (2000). Assessing people’s general ecological
behavior: A cross-cultural measure. Journal of Applied Social
Psychology, 30, 952–978.
Kaiser, F. G., & Wilson, M. (2004). Goal-directed conservation behavior:
The specific composition of a general performance. Personality and
Individual Differences, 36, 1531–1544.
ARTICLE IN PRESSF.G. Kaiser et al. / Journal of Environmental Psychology 27 (2007) 242–251250
Maloney, M. P., & Ward, M. P. (1973). Ecology: Let’s hear from the
people. An objective scale for the measurement of ecological attitudes
and knowledge. American Psychologist, 28, 583–586.
Milfont, T. L., & Duckitt, J. (2004). The structure of environmental
attitudes: A first- and second-order confirmatory factor analysis.
Journal of Environmental Psychology, 24, 289–303.
Schultz, P. W. (2001). The structure of environmental concern: Concern
for self, other people, and the biosphere. Journal of Environmental
Psychology, 21, 327–339.
Schultz, P. W., & Oskamp, S. (1996). Effort as a moderator of the
attitude–behavior relationship: General environmental concern and
recycling. Social Psychology Quarterly, 59, 375–383.
Staats, H. (2003). Understanding proenvironmental attitudes and
behavior: An analysis and review of research based on the theory of
planned behavior. In M. Bonnes, T. Lee, & M. Bonaiuto (Eds.),
Psychological theories for environmental issues (pp. 171–201). Alder-
shot, UK: Ashgate.
Vining, J., & Ebreo, A. (2002). Emerging theoretical and methodological
perspectives on conservation behavior. In R. B. Bechtel, & A. Church-
man (Eds.), Handbook of environmental psychology (pp. 541–558).
New York: Wiley.
Wicker, A. W. (1969). Attitudes versus actions: The relationship of verbal
and overt behavioral responses to attitude objects. Journal of Social
Issues, 25(4), 41–78.
Wiseman, M., & Bogner, F. X. (2003). A higher-order model of ecological
values and its relationship to personality. Personality and Individual
Differences, 34, 783–794.
Wright, B. D., Linacre, J. M., Gustafson, J.-E., & Martin-Lof, P. (1994).
Reasonable mean-square fit values. Rasch Measurement Transactions,
8(3), 370.
ARTICLE IN PRESSF.G. Kaiser et al. / Journal of Environmental Psychology 27 (2007) 242–251 251
7.3 Teilarbeit C
80
7.3 Teilarbeit C
C Britta Oerke & Franz X. Bogner.
Social desirability, environmental attitudes and general ecological behavior.
Journal of Applied Social Psychology (submitted for publication)
Social desirability, environmental attitudes and general ecological behavior
Britta Oerke & Franz X. Bogner
University of Bayreuth, Germany
Correspondence concerning this article should be addressed to Britta Oerke, University of
Bayreuth, Department Didactics of Biology (NWI), D- 95447 Bayreuth, Germany;
e-mail: [email protected], [email protected]
* Title Page
1
1. Introduction
For children and adolescents, environmental education is the most important means of developing
a necessary awareness of the problems caused by climate change as well as a willingness to act
upon them. However, discussion remains as to whether ecology education programmes are
actually succeeding in increasing concern about ecosystems and reshaping the relevant behaviour
toward the environment in the way that almost all educational programme designers promise. For
the serious validation and evaluation of a programme, a valid measurement of environmentally
relevant attitudes and of behaviour change is essential. A lack of concern with establishing the
reliability and validity of the instruments employed has been criticised by some authors (Bogner
and Wiseman, 2006; Leeming, Dwyer, Porter and Cobern, 1993). Especially, the validity of self-
reported attitudes and behaviour is threatened by response biases such as acquiescence (Milfont
and Duckitt, 2004) or social desirability (e.g. Bogner and Wiseman 2006; Mummendey, 1981).
The latter can cause a major problem in the field of conservation because eco-friendly attitudes
and behaviour can be considered a social norm (Newhouse 1990). But how susceptible are they
really to social desirability bias and to what extent does the latter devalue or even distort
empirical results? In this present study, we coped with these questions by applying two specific
measures developed for adolescents in the frame of an environmental education study.
1.1 Measurement of Environmental Attitudes and Ecological Values
The construct of Environmental Attitudes (EA) commonly refers to a multiple component
approach, e.g., in a recent definition provided by Schultz, Shriver, Tabanico, and Khazian (2004),
to “the collection of beliefs, affect, and behavioural intentions a person holds regarding
environmentally related activities or issues” (Schultz et al., 2004, p. 31). Various approaches have
been presented to operationalise measurement instruments within the domain of EA and values
(cf Bogner and Wiseman, 2002). The dimensionality of these instruments, revealed by factor
* Manuscript
2
analysis, depends to a great extent on the item-pool it is based on. A well-known example of the
traditional unidimensional view is the New Environmental (Ecological) Paradigm (NEP) Scale
(Dunlap and Van Liere, 1978; Dunlap, Van Liere, Mertig and Jones, 2000) ranging from
unconcerned about the environment to concerned. Other approaches propose two-dimensional
(an anthropocentric versus an ecocentric view, Gagnon Thompson and Barton, 1994; Bogner and
Wiseman, 1999) or three-dimensional views (Schultz, 2001: egoistic, altruistic and biospheric
concern). Wiseman and Bogner (2003) criticised this by pointing to personality research that “the
study of first-order factors generates as many batteries as investigators” (p.785). The authors
started a series of surveys following the approach of Blakie (1992), analysing a great pool of
items and isolating five first-order factors with their instrument for adolescents (e.g. Bogner and
Wiseman 1999, 2002). Analysing inter-factor instead of inter-item correlations they produced a
higher-order two-factor system of EA (Wiseman and Bogner, 2003) or, following a convention
established by Rokeach (1968, 1973)1: Environmental Values consisting of sets of attitudes.
Values generally “function as an organizing system for attitudes and beliefs”, and “are viewed as
determinants of attitudes” (Schultz et. al, 2004, p. 32). This model, being independently
confirmed by Milfont and Duckitt (2004) in a study with 99 items from different established
scales applied to adults, was formalised as “Ecological Values are determined by one’s position
on two orthogonal dimensions, a biocentric dimension that reflects conservation and protection
of the environment (Preservation); and an anthropocentric dimension that reflects the utilization
of natural resources (Utilization)” (Wiseman and Bogner, 2003, p.5). The principle of
orthogonality of the factors implies that Preservation (P) and Utilisation (U) are complementary
and uncorrelated, but not opposing values. A person may on the one hand endorse the protection
of the environment (P) and on the other hand the usage of nature (U). Actually Wiseman and
Bogner (2003) found a low negative correlation of -.17 for an oblique rotation of the two factors
which however they regarded as negligible. In a very recent study, Bogner and Wiseman (2006)
succeeded in measuring the two values directly as primary order factors based on a 20-item-scale.
3
Notice that this specific scale is the only established instrument measuring EA that was
developed and validated for the age-group of adolescents (Bogner and Wiseman, 2006).
1.2 Measurement of Ecological Behaviour
One specific reason for the importance of measuring EA is the expectation of obtaining a
valuable predictor of ecological behaviour. Empirical results on the relationship of EA to
behaviour, however, are inconsistent: Correlations vary from weak (e.g. Scott and Willits, 1994;
Van Liere and Dunlap 1981; Diekmann and Preisendörfer, 1998) via moderate (22% of explained
variance for adolescents, Meinhold and Malkus, 2005) to strong (about 40% of explained
variance, Weigel and Weigel, 1978), with an average corrected correlation in the meta-analysis of
Hines, Hungerford and Tomera (1987) of .35 and of .42 respectively in the meta-analysis of
Bamberg and Möser (2007). At least three aspects of measurement explain the weak or varying
interrelationships between EA and behaviour: (a) the degree of congruence between both
measures (Ajzen and Fishbein, 1977), (b) a failure to regard the influence of external, situational
factors on ecological behaviour, and (c) “socially acceptable” responses to behaviour or attitude
test items.
a) The specificity of Ecological Behaviour measurement varies between different surveys. Some
researchers assume different, more or less independent types of ecological behaviour, e.g.
recycling, more ecological transport or more ecological consumerism (for a review see Kaiser,
1998). If however behaviour is measured on a specific level while attitude is measured on a
general level like in the popular NEP Scale (Dunlap and Van Liere 1978), the lack of
measurement correspondence will probably reduce attitude-behaviour consistency (e.g., Weigel
and Weigel, 1978; Diekmann and Preisendörfer, 2003). Predicting, on the other hand, a multitude
of different behaviours (in the field of conservation e.g., using public transport, saving energy,
etc.) with general attitude can be highly successful (Newhouse, 1990). Support for better attitude-
4
behaviour correlations in the case of measurement correspondence was also confirmed by Tarrant
and Cordell (1997).
b) One major problem of specific behaviours is their susceptibility to a wide range of influences.
Which ecological acts actually are performed depends to a great extent on the external conditions
that make some types of behaviour easier or more difficult to carry out than others (Diekmann
and Preisendörfer, 2003; Foppa, Tanner, Jaeggi and Arnold, 1995; Kaiser 1998). The recycling
rate in a city, e.g., is influenced by factors reducing or augmenting the effort needed for
participating, e.g., by the number of containers for glass or by the implementation of regular
waste paper collections by refuse collection services. Personal factors like delight in sports, or
physical health may also moderate the difficulty of a specific behaviour, for example the
frequency of riding a bicycle. Consequently, people seem inconsistent in their ecological acts,
behaving ecologically in one case and not ecologically in another (e.g. Diekmann and
Preisendörfer, 1998; Granzin and Olsen, 1991). Kaiser (1998) proposed a probabilistic
measurement approach considering both, the difficulty of different types of behaviour as well as a
casual inconsistency in ecological performance. The model predicts the probability of a specific
type of behaviour with a given difficulty to be carried out by a specific person with a given
tendency to behave ecologically. Kaiser and co-workers (Kaiser, 1998; Kaiser, Wölfing and
Fuhrer, 1999; Kaiser and Wilson, 2004) calibrated a general ecological behaviour measure for
adults as a unidimensional Rasch-scale based on the item response theory (see Bond and Fox,
2001). From this measure we have adapted a General Ecological Behaviour (GEB) scale for
adolescents (Kaiser, Oerke and Bogner, 2007). Though it is composed of behaviours from six
different domains we extracted a unidimensional scale, just like the one for adults (see above).
Kaiser et al. (2007) demonstrated that the GEB scale measures as much conservation behaviour
as behaviour-based environmental attitude, for attitudes become traceable from people’s self-
reported behaviour.
5
(c) Notwithstanding, the usage of self-reports allows measurement of a wide range of actions, it is
also criticised for being susceptible to measurement bias (e.g. Mummendey, 1981; Diekmann and
Preisendörfer, 2003), e.g., Social Desirability Bias (SDB), the tendency “to give overly positive
self-descriptions” (Paulhus, 2002, p.50). In this case SDB means to overstate one’s own
“ecological correctness” to make a good impression. In personality research, SDB was shown to
be a personal style that can be measured with a Lie scale, but also as a situation-dependent
response set (e.g. Crowne and Marlow, 1964; Schmitt and Steyer, 1993). Though high agreement
between individual subjects was observed in the assessment of the SD of items, the latter also
varies depending on the setting, the audience and on socioeconomic characteristics of the subject
(e.g., age or gender). Both EA and ecological behaviours have been suspected of being biased by
SDB and thus reducing attitude-behaviour-correlations (e.g., Ewert and Baker, 2001; Scott and
Willits, 1994). Corresponding results have been reported by Schahn (2002) who examined the
influence of SDB on item level and found the social SDB rating of environmental attitude items
by experts to explain 25 to 35% of item-mean score variance in multiple regression. Small but
inconsistent effects of individual Lie scores were reported in other inquiries (e.g. Wiseman and
Bogner, 2003; Kaiser, 1998; Kaiser et al., 1999). To our knowledge no studies have been done
about the influence of SDB on the self-reported ecological behaviour of children.
1.3 Structure and control of Social Desirability
Nederhof (1985) reviewed methods of controlling for the effects of SDB (see also, Paulhus,
1991). Socially desirable responses can be prevented or reduced with the help of a specific
answer format (e.g., forced-choice) or of specific experimental settings and instructions ensuring
anonymity (e.g., randomised response technique) or leading the subjects to believe that faking
good behaviour will be revealed (e.g., bogus pipeline). However, a totally anonymous situation
cannot always be credibly assured. Thus, detection and measurement of SDB does make sense,
either by utilising SD- or Lie scales or by the rating of item desirability.
6
Early Lie scales that were developed to detect more or less conscious lying within personality
questionnaires asked for socially undesirable but common behaviour as well as for socially
desirable but uncommon behaviour; such scales were regarded as unidimensional. A common
instrument is the Marlowe-Crowne Social Desirability Scale (Crowne and Marlowe, 1960). A
two-dimensional character of SD was identified by a number of authors in investigations where
factors were analysed (e.g., Sackeim and Gur, 1979) and as an elaborated two-factor model
presented by Paulhus (1984, 2002). He distinguished between self-deceptive enhancement,
representing an unconscious tendency to perceive reality optimistically biased as some kind of
self-protection and impression management (IM), a deliberate deception to impress an audience,
e.g. the interviewer. The latter aspect of SDB corresponds to the classical lie scales. Only few
scales were systematically constructed to measure SDB in children, and to our knowledge, no
instrument for children exists, measuring the two factors reported by Paulhus (2002): The
Children’s Social Desirability Scale (CSD, Crandall, Crandall and Katkovsky, 1965) with 48
items, similar to those of the Marlow-Crowne Scale, is considered to measure the fear of
disapproval; however it is criticised for its low stability.
A second instrument is the Lie scale of the Revised Children’s Manifest Anxiety Scale (RCMAS),
one of the most frequently used self-reporting measures in childhood anxiety research (Reynolds
and Richmond, 1985, 1997) derived from the MMPI (Minnesota Multiphasic Personality
Inventory) Lie scale. The German version was developed and tested by Boehnke, Silbereisen,
Reynolds and Richmond (1986). The scale is often used as indicator of social desirability (Dadds,
Perrin, & Yule, 1998) and/ or defensiveness for children and adolescents. Its small number of
nine items is of advantage for a combination with other scales.
7
1.4 Objectives
Though self-reported ecological behaviour and EA are often suspected of failing to provide valid
measures due to a social desirability bias, just a few studies have shown a high effect of SDB, and
especially for children its evidence is not so clear. A major objective of our study focuses on an
application and description of a Lie scale for children in the context of environmental attitudes
and self-reported GEB. Thereby, our special interest was to check the influence of a specific Lie
scale on the attitude and behaviour scales and to further test any value change in the prediction of
behaviour by attitudes in multiple regression if potential impact of the Lie scale is considered.
This included an exploration of whether Lie scores vary as a function of characteristics such as
gender, age and academic achievement levels.
2. Method
2.1 Participants
Data were gathered from a convenient sample of fifth- and sixth-graders in Bavaria (N = 218).
Due to missing data, 20 pupils were excluded. From the remaining 198 children, 46% were girls,
the mean age was 11.52 (SD + 0.79). About 50% of the sample consisted of pupils from classes
of highest stratification [Gymnasium], referred to as A-level, the others of medium stratification
classes [Realschule], referred to as B-Level, both coming from rural communities with less than
50,000 residents. The participants in this inquiry represented the control group of an intervention
study with pre- and post-intervention measures; they did not receive any intervention. Before
questioning, pupils were assured of their anonymity and were requested to answer the scales on
their own, but they were not physically separated.
8
2.2 Materials
Assessment of Ecological Values (EV): To measure Ecological Values we applied the 2-MEV
model covering a Preservation and Utilisation dimension (Bogner and Wiseman, 2006).The
Preservation measure consisted of 8 items (e.g. “I enjoy trips to the countryside”), Utilisation one
of 11 items (such as “Our planet has unlimited resources”) that were presented mixed-up. The
response scale ranged from 1 (“totally incorrect”) to 5 (“totally correct”) including an
“undecided” category.
Assessment of General Ecological Behaviour (GEB): General ecological behaviour was measured
with the GEB-Scale (Kaiser et al., 2007) consisting of 40 items (e.g. “I separate waste” or “I buy
beverages in cans”) covering six domains: energy conservation, mobility and transportation,
waste avoidance, consumerism, recycling and vicarious behaviours toward conservation. Most of
the items were answered on a 5-point Likert scale from often to never, since for behaviours like
buying beverages in cans (negative coding) it is easier to give information about frequency than
to give a yes/ no answer. Since, however, participants were found to be inconsistent in using the
more diverse response alternatives (Kaiser and Wilson, 2000), in line with previous scale
calibrations (e.g., Kaiser and Wilson 2004) the response format was collapsed to a dichotomous
one with “often” and “always” as positive responses and “never”, “seldom” and “sometimes” as
negative ones. Seven one-time decisions, such as being a member of an environmental
organisation, from the outset were examined with a yes/ no format. For all items, “I don’t know”
was a response alternative when an answer was not possible. Such responses were treated as
missing values.
Assessment of Social Desirability (SDB): To avoid overstraining pupils with too many items, the
German version of the RCMAS Lie scale for children was applied. It consisted of nine very
implausible claims e.g., “I never lie” or “I like everyone I know” (Boehnke et al., 1986) that were
placed at the end of the questionnaire. Sum scores between zero (very low SDB) and nine (very
high SDB) were possible.
9
3. Results
3.1 Lie Scale
For the Lie scale, Cronbach’s alpha was .82, and for standardised items = .81. Figure 1 shows a
right skewed distribution, i.e., almost a third of the pupils did not agree with any of the items. The
overall mean of M = 2.90 (SD + 2.57) for our sample is similar to the mean of the German 5th
class sample of Boehnke et al. (1986: 2.97). The means of girls (2.89 + 2.61) and boys (2.92 +
2.55) did not differ significantly from each other.
Figure 1: Frequency of Lie scores in per cent.
In order to analyse the influence of pupil age on the Lie score, three sub-groups were formed, one
of 10 years (n = 52, M = 10.62 + 0.29), one of 11 years (n = 89, M = 11.41 + 0.26) and one of 12
to 13 years (n = 57, M = 12.53 + 0.47). A Kruskal-Wallis test showed highly significant
differences (p < .001, χ2 = 16.24). Follow-up U-Tests revealed significant differences between all
three sub-samples: The Lie score decreased with increasing age (Figure 2a). Pupils aged 10 and
pupils aged 12 to 13 differed on average for about 2 points (p = .000, Z = -4.01).
The difference between the medium age group (11 to 12) and the younger group (p < .05, Z = -
2.28) as well as the medium group and the older group (p < .05, Z = -2.24) was only 1 point on
average and just passed the significance criterion.
Figures 2a and 2b: Mean Lie scores a) Sub-samples grouped for age b) Sub-samples grouped
for stratification level. Error bars show 1 standard deviation. *** p < .001 * p < .05
Although no general gender difference was found, in the sub-sample older than 12 years, girls
scored a little bit lower on the Lie scale (M = 1.30 + 2.08, n = 20) than boys (M = 2.27 + 2.19, n
= 37, p = .043, Z = -2.02). Further more, we compared children from different stratification levels
(figure 2b) and found B-Level pupils (n = 100, M =1.95 + 2.14) to score significantly lower than
A-Level ones (n = 98, M = 3.88 + 2.62, U-Test: Z = -5.20, p < .001).
10
We conclude that older children, and of these especially girls, and B-Level pupils have lower
Social Desirability values than younger children and A-Level pupils.
3.2 Environmental Values (EV) and General Ecological Behaviour (GEB)
One item was discarded from the Preservation (P) scale due to inappropriate item-total-
correlation (.12). For the remaining seven items, the Cronbach’s alpha was .78 (and .77 for the
Utilisation (U) scale). In a principle axis analysis with Varimax rotation, the two-factor solution
was confirmed explaining altogether 30.7% of variance (cross loadings to the Utilisation scale
were quite few but scored up to -.42). The total mean for Preservation was high (M = 3.84 + 0.68)
indicating a general agreement, whereas the Utilisation mean indicated moderate disagreement
(M = 2.43 + 0.63).
GEB was calibrated as a Rasch-scale. Thus, the mean of item estimates (or difficulty) was located
at zero by default (here: standard deviation (SD) = 1.82, adjusted: SD = 1.80), the item scores
ranged from -3.4 to +4.5. In a well-matched Rasch calibration, the mean of case estimates should
be near zero. In this case the mean for the total sample was M = 0.10 (SD = 0.92, SDadjusted =
0.82). Case estimates ranged from -2.3 to +3.3. The internal consistency of the scale was high,
with alpha = .81 (Rasch reliability = .78). One item did not fit the Rasch scale with an MS-value
above 1.20 (MS = 1.23), none had an overfit (MS < .802).
3.3 Impact of Social Desirability Bias (SDB) and academic achievement on Environmental
Attitudes (EA) and General Ecological Behaviour (GEB)
3.3.1 MANOVA
In order to check a potential impact of Social Desirability response on attitude and behaviour
scores, three similar-sized sub-samples based on the Lie scores were formed. The “low SDB”
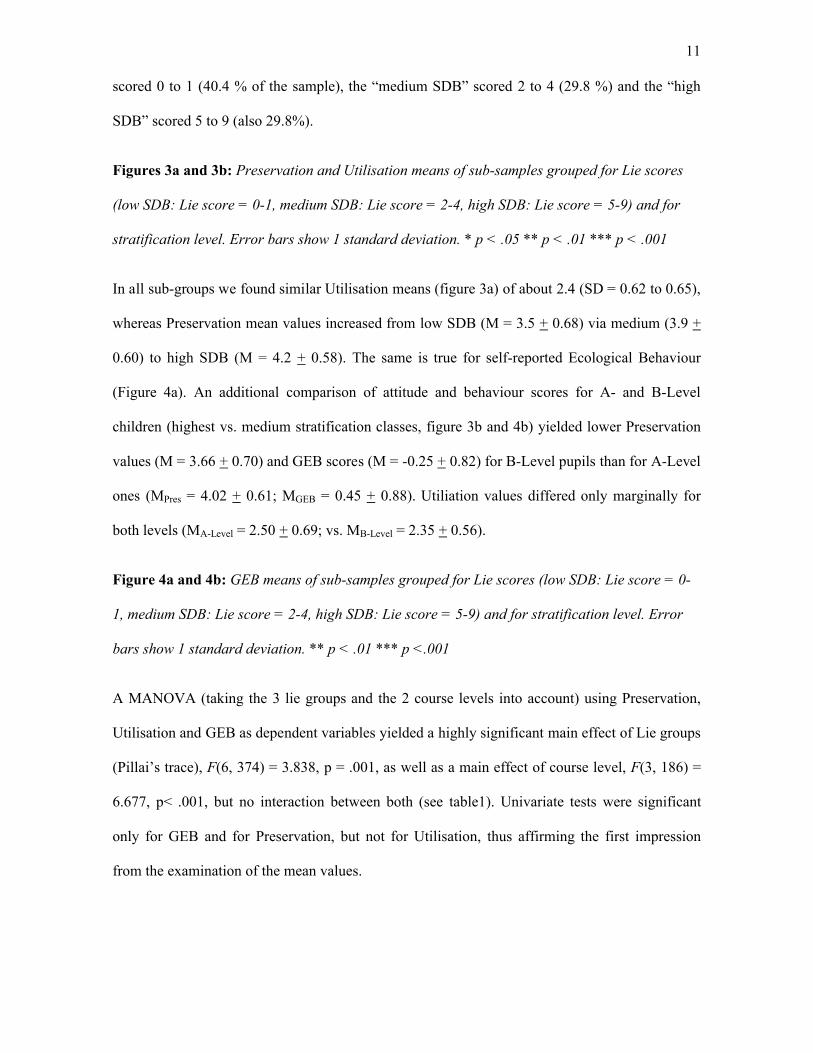
11
scored 0 to 1 (40.4 % of the sample), the “medium SDB” scored 2 to 4 (29.8 %) and the “high
SDB” scored 5 to 9 (also 29.8%).
Figures 3a and 3b: Preservation and Utilisation means of sub-samples grouped for Lie scores
(low SDB: Lie score = 0-1, medium SDB: Lie score = 2-4, high SDB: Lie score = 5-9) and for
stratification level. Error bars show 1 standard deviation. * p < .05 ** p < .01 *** p < .001
In all sub-groups we found similar Utilisation means (figure 3a) of about 2.4 (SD = 0.62 to 0.65),
whereas Preservation mean values increased from low SDB (M = 3.5 + 0.68) via medium (3.9 +
0.60) to high SDB (M = 4.2 + 0.58). The same is true for self-reported Ecological Behaviour
(Figure 4a). An additional comparison of attitude and behaviour scores for A- and B-Level
children (highest vs. medium stratification classes, figure 3b and 4b) yielded lower Preservation
values (M = 3.66 + 0.70) and GEB scores (M = -0.25 + 0.82) for B-Level pupils than for A-Level
ones (MPres = 4.02 + 0.61; MGEB = 0.45 + 0.88). Utiliation values differed only marginally for
both levels (MA-Level = 2.50 + 0.69; vs. MB-Level = 2.35 + 0.56).
Figure 4a and 4b: GEB means of sub-samples grouped for Lie scores (low SDB: Lie score = 0-
1, medium SDB: Lie score = 2-4, high SDB: Lie score = 5-9) and for stratification level. Error
bars show 1 standard deviation. ** p < .01 *** p <.001
A MANOVA (taking the 3 lie groups and the 2 course levels into account) using Preservation,
Utilisation and GEB as dependent variables yielded a highly significant main effect of Lie groups
(Pillai’s trace), F(6, 374) = 3.838, p = .001, as well as a main effect of course level, F(3, 186) =
6.677, p< .001, but no interaction between both (see table1). Univariate tests were significant
only for GEB and for Preservation, but not for Utilisation, thus affirming the first impression
from the examination of the mean values.
12
Post hoc tests (Tukey-HSD) revealed a significant difference between Lie groups only for the low
SDB group compared to both other groups (difference to medium SDB: p =.002, difference to
high SDB: p <.001). No difference was found between medium and high SDB groups.
3.3.2 Multiple Regression
The “low SDB” group (0 or 1 point) showed significantly lower Preservation and GEB scores
compared to pupils with higher SDB. Additionally, we found that A-Level pupils exhibited
higher Preservation and GEB values than B-Level pupils.
However, clustering pupils into Lie groups may bias results by not using the full range of the Lie
scale, especially as more A-Level children are in the high-SDB group and more B-Level children
are members of the low-SDB group. Thus, we computed a multiple regression analysis to predict
Preservation, Utilisation and GEB and added gender and age as additional independent variables
to individual Lie-score and stratification level (A- or B-Level) (see table 2). A-Level pupils were
coded as 1, B-Level pupils were coded as 2, girls as 1, boys as 2. Predictors that were not
significant in the first step were excluded and a new regression analysis was done without them in
a second step.
The multiple regression analysis confirms the results indicated by the MANOVA: Lie scores and
stratification levels explained together significant portions of Preservation variance (14.7%) and
of behaviour variance (20%). While for Preservation the Lie score explained more variance than
the stratification level, for self-reported behaviour the influence of both variables was equal.
Utilisation scores were predicted only by gender: Boys (M = 2.31 + 0.64) have slightly lower
Utilisation scores than girls (M = 2.57 + 0.60).
13
3.3.3 Predicting behaviour with attitude and Lie scores
One specific goal of this study focused on re-examination of the relationship between attitude and
behaviour after correction for the Lie scores. Therefore, Preservation and Utilisation were
regressed on GEB scores, one time with Lie score as an additional predictor and one time
without. Table 3 shows that the beta value for Preservation changes only minimally (from about
.47 to about .54) depending on the presence of the Lie score as a predictor. Utilisation in both
cases does not predict GEB significantly. Its negative correlation to GEB is suppressed by the
impact of Preservation. The same is true for the impact of the Lie score that is only .15 in the
regression, but correlates .33 with GEB. If the Lie score is included into the model, the corrected
R2 augments only .015.
We conclude that the impact of Lie scores is higher for Preservation than for GEB and not
significant for Utilisation. An inclusion of Lie scores does not improve the prediction of GEB by
Environmental Attitudes nor diminish it significantly.
4. Discussion
4.1 Moderators and interpretation of the Lie score
The specific aim of this study was to identify a potential contamination of Environmental
Attitude and self-reported Ecological Behaviour data by Social Desirability. With respect to the
potential moderators we found older children to score lower on SD scale, which is consistent with
earlier studies (see Brown and Kodadek, 1987; Richmond and Millar 1984); this is also in line
with Boehnke et al. (1986) who reported a linear decrease of Lie scores with increasing age. Non-
consistent with that specific study, however, was the absence of any gender effect. Only the 12
(and 13) year old boys scored higher on the Lie scale than girls of the same age.
Brown and Kodadek (1987) referred to a decrease in Lie scores especially from grades 1 to 2 and
grades 5 to 6. They explained these decreases with Piaget’s theory of cognitive development
(Piaget, 1965), claiming that the generally high Lie scores of children younger than about 7
14
reflect a lack of insight in the meaning of lying. The later decline, at the age of about 12 years
(grade 6) may then reflect the cognitive leap to the formal stage of thinking, enabling the children
to think abstractly and draw conclusions from the information available. Thus, children younger
than 12 may understand the meaning of lying but they may be less able to report accurately on
their own behaviour compared to ideals of behaviour.
Therefore, it seems plausible, that children who participate in A-Level courses with higher
cognitive demands should have lower Lie scores than B-Level pupils do. The contrary is true: A-
Level pupils scored significantly higher on the Lie scale, and this remains true also for pupils of
the same age-subgroup (B-Level pupils were on average 9 months older than A-Level pupils).
Does this mean that A-Level pupils tend to answer in a more socially desirable way than B-Level
pupils? Plausible impact factors are the educational level of parents or the individual’s
intelligence (unfortunately, these characteristics have not been examined very closely in
literature). Crott and Roßrucker (1974) reported socioeconomic differences in the extent to which
adults estimated specific attributes like aggression, or autonomy to be socially or individually
desirable. But the only study we are aware of, that actually analysed the impact of socioeconomic
status and intelligence on SD scores in children was done by Crandall et al. (1965) with
American pupils. They however reported significantly higher SD values for less intelligent
children as well as for children whose parents had lower socioeconomic status. Thus, we have no
clue for the contradiction of our results to the contrarian ones in the, anyway rather scarce,
literature.
4.2 Impact of Social Desirability on Environmental Attitude and General Ecological Behaviour
Our results suggest that Social Desirability has an impact on Environmental Attitude and
behaviour: The MANOVA yielded a main effect of Lie scale groups explaining 6% of total
variance. This effect can be attributed to the difference between low scorers and medium and
accordingly high scorers on the Lie scale.
15
Two assertions can be made: 1) no significant difference occurred between medium and high
scorers, and 2) the impact of Lie scores was found only for Preservation and for GEB, but not for
Utilisation. The latter may be a hint that no social norms exist to evaluate the utilisation part of
EA in any direction, positive or negative. This assumption is affirmed by the low mean (about
2.4) and the, unlike Preservation, non-skewed distribution of the Utilisation factor. The first point
may signal that it may be more important to check a child’s tendency to respond in a socially
desirable way at all rather than to measure exactly the degree of tendencies to answer in a socially
desirable way. According to this, the multiple regression analysis yielded very similar findings:
the beta value of Lie scores for Preservation (.32) was higher than the one for self-reported
behaviour (.20), as by Lie scale groups explained variance was higher for Preservation (9%) than
for GEB (4%). This was true although age and stratification level were included in the multiple
regression analysis, too.
Compared to earlier findings, the SDB impact in our study was relatively high: Kaiser and
colleagues (Kaiser, Wölfing & Fuhrer 1999; Kaiser 1998) found SDB to explain only 1% of
General Ecological Behaviour variance. Equally, accuracy checking of self-reported specific
ecological behaviour by spouse ratings (Lam & Cheng, 2002) yielded low, in part positive, in part
negative influence of SDB. Wiseman and Bogner (2003) found similarly little explained variance
of pro-environmental attitudes in children. On the item level, Schahn (2002) reported high impact
of SD only on attitude but not on behaviour. He interpreted this result as a hint that self-deception
and not others-deception was measured and that it was easier to adapt attitude as a consequence
of perceived pressure due to Social Desirability than to adapt behaviour. On the other hand,
Schahn and Möllers (2002) found negative correlations between cost and SDB on item level. In
our GEB scale we had a wide range of item difficulty. If a lot of difficult and consequently pricy
behaviours are part of the measure, maybe it makes the scale less socially desirable.
16
However, to what extent does the fact that an Environmental Attitude and Ecological Behaviour
test is open to Social Desirability Bias mean that that measurement is invalid? And to what extent
does it bias the correlations between attitude and behaviour?
4.3 Removing the effects of Social Desirability: impact on the attitude- behaviour relationship
Ganster, Hennessey and Luthans (1983) described three alternative consequences of using SDB
contaminated measures: The first is the establishing of misleading correlations between variables
(spuriousness), if both variables are correlated with SDB. The second is suppression, the masking
of relationships between variables because of SD contamination in one or both of the measures.
In our case, a small spurious correlation occurs between GEB and Preservation which are both
correlated with SDB. On the other hand, a suppression of the Utilisation correlation with GEB is
feasible, for GEB is correlated with SD but Utilisation is not. However, if in prediction of GEB
the effect of SDB is included in the calculation, beta values for Preservation or Utilisation do not
change remarkably, even if there is a small (.15) but significant beta value for the Lie score. A
third possibility would be a moderating effect of SD, if SD is not correlated with any variable
which is not the case in the actual study.
Thus, even if Preservation, Utilisation and self-reported behaviour are correlated with Social
Desirability score the latter does not have any remarkable impact on the relationship between
attitude and behaviour. The relationship between Preservation and GEB is still high (beta = .47),
if the Lie score impact is included. Notably, it seems that pupils do not relate their attitude
towards the utilisation of natural resources to their own behaviour, for the Utilisation mean does
not add to explained behaviour variance.
4.4 Objections
Some objections remain. Firstly, our sample was relatively small and not representative for a
national sample which by itself may explain some divergence to earlier findings. Secondly, our
17
results count only for the impact of SD in a classroom test with questionnaires to be answered in
written form. Although pupils were assured of anonymity, it was not possible to perfectly control
that the children did not compare their answers, thus reducing anonymity. This means that in a
more anonymous setting (e.g. by physically separating children) or a less anonymous setting (in
interviews) the impact of SD could be smaller or bigger.
The teacher also may be a source of error. Even if in our study teachers got strict instructions on
how to introduce the questionnaires, it is possible that they did not abide by the assignment, thus
influencing the responses of the children into a more or less socially desirable direction. This,
however, should be controlled by the Lie scale and thus possible impact should be corrected.
Thirdly, as derived from classical Lie scales, our SD-Scale probably loads on the impression
management factor described by Paulhus (2002). This means that a potential impact of self-
deception on Environmental Attitudes and Behaviour was not examined in our study. Such an
impact cannot be excluded, even if self-deception is more important in measurement of
characteristics concerning personal competence and status.
Further, we cannot be sure that a Lie score of zero indeed implies total absence of SDB. Maybe
there is some basic level of SD that cannot be discovered with the help of a Lie scale but
nevertheless does influence the variables of interest. Possibly for a Lie scale it is true as Nederhof
(1985) stated of the Marlow-Crowne-Scale: it “seems not fit to predict the exact frequency of
undesirable behaviour, but may be used to give an indication of the extent to which people distort
their reports about a particular behaviour or attitude in a socially desirable direction” (p.266).
4.5 Conclusions
For the situation that we tested we can reassume that Social Desirability will bias Preservation
attitudes and a bit less also, Ecological Behaviour reports positively. Thus any monitoring of both
will be overestimated. Furnham (1986) proposed as alternative interpretation that indeed a person
with a high Lie score may be conscientious, adjusted etc. or that Social Desirability may measure
18
a disposition which overlaps positively or negatively with the other test, e.g. a need for approval
or social naiveté. In the case of pro-environmental attitude and behaviour this would mean that a
person does not fake a good impression but does really have the concordant attitude and does
behave in an eco-friendly way. Then, a correction would unreasonably eliminate common
variance of both variables.
Fisher and Katz (2000) identified a correlation between values and SDB as a hint of the societal
importance of a specific value. They advised against removing the SDB component from all self-
reported values since any removal can reduce validity – not only in the case of self-deception but
also if SD implies impression management, i.e., if the behaviours being predicted by the values
are socially visible. In fact, many ecological behaviours cannot easily be observed in public. A
clear recommendation is difficult. In our actual study at least no suppression or spuriousness
effect of social desirability could be detected.
We agree with Fisher and Katz (2000) who recommend minimizing the impact of SDB at the
earliest possible stages of research, e.g. by increasing response anonymity, but also to use
statistical control techniques to identify possible impact and learn more about the relationship
between SDB, Ecological Attitude and Behaviour. Consequently, the development of a scale
measuring self-deceptive enhancement in children would be a desirable outcome. A general
removal of SDB components however, seems not to be advisable.
19
References
Ajzen, I., & Fishbein, M. (1977). Attitude-behaviour relations: A theoretical analysis and review
of empirical research. Psychological Bulletin, 84, 888-918.
Bamberg, S., & Möser, G. (2007). Twenty years after Hines, Hungerford, and Tomera: A new
meta-analysis of psycho-social determinants of pro-environmental behaviour. Journal of
Environmental Psychology, 27, 14-25.
Blaikie, N. W. H. (1992). The nature and origins of ecological world views: An Australian study.
Social science quarterly, 73(1), 144-165.
Boehnke, K., Silbereisen, R. K., Reynolds, C. R., & Richmond, B. (1986). What I think and feel:
German experience with the revised form of the Children's Manifest Anxiety Scale.
Personality and Individual Differences, 7(4), 553-560.
Bogner, F. X., & Wiseman, M. (1999). Towards measuring adolescent environmental perception.
European Psychologist, 4, 139-151.
Bogner, F. X., & Wiseman, M. (2002). Environmental perception: Factor profiles of extreme
groups. European Psychologist, 7(3), 225-237.
Bogner, F. X., & Wiseman, M. (2006). Adolescent's attitudes towards nature and environment:
Quantifying the 2-MEV model. Environmentalist, 26, 231-237.
Bond, T. G., & Fox, C. M. (2001). Applying the Rasch Model: Fundamental measurement in the
human sciences. Mahwah, New Jersey: LEA.
Brown, M. S., & Kodadek, S. M. (1987). The use of lie scales in psychometric measures of
children. Research in Nursing & Health, 10, 87-92.
Crandall, V. C., Crandall, V. J., & Katkovsky, W. (1965). A children's social desirability
questionnaire. Journal of Consulting Psychology, 29(1), 27-36.
Crott, H. W., & Roßrucker, K. (1974). Erwünschtheit von Eigenschaften in Abhängigkeit von
Alter, Geschlecht und Schichtzugehörigkeit [Desirability of attributes depending on age,
20
gender and socioeconomic status]. Zeitschrift für Entwicklungspsychologie und
Pädagogische Psychologie, VI(4), 241-261.
Crowne, D. P., & Marlow, D. (1960). A new scale of social desirability independent of
psychopathology. Journal of Consulting Psychology, 24, 349-354.
Crowne, D. P., & Marlowe, D. (1964). The approval motive: Studies in evaluative dependence.
New York: John Wiley.
Dadds, M. R., Perrin, S., & Yule, W. (1998). Social desirability and self-reported anxiety in
children: an analysis of the RCMAS Lie scale. Journal of Abnormal Child Psychology,
26(4), 311-317.
Diekmann, A., & Preisendörfer, P. (1998). Environmental behavior: Discrepancies between
aspirations and reality. Rationality and Society, 10(1), 79-102.
Diekmann, A., & Preisendörfer, P. (2003). Green and greenback. The behavioral effects of
environmental attitudes in low-cost and high-cost situations. Rationality and Society, 15,
441-472.
Dunlap, R. E., & Van Liere, K. D. (1978). The "New Environmental Paradigm": A proposed
measuring instrument and preliminary results. Journal of Environmental Education, 9, 10-
19.
Dunlap, R. E., Van Liere, K. D., Mertig, A. G., & Jones, R. E. (2000). Measuring endorsement of
the New Ecolgical Paradigm: A revised NEP scale. Journal of Social Issues, 56(3), 425-
442.
Ewert, A., & Baker, D. (2001). Standing for where you sit: An exploratory analysis of the
relationship between academics major and environment beliefs. Environment and
Behavior, 33(5), 687-707.
Fisher, R. J., & Katz, J. E. (2000). Social-desirabiltiy bias and the validity of self-reported values.
Psychology and Marketing, 17(2), 105-120.
21
Foppa, K., Tanner, C., Jaeggi, C., & Arnold, S. (Eds.). (1995). Was hindert uns daran, zu tun,
was wir tun müssen? [What restricts us from doing what we are supported to do?] (Vol.
85, pp. 15-17). Bern, Switzerland: University of Bern.
Furnham, A. (1986). Response bias, social desirability and dissimulation. Personality and
Individual Differences, 7(3), 385-400.
Gagnon Thompson, S. C., & Barton, M. A. (1994). Ecocentric and anthropocentric attitudes
toward the environment. Journal of Environmental Psychology, 14(2), 149-157.
Ganster, D. C., Hennessey, H. W., & Luthans, F. (1983). Social desirability response effects:
Three different models Academy of Management Journal, 26(2), 955-966
Granzin, K. L., & Olsen, J. E. (1991). Characterizing participants in activities protecting the
environment: A focus on donating, recycling, and conservation behaviors. Journal of
Public Policy & Marketing, 10(2), 1-27.
Hines, J. M., Hungerford, H. R., & Tomera, A. N. (1987). Analysis and synthesis of research on
responsible environmental behavior: A meta-analysis. The Journal of Environmental
Education, 18, 1-8.
Kaiser, F. G. (1998). A general measure of ecological behavior. Journal of Applied Social
Psychology, 28(5), 395-422.
Kaiser, F. G., Oerke, B., & Bogner, F. X. (2007). Behavior-based environmental attitude:
Development of an instrument for adolescents. Journal of Environmental Psychology, in
press.
Kaiser, F. G., & Wilson, M. (2000). Assessing people´s general ecological behavior: A cross-
cultural measure. Journal of Applied Social Psychology, 30(5), 952-978.
Kaiser, F. G., & Wilson, M. (2004). Goal-directed conservation behavior: the specific
composition of a general performance. Personality and Individual Differences, 36, 1531-
1544.
22
Kaiser, F. G., Wölfing, S., & Fuhrer, U. (1999). Environmental attitude and ecological behaviour.
Journal of Environmental Psychology, 19, 1-19.
Lam, S.-P., & Cheng, S.-I. (2002). Cross-informant agreement in reports of environmental
behavior and the effect of cross-questioning on report accuracy. Environment and
Behavior, 34(4), 508-520.
Leeming, F. C., Dwyer, W. O., Porter, B. E., & Cobern, M. K. (1993). Outcome research in
environmental education: A critical review. Journal of Environmental Education, 24(4),
8-21.
Meinhold, J. L., & Malkus, A. J. (2005). Adolescent environmental behaviors: Can knowledge,
attitudes, and self-efficacy make a difference? Environment and Behavior, 37(4), 511-
532.
Milfont, T. L., & Duckitt, J. (2004). The structure of environmental attitudes: A first- and second-
order confirmatory factor analysis. Journal of Environmental Psychology, 24, 289-303.
Mummendey, H. D. (1981). Methoden und Probleme der Kontrolle sozialer Erwünschtheit
[Methods and problems of social desirability control]. Zeitschrift für Differentielle und
Diagnostische Psychologie, 2(3), 199-218.
Nederhof, A. J. (1985). Methods of coping with social desirability bias: a review. European
Journal of Social Psychology, 15(3), 263-280.
Newhouse, N. (1990). Implications of attitude and behavior research for environmental
conservation. Journal of Environmental Education, 22, 26-32.
Paulhus, D. L. (1984). Two-component models of socially desirable responding. Journal of
Personality and Social Psychology, 46(3), 598-609.
Paulhus, D. L. (1991). Measurement and control of response bias. In J. P. Robinson, P. Shaver &
L. S. Wrightsman (Eds.), Measures of personality and social psychological attitudes. San
Diego: Academic Press.
23
Paulhus, D. L. (2002). Socially desirable responding: The evolution of a construct. In H. I. Braun,
D. N. Jackson & D. E. Wiley (Eds.), Psychological and educational measurement (pp. 49-
69). Hillsdale, NJ: Erlbaum.
Piaget, J. (1965). The moral judgement of the child. New York: The Free Press.
Reynolds, C. R., & Richmond, B. O. (1985). Revised Children`s Manifest Anxiety Scale: Manual.
Los Angeles, CA: Western Psychological Services.
Reynolds, C. R., & Richmond, B. O. (1997). What I think and feel: A revised measure of
Children's Manifest Anxiety. Journal of Abnormal Child Psychology, 25(1), 15-20.
Richmond, B. O., & Millar, G. W. (1984). What I think and feel: A cross-cultural study of
anxiety in children. Psychology in the Schools, 21(2), 255-257.
Rokeach, M. (1968). Beliefs, attitudes, and values: A theory of organisation and change. San
Francisco: Jossey-Bass.
Rokeach, M. (1973). The nature of human values. New York: Free Press.
Sackeim, H. A., & Gur, R. (1979). Self-deception, other-deception, and self-reported
psychopathology. Journal of Consulting and Clinical Psychology, 47, 213-215.
Schahn, J. (2002). Aufwand und soziale Erwünschtheit als Prädiktoren von Itemmittelwerten:
Analysen auf Aggregat- und Individualdatenebene im Bereich Umwelteinstellung und -
verhalten [The role of behavioral costs and social desirability as predictors of
environmental attitudes and conservation behavior: An analysis on aggregate and on
individual data level]. Zeitschrift für Differentielle und Diagnostische Psychologie, 23(1),
45-54.
Schahn, J., & Möllers, D. (2002, Dezember ). Aufwand, Soziale Erwünschtheit und
Umweltbewusstsein: Replikation und neue Befunde [Costs, social desirability and
environmental consciousness: replication and new findings]. Diskussionspapier, 86.
Schmitt, M. J., & Steyer, R. (1993). A latent state-trait model (not only) for social desirability.
Personality and Individual Differences, 14(4), 519-529.
24
Schultz, P. W. (2001). The structure of environmental concern: Concern for self, other people,
and the biosphere. Journal of Environmental Psychology, 21, 327-339.
Schultz, P. W., Shriver, C., Tabanico, J. J., & Khazian, A. M. (2004). Implicit connections with
nature. Journal of Environmental Psychology, 24(1), 31-42.
Scott, D., & Willits, F. K. (1994). Environmental attitudes and behaviour: A Pennsylvania
survey. Environment and Behavior, 26(2), 239-260.
Tarrant, M. A., & Cordell, H. K. (1997). The effect of respondent characteristics on general
environmental attitude-behavior correspondence. Environment and Behavior, 29(5), 618-
637.
Van Liere, K. D., & Dunlap, R. E. (1981). Environmental concern: Does it make a difference
how it's measured? Environment and Behavior, 13(6), 651-676.
Weigel, R., & Weigel, J. (1978). Environmental concern: the development of a measure.
Environment and Behavior, 10(1), 3-15.
Wiseman, M., & Bogner, F. X. (2003). A higher-order model of ecological values and its
relationship to personality. Personality and Individual Differences, 34, 783-794.
25
Footnotes
1 Corresponding to Rockeach (1968, 1973), a set of closely related attitudes extracted as higher-
order factors are labelled `values´, while first-order factors are labelled `attitudes´.
2 As fit statistic, the averaged mean square (MS) statistics of 0.90 corresponds to a 10% lack of
variation (overfit) and a MS of 1.10 to a 10% excess of variation (underfit) in the model
prediction compared to what is in the data.
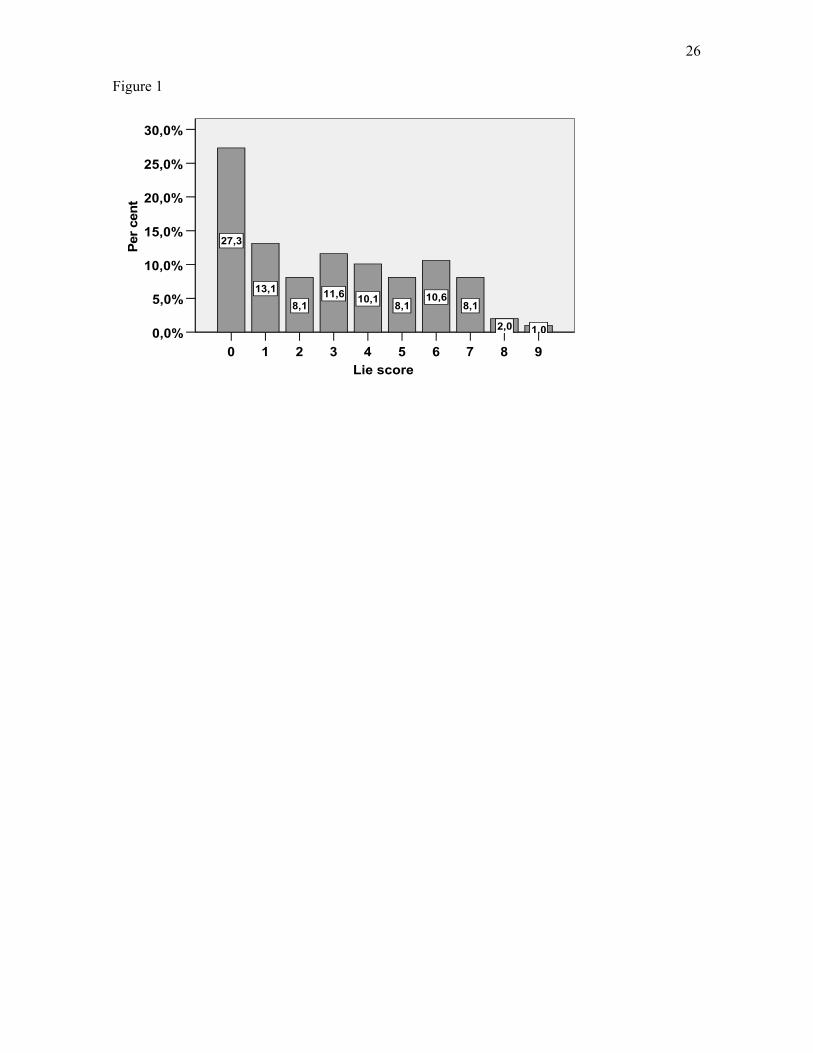
26
Figure 1
9876543210Lie score
30,0%
25,0%
20,0%
15,0%
10,0%
5,0%
0,0%
Per
cen
t
1,02,0
8,110,6
8,110,111,6
8,1
13,1
27,3
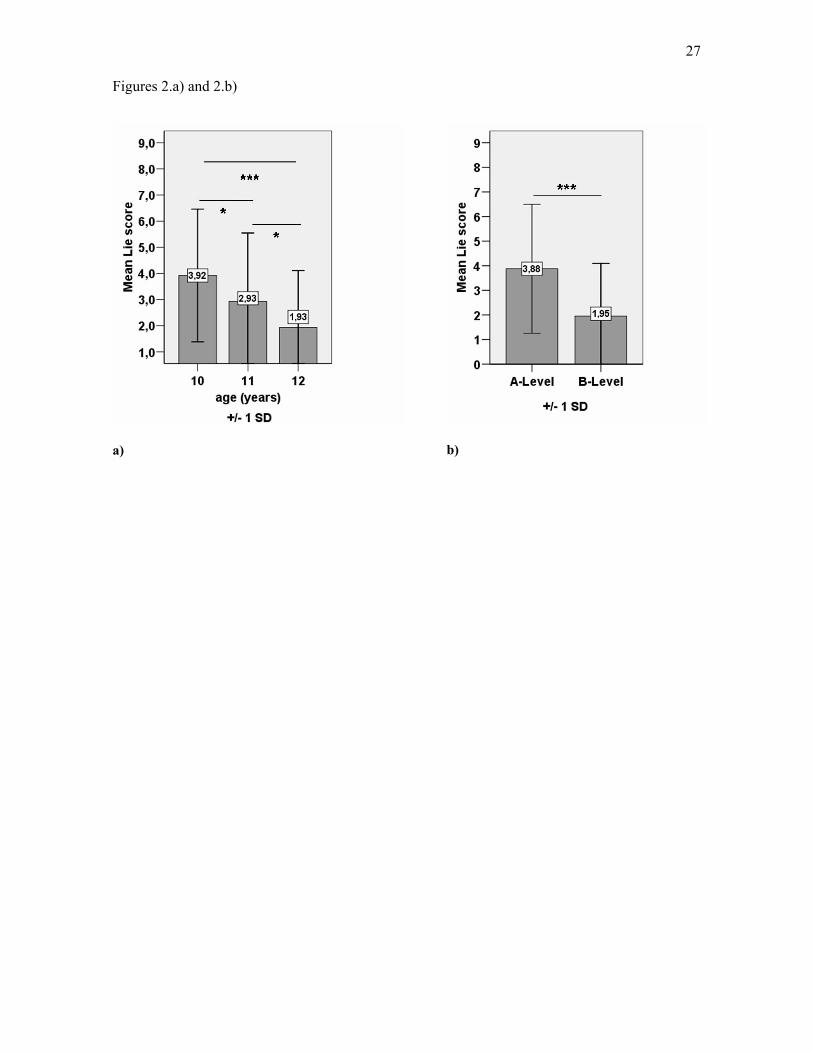
27
Figures 2.a) and 2.b)
a) b)
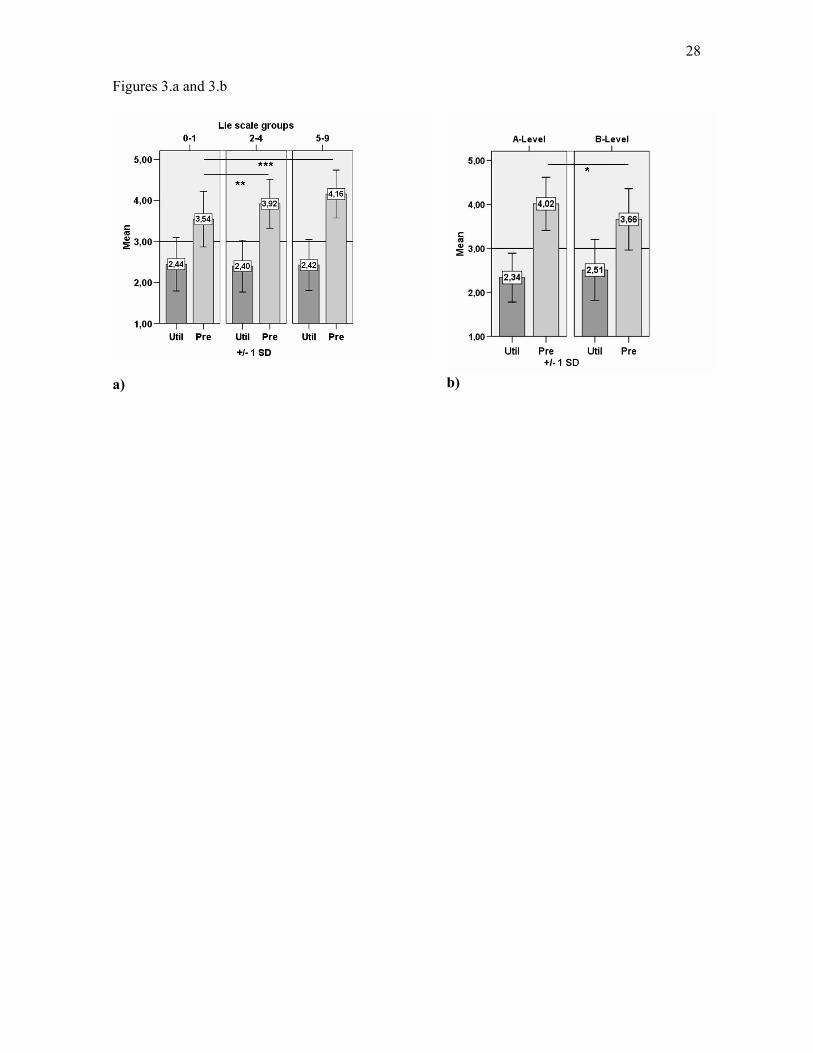
28
Figures 3.a and 3.b
a) b)
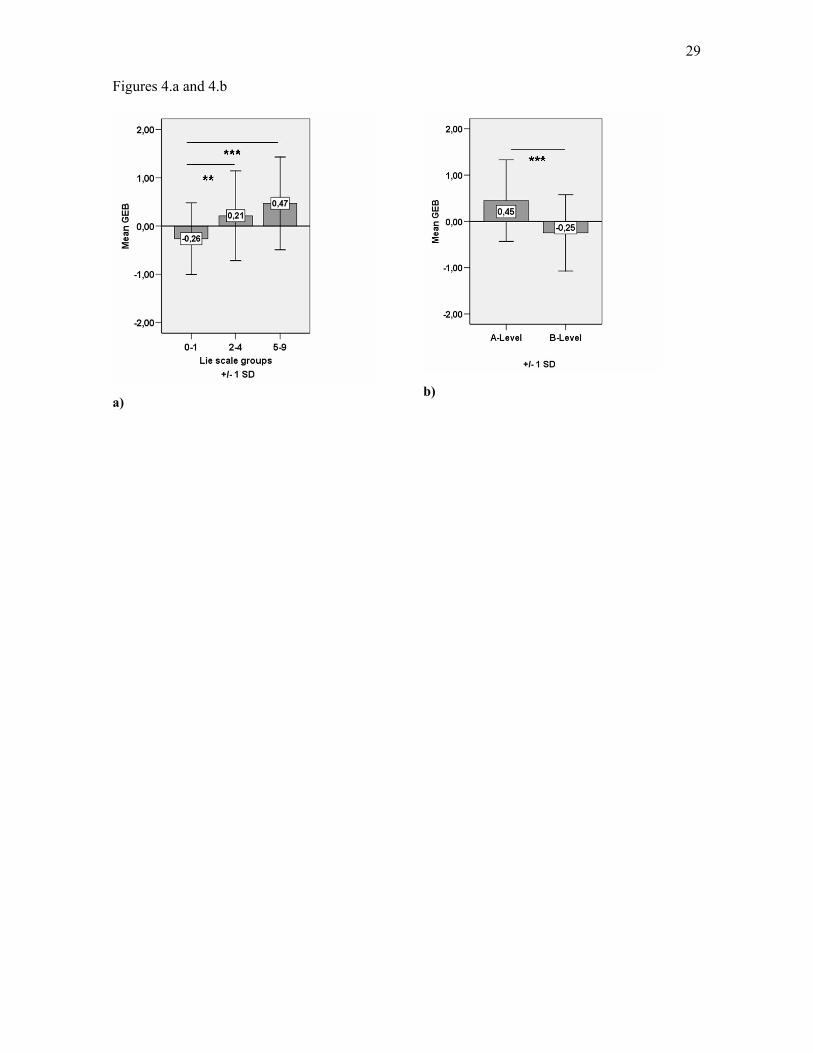
29
Figures 4.a and 4.b
a)b)

Acknowledgments
This research was supported by the BIOHEAD grant #CIT2-CT-2004-506015 from the
European Commission.
We wish to thank Stephen P. Tomkins for his language support.
Acknowledgements
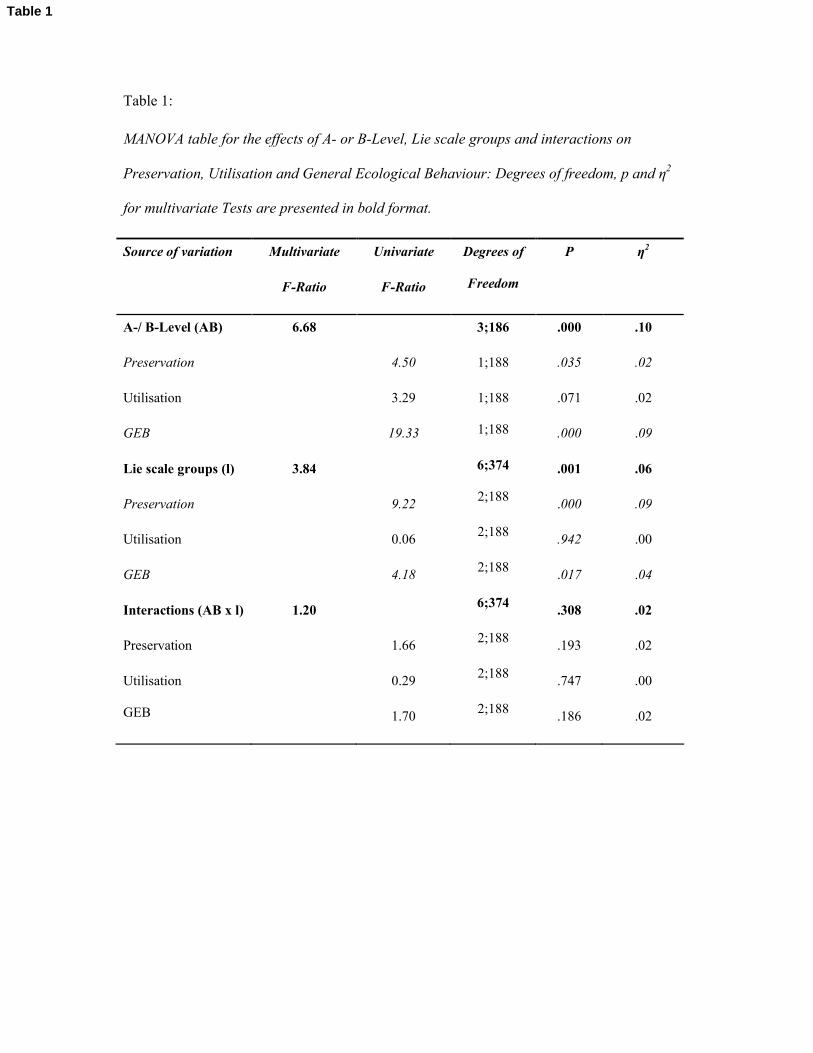
Table 1:
MANOVA table for the effects of A- or B-Level, Lie scale groups and interactions on
Preservation, Utilisation and General Ecological Behaviour: Degrees of freedom, p and η2
for multivariate Tests are presented in bold format.
Source of variation Multivariate
F-Ratio
Univariate
F-Ratio
Degrees of
Freedom
P η2
A-/ B-Level (AB)
Preservation
Utilisation
GEB
Lie scale groups (l)
Preservation
Utilisation
GEB
Interactions (AB x l)
Preservation
Utilisation
GEB
6.68
3.84
1.20
4.50
3.29
19.33
9.22
0.06
4.18
1.66
0.29
1.70
3;186
1;188
1;188
1;188
6;374
2;188
2;188
2;188
6;374
2;188
2;188
2;188
.000
.035
.071
.000
.001
.000
.942
.017
.308
.193
.747
.186
.10
.02
.02
.09
.06
.09
.00
.04
.02
.02
.00
.02
Table 1
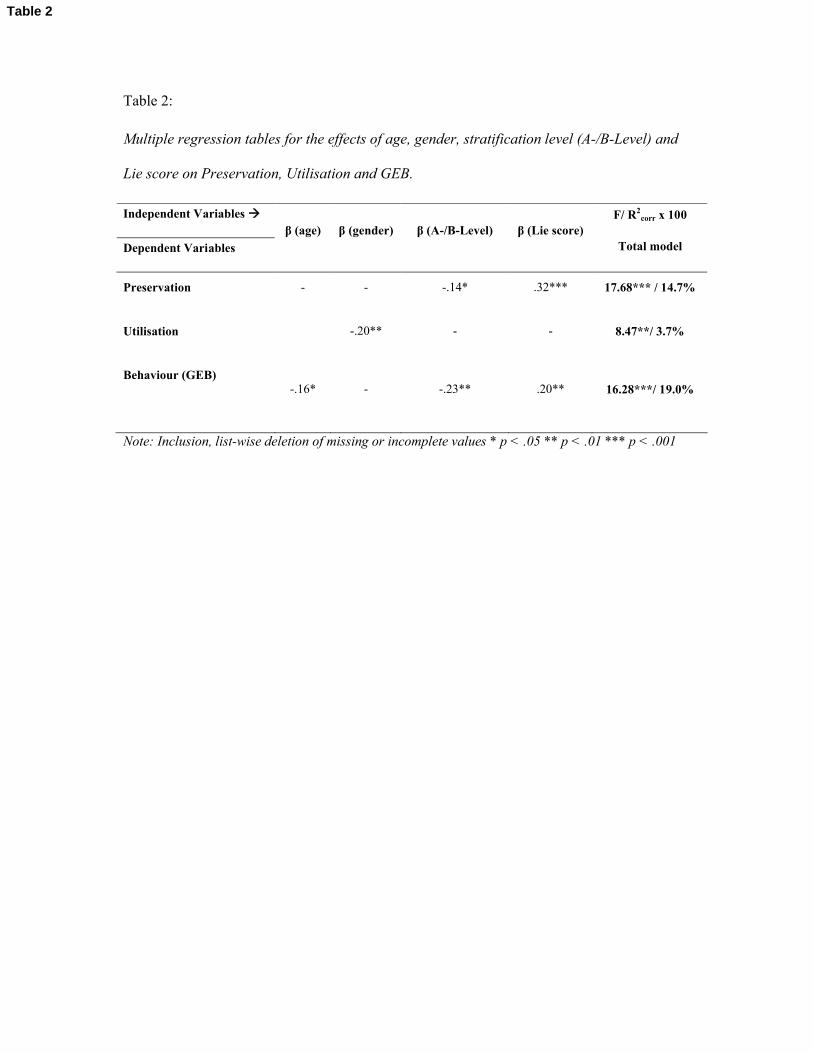
Table 2:
Multiple regression tables for the effects of age, gender, stratification level (A-/B-Level) and
Lie score on Preservation, Utilisation and GEB.
Independent Variables
Dependent Variables
β (age) β (gender) β (A-/B-Level) β (Lie score)F/ R2
corr x 100
Total model
Preservation - - -.14* .32*** 17.68*** / 14.7%
Utilisation -.20** - - 8.47**/ 3.7%
Behaviour (GEB)-.16* - -.23** .20** 16.28***/ 19.0%
Note: Inclusion, list-wise deletion of missing or incomplete values * p < .05 ** p < .01 *** p < .001
Table 2
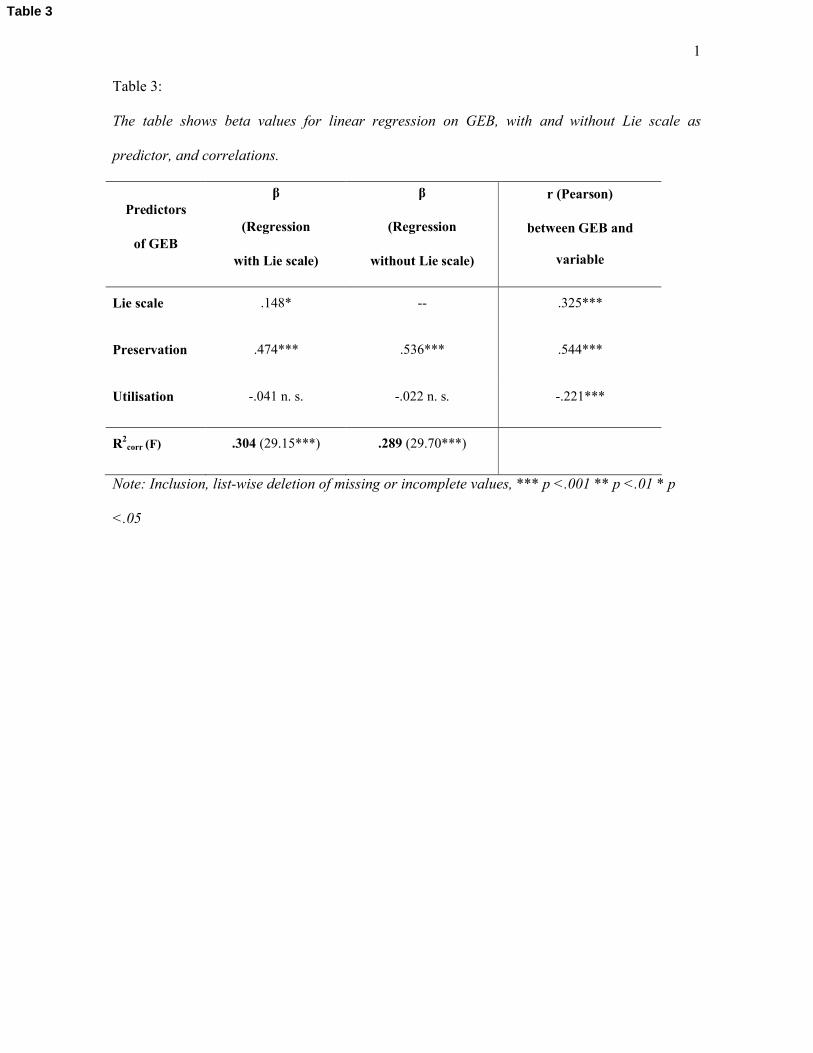
1
Table 3:
The table shows beta values for linear regression on GEB, with and without Lie scale as
predictor, and correlations.
Predictors
of GEB
β
(Regression
with Lie scale)
β
(Regression
without Lie scale)
r (Pearson)
between GEB and
variable
Lie scale .148* -- .325***
Preservation .474*** .536*** .544***
Utilisation -.041 n. s. -.022 n. s. -.221***
R2corr (F) .304 (29.15***) .289 (29.70***)
Note: Inclusion, list-wise deletion of missing or incomplete values, *** p <.001 ** p <.01 * p
<.05
Table 3
Anhang
115
Anhang
A.1 Verwendete Fragebögen
A.1.1 Fragebogen zum Umweltverhalten und Umwelteinstellungen von Schülern
(Teilarbeiten B und C)
A.1.2 Lügenskala (Teilarbeit B)
A.2 BIOHEAD-Citizen: Struktur von Einstellungen zur Umwelt und zu GMO
in der Gesamtstichprobe
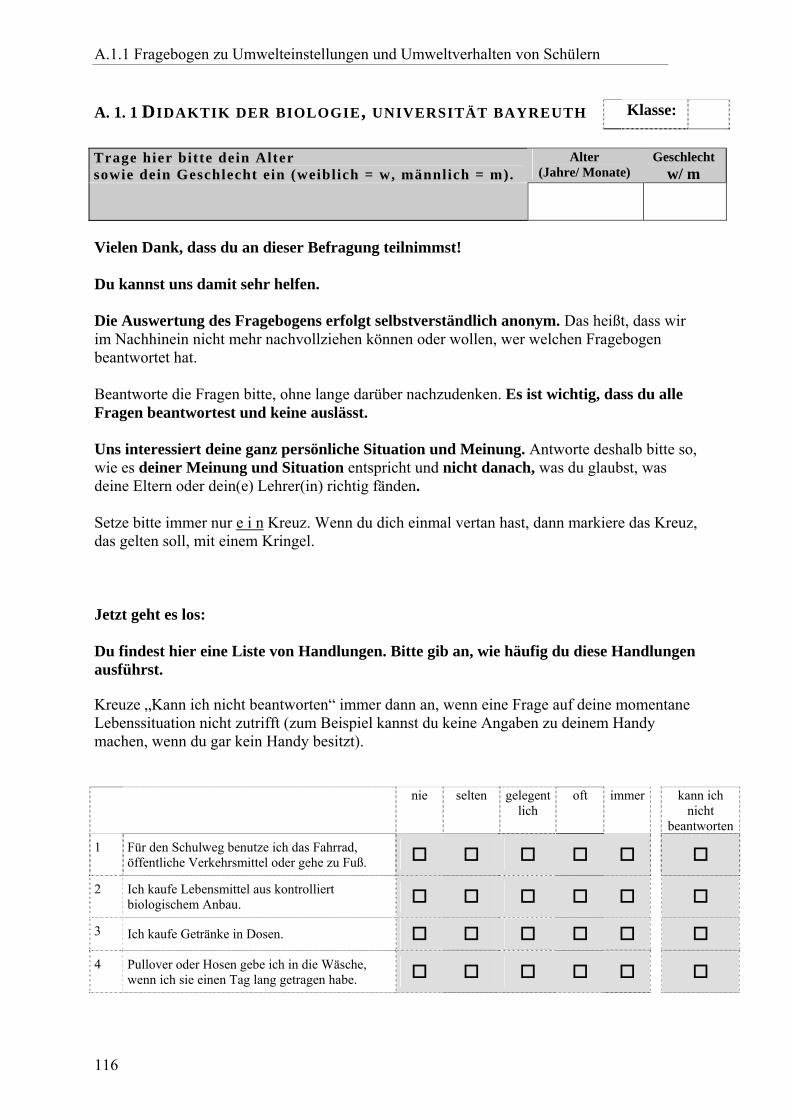
A.1.1 Fragebogen zu Umwelteinstellungen und Umweltverhalten von Schülern
116
A. 1. 1 DIDAKTIK DER BIOLOGIE, UNIVERSITÄT BAYREUTH Klasse:
Trage hier bitte dein Alter sowie dein Geschlecht ein (weiblich = w, männlich = m).
Alter (Jahre/ Monate)
Geschlecht w/ m
Vielen Dank, dass du an dieser Befragung teilnimmst! Du kannst uns damit sehr helfen. Die Auswertung des Fragebogens erfolgt selbstverständlich anonym. Das heißt, dass wir im Nachhinein nicht mehr nachvollziehen können oder wollen, wer welchen Fragebogen beantwortet hat. Beantworte die Fragen bitte, ohne lange darüber nachzudenken. Es ist wichtig, dass du alle Fragen beantwortest und keine auslässt. Uns interessiert deine ganz persönliche Situation und Meinung. Antworte deshalb bitte so, wie es deiner Meinung und Situation entspricht und nicht danach, was du glaubst, was deine Eltern oder dein(e) Lehrer(in) richtig fänden. Setze bitte immer nur e i n Kreuz. Wenn du dich einmal vertan hast, dann markiere das Kreuz, das gelten soll, mit einem Kringel. Jetzt geht es los: Du findest hier eine Liste von Handlungen. Bitte gib an, wie häufig du diese Handlungen ausführst. Kreuze „Kann ich nicht beantworten“ immer dann an, wenn eine Frage auf deine momentane Lebenssituation nicht zutrifft (zum Beispiel kannst du keine Angaben zu deinem Handy machen, wenn du gar kein Handy besitzt).
nie selten gelegentlich
oft immer kann ich nicht
beantworten1 Für den Schulweg benutze ich das Fahrrad,
öffentliche Verkehrsmittel oder gehe zu Fuß.
2 Ich kaufe Lebensmittel aus kontrolliert biologischem Anbau.
3 Ich kaufe Getränke in Dosen. 4 Pullover oder Hosen gebe ich in die Wäsche,
wenn ich sie einen Tag lang getragen habe.
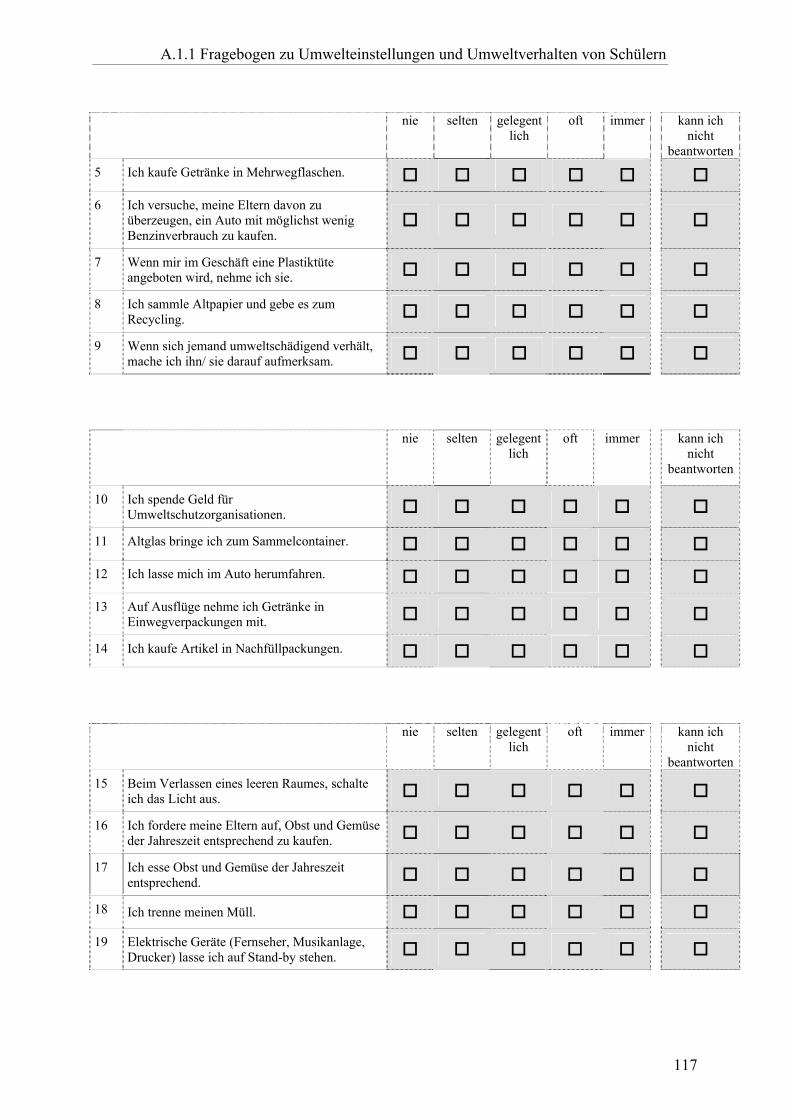
A.1.1 Fragebogen zu Umwelteinstellungen und Umweltverhalten von Schülern
117
nie selten gelegent
lich oft immer kann ich
nicht beantworten
5 Ich kaufe Getränke in Mehrwegflaschen. 6 Ich versuche, meine Eltern davon zu
überzeugen, ein Auto mit möglichst wenig Benzinverbrauch zu kaufen.
7 Wenn mir im Geschäft eine Plastiktüte angeboten wird, nehme ich sie.
8 Ich sammle Altpapier und gebe es zum Recycling.
9 Wenn sich jemand umweltschädigend verhält, mache ich ihn/ sie darauf aufmerksam.
nie selten gelegentlich
oft immer kann ich nicht
beantworten
10 Ich spende Geld für Umweltschutzorganisationen.
11 Altglas bringe ich zum Sammelcontainer. 12 Ich lasse mich im Auto herumfahren. 13 Auf Ausflüge nehme ich Getränke in
Einwegverpackungen mit.
14 Ich kaufe Artikel in Nachfüllpackungen.
nie selten gelegent
lich oft immer kann ich
nicht beantworten
15 Beim Verlassen eines leeren Raumes, schalte ich das Licht aus.
16 Ich fordere meine Eltern auf, Obst und Gemüse der Jahreszeit entsprechend zu kaufen.
17 Ich esse Obst und Gemüse der Jahreszeit entsprechend.
18 Ich trenne meinen Müll. 19 Elektrische Geräte (Fernseher, Musikanlage,
Drucker) lasse ich auf Stand-by stehen.
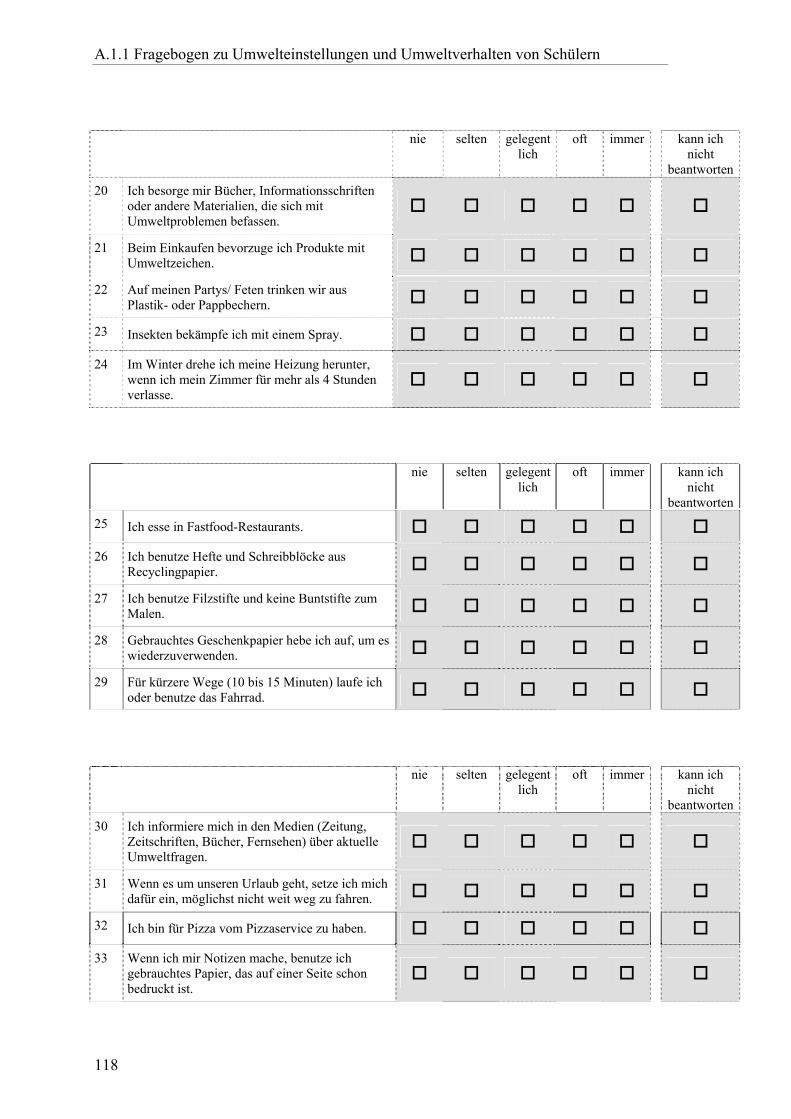
A.1.1 Fragebogen zu Umwelteinstellungen und Umweltverhalten von Schülern
118
nie selten gelegent
lich oft immer kann ich
nicht beantworten
20 Ich besorge mir Bücher, Informationsschriften oder andere Materialien, die sich mit Umweltproblemen befassen.
21 Beim Einkaufen bevorzuge ich Produkte mit Umweltzeichen.
22 Auf meinen Partys/ Feten trinken wir aus Plastik- oder Pappbechern.
23 Insekten bekämpfe ich mit einem Spray. 24 Im Winter drehe ich meine Heizung herunter,
wenn ich mein Zimmer für mehr als 4 Stunden verlasse.
nie selten gelegent
lich oft immer kann ich
nicht beantworten
25 Ich esse in Fastfood-Restaurants. 26 Ich benutze Hefte und Schreibblöcke aus
Recyclingpapier.
27 Ich benutze Filzstifte und keine Buntstifte zum Malen.
28 Gebrauchtes Geschenkpapier hebe ich auf, um es wiederzuverwenden.
29 Für kürzere Wege (10 bis 15 Minuten) laufe ich oder benutze das Fahrrad.
nie selten gelegent
lich oft immer kann ich
nicht beantworten
30 Ich informiere mich in den Medien (Zeitung, Zeitschriften, Bücher, Fernsehen) über aktuelle Umweltfragen.
31 Wenn es um unseren Urlaub geht, setze ich mich dafür ein, möglichst nicht weit weg zu fahren.
32 Ich bin für Pizza vom Pizzaservice zu haben. 33 Wenn ich mir Notizen mache, benutze ich
gebrauchtes Papier, das auf einer Seite schon bedruckt ist.
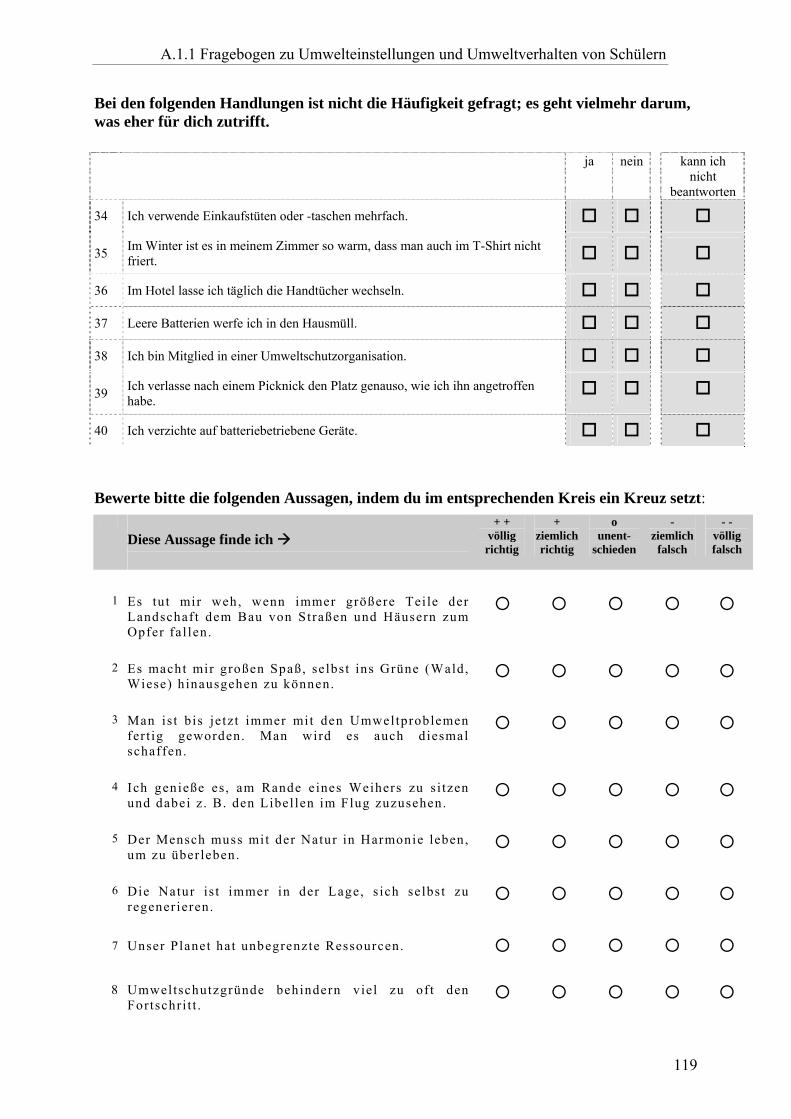
A.1.1 Fragebogen zu Umwelteinstellungen und Umweltverhalten von Schülern
119
Bei den folgenden Handlungen ist nicht die Häufigkeit gefragt; es geht vielmehr darum, was eher für dich zutrifft. ja nein kann ich
nicht beantworten
34 Ich verwende Einkaufstüten oder -taschen mehrfach.
35 Im Winter ist es in meinem Zimmer so warm, dass man auch im T-Shirt nicht friert.
36 Im Hotel lasse ich täglich die Handtücher wechseln.
37 Leere Batterien werfe ich in den Hausmüll.
38 Ich bin Mitglied in einer Umweltschutzorganisation.
39 Ich verlasse nach einem Picknick den Platz genauso, wie ich ihn angetroffen habe.
40 Ich verzichte auf batteriebetriebene Geräte. Bewerte bitte die folgenden Aussagen, indem du im entsprechenden Kreis ein Kreuz setzt:
Diese Aussage finde ich
+ + völlig
richtig
+ ziemlich richtig
o unent-
schieden
- ziemlich
falsch
- - völlig falsch
1 Es tu t mir weh, wenn immer größere Tei le der
Landschaf t dem Bau von Straßen und Häusern zum Opfer fa l len.
2 Es macht mir großen Spaß, selbst ins Grüne (Wald, Wiese) h inausgehen zu können.
3 Man is t b is je tz t immer mit den Umweltproblemen fer t ig geworden. Man wird es auch diesmal schaffen.
4 Ich genieße es, am Rande eines Weihers zu s i tzen und dabei z . B. den Libel len im Flug zuzusehen.
5 Der Mensch muss mit der Natur in Harmonie leben, um zu über leben.
6 Die Natur is t immer in der Lage, s ich selbst zu regener ieren.
7 Unser Planet hat unbegrenzte Ressourcen.
8 Umweltschutzgründe behindern viel zu of t den Fortschri t t .
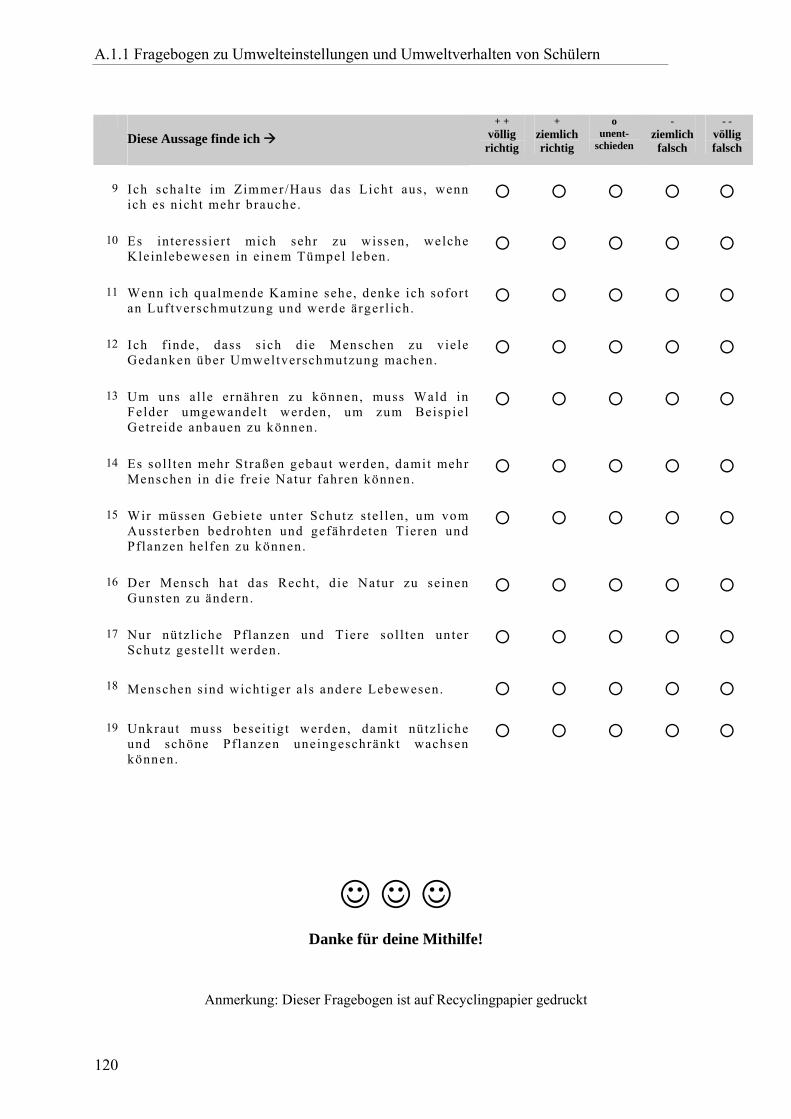
A.1.1 Fragebogen zu Umwelteinstellungen und Umweltverhalten von Schülern
120
Diese Aussage finde ich
+ + völlig
richtig
+ ziemlich richtig
o unent-
schieden -
ziemlich falsch
- - völlig falsch
9 Ich schal te im Zimmer/Haus das Licht aus, wenn ich es n icht mehr brauche.
10 Es in teressier t mich sehr zu wissen, welche Kleinlebewesen in e inem Tümpel leben.
11 Wenn ich qualmende Kamine sehe, denke ich sofor t an Luf tverschmutzung und werde ärger l ich.
12 Ich f inde, dass s ich die Menschen zu viele Gedanken über Umweltverschmutzung machen.
13 Um uns al le ernähren zu können, muss Wald in Felder umgewandel t werden, um zum Beispie l Getreide anbauen zu können.
14 Es sol l ten mehr Straßen gebaut werden, damit mehr Menschen in d ie f reie Natur fahren können.
15 Wir müssen Gebiete unter Schutz s te l len, um vom Aussterben bedrohten und gefährdeten Tieren und Pflanzen helfen zu können.
16 Der Mensch hat das Recht , d ie Natur zu seinen Gunsten zu ändern .
17 Nur nützl iche Pflanzen und Tiere sol l ten unter Schutz gestel l t werden.
18 Menschen sind wicht iger als andere Lebewesen.
19 Unkraut muss besei t ig t werden, damit nützl iche und schöne Pf lanzen uneingeschränkt wachsen können.
☺ ☺ ☺
Danke für deine Mithilfe!
Anmerkung: Dieser Fragebogen ist auf Recyclingpapier gedruckt
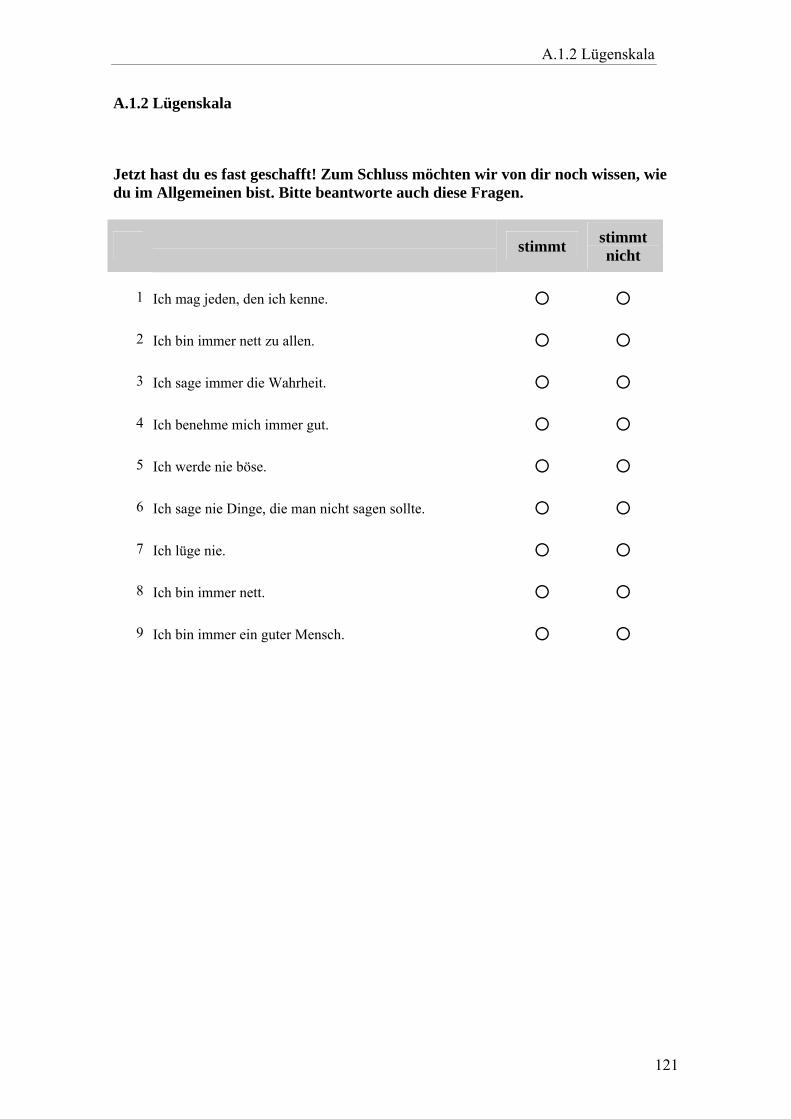
A.1.2 Lügenskala
121
A.1.2 Lügenskala
Jetzt hast du es fast geschafft! Zum Schluss möchten wir von dir noch wissen, wie du im Allgemeinen bist. Bitte beantworte auch diese Fragen.
stimmt stimmt
nicht
1 Ich mag jeden, den ich kenne.
2 Ich bin immer nett zu allen.
3 Ich sage immer die Wahrheit.
4 Ich benehme mich immer gut.
5 Ich werde nie böse.
6 Ich sage nie Dinge, die man nicht sagen sollte.
7 Ich lüge nie.
8 Ich bin immer nett.
9 Ich bin immer ein guter Mensch.
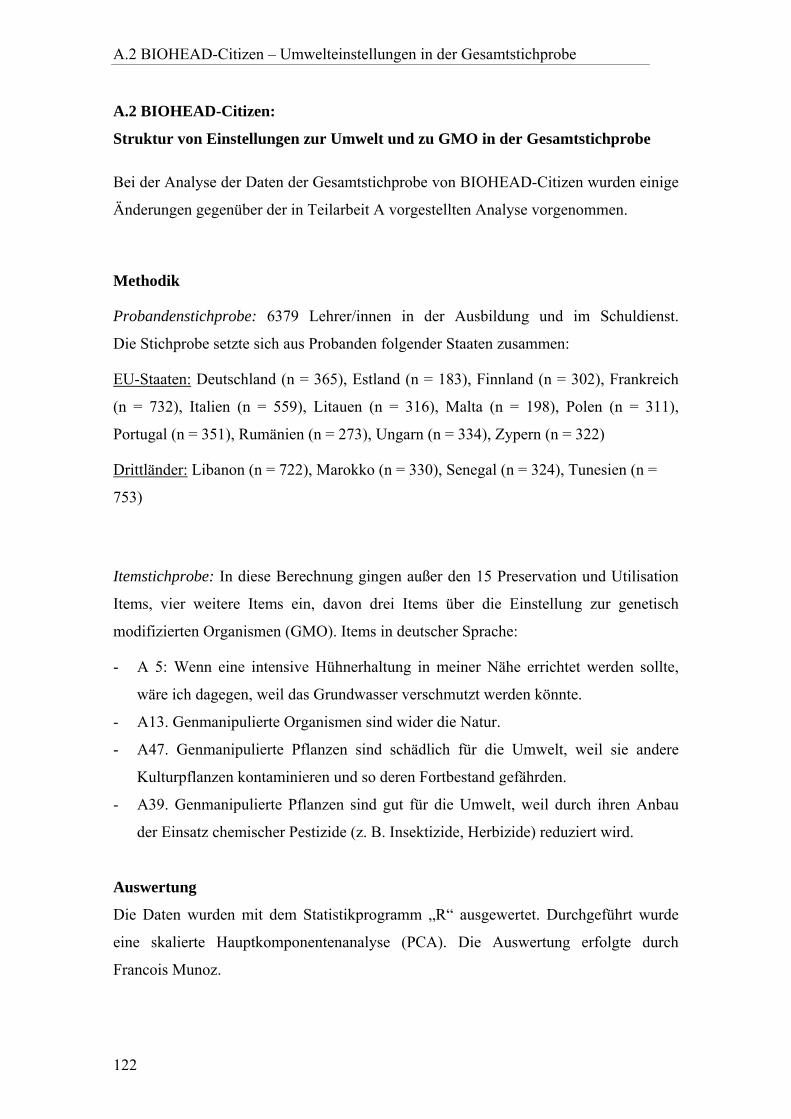
A.2 BIOHEAD-Citizen – Umwelteinstellungen in der Gesamtstichprobe
122
A.2 BIOHEAD-Citizen:
Struktur von Einstellungen zur Umwelt und zu GMO in der Gesamtstichprobe
Bei der Analyse der Daten der Gesamtstichprobe von BIOHEAD-Citizen wurden einige
Änderungen gegenüber der in Teilarbeit A vorgestellten Analyse vorgenommen.
Methodik
Probandenstichprobe: 6379 Lehrer/innen in der Ausbildung und im Schuldienst.
Die Stichprobe setzte sich aus Probanden folgender Staaten zusammen:
EU-Staaten: Deutschland (n = 365), Estland (n = 183), Finnland (n = 302), Frankreich
(n = 732), Italien (n = 559), Litauen (n = 316), Malta (n = 198), Polen (n = 311),
Portugal (n = 351), Rumänien (n = 273), Ungarn (n = 334), Zypern (n = 322)
Drittländer: Libanon (n = 722), Marokko (n = 330), Senegal (n = 324), Tunesien (n =
753)
Itemstichprobe: In diese Berechnung gingen außer den 15 Preservation und Utilisation
Items, vier weitere Items ein, davon drei Items über die Einstellung zur genetisch
modifizierten Organismen (GMO). Items in deutscher Sprache:
- A 5: Wenn eine intensive Hühnerhaltung in meiner Nähe errichtet werden sollte,
wäre ich dagegen, weil das Grundwasser verschmutzt werden könnte.
- A13. Genmanipulierte Organismen sind wider die Natur.
- A47. Genmanipulierte Pflanzen sind schädlich für die Umwelt, weil sie andere
Kulturpflanzen kontaminieren und so deren Fortbestand gefährden.
- A39. Genmanipulierte Pflanzen sind gut für die Umwelt, weil durch ihren Anbau
der Einsatz chemischer Pestizide (z. B. Insektizide, Herbizide) reduziert wird.
Auswertung
Die Daten wurden mit dem Statistikprogramm „R“ ausgewertet. Durchgeführt wurde
eine skalierte Hauptkomponentenanalyse (PCA). Die Auswertung erfolgte durch
Francois Munoz.
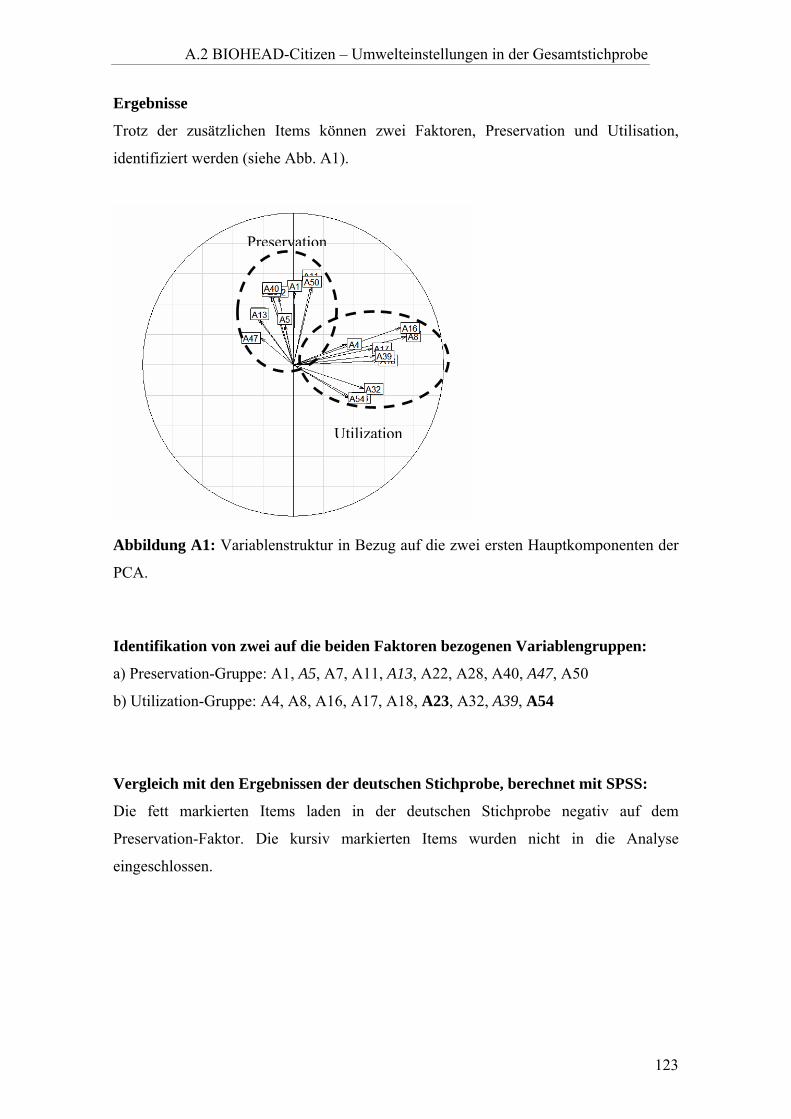
A.2 BIOHEAD-Citizen – Umwelteinstellungen in der Gesamtstichprobe
123
Ergebnisse
Trotz der zusätzlichen Items können zwei Faktoren, Preservation und Utilisation,
identifiziert werden (siehe Abb. A1).
Abbildung A1: Variablenstruktur in Bezug auf die zwei ersten Hauptkomponenten der
PCA.
Identifikation von zwei auf die beiden Faktoren bezogenen Variablengruppen:
a) Preservation-Gruppe: A1, A5, A7, A11, A13, A22, A28, A40, A47, A50
b) Utilization-Gruppe: A4, A8, A16, A17, A18, A23, A32, A39, A54
Vergleich mit den Ergebnissen der deutschen Stichprobe, berechnet mit SPSS:
Die fett markierten Items laden in der deutschen Stichprobe negativ auf dem
Preservation-Faktor. Die kursiv markierten Items wurden nicht in die Analyse
eingeschlossen.
Utilization
Preservation
Erklärung
Hiermit versichere ich, die vorliegende Arbeit selbständig verfasst und keine anderen
als die von mir angegebenen Quellen und Hilfsmittel verwendet zu haben.
Ferner erkläre ich, dass ich weder an der Universität Bayreuth noch an einer anderen
Hochschule versucht habe, eine Dissertation einzureichen, oder mich einer Promotions-
prüfung zu unterziehen.
Bayreuth, den 24.10.2007
Britta Oerke