Embed Size (px)
Citation preview
Project background Summary Investor observations Example disclosures Project methodology
Lab project report: Net debt reconciliationsSeptember 2012
Navigation Click here to view functionality
01 Lab project report | Net debt reconciliations
Contents
01 Project background
02 Summary of project process and observations
04 Investor observations
10 Example disclosures
• Example 1 – National Grid net
debt reconciliation
• Example 2 – Vodafone reconciliation
of net cash flows to net debt
• Example 3 – Royal Dutch Shell net
debt reconciliation and disclosure
of additional items
• Example 4 – BT Group definition
of net debt
15 Project methodology
What is the Lab?The Financial Reporting Lab has been set up by the Financial Reporting Council to improve the effectiveness of corporate reporting in the UK. The Lab provides a safe environment for listed companies and investors to explore innovative reporting solutions that better meet their needs.
Lab project reports do not form new reporting requirements. Instead, they summarise observations on practices that investors found useful to their analysis and encourage companies to consider adopting the practices if appropriate in the context of their own financial reporting.
Find out more about the Lab and its other projects at: http://www.frc.org.uk/Our-Work/Codes-Standards/Financial-Reporting-Lab.aspx
Do you have suggestions to share? The Lab encourages readers of this report to comment on its content and presentation. As far as possible, comments will be taken into account in producing the related reports on debt and cash flow disclosure, or may help shape future projects. To provide comments, please send us an email at: [email protected]
Lab project report: Net debt reconciliations
Project backgroundWhen talking to investors and companies about the areas that they would like to see the Financial Reporting Lab (the Lab) cover, debt and cash flow reporting came high on the list of priorities. Reflecting this, the Lab included four related areas of disclosure in its initial list of topics:
•Net debt reconciliations•Cash flow statements•Debt terms and economic obligations•Debt maturity schedules.
The Lab involved the same group of company participants and members of the investment community in discussions across all four topics. The project focused on existing reporting practices and aims to encourage more companies to consider adopting the practices highlighted as helping to meet the analytical needs of investors.
This report focuses on the first of these topics. Reports on the other topics will be published shortly.
References made in this report to views of ‘companies’ and ‘investors’ refer to the individuals from companies and investment community organisations that participated in this project. The term ‘investors’ is used as shorthand to refer to the investment community participants in this project, which include a broad range of individuals in their capacity as investors or their role in analyst organisations that work in the interest of investors.
Unsurprisingly, members of the investment community had different views on certain characteristics of reporting discussed. Where possible, the views have been distinguished by type of investor and their use of reported information, as well as the importance of particular disclosure in light of general economic, market or company circumstances.
While there may be messages in this report for all companies, the findings were discussed mainly in the context of companies outside of the financial services sector. Information that investors do not use could be considered to be clutter. However, this project on net debt reconciliations has shown the need for more disclosure in this specific area.
We refer to the tabular reconciliation of changes in net debt by component as a ‘net debt reconciliation’ (NDR); the reconciliation of the movement in cash with the movement in net debt as a ‘reconciliation of net cash flows to net debt’; and the two of these collectively as the ‘reconciliations’.
Project background Summary Investor observations Example disclosures Project methodology
Project background Summary Investor observations Example disclosures Project methodology
Lab project report | Net debt reconciliations02
Summary of project process and observationsSummary of project processFive companies in the UK that recognise the importance of good reporting offered to participate in this project to have the Lab facilitate investor feedback on the usefulness of their existing published disclosure.
The five companies are:
•BT Group •National Grid •Royal Dutch Shell•Vodafone •Xchanging
The overall objective of this project was to explore various voluntary practices and to identify those that investors found to be useful, indicating why this is the case and how information is used.
The Lab worked with these companies to:
•develop a list of questions to be discussed with investors; and
•identify illustrative excerpts from their accounts to be used during the meetings with investors.
Comments and thoughts on these were gathered by the Lab in a series of mainly face-to-face discussions with members of the investment community.
Over 30 individuals from 16 investment organisations provided input, covering a wide spectrum of those using reported information from institutional and retail investors, broker sell-side and independent research organisations, credit rating agencies, analyst associations and other advisers.
For further details on the process, see the section of this report on ‘Project methodology’.
“We take engagement with shareholders, analysts and the wider investment community very seriously. Our approach is to be open and transparent, and to encourage candid dialogue.”Ken Lever, Xchanging
Summary of project observationsNeed for a NDR, reconciliation of net cash flows to net debtA strong majority of investors indicate they use a NDR or reconciliation of net cash flows to net debt in their analysis when one is presented, and given the importance, attempt to construct them when they are not.
There are two typical uses of these reconciliations:
•equity valuation – taking into account how geared a company’s capital structure is, and the enterprise value attributable to net debt; and
•analysis or ‘investigation’ – looking into perceived problems with debt or liquidity.
The reconciliations can provide insight on the company’s definition of net debt, the cash and non-cash drivers of changes in net debt, the effect of hedging activities on debt, and the measurement of debt for accounting purposes, which are all important to these two analytical objectives.
While the NDR typically shows total cash and various non-cash changes for each component of net debt, a reconciliation of net cash flows to net debt generally shows the change in net debt in the aggregate, splitting out the cash and non-cash movements in greater detail and relating the cash movements to the statement of cash flows.
Some investors always use the reconciliations, and they are particularly important to a wide audience of both equity and fixed income investors when debt is significant to the company’s capital structure or where there are concerns over cash flow generation. Such circumstances heighten investor concerns over refinancing risk and bring a closer focus on debt and cash flows.
Background of the reconciliations in the UK
UK accounting standards define net debt and require a reconciliation that shows changes over the period for each component. A note reconciling the movement of cash with the movement in net debt is also required to be given. The requirements define net debt as including borrowings, together with related derivatives and obligations under finance leases, less cash and liquid resources.
IFRS does not refer to the term ‘net debt’ and has no requirement to show a reconciliation of changes in net debt (or debt).
Since adopting IFRS, some UK companies have removed the reconciliations that were previously presented under UK accounting standards. Other companies have retained them or provide similar disclosure, as part of the financial statements, narrative reporting, preliminary announcements, investor presentations, or a combination of these.
Each of the five companies participating in the Lab’s project voluntarily provides either a net debt reconciliation, a reconciliation of net cash flows to net debt, or both.
03
Project background Summary Investor observations Example disclosures Project methodology
Lab project report | Net debt reconciliations
Companies looking to issue or refinance debt should also find the observations in this report to be relevant.
Characteristics of the reconciliationsCharacteristics of the reconciliations that investors feel are most helpful include:
•Making clear how components of net debt relate to amounts on the balance sheet, by disclosing the corresponding balance sheet line items, and describing the nature of any adjustments made to these.
•Adjusting net debt to retranslate foreign currency denominated amounts to the exchange rates achieved by hedging, or disclosing the retranslation amount.
•Making clear the nature of any derivatives included in net debt and whether net debt includes accrued interest.
•Disclosing additional items, or aspects relevant to evaluating net debt, for example cash and investments that may not be readily available to pay debt, fair value or fair value hedge adjustments to reported debt, or derivatives related to debt that have not been adjusted for in the company’s definition of net debt.
•Disclosing separate movements in net debt, making clear whether each is cash or non- cash, and how they relate to other aspects of reporting (for example the income statement, the statement of cash flows, the balance sheet, or note disclosure relating to these).
•Listing movements that differ in nature separately, for example separately listing significant currency movements that differ from fair value changes that relate to different economic drivers.
•In the NDR, separately reconciling key components such as total borrowings, derivatives, cash and cash equivalents, and financial investments.
The section ‘Example disclosures’ provides illustrations of many of these reporting practices taken from the published annual reports of the companies participating in this project.
For further details of the observations made by investors see the section ‘Investor observations’.
Next stepsCompanies are encouraged to consider whether the suggested approaches described are relevant to their own circumstances, and if so, to enhance their reporting to meet investor needs more fully.
The Lab considers there to be room for further dialogue and development of enhanced disclosure in this area. Should companies want to build on the existing practices highlighted and explore potential new approaches, the Lab would be pleased to discuss this topic further.
Lab comment
Companies that do not currently provide a NDR or reconciliation of net cash flows to net debt could consider: how easy it is to construct these reconciliations from the information in our published accounts?
If this feels similar to what one investor described as ‘a scavenger hunt’, the company’s reporting may benefit from adding a NDR, reconciliation of net cash flows to net debt, or both.
Investors have also told us that they often need to prove out changes in net debt in a relatively short time frame. Presenting this for them can save critical analytical time, allowing them more time to focus on the key strategic issues and opportunities for your company.
Some investors also observed that areas of concern might be more easily addressed when the company has previously provided certain basic information. It may be best to provide the components of net debt, and a reconciliation of net cash flows to net debt, or a NDR at some level of detail. This could be expanded upon if necessary, for example if concerns over cash generation intensify.

04
Project background Investor observations Example disclosures Project methodologySummary
Lab project report | Net debt reconciliations
Investor observationsAre NDRs useful? A strong majority of investors indicate they use a net debt reconciliation in their analysis. A range of reasons were cited for this, including the investigation of particular points and equity valuation issues. The former mainly has implications for the detail of the reconciliation, whereas the latter has implications for the definition of net debt.
Some investors indicate that they use information in the NDR as it provides a ‘comfort factor’ when investigating potential problems, and that it ‘answers questions of potential sellers rather than persuades buyers’. The section ‘Which reconciling items are needed in a NDR?’ covers particular types of movements scrutinised by investors.
A few investors indicate that they are only likely to refer to a NDR if there is a concern over cash generation relative to debt levels, or very significant changes in debt. One also notes that the NDR might not be used regularly as it is not provided consistently by companies across what is often a pan-European base of investor coverage.
Cash movementsSome investors use the NDR to understand how net debt movements reconcile to what was expected from a cash standpoint, to see any ‘shocks to the system’ and whether the company has done what it said it would do in prior discussions of financial policy and strategy.
Also mentioned is that the NDR:
•ensures that investors have not missed any relevant cash flows in understanding the business;
•helps with evaluating liquidity risks and potential covenant breaches by showing how amounts move over time; and
•offers an understanding of how debt financing has changed over time and whether increases in cash balances can be explained by a commensurate increase in borrowings.
Non-cash movementsInvestors also highlight that some important changes in funding may not be in the cash
flow statement, such as the use of finance leases, debt assumed in an acquisition, fair value and fair value hedge adjustments, and foreign exchange movements. The NDR can provide insight on the exposure to foreign exchange movements and other non-cash movements that may not otherwise be apparent.
Capital structureIf a company’s debt structure is complicated, the NDR can help provide an overall picture of the debt structure. Investors also use the NDR to better understand how the term net debt has been used, tying components to what they represent on the balance sheet and to related notes. Net debt also flows through to comparisons of gearing levels used by investors.
Equity investors note that net debt is a key component for modelling equity value, which is the result of estimating enterprise value and subtracting from it the economic value of net debt. In companies with significant levels of debt relative to their market capitalisation, net debt and its development are a very important valuation consideration.
Analysts use the current year NDR to understand various sensitivities in the past development of debt in order to work forward to an appropriate future net debt figure for valuation, for example sensitivities to foreign exchange or fair value movements.
Average net debtWhile the NDR shows the overall change in net debt over the period, some investors would also like to have an average figure for net debt, as this would help in considering the reasonableness of interest cost as a percentage of debt. The year-end figures can be considerably lower than the average, making the cost of debt look unreasonably high. BT Group added such a disclosure in its 2012 annual report (see Example 4).
“The NDR provides a comfort factor. It answers questions of potential sellers rather than persuades buyers.”An equities analyst
“We aim to provide decision-useful information, including disclosures not required by IFRSs but relevant in understanding how the company is managed and has performed.”Royal Dutch Shell
“If investors cannot understand what happened in net debt, then they cannot understand the company.” An equities analyst

05
Project background Investor observations Example disclosures Project methodologySummary
Lab project report | Net debt reconciliations
Do investors reconcile net debt if companies do not? Hoping to gain insight to the importance to investment analysis of reconciling net debt movements, the Lab asked investors if they try to reconcile changes in net debt when a company does not disclose a NDR.
Many indicate that they regularly try to reconcile net debt based on information in the cash flow statement and disclosed elsewhere. Others indicate that as part of their model, they build their own reconciliation by realigning reported amounts into a standard template, typically one which reconciles net cash flows to changes in net debt, and will use any reconciliations provided to fill in details of large differences not explained by cash flows and other disclosures.
However, investors comment that almost always there is an element missing from their attempts such as non-cash changes that cannot be seen from the notes. This often happens when investors are most concerned to prove the changes out, which suggests the value of a reconciliation being disclosed by the company.
Some investors indicate that they generally contact the company for further information and that time could be saved if the NDR was already provided in the company’s report. Others generally cannot spend further time
investigating the difference, or simply do not try to reconcile net debt as it is generally not a fruitful exercise.
Should net debt be defined? Investors make arguments for and against standardisation of a net debt definition.
Defined by each companyInvestors observe that currently net debt is not defined by IFRS, and so companies develop their own approach. Many accept this approach and some even favour it. Investors highlight the importance of:
•showing how each component relates to the corresponding amount on the balance sheet; and
•using clear descriptions, for example indicating whether all derivatives are included, or just those relating to other components of net debt.
A quick review of information by investors is necessary when it is announced, so clear disclosure of what each of the components represents is critical for relatively easy use of the information.
Investors typically use their own definition of net debt in developing their analysis and valuation models, but these naturally start with balance sheet amounts and this is often published in research. However, it is important that this can be reconciled to the
company’s own definition of net debt and the difference explained. If adjustments to balance sheet amounts are made by the company to arrive at its definition of net debt, it is helpful if these adjustments can be seen in, or tied to, other related disclosure, for example if an adjustment for hedging can be tied into the note on derivatives.
Investors observe that disclosure of the components of net debt, either as part of the net debt reconciliation (beginning and ending points of a reconciliation by component), or in a separate list of the components, can effectively provide the company’s definition of net debt, as long as the components are easily linked in this manner. In other words, net debt can be defined by what the company includes and excludes in the calculation, rather than by a qualitative description of its characteristics.
Some investors feel there is value in allowing companies to use their own definition of net debt as it may reflect key aspects of their business. Many examples of this were noted, including environmental liabilities, derivatives, vendor finance, etc. Others do not believe that net debt can effectively be defined, for example they question how debt liabilities might be distinguished from other liabilities, and some even fear that standardising the definition could prevent companies from providing interesting insight as to what they consider to be the net debt component of their capital structure.
Standardised Several investors consider it desirable for there to be a more standard approach to defining net debt, particularly within a sector, as the valuation approach will be similar within a sector. There is a feeling that some investors may not appreciate the diversity of approaches that exist and the impact this may have on their analysis. A standard approach might eliminate questions of what is included and why, as well as the inconsistencies.
One investor indicated that some companies follow the definition of net debt in their bank covenants, and that this provides a meaningful convention.
Words used by investors to describe a possible starting point for a definition included ‘simple’ and ‘conventional’, by which it was intended that net debt could be a relatively basic combination of financial debt, net of cash and cash equivalents.
“We believe it is important for users that net debt ties back to the financial statements as this facilitates tracking of movements.” Royal Dutch Shell
06
Project background Investor observations Example disclosures Project methodologySummary
Lab project report | Net debt reconciliations
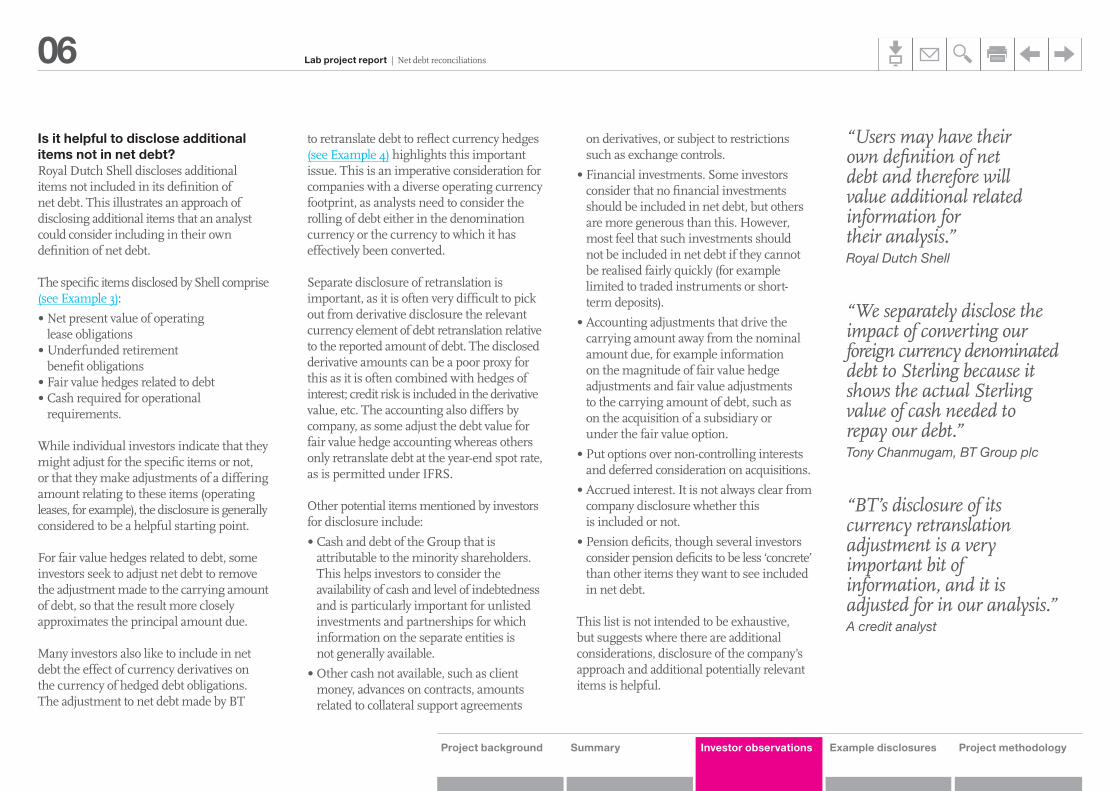
Is it helpful to disclose additional items not in net debt? Royal Dutch Shell discloses additional items not included in its definition of net debt. This illustrates an approach of disclosing additional items that an analyst could consider including in their own definition of net debt.
The specific items disclosed by Shell comprise (see Example 3):
•Net present value of operating lease obligations
•Underfunded retirement benefit obligations
•Fair value hedges related to debt•Cash required for operational
requirements.
While individual investors indicate that they might adjust for the specific items or not, or that they make adjustments of a differing amount relating to these items (operating leases, for example), the disclosure is generally considered to be a helpful starting point.
For fair value hedges related to debt, some investors seek to adjust net debt to remove the adjustment made to the carrying amount of debt, so that the result more closely approximates the principal amount due.
Many investors also like to include in net debt the effect of currency derivatives on the currency of hedged debt obligations. The adjustment to net debt made by BT
to retranslate debt to reflect currency hedges (see Example 4) highlights this important issue. This is an imperative consideration for companies with a diverse operating currency footprint, as analysts need to consider the rolling of debt either in the denomination currency or the currency to which it has effectively been converted.
Separate disclosure of retranslation is important, as it is often very difficult to pick out from derivative disclosure the relevant currency element of debt retranslation relative to the reported amount of debt. The disclosed derivative amounts can be a poor proxy for this as it is often combined with hedges of interest; credit risk is included in the derivative value, etc. The accounting also differs by company, as some adjust the debt value for fair value hedge accounting whereas others only retranslate debt at the year-end spot rate, as is permitted under IFRS.
Other potential items mentioned by investors for disclosure include:
•Cash and debt of the Group that is attributable to the minority shareholders. This helps investors to consider the availability of cash and level of indebtedness and is particularly important for unlisted investments and partnerships for which information on the separate entities is not generally available.
•Other cash not available, such as client money, advances on contracts, amounts related to collateral support agreements
on derivatives, or subject to restrictions such as exchange controls.
•Financial investments. Some investors consider that no financial investments should be included in net debt, but others are more generous than this. However, most feel that such investments should not be included in net debt if they cannot be realised fairly quickly (for example limited to traded instruments or short- term deposits).
•Accounting adjustments that drive the carrying amount away from the nominal amount due, for example information on the magnitude of fair value hedge adjustments and fair value adjustments to the carrying amount of debt, such as on the acquisition of a subsidiary or under the fair value option.
•Put options over non-controlling interests and deferred consideration on acquisitions.
•Accrued interest. It is not always clear from company disclosure whether this is included or not.
•Pension deficits, though several investors consider pension deficits to be less ‘concrete’ than other items they want to see included in net debt.
This list is not intended to be exhaustive, but suggests where there are additional considerations, disclosure of the company’s approach and additional potentially relevant items is helpful.
“Users may have their own definition of net debt and therefore will value additional related information for their analysis.” Royal Dutch Shell
“We separately disclose the impact of converting our foreign currency denominated debt to Sterling because it shows the actual Sterling value of cash needed to repay our debt.” Tony Chanmugam, BT Group plc
“BT’s disclosure of its currency retranslation adjustment is a very important bit of information, and it is adjusted for in our analysis.”A credit analyst
07
Project background Investor observations Example disclosures Project methodologySummary
Lab project report | Net debt reconciliations
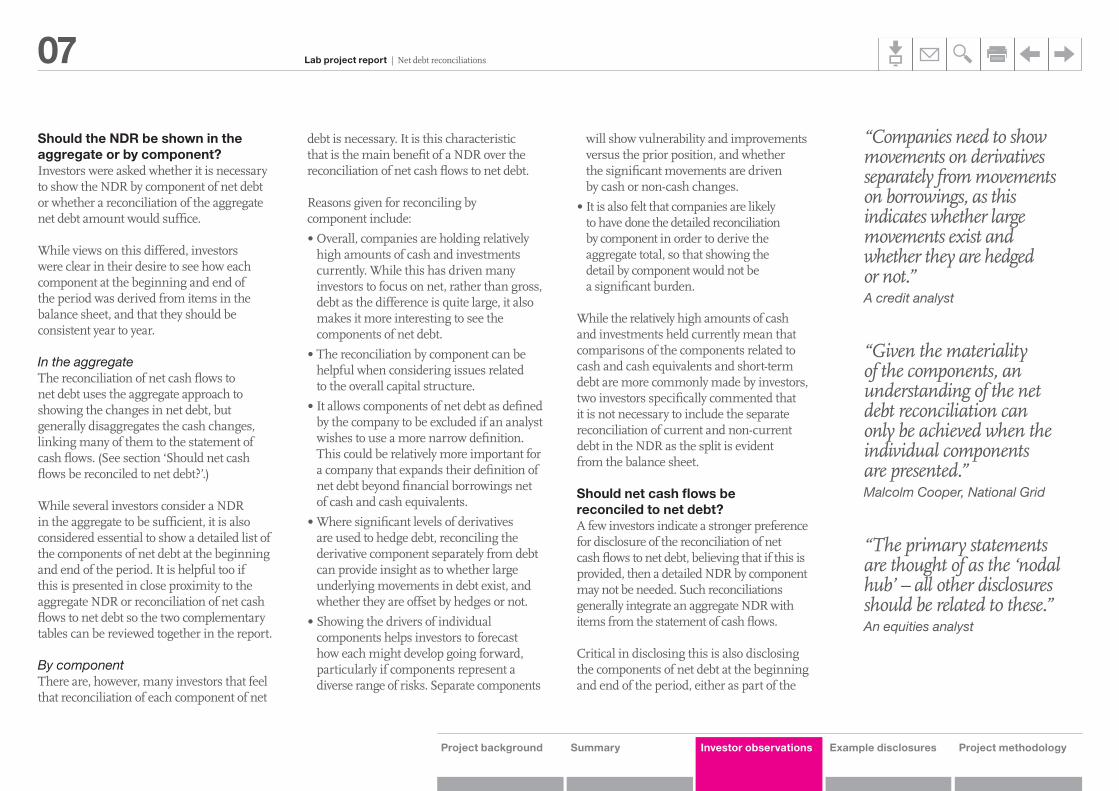
Should the NDR be shown in the aggregate or by component? Investors were asked whether it is necessary to show the NDR by component of net debt or whether a reconciliation of the aggregate net debt amount would suffice.
While views on this differed, investors were clear in their desire to see how each component at the beginning and end of the period was derived from items in the balance sheet, and that they should be consistent year to year.
In the aggregateThe reconciliation of net cash flows to net debt uses the aggregate approach to showing the changes in net debt, but generally disaggregates the cash changes, linking many of them to the statement of cash flows. (See section ‘Should net cash flows be reconciled to net debt?’.)
While several investors consider a NDR in the aggregate to be sufficient, it is also considered essential to show a detailed list of the components of net debt at the beginning and end of the period. It is helpful too if this is presented in close proximity to the aggregate NDR or reconciliation of net cash flows to net debt so the two complementary tables can be reviewed together in the report.
By componentThere are, however, many investors that feel that reconciliation of each component of net
debt is necessary. It is this characteristic that is the main benefit of a NDR over the reconciliation of net cash flows to net debt.
Reasons given for reconciling by component include:
•Overall, companies are holding relatively high amounts of cash and investments currently. While this has driven many investors to focus on net, rather than gross, debt as the difference is quite large, it also makes it more interesting to see the components of net debt.
•The reconciliation by component can be helpful when considering issues related to the overall capital structure.
•It allows components of net debt as defined by the company to be excluded if an analyst wishes to use a more narrow definition. This could be relatively more important for a company that expands their definition of net debt beyond financial borrowings net of cash and cash equivalents.
•Where significant levels of derivatives are used to hedge debt, reconciling the derivative component separately from debt can provide insight as to whether large underlying movements in debt exist, and whether they are offset by hedges or not.
•Showing the drivers of individual components helps investors to forecast how each might develop going forward, particularly if components represent a diverse range of risks. Separate components
will show vulnerability and improvements versus the prior position, and whether the significant movements are driven by cash or non-cash changes.
•It is also felt that companies are likely to have done the detailed reconciliation by component in order to derive the aggregate total, so that showing the detail by component would not be a significant burden.
While the relatively high amounts of cash and investments held currently mean that comparisons of the components related to cash and cash equivalents and short-term debt are more commonly made by investors, two investors specifically commented that it is not necessary to include the separate reconciliation of current and non-current debt in the NDR as the split is evident from the balance sheet.
Should net cash flows be reconciled to net debt? A few investors indicate a stronger preference for disclosure of the reconciliation of net cash flows to net debt, believing that if this is provided, then a detailed NDR by component may not be needed. Such reconciliations generally integrate an aggregate NDR with items from the statement of cash flows. Critical in disclosing this is also disclosing the components of net debt at the beginning and end of the period, either as part of the
“Companies need to show movements on derivatives separately from movements on borrowings, as this indicates whether large movements exist and whether they are hedged or not.” A credit analyst
“Given the materiality of the components, an understanding of the net debt reconciliation can only be achieved when the individual components are presented.” Malcolm Cooper, National Grid
“The primary statements are thought of as the ‘nodal hub’ – all other disclosures should be related to these.” An equities analyst
08
Project background Investor observations Example disclosures Project methodologySummary
Lab project report | Net debt reconciliations
NDR or in a separate table accompanying the reconciliation of net cash flows to net debt. Investors highlight that it is helpful if such information is presented in close proximity so it can be seen together.
Vodafone and Xchanging both disclose such reconciliations (see Example 2, Vodafone) and BT Group added one in its March 2012 annual report.
The best of these reconciliations highlight key movements clearly, and separately show cash and non-cash drivers of changes to net debt that are generally of interest to investors, in a user-friendly format. Ideally, most cash amounts easily relate to amounts also shown on the statement of cash flows.
Some investors observe that the reconciliations of net cash flows to net debt are somewhat repetitive of either items on the cash flow statement or the NDR (if one is presented), and many consider them helpful in confirming how items in the statements tie together (the balance sheet, income statement, statement of cash flows) and relating changes in net debt to each of these statements.
While the order and classification of items can differ in such reconciliations, several investors commented that these presentations closely matched their own standard templates that reconcile such information. It was also noted that any unusual items for a business or industry could be shown separately and that analysts could reclassify items if this is desirable.
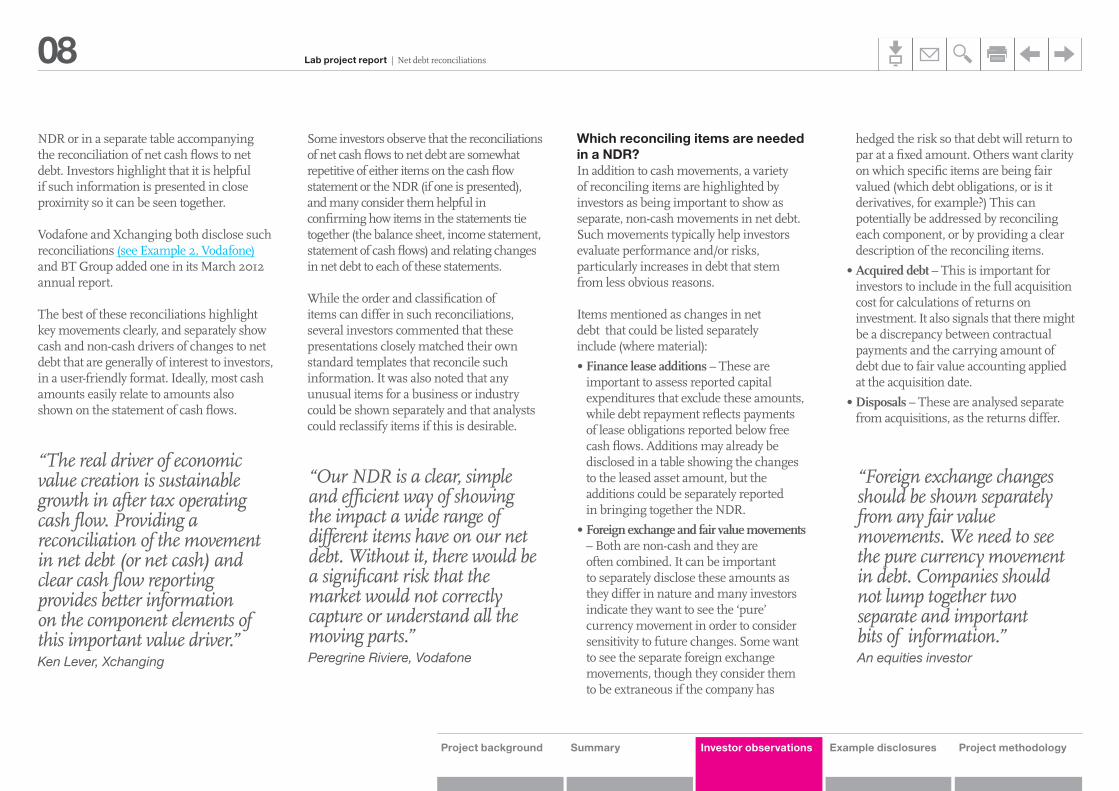
Which reconciling items are needed in a NDR? In addition to cash movements, a variety of reconciling items are highlighted by investors as being important to show as separate, non-cash movements in net debt. Such movements typically help investors evaluate performance and/or risks, particularly increases in debt that stem from less obvious reasons.
Items mentioned as changes in net debt that could be listed separately include (where material):
•Finance lease additions – These are important to assess reported capital expenditures that exclude these amounts, while debt repayment reflects payments of lease obligations reported below free cash flows. Additions may already be disclosed in a table showing the changes to the leased asset amount, but the additions could be separately reported in bringing together the NDR.
•Foreign exchange and fair value movements – Both are non-cash and they are often combined. It can be important to separately disclose these amounts as they differ in nature and many investors indicate they want to see the ‘pure’ currency movement in order to consider sensitivity to future changes. Some want to see the separate foreign exchange movements, though they consider them to be extraneous if the company has
hedged the risk so that debt will return to par at a fixed amount. Others want clarity on which specific items are being fair valued (which debt obligations, or is it derivatives, for example?) This can potentially be addressed by reconciling each component, or by providing a clear description of the reconciling items.
•Acquired debt – This is important for investors to include in the full acquisition cost for calculations of returns on investment. It also signals that there might be a discrepancy between contractual payments and the carrying amount of debt due to fair value accounting applied at the acquisition date.
•Disposals – These are analysed separate from acquisitions, as the returns differ.
“The real driver of economic value creation is sustainable growth in after tax operating cash flow. Providing a reconciliation of the movement in net debt (or net cash) and clear cash flow reporting provides better information on the component elements of this important value driver.”Ken Lever, Xchanging
“Our NDR is a clear, simple and efficient way of showing the impact a wide range of different items have on our net debt. Without it, there would be a significant risk that the market would not correctly capture or understand all the moving parts.”Peregrine Riviere, Vodafone
“Foreign exchange changes should be shown separately from any fair value movements. We need to see the pure currency movement in debt. Companies should not lump together two separate and important bits of information.” An equities investor
09
Project background Investor observations Example disclosures Project methodologySummary
Lab project report | Net debt reconciliations
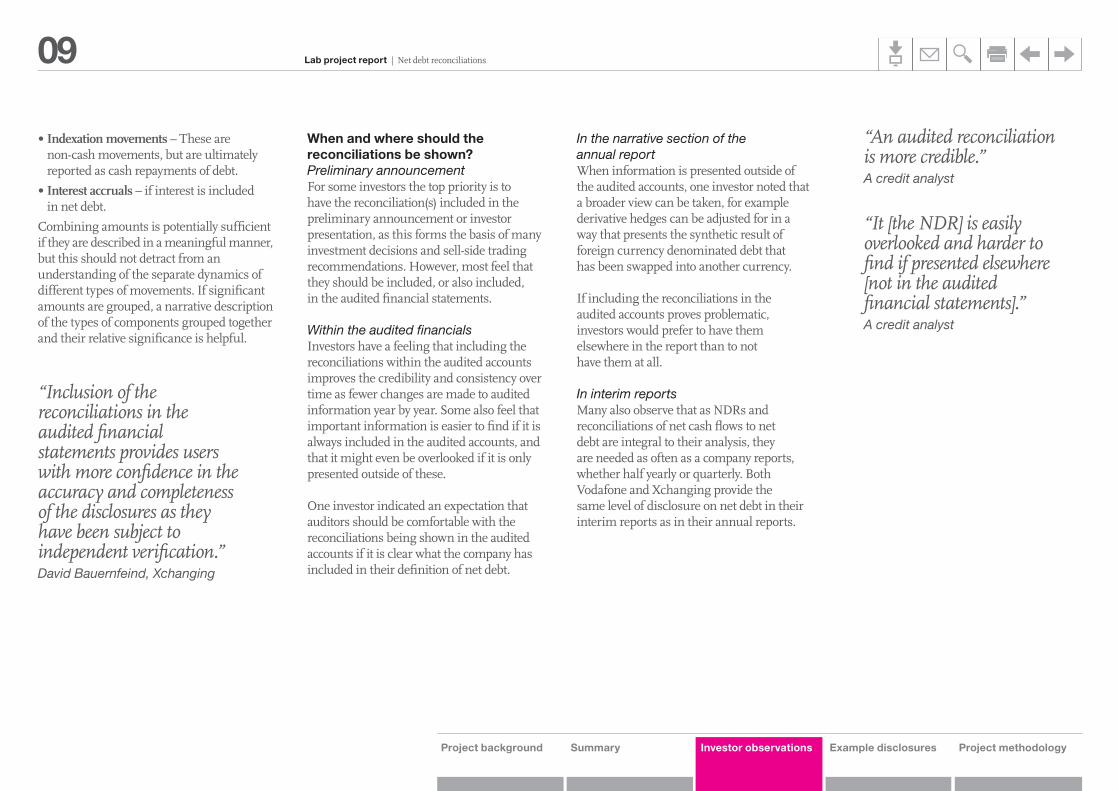
•Indexation movements – These are non-cash movements, but are ultimately reported as cash repayments of debt.
•Interest accruals – if interest is included in net debt.
Combining amounts is potentially sufficient if they are described in a meaningful manner, but this should not detract from an understanding of the separate dynamics of different types of movements. If significant amounts are grouped, a narrative description of the types of components grouped together and their relative significance is helpful.
When and where should the reconciliations be shown? Preliminary announcementFor some investors the top priority is to have the reconciliation(s) included in the preliminary announcement or investor presentation, as this forms the basis of many investment decisions and sell-side trading recommendations. However, most feel that they should be included, or also included, in the audited financial statements. Within the audited financialsInvestors have a feeling that including the reconciliations within the audited accounts improves the credibility and consistency over time as fewer changes are made to audited information year by year. Some also feel that important information is easier to find if it is always included in the audited accounts, and that it might even be overlooked if it is only presented outside of these.
One investor indicated an expectation that auditors should be comfortable with the reconciliations being shown in the audited accounts if it is clear what the company has included in their definition of net debt.
In the narrative section of the annual reportWhen information is presented outside of the audited accounts, one investor noted that a broader view can be taken, for example derivative hedges can be adjusted for in a way that presents the synthetic result of foreign currency denominated debt that has been swapped into another currency.
If including the reconciliations in the audited accounts proves problematic, investors would prefer to have them elsewhere in the report than to not have them at all.
In interim reportsMany also observe that as NDRs and reconciliations of net cash flows to net debt are integral to their analysis, they are needed as often as a company reports, whether half yearly or quarterly. Both Vodafone and Xchanging provide the same level of disclosure on net debt in their interim reports as in their annual reports.
“An audited reconciliation is more credible.”A credit analyst
“It [the NDR] is easily overlooked and harder to find if presented elsewhere [not in the audited financial statements].”A credit analyst
“Inclusion of the reconciliations in the audited financial statements provides users with more confidence in the accuracy and completeness of the disclosures as they have been subject to independent verification.” David Bauernfeind, Xchanging
10
Project background Example disclosures Project methodologySummary Investor observations
Lab project report | Net debt reconciliations
Example disclosure 1Net debt reconciliation
National Grid, March 2012 Annual Report
Financial Statements
27. Consolidated cash flow statement
(a) Reconciliation of net cash flow to movement in net debt2012
£m2011
£m2010
£m
Decrease in cash and cash equivalents (43) (346) (28)(Decrease)/increase in financial investments (553) 1,577 (805)Decrease in borrowings and related derivatives 154 1,763 499Net interest paid on the components of net debt 721 1,011 999
Change in net debt resulting from cash flows 279 4,005 665Changes in fair value of financial assets and liabilities and exchange movements (87) 690 865Net interest charge on the components of net debt (1,042) (1,228) (996)Reclassified as held for sale (2) 9 –Other non-cash movements (14) (68) –
Movement in net debt (net of related derivative financial instruments) in the year (866) 3,408 534Net debt (net of related derivative financial instruments) at start of year (18,731) (22,139) (22,673)
Net debt (net of related derivative financial instruments) at end of year (19,597) (18,731) (22,139)
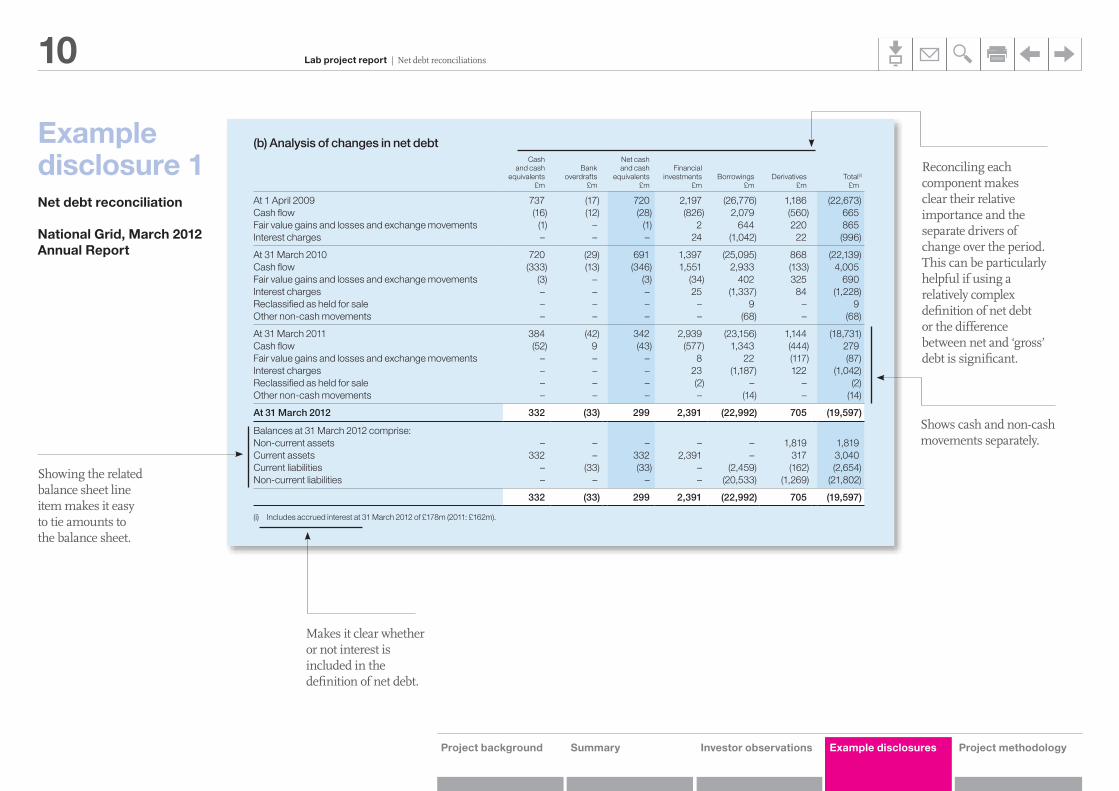
(b) Analysis of changes in net debtCash
and cashequivalents
£m
Bankoverdrafts
£m
Net cash and cash
equivalents£m
Financialinvestments
£mBorrowings
£mDerivatives
£mTotal(i)
£m
At 1 April 2009 737 (17) 720 2,197 (26,776) 1,186 (22,673)Cash flow (16) (12) (28) (826) 2,079 (560) 665Fair value gains and losses and exchange movements (1) – (1) 2 644 220 865Interest charges – – – 24 (1,042) 22 (996)
At 31 March 2010 720 (29) 691 1,397 (25,095) 868 (22,139)Cash flow (333) (13) (346) 1,551 2,933 (133) 4,005Fair value gains and losses and exchange movements (3) – (3) (34) 402 325 690Interest charges – – – 25 (1,337) 84 (1,228)Reclassified as held for sale – – – – 9 – 9Other non-cash movements – – – – (68) – (68)
At 31 March 2011 384 (42) 342 2,939 (23,156) 1,144 (18,731)Cash flow (52) 9 (43) (577) 1,343 (444) 279Fair value gains and losses and exchange movements – – – 8 22 (117) (87)Interest charges – – – 23 (1,187) 122 (1,042)Reclassified as held for sale – – – (2) – – (2)Other non-cash movements – – – – (14) – (14)
At 31 March 2012 332 (33) 299 2,391 (22,992) 705 (19,597)
Balances at 31 March 2012 comprise:Non-current assets – – – – – 1,819 1,819Current assets 332 – 332 2,391 – 317 3,040Current liabilities – (33) (33) – (2,459) (162) (2,654)Non-current liabilities – – – – (20,533) (1,269) (21,802)
332 (33) 299 2,391 (22,992) 705 (19,597)
(i) Includes accrued interest at 31 March 2012 of £178m (2011: £162m).
Notes to the consolidated financial statements continued
150 National Grid plc Annual Report and Accounts 2011/12
Showing the related balance sheet line item makes it easy to tie amounts to the balance sheet.
Reconciling each component makes clear their relative importance and the separate drivers of change over the period. This can be particularly helpful if using a relatively complex definition of net debt or the difference between net and ‘gross’ debt is significant.
Shows cash and non-cash movements separately.
Makes it clear whether or not interest is included in the definition of net debt.
11
Project background Example disclosures Project methodologySummary Investor observations
Lab project report | Net debt reconciliations Business reviewPerform
anceG
overnanceFinancials
Additional information
55Vodafone Group Plc Annual Report 2012
We provide returns to shareholders through dividends and have historically paid dividends semi-annually, with a regular interim dividend in respect of the first six months of the financial year payable in February and a final dividend payable in August. The directors expect that we will continue to pay dividends semi-annually.
In November 2011 the directors announced an interim dividend of 3.05 pence per share representing a 7.0% increase over last year’s interim dividend. In addition a special, second interim, dividend of 4.0 pence per share was paid in February 2012 following the receipt of a US$4.5 billion (£2.9 billion) income dividend from Verizon Wireless. The directors are proposing a final dividend of 6.47 pence per share. Total dividends, excluding special dividends, for the year increased by 7.0% to 9.52 pence per share.
In May 2010 the directors issued a dividend per share growth target, excluding special dividends, of at least 7% per annum for each of the financial years in the period ending 31 March 2013, assuming no material adverse foreign exchange rate movements. We expect that total ordinary dividends per share will therefore be no less than 10.18 pence for the 2013 financial year. See page 50 for the assumptions underlying this expectation.
Liquidity and capital resourcesThe major sources of Group liquidity for the 2012 and 2011 financial years were cash generated from operations, dividends from associates, disposal of investments and borrowings through short-term and long-term issuances in the capital markets. We do not use non-consolidated special purpose entities as a source of liquidity or for other financing purposes.
Our key sources of liquidity for the foreseeable future are likely to be cash generated from operations and borrowings through long-term and short-term issuances in the capital markets as well as committed bank facilities.
Our liquidity and working capital may be affected by a material decrease in cash flow due to factors such as reduced operating cash flow resulting from further possible business disposals, increased competition, litigation, timing of tax payments and the resolution of outstanding tax issues, regulatory rulings, delays in the development of new services and networks, licence and spectrum payments, inability to receive expected revenue from the introduction of new services, reduced dividends from associates and investments or increased dividend payments to non-controlling shareholders. Please see the section titled “Principal risk factors and uncertainties” on pages 51 to 53.
We are also party to a number of agreements that may result in a cash outflow in future periods. These agreements are discussed further in “Option agreements and similar arrangements” at the end of this section.
Wherever possible, surplus funds in the Group (except in Albania, Egypt, India, Qatar and Vodacom) are transferred to the centralised treasury department through repayment of borrowings, deposits, investments, share purchases and dividends. These are then loaned internally or contributed as equity to fund our operations, used to retire external debt, invested externally or used to fund shareholder returns.
Cash flowsCash generated by operations decreased by 3.7% to £14.8 billion primarily driven by working capital movements and lower EBITDA.
Free cash flow decreased by 13.4% to £6.1 billion primarily due to increased cash capital expenditure, working capital movements and lower dividends from associates1, offset by lower payments for taxation.
Cash capital expenditure increased by £0.8 billion, driven by a reduction in working capital creditors and increased investment, particularly in Vodacom and Germany.
Payments for taxation decreased by 24.2% to £2.0 billion primarily due to accelerated tax depreciation in the United States and the timing of tax payments in Italy.
Dividends received from associates and investments1 decreased by £0.3 billion due to the loss of dividends resulting from the disposal of the Group’s interest in SFR and China Mobile Limited. Net interest payments were stable at £1.3 billion.
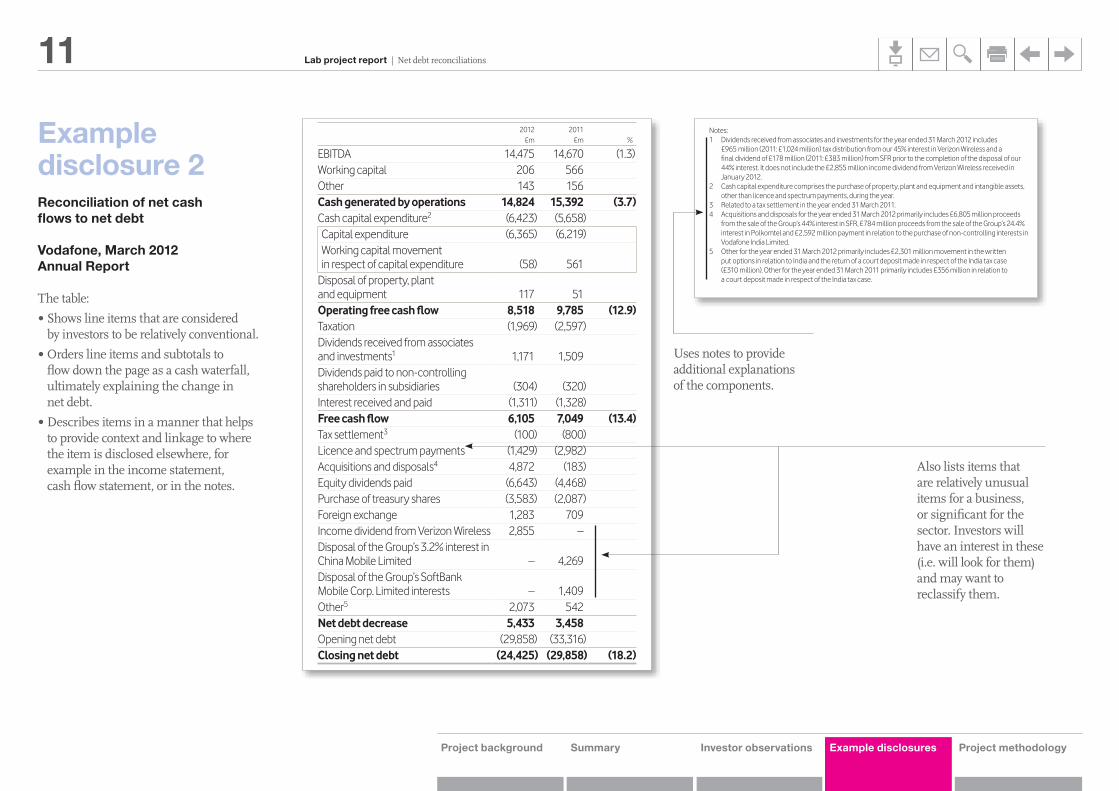
2012 2011£m £m %
EBITDA 14,475 14,670 (1.3)Working capital 206 566Other 143 156Cash generated by operations 14,824 15,392 (3.7)Cash capital expenditure2 (6,423) (5,658)Capital expenditure (6,365) (6,219)Working capital movement in respect of capital expenditure (58) 561
Disposal of property, plant and equipment 117 51Operating free cash flow 8,518 9,785 (12.9)Taxation (1,969) (2,597)Dividends received from associates and investments1 1,171 1,509Dividends paid to non-controlling shareholders in subsidiaries (304) (320)Interest received and paid (1,311) (1,328)Free cash flow 6,105 7,049 (13.4)Tax settlement3 (100) (800)Licence and spectrum payments (1,429) (2,982)Acquisitions and disposals4 4,872 (183)Equity dividends paid (6,643) (4,468)Purchase of treasury shares (3,583) (2,087)Foreign exchange 1,283 709Income dividend from Verizon Wireless 2,855 –Disposal of the Group’s 3.2% interest in China Mobile Limited – 4,269Disposal of the Group’s SoftBank Mobile Corp. Limited interests – 1,409Other5 2,073 542Net debt decrease 5,433 3,458Opening net debt (29,858) (33,316)Closing net debt (24,425) (29,858) (18.2)
Notes:1 Dividends received from associates and investments for the year ended 31 March 2012 includes
£965 million (2011: £1,024 million) tax distribution from our 45% interest in Verizon Wireless and a final dividend of £178 million (2011: £383 million) from SFR prior to the completion of the disposal of our 44% interest. It does not include the £2,855 million income dividend from Verizon Wireless received in January 2012.
2 Cash capital expenditure comprises the purchase of property, plant and equipment and intangible assets, other than licence and spectrum payments, during the year.
3 Related to a tax settlement in the year ended 31 March 2011.4 Acquisitions and disposals for the year ended 31 March 2012 primarily includes £6,805 million proceeds
from the sale of the Group’s 44% interest in SFR, £784 million proceeds from the sale of the Group’s 24.4% interest in Polkomtel and £2,592 million payment in relation to the purchase of non-controlling interests in Vodafone India Limited.
5 Other for the year ended 31 March 2012 primarily includes £2,301 million movement in the written put options in relation to India and the return of a court deposit made in respect of the India tax case (£310 million). Other for the year ended 31 March 2011 primarily includes £356 million in relation to a court deposit made in respect of the India tax case.
Business reviewPerform
anceG
overnanceFinancials
Additional information
55Vodafone Group Plc Annual Report 2012
We provide returns to shareholders through dividends and have historically paid dividends semi-annually, with a regular interim dividend in respect of the first six months of the financial year payable in February and a final dividend payable in August. The directors expect that we will continue to pay dividends semi-annually.
In November 2011 the directors announced an interim dividend of 3.05 pence per share representing a 7.0% increase over last year’s interim dividend. In addition a special, second interim, dividend of 4.0 pence per share was paid in February 2012 following the receipt of a US$4.5 billion (£2.9 billion) income dividend from Verizon Wireless. The directors are proposing a final dividend of 6.47 pence per share. Total dividends, excluding special dividends, for the year increased by 7.0% to 9.52 pence per share.
In May 2010 the directors issued a dividend per share growth target, excluding special dividends, of at least 7% per annum for each of the financial years in the period ending 31 March 2013, assuming no material adverse foreign exchange rate movements. We expect that total ordinary dividends per share will therefore be no less than 10.18 pence for the 2013 financial year. See page 50 for the assumptions underlying this expectation.
Liquidity and capital resourcesThe major sources of Group liquidity for the 2012 and 2011 financial years were cash generated from operations, dividends from associates, disposal of investments and borrowings through short-term and long-term issuances in the capital markets. We do not use non-consolidated special purpose entities as a source of liquidity or for other financing purposes.
Our key sources of liquidity for the foreseeable future are likely to be cash generated from operations and borrowings through long-term and short-term issuances in the capital markets as well as committed bank facilities.
Our liquidity and working capital may be affected by a material decrease in cash flow due to factors such as reduced operating cash flow resulting from further possible business disposals, increased competition, litigation, timing of tax payments and the resolution of outstanding tax issues, regulatory rulings, delays in the development of new services and networks, licence and spectrum payments, inability to receive expected revenue from the introduction of new services, reduced dividends from associates and investments or increased dividend payments to non-controlling shareholders. Please see the section titled “Principal risk factors and uncertainties” on pages 51 to 53.
We are also party to a number of agreements that may result in a cash outflow in future periods. These agreements are discussed further in “Option agreements and similar arrangements” at the end of this section.
Wherever possible, surplus funds in the Group (except in Albania, Egypt, India, Qatar and Vodacom) are transferred to the centralised treasury department through repayment of borrowings, deposits, investments, share purchases and dividends. These are then loaned internally or contributed as equity to fund our operations, used to retire external debt, invested externally or used to fund shareholder returns.
Cash flowsCash generated by operations decreased by 3.7% to £14.8 billion primarily driven by working capital movements and lower EBITDA.
Free cash flow decreased by 13.4% to £6.1 billion primarily due to increased cash capital expenditure, working capital movements and lower dividends from associates1, offset by lower payments for taxation.
Cash capital expenditure increased by £0.8 billion, driven by a reduction in working capital creditors and increased investment, particularly in Vodacom and Germany.
Payments for taxation decreased by 24.2% to £2.0 billion primarily due to accelerated tax depreciation in the United States and the timing of tax payments in Italy.
Dividends received from associates and investments1 decreased by £0.3 billion due to the loss of dividends resulting from the disposal of the Group’s interest in SFR and China Mobile Limited. Net interest payments were stable at £1.3 billion.
2012 2011£m £m %
EBITDA 14,475 14,670 (1.3)Working capital 206 566Other 143 156Cash generated by operations 14,824 15,392 (3.7)Cash capital expenditure2 (6,423) (5,658)Capital expenditure (6,365) (6,219)Working capital movement in respect of capital expenditure (58) 561
Disposal of property, plant and equipment 117 51Operating free cash flow 8,518 9,785 (12.9)Taxation (1,969) (2,597)Dividends received from associates and investments1 1,171 1,509Dividends paid to non-controlling shareholders in subsidiaries (304) (320)Interest received and paid (1,311) (1,328)Free cash flow 6,105 7,049 (13.4)Tax settlement3 (100) (800)Licence and spectrum payments (1,429) (2,982)Acquisitions and disposals4 4,872 (183)Equity dividends paid (6,643) (4,468)Purchase of treasury shares (3,583) (2,087)Foreign exchange 1,283 709Income dividend from Verizon Wireless 2,855 –Disposal of the Group’s 3.2% interest in China Mobile Limited – 4,269Disposal of the Group’s SoftBank Mobile Corp. Limited interests – 1,409Other5 2,073 542Net debt decrease 5,433 3,458Opening net debt (29,858) (33,316)Closing net debt (24,425) (29,858) (18.2)
Notes:1 Dividends received from associates and investments for the year ended 31 March 2012 includes
£965 million (2011: £1,024 million) tax distribution from our 45% interest in Verizon Wireless and a final dividend of £178 million (2011: £383 million) from SFR prior to the completion of the disposal of our 44% interest. It does not include the £2,855 million income dividend from Verizon Wireless received in January 2012.
2 Cash capital expenditure comprises the purchase of property, plant and equipment and intangible assets, other than licence and spectrum payments, during the year.
3 Related to a tax settlement in the year ended 31 March 2011.4 Acquisitions and disposals for the year ended 31 March 2012 primarily includes £6,805 million proceeds
from the sale of the Group’s 44% interest in SFR, £784 million proceeds from the sale of the Group’s 24.4% interest in Polkomtel and £2,592 million payment in relation to the purchase of non-controlling interests in Vodafone India Limited.
5 Other for the year ended 31 March 2012 primarily includes £2,301 million movement in the written put options in relation to India and the return of a court deposit made in respect of the India tax case (£310 million). Other for the year ended 31 March 2011 primarily includes £356 million in relation to a court deposit made in respect of the India tax case.
Example disclosure 2Reconciliation of net cash flows to net debt
Vodafone, March 2012 Annual Report
The table:
•Shows line items that are considered by investors to be relatively conventional.
•Orders line items and subtotals to flow down the page as a cash waterfall, ultimately explaining the change in net debt.
•Describes items in a manner that helps to provide context and linkage to where the item is disclosed elsewhere, for example in the income statement, cash flow statement, or in the notes.
Also lists items that are relatively unusual items for a business, or significant for the sector. Investors will have an interest in these (i.e. will look for them) and may want to reclassify them.
Uses notes to provide additional explanations of the components.
12
Project background Example disclosures Project methodologySummary Investor observations
Lab project report | Net debt reconciliations
(Example disclosure 2 – continued)
Disclosure of components of net debt
Vodafone, March 2012 Annual Report
Business reviewPerform
anceG
overnanceFinancials
Additional information
57Vodafone Group Plc Annual Report 2012
Shares purchased are held in treasury in accordance with sections 724 to 732 of the Companies Act 2006 and are cancelled in accordance with the Association of British Insurers guidelines. The movement in treasury shares during the year is shown below:
NumberMillion £m
1 April 2011 5,234 8,171Reissue of shares (166) (277)Purchase of shares 2,101 4,671Cancelled shares (3,000) (4,724)31 March 2012 4,169 7,841
Funding We have maintained a robust liquidity position throughout the year thereby enabling us to service shareholder returns, debt and expansion through capital investment. This position has been achieved through continued delivery of strong operating cash flows, cash receipts from investment disposals, issuances of short-term and long-term debt, and non-recourse borrowing assumed in respect of the emerging market businesses. It has not been necessary for us to draw down on our syndicated committed bank facilities during the year.
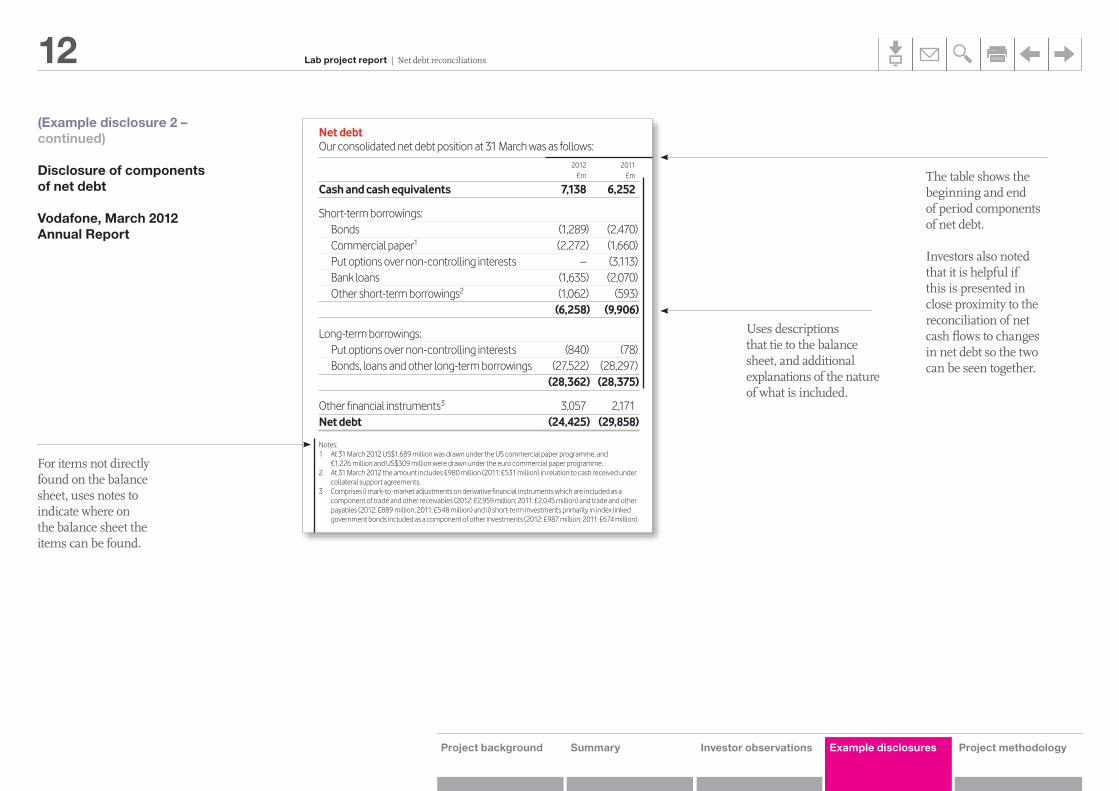
Net debtOur consolidated net debt position at 31 March was as follows:
2012 2011£m £m
Cash and cash equivalents 7,138 6,252
Short-term borrowings: Bonds (1,289) (2,470) Commercial paper1 (2,272) (1,660) Put options over non-controlling interests – (3,113) Bank loans (1,635) (2,070) Other short-term borrowings2 (1,062) (593)
(6,258) (9,906)
Long-term borrowings: Put options over non-controlling interests (840) (78) Bonds, loans and other long-term borrowings (27,522) (28,297)
(28,362) (28,375)
Other financial instruments3 3,057 2,171Net debt (24,425) (29,858)
Notes:1 At 31 March 2012 US$1,689 million was drawn under the US commercial paper programme, and
€1,226 million and US$309 million were drawn under the euro commercial paper programme.2 At 31 March 2012 the amount includes £980 million (2011: £531 million) in relation to cash received under
collateral support agreements. 3 Comprises i) mark-to-market adjustments on derivative financial instruments which are included as a
component of trade and other receivables (2012: £2,959 million; 2011: £2,045 million) and trade and other payables (2012: £889 million; 2011: £548 million) and ii) short-term investments primarily in index linked government bonds included as a component of other investments (2012: £987 million; 2011: £674 million).
At 31 March 2012 we had £7,138 million of cash and cash equivalents which are held in accordance with our treasury policy.
We hold cash and liquid investments in accordance with the counterparty and settlement risk limits of the Board approved treasury policy. The main forms of liquid investment at 31 March 2012 were money market funds, UK index linked government bonds and bank deposits.
Net debt decreased by £5.4 billion to £24.4 billion primarily due to cash generated by operations, the proceeds from the sale of the Group’s 44% interest in SFR and 24.4% interest in Polkomtel, and the £2.9 billion income dividend from Verizon Wireless, partially offset by share buybacks and dividend payments to equity holders.
Net debt represented 28.6% of our market capitalisation at 31 March 2012 compared to 32.8% at 31 March 2011. Average net debt at month end accounting dates over the 12 month period ended 31 March 2012 was £25.6 billion and ranged between £22.3 billion and £29.6 billion during the year.
The cash received from collateral support agreements mainly reflects the value of our interest rate swap portfolio which is substantially net present value positive. See note 21 to the consolidated financial statements for further details on these agreements.
Commercial paper programmesWe currently have US and euro commercial paper programmes of US$15 billion and £5 billion respectively which are available to be used to meet short-term liquidity requirements. At 31 March 2012 amounts external to the Group of €1,226 million (£1,022 million) and US$309 million (£193 million) were drawn under the euro commercial paper programme and US$1,689 million (£1,056 million) was drawn down under the US commercial paper programme, with such funds being provided by counterparties external to the Group. At 31 March 2011 €1,490 million (£1,317 million) was drawn under the euro commercial paper programme and US$551 million (£343 million) was drawn under the US commercial paper programme. The commercial paper facilities were supported by US$4.2 billion (£2.7 billion) and €4.2 billion (£3.5 billion) of syndicated committed bank facilities (see “Committed facilities”). No amounts had been drawn under either bank facility.
BondsWe have a €30 billion euro medium-term note programme and a US shelf programme which are used to meet medium- to long-term funding requirements. At 31 March 2012 the total amounts in issue under these programmes split by currency were US$13.3 billion, £2.5 billion, €8.9 billion and £0.2 billion sterling equivalent of other currencies.
In the year ended 31 March 2012 bonds with a nominal value equivalent of £0.7 billion at the relevant 31 March 2012 foreign exchange rates were issued under the US shelf and the euro medium-term note programme. The bonds issued during the year were:
Date of bond issue Maturity of bond
Nominalamount
Million
Sterlingequivalent
Million
22 August 2011 22 August 2012 US$100 6520 March 2012 20 March 2017 US$1,000 625
On 11 July 2011 we also raised US$850 million (£543 million) through a US private placement with a maturity of 11 July 2016.
At 31 March 2012 we had bonds outstanding with a nominal value of £18,333 million (2011: £20,987 million).
The table shows the beginning and end of period components of net debt.
Investors also noted that it is helpful if this is presented in close proximity to the reconciliation of net cash flows to changes in net debt so the two can be seen together.
Uses descriptions that tie to the balance sheet, and additional explanations of the nature of what is included.
For items not directly found on the balance sheet, uses notes to indicate where on the balance sheet the items can be found.
13
Project background Example disclosures Project methodologySummary Investor observations
Lab project report | Net debt reconciliations
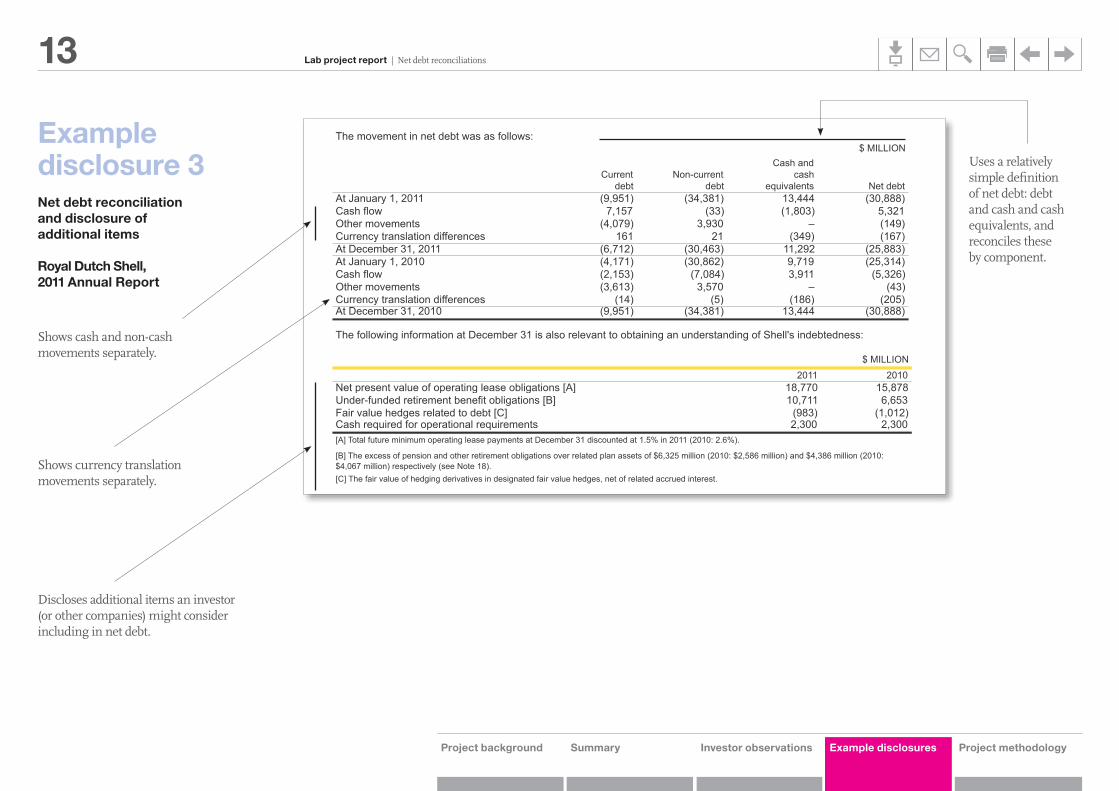
The movement in net debt was as follows:$ MILLION
Currentdebt
Non-currentdebt
Cash andcash
equivalents Net debtAt January 1, 2011 (9,951) (34,381) 13,444 (30,888)Cash flow 7,157 (33) (1,803) 5,321Other movements (4,079) 3,930 – (149)Currency translation differences 161 21 (349) (167)At December 31, 2011 (6,712) (30,463) 11,292 (25,883)At January 1, 2010 (4,171) (30,862) 9,719 (25,314)Cash flow (2,153) (7,084) 3,911 (5,326)Other movements (3,613) 3,570 – (43)Currency translation differences (14) (5) (186) (205)At December 31, 2010 (9,951) (34,381) 13,444 (30,888)
The following information at December 31 is also relevant to obtaining an understanding of Shell's indebtedness:
$ MILLION2011 2010
Net present value of operating lease obligations [A] 18,770 15,878Under-funded retirement benefit obligations [B] 10,711 6,653Fair value hedges related to debt [C] (983) (1,012)Cash required for operational requirements 2,300 2,300
[C] The fair value of hedging derivatives in designated fair value hedges, net of related accrued interest.
[A] Total future minimum operating lease payments at December 31 discounted at 1.5% in 2011 (2010: 2.6%).
[B] The excess of pension and other retirement obligations over related plan assets of $6,325 million (2010: $2,586 million) and $4,386 million (2010: $4,067 million) respectively (see Note 18).
Shows cash and non-cash movements separately.
Shows currency translation movements separately.
Uses a relatively simple definition of net debt: debt and cash and cash equivalents, and reconciles these by component.
Discloses additional items an investor (or other companies) might consider including in net debt.
Example disclosure 3Net debt reconciliation and disclosure of additional items
Royal Dutch Shell, 2011 Annual Report
14
Project background Example disclosures Project methodologySummary Investor observations
Lab project report | Net debt reconciliations
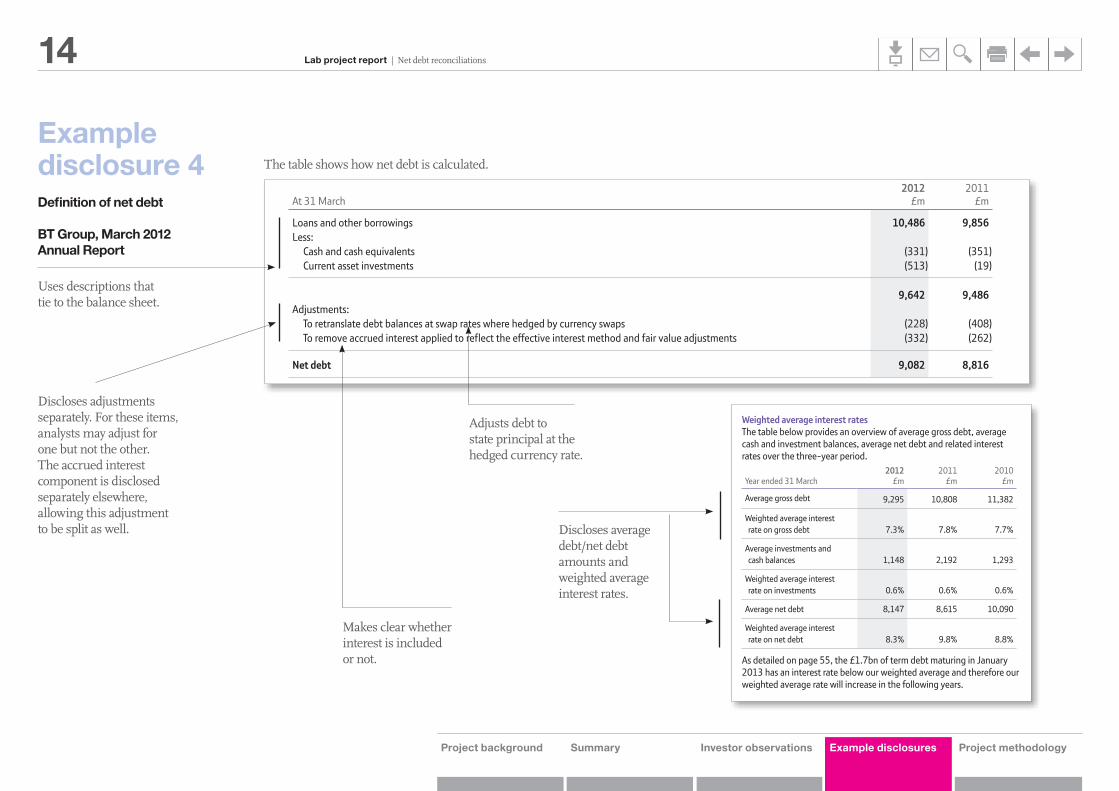
Example disclosure 4Definition of net debt
BT Group, March 2012 Annual Report
148 Financial statementsNotes to the consolidated financial statements
26. Financial instruments and risk management continuedCapital management policyThe objective of the group’s capital management policy is to reduce net debt over time whilst investing in the business, supporting the pensionscheme and paying progressive dividends. In order to meet this objective, the group may issue or repay debt, issue new shares, repurchaseshares, or adjust the amount of dividends paid to shareholders. The group manages the capital structure and makes adjustments to it in the lightof changes in economic conditions and the risk characteristics of the group. The Board regularly reviews the capital structure. No changes weremade to these objectives and processes during 2012 and 2011.
The group’s capital structure consists of net debt and shareholders’ equity. The following analysis summarises the components which the groupmanages as capital:
2012 2011At 31 March £m £m
Net debt 9,082 8,816Total parent shareholders’ equitya 1,297 1,925
10,379 10,741
a See page 100.
Net debtNet debt consists of loans and other borrowings (both current and non-current), less current asset investments and cash and cash equivalents.Loans and other borrowings are measured at the net proceeds raised, adjusted to amortise any discount over the term of the debt. For the purposeof this measure, current asset investments and cash and cash equivalents are measured at the lower of cost and net realisable value. Currencydenominated balances within net debt are translated to Sterling at swapped rates where hedged. Net debt is considered to be an alternativeperformance measure as it is not defined in IFRS. The most directly comparable IFRS measure is the aggregate of loans and other borrowings(current and non-current), current asset investments and cash and cash equivalents. A reconciliation from this measure, the most directlycomparable IFRS measure, to net debt is given below.
2012 2011At 31 March £m £m
Loans and other borrowings 10,486 9,856Less:
Cash and cash equivalents (331) (351)Current asset investments (513) (19)
9,642 9,486Adjustments:
To retranslate debt balances at swap rates where hedged by currency swaps (228) (408)To remove accrued interest applied to reflect the effective interest method and fair value adjustments (332) (262)
Net debt 9,082 8,816
Liquidity risk managementManagement policyThe group ensures its liquidity is maintained by entering into short, medium and long-term financial instruments to support operational and otherfunding requirements. The group determines its liquidity requirements by the use of both short and long-term cash forecasts. These forecasts aresupplemented by a financial headroom analysis which is used to assess funding adequacy for at least a 12-month period. On at least an annualbasis the Board reviews and approves the maximum long-term funding of the group and on an ongoing basis considers any related matters. Shortand medium-term requirements are regularly reviewed and managed by the treasury operation within the parameters of the policies set by theBoard.
Refinancing risk is managed by limiting the amount of borrowing that matures within any specified period and having appropriate strategies inplace to manage refinancing needs as they arise. The maturity profile of the group’s term debt at 31 March 2012 is disclosed in note 24. The grouphas term debt maturities of £1.7bn in 2013.
During 2012 and 2011 the group issued commercial paper and held cash, cash equivalents and current investments in order to manage short-term liquidity requirements. At 31 March 2012 the group has undrawn committed borrowing facilities of £1.5bn (2011: £1.5bn) maturing inMarch 2016.
52 Performance
Payments to telecommunications operators (POLOs) were down 16% (2011: 8%), reflecting lower mobile termination rates and reduced transit and wholesale call volumes. Property and energy costs were down 7% (2011: 11%). Network operating and IT costs were down 11% (2011: 10%) as we rationalise our networks and systems. Other operating costs decreased by 3% (2011: 4%).
Net labour costs
POLOs
Property & energy
Network operating & IT
Other
5%
29%
8%
35%
23%
2012 Cost basea
a Excluding depreciation, amortisation and specific items.
A detailed breakdown of our operating costs is provided in note 6 to the consolidated financial statements.
EBITDAAdjusted EBITDA increased by 3% to £6.1bn in 2012 which means we have achieved our 2013 target of above £6.0bn a year early.
The 3% and 4% increase in 2012 and 2011, respectively, reflect the benefits from our cost transformation activities. An analysis of EBITDA by line of business is provided in note 4 to the consolidated financial statements.
Depreciation and amortisation Depreciation and amortisation was flat at £2,972m (2011: 2% decrease) reflecting the lower levels of capital expenditure over the last three years offset by higher depreciation and amortisation on shorter lived assets.
Net finance expenseNet finance expense reduced by £164m in 2012 as we repaid higher coupon debt in the second half of 2011.
Year ended 31 March2012
£m2011
£m2010
£m
Interest on borrowings 672 852 886
Capitalised interest (9) (6) (3)
Fair value movements on derivatives 29 34 19
Total finance expense 692 880 902
Total finance income (11) (35) (12)
Net finance expense 681 845 890
In 2012 interest on borrowings decreased by 21% (2011: 4%) reflecting the reduction in the average net debt balance and the repayment of higher coupon debt in the second half of 2011. Fair value movements on derivatives included £16m (2011: £28m, 2010: £9m) of swap restructuring costs on certain derivatives and £13m (2011: £6m, 2010: £10m) of fair value movements on derivatives not in a designated hedge relationship. In 2012 finance income decreased by £24m (2011: £23m increase) mainly due to lower average cash and investment balances. In 2011 finance income included £19m of interest in respect of a tax refund.
Net pension interest is classified as a specific item and discussed in note 20 to the consolidated financial statements.
Weighted average interest ratesThe table below provides an overview of average gross debt, average cash and investment balances, average net debt and related interest rates over the three-year period.
Year ended 31 March2012
£m2011
£m2010
£m
Average gross debt 9,295 10,808 11,382
Weighted average interest rate on gross debt 7.3% 7.8% 7.7%
Average investments and cash balances 1,148 2,192 1,293
Weighted average interest rate on investments 0.6% 0.6% 0.6%
Average net debt 8,147 8,615 10,090
Weighted average interest rate on net debt 8.3% 9.8% 8.8%
As detailed on page 55, the £1.7bn of term debt maturing in January 2013 has an interest rate below our weighted average and therefore our weighted average rate will increase in the following years.
Group financial performance
Book FRONT.indb 52 23/08/2012 18:01
Discloses average debt/net debt amounts and weighted average interest rates.
Adjusts debt to state principal at the hedged currency rate.
Makes clear whether interest is included or not.
Uses descriptions that tie to the balance sheet.
The table shows how net debt is calculated.
Discloses adjustments separately. For these items, analysts may adjust for one but not the other. The accrued interest component is disclosed separately elsewhere, allowing this adjustment to be split as well.
15
Project background Project methodologySummary Investor observations Example disclosures
Lab project report | Net debt reconciliations
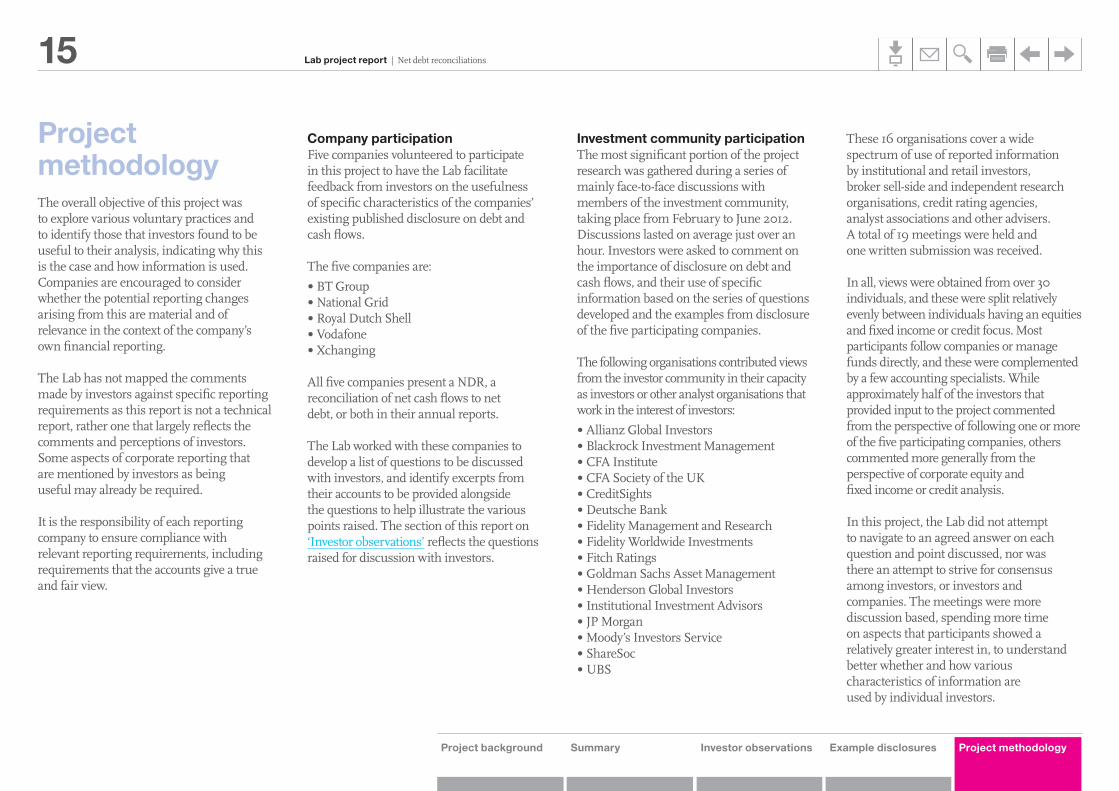
Project methodology The overall objective of this project was to explore various voluntary practices and to identify those that investors found to be useful to their analysis, indicating why this is the case and how information is used. Companies are encouraged to consider whether the potential reporting changes arising from this are material and of relevance in the context of the company’s own financial reporting.
The Lab has not mapped the comments made by investors against specific reporting requirements as this report is not a technical report, rather one that largely reflects the comments and perceptions of investors. Some aspects of corporate reporting that are mentioned by investors as being useful may already be required.
It is the responsibility of each reporting company to ensure compliance with relevant reporting requirements, including requirements that the accounts give a true and fair view.
Company participation Five companies volunteered to participate in this project to have the Lab facilitate feedback from investors on the usefulness of specific characteristics of the companies’ existing published disclosure on debt and cash flows. The five companies are:
•BT Group •National Grid •Royal Dutch Shell•Vodafone •Xchanging
All five companies present a NDR, a reconciliation of net cash flows to net debt, or both in their annual reports.
The Lab worked with these companies to develop a list of questions to be discussed with investors, and identify excerpts from their accounts to be provided alongside the questions to help illustrate the various points raised. The section of this report on ‘Investor observations’ reflects the questions raised for discussion with investors.
Investment community participation The most significant portion of the project research was gathered during a series of mainly face-to-face discussions with members of the investment community, taking place from February to June 2012. Discussions lasted on average just over an hour. Investors were asked to comment on the importance of disclosure on debt and cash flows, and their use of specific information based on the series of questions developed and the examples from disclosure of the five participating companies.
The following organisations contributed views from the investor community in their capacity as investors or other analyst organisations that work in the interest of investors:
•Allianz Global Investors•Blackrock Investment Management•CFA Institute•CFA Society of the UK•CreditSights•Deutsche Bank•Fidelity Management and Research•Fidelity Worldwide Investments•Fitch Ratings•Goldman Sachs Asset Management•Henderson Global Investors•Institutional Investment Advisors•JP Morgan•Moody’s Investors Service•ShareSoc•UBS
These 16 organisations cover a wide spectrum of use of reported information by institutional and retail investors, broker sell-side and independent research organisations, credit rating agencies, analyst associations and other advisers. A total of 19 meetings were held and one written submission was received.
In all, views were obtained from over 30 individuals, and these were split relatively evenly between individuals having an equities and fixed income or credit focus. Most participants follow companies or manage funds directly, and these were complemented by a few accounting specialists. While approximately half of the investors that provided input to the project commented from the perspective of following one or more of the five participating companies, others commented more generally from the perspective of corporate equity and fixed income or credit analysis.
In this project, the Lab did not attempt to navigate to an agreed answer on each question and point discussed, nor was there an attempt to strive for consensus among investors, or investors and companies. The meetings were more discussion based, spending more time on aspects that participants showed a relatively greater interest in, to understand better whether and how various characteristics of information are used by individual investors.
16
Project background Project methodologySummary Investor observations Example disclosures
Lab project report | Net debt reconciliations
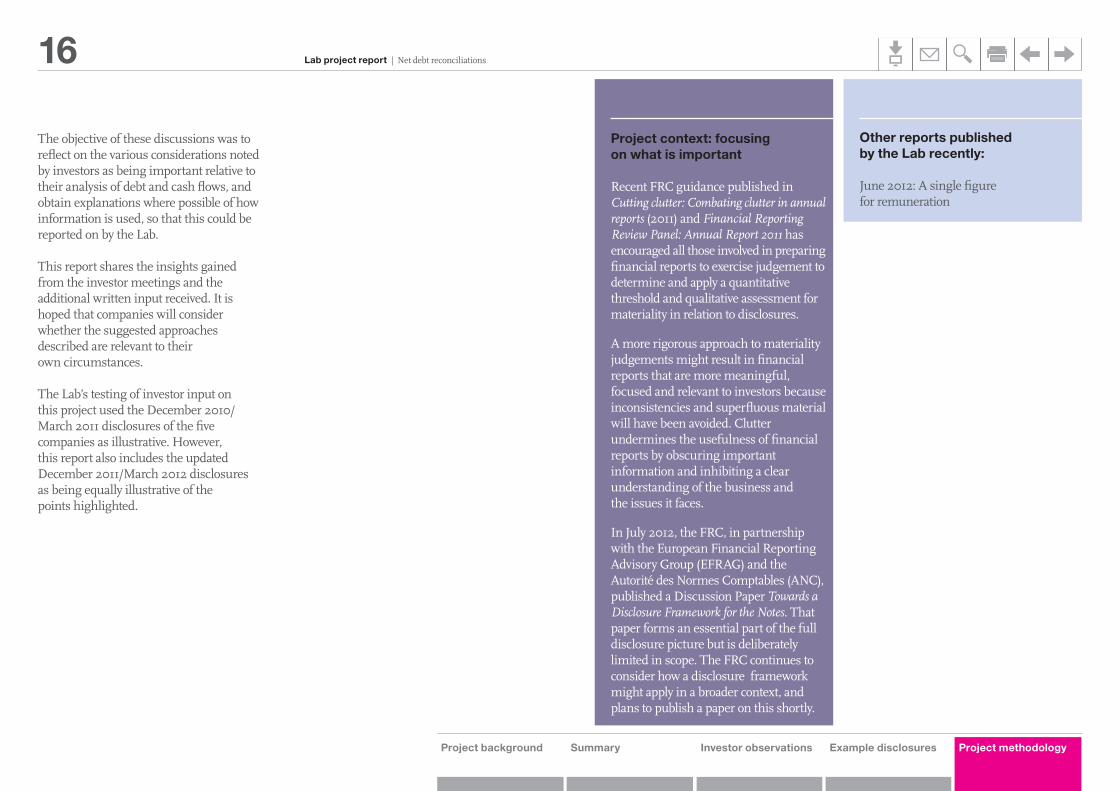
The objective of these discussions was to reflect on the various considerations noted by investors as being important relative to their analysis of debt and cash flows, and obtain explanations where possible of how information is used, so that this could be reported on by the Lab.
This report shares the insights gained from the investor meetings and the additional written input received. It is hoped that companies will consider whether the suggested approaches described are relevant to their own circumstances.
The Lab’s testing of investor input on this project used the December 2010/March 2011 disclosures of the five companies as illustrative. However, this report also includes the updated December 2011/March 2012 disclosures as being equally illustrative of the points highlighted.
Other reports published by the Lab recently:
June 2012: A single figure for remuneration
Project context: focusing on what is important
Recent FRC guidance published in Cutting clutter: Combating clutter in annual reports (2011) and Financial Reporting Review Panel: Annual Report 2011 has encouraged all those involved in preparing financial reports to exercise judgement to determine and apply a quantitative threshold and qualitative assessment for materiality in relation to disclosures.
A more rigorous approach to materiality judgements might result in financial reports that are more meaningful, focused and relevant to investors because inconsistencies and superfluous material will have been avoided. Clutter undermines the usefulness of financial reports by obscuring important information and inhibiting a clear understanding of the business and the issues it faces.
In July 2012, the FRC, in partnership with the European Financial Reporting Advisory Group (EFRAG) and the Autorité des Normes Comptables (ANC), published a Discussion Paper Towards a Disclosure Framework for the Notes. That paper forms an essential part of the full disclosure picture but is deliberately limited in scope. The FRC continues to consider how a disclosure framework might apply in a broader context, and plans to publish a paper on this shortly.
17
How to use this interactive PDF
Use the buttons top right to:
DownloadYou can download the document by clicking on this icon
Links within this documentThroughout this report there are links to pages, which are underlined in blue. Also, use the tabs below to quickly go to the start of a new section.
EmailYou can email a friend or colleague this document
SearchAllows you to search for keywords within this document
PrintWill open up a print dialogue box for you to select your output options
Go backThis button will take you back to the previous page
Go forwardThis button will take you forward to the next page
Project background Summary Investor observations Example disclosures Project methodology
Lab project report | Net debt reconciliations

Financial Reporting Council5th Floor, Aldwych House7ı-9ı AldwychLondon WC2B 4HN
www.frc.org.ukDesigned by Addisonwww.addison.co.uk