Embed Size (px)
Citation preview
Copyright © 2010 Key Research. Confidential and proprietary.
Nelson City Council - Residents Survey -Council Activities and Environment
2010
Damien Cullinan, Sara Laugesenn968574
Copyright © 2010 Key Research. Confidential and proprietary.
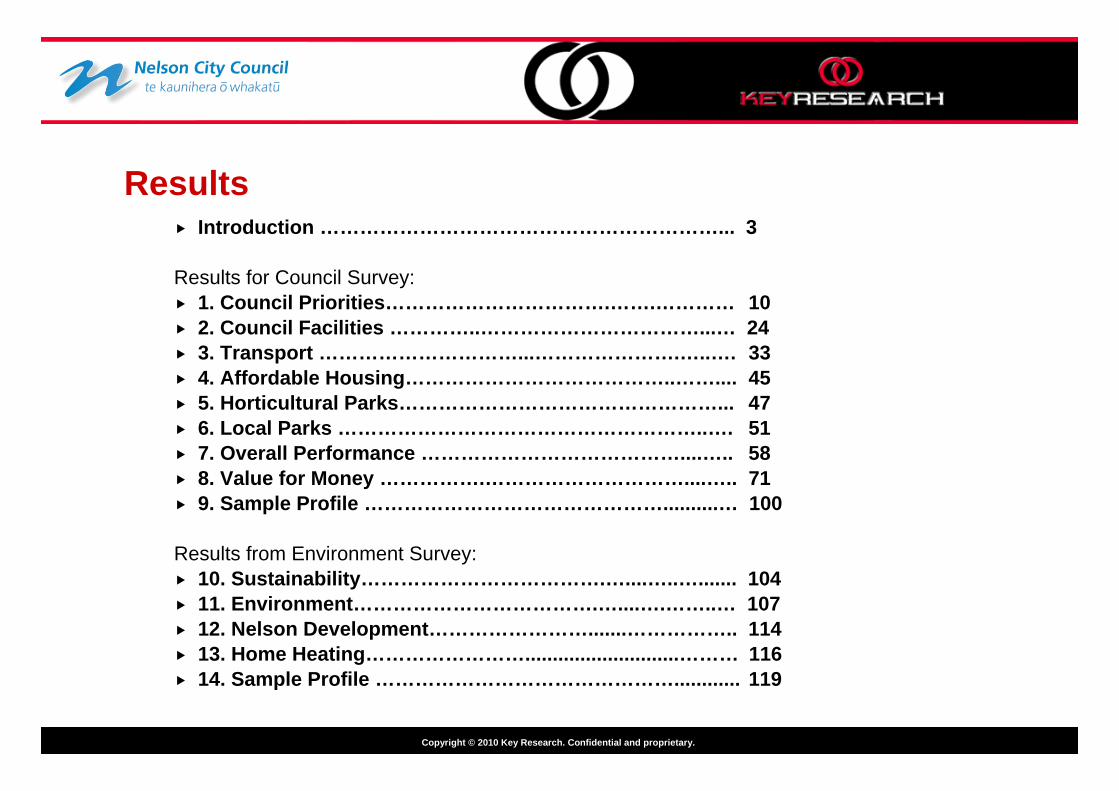
Introduction ……………………………………………………... 3
Results for Council Survey: 1. Council Priorities…………………………….…….………… 10 2. Council Facilities …………..……………………………...… 24 3. Transport …………………………...………………….…..…. 33 4. Affordable Housing…………………………………..…….... 45 5. Horticultural Parks…………………………………………... 47 6. Local Parks ………………………………………………..…. 51 7. Overall Performance …………………………………....….. 58 8. Value for Money …………….…………………………....….. 71 9. Sample Profile ………………………………………..........… 100
Results from Environment Survey: 10. Sustainability……………………………….…....…..…....... 104 11. Environment……………………………….…....….……..… 107 12. Nelson Development…………………….......…………….. 114 13. Home Heating……………………............................……… 116 14. Sample Profile ………………………………………............ 119
Results
Copyright © 2010 Key Research. Confidential and proprietary.
Introduction and ObjectivesEvery year Nelson City Council commissions a resident survey to seek feedback on Council’s services and facilities and other information to assist planning, management and accountability. This year, a comprehensive survey was undertaken to establish relative priorities among the significant activity areas for Council and measure the level of satisfaction with Council performance in each of these areas. A second survey was also conducted in unison with the Council survey to establish perceptions about the environment and sustainability of Nelson City.
This information helps in the preparation of the annual plan and asset management plans and provides feedback for the annual reporting process.
The information from the study will be used by NCC for future planning across a number of service areas.
Objectives:The primary objectives for this survey were to:
– Identify the level of satisfaction in each of the 14 Council areas;– Determine the level of importance for prioritisation in each of the 14 Council areas;– Identify the usage of parks for active vs. inactive recreational activities;– Determine the levels of satisfaction with roads and transport services in the Nelson area.– Determine the sustainability levels of Nelson City residents such as recycling, composting and gardening;– Determine agreement levels over 7 environmental statements;– Determine residents’ views regarding the way the Council manages the development of subdivisions for new houses in
the city; – And determine residents’ heating solutions in their home
Page 3
Copyright © 2010 Key Research. Confidential and proprietary.
Methodology
Each study consisted of 400 telephone interviews with residents in the Nelson City Council area. Respondents completing either of the surveys were given the option to complete the other survey at
another time. 172 respondents agreed to and completed both the environment and council surveys. Quotas were enforced according to age and gender, to ensure a proportionally representative sample
of Nelson City’s population was obtained. The data was re-weighted to account for slight variances in the achieved quotas.
Interviewing took place between Friday June 25th and Sunday July 11th 2010; The overall results for the individual surveys have a margin of error of +/-4.90% at the 95%
confidence level.
Page 4
Copyright © 2010 Key Research. Confidential and proprietary.
Summary (I) Page 5
Council Priorities:Water supply is perceived as the most important area for Council to focus on. Satisfaction is high with regard to water supply with
respondents rating this second highest after parks and open spaces.Water supply, emergency management and community facilities are the three priority areas for Council to focus on in terms of
importance. Transport rates low with regards to satisfaction and should also be a priority area for Council.Social development, culture, heritage and arts and economic tourism support are perceived to have a low importance. Water supply,
waste water and emergency management are the three main areas of importance. Importance has decreased for all Council activity areas from previous years. Water supply is still considered most important.Culture, heritage and arts, economic tourism support and social development remain the three least important Council activities.Satisfaction is highest for parks and open spaces, water supply and recreation and leisure. A significant proportion of respondents
stated dissatisfaction with transport.There has been a significant increase in respondents stating they are most dissatisfied with Transport. Water supply and environmental
management have both decreased in dissatisfaction.Dissatisfaction with the public transport (bus) network in Nelson is the main reason for dissatisfaction with transport in Nelson.Difficulties with obtaining consents is the main reason for dissatisfaction with regulatory compliance. Poor quality and cost is the most
stated reason for dissatisfaction with the water supply.Respondents stated dissatisfaction with social development due to a lack of support from Council. Issues over the performing arts
centre is the main reasons for respondents’ dissatisfaction with culture, heritage and arts.Lack of promotion was stated as the reason for dissatisfaction with economic tourism support. Respondents stated dissatisfaction with
storm water and flood protection due to previous experience with flooding. Respondents identified a variety of reasons for their dissatisfaction with environmental management, solid waste management, parks
and open spaces, emergency management and wastewater.
Copyright © 2010 Key Research. Confidential and proprietary.
Summary (II) Page 6
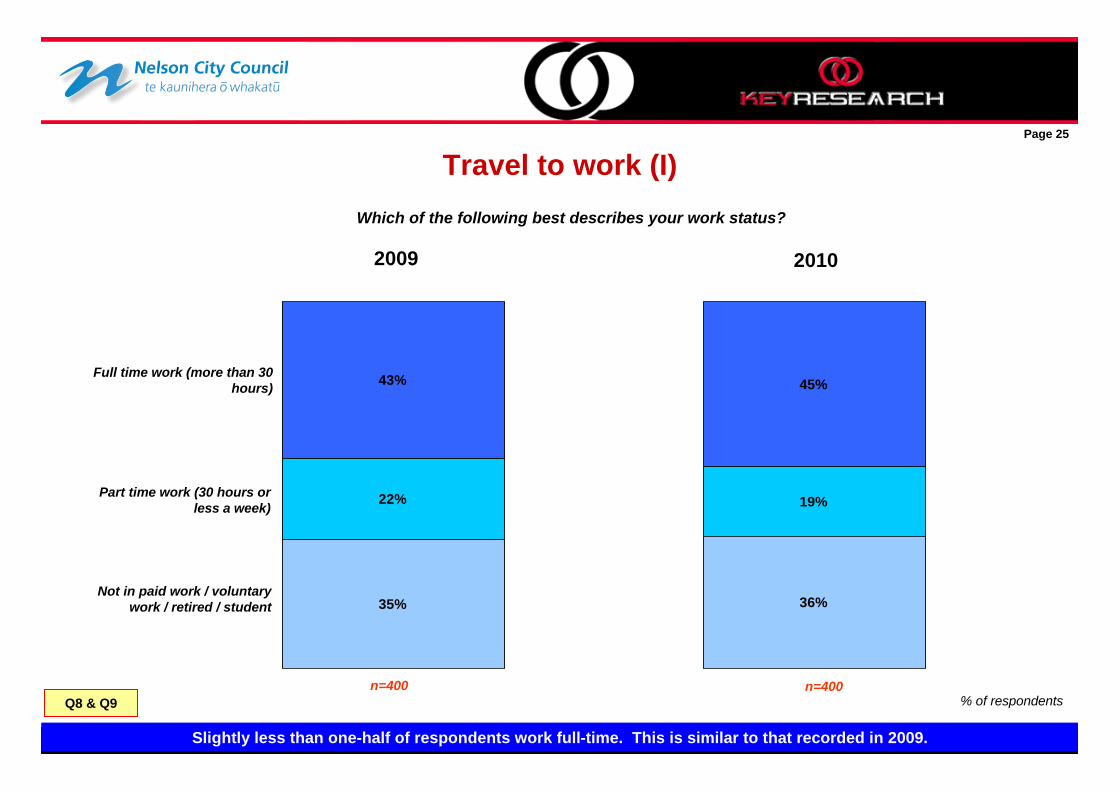
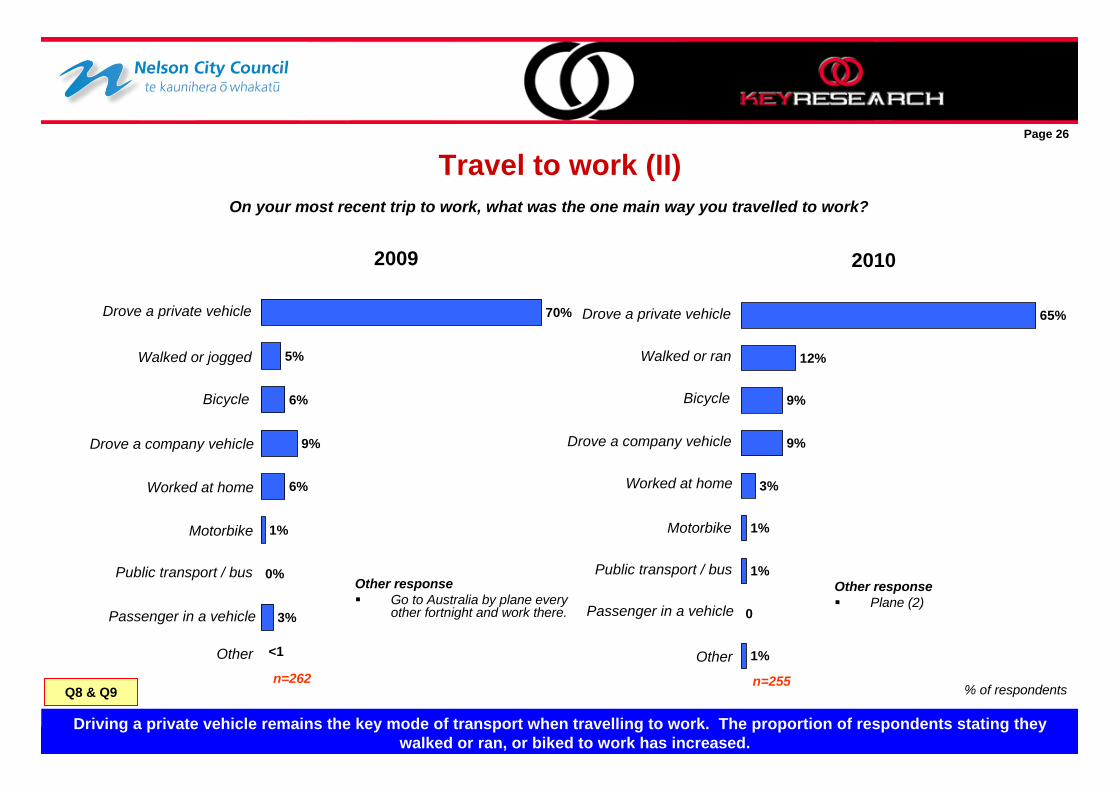
Transport : Slightly less than one-half of respondents work full-time. This is similar to that recorded in 2009. Driving a private vehicle remains the key mode of transport when travelling to work. The proportion of respondents stating they walked
or ran, or biked to work has increased. Similar to how respondents personally travel to work, driving a private motor vehicle is also the most common mode of transport used
by other members in the household. Satisfaction is highest with regards to off road cycle ways and walkways linking roads or suburbs. Large proportions of respondents
identified dissatisfaction with public transport and moderate proportions stated dissatisfaction with roads / streets and footpaths. With the exception of street lighting and off road cycle ways, satisfaction has decreased with all aspects of the transport network.
Public transport, roads / streets and footpaths have recorded moderate increases in dissatisfaction from 2009. The proportion of respondents stating it is harder to park in the central city has decreased since 2006 and 2009 while the proportion of
respondents stating it is easier to park continues to increase. Slightly more than two in every five respondents cycle in Nelson. Slightly less than two-thirds of these respondents stated they are
satisfied with the experience of cycling on roads or cycle ways in Nelson. This represents a slight decrease from the 2009 results. Respondents dissatisfied with the cycling experience in Nelson stated this was because of narrow roads and safety issues with
motorists also using the road. Satisfaction with the safety for motorists, pedestrians and cyclists in Nelson have all decreased from the 2009 results.
Council Facilities: The majority of respondents are satisfied with the public library service and swimming pools. Satisfaction is low for the number of
public toilets and quality of public toilets in Nelson. Slightly more than four out of every five respondents stated they were either very satisfied or satisfied with the public library service.
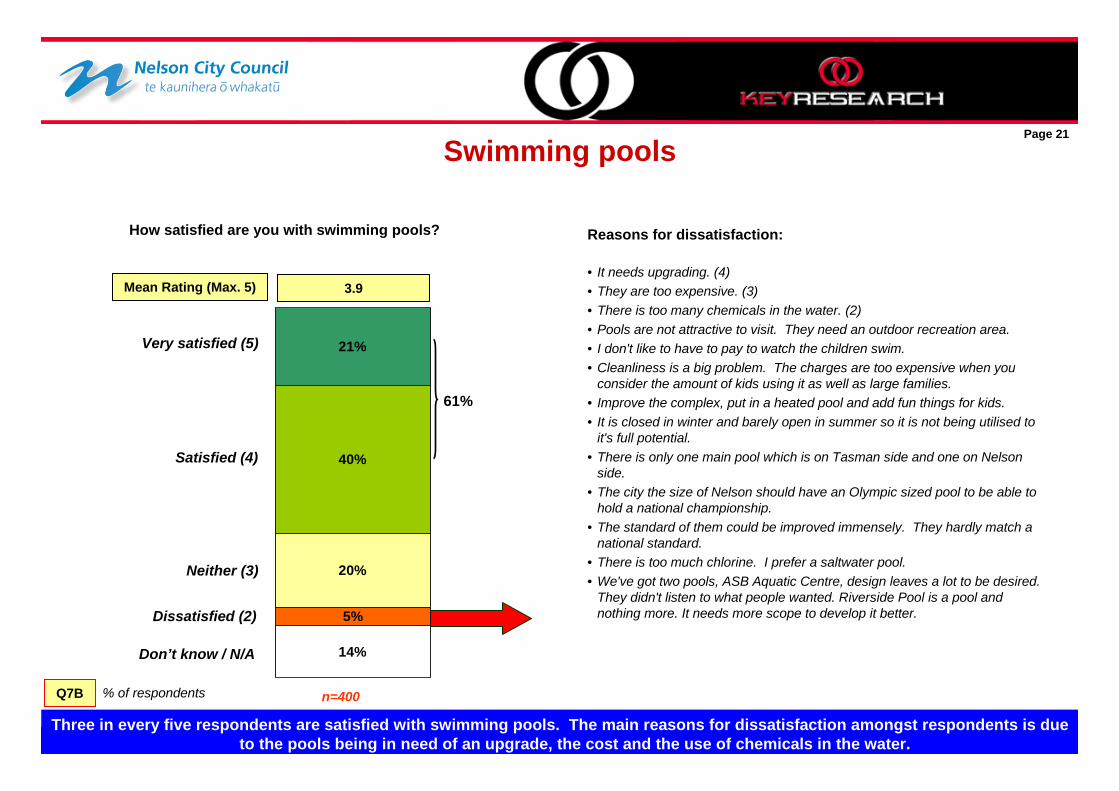
Being unable to use the free computers in the library because of tourists was the main reason stated for dissatisfaction. Three in every five respondents are satisfied with swimming pools. The main reasons for dissatisfaction amongst respondents is due
to the pools being in need of an upgrade, the cost and the use of chemicals in the water. Slightly more than one-quarter of respondents are satisfied with the quality of public toilets. One-third of respondents stated they were
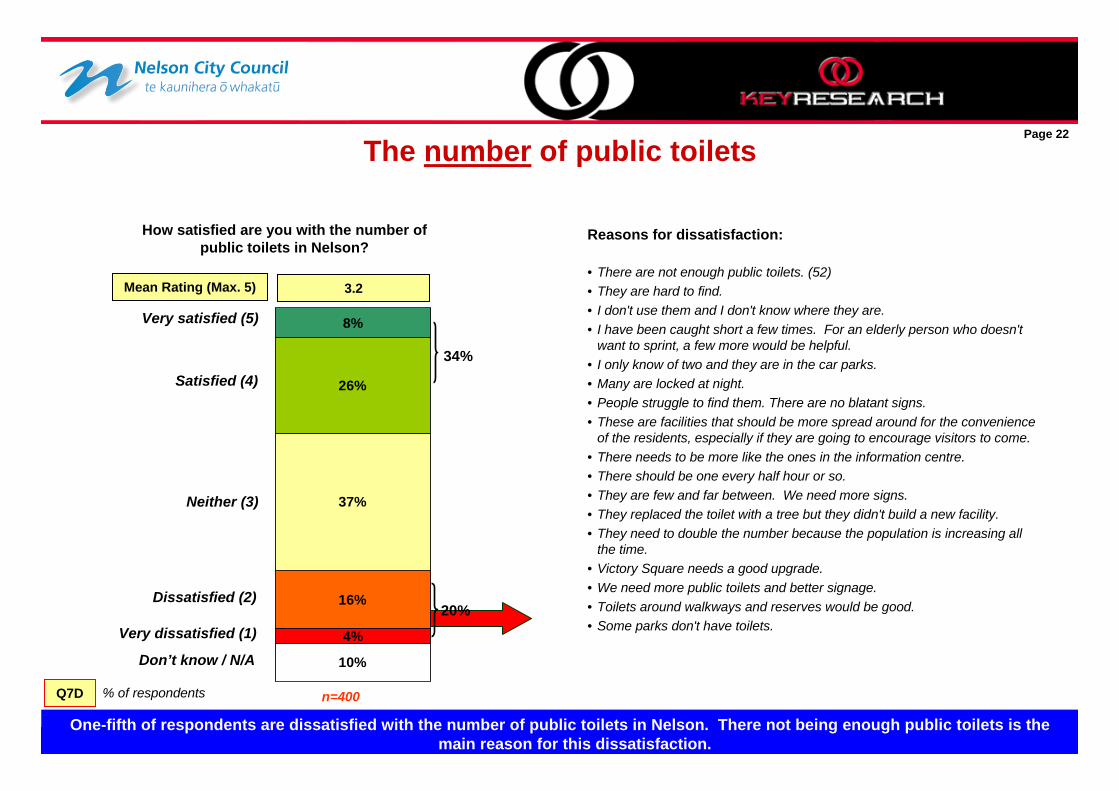
dissatisfied, this is mainly because they are unclean and dirty (lack of maintenance). One-fifth of respondents are dissatisfied with the number of public toilets in Nelson. There not being enough public toilets is the main
reason for this dissatisfaction.
Copyright © 2010 Key Research. Confidential and proprietary.
Summary (III) Page 7
Local Parks: Four out of every five respondents visit their local park. For the majority of respondents, this park is less than 10 minutes walk away from
their home. Respondents regularly visit their local park. Slightly less than one-half of respondents who visit their local park do this on a weekly basis or
more often. Walking, to enjoy nature, to use the playgrounds and for botanical interest are the main activities respondents visit their local park for.
Respondents who don’t visit their local park stated this is because they are generally not interested in parks or they visit a different one. Respondents stated that more organised events would encourage them to visit their local park. Slightly less than one-half of respondents who don’t visit their local park stated there was another park they visit. Walking and to enjoy
nature are the main activities these respondents visit these parks for. Almost all respondents stated it would matter to them if both horticultural parks and local parks weren’t there. The majority of respondents
stated they would be prepared to walk anywhere between 6 – 30 minutes from their home to visit a park.
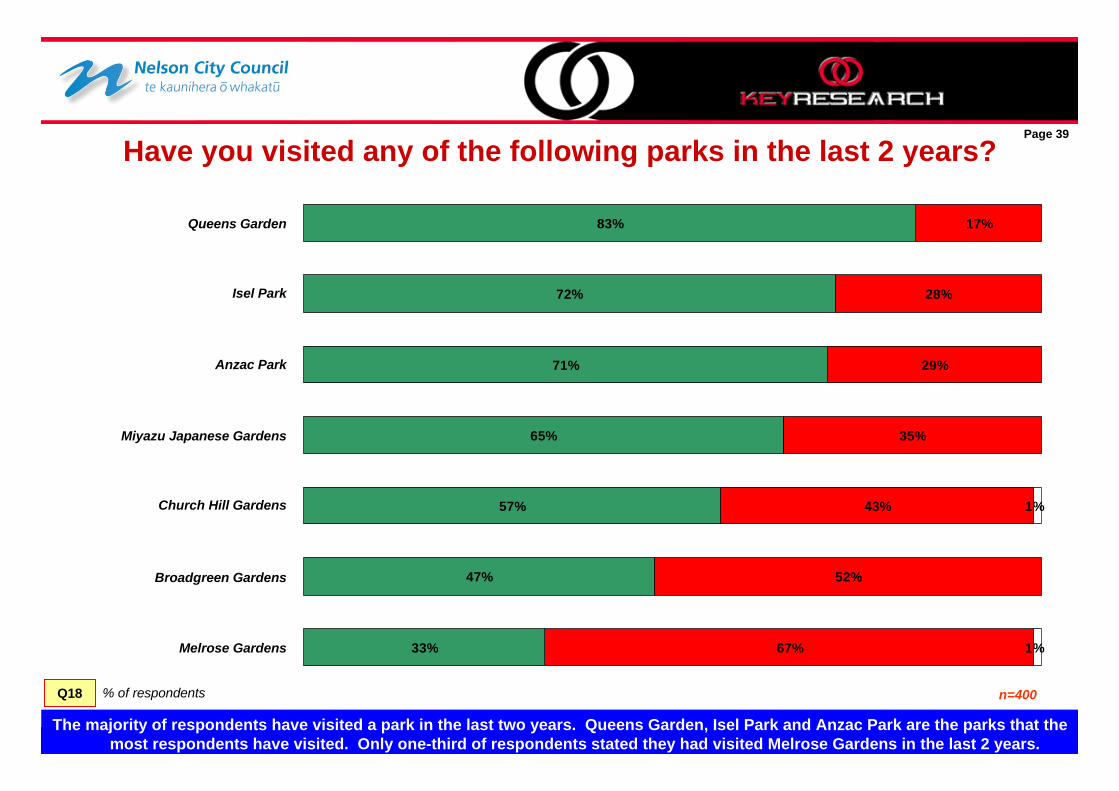
Horticultural Parks : The majority of respondents have visited a park in the last two years. Queens Garden, Isel Park and Anzac Park are the parks that the
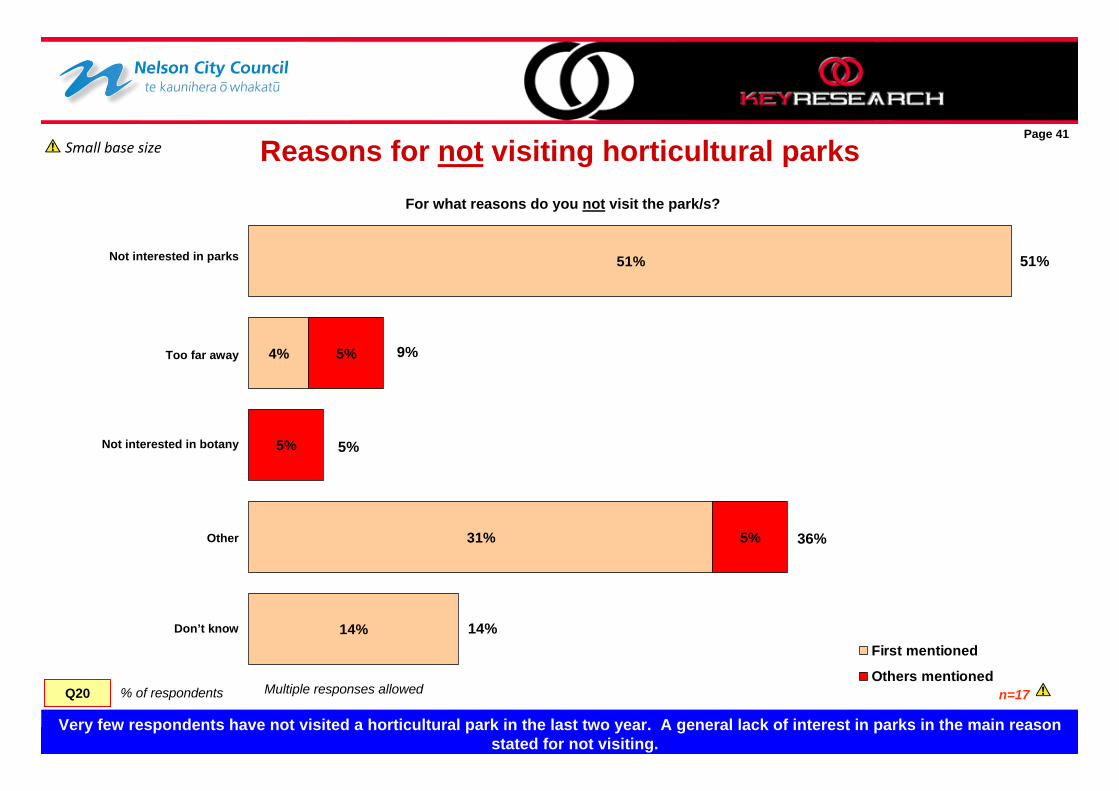
most respondents have visited. Only one-third of respondents stated they had visited Melrose Gardens in the last 2 years. Exercise, for family activities and for sitting / quiet enjoyment are the three most common reasons respondents visit horticultural parks. Very few respondents have not visited a horticultural park in the last two year. A general lack of interest in parks in the main reason stated
for not visiting.
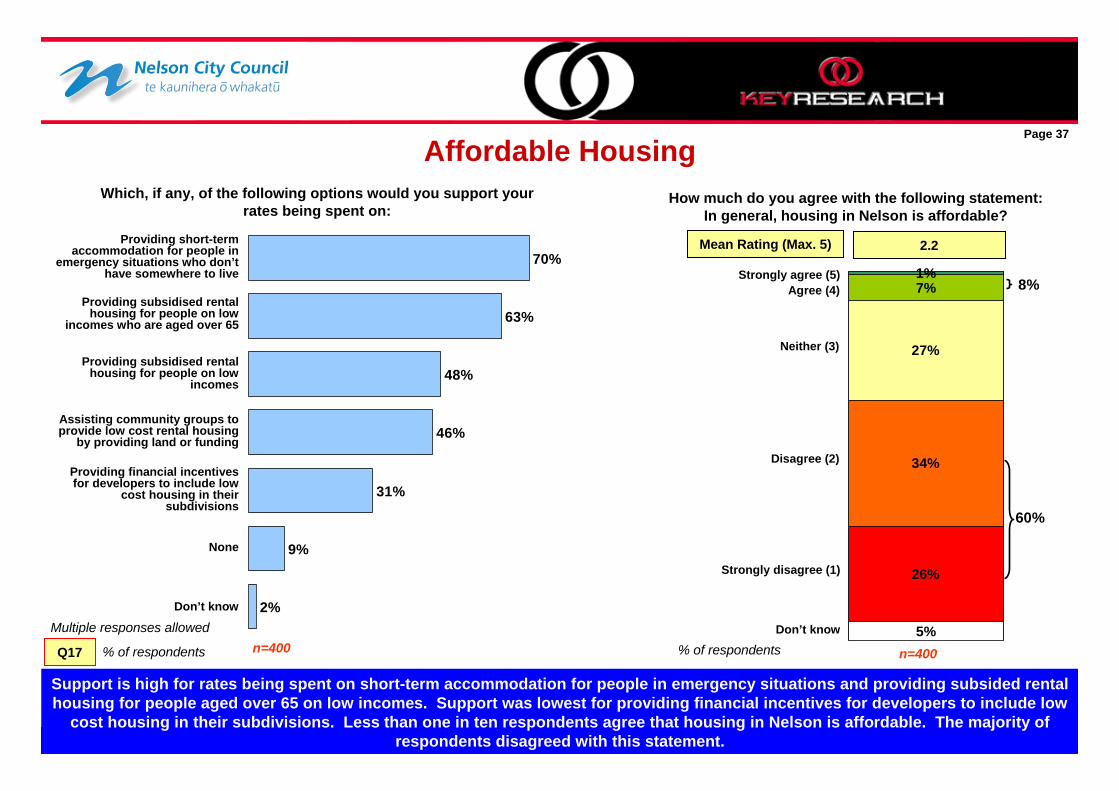
Affordable Housing : Support is high for rates being spent on short-term accommodation for people in emergency situations and providing subsided rental
housing for people aged over 65 on low incomes. Support was lowest for providing financial incentives for developers to include low cost housing in their subdivisions. Less than one in ten respondents agree that housing in Nelson is affordable. The majority of respondents disagreed with this statement.
Copyright © 2010 Key Research. Confidential and proprietary.
Summary (IV) Page 8
Environment: The majority of respondents agree that changing our lifestyles is the solution our environmental issues depend on. Slightly more than one-
half of respondents agree that the earth has very limited room and resources. Almost all respondents stated that it is urgent that steps are taken to take care of the environment. The majority of respondents believe
that all New Zealanders / everyone are responsible for taking steps to take care of the environment. The majority of respondents agree that people have a responsibility to look after the environment for future generations. Only 6% of
respondents stated they Would be embarrassed if their friends thought their lifestyle was purposefully environmentally friendly. Almost all respondents do at least some things that are environmentally friendly in their current lifestyle. Three out of five respondents
stated that they would like to do more for the environment in consideration of their current lifestyle. The media was identified as the main source from which respondents found out about doing environmentally friendly things.
Of the 28% of respondents who disagreed to the statement, Council action to deal with environmental issues is adequate, 93% stated that this was due to not enough Council action being taken. The majority of respondents agreed that by helping others you help yourself in the long run.
The majority of respondents stated they would support the Council making it compulsory to install a rain water collection system on new homes and in providing incentives to encourage households to install a rain water collection system on existing homes.
Value for Money: The majority of respondents are ratepayers in Nelson. Slightly more than one-third of respondents agree the Council offers good value for
money while one-fifth disagree. Having good facilities like rubbish, water, recycling is the main reason for satisfaction with the value for money offered by the Council. Expensive rates and water rates is the main reason for dissatisfaction with the value for money offered by Council. Respondents made a variety of comments which would improve the value for money of the rates.
Overall Performance: Slightly less than one-half of respondents are satisfied overall with Councils overall performance. This represents a decrease from the
results recorded in 2009. General satisfaction / they do a good job and Council introducing good initiatives are the main reasons for satisfaction amongst
respondents. Issues with Council spending and the cost of rates are the main reasons for dissatisfaction with Council’s overall performance.
Copyright © 2010 Key Research. Confidential and proprietary.
Summary (VI) Page 9
Nelson Development : The majority of respondents would prefer if the Council prevented or limited the further development of the hillsides around Nelson City.
Three out of five respondents are in favour of the Council encouraging planned, but more compact and more efficient house types (like terrace or town houses) in specific areas.
Home Heating : Almost one-half of respondents use a wood burner as the main form of heating in the main living room of their house. Almost one-half of respondents who stopped using an enclosed wood or multi-fuel burner in their homes (in the last three years), stated
they stopped using it due to Council regulations.
Sustainability : The majority of respondents put out their recycling every week, compost their food waste and compost their garden waste. Four out of five
respondents produce some of their own food at home. Of the 80% of respondents who do produce some of their own food at home, almost all of them grow vegetables or herbs.
Copyright © 2010 Key Research. Confidential and proprietary.
1. Council Priorities
Page 10
- Importance
- Satisfaction
Copyright © 2010 Key Research. Confidential and proprietary.
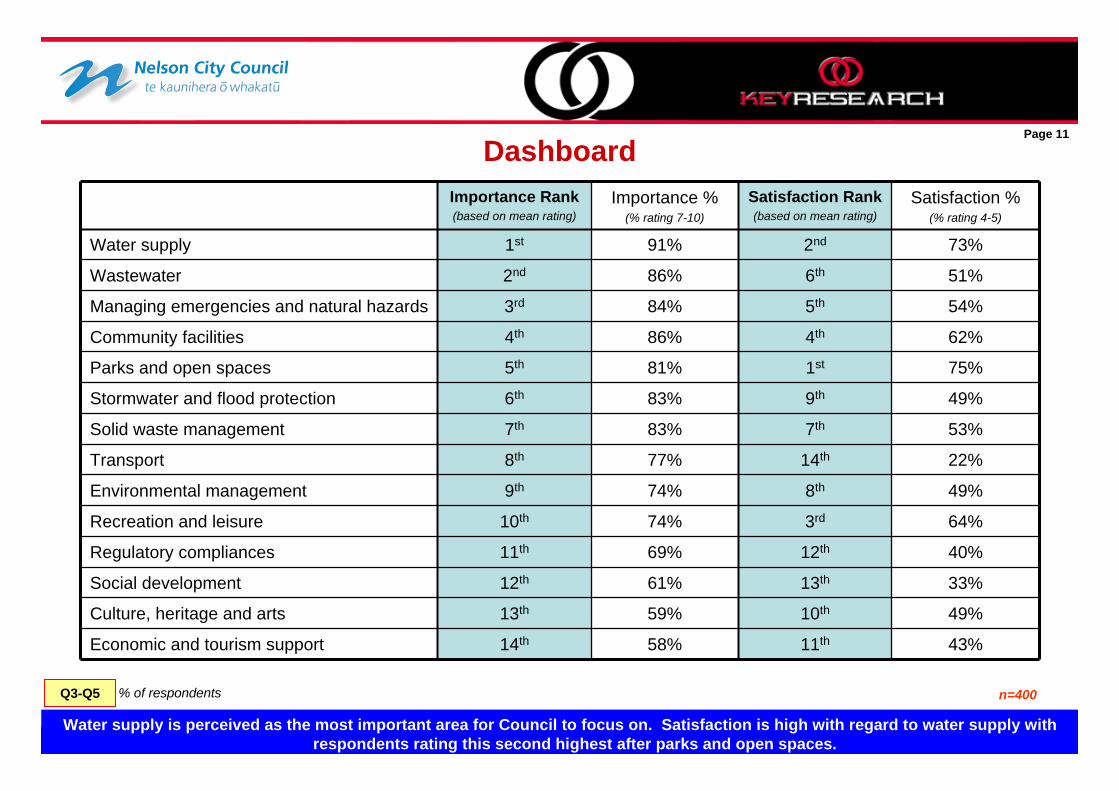
Dashboard
% of respondents
Water supply is perceived as the most important area for Council to focus on. Satisfaction is high with regard to water supply with respondents rating this second highest after parks and open spaces.
Q3-Q5 n=400
Page 11
Importance Rank (based on mean rating)
Importance %(% rating 7-10)
Satisfaction Rank(based on mean rating)
Satisfaction %(% rating 4-5)
Water supply 1st 91% 2nd 73%
Wastewater 2nd 86% 6th 51%
Managing emergencies and natural hazards 3rd 84% 5th 54%
Community facilities 4th 86% 4th 62%
Parks and open spaces 5th 81% 1st 75%
Stormwater and flood protection 6th 83% 9th 49%
Solid waste management 7th 83% 7th 53%
Transport 8th 77% 14th 22%
Environmental management 9th 74% 8th 49%
Recreation and leisure 10th 74% 3rd 64%
Regulatory compliances 11th 69% 12th 40%
Social development 12th 61% 13th 33%
Culture, heritage and arts 13th 59% 10th 49%
Economic and tourism support 14th 58% 11th 43%
Copyright © 2010 Key Research. Confidential and proprietary.
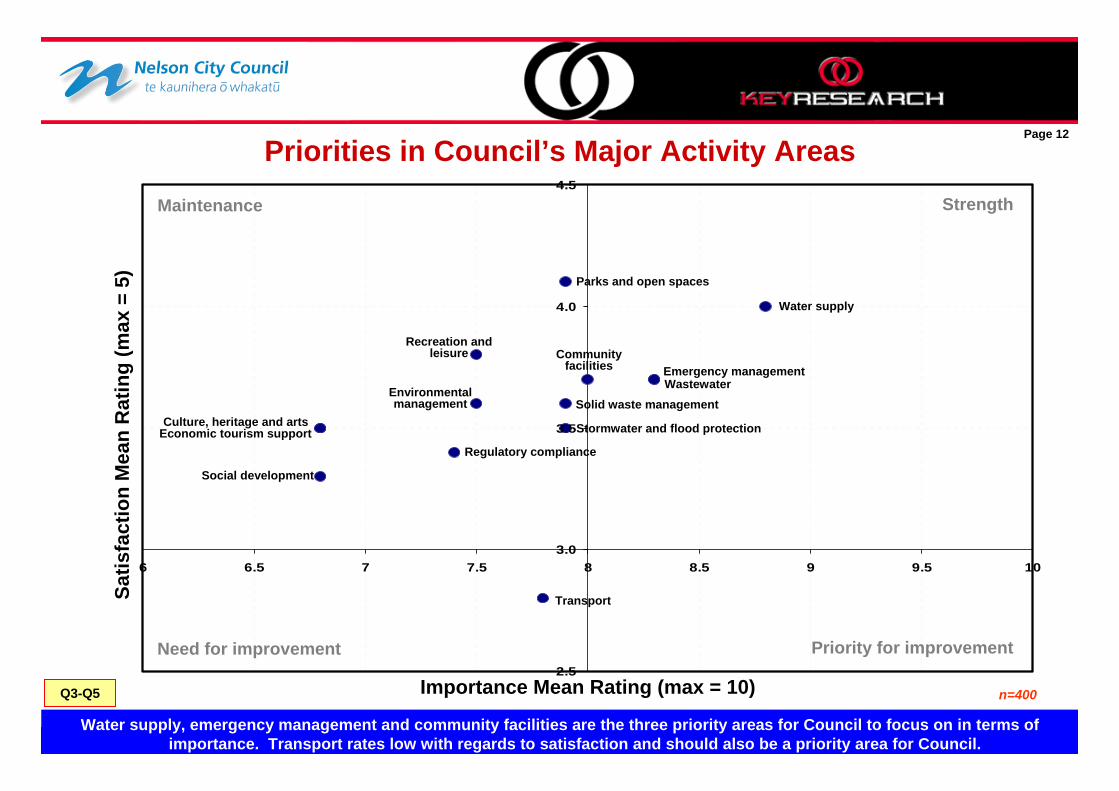
Priorities in Council’s Major Activity Areas
Water supply, emergency management and community facilities are the three priority areas for Council to focus on in terms of importance. Transport rates low with regards to satisfaction and should also be a priority area for Council.
Page 12
2.5
3.0
3.5
4.0
4.5
6 6.5 7 7.5 8 8.5 9 9.5 10
Water supply
Emergency managementCommunity
facilities
Stormwater and flood protection
Parks and open spaces
Solid waste management
Transport
Environmental management
Recreation and leisure
Regulatory compliance
Social development
Culture, heritage and artsEconomic tourism support
Wastewater
Importance Mean Rating (max = 10)
Satis
fact
ion
Mea
n R
atin
g (m
ax =
5)
Priority for improvementNeed for improvement
StrengthMaintenance
Q3-Q5 n=400
Copyright © 2010 Key Research. Confidential and proprietary.
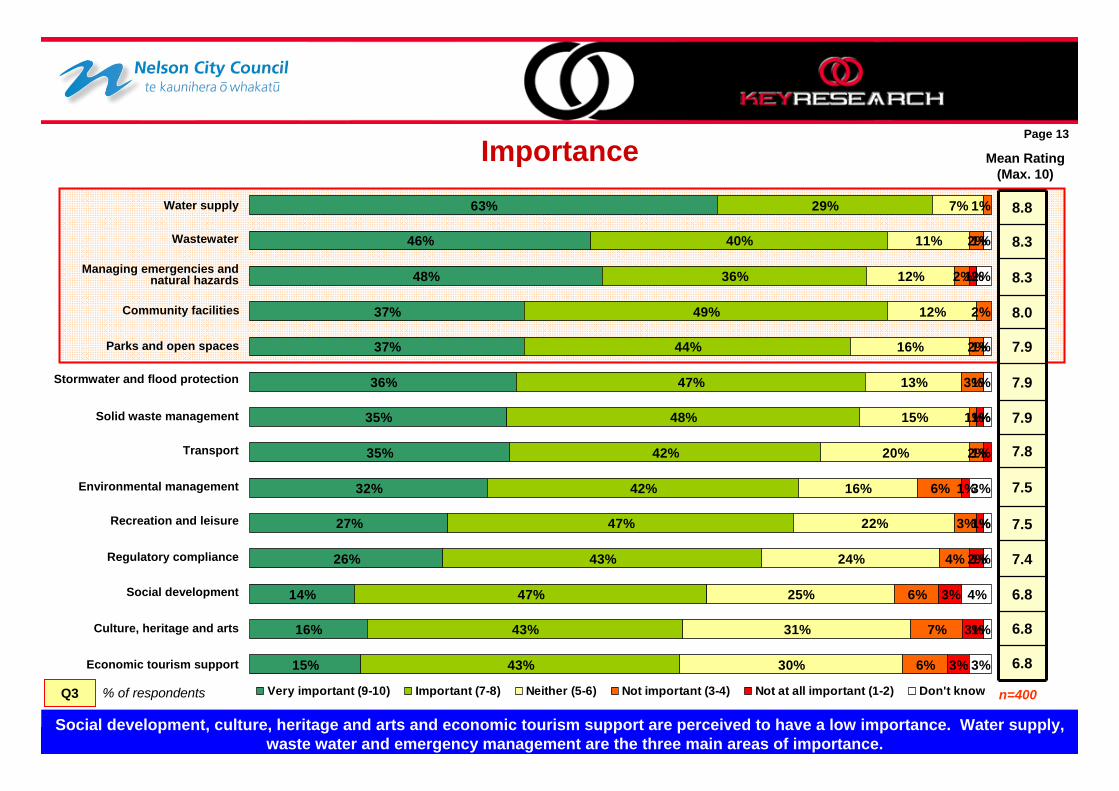
Importance
% of respondents
Social development, culture, heritage and arts and economic tourism support are perceived to have a low importance. Water supply, waste water and emergency management are the three main areas of importance.
Q3
15%
16%
14%
26%
27%
32%
35%
35%
36%
37%
37%
48%
46%
63%
43%
43%
47%
43%
47%
42%
42%
48%
47%
44%
49%
36%
40%
29%
30%
31%
25%
24%
22%
16%
20%
15%
13%
16%
12%
12%
11%
7%
6%
7%
6%
4%
3%
6%
2%
1%
3%
2%
2%
2%
2%
1%
3%
3%
3%
2%
1%
1%
1%
1%
1%
3%
1%
4%
1%
1%
3%
1%
1%
1%
2%
1%
Very important (9-10) Important (7-8) Neither (5-6) Not important (3-4) Not at all important (1-2) Don't know
8.8
8.3
8.3
8.0
7.9
7.9
7.9
7.8
7.5
7.5
7.4
6.8
6.8
6.8
Mean Rating (Max. 10)
Water supply
Page 13
Wastewater
Managing emergencies and natural hazards
Community facilities
Stormwater and flood protection
Parks and open spaces
Solid waste management
Transport
Environmental management
Recreation and leisure
Regulatory compliance
Social development
Culture, heritage and arts
Economic tourism support
n=400

Copyright © 2010 Key Research. Confidential and proprietary.
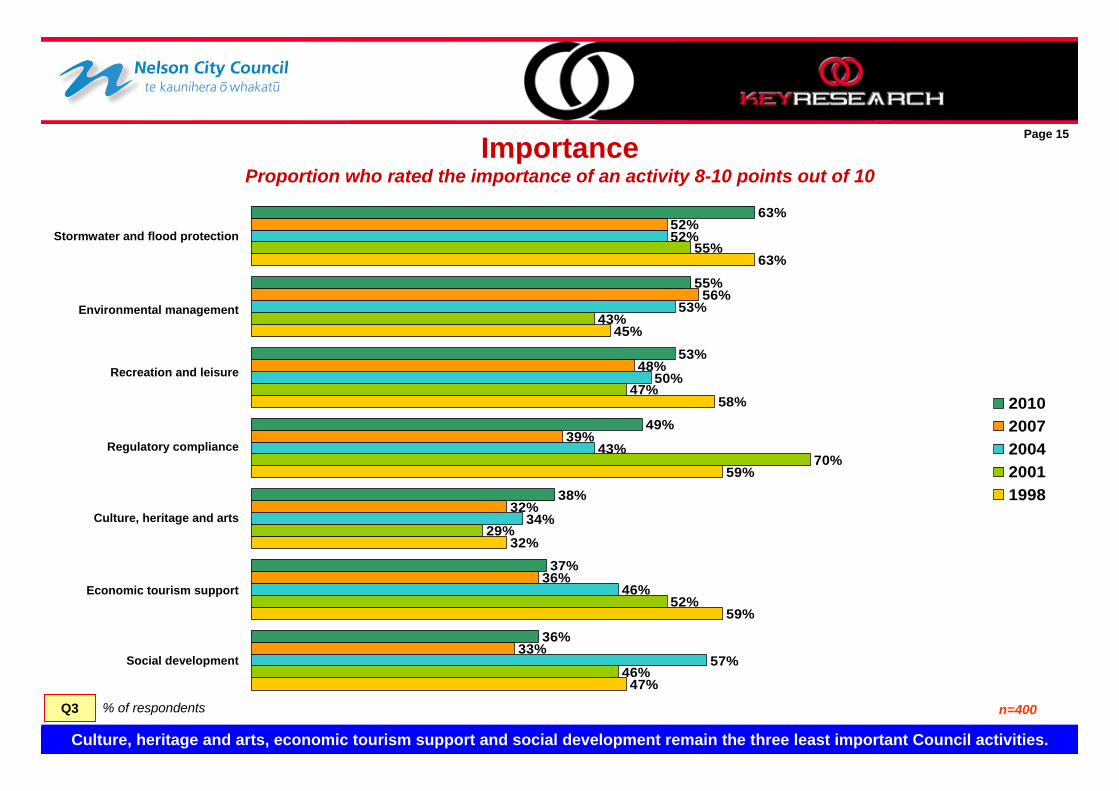
ImportanceProportion who rated the importance of an activity 8-10 points out of 10
% of respondents
Importance has increased for all Council activity areas from previous years. Water supply is still considered most important.
Q355%
62%
47%
54%
63%
78%
79%
51%
64%
45%
51%
59%
75%
70%
58%
62%
58%
57%
59%
73%
75%
59%
61%
56%
52%
63%
72%
76%
65%
65%
65%
68%
71%
73%
83%
20102007200420011998
Water supply
Page 14
Wastewater
Managing emergencies and natural hazards
Community facilities
Parks and open spaces
Solid waste management
n=400
Transport
Copyright © 2010 Key Research. Confidential and proprietary.
ImportanceProportion who rated the importance of an activity 8-10 points out of 10
% of respondents
Culture, heritage and arts, economic tourism support and social development remain the three least important Council activities.
Q3
47%
59%
32%
59%
58%
45%
63%
46%
52%
29%
70%
47%
43%
55%
57%
46%
34%
43%
50%
53%
52%
33%
36%
32%
39%
48%
56%
52%
36%
37%
38%
49%
53%
55%
63%
20102007200420011998
Page 15
n=400
Environmental management
Recreation and leisure
Regulatory compliance
Social development
Culture, heritage and arts
Economic tourism support
Stormwater and flood protection
Copyright © 2010 Key Research. Confidential and proprietary.
% of respondents
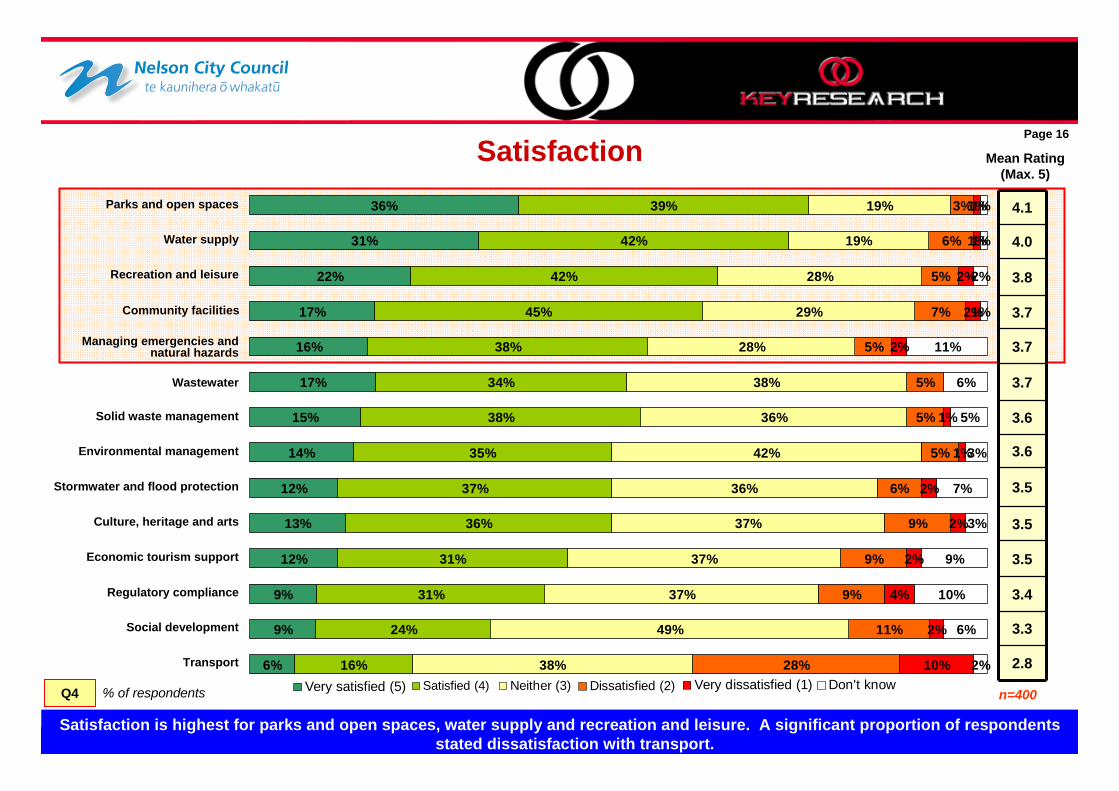
Satisfaction is highest for parks and open spaces, water supply and recreation and leisure. A significant proportion of respondents stated dissatisfaction with transport.
Q4 n=400
2%
6%
10%
9%
3%
7%
3%
5%
6%
11%
1%
2%
1%
1%
2%
4%
2%
2%
2%
1%
1%
2%
2%
2%
1%
1%
28%
11%
9%
9%
9%
6%
5%
5%
5%
5%
7%
5%
6%
3%
38%
49%
37%
37%
37%
36%
42%
36%
38%
28%
29%
28%
19%
19%
16%
24%
31%
31%
36%
37%
35%
38%
34%
38%
45%
42%
42%
39%
6%
9%
9%
12%
13%
12%
14%
15%
17%
16%
17%
22%
31%
36%
10%
4.1
4.0
3.8
3.7
3.7
3.7
3.6
3.6
3.5
3.5
3.5
3.4
3.3
2.8
Mean Rating (Max. 5)
Water supply
Page 16
Wastewater
Managing emergencies and natural hazards
Community facilities
Stormwater and flood protection
Parks and open spaces
Solid waste management
Transport
Environmental management
Recreation and leisure
Regulatory compliance
Social development
Culture, heritage and arts
Economic tourism support
Satisfaction
) Dissatisfied (2)Neither (3)Satisfied (4)Very satisfied (5) Very dissatisfied (1) Don't know
Copyright © 2010 Key Research. Confidential and proprietary.
% of respondents
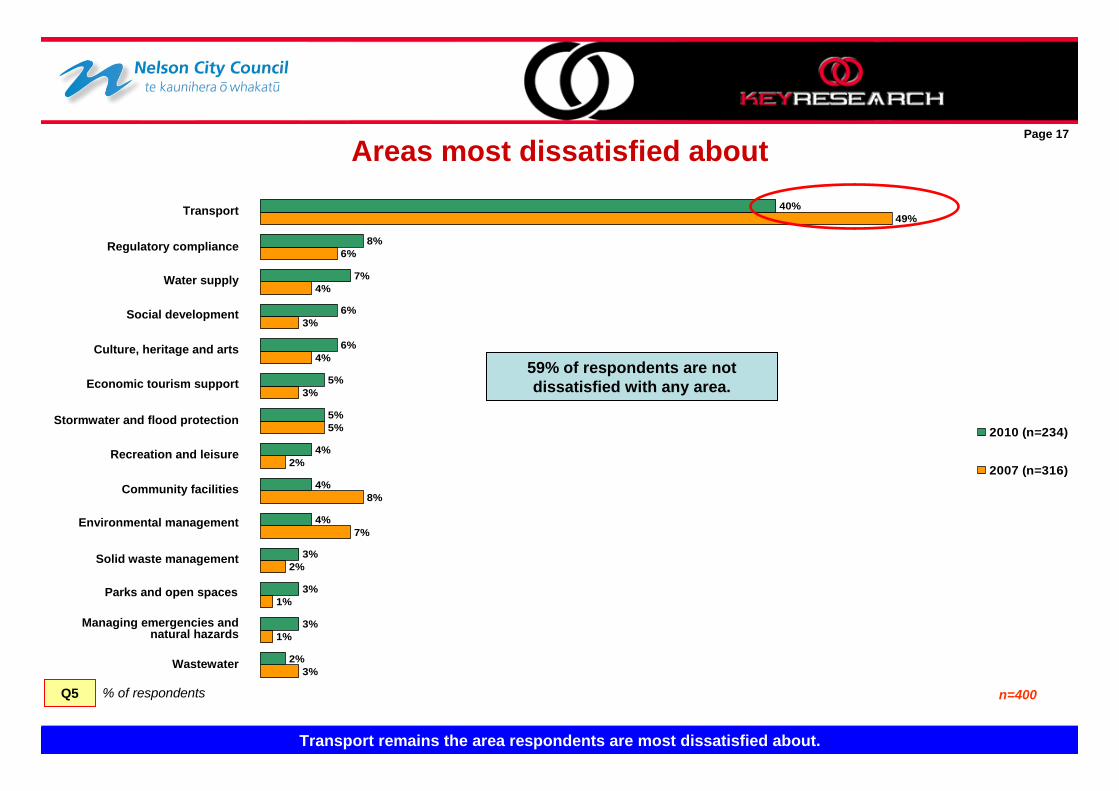
Transport remains the area respondents are most dissatisfied about.
Q5 n=400
3%
1%
1%
2%
7%
8%
2%
5%
3%
4%
3%
4%
6%
49%
2%
3%
3%
3%
4%
4%
4%
5%
5%
6%
6%
7%
8%
40%
2010 (n=234)
2007 (n=316)
Water supply
Page 17
Wastewater
Managing emergencies and natural hazards
Community facilities
Stormwater and flood protection
Parks and open spaces
Solid waste management
Transport
Environmental management
Recreation and leisure
Regulatory compliance
Social development
Culture, heritage and arts
Economic tourism support
Areas most dissatisfied about
59% of respondents are not dissatisfied with any area.

Copyright © 2010 Key Research. Confidential and proprietary.
2. Council Facilities
Page 18
Copyright © 2010 Key Research. Confidential and proprietary.
% of respondents
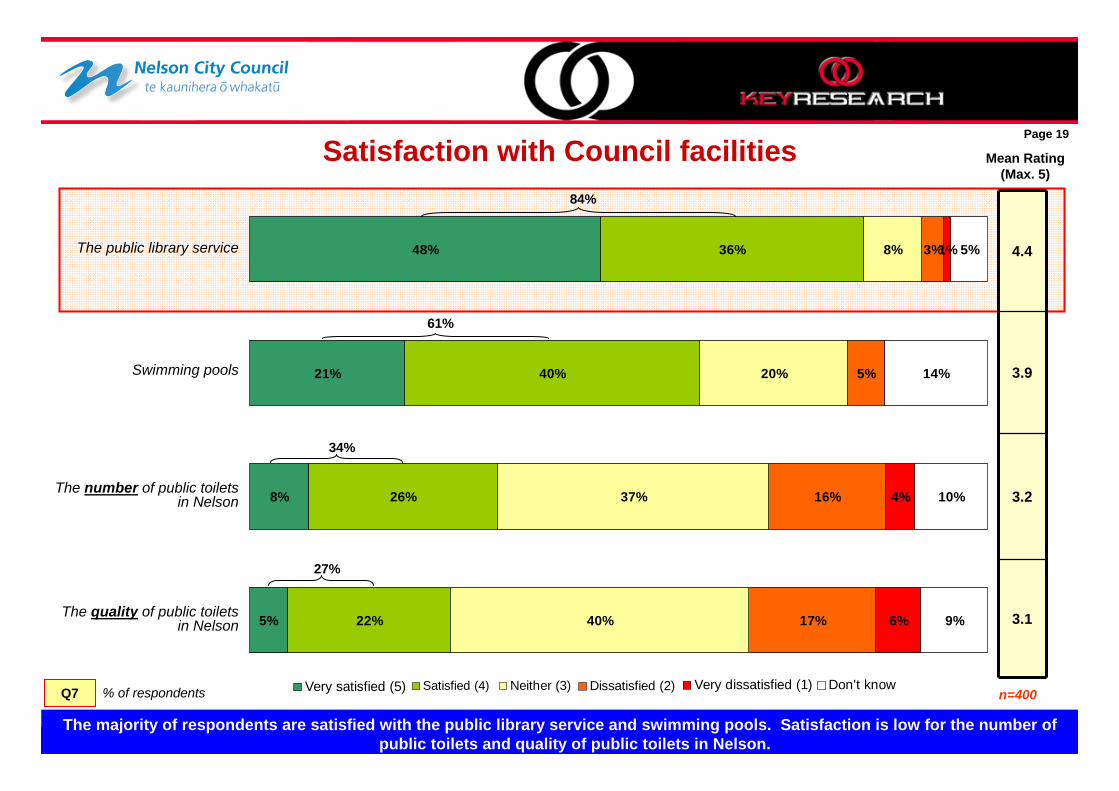
The majority of respondents are satisfied with the public library service and swimming pools. Satisfaction is low for the number of public toilets and quality of public toilets in Nelson.
Q7 n=400
9%
10%
14%
5%
4%
1%
17%
16%
5%
3%
40%
37%
20%
8%
22%
26%
40%
36%
5%
8%
21%
48%
6%
4.4
3.9
3.2
3.1
Mean Rating (Max. 5)
The public library service
Page 19
Swimming pools
The number of public toilets in Nelson
The quality of public toilets in Nelson
Satisfaction with Council facilities84%
61%
34%
27%
) Dissatisfied (2)Neither (3)Satisfied (4)Very satisfied (5) Very dissatisfied (1) Don't know
Copyright © 2010 Key Research. Confidential and proprietary.
% of respondents
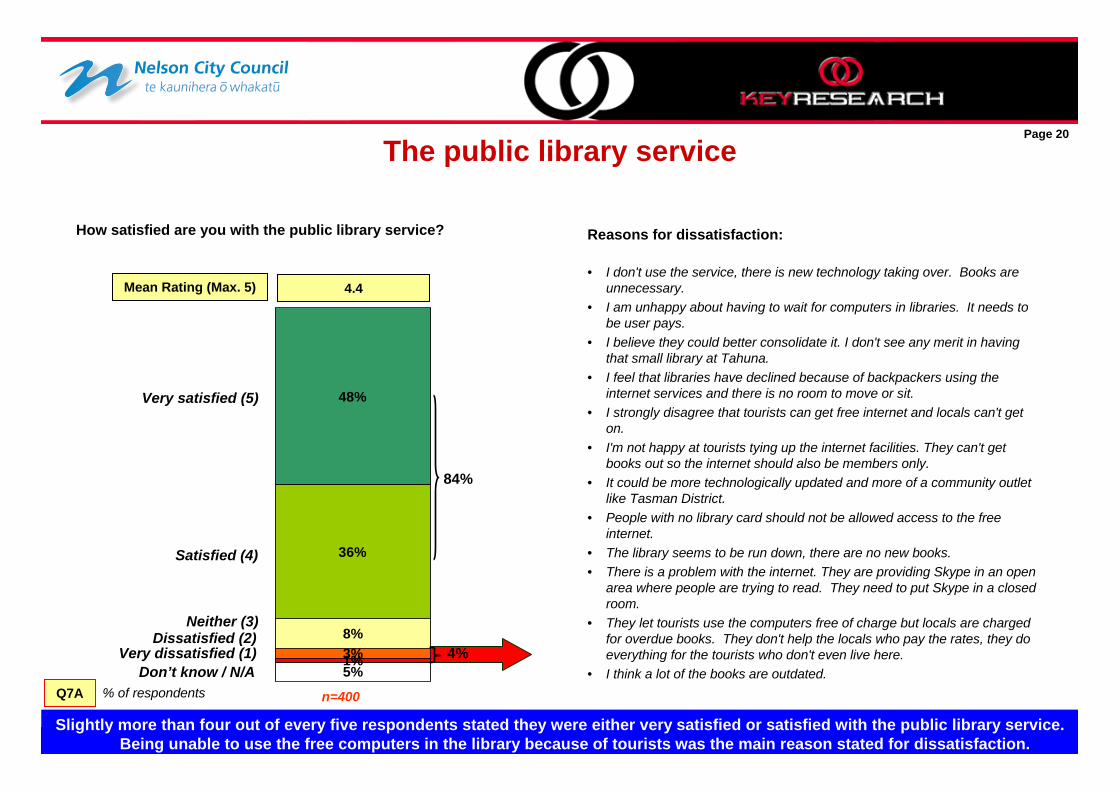
Slightly more than four out of every five respondents stated they were either very satisfied or satisfied with the public library service. Being unable to use the free computers in the library because of tourists was the main reason stated for dissatisfaction.
Q7A n=400
Page 20
The public library service
48%
36%
8%3%1%5%
84%
4%Dissatisfied (2)
Very dissatisfied (1)Don’t know / N/A
Satisfied (4)
Very satisfied (5)
Neither (3)
4.4Mean Rating (Max. 5)
How satisfied are you with the public library service? Reasons for dissatisfaction:
• I don't use the service, there is new technology taking over. Books are unnecessary.
• I am unhappy about having to wait for computers in libraries. It needs to be user pays.
• I believe they could better consolidate it. I don't see any merit in having that small library at Tahuna.
• I feel that libraries have declined because of backpackers using the internet services and there is no room to move or sit.
• I strongly disagree that tourists can get free internet and locals can't get on.
• I'm not happy at tourists tying up the internet facilities. They can't get books out so the internet should also be members only.
• It could be more technologically updated and more of a community outlet like Tasman District.
• People with no library card should not be allowed access to the free internet.
• The library seems to be run down, there are no new books.• There is a problem with the internet. They are providing Skype in an open
area where people are trying to read. They need to put Skype in a closed room.
• They let tourists use the computers free of charge but locals are charged for overdue books. They don't help the locals who pay the rates, they do everything for the tourists who don't even live here.
• I think a lot of the books are outdated.
Copyright © 2010 Key Research. Confidential and proprietary.
% of respondents
Three in every five respondents are satisfied with swimming pools. The main reasons for dissatisfaction amongst respondents is due to the pools being in need of an upgrade, the cost and the use of chemicals in the water.
Q7B
Page 21
Swimming pools
21%
40%
20%
5%
14%
61%
Dissatisfied (2)
Don’t know / N/A
Satisfied (4)
Very satisfied (5)
Neither (3)
3.9Mean Rating (Max. 5)
How satisfied are you with swimming pools? Reasons for dissatisfaction:
• It needs upgrading. (4)• They are too expensive. (3)• There is too many chemicals in the water. (2)• Pools are not attractive to visit. They need an outdoor recreation area.• I don't like to have to pay to watch the children swim.• Cleanliness is a big problem. The charges are too expensive when you
consider the amount of kids using it as well as large families.• Improve the complex, put in a heated pool and add fun things for kids.• It is closed in winter and barely open in summer so it is not being utilised to
it's full potential.• There is only one main pool which is on Tasman side and one on Nelson
side. • The city the size of Nelson should have an Olympic sized pool to be able to
hold a national championship.• The standard of them could be improved immensely. They hardly match a
national standard. • There is too much chlorine. I prefer a saltwater pool.• We've got two pools, ASB Aquatic Centre, design leaves a lot to be desired.
They didn't listen to what people wanted. Riverside Pool is a pool and nothing more. It needs more scope to develop it better.
n=400
Copyright © 2010 Key Research. Confidential and proprietary.
% of respondents
One-fifth of respondents are dissatisfied with the number of public toilets in Nelson. There not being enough public toilets is themain reason for this dissatisfaction.
Q7D
Page 22
The number of public toilets
8%
26%
37%
16%
4%
10%
34%
Dissatisfied (2)
Don’t know / N/A
Satisfied (4)
Very satisfied (5)
Neither (3)
3.2Mean Rating (Max. 5)
How satisfied are you with the number of public toilets in Nelson?
Very dissatisfied (1)
Reasons for dissatisfaction:
• There are not enough public toilets. (52)• They are hard to find.• I don't use them and I don't know where they are.• I have been caught short a few times. For an elderly person who doesn't
want to sprint, a few more would be helpful.• I only know of two and they are in the car parks.• Many are locked at night. • People struggle to find them. There are no blatant signs.• These are facilities that should be more spread around for the convenience
of the residents, especially if they are going to encourage visitors to come.• There needs to be more like the ones in the information centre.• There should be one every half hour or so.• They are few and far between. We need more signs. • They replaced the toilet with a tree but they didn't build a new facility.• They need to double the number because the population is increasing all
the time.• Victory Square needs a good upgrade.• We need more public toilets and better signage.• Toilets around walkways and reserves would be good.• Some parks don't have toilets.
20%
n=400

Copyright © 2010 Key Research. Confidential and proprietary.
% of respondents
Slightly more than one-quarter of respondents are satisfied with the quality of public toilets. One-third of respondents stated they were dissatisfied, this is mainly because they are unclean and dirty (lack of maintenance).
Q7C
Page 23
The quality of public toilets
5%
22%
40%
17%
6%
9%
27%
Dissatisfied (2)
Don’t know / N/A
Satisfied (4)
Very satisfied (5)
Neither (3)
3.1Mean Rating (Max. 5)
How satisfied are you with the quality of public toilets in Nelson?
Reasons for dissatisfaction:
Very dissatisfied (1)
33%
n=400

Copyright © 2010 Key Research. Confidential and proprietary.
3. Transport
Page 24
Copyright © 2010 Key Research. Confidential and proprietary.
Travel to work (I)
% of respondents
Slightly less than one-half of respondents work full-time. This is similar to that recorded in 2009.
Q8 & Q9
43% 45%
22% 19%
35% 36%Not in paid work / voluntary
work / retired / student
Part time work (30 hours or less a week)
Full time work (more than 30 hours)
Which of the following best describes your work status?
n=400
Page 25
n=400
20102009
Copyright © 2010 Key Research. Confidential and proprietary.
Travel to work (II)
% of respondents
Driving a private vehicle remains the key mode of transport when travelling to work. The proportion of respondents stating theywalked or ran, or biked to work has increased.
Q8 & Q9
On your most recent trip to work, what was the one main way you travelled to work?
1%
0
1%
1%
3%
9%
9%
12%
65%
Drove a company vehicle
Motorbike
Bicycle
Drove a private vehicle
Public transport / bus
Worked at home
Walked or ran
Othern=255
Page 26
Other response Plane (2)
2010
3%
0%
1%
6%
9%
6%
5%
70%
Drove a company vehicle
Passenger in a vehicle
Motorbike
Bicycle
Drove a private vehicle
Public transport / bus
Worked at home
Walked or jogged
Othern=262
Other response Go to Australia by plane every
other fortnight and work there.
<1
2009
Passenger in a vehicle
Copyright © 2010 Key Research. Confidential and proprietary.
How other family members travel
% of respondents
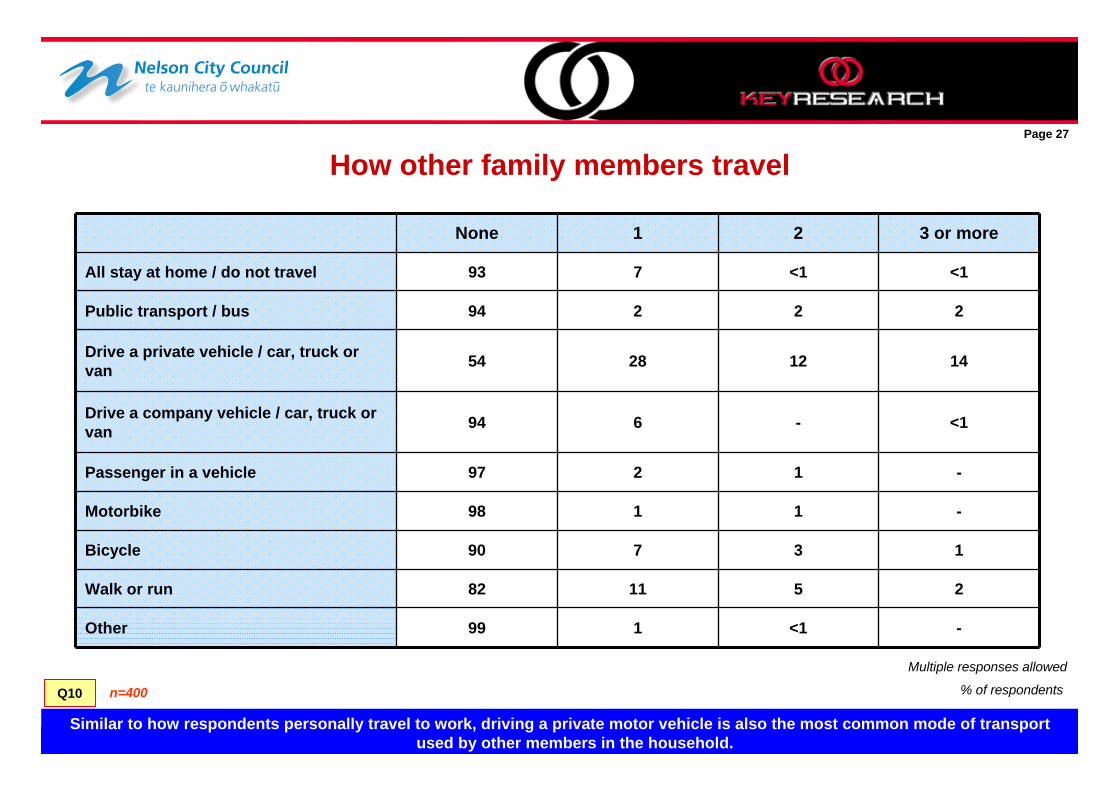
Similar to how respondents personally travel to work, driving a private motor vehicle is also the most common mode of transport used by other members in the household.
Page 27
Q10
None 1 2 3 or more
All stay at home / do not travel 93 7 <1 <1
Public transport / bus 94 2 2 2
Drive a private vehicle / car, truck or van 54 28 12 14
Drive a company vehicle / car, truck or van 94 6 - <1
Passenger in a vehicle 97 2 1 -
Motorbike 98 1 1 -
Bicycle 90 7 3 1
Walk or run 82 11 5 2
Other 99 1 <1 -
n=400
Multiple responses allowed
Copyright © 2010 Key Research. Confidential and proprietary.
Satisfaction with the transport network
% of respondents
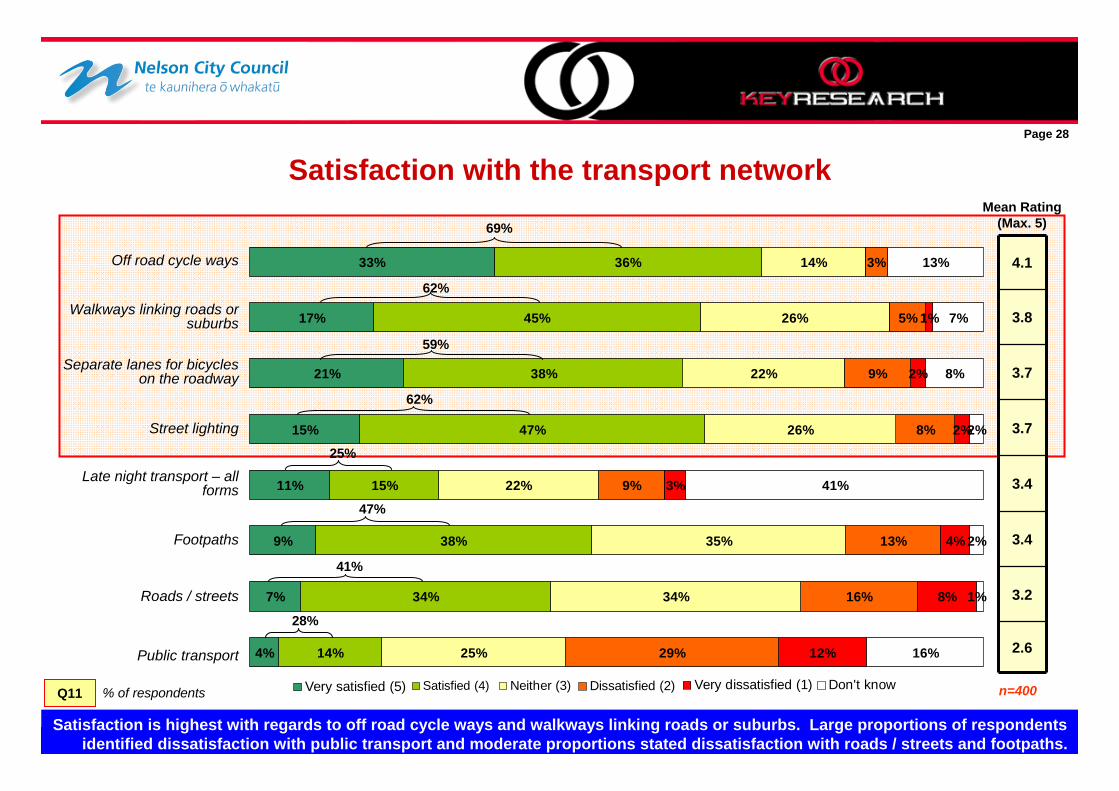
Satisfaction is highest with regards to off road cycle ways and walkways linking roads or suburbs. Large proportions of respondents identified dissatisfaction with public transport and moderate proportions stated dissatisfaction with roads / streets and footpaths.
Q11 n=400
16%
1%
2%
41%
2%
8%
7%
13%
8%
4%
3%
2%
2%
1%
29%
16%
13%
9%
8%
9%
5%
3%
25%
34%
35%
22%
26%
22%
26%
14%
14%
34%
38%
15%
47%
38%
45%
36%
4%
7%
9%
11%
15%
21%
17%
33%
12%
4.1
3.8
3.7
3.7
3.4
3.4
3.2
2.6
Mean Rating (Max. 5)
Off road cycle ways
Roads / streets
Late night transport – all forms
Separate lanes for bicycles on the roadway
Public transport
Street lighting
Footpaths
Walkways linking roads or suburbs
69%
62%
59%
62%
25%
47%
41%
28%
) Dissatisfied (2)Neither (3)Satisfied (4)Very satisfied (5)
Page 28
Very dissatisfied (1) Don't know
Copyright © 2010 Key Research. Confidential and proprietary.
19%29%
11%16%
9%13%
10%8%
4%5%
12%
7%
6%
18%14%
39%34%
47%
20%15%
45%47%
40%38%
46%45%
42%36%
5%4%
10%7%
9%9%
6%11%
13%15%
20%21%
10%17%
26%33%
3%3%
8%9%
6%9%
12%
8%
4%4%
1%2%
1%2%
2%1%
3%
38%
20092010
20092010
20092010
20092010
20092010
20092010
20092010
20092010
Off road cycle ways
Walkways linking roads
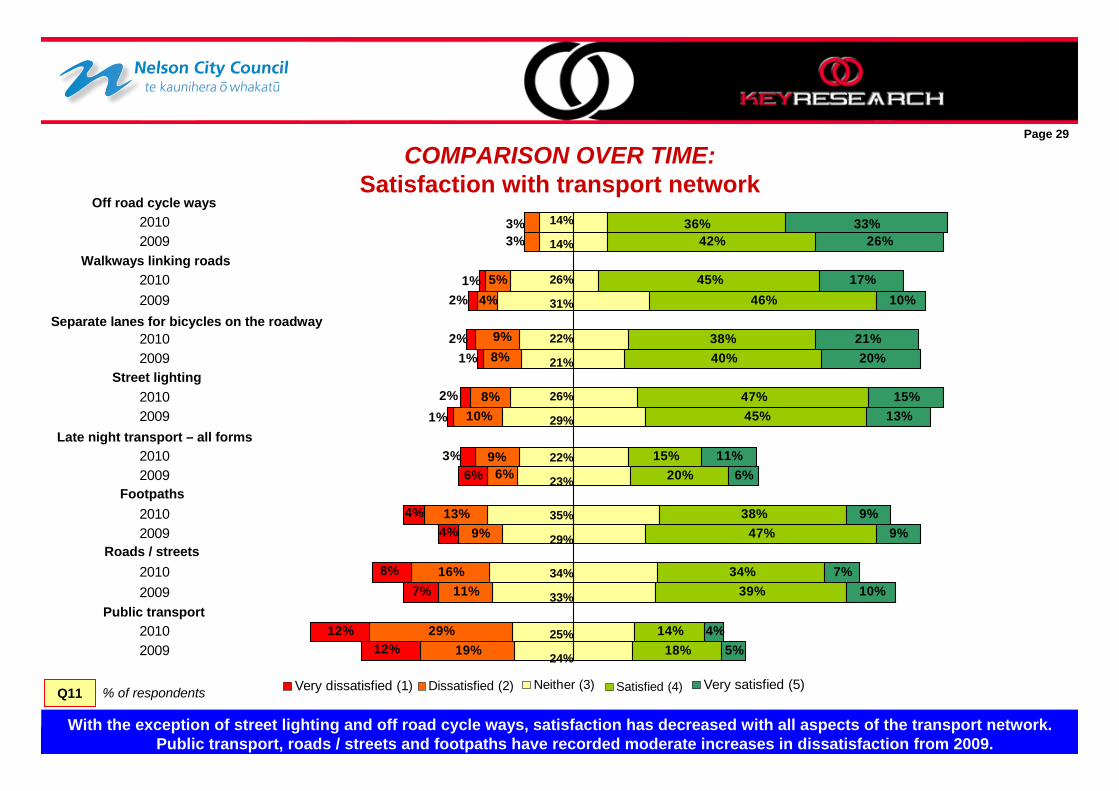
COMPARISON OVER TIME:Satisfaction with transport network
Q11
With the exception of street lighting and off road cycle ways, satisfaction has decreased with all aspects of the transport network. Public transport, roads / streets and footpaths have recorded moderate increases in dissatisfaction from 2009.
% of respondents
Page 29
) Dissatisfied (2) Neither (3) Satisfied (4) Very satisfied (5)Very dissatisfied (1)
Separate lanes for bicycles on the roadway
Street lighting
Late night transport – all forms
Footpaths
Roads / streets
Public transport
14%
14%
26%
31%
22%
21%
26%
29%
22%
23%
35%
29%
34%
33%
25%
24%
Copyright © 2010 Key Research. Confidential and proprietary.
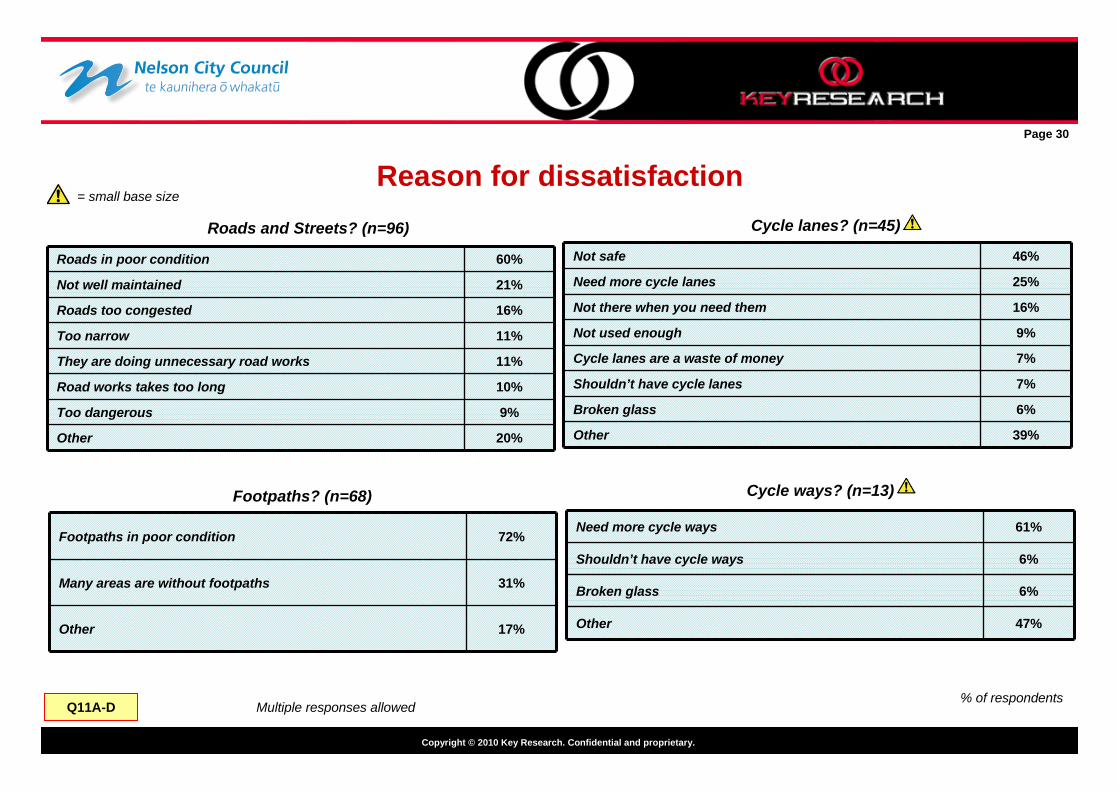
Reason for dissatisfaction
% of respondentsQ11A-D
Roads and Streets? (n=96)
Multiple responses allowed
Footpaths? (n=68)
Cycle lanes? (n=45)
Cycle ways? (n=13)
Roads in poor condition 60%
Not well maintained 21%
Roads too congested 16%
Too narrow 11%
They are doing unnecessary road works 11%
Road works takes too long 10%
Too dangerous 9%
Other 20%
Footpaths in poor condition 72%
Many areas are without footpaths 31%
Other 17%
Not safe 46%
Need more cycle lanes 25%
Not there when you need them 16%
Not used enough 9%
Cycle lanes are a waste of money 7%
Shouldn’t have cycle lanes 7%
Broken glass 6%
Other 39%
Need more cycle ways 61%
Shouldn’t have cycle ways 6%
Broken glass 6%
Other 47%
= small base size
Page 30
Copyright © 2010 Key Research. Confidential and proprietary.
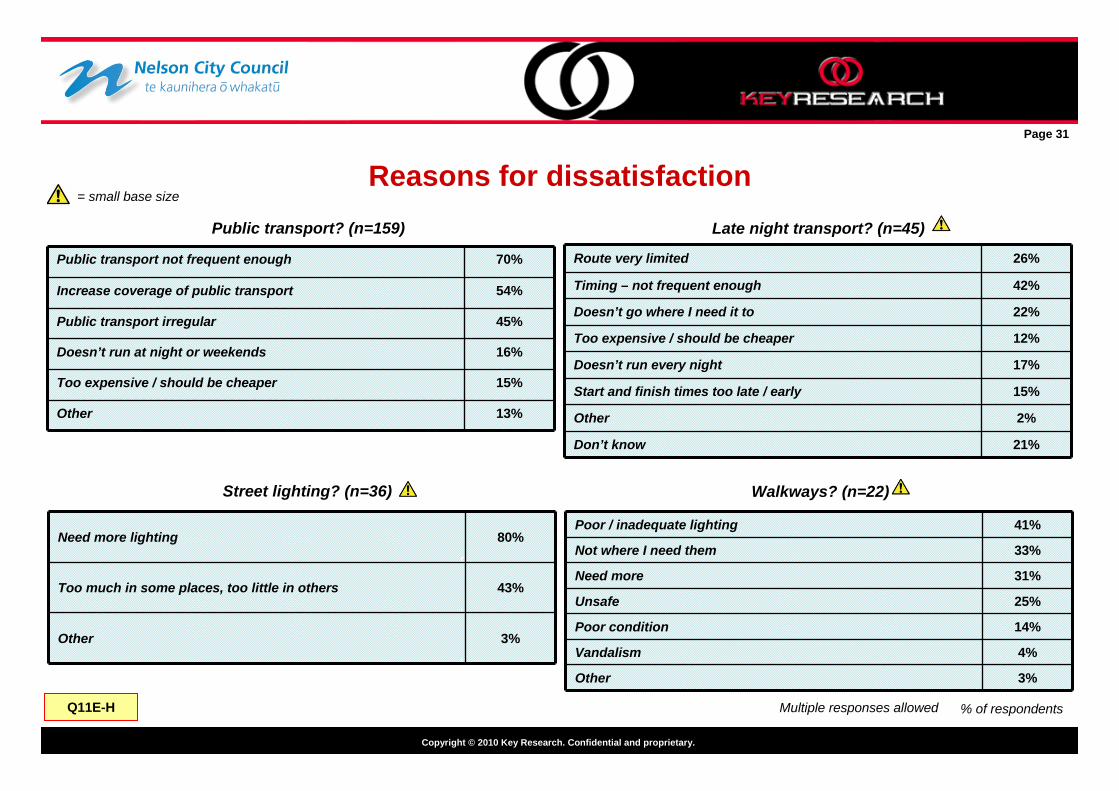
Reasons for dissatisfaction
% of respondentsQ11E-H
Public transport? (n=159)
Multiple responses allowed
Late night transport? (n=45)
Street lighting? (n=36) Walkways? (n=22)
Public transport not frequent enough 70%
Increase coverage of public transport 54%
Public transport irregular 45%
Doesn’t run at night or weekends 16%
Too expensive / should be cheaper 15%
Other 13%
Route very limited 26%
Timing – not frequent enough 42%
Doesn’t go where I need it to 22%
Too expensive / should be cheaper 12%
Doesn’t run every night 17%
Start and finish times too late / early 15%
Other 2%
Don’t know 21%
Need more lighting 80%
Too much in some places, too little in others 43%
Other 3%
Poor / inadequate lighting 41%
Not where I need them 33%
Need more 31%
Unsafe 25%
Poor condition 14%
Vandalism 4%
Other 3%
= small base size
Page 31
Copyright © 2010 Key Research. Confidential and proprietary.
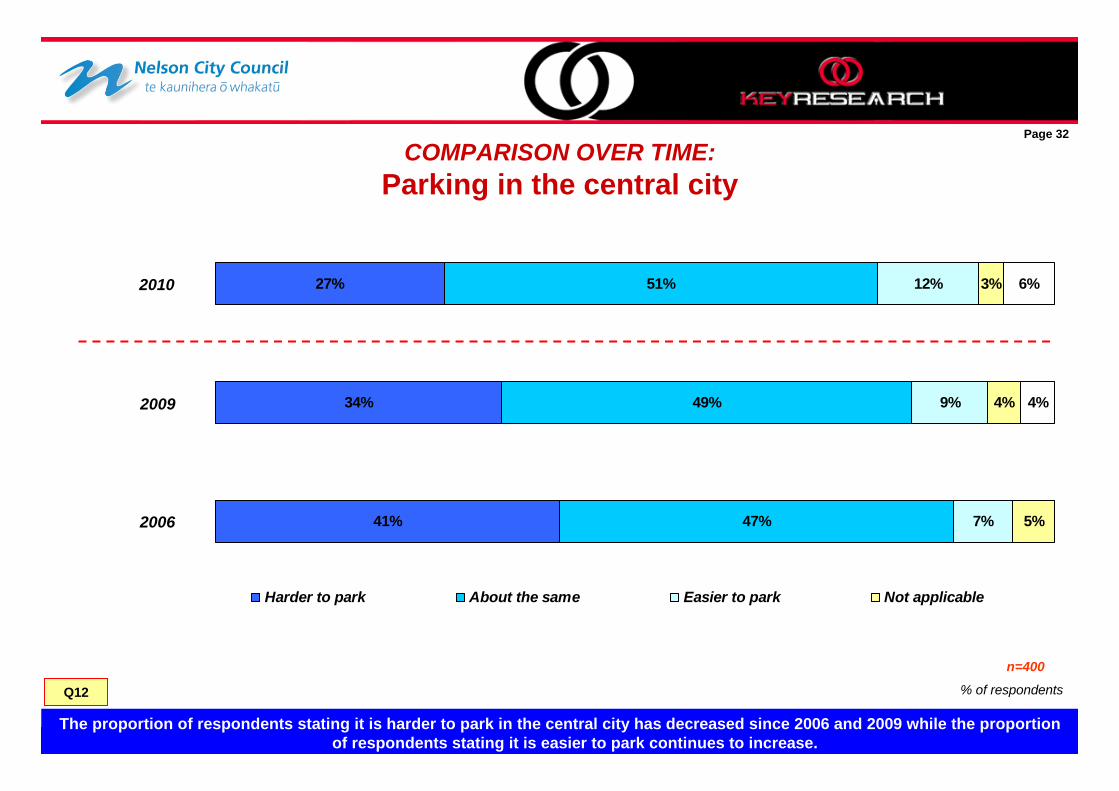
COMPARISON OVER TIME:Parking in the central city
% of respondents
The proportion of respondents stating it is harder to park in the central city has decreased since 2006 and 2009 while the proportion of respondents stating it is easier to park continues to increase.
Q12
41%
34%
27%
47%
49%
51%
7%
9%
12%
5%
4%
3%
4%
6%
Harder to park About the same Easier to park Not applicable
n=400
2009
2006
Page 32
2010
Copyright © 2010 Key Research. Confidential and proprietary.
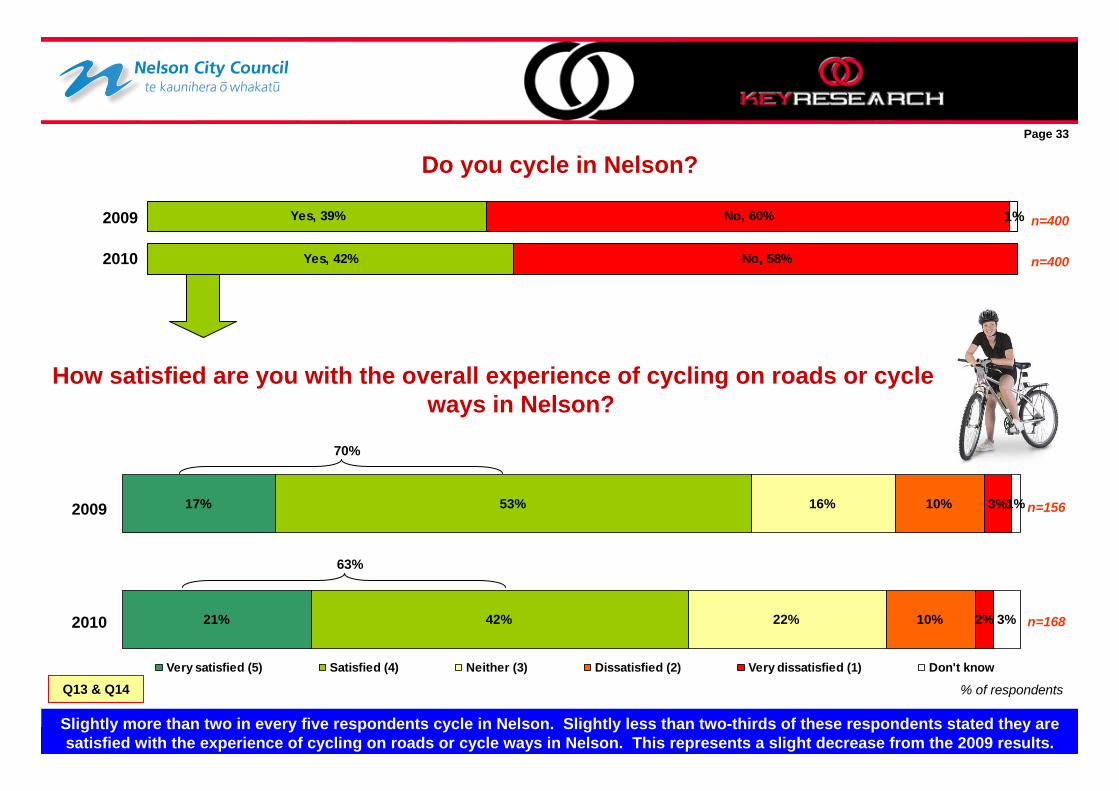
Do you cycle in Nelson?
% of respondents
Slightly more than two in every five respondents cycle in Nelson. Slightly less than two-thirds of these respondents stated they are satisfied with the experience of cycling on roads or cycle ways in Nelson. This represents a slight decrease from the 2009 results.
n=400
Page 33
How satisfied are you with the overall experience of cycling on roads or cycle ways in Nelson?
n=16821%
17%
42%
53%
22%
16%
10%
10%
2%
3%
3%
1%
Very satisfied (5) Satisfied (4) Neither (3) Dissatisfied (2) Very dissatisfied (1) Don't know
70%
Yes, 39%
No, 58%
No, 60% 1%
Yes, 42%
n=400
2010
2009
63%
n=156
2010
2009
Q13 & Q14
Copyright © 2010 Key Research. Confidential and proprietary.
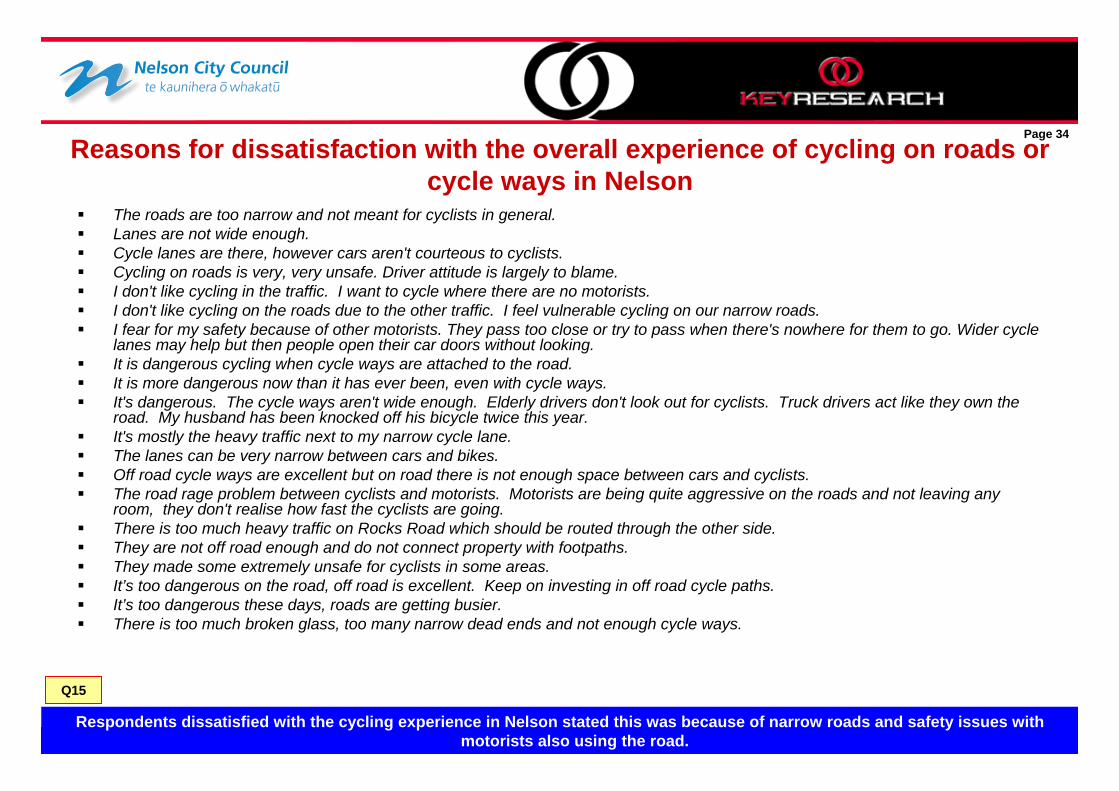
The roads are too narrow and not meant for cyclists in general. Lanes are not wide enough. Cycle lanes are there, however cars aren't courteous to cyclists. Cycling on roads is very, very unsafe. Driver attitude is largely to blame. I don't like cycling in the traffic. I want to cycle where there are no motorists. I don't like cycling on the roads due to the other traffic. I feel vulnerable cycling on our narrow roads. I fear for my safety because of other motorists. They pass too close or try to pass when there's nowhere for them to go. Wider cycle
lanes may help but then people open their car doors without looking. It is dangerous cycling when cycle ways are attached to the road. It is more dangerous now than it has ever been, even with cycle ways. It's dangerous. The cycle ways aren't wide enough. Elderly drivers don't look out for cyclists. Truck drivers act like they own the
road. My husband has been knocked off his bicycle twice this year. It's mostly the heavy traffic next to my narrow cycle lane. The lanes can be very narrow between cars and bikes. Off road cycle ways are excellent but on road there is not enough space between cars and cyclists. The road rage problem between cyclists and motorists. Motorists are being quite aggressive on the roads and not leaving any
room, they don't realise how fast the cyclists are going. There is too much heavy traffic on Rocks Road which should be routed through the other side. They are not off road enough and do not connect property with footpaths. They made some extremely unsafe for cyclists in some areas. It’s too dangerous on the road, off road is excellent. Keep on investing in off road cycle paths. It’s too dangerous these days, roads are getting busier. There is too much broken glass, too many narrow dead ends and not enough cycle ways.
Reasons for dissatisfaction with the overall experience of cycling on roads or cycle ways in Nelson
Q15
Respondents dissatisfied with the cycling experience in Nelson stated this was because of narrow roads and safety issues with motorists also using the road.
Page 34

Copyright © 2010 Key Research. Confidential and proprietary.
Perceptions of Safety
% of respondents
Satisfaction with the safety for motorists, pedestrians and cyclists in Nelson have all decreased from the 2009 results.
Q16
Safety for cyclists around
Nelson
Safety for motorists around
Nelson
Safety for pedestrians
around Nelson
Page 35
10%
8%
14%
10%
11%
11%
38%
30%
51%
46%
52%
49%
29%
35%
29%
32%
28%
31%
9%
13%
5%
9%
5%
5%
2%
3%
1%
1%
1%
12%
12%
1%
1%
3%
3%
Very satisfied (5) Satisfied (4) Neither (3) Dissatisfied (2) Very dissatisfied (1)
60%
38%
n=4003.7
3.7
3.6
3.7
3.3
3.5
Mean Rating (Max. 5)
n=400
n=400
56%
n=400
n=400
n=400
2010
2009
2010
2009
2010
2009

Copyright © 2010 Key Research. Confidential and proprietary.
4. Affordable Housing
Page 36
Copyright © 2010 Key Research. Confidential and proprietary.
1%7%
27%
34%
26%
5%% of respondents
Support is high for rates being spent on short-term accommodation for people in emergency situations and providing subsided rental housing for people aged over 65 on low incomes. Support was lowest for providing financial incentives for developers to include low
cost housing in their subdivisions. Less than one in ten respondents agree that housing in Nelson is affordable. The majority of respondents disagreed with this statement.
Q17 n=400
2%
9%
31%
46%
48%
63%
70%
Providing subsidised rental housing for people on low
incomes who are aged over 65
Page 37
Don’t know
None
Providing short-term accommodation for people in
emergency situations who don’t have somewhere to live
Providing financial incentives for developers to include low
cost housing in their subdivisions
Assisting community groups to provide low cost rental housing
by providing land or funding
Providing subsidised rental housing for people on low
incomes
Affordable HousingWhich, if any, of the following options would you support your
rates being spent on:
% of respondents
8%
2.2Mean Rating (Max. 5)
How much do you agree with the following statement: In general, housing in Nelson is affordable?
60%
n=400Multiple responses allowed
Strongly agree (5)Agree (4)
Neither (3)
Disagree (2)
Strongly disagree (1)
Don’t know
Copyright © 2010 Key Research. Confidential and proprietary.
5. Horticultural Parks
Page 38
Copyright © 2010 Key Research. Confidential and proprietary.
Have you visited any of the following parks in the last 2 years?
% of respondents
The majority of respondents have visited a park in the last two years. Queens Garden, Isel Park and Anzac Park are the parks that the most respondents have visited. Only one-third of respondents stated they had visited Melrose Gardens in the last 2 years.
Q18 n=400
1%
1%
52%
43%
35%
29%
28%
17%
33%
47%
57%
65%
71%
72%
83%
67%
Queens Garden
Page 39
Isel Park
Anzac Park
Miyazu Japanese Gardens
Church Hill Gardens
Broadgreen Gardens
Melrose Gardens

Copyright © 2010 Key Research. Confidential and proprietary.
% of respondents
Exercise, for family activities and for sitting / quiet enjoyment are the three most common reasons respondents visit horticultural parks.
Q19A n=379
1%
1%
1%
3%
3%
4%
4%
3%
2%
7%
6%
7%
13%
18%
23%
3%
1%
1%
3%
3%
4%
4%
5%
8%
10%
13%
16%
18%
18%
16%
26%
First mentioned
Others mentioned
Page 40
Reasons for visiting horticultural parksFor what reasons do you visit the park/s?
For family activities
Passing through (commuting)
For an annual event
For plants / trees (botanical interest)
Dog exercising
Exercise
Scenic lookout
To take my children there
Showing visitors to Nelson
For sitting / quiet enjoyment
General recreation
Taken there by someone else
It’s my local park
Other organised events
Sporting events
Other
49%
34%
31%
25%
22%
20%
12%
11%
9%
8%
7%
6%
4%
2%
1%
4%
Multiple responses allowed
Copyright © 2010 Key Research. Confidential and proprietary.
% of respondents
Very few respondents have not visited a horticultural park in the last two year. A general lack of interest in parks in the main reason stated for not visiting.
Q20 n=17
Page 41
Reasons for not visiting horticultural parksFor what reasons do you not visit the park/s?
Not interested in parks
Too far away
Not interested in botany
Don’t know
Other
14%
31%
4%
51%
5%
5%
5%
First mentioned
Others mentioned
Small base size
51%
9%
5%
36%
14%
Multiple responses allowed

Copyright © 2010 Key Research. Confidential and proprietary.
6. Local Parks
Page 42

Copyright © 2010 Key Research. Confidential and proprietary.
3%3%
16%
23%
54%
1%% of respondents
Four out of every five respondents visit their local park. For the majority of respondents, this park is less than 10 minutes walk away from their home.
Q22 & Q23 n=319
Page 43
Local parks
Do you visit the park closest to where you live?
% of respondents
How far away is this park from your home? (minutes walk)
n=400
30+ minutes21-30 minutes
11-20 minutes
6-10 minutes
Up to 5 minutes
Don’t know
Yes, 81%
No, 19%

Copyright © 2010 Key Research. Confidential and proprietary.
% of respondents
Respondents regularly visit their local park. Slightly less than one-half of respondents who visit their local park do this on a weekly basis or more often. Walking, to enjoy nature, to use the playgrounds and for botanical interest are the main activities
respondents visit their local park for.
Q24 & Q25 n=3192%
2%
1%
3%
6%
9%
3%
3%
6%
3%
14%
8%
22%
7%
3%
5%
5%
6%
10%
9%
7%
13%
13%
16%
22%
11%
21%
27%
First mentioned
Others mentioned
Page 44
Reasons for visiting local park/sWhat activities do you visit your local park/s for?
To enjoy nature
Gardens for sitting
Exercise
Botanical interest
For sport
Walking
Events / concerts
Other
Dog walking
Use the playgrounds
General recreation
Education
Scenic lookouts
Cycling
12%
17%
26%
31%
13%
0.011%
n=319
How often would you say you visit your local park?
Once or twice per year
Quite regularly
Monthly
Daily
Weekly
OtherDon’t know
Picnics / BBQ area
49%
29%
25%
25%
22%
16%
16%
16%
15%
13%
7%
7%
9%
5%
3%Multiple responses allowed
Copyright © 2010 Key Research. Confidential and proprietary.
% of respondents
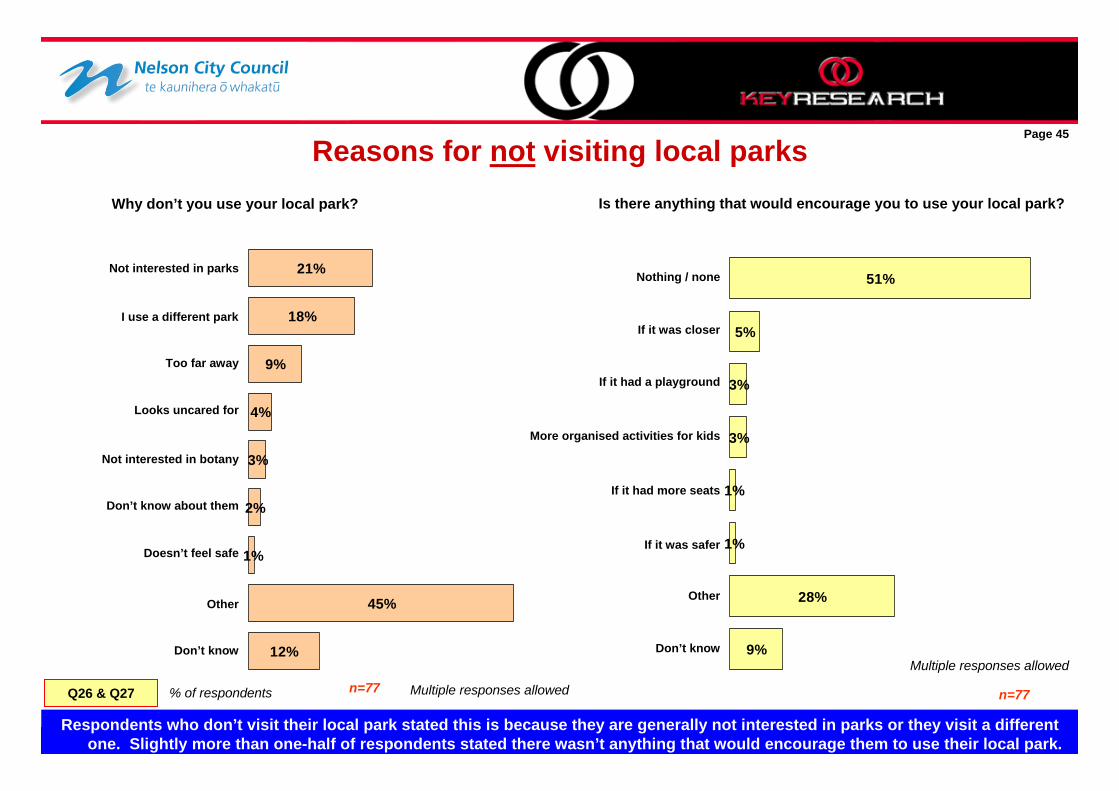
Respondents who don’t visit their local park stated this is because they are generally not interested in parks or they visit a different one. Slightly more than one-half of respondents stated there wasn’t anything that would encourage them to use their local park.
Q26 & Q27 n=77
Page 45
Reasons for not visiting local parksWhy don’t you use your local park?
Not interested in parks
Too far away
Not interested in botany
Don’t know
Doesn’t feel safe
12%
45%
1%
2%
3%
4%
9%
18%
21%
I use a different park
Looks uncared for
Don’t know about them
Other
Is there anything that would encourage you to use your local park?
Nothing / none
If it was closer
More organised activities for kids
Don’t know
If it was safer
9%
28%
1%
1%
3%
3%
5%
51%
If it had a playground
If it had more seats
Other
n=77Multiple responses allowed
Multiple responses allowed
Copyright © 2010 Key Research. Confidential and proprietary.
% of respondents
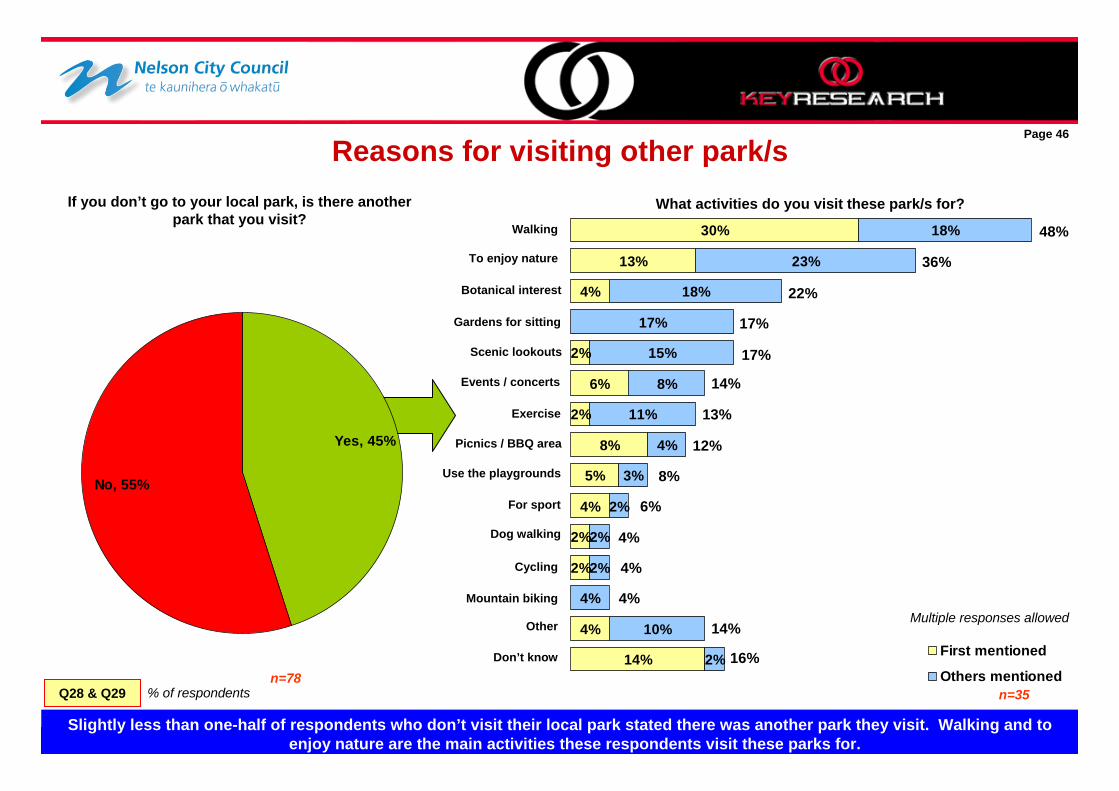
Slightly less than one-half of respondents who don’t visit their local park stated there was another park they visit. Walking and to enjoy nature are the main activities these respondents visit these parks for.
Q28 & Q29 n=35
14%
4%
2%
2%
4%
5%
8%
2%
6%
2%
4%
13%
30%
2%
10%
4%
2%
2%
2%
3%
4%
11%
8%
15%
17%
18%
23%
18%
First mentioned
Others mentioned
Page 46
Reasons for visiting other park/sWhat activities do you visit these park/s for?
To enjoy nature
Gardens for sitting
Exercise
Botanical interest
For sport
Walking
Events / concerts
Don’t know
Dog walking
Use the playgrounds
Mountain biking
Other
Scenic lookouts
Cycling
n=78
If you don’t go to your local park, is there another park that you visit?
Picnics / BBQ areaYes, 45%
No, 55%
48%
36%
22%
17%
17%
14%
13%
12%
8%
6%
4%
4%
14%
4%
16%
Multiple responses allowed
Copyright © 2010 Key Research. Confidential and proprietary.
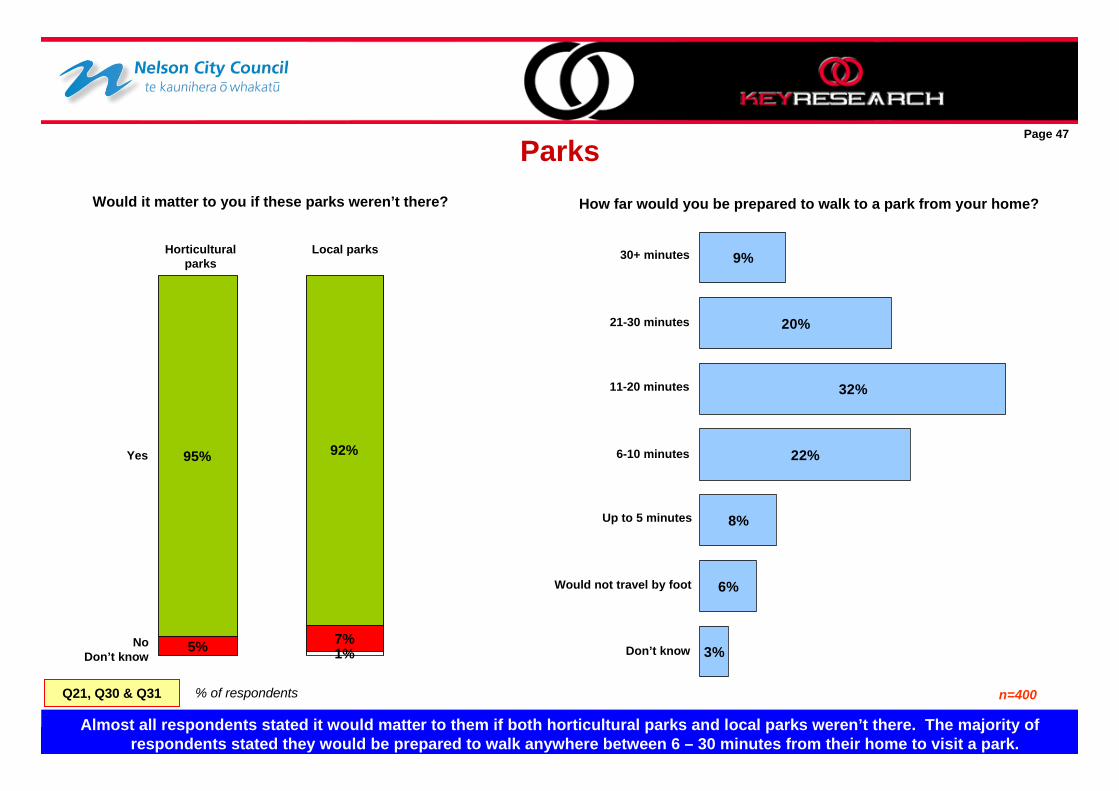
% of respondents
Almost all respondents stated it would matter to them if both horticultural parks and local parks weren’t there. The majority of respondents stated they would be prepared to walk anywhere between 6 – 30 minutes from their home to visit a park.
Q21, Q30 & Q31 n=400
Page 47
Parks
95% 92%
5% 7%1%
Would it matter to you if these parks weren’t there?
Yes
NoDon’t know
Local parksHorticultural parks
3%
6%
8%
22%
32%
20%
9%
How far would you be prepared to walk to a park from your home?
6-10 minutes
Up to 5 minutes
11-20 minutes
Don’t know
Would not travel by foot
21-30 minutes
30+ minutes

Copyright © 2010 Key Research. Confidential and proprietary.
7. Overall Performance
Page 48
Copyright © 2010 Key Research. Confidential and proprietary.
% of respondents
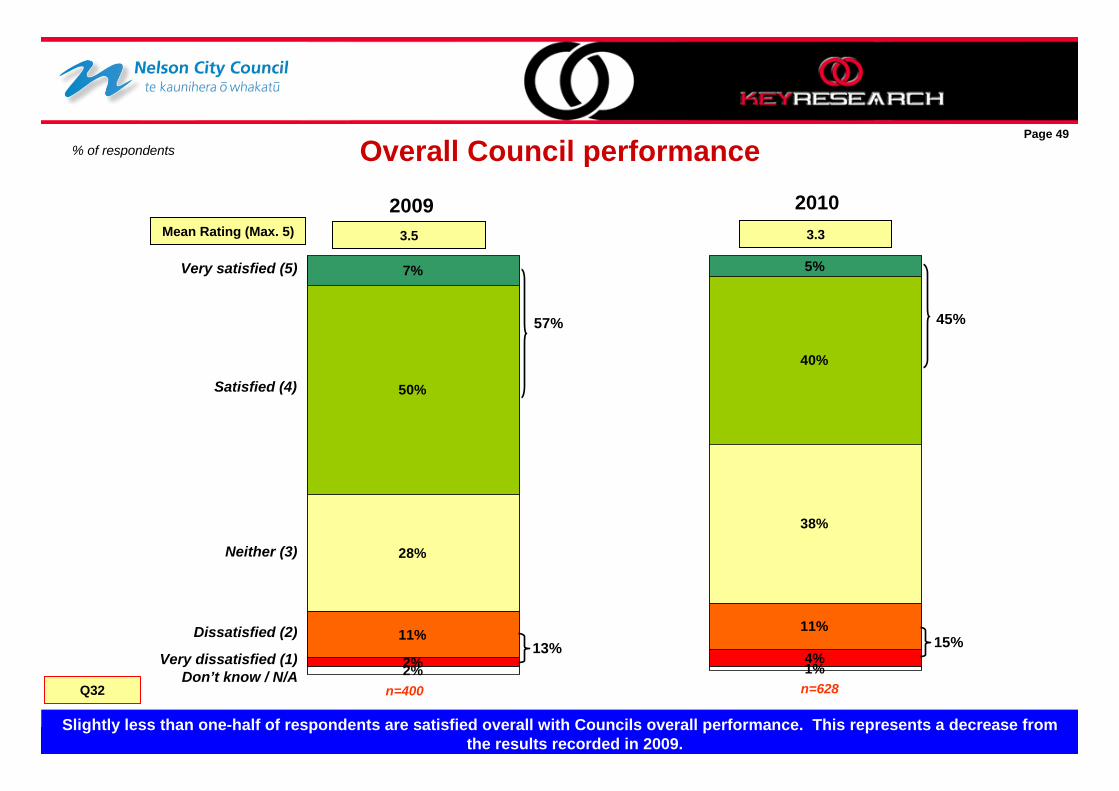
Q32
7% 5%
50%
40%
28%
38%
11% 11%
2% 4%1%2%
45%
3.3
n=628
Mean Rating (Max. 5)
15%Dissatisfied (2)
Very dissatisfied (1)Don’t know / N/A
Satisfied (4)
Very satisfied (5)
Neither (3)
Page 49
Overall Council performance
n=400
57%
13%
3.5
Slightly less than one-half of respondents are satisfied overall with Councils overall performance. This represents a decrease from the results recorded in 2009.
20102009
Copyright © 2010 Key Research. Confidential and proprietary.
% of respondents
45%
3.3
n=628
Mean Rating (Max. 5)
15%
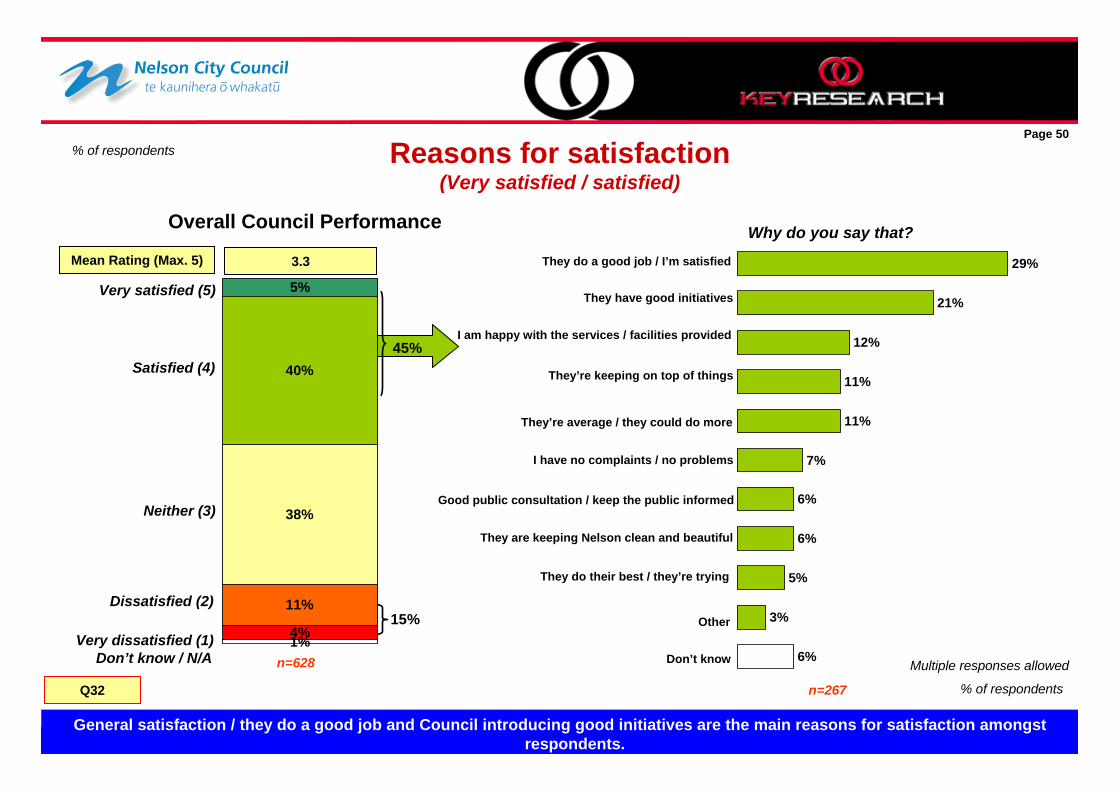
Overall Council Performance
Dissatisfied (2)
Very dissatisfied (1)Don’t know / N/A
Satisfied (4)
Very satisfied (5)
Neither (3)
Page 50
Reasons for satisfaction (Very satisfied / satisfied)
% of respondents
Why do you say that?
n=267
6%
3%
5%
6%
6%
7%
11%
11%
12%
21%
29%
I am happy with the services / facilities provided
They’re keeping on top of things
They are keeping Nelson clean and beautiful
They do a good job / I’m satisfied
They have good initiatives
They’re average / they could do more
I have no complaints / no problems
Don’t know
Good public consultation / keep the public informed
They do their best / they’re trying
Other
General satisfaction / they do a good job and Council introducing good initiatives are the main reasons for satisfaction amongstrespondents.
Q32
5%
40%
38%
11%
4%1%Multiple responses allowed
Copyright © 2010 Key Research. Confidential and proprietary.
% of respondents
45%
3.3
n=628
Mean Rating (Max. 5)
15%
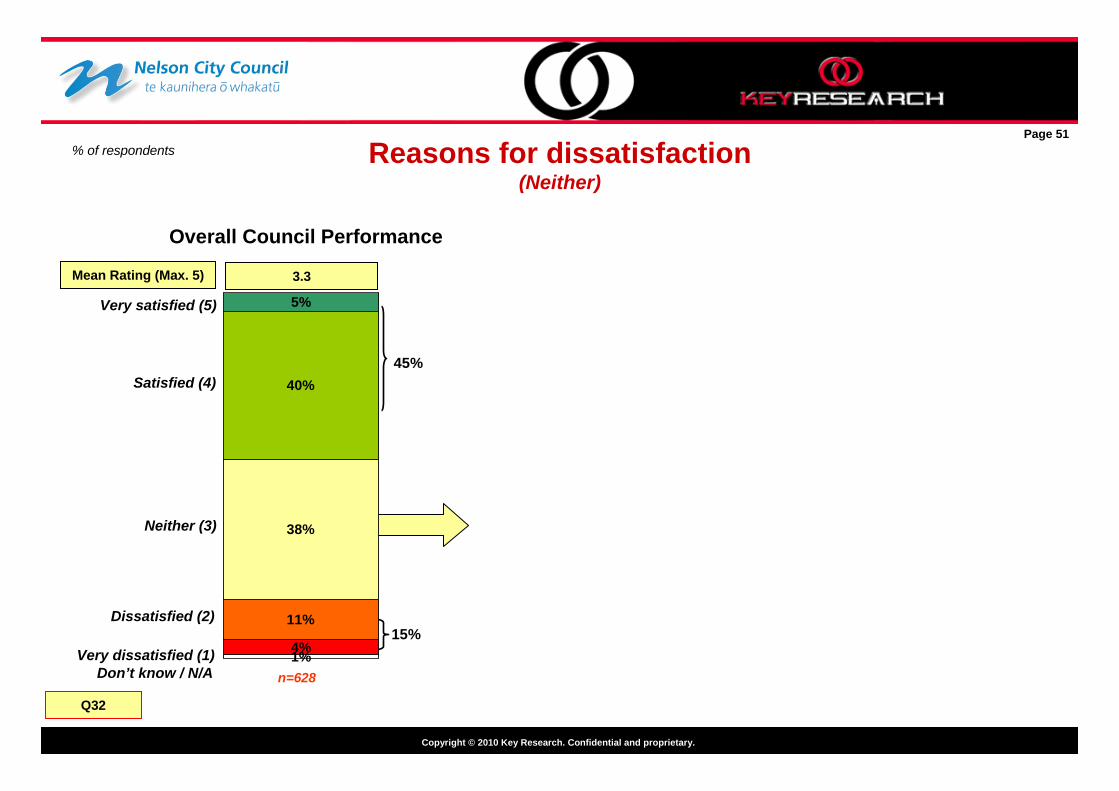
Overall Council Performance
Dissatisfied (2)
Very dissatisfied (1)Don’t know / N/A
Satisfied (4)
Very satisfied (5)
Neither (3)
Page 51
Reasons for dissatisfaction (Neither)
Q32
5%
40%
38%
11%
4%1%
Copyright © 2010 Key Research. Confidential and proprietary.
% of respondents
45%
3.3
n=628
Mean Rating (Max. 5)
15%
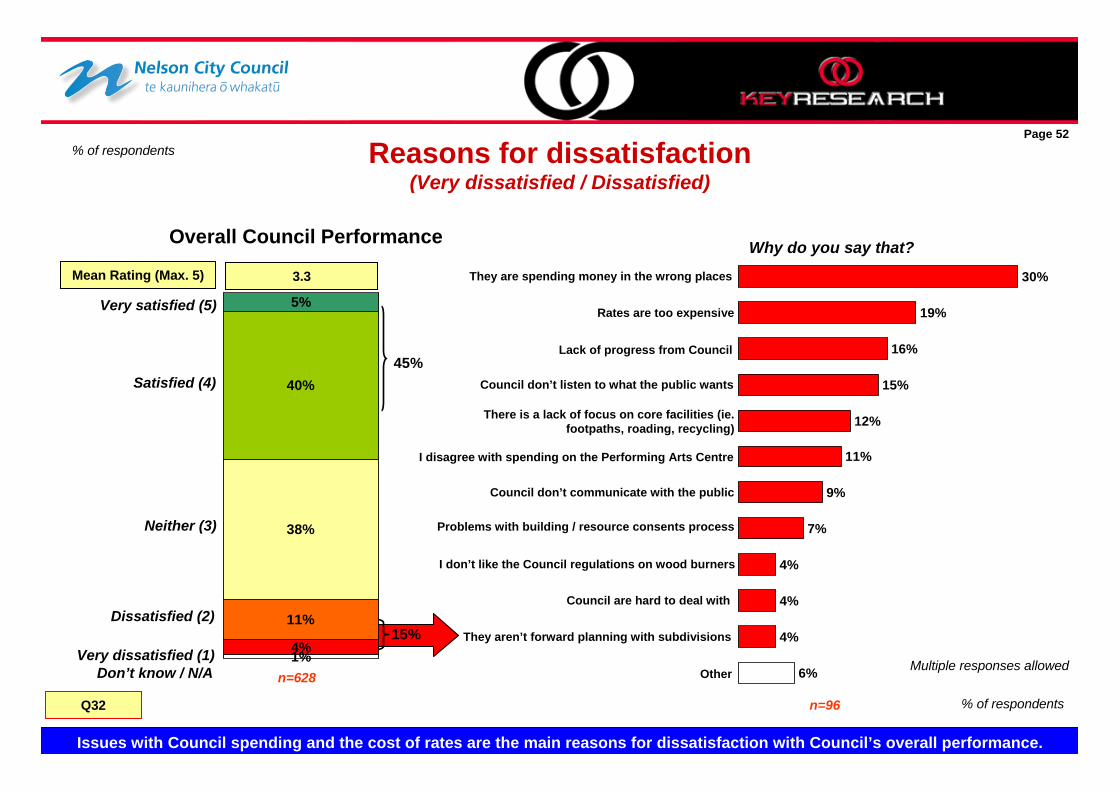
Overall Council Performance
Dissatisfied (2)
Very dissatisfied (1)Don’t know / N/A
Satisfied (4)
Very satisfied (5)
Neither (3)
Page 52
Reasons for dissatisfaction (Very dissatisfied / Dissatisfied)
% of respondents
Why do you say that?
n=96
6%
4%
4%
4%
7%
9%
11%
12%
15%
16%
19%
30%
Lack of progress from Council
There is a lack of focus on core facilities (ie. footpaths, roading, recycling)
Council don’t listen to what the public wants
Council don’t communicate with the public
They are spending money in the wrong places
Rates are too expensive
I disagree with spending on the Performing Arts Centre
Problems with building / resource consents process
Other
I don’t like the Council regulations on wood burners
Council are hard to deal with
They aren’t forward planning with subdivisions
Issues with Council spending and the cost of rates are the main reasons for dissatisfaction with Council’s overall performance.
Q32
5%
40%
38%
11%
4%1% Multiple responses allowed

Copyright © 2010 Key Research. Confidential and proprietary.
8. Value for Money
Page 53
Copyright © 2010 Key Research. Confidential and proprietary.
% of respondentsPage 54
Q37
6%
30%
36%
11%
9%
9%
36%
3.1
n=400
Mean Rating (Max. 5)
20%Disagree (2)
Strongly disagree (1)Don’t know / N/A
Agree (4)
Strongly agree (5)
Neither (3)
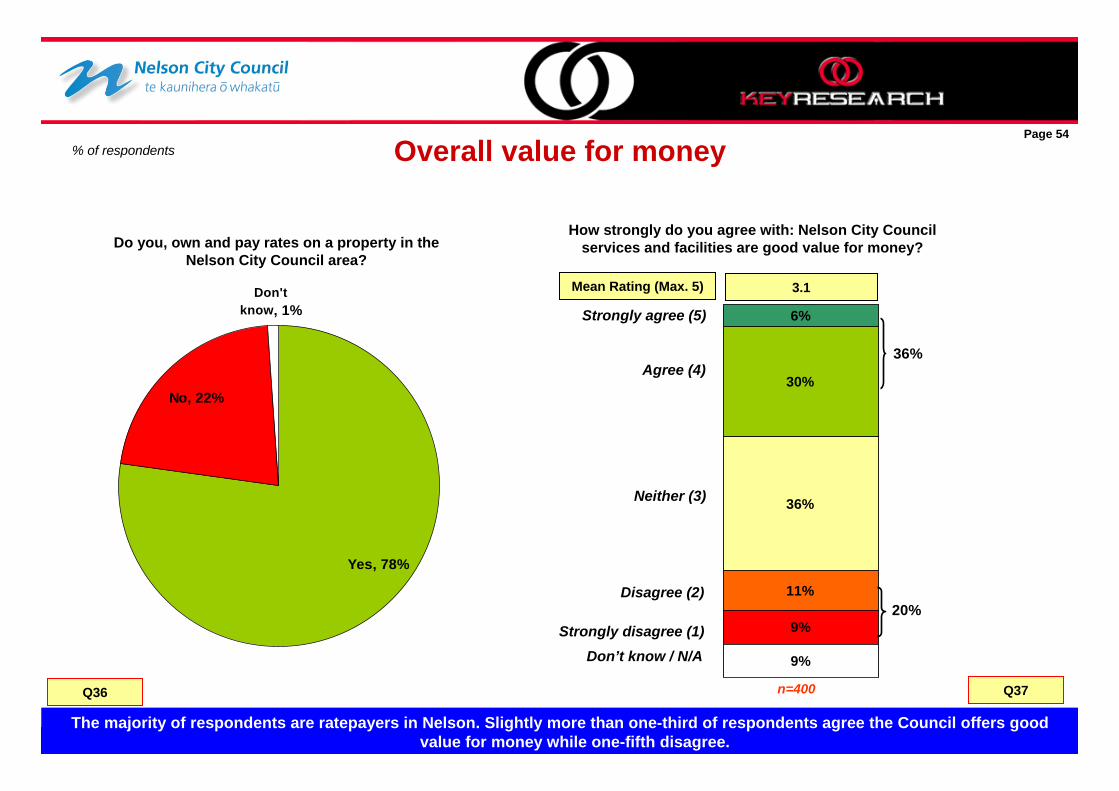
Overall value for money
Do you, own and pay rates on a property in the Nelson City Council area?
Don't know, 1%
No, 22%
Yes, 78%
Q36
How strongly do you agree with: Nelson City Council services and facilities are good value for money?
The majority of respondents are ratepayers in Nelson. Slightly more than one-third of respondents agree the Council offers good value for money while one-fifth disagree.
Copyright © 2010 Key Research. Confidential and proprietary.
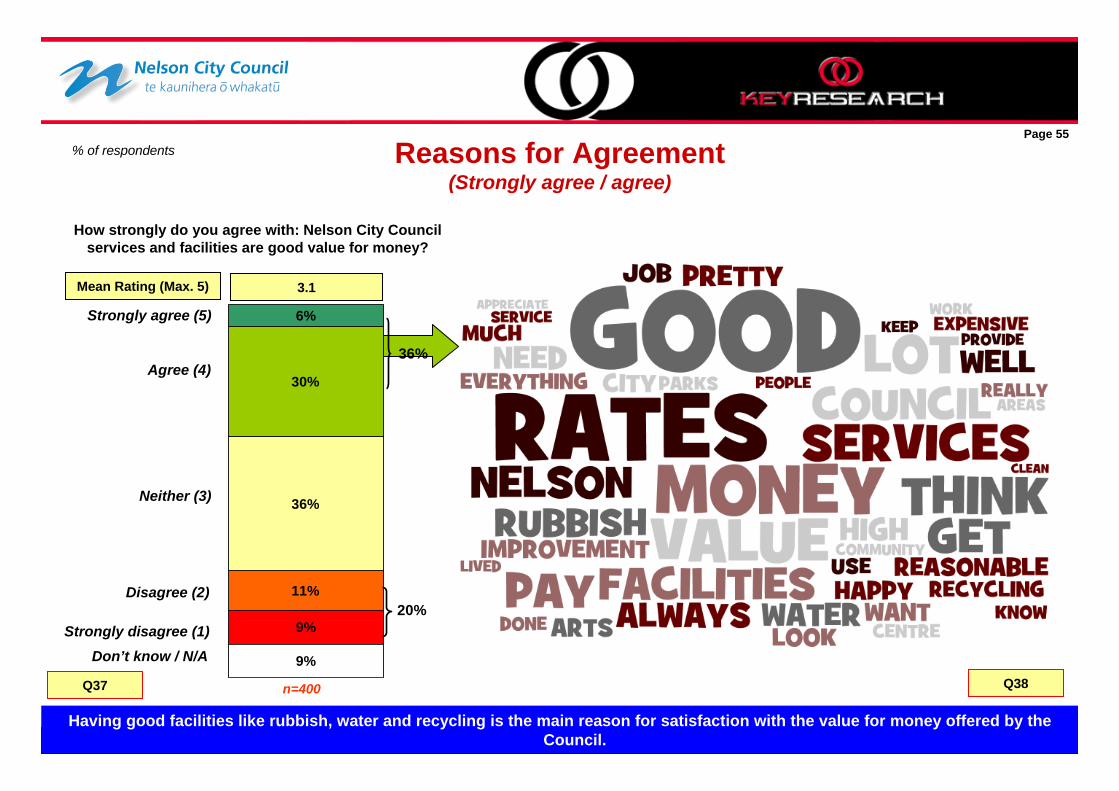
% of respondentsPage 55
Q38
6%
30%
36%
11%
9%
9%
36%
3.1
n=400
Mean Rating (Max. 5)
20%Disagree (2)
Strongly disagree (1)Don’t know / N/A
Agree (4)
Strongly agree (5)
Neither (3)
Q37
How strongly do you agree with: Nelson City Council services and facilities are good value for money?
Reasons for Agreement(Strongly agree / agree)
Having good facilities like rubbish, water and recycling is the main reason for satisfaction with the value for money offered by the Council.
Copyright © 2010 Key Research. Confidential and proprietary.
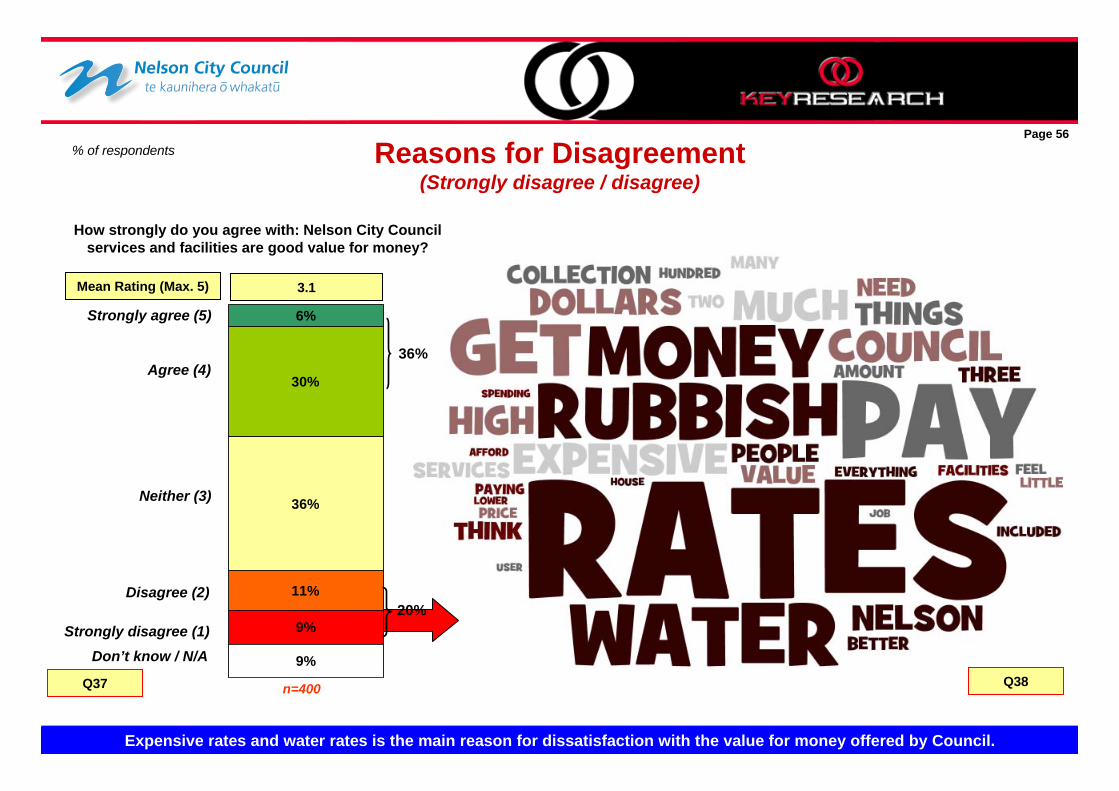
% of respondentsPage 56
Q38
6%
30%
36%
11%
9%
9%
36%
3.1
n=400
Mean Rating (Max. 5)
20%Disagree (2)
Strongly disagree (1)Don’t know / N/A
Agree (4)
Strongly agree (5)
Neither (3)
Q37
How strongly do you agree with: Nelson City Council services and facilities are good value for money?
Reasons for Disagreement(Strongly disagree / disagree)
Expensive rates and water rates is the main reason for dissatisfaction with the value for money offered by Council.
Copyright © 2010 Key Research. Confidential and proprietary.
Page 57
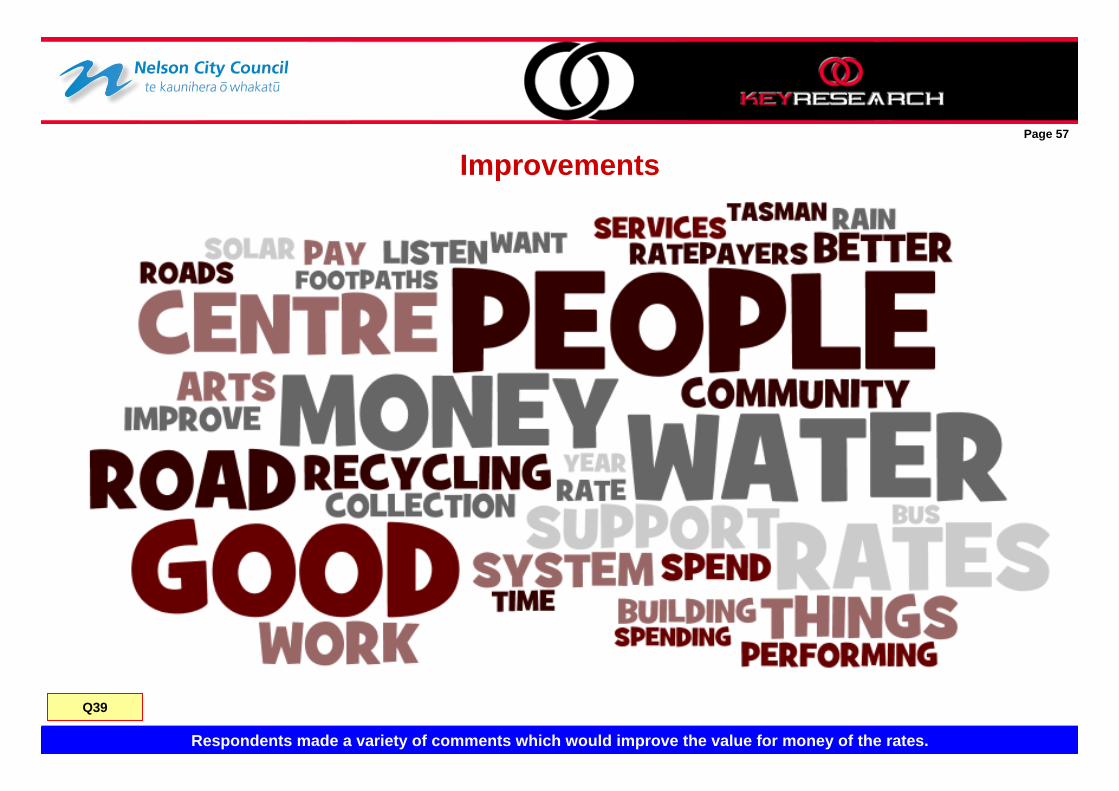
Q39
Improvements
Respondents made a variety of comments which would improve the value for money of the rates.
Copyright © 2010 Key Research. Confidential and proprietary.
9. Sample Profile – Activities/Transport questionnaire
Page 58
Copyright © 2010 Key Research. Confidential and proprietary.
%
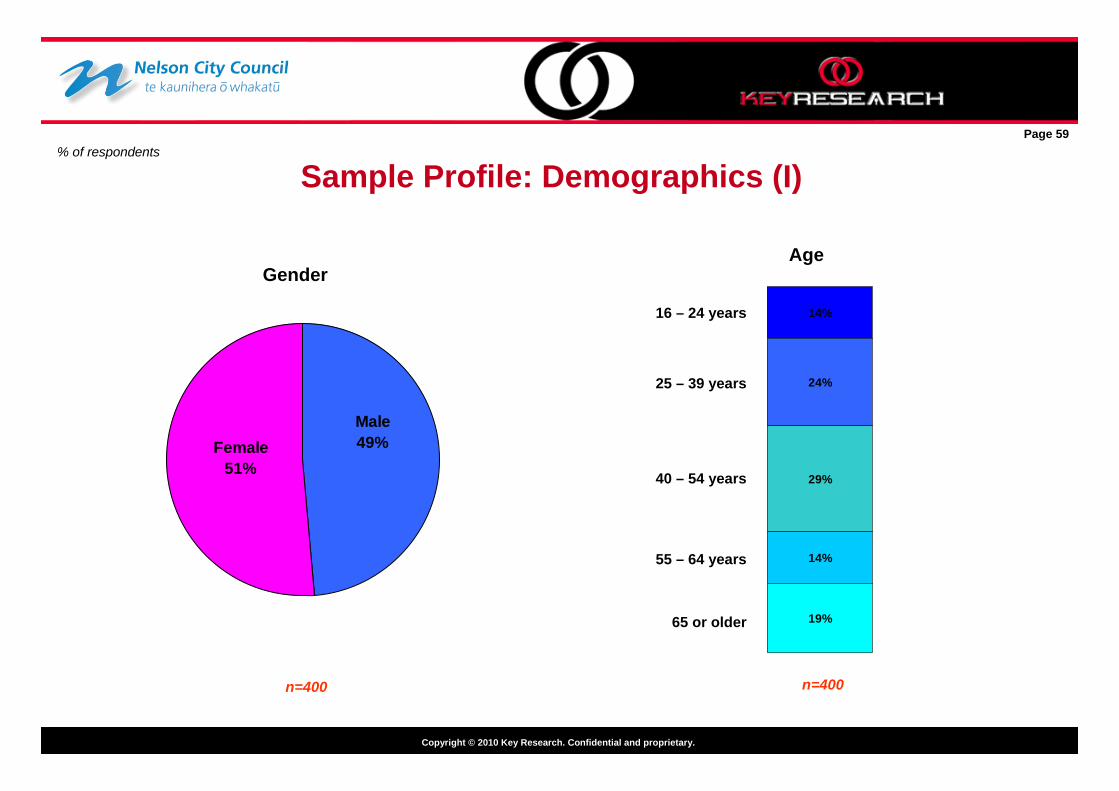
Sample Profile: Demographics (I)% of respondents
Male49%Female
51%
Gender
n=400
14%
24%
29%
14%
19%
Age
16 – 24 years
25 – 39 years
40 – 54 years
55 – 64 years
65 or older
n=400
Page 59

Copyright © 2010 Key Research. Confidential and proprietary.
1%
4%
91%
Sample Profile: Demographics (II)% of respondents
Area
New Zealander
Maori
Other
Ethnicity
n=400 % of respondentsn=400
37%
7%
8%
10%
9%
4%3%4%
12%
4%
Tahunanui
Stoke
Atawhai / Marybank
Inner City
Port HillsThe Brook / Maitai Valley
The WoodWakatu
Other
Page 60
Nelson South
Copyright © 2010 Key Research. Confidential and proprietary.
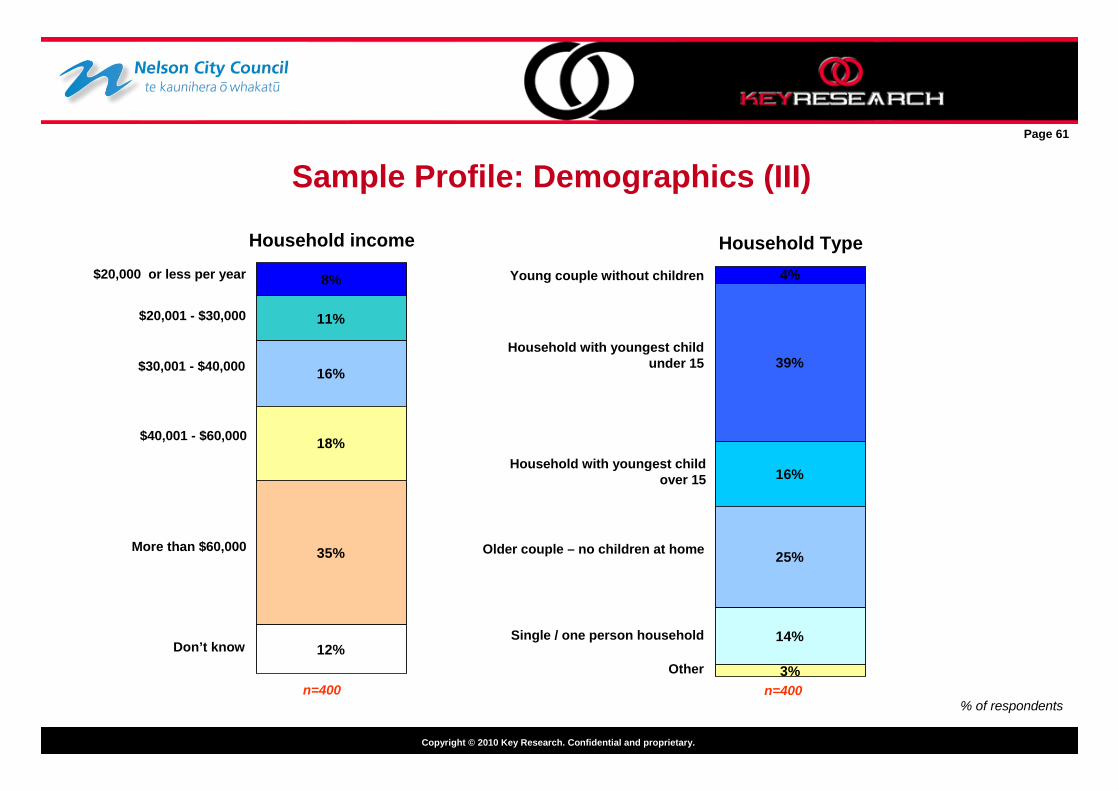
% of respondents
Household income
n=400
8%
11%
16%
18%
35%
12%Don’t know
$20,001 - $30,000
$20,000 or less per year
Household Type
n=400
4%
39%
16%
25%
14%
3%
Single / one person household
Other
Older couple – no children at home
Household with youngest child under 15
Young couple without children
Sample Profile: Demographics (III)
$30,001 - $40,000
$40,001 - $60,000
More than $60,000
Page 61
Household with youngest child over 15
Copyright © 2010 Key Research. Confidential and proprietary.
- PART TWO -
10. Sustainability
Page 62
Copyright © 2010 Key Research. Confidential and proprietary.
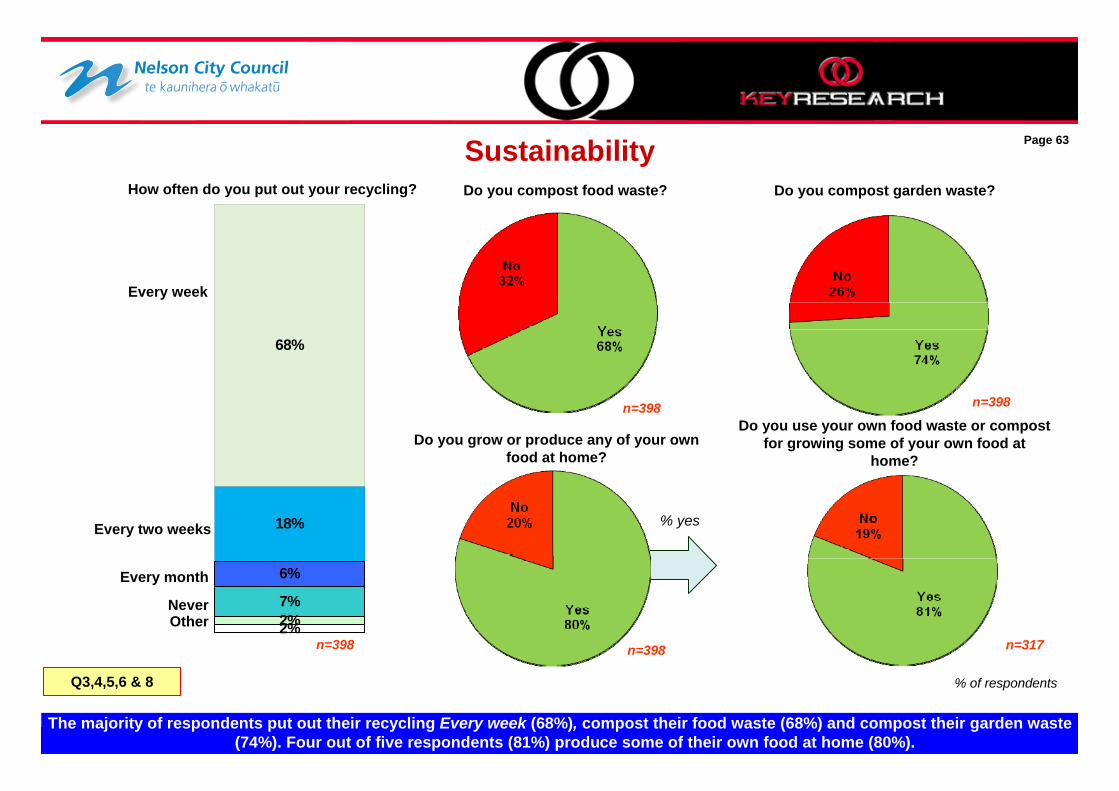
Sustainability
Q3,4,5,6 & 8
The majority of respondents put out their recycling Every week (68%), compost their food waste (68%) and compost their garden waste (74%). Four out of five respondents (81%) produce some of their own food at home (80%).
Do you compost food waste? Do you compost garden waste?
Do you grow or produce any of your own food at home?
Do you use your own food waste or compost for growing some of your own food at
home?
n=317
% of respondents
Page 63
68%
18%
6%
7%2%2%
Every week
Every two weeks
Every month
NeverOther
How often do you put out your recycling?
n=398 n=398
n=398n=398
% yes
Copyright © 2010 Key Research. Confidential and proprietary.
% of respondents
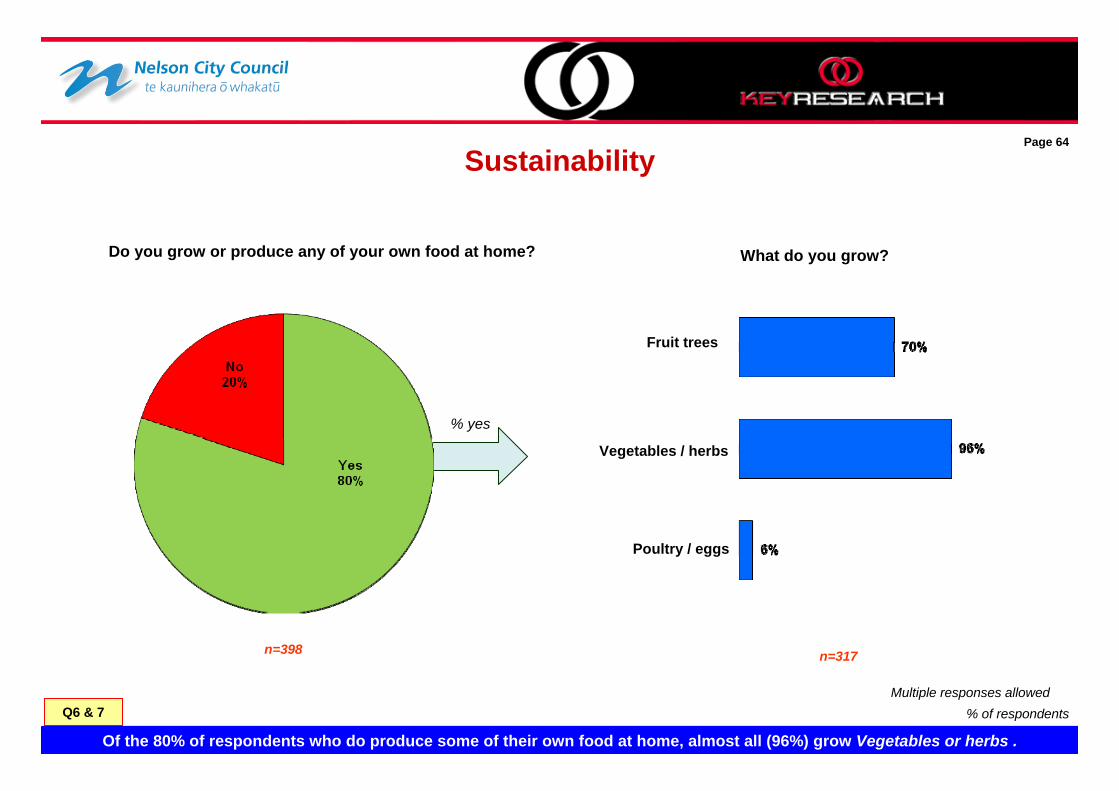
Of the 80% of respondents who do produce some of their own food at home, almost all (96%) grow Vegetables or herbs .
Q6 & 7
What do you grow?
% yes
Fruit trees
Poultry / eggs
Vegetables / herbs
n=398 n=317
Page 64
Do you grow or produce any of your own food at home?
Sustainability
Multiple responses allowed
Copyright © 2010 Key Research. Confidential and proprietary.
11. Environment
Page 65
Copyright © 2010 Key Research. Confidential and proprietary.
Environment
% of respondents
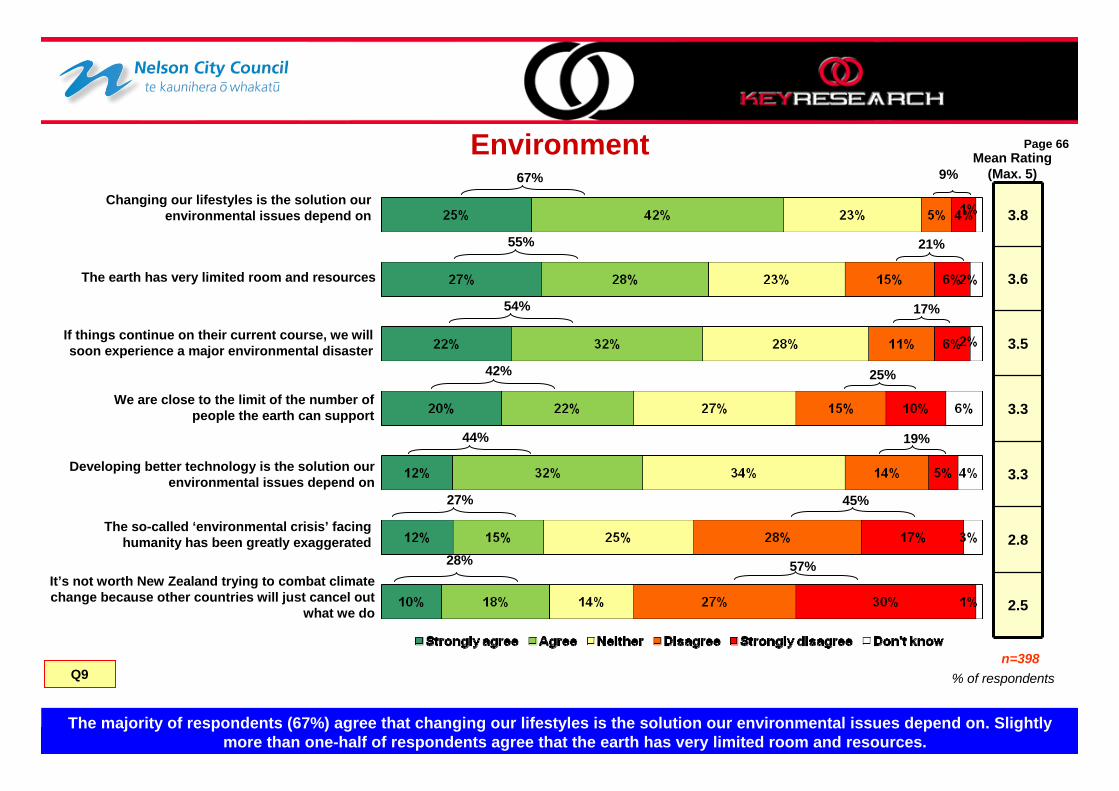
The majority of respondents (67%) agree that changing our lifestyles is the solution our environmental issues depend on. Slightly more than one-half of respondents agree that the earth has very limited room and resources.
Q9
If things continue on their current course, we will soon experience a major environmental disaster
Developing better technology is the solution our environmental issues depend on
The so-called ‘environmental crisis’ facing humanity has been greatly exaggerated
The earth has very limited room and resources
We are close to the limit of the number of people the earth can support
Page 66
3.8
3.6
3.5
3.3
3.3
2.8
2.5
Mean Rating (Max. 5)
28%
Changing our lifestyles is the solution our environmental issues depend on
It’s not worth New Zealand trying to combat climate change because other countries will just cancel out
what we do
67%
27%
42%
44%
54%
55%
n=398
9%
21%
17%
25%
19%
45%
57%
Copyright © 2010 Key Research. Confidential and proprietary.
57% 39% 4%
Very urgent Somewhat urgent Not at all urgent
1%
2%
15%
2%
11%
70%
3%
3%
12%
18%
32%
34%
13%
6%
First mentioned Others mentioned
How urgent would you say it is to take steps to take care of the environment?
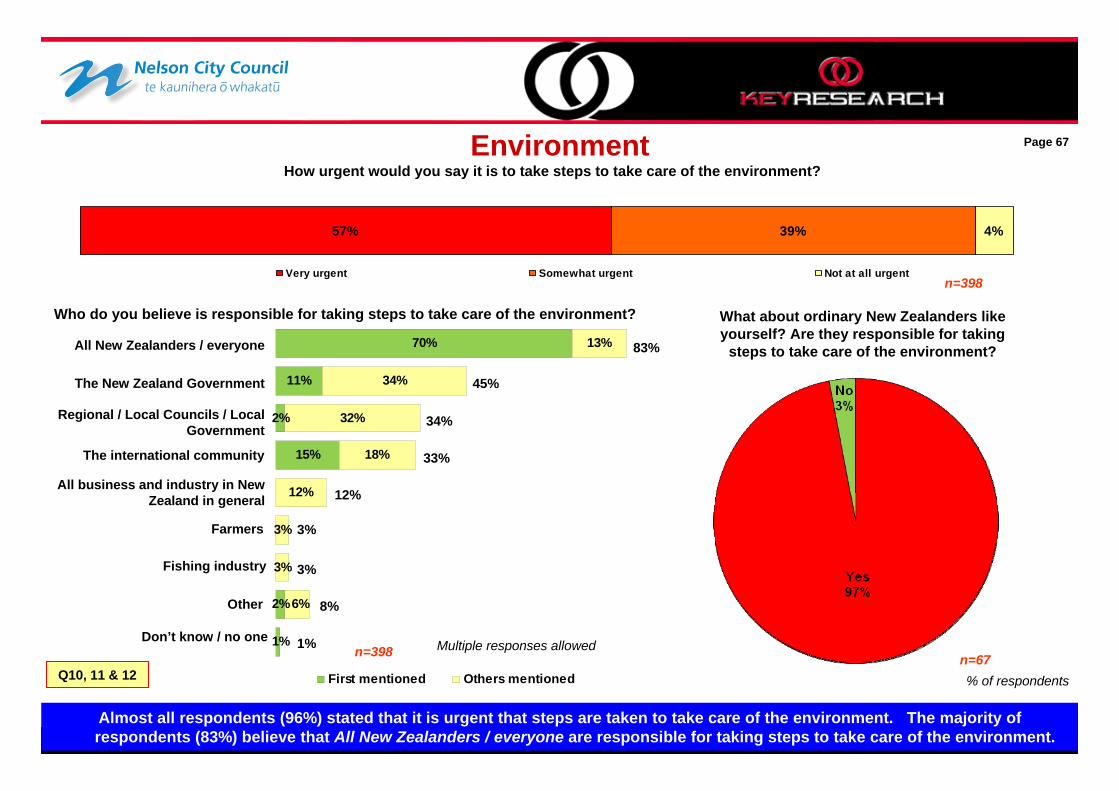
% of respondents
Almost all respondents (96%) stated that it is urgent that steps are taken to take care of the environment. The majority of respondents (83%) believe that All New Zealanders / everyone are responsible for taking steps to take care of the environment.
Q10, 11 & 12
Other
All New Zealanders / everyone
Regional / Local Councils / Local Government
Don’t know / no one
All business and industry in New Zealand in general
Page 67
The New Zealand Government
The international community
Farmers
Fishing industry
1%
8%
83%
12%
3%
3%
34%
45%
33%
Who do you believe is responsible for taking steps to take care of the environment? What about ordinary New Zealanders like yourself? Are they responsible for taking
steps to take care of the environment?
n=398
Environment
n=67n=398 Multiple responses allowed

Copyright © 2010 Key Research. Confidential and proprietary.
Attitudes to taking care of the environment
% of respondents
The majority of respondents agree that people have a responsibility to look after the environment for future generations (89%). Only 6% of respondents stated they would be embarrassed if their friends thought their lifestyle was purposefully environmentally friendly.
Q13
The effects of climate change are too far in the future to really worry me
It’s not worth me doing things to help the environment if others don’t do the same
People have a responsibility to look after the environment for future generations
It’s only worth doing environmentally friendly things if they save you money
It would embarrass me if my friends thought my lifestyle was purposefully environmentally friendly
Page 68
4.5
4.1
3.0
2.9
2.7
2.5
2.5
2.3
2.0
2.1
2.1
1.9
1.7
Mean Rating (Max. 5)
I find it hard to change my habits to be more environmentally friendly
I don’t pay much attention to the amount of water I use at home
26%
People have a duty to recycle
I don’t really give much thought to saving energy in my home
I would only travel by bus if I had no other choice
People who fly should bear the cost of the environmental damage that air travel causes
For the sake of the environment, car users should pay higher taxes
For the sake of the environment, I would pay more taxes
19%
32%
39%
16%
20%
77%
18%
6%
11%
15%
7%
89%
n=398
Environment
84%
78%
76%
71%
75%
69%
56%
35%
49%
8%
5%
52%
42%
Copyright © 2010 Key Research. Confidential and proprietary.
I do one or two things
Most things I do are environ-
mentally friendly
Everything I do is environmentally friendly
I don’t really do anything that is environmentally
friendly
n=398 8%
5%
1%
2%
3%
3%
4%
4%
4%
6%
7%
8%
12%
14%
23%
42%
68%
Which of these best describes how you feel about your current lifestyle and the
environment?
I do quite a few things
Which of these would you say best describes your current lifestyle in relation to the
environment?
How have you mainly found out about doing these things?
The media
Friends and familyInformation from the Local
Council
Information for Manufacturers and retailers
The internet
Environmental groups
Through school / education
Scientific research organisations
Ecofest
Community groups
Common sense
Consumer organisations
Through work
Home and garden shows
Other
Don’t know / no one
Trades people
Environment
% of respondents
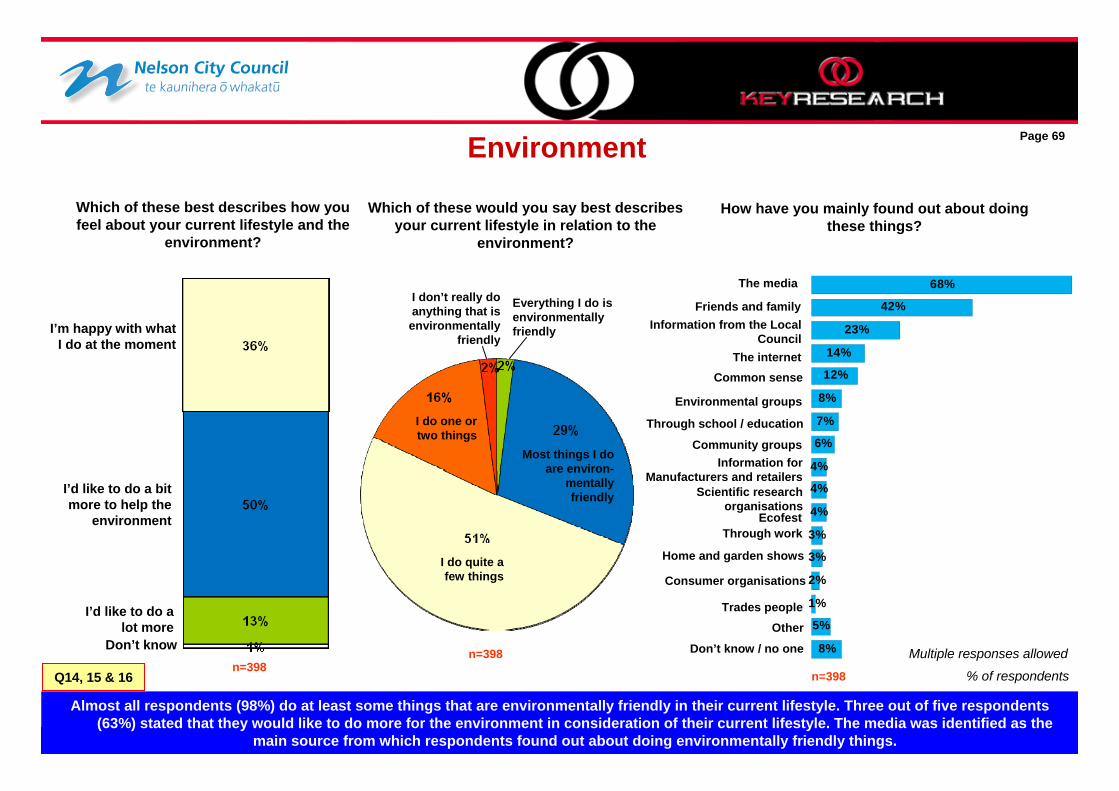
Almost all respondents (98%) do at least some things that are environmentally friendly in their current lifestyle. Three out of five respondents (63%) stated that they would like to do more for the environment in consideration of their current lifestyle. The media was identified as the
main source from which respondents found out about doing environmentally friendly things.
Q14, 15 & 16n=398
n=398
Multiple responses allowed
Page 69
I’m happy with what I do at the moment
I’d like to do a bit more to help the
environment
I’d like to do a lot more
Don’t know
Copyright © 2010 Key Research. Confidential and proprietary.
4%
4%
2%
6%
6%
9%
14%
14%
18%
44%
12%
15%
23%
29%
25%
35%
42%
52%
49%
45%
24%
29%
29%
27%
37%
28%
27%
22%
23%
9%
39%
32%
29%
25%
19%
21%
13%
7%
8%
1%
18%
19%
16%
13%
9%
7%
3%
3%
1%
3%
2%
2%
5%
1%
1%
2%
1%
Strongly agree Agree NeitherDisagree Strongly disagree Don't know % of respondents
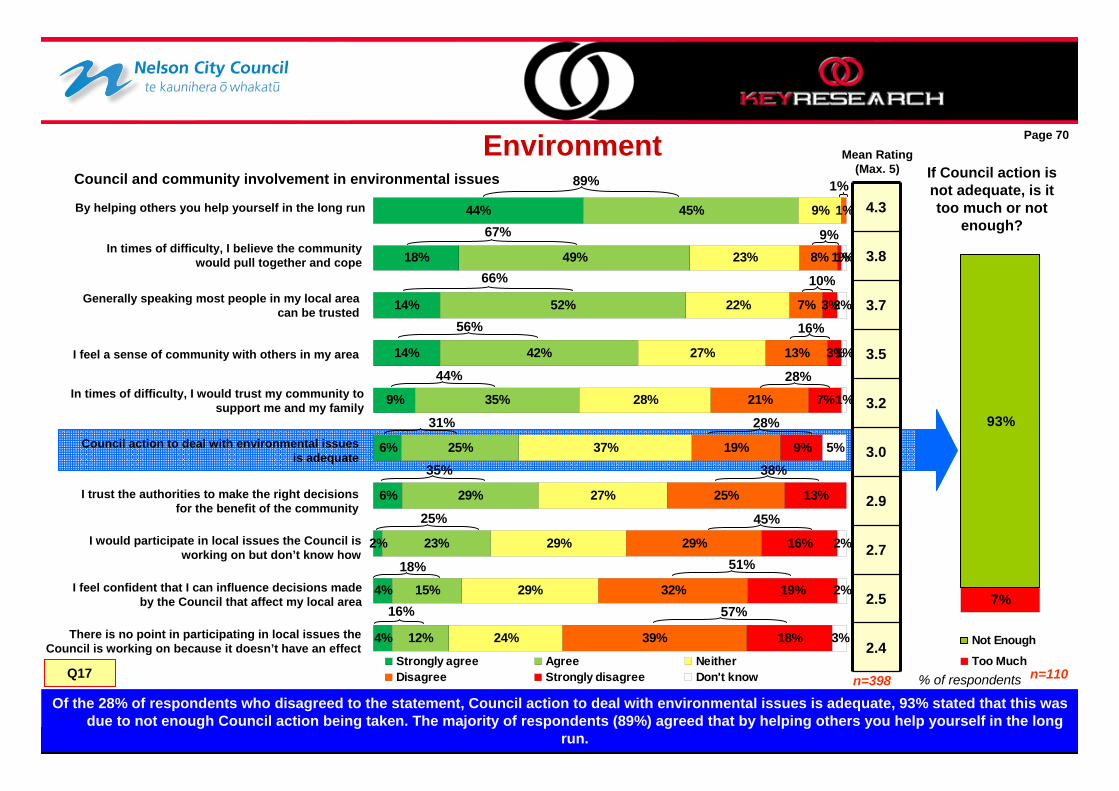
Of the 28% of respondents who disagreed to the statement, Council action to deal with environmental issues is adequate, 93% stated that this was due to not enough Council action being taken. The majority of respondents (89%) agreed that by helping others you help yourself in the long
run.
Q17
I feel a sense of community with others in my area
By helping others you help yourself in the long run
Page 70
4.3
3.8
3.7
3.5
3.2
3.0
2.9
2.7
2.5
2.4
Mean Rating (Max. 5)
Generally speaking most people in my local area can be trusted
In times of difficulty, I would trust my community to support me and my family
n=398
In times of difficulty, I believe the community would pull together and cope
I would participate in local issues the Council is working on but don’t know how
There is no point in participating in local issues the Council is working on because it doesn’t have an effect
I feel confident that I can influence decisions made by the Council that affect my local area
I trust the authorities to make the right decisions for the benefit of the community
Council action to deal with environmental issues is adequate
7%
93%
Not Enough
Too Much
If Council action is not adequate, is it too much or not
enough?
n=110
Council and community involvement in environmental issues
Environment89%
67%
66%
56%
44%
31%
35%
25% 45%
38%
28%
28%
16%
10%
9%
1%
51%
57%
18%
16%
Copyright © 2010 Key Research. Confidential and proprietary.
Which, of the following types of organisations or groups do you belong to?
A church group
An environmental group
A Rotary or other service club
Sports group
Parents group
Support groups
Neighbourhood / community group
None
Any other group or volunteer organisation
General interest group
Would you support Council making it compulsory to install a rain water collection
system on new homes?
Would you support Council providing incentives to encourage households to install a rain water collection system on
existing homes?
Environment
n=398 n=398 n=398% of respondents
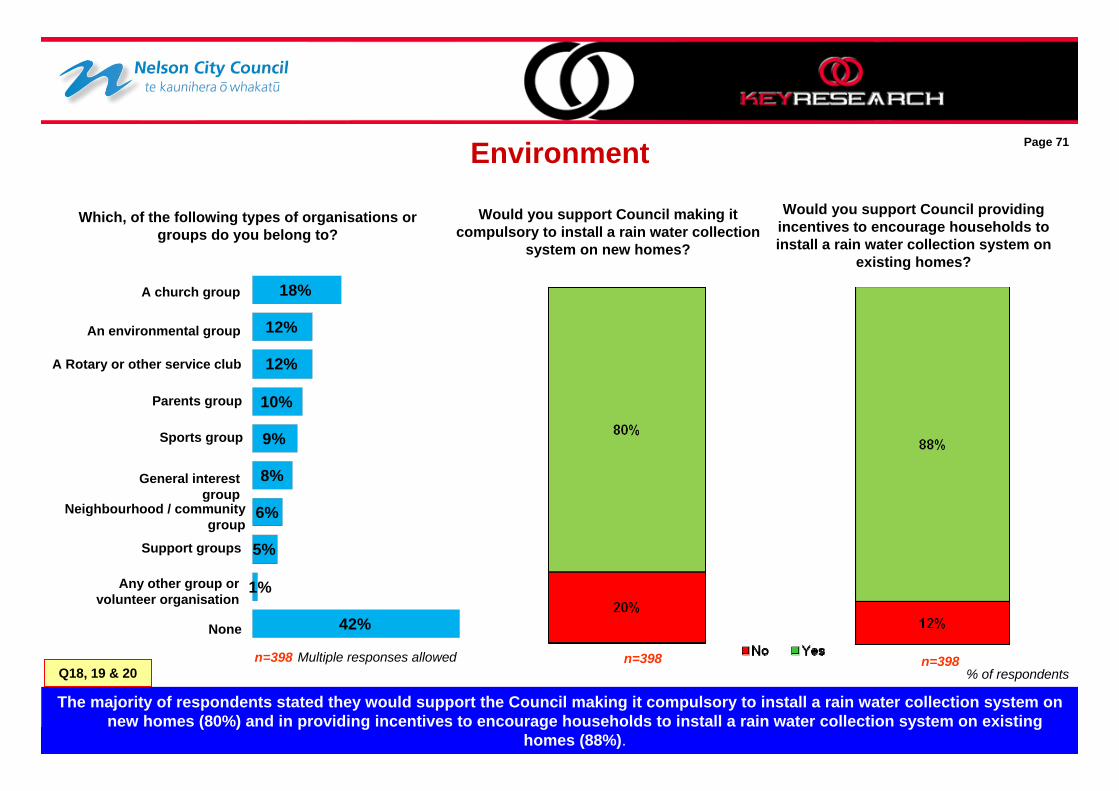
The majority of respondents stated they would support the Council making it compulsory to install a rain water collection system on new homes (80%) and in providing incentives to encourage households to install a rain water collection system on existing
homes (88%).
Q18, 19 & 20
Page 71
Multiple responses allowed
42%
1%
5%
6%
8%
9%
10%
12%
12%
18%
Copyright © 2010 Key Research. Confidential and proprietary.
12. Nelson Development
Page 72
Copyright © 2010 Key Research. Confidential and proprietary.
% of respondents
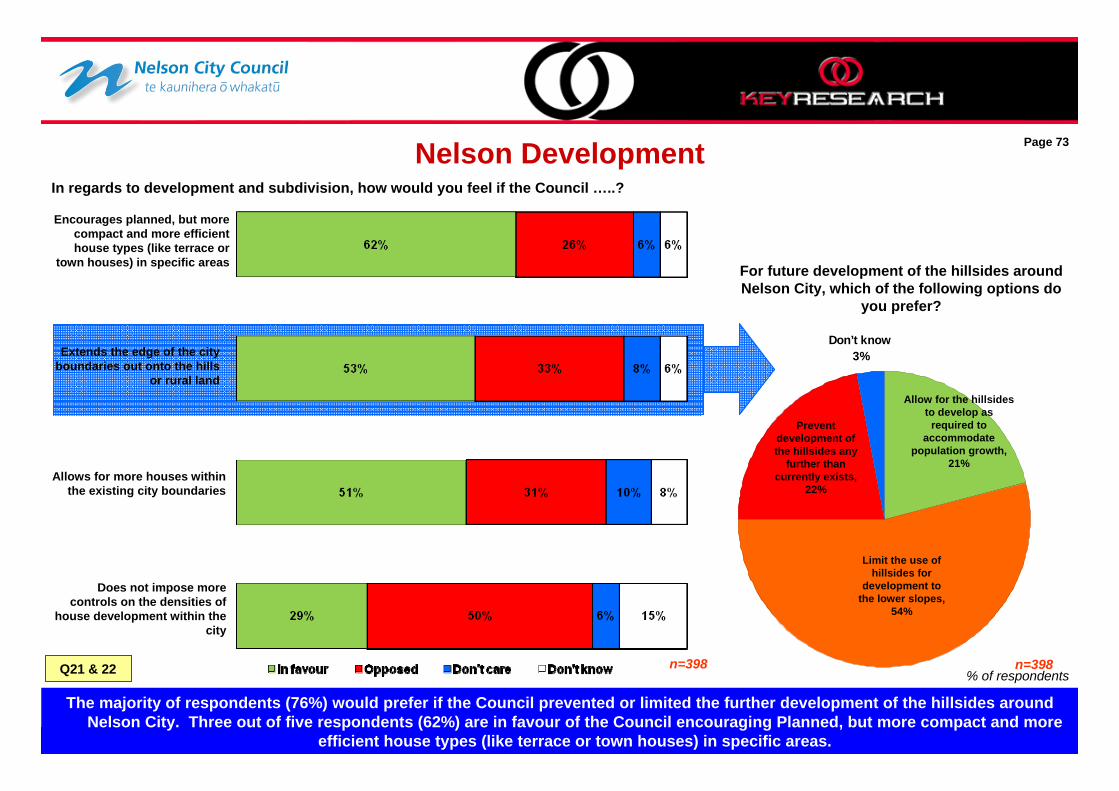
The majority of respondents (76%) would prefer if the Council prevented or limited the further development of the hillsides around Nelson City. Three out of five respondents (62%) are in favour of the Council encouraging Planned, but more compact and more
efficient house types (like terrace or town houses) in specific areas.
Q21 & 22
Page 73
Extends the edge of the city boundaries out onto the hills
or rural land
Allows for more houses within the existing city boundaries
Encourages planned, but more compact and more efficient house types (like terrace or
town houses) in specific areas
Does not impose more controls on the densities of
house development within the city
Don’t know3%
For future development of the hillsides around Nelson City, which of the following options do
you prefer?
In regards to development and subdivision, how would you feel if the Council …..?
n=398 n=398
Nelson Development
Prevent development of the hillsides any
further than currently exists,
22%
Allow for the hillsides to develop as
required to accommodate
population growth, 21%
Limit the use of hillsides for
development to the lower slopes,
54%
Copyright © 2010 Key Research. Confidential and proprietary.
13. Home Heating
Page 74
Copyright © 2010 Key Research. Confidential and proprietary.
Wood burner
Heat pump
Plug in (portable) electrical heating
Flued gas burner
Unflued (portable) gas burner
Central heating
Pellet burner
Don’t know
Other
Open fire
Home Heating
n=398
% of respondents
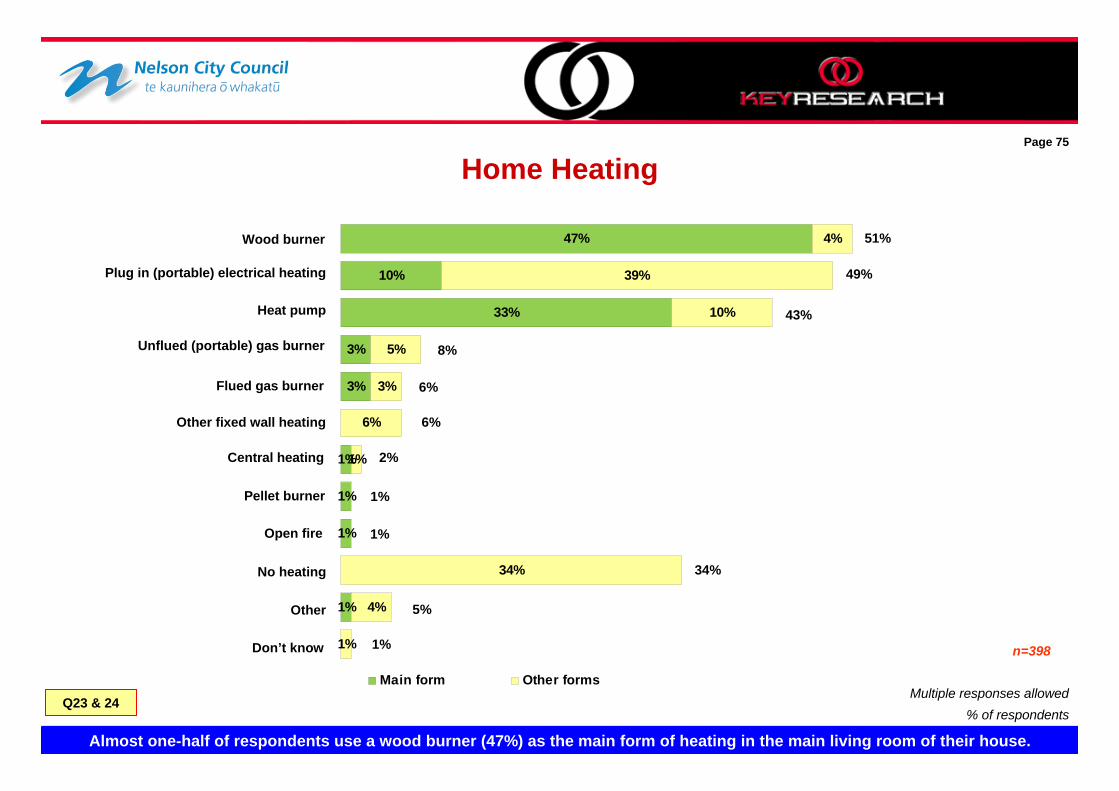
Almost one-half of respondents use a wood burner (47%) as the main form of heating in the main living room of their house.
Q23 & 24
Page 75
Multiple responses allowed
No heating
Other fixed wall heating
1%
1%
1%
1%
3%
3%
33%
10%
47%
1%
34%
1%
6%
3%
5%
10%
39%
4%
4%
Main form Other forms
1%
1%
51%
6%
2%
6%
43%
49%
8%
34%
5%
1%
Copyright © 2010 Key Research. Confidential and proprietary.
Yes20%
No80%
Don't Know
1%
For what reasons did you stop using it?
Council regulations
Installed a new heating system
Moved house
Concern for the environment / air quality
Wasn’t efficient enough
Broke or got run down
Don’t know
Other
Too much hassle / work
Have you stopped using an enclosed wood or multi-fuel burner in your home in the last three years?
Home Heating
n=398n=78
% of respondents
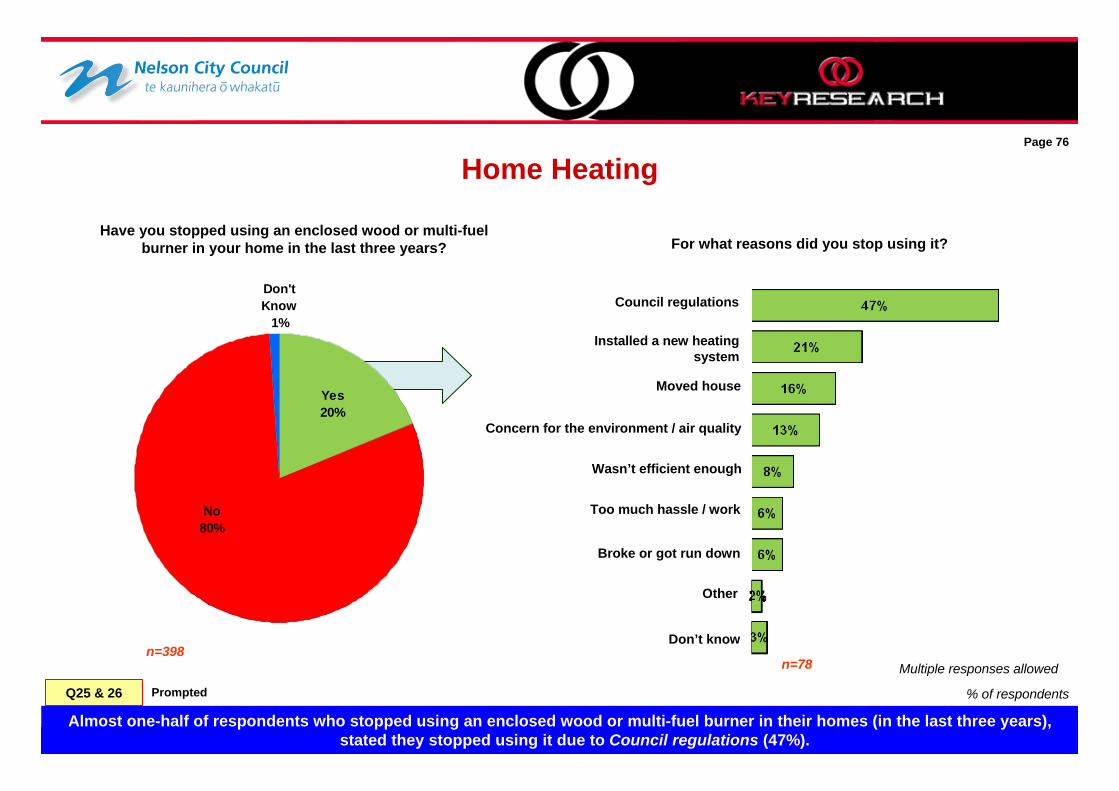
Almost one-half of respondents who stopped using an enclosed wood or multi-fuel burner in their homes (in the last three years), stated they stopped using it due to Council regulations (47%).
Q25 & 26 Prompted
Page 76
Multiple responses allowed

Copyright © 2010 Key Research. Confidential and proprietary.
14. Sample Profile - Environment
Page 77
Copyright © 2010 Key Research. Confidential and proprietary.
%
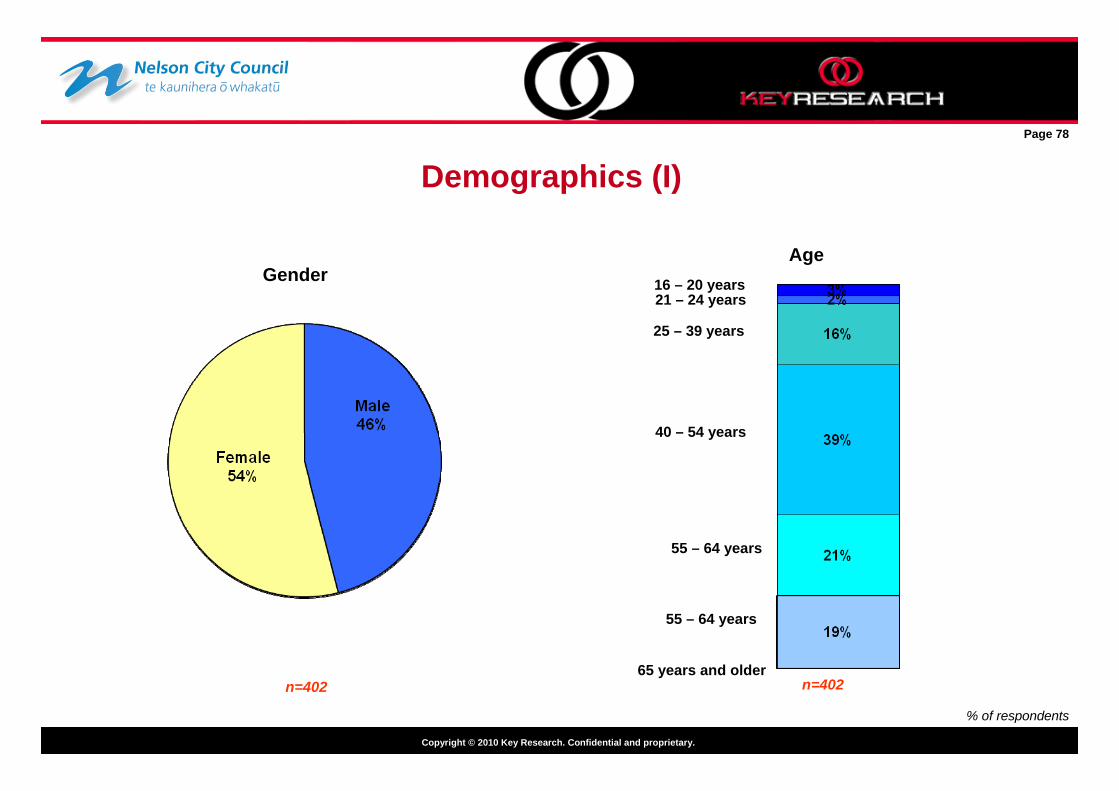
Demographics (I)
% of respondents
Gender
n=402
Age
n=402
Page 78
16 – 20 years21 – 24 years
25 – 39 years
40 – 54 years
55 – 64 years
55 – 64 years
65 years and older
Copyright © 2010 Key Research. Confidential and proprietary.
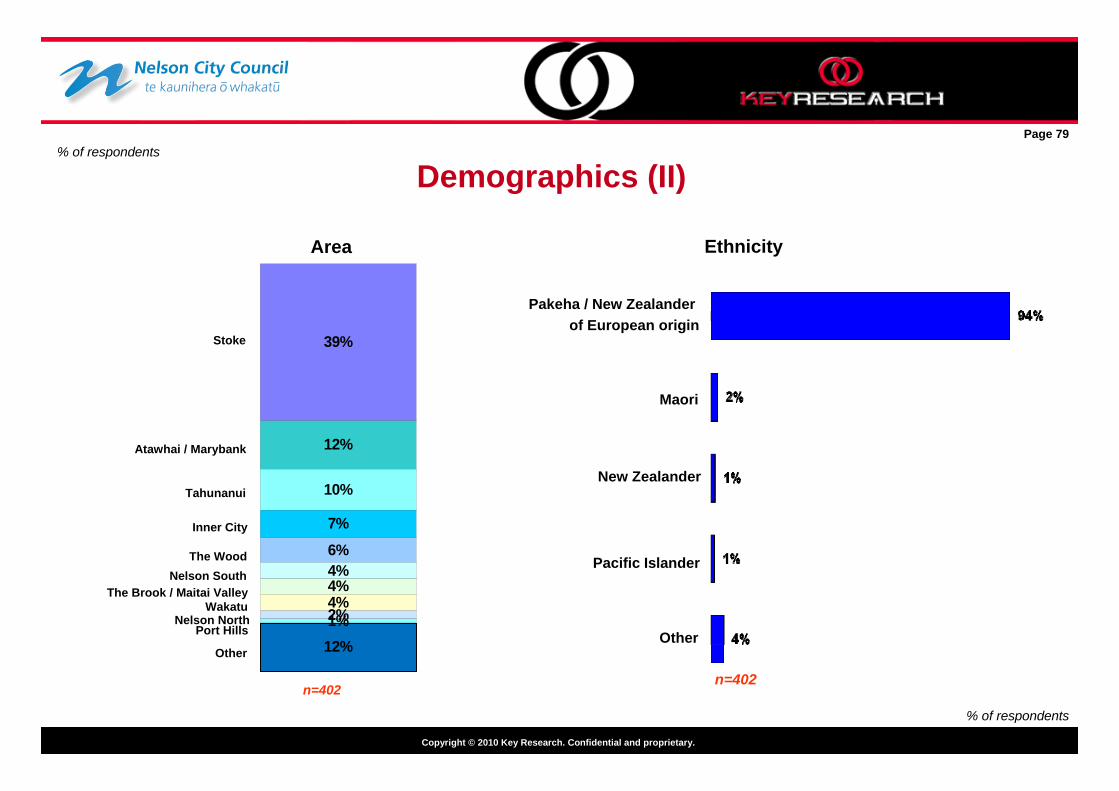
Demographics (II)% of respondents
Area Ethnicity
n=402
% of respondents
n=402
39%
12%
10%
7%6%4%4%4%2%1%12%
Tahunanui
Stoke
Atawhai / Marybank
Inner City
Port Hills
Page 79
Nelson South
Other
The Wood
The Brook / Maitai ValleyWakatu
Nelson North
New Zealander
Maori
Other
Pacific Islander
Pakeha / New Zealander of European origin
Copyright © 2010 Key Research. Confidential and proprietary.
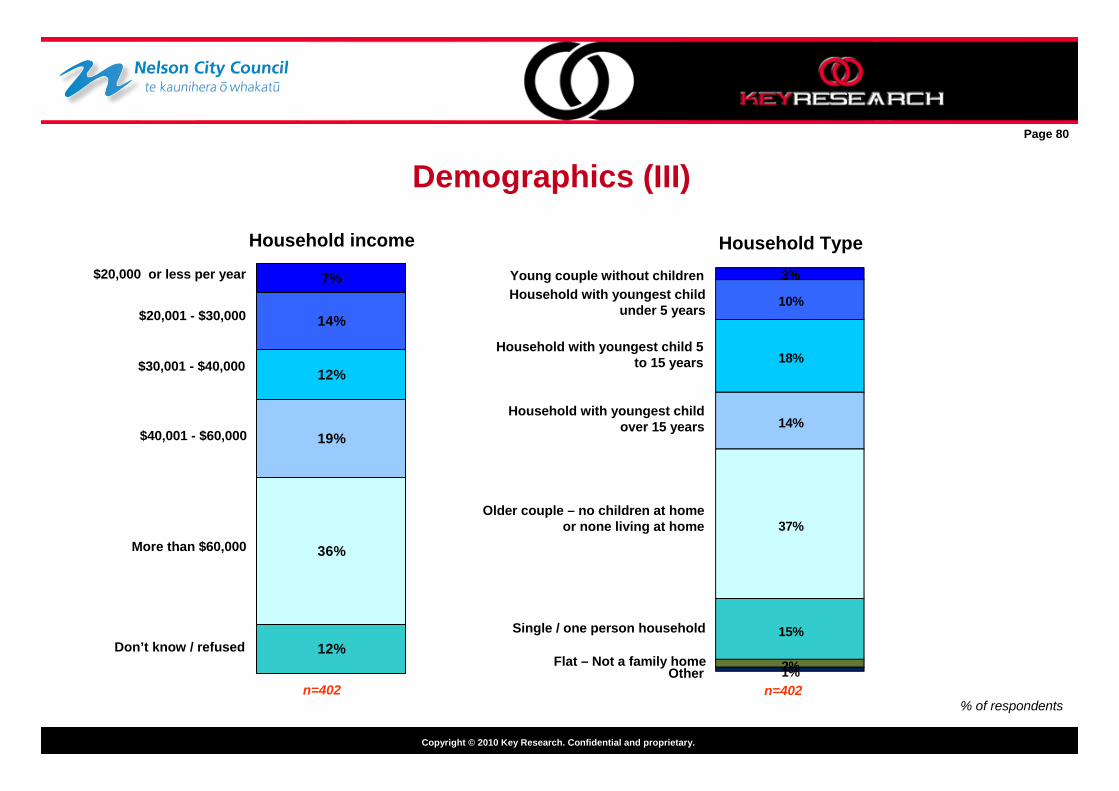
% of respondents
Household income
n=402
7%
14%
12%
19%
36%
12%Don’t know / refused
$20,001 - $30,000
$20,000 or less per year
Household Type
n=402
3%
10%
18%
14%
37%
15%
2%1%
Single / one person household
Other
Older couple – no children at home or none living at home
Household with youngest child under 5 years
Young couple without children
Demographics (III)
$30,001 - $40,000
$40,001 - $60,000
More than $60,000
Page 80
Household with youngest child over 15 years
Household with youngest child 5 to 15 years
Flat – Not a family home