Embed Size (px)
Citation preview
www.nesdb.go.th
962 Krung Kasem Road, Pomprab, Bangkok 10100 Office of the National Economic and Social Development Board (NESDB)
NESDB ECONOMIC REPORT
Press Release 9.30 a.m. May 15, 2017
Thai Economic Performance in Q1 and Outlook for 2017
NESDB ECONOMIC REPORT
Macroeconomic Strategy and Planning Office
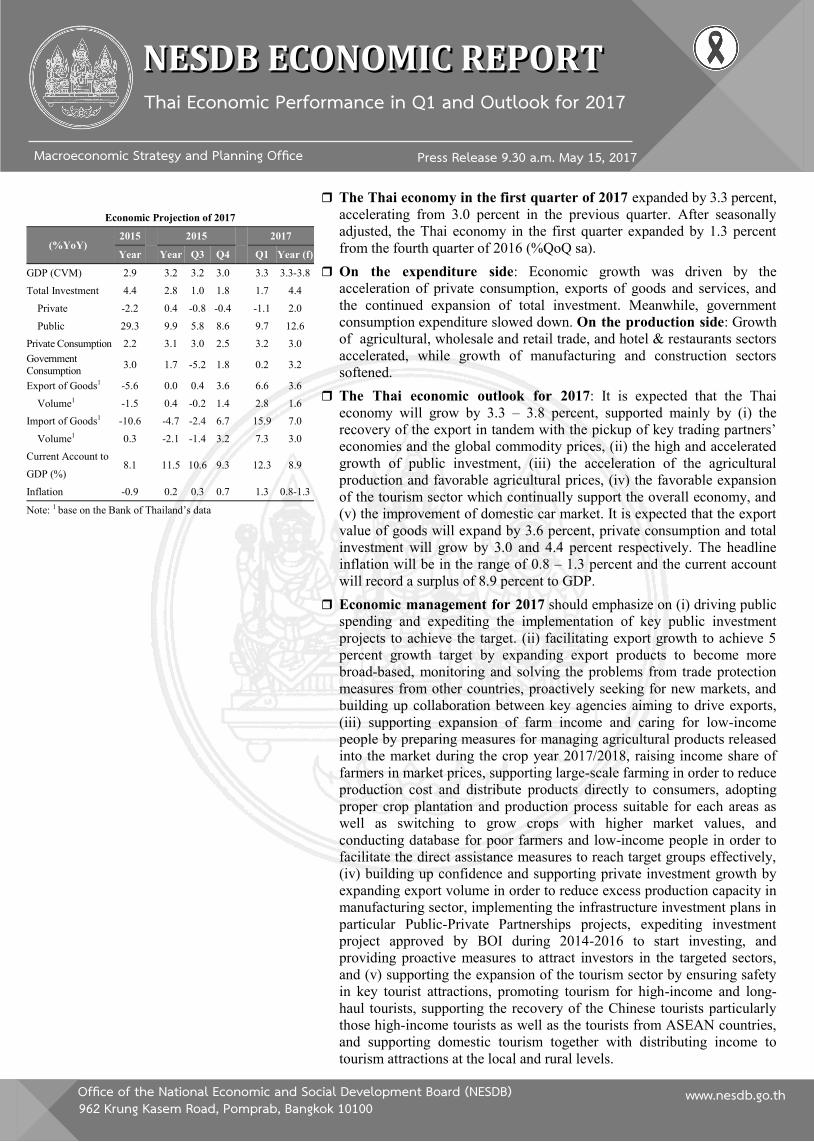
The Thai economy in the first quarter of 2017 expanded by 3.3 percent,
accelerating from 3.0 percent in the previous quarter. After seasonally
adjusted, the Thai economy in the first quarter expanded by 1.3 percent
from the fourth quarter of 2016 (%QoQ sa).
On the expenditure side: Economic growth was driven by the
acceleration of private consumption, exports of goods and services, and
the continued expansion of total investment. Meanwhile, government
consumption expenditure slowed down. On the production side: Growth
of agricultural, wholesale and retail trade, and hotel & restaurants sectors
accelerated, while growth of manufacturing and construction sectors
softened.
The Thai economic outlook for 2017: It is expected that the Thai
economy will grow by 3.3 – 3.8 percent, supported mainly by (i) the
recovery of the export in tandem with the pickup of key trading partners’
economies and the global commodity prices, (ii) the high and accelerated
growth of public investment, (iii) the acceleration of the agricultural
production and favorable agricultural prices, (iv) the favorable expansion
of the tourism sector which continually support the overall economy, and
(v) the improvement of domestic car market. It is expected that the export
value of goods will expand by 3.6 percent, private consumption and total
investment will grow by 3.0 and 4.4 percent respectively. The headline
inflation will be in the range of 0.8 – 1.3 percent and the current account
will record a surplus of 8.9 percent to GDP.
Economic management for 2017 should emphasize on (i) driving public
spending and expediting the implementation of key public investment
projects to achieve the target. (ii) facilitating export growth to achieve 5
percent growth target by expanding export products to become more
broad-based, monitoring and solving the problems from trade protection
measures from other countries, proactively seeking for new markets, and
building up collaboration between key agencies aiming to drive exports,
(iii) supporting expansion of farm income and caring for low-income
people by preparing measures for managing agricultural products released
into the market during the crop year 2017/2018, raising income share of
farmers in market prices, supporting large-scale farming in order to reduce
production cost and distribute products directly to consumers, adopting
proper crop plantation and production process suitable for each areas as
well as switching to grow crops with higher market values, and
conducting database for poor farmers and low-income people in order to
facilitate the direct assistance measures to reach target groups effectively,
(iv) building up confidence and supporting private investment growth by
expanding export volume in order to reduce excess production capacity in
manufacturing sector, implementing the infrastructure investment plans in
particular Public-Private Partnerships projects, expediting investment
project approved by BOI during 2014-2016 to start investing, and
providing proactive measures to attract investors in the targeted sectors,
and (v) supporting the expansion of the tourism sector by ensuring safety
in key tourist attractions, promoting tourism for high-income and long-
haul tourists, supporting the recovery of the Chinese tourists particularly
those high-income tourists as well as the tourists from ASEAN countries,
and supporting domestic tourism together with distributing income to
tourism attractions at the local and rural levels.
Economic Projection of 2017
(%YoY) 2015 2015 2017
Year Year Q3 Q4 Q1 Year (f)
GDP (CVM) 2.9 3.2 3.2 3.0 3.3 3.3-3.8
Total Investment 4.4 2.8 1.0 1.8 1.7 4.4
Private -2.2 0.4 -0.8 -0.4 -1.1 2.0
Public 29.3 9.9 5.8 8.6 9.7 12.6
Private Consumption 2.2 3.1 3.0 2.5 3.2 3.0
Government Consumption
3.0 1.7 -5.2 1.8 0.2 3.2
Export of Goods1 -5.6 0.0 0.4 3.6 6.6 3.6
Volume1 -1.5 0.4 -0.2 1.4 2.8 1.6
Import of Goods1 -10.6 -4.7 -2.4 6.7 15.9 7.0
Volume1 0.3 -2.1 -1.4 3.2 7.3 3.0
Current Account to 8.1 11.5 10.6 9.3 12.3 8.9
GDP (%)
Inflation -0.9 0.2 0.3 0.7 1.3 0.8-1.3
Note: 1 base on the Bank of Thailand’s data
Macroeconomic Strategy and Planning Office
NESDB Economic Outlook
May 15, 2017 2
The Thai economy in the first quarter and the outlook for 2017
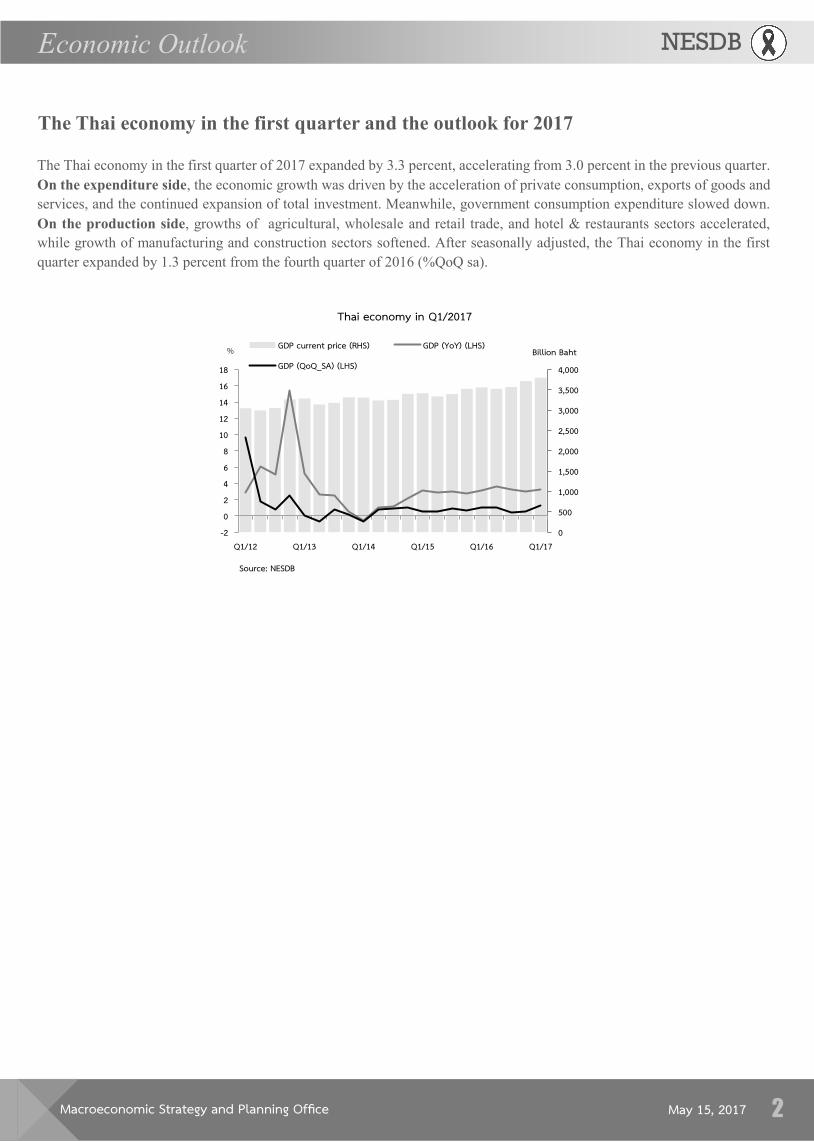
The Thai economy in the first quarter of 2017 expanded by 3.3 percent, accelerating from 3.0 percent in the previous quarter.
On the expenditure side, the economic growth was driven by the acceleration of private consumption, exports of goods and
services, and the continued expansion of total investment. Meanwhile, government consumption expenditure slowed down.
On the production side, growths of agricultural, wholesale and retail trade, and hotel & restaurants sectors accelerated,
while growth of manufacturing and construction sectors softened. After seasonally adjusted, the Thai economy in the first
quarter expanded by 1.3 percent from the fourth quarter of 2016 (%QoQ sa).
Thai economy in Q1/2017
Source: NESDB
0
500
1,000
1,500
2,000
2,500
3,000
3,500
4,000
-202468
1012141618
Q1/12 Q1/13 Q1/14 Q1/15 Q1/16 Q1/17
Billion Baht% GDP current price (RHS) GDP (YoY) (LHS)
GDP (QoQ_SA) (LHS)
Macroeconomic Strategy and Planning Office
NESDB Economic Outlook
May 15, 2017 3
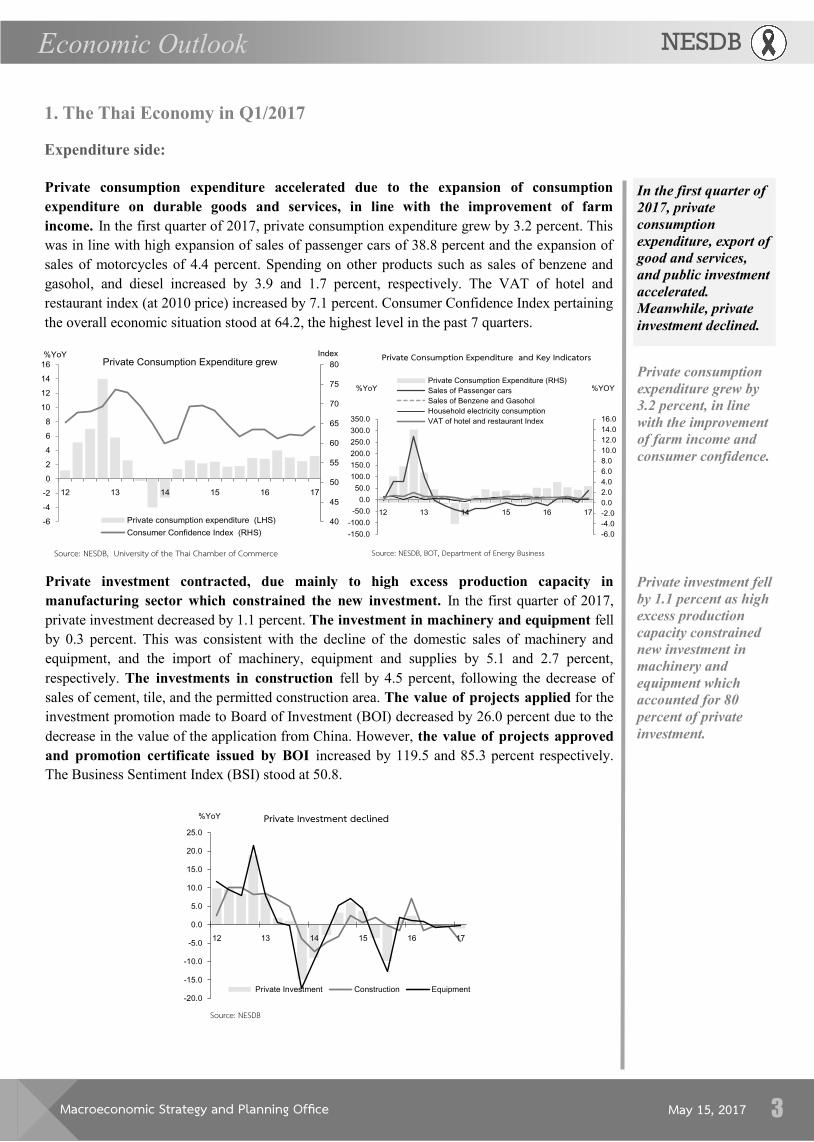
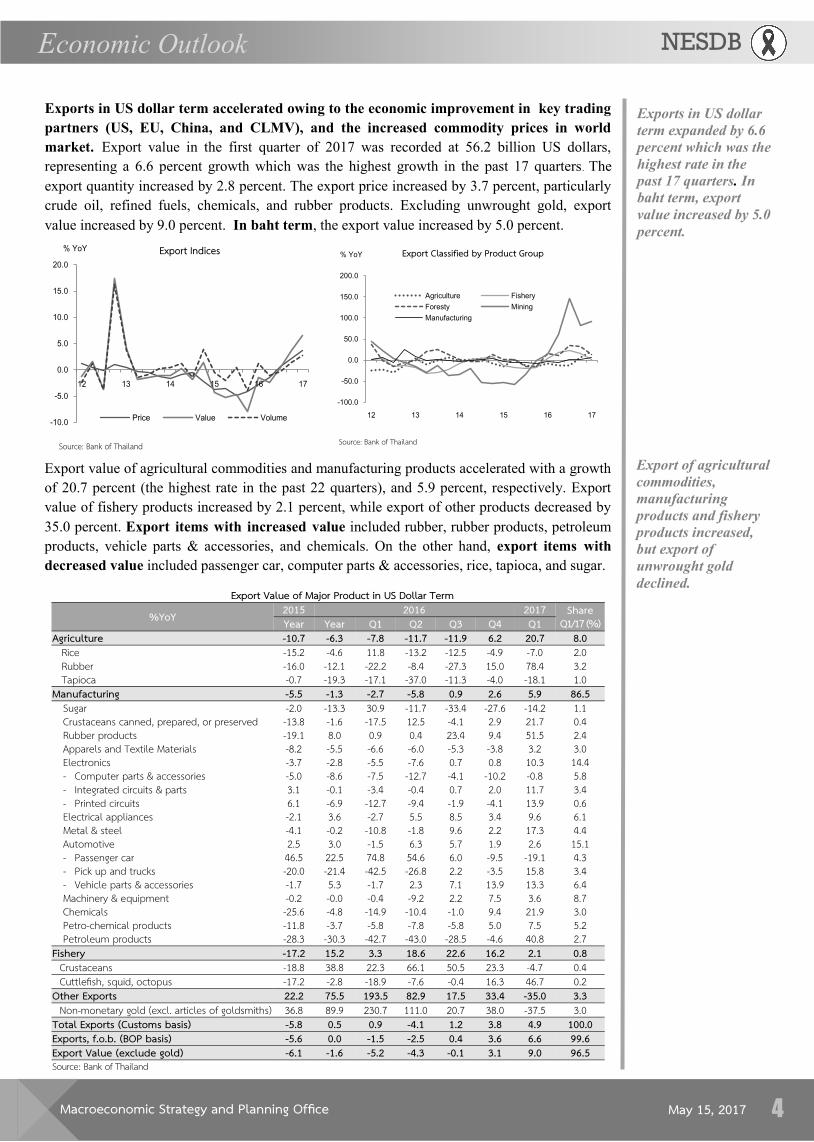
Private consumption expenditure accelerated due to the expansion of consumption
expenditure on durable goods and services, in line with the improvement of farm
income. In the first quarter of 2017, private consumption expenditure grew by 3.2 percent. This
was in line with high expansion of sales of passenger cars of 38.8 percent and the expansion of
sales of motorcycles of 4.4 percent. Spending on other products such as sales of benzene and
gasohol, and diesel increased by 3.9 and 1.7 percent, respectively. The VAT of hotel and
restaurant index (at 2010 price) increased by 7.1 percent. Consumer Confidence Index pertaining
the overall economic situation stood at 64.2, the highest level in the past 7 quarters.
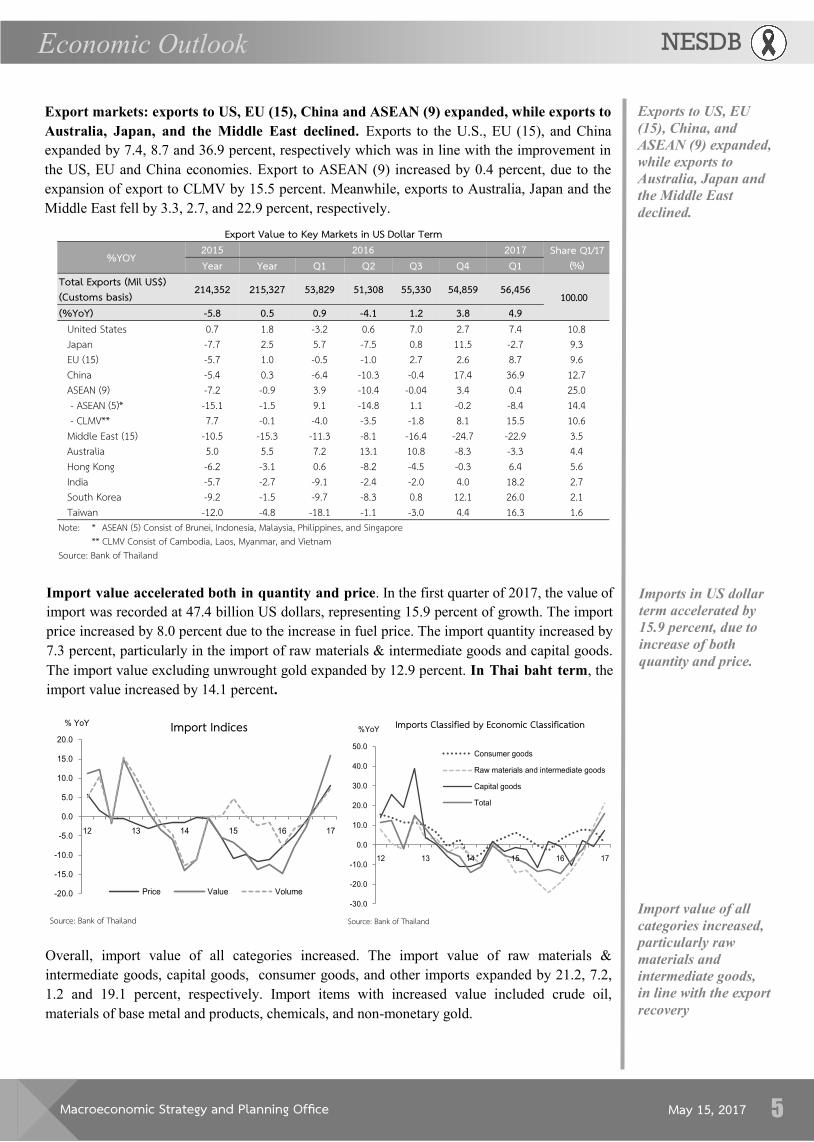
Private investment contracted, due mainly to high excess production capacity in
manufacturing sector which constrained the new investment. In the first quarter of 2017,
private investment decreased by 1.1 percent. The investment in machinery and equipment fell
by 0.3 percent. This was consistent with the decline of the domestic sales of machinery and
equipment, and the import of machinery, equipment and supplies by 5.1 and 2.7 percent,
respectively. The investments in construction fell by 4.5 percent, following the decrease of
sales of cement, tile, and the permitted construction area. The value of projects applied for the
investment promotion made to Board of Investment (BOI) decreased by 26.0 percent due to the
decrease in the value of the application from China. However, the value of projects approved
and promotion certificate issued by BOI increased by 119.5 and 85.3 percent respectively.
The Business Sentiment Index (BSI) stood at 50.8.
1. The Thai Economy in Q1/2017
In the first quarter of
2017, private
consumption
expenditure, export of
good and services,
and public investment
accelerated.
Meanwhile, private
investment declined.
Source: NESDB, University of the Thai Chamber of Commerce
40
45
50
55
60
65
70
75
80
-6
-4
-2
0
2
4
6
8
10
12
14
16
Index%YoYPrivate Consumption Expenditure grew
Private consumption expenditure (LHS)
Consumer Confidence Index (RHS)
Expenditure side:
Private consumption
expenditure grew by
3.2 percent, in line
with the improvement
of farm income and consumer confidence.
Private investment fell
by 1.1 percent as high
excess production
capacity constrained
new investment in
machinery and
equipment which
accounted for 80
percent of private
investment.
-6.0
-4.0
-2.0
0.0
2.0
4.0
6.0
8.0
10.0
12.0
14.0
16.0
-150.0
-100.0
-50.0
0.0
50.0
100.0
150.0
200.0
250.0
300.0
350.0
%YOY%YoY
Private Consumption Expenditure and Key Indicators
Private Consumption Expenditure (RHS)
Sales of Passenger cars
Sales of Benzene and Gasohol
Household electricity consumption
VAT of hotel and restaurant Index
Source: NESDB, BOT, Department of Energy Business
Source: NESDB
-20.0
-15.0
-10.0
-5.0
0.0
5.0
10.0
15.0
20.0
25.0
%YoY Private Investment declined
Private Investment Construction Equipment
Macroeconomic Strategy and Planning Office
NESDB Economic Outlook
May 15, 2017 4
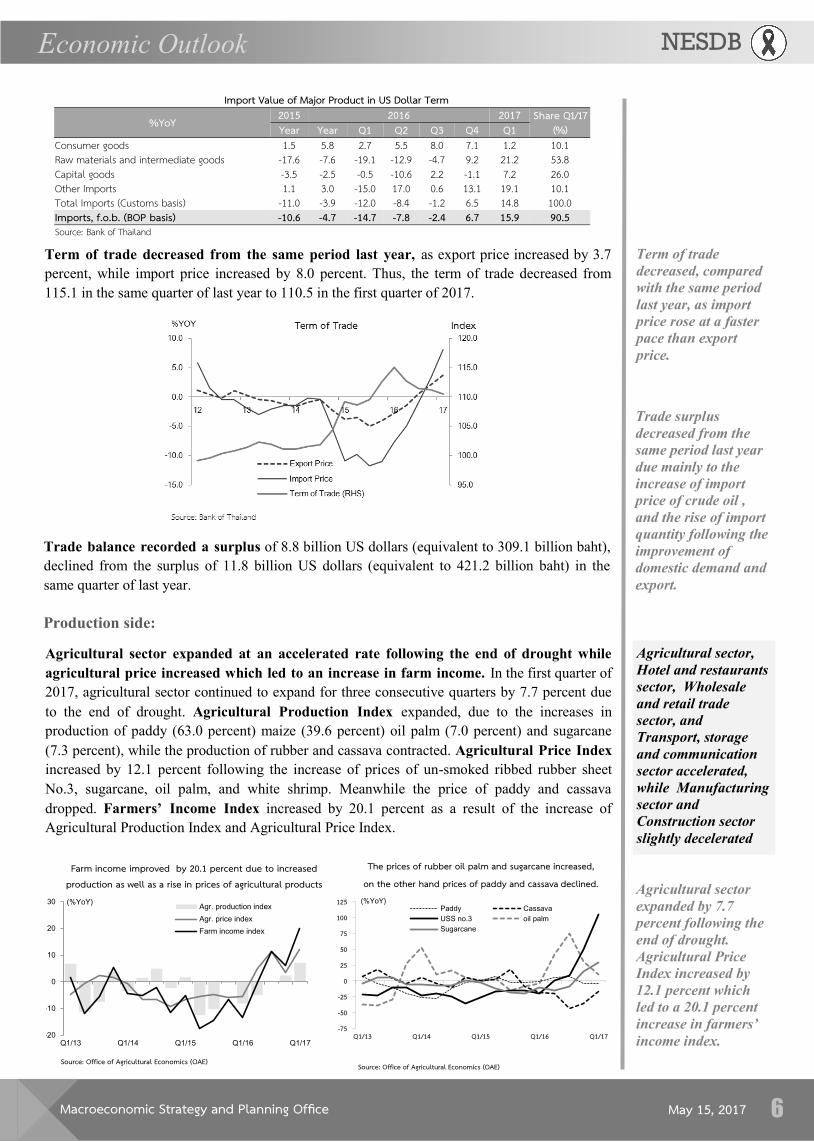
Exports in US dollar term accelerated owing to the economic improvement in key trading
partners (US, EU, China, and CLMV), and the increased commodity prices in world
market. Export value in the first quarter of 2017 was recorded at 56.2 billion US dollars,
representing a 6.6 percent growth which was the highest growth in the past 17 quarters. The
export quantity increased by 2.8 percent. The export price increased by 3.7 percent, particularly
crude oil, refined fuels, chemicals, and rubber products. Excluding unwrought gold, export
value increased by 9.0 percent. In baht term, the export value increased by 5.0 percent.
Export value of agricultural commodities and manufacturing products accelerated with a growth
of 20.7 percent (the highest rate in the past 22 quarters), and 5.9 percent, respectively. Export
value of fishery products increased by 2.1 percent, while export of other products decreased by
35.0 percent. Export items with increased value included rubber, rubber products, petroleum
products, vehicle parts & accessories, and chemicals. On the other hand, export items with
decreased value included passenger car, computer parts & accessories, rice, tapioca, and sugar.
-10.0
-5.0
0.0
5.0
10.0
15.0
20.0
% YoY Export Indices
Price Value Volume
Source: Bank of Thailand Source: Bank of Thailand
-100.0
-50.0
0.0
50.0
100.0
150.0
200.0
% YoY Export Classified by Product Group
Agriculture Fishery
Foresty Mining
Manufacturing
Exports in US dollar
term expanded by 6.6
percent which was the
highest rate in the
past 17 quarters. In
baht term, export
value increased by 5.0
percent.
Export of agricultural
commodities,
manufacturing
products and fishery
products increased,
but export of
unwrought gold
declined. Export Value of Major Product in US Dollar Term
%YoY 2015 2016 Share Q1/17 (%)
2017 Year Year Q1 Q2 Q3 Q4 Q1
Agriculture -10.7 -6.3 -7.8 -11.7 -11.9 6.2 8.0 20.7 Rice -15.2 -4.6 11.8 -13.2 -12.5 -4.9 2.0 -7.0 Rubber -16.0 -12.1 -22.2 -8.4 -27.3 15.0 3.2 78.4 Tapioca -0.7 -19.3 -17.1 -37.0 -11.3 -4.0 1.0 -18.1
Manufacturing -5.5 -1.3 -2.7 -5.8 0.9 2.6 86.5 5.9 Sugar -2.0 -13.3 30.9 -11.7 -33.4 -27.6 1.1 -14.2 Crustaceans canned, prepared, or preserved -13.8 -1.6 -17.5 12.5 -4.1 2.9 0.4 21.7 Rubber products -19.1 8.0 0.9 0.4 23.4 9.4 2.4 51.5 Apparels and Textile Materials -8.2 -5.5 -6.6 -6.0 -5.3 -3.8 3.0 3.2 Electronics -3.7 -2.8 -5.5 -7.6 0.7 0.8 14.4 10.3 - Computer parts & accessories -5.0 -8.6 -7.5 -12.7 -4.1 -10.2 5.8 -0.8 - Integrated circuits & parts 3.1 -0.1 -3.4 -0.4 0.7 2.0 3.4 11.7 - Printed circuits 6.1 -6.9 -12.7 -9.4 -1.9 -4.1 0.6 13.9 Electrical appliances -2.1 3.6 -2.7 5.5 8.5 3.4 6.1 9.6 Metal & steel -4.1 -0.2 -10.8 -1.8 9.6 2.2 4.4 17.3 Automotive 2.5 3.0 -1.5 6.3 5.7 1.9 15.1 2.6 - Passenger car 46.5 22.5 74.8 54.6 6.0 -9.5 4.3 -19.1 - Pick up and trucks -20.0 -21.4 -42.5 -26.8 2.2 -3.5 3.4 15.8 - Vehicle parts & accessories -1.7 5.3 -1.7 2.3 7.1 13.9 13.3 6.4 Machinery & equipment -0.2 -0.0 -0.4 -9.2 2.2 7.5 8.7 3.6 Chemicals -25.6 -4.8 -14.9 -10.4 -1.0 9.4 3.0 21.9 Petro-chemical products -11.8 -3.7 -5.8 -7.8 -5.8 5.0 5.2 7.5 Petroleum products -28.3 -30.3 -42.7 -43.0 -28.5 -4.6 2.7 40.8
Fishery -17.2 15.2 3.3 18.6 22.6 16.2 0.8 2.1 Crustaceans -18.8 38.8 22.3 66.1 50.5 23.3 0.4 -4.7 Cuttlefish, squid, octopus -17.2 -2.8 -18.9 -7.6 -0.4 16.3 0.2 46.7
Other Exports 22.2 75.5 193.5 82.9 17.5 33.4 3.3 -35.0 Non-monetary gold (excl. articles of goldsmiths) 36.8 89.9 230.7 111.0 20.7 38.0 3.0 -37.5
Total Exports (Customs basis) -5.8 0.5 0.9 -4.1 1.2 3.8 100.0 4.9 Exports, f.o.b. (BOP basis) -5.6 0.0 -1.5 -2.5 0.4 3.6 99.6 6.6 Export Value (exclude gold) -6.1 -1.6 -5.2 -4.3 -0.1 3.1 96.5 9.0 Source: Bank of Thailand
Macroeconomic Strategy and Planning Office
NESDB Economic Outlook
May 15, 2017 5
Export markets: exports to US, EU (15), China and ASEAN (9) expanded, while exports to
Australia, Japan, and the Middle East declined. Exports to the U.S., EU (15), and China
expanded by 7.4, 8.7 and 36.9 percent, respectively which was in line with the improvement in
the US, EU and China economies. Export to ASEAN (9) increased by 0.4 percent, due to the
expansion of export to CLMV by 15.5 percent. Meanwhile, exports to Australia, Japan and the
Middle East fell by 3.3, 2.7, and 22.9 percent, respectively.
Exports to US, EU
(15), China, and
ASEAN (9) expanded,
while exports to
Australia, Japan and
the Middle East
declined.
Import value of all
categories increased,
particularly raw
materials and
intermediate goods,
in line with the export
recovery
Export Value to Key Markets in US Dollar Term
%YOY 2015 2016 Share Q1/17 (%)
2017 Year Year Q1 Q2 Q3 Q4 Q1
Total Exports (Mil US$) (Customs basis) 214,352 215,327 53,829 51,308 55,330 54,859 100.00 56,456
(%YoY) -5.8 0.5 0.9 -4.1 1.2 3.8 4.9 United States 0.7 1.8 -3.2 0.6 7.0 2.7 10.8 7.4 Japan -7.7 2.5 5.7 -7.5 0.8 11.5 9.3 -2.7 EU (15) -5.7 1.0 -0.5 -1.0 2.7 2.6 9.6 8.7 China -5.4 0.3 -6.4 -10.3 -0.4 17.4 12.7 36.9 ASEAN (9) -7.2 -0.9 3.9 -10.4 -0.04 3.4 25.0 0.4 - ASEAN (5)* -15.1 -1.5 9.1 -14.8 1.1 -0.2 14.4 -8.4 - CLMV** 7.7 -0.1 -4.0 -3.5 -1.8 8.1 10.6 15.5 Middle East (15) -10.5 -15.3 -11.3 -8.1 -16.4 -24.7 3.5 -22.9 Australia 5.0 5.5 7.2 13.1 10.8 -8.3 4.4 -3.3 Hong Kong -6.2 -3.1 0.6 -8.2 -4.5 -0.3 5.6 6.4 India -5.7 -2.7 -9.1 -2.4 -2.0 4.0 2.7 18.2 South Korea -9.2 -1.5 -9.7 -8.3 0.8 12.1 2.1 26.0 Taiwan -12.0 -4.8 -18.1 -1.1 -3.0 4.4 1.6 16.3
Note: * ASEAN (5) Consist of Brunei, Indonesia, Malaysia, Philippines, and Singapore ** CLMV Consist of Cambodia, Laos, Myanmar, and Vietnam
Source: Bank of Thailand
Import value accelerated both in quantity and price. In the first quarter of 2017, the value of
import was recorded at 47.4 billion US dollars, representing 15.9 percent of growth. The import
price increased by 8.0 percent due to the increase in fuel price. The import quantity increased by
7.3 percent, particularly in the import of raw materials & intermediate goods and capital goods.
The import value excluding unwrought gold expanded by 12.9 percent. In Thai baht term, the
import value increased by 14.1 percent.
-20.0
-15.0
-10.0
-5.0
0.0
5.0
10.0
15.0
20.0
% YoY Import Indices
Price Value Volume
Source: Bank of Thailand
Overall, import value of all categories increased. The import value of raw materials &
intermediate goods, capital goods, consumer goods, and other imports expanded by 21.2, 7.2,
1.2 and 19.1 percent, respectively. Import items with increased value included crude oil, materials of base metal and products, chemicals, and non-monetary gold.
Imports in US dollar
term accelerated by
15.9 percent, due to
increase of both
quantity and price.
Source: Bank of Thailand
-30.0
-20.0
-10.0
0.0
10.0
20.0
30.0
40.0
50.0
%YoYImports Classified by Economic Classification
Consumer goods
Raw materials and intermediate goods
Capital goods
Total
Macroeconomic Strategy and Planning Office
NESDB Economic Outlook
May 15, 2017 6
Term of trade decreased from the same period last year, as export price increased by 3.7
percent, while import price increased by 8.0 percent. Thus, the term of trade decreased from
115.1 in the same quarter of last year to 110.5 in the first quarter of 2017.
Trade balance recorded a surplus of 8.8 billion US dollars (equivalent to 309.1 billion baht),
declined from the surplus of 11.8 billion US dollars (equivalent to 421.2 billion baht) in the
same quarter of last year.
Term of trade
decreased, compared
with the same period
last year, as import
price rose at a faster
pace than export
price.
Trade surplus
decreased from the
same period last year
due mainly to the
increase of import
price of crude oil ,
and the rise of import
quantity following the
improvement of
domestic demand and
export.
Import Value of Major Product in US Dollar Term
%YoY 2015 2016 2017 Share Q1/17 (%) Year Year Q1 Q2 Q3 Q4 Q1
Consumer goods 1.5 5.8 2.7 5.5 8.0 7.1 1.2 10.1 Raw materials and intermediate goods -17.6 -7.6 -19.1 -12.9 -4.7 9.2 21.2 53.8 Capital goods -3.5 -2.5 -0.5 -10.6 2.2 -1.1 7.2 26.0 Other Imports 1.1 3.0 -15.0 17.0 0.6 13.1 19.1 10.1 Total Imports (Customs basis) -11.0 -3.9 -12.0 -8.4 -1.2 6.5 14.8 100.0 Imports, f.o.b. (BOP basis) -10.6 -4.7 -14.7 -7.8 -2.4 6.7 15.9 90.5 Source: Bank of Thailand
Production side:
Agricultural sector expanded at an accelerated rate following the end of drought while
agricultural price increased which led to an increase in farm income. In the first quarter of
2017, agricultural sector continued to expand for three consecutive quarters by 7.7 percent due
to the end of drought. Agricultural Production Index expanded, due to the increases in
production of paddy (63.0 percent) maize (39.6 percent) oil palm (7.0 percent) and sugarcane
(7.3 percent), while the production of rubber and cassava contracted. Agricultural Price Index
increased by 12.1 percent following the increase of prices of un-smoked ribbed rubber sheet
No.3, sugarcane, oil palm, and white shrimp. Meanwhile the price of paddy and cassava
dropped. Farmers’ Income Index increased by 20.1 percent as a result of the increase of
Agricultural Production Index and Agricultural Price Index.
Agricultural sector,
Hotel and restaurants
sector, Wholesale
and retail trade
sector, and
Transport, storage
and communication
sector accelerated,
while Manufacturing
sector and
Construction sector
slightly decelerated
-75
-50
-25
0
25
50
75
100
125
Q1/13 Q1/14 Q1/15 Q1/16 Q1/17
(%YoY)Paddy Cassava
USS no.3 oil palm
Sugarcane
The prices of rubber oil palm and sugarcane increased,
on the other hand prices of paddy and cassava declined.
Source: Office of Agricultural Economics (OAE)
-20
-10
0
10
20
30
Q1/13 Q1/14 Q1/15 Q1/16 Q1/17
(%YoY)Agr. production index
Agr. price index
Farm income index
Source: Office of Agricultural Economics (OAE)
Farm income improved by 20.1 percent due to increased production as well as a rise in prices of agricultural products Agricultural sector
expanded by 7.7
percent following the
end of drought.
Agricultural Price
Index increased by
12.1 percent which
led to a 20.1 percent
increase in farmers’
income index.
Macroeconomic Strategy and Planning Office
NESDB Economic Outlook
May 15, 2017 7
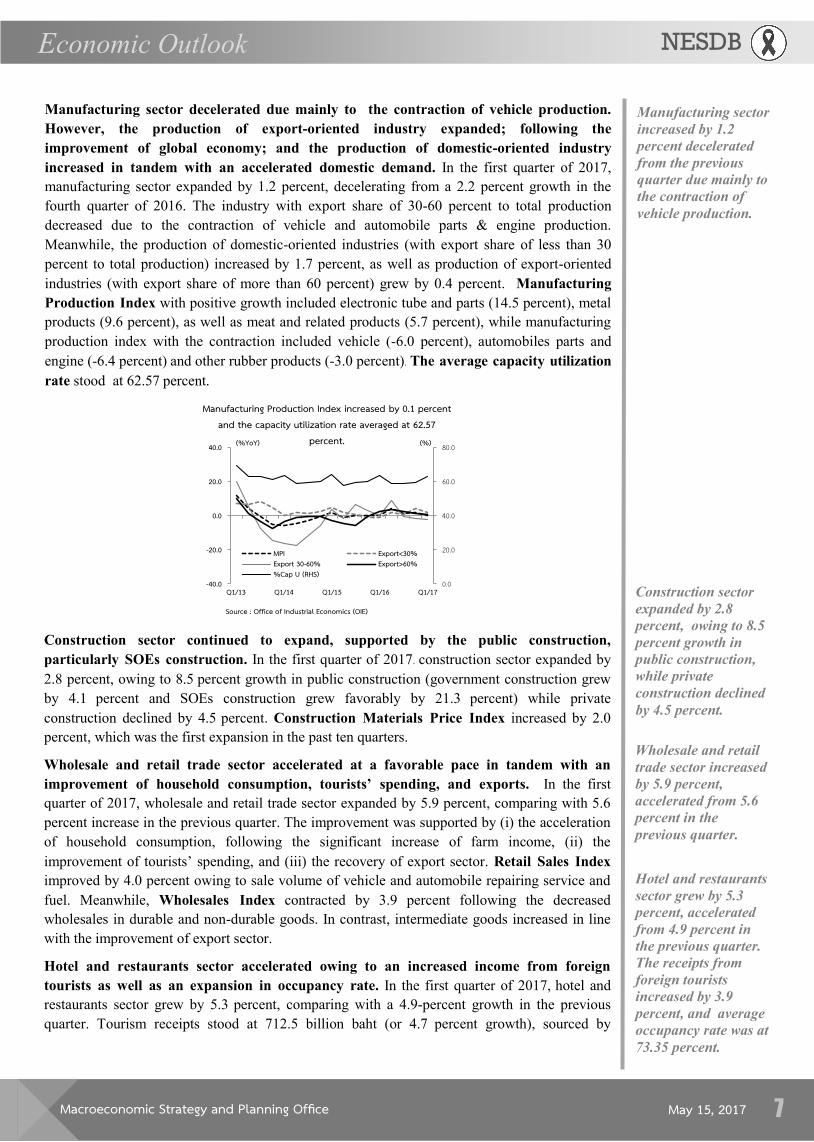
Manufacturing sector decelerated due mainly to the contraction of vehicle production.
However, the production of export-oriented industry expanded; following the
improvement of global economy; and the production of domestic-oriented industry
increased in tandem with an accelerated domestic demand. In the first quarter of 2017,
manufacturing sector expanded by 1.2 percent, decelerating from a 2.2 percent growth in the
fourth quarter of 2016. The industry with export share of 30-60 percent to total production
decreased due to the contraction of vehicle and automobile parts & engine production.
Meanwhile, the production of domestic-oriented industries (with export share of less than 30
percent to total production) increased by 1.7 percent, as well as production of export-oriented
industries (with export share of more than 60 percent) grew by 0.4 percent. Manufacturing
Production Index with positive growth included electronic tube and parts (14.5 percent), metal
products (9.6 percent), as well as meat and related products (5.7 percent), while manufacturing
production index with the contraction included vehicle (-6.0 percent), automobiles parts and
engine (-6.4 percent) and other rubber products (-3.0 percent). The average capacity utilization
rate stood at 62.57 percent.
Manufacturing sector
increased by 1.2
percent decelerated
from the previous
quarter due mainly to
the contraction of
vehicle production.
Construction sector expanded by 2.8 percent, owing to 8.5
percent growth in
public construction,
while private
construction declined
by 4.5 percent.
Manufacturing Production Index increased by 0.1 percent and the capacity utilization rate averaged at 62.57
percent.
Source : Office of Industrial Economics (OIE)
0.0
20.0
40.0
60.0
80.0
-40.0
-20.0
0.0
20.0
40.0
Q1/13 Q1/14 Q1/15 Q1/16 Q1/17
MPI Export<30%Export 30-60% Export>60%%Cap U (RHS)
(%YoY) (%)
Construction sector continued to expand, supported by the public construction,
particularly SOEs construction. In the first quarter of 2017. construction sector expanded by
2.8 percent, owing to 8.5 percent growth in public construction (government construction grew
by 4.1 percent and SOEs construction grew favorably by 21.3 percent) while private
construction declined by 4.5 percent. Construction Materials Price Index increased by 2.0
percent, which was the first expansion in the past ten quarters.
Wholesale and retail trade sector accelerated at a favorable pace in tandem with an
improvement of household consumption, tourists’ spending, and exports. In the first
quarter of 2017, wholesale and retail trade sector expanded by 5.9 percent, comparing with 5.6
percent increase in the previous quarter. The improvement was supported by (i) the acceleration
of household consumption, following the significant increase of farm income, (ii) the
improvement of tourists’ spending, and (iii) the recovery of export sector. Retail Sales Index
improved by 4.0 percent owing to sale volume of vehicle and automobile repairing service and
fuel. Meanwhile, Wholesales Index contracted by 3.9 percent following the decreased
wholesales in durable and non-durable goods. In contrast, intermediate goods increased in line
with the improvement of export sector.
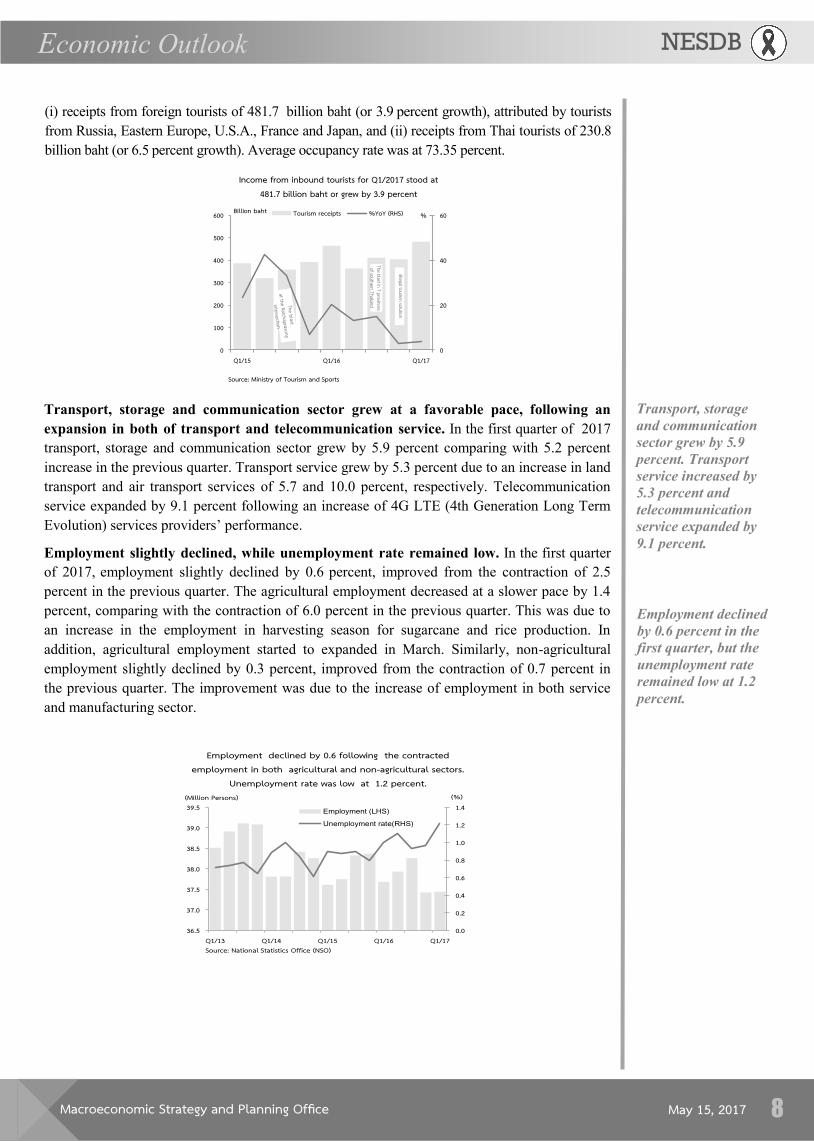
Hotel and restaurants sector accelerated owing to an increased income from foreign
tourists as well as an expansion in occupancy rate. In the first quarter of 2017, hotel and
restaurants sector grew by 5.3 percent, comparing with a 4.9-percent growth in the previous
quarter. Tourism receipts stood at 712.5 billion baht (or 4.7 percent growth), sourced by
Wholesale and retail
trade sector increased
by 5.9 percent,
accelerated from 5.6
percent in the
previous quarter.
Hotel and restaurants
sector grew by 5.3
percent, accelerated
from 4.9 percent in
the previous quarter.
The receipts from
foreign tourists
increased by 3.9
percent, and average
occupancy rate was at
73.35 percent.
Macroeconomic Strategy and Planning Office
NESDB Economic Outlook
May 15, 2017 8
(i) receipts from foreign tourists of 481.7 billion baht (or 3.9 percent growth), attributed by tourists
from Russia, Eastern Europe, U.S.A., France and Japan, and (ii) receipts from Thai tourists of 230.8
billion baht (or 6.5 percent growth). Average occupancy rate was at 73.35 percent.
Employment declined
by 0.6 percent in the
first quarter, but the
unemployment rate
remained low at 1.2
percent.
Transport, storage
and communication
sector grew by 5.9 percent. Transport
service increased by
5.3 percent and
telecommunication
service expanded by
9.1 percent.
Transport, storage and communication sector grew at a favorable pace, following an
expansion in both of transport and telecommunication service. In the first quarter of 2017
transport, storage and communication sector grew by 5.9 percent comparing with 5.2 percent
increase in the previous quarter. Transport service grew by 5.3 percent due to an increase in land
transport and air transport services of 5.7 and 10.0 percent, respectively. Telecommunication
service expanded by 9.1 percent following an increase of 4G LTE (4th Generation Long Term
Evolution) services providers’ performance.
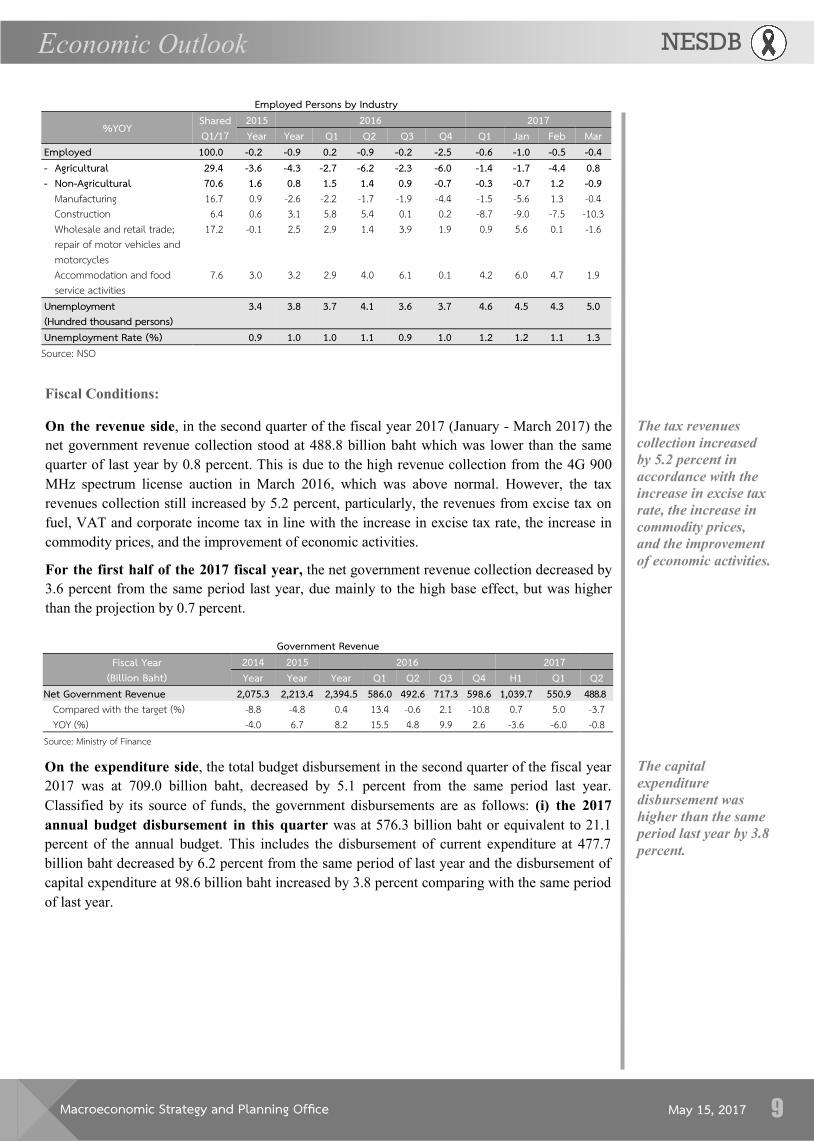
Employment slightly declined, while unemployment rate remained low. In the first quarter
of 2017, employment slightly declined by 0.6 percent, improved from the contraction of 2.5
percent in the previous quarter. The agricultural employment decreased at a slower pace by 1.4
percent, comparing with the contraction of 6.0 percent in the previous quarter. This was due to
an increase in the employment in harvesting season for sugarcane and rice production. In
addition, agricultural employment started to expanded in March. Similarly, non-agricultural
employment slightly declined by 0.3 percent, improved from the contraction of 0.7 percent in
the previous quarter. The improvement was due to the increase of employment in both service
and manufacturing sector.
0.0
0.2
0.4
0.6
0.8
1.0
1.2
1.4
36.5
37.0
37.5
38.0
38.5
39.0
39.5
Q1/13 Q1/14 Q1/15 Q1/16 Q1/17
Employment (LHS)
Unemployment rate(RHS)
(%)(Million Persons)
Employment declined by 0.6 following the contracted employment in both agricultural and non-agricultural sectors.
Unemployment rate was low at 1.2 percent.
Source: National Statistics Office (NSO)
0
20
40
60
0
100
200
300
400
500
600
Q1/15 Q1/16 Q1/17
%Billion baht Tourism receipts %YoY (RHS)
Income from inbound tourists for Q1/2017 stood at 1.7 billion baht or grew by .9 percent
Source: Ministry of Tourism and Sports
The blast in 7 provinces of southern Thailand
Iillegaltourism solution
Macroeconomic Strategy and Planning Office
NESDB Economic Outlook
May 15, 2017 9
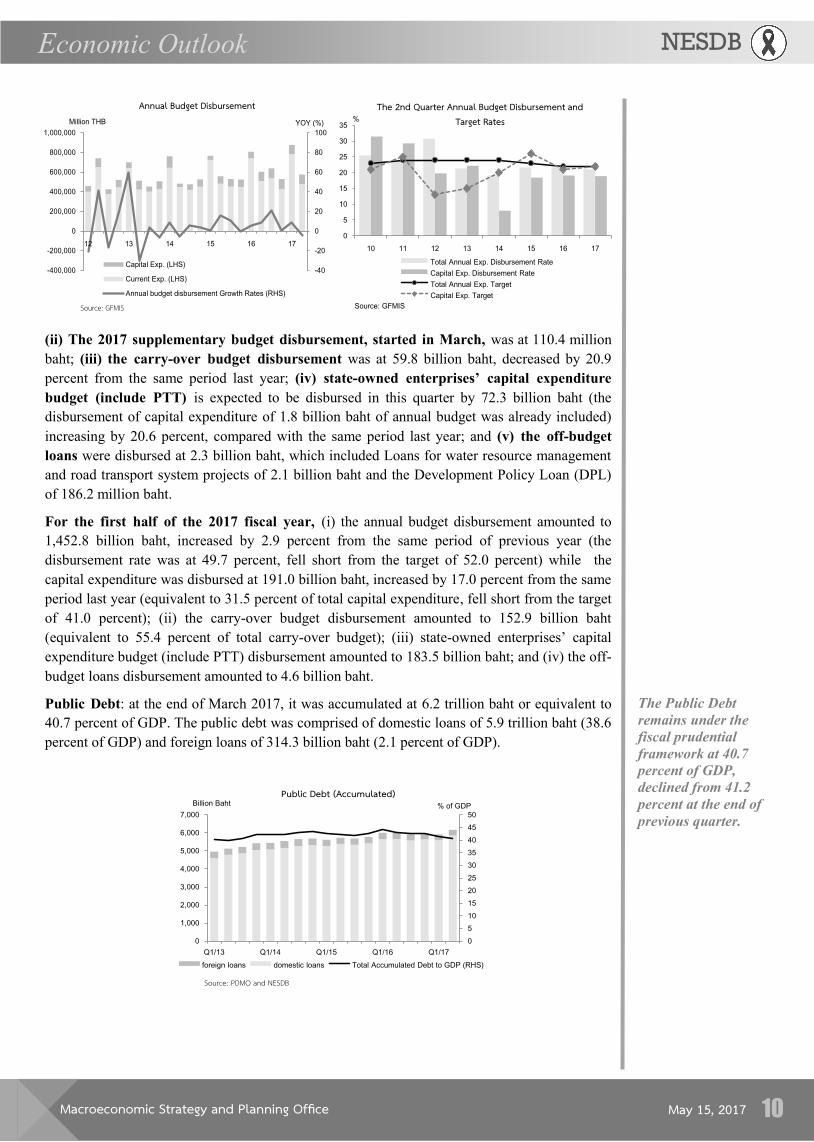
On the expenditure side, the total budget disbursement in the second quarter of the fiscal year
2017 was at 709.0 billion baht, decreased by 5.1 percent from the same period last year.
Classified by its source of funds, the government disbursements are as follows: (i) the 2017
annual budget disbursement in this quarter was at 576.3 billion baht or equivalent to 21.1
percent of the annual budget. This includes the disbursement of current expenditure at 477.7
billion baht decreased by 6.2 percent from the same period of last year and the disbursement of
capital expenditure at 98.6 billion baht increased by 3.8 percent comparing with the same period
of last year.
On the revenue side, in the second quarter of the fiscal year 2017 (January - March 2017) the
net government revenue collection stood at 488.8 billion baht which was lower than the same
quarter of last year by 0.8 percent. This is due to the high revenue collection from the 4G 900
MHz spectrum license auction in March 2016, which was above normal. However, the tax
revenues collection still increased by 5.2 percent, particularly, the revenues from excise tax on
fuel, VAT and corporate income tax in line with the increase in excise tax rate, the increase in
commodity prices, and the improvement of economic activities.
For the first half of the 2017 fiscal year, the net government revenue collection decreased by
3.6 percent from the same period last year, due mainly to the high base effect, but was higher
than the projection by 0.7 percent.
Fiscal Conditions:
Employed Persons by Industry
%YOY Shared Q1/17
2015 2016 2017 Year Year Q1 Q2 Q3 Q4 Q1 Jan Feb Mar
Employed 100.0 -0.2 -0.9 0.2 -0.9 -0.2 -2.5 -0.6 -1.0 -0.5 -0.4 - Agricultural 29. -3.6 -4.3 -2.7 -6.2 -2.3 -6.0 -1.4 -1.7 -4.4 0. - Non-Agricultural 70.6 1.6 0. 1.5 1. 0.9 -0.7 -0.3 -0.7 1.2 -0.9
Manufacturing 16.7 0.9 -2.6 -2.2 -1.7 -1.9 -4.4 -1.5 -5.6 1.3 -0.4 Construction 6.4 0.6 3.1 5.8 5.4 0.1 0.2 -8.7 -9.0 -7.5 -10.3 Wholesale and retail trade; repair of motor vehicles and motorcycles
17.2 -0.1 2.5 2.9 1.4 3.9 1.9 0.9 5.6 0.1 -1.6
Accommodation and food service activities
7.6 3.0 3.2 2.9 4.0 6.1 0.1 4.2 6.0 4.7 1.9
Unemployment (Hundred thousand persons)
. . .7 .1 .6 .7 .6 .5 . 5.0
Unemployment Rate (%) 0.9 1.0 1.0 1.1 0.9 1.0 1.2 1.2 1.1 1. Source: NSO
Government Revenue Fiscal Year
(Billion Baht) 201 2015 2016 2017 Year Year Year Q1 Q2 Q3 Q4 H1 Q1 Q2
Net Government Revenue 2,075. 2,21 . 2, 9 .5 5 6.0 92.6 717. 59 .6 1,0 9.7 550.9 . Compared with the target (%) -8.8 -4.8 0.4 13.4 -0.6 2.1 -10.8 0.7 5.0 -3.7 YOY (%) -4.0 6.7 8.2 15.5 4.8 9.9 2.6 -3.6 -6.0 -0.8
Source: Ministry of Finance
The tax revenues
collection increased
by 5.2 percent in
accordance with the
increase in excise tax
rate, the increase in
commodity prices,
and the improvement
of economic activities.
The capital
expenditure
disbursement was
higher than the same
period last year by 3.8
percent.
Macroeconomic Strategy and Planning Office
NESDB Economic Outlook
May 15, 2017 10
(ii) The 2017 supplementary budget disbursement, started in March, was at 110.4 million
baht; (iii) the carry-over budget disbursement was at 59.8 billion baht, decreased by 20.9
percent from the same period last year; (iv) state-owned enterprises’ capital expenditure
budget (include PTT) is expected to be disbursed in this quarter by 72.3 billion baht (the
disbursement of capital expenditure of 1.8 billion baht of annual budget was already included)
increasing by 20.6 percent, compared with the same period last year; and (v) the off-budget
loans were disbursed at 2.3 billion baht, which included Loans for water resource management
and road transport system projects of 2.1 billion baht and the Development Policy Loan (DPL)
of 186.2 million baht.
For the first half of the 2017 fiscal year, (i) the annual budget disbursement amounted to
1,452.8 billion baht, increased by 2.9 percent from the same period of previous year (the
disbursement rate was at 49.7 percent, fell short from the target of 52.0 percent) while the
capital expenditure was disbursed at 191.0 billion baht, increased by 17.0 percent from the same
period last year (equivalent to 31.5 percent of total capital expenditure, fell short from the target
of 41.0 percent); (ii) the carry-over budget disbursement amounted to 152.9 billion baht
(equivalent to 55.4 percent of total carry-over budget); (iii) state-owned enterprises’ capital
expenditure budget (include PTT) disbursement amounted to 183.5 billion baht; and (iv) the off-
budget loans disbursement amounted to 4.6 billion baht.
Public Debt: at the end of March 2017, it was accumulated at 6.2 trillion baht or equivalent to
40.7 percent of GDP. The public debt was comprised of domestic loans of 5.9 trillion baht (38.6
percent of GDP) and foreign loans of 314.3 billion baht (2.1 percent of GDP).
The Public Debt
remains under the
fiscal prudential
framework at 40.7
percent of GDP,
declined from 41.2
percent at the end of
previous quarter.
-40
-20
0
20
40
60
80
100
-400,000
-200,000
0
200,000
400,000
600,000
800,000
1,000,000
YOY (%)Million THB
Source: GFMIS
Annual Budget Disbursement
Capital Exp. (LHS)
Current Exp. (LHS)
Annual budget disbursement Growth Rates (RHS)
0
5
10
15
20
25
30
35
%
Source: GFMIS
The 2nd Quarter Annual Budget Disbursement and Target Rates
Total Annual Exp. Disbursement Rate
Capital Exp. Disbursement Rate
Total Annual Exp. Target
Capital Exp. Target
0
5
10
15
20
25
30
35
40
45
50
0
1,000
2,000
3,000
4,000
5,000
6,000
7,000
Q1/13 Q1/14 Q1/15 Q1/16 Q1/17
% of GDPBillion Baht
Source: PDMO and NESDB
Public Debt (Accumulated)
foreign loans domestic loans Total Accumulated Debt to GDP (RHS)
Macroeconomic Strategy and Planning Office
NESDB Economic Outlook
May 15, 2017 11
At the end of the
second quarter of
fiscal year 2017, the
treasury reserve stood
at 141.6 billion baht.
Policy interest rate
remained
unchanging, though
Fed raised its policy
rate.
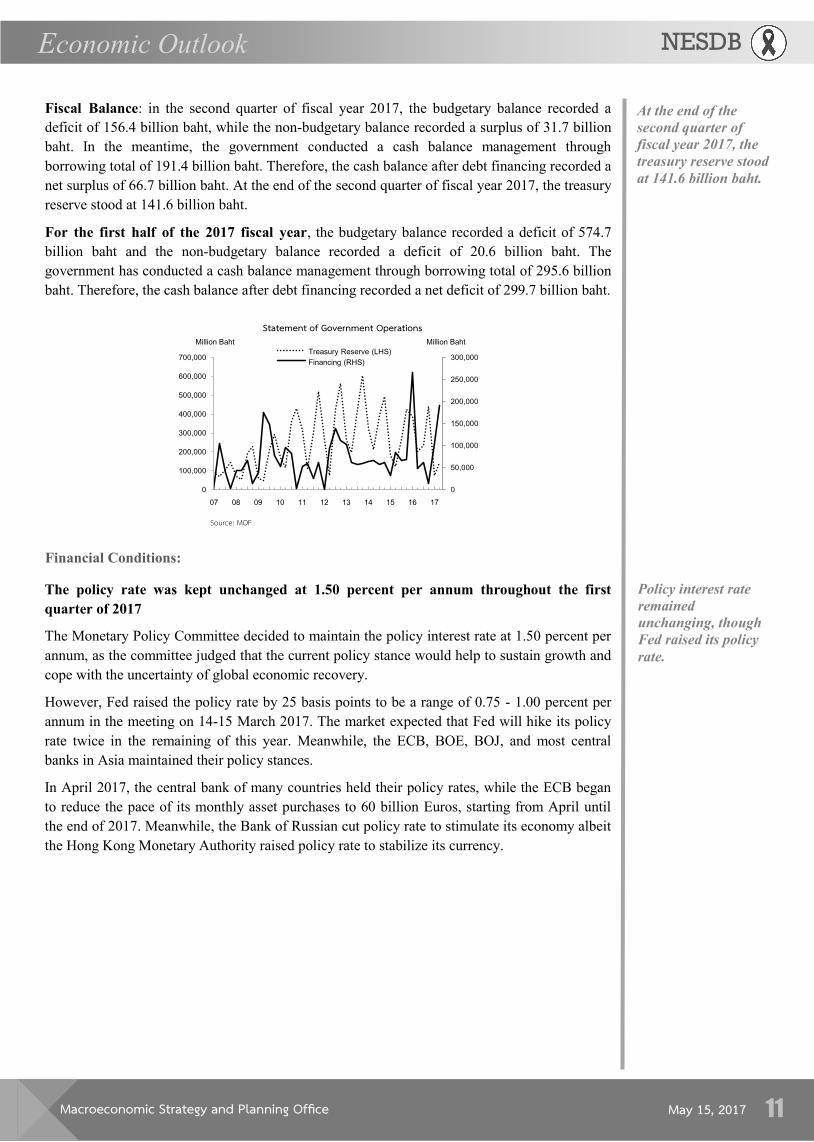
Fiscal Balance: in the second quarter of fiscal year 2017, the budgetary balance recorded a
deficit of 156.4 billion baht, while the non-budgetary balance recorded a surplus of 31.7 billion
baht. In the meantime, the government conducted a cash balance management through
borrowing total of 191.4 billion baht. Therefore, the cash balance after debt financing recorded a
net surplus of 66.7 billion baht. At the end of the second quarter of fiscal year 2017, the treasury
reserve stood at 141.6 billion baht.
For the first half of the 2017 fiscal year, the budgetary balance recorded a deficit of 574.7
billion baht and the non-budgetary balance recorded a deficit of 20.6 billion baht. The
government has conducted a cash balance management through borrowing total of 295.6 billion
baht. Therefore, the cash balance after debt financing recorded a net deficit of 299.7 billion baht.
The policy rate was kept unchanged at 1.50 percent per annum throughout the first
quarter of 2017
The Monetary Policy Committee decided to maintain the policy interest rate at 1.50 percent per
annum, as the committee judged that the current policy stance would help to sustain growth and
cope with the uncertainty of global economic recovery.
However, Fed raised the policy rate by 25 basis points to be a range of 0.75 - 1.00 percent per
annum in the meeting on 14-15 March 2017. The market expected that Fed will hike its policy
rate twice in the remaining of this year. Meanwhile, the ECB, BOE, BOJ, and most central
banks in Asia maintained their policy stances.
In April 2017, the central bank of many countries held their policy rates, while the ECB began
to reduce the pace of its monthly asset purchases to 60 billion Euros, starting from April until
the end of 2017. Meanwhile, the Bank of Russian cut policy rate to stimulate its economy albeit
the Hong Kong Monetary Authority raised policy rate to stabilize its currency.
0
50,000
100,000
150,000
200,000
250,000
300,000
0
100,000
200,000
300,000
400,000
500,000
600,000
700,000
07 08 09 10 11 12 13 14 15 16 17
Source: MOF
Statement of Government Operations
Treasury Reserve (LHS)
Financing (RHS)
Million BahtMillion Baht
Financial Conditions:
Macroeconomic Strategy and Planning Office
NESDB Economic Outlook
May 15, 2017 12
All major and medium-sizes commercial banks, retail bank and Specialized Financial
Institutions (SFIs) hold their 12-month deposit rates and lending rates at the same rate as in the
previous quarter. However, real deposit and lending rates increased following a decrease in
headline inflation rate at the end of the first quarter of 2017.
In April 2017, the 12-month deposit and lending rates of all-sized commercial banks and SFIs
remained at the same rates as in the previous quarter. Furthermore, the real deposit and lending
rates further increased due to the reduction of headline inflation.
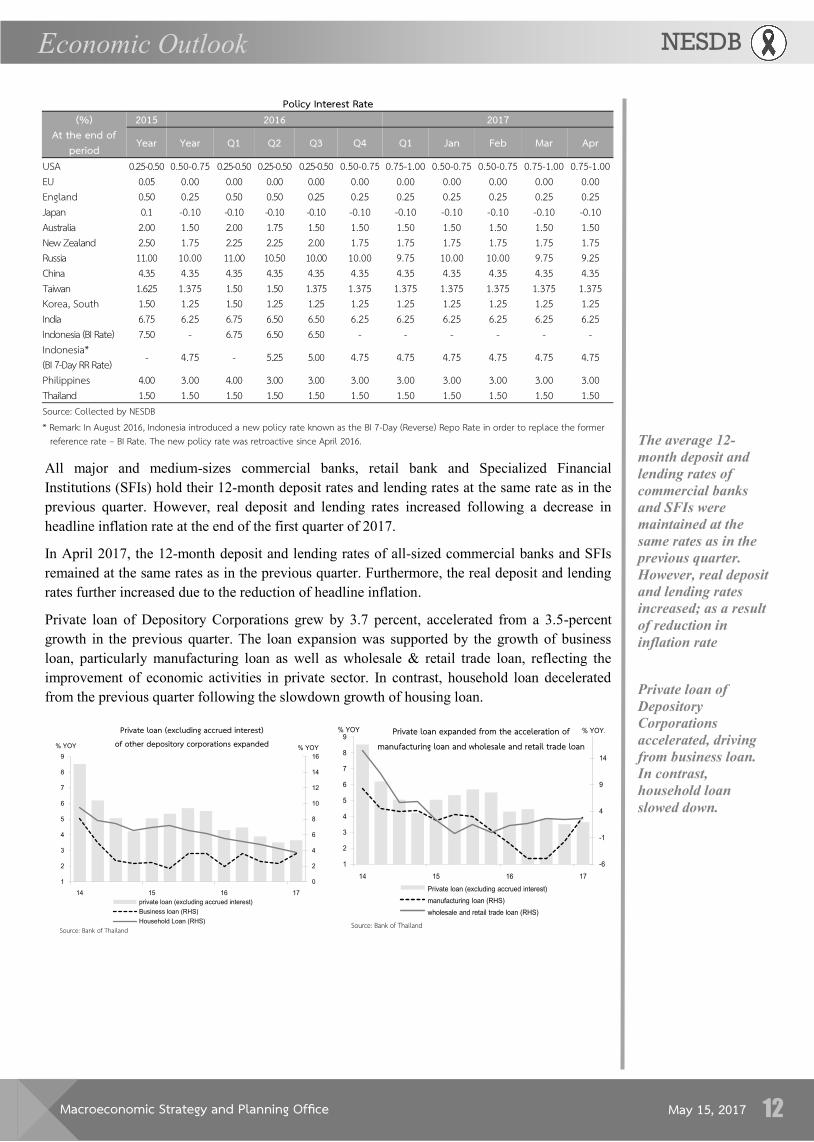
Private loan of Depository Corporations grew by 3.7 percent, accelerated from a 3.5-percent
growth in the previous quarter. The loan expansion was supported by the growth of business
loan, particularly manufacturing loan as well as wholesale & retail trade loan, reflecting the
improvement of economic activities in private sector. In contrast, household loan decelerated
from the previous quarter following the slowdown growth of housing loan. Private loan of
Depository
Corporations
accelerated, driving
from business loan.
In contrast,
household loan
slowed down.
The average 12-
month deposit and
lending rates of
commercial banks
and SFIs were
maintained at the
same rates as in the
previous quarter.
However, real deposit
and lending rates
increased; as a result
of reduction in
inflation rate
Policy Interest Rate (%)
At the end of period
2015 2016 2017
Year Year Q1 Q2 Q3 Q4 Q1 Jan Feb Mar Apr
USA 0.25-0.50 0.50-0.75 0.25-0.50 0.25-0.50 0.25-0.50 0.50-0.75 0.75-1.00 0.50-0.75 0.50-0.75 0.75-1.00 0.75-1.00 EU 0.05 0.00 0.00 0.00 0.00 0.00 0.00 0.00 0.00 0.00 0.00 England 0.50 0.25 0.50 0.50 0.25 0.25 0.25 0.25 0.25 0.25 0.25 Japan 0.1 -0.10 -0.10 -0.10 -0.10 -0.10 -0.10 -0.10 -0.10 -0.10 -0.10 Australia 2.00 1.50 2.00 1.75 1.50 1.50 1.50 1.50 1.50 1.50 1.50 New Zealand 2.50 1.75 2.25 2.25 2.00 1.75 1.75 1.75 1.75 1.75 1.75 Russia 11.00 10.00 11.00 10.50 10.00 10.00 9.75 10.00 10.00 9.75 9.25 China 4.35 4.35 4.35 4.35 4.35 4.35 4.35 4.35 4.35 4.35 4.35 Taiwan 1.625 1.375 1.50 1.50 1.375 1.375 1.375 1.375 1.375 1.375 1.375 Korea, South 1.50 1.25 1.50 1.25 1.25 1.25 1.25 1.25 1.25 1.25 1.25 India 6.75 6.25 6.75 6.50 6.50 6.25 6.25 6.25 6.25 6.25 6.25 Indonesia (BI Rate) 7.50 - 6.75 6.50 6.50 - - - - - - Indonesia* (BI 7-Day RR Rate) - 4.75 - 5.25 5.00 4.75 4.75 4.75 4.75 4.75 4.75
Philippines 4.00 3.00 4.00 3.00 3.00 3.00 3.00 3.00 3.00 3.00 3.00 Thailand 1.50 1.50 1.50 1.50 1.50 1.50 1.50 1.50 1.50 1.50 1.50 Source: Collected by NESDB * Remark: In August 2016, Indonesia introduced a new policy rate known as the BI 7-Day (Reverse) Repo Rate in order to replace the former
reference rate – BI Rate. The new policy rate was retroactive since April 2016.
0
2
4
6
8
10
12
14
16
1
2
3
4
5
6
7
8
9
% YOY% YOY
private loan (excluding accrued interest)
Business loan (RHS)
Household Loan (RHS)
Private loan (excluding accrued interest) of other depository corporations expanded
Source: Bank of Thailand
-6
-1
4
9
14
1
2
3
4
5
6
7
8
9
14 15 16 17
% YOY.% YOY
Private loan (excluding accrued interest)
manufacturing loan (RHS)
wholesale and retail trade loan (RHS)
Private loan expanded from the acceleration of manufacturing loan and wholesale and retail trade loan
Source: Bank of Thailand
Macroeconomic Strategy and Planning Office
NESDB Economic Outlook
May 15, 2017 13
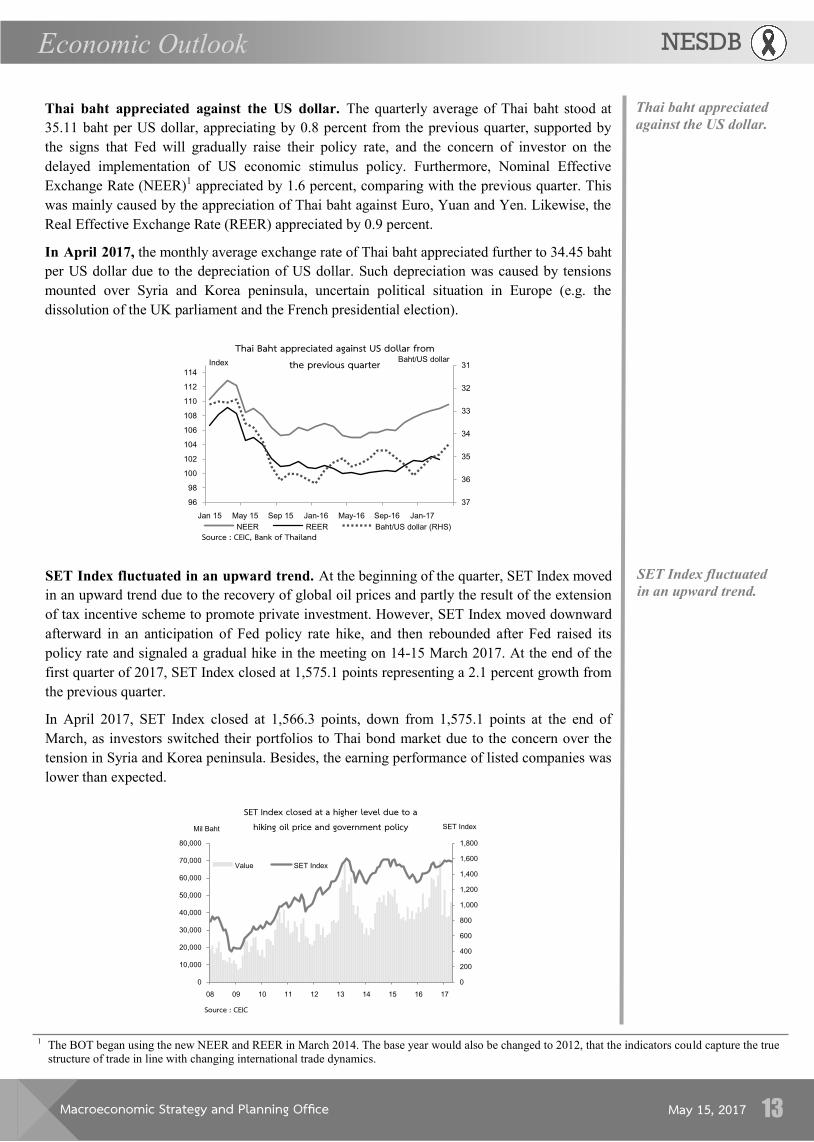
Thai baht appreciated against the US dollar. The quarterly average of Thai baht stood at
35.11 baht per US dollar, appreciating by 0.8 percent from the previous quarter, supported by
the signs that Fed will gradually raise their policy rate, and the concern of investor on the
delayed implementation of US economic stimulus policy. Furthermore, Nominal Effective
Exchange Rate (NEER)1 appreciated by 1.6 percent, comparing with the previous quarter. This
was mainly caused by the appreciation of Thai baht against Euro, Yuan and Yen. Likewise, the
Real Effective Exchange Rate (REER) appreciated by 0.9 percent.
In April 2017, the monthly average exchange rate of Thai baht appreciated further to 34.45 baht
per US dollar due to the depreciation of US dollar. Such depreciation was caused by tensions
mounted over Syria and Korea peninsula, uncertain political situation in Europe (e.g. the
dissolution of the UK parliament and the French presidential election).
SET Index fluctuated
in an upward trend. SET Index fluctuated in an upward trend. At the beginning of the quarter, SET Index moved
in an upward trend due to the recovery of global oil prices and partly the result of the extension
of tax incentive scheme to promote private investment. However, SET Index moved downward
afterward in an anticipation of Fed policy rate hike, and then rebounded after Fed raised its
policy rate and signaled a gradual hike in the meeting on 14-15 March 2017. At the end of the
first quarter of 2017, SET Index closed at 1,575.1 points representing a 2.1 percent growth from
the previous quarter.
In April 2017, SET Index closed at 1,566.3 points, down from 1,575.1 points at the end of
March, as investors switched their portfolios to Thai bond market due to the concern over the
tension in Syria and Korea peninsula. Besides, the earning performance of listed companies was
lower than expected.
31
32
33
34
35
36
3796
98
100
102
104
106
108
110
112
114
Jan 15 May 15 Sep 15 Jan-16 May-16 Sep-16 Jan-17
Index
NEER REER Baht/US dollar (RHS)
Baht/US dollar
Thai Baht appreciated against US dollar from the previous quarter
Source : CEIC, Bank of Thailand
1 The BOT began using the new NEER and REER in March 2014. The base year would also be changed to 2012, that the indicators could capture the true
structure of trade in line with changing international trade dynamics.
Thai baht appreciated
against the US dollar.
0
200
400
600
800
1,000
1,200
1,400
1,600
1,800
0
10,000
20,000
30,000
40,000
50,000
60,000
70,000
80,000
SET IndexMil Baht
Value SET Index
SET Index closed at a higher level due to a hiking oil price and government policy
Source : CEIC
Macroeconomic Strategy and Planning Office
NESDB Economic Outlook
May 15, 2017 14
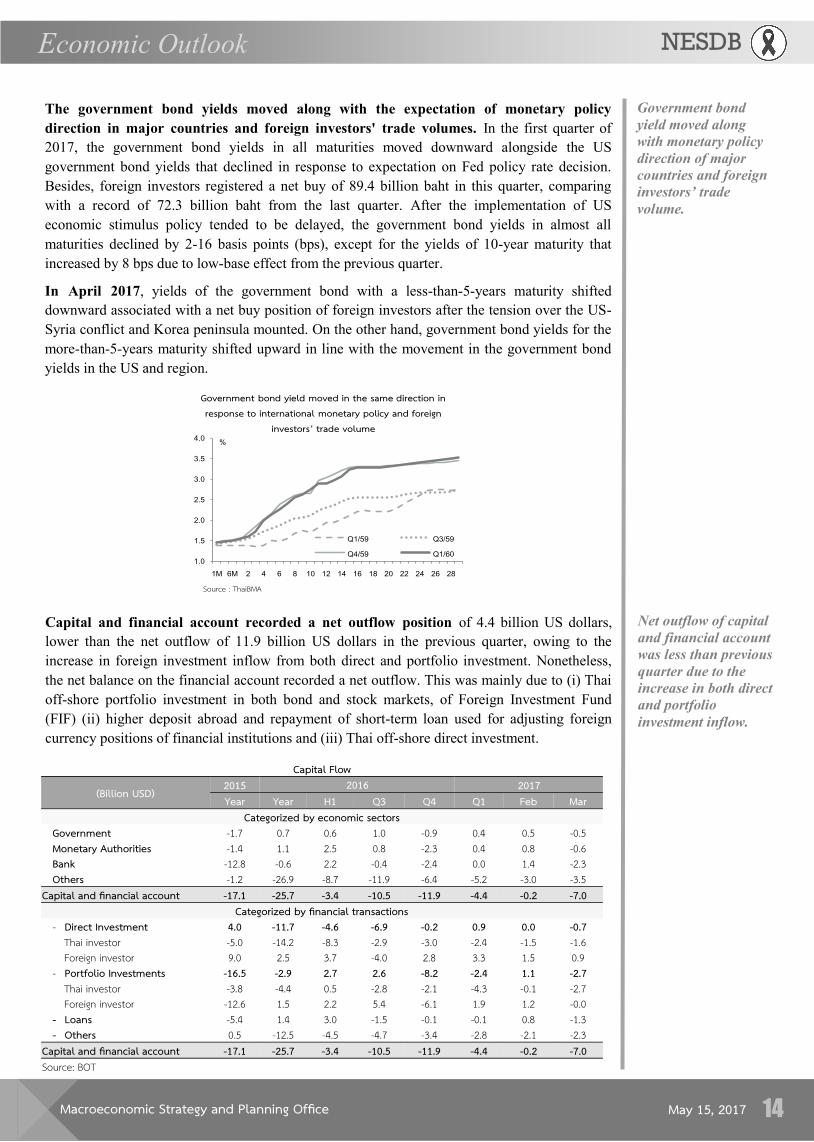
The government bond yields moved along with the expectation of monetary policy
direction in major countries and foreign investors' trade volumes. In the first quarter of
2017, the government bond yields in all maturities moved downward alongside the US
government bond yields that declined in response to expectation on Fed policy rate decision.
Besides, foreign investors registered a net buy of 89.4 billion baht in this quarter, comparing
with a record of 72.3 billion baht from the last quarter. After the implementation of US
economic stimulus policy tended to be delayed, the government bond yields in almost all
maturities declined by 2-16 basis points (bps), except for the yields of 10-year maturity that
increased by 8 bps due to low-base effect from the previous quarter.
In April 2017, yields of the government bond with a less-than-5-years maturity shifted
downward associated with a net buy position of foreign investors after the tension over the US-
Syria conflict and Korea peninsula mounted. On the other hand, government bond yields for the
more-than-5-years maturity shifted upward in line with the movement in the government bond
yields in the US and region.
Government bond
yield moved along
with monetary policy
direction of major
countries and foreign
investors’ trade
volume.
Net outflow of capital
and financial account
was less than previous
quarter due to the
increase in both direct
and portfolio
investment inflow.
Capital and financial account recorded a net outflow position of 4.4 billion US dollars,
lower than the net outflow of 11.9 billion US dollars in the previous quarter, owing to the
increase in foreign investment inflow from both direct and portfolio investment. Nonetheless,
the net balance on the financial account recorded a net outflow. This was mainly due to (i) Thai
off-shore portfolio investment in both bond and stock markets, of Foreign Investment Fund
(FIF) (ii) higher deposit abroad and repayment of short-term loan used for adjusting foreign
currency positions of financial institutions and (iii) Thai off-shore direct investment.
1.0
1.5
2.0
2.5
3.0
3.5
4.0
1M 6M 2 4 6 8 10 12 14 16 18 20 22 24 26 28
%
Q1/59 Q3/59
Q4/59 Q1/60
Government bond yield moved in the same direction in response to international monetary policy and foreign
investors’ trade volume
Source : ThaiBMA
Capital Flow
(Billion USD) 2015 2016 2017 Year Year H1 Q3 Q4 Q1 Feb Mar
Categorized by economic sectors Government -1.7 0.7 0.6 1.0 -0.9 0.4 0.5 -0.5 Monetary Authorities -1.4 1.1 2.5 0.8 -2.3 0.4 0.8 -0.6 Bank -12.8 -0.6 2.2 -0.4 -2.4 0.0 1.4 -2.3 Others -1.2 -26.9 -8.7 -11.9 -6.4 -5.2 -3.0 -3.5
Capital and financial account -17.1 -25.7 -3.4 -10.5 -11.9 -4.4 -0.2 -7.0 Categorized by financial transactions
- Direct Investment .0 -11.7 -4.6 -6.9 -0.2 0.9 0.0 -0.7 Thai investor -5.0 -14.2 -8.3 -2.9 -3.0 -2.4 -1.5 -1.6 Foreign investor 9.0 2.5 3.7 -4.0 2.8 3.3 1.5 0.9
- Portfolio Investments -16.5 -2.9 2.7 2.6 -8.2 -2.4 1.1 -2.7 Thai investor -3.8 -4.4 0.5 -2.8 -2.1 -4.3 -0.1 -2.7 Foreign investor -12.6 1.5 2.2 5.4 -6.1 1.9 1.2 -0.0
- Loans -5.4 1.4 3.0 -1.5 -0.1 -0.1 0.8 -1.3 - Others 0.5 -12.5 -4.5 -4.7 -3.4 -2.8 -2.1 -2.3
Capital and financial account -17.1 -25.7 -3.4 -10.5 -11.9 -4.4 -0.2 -7.0 Source: BOT
Macroeconomic Strategy and Planning Office
NESDB Economic Outlook
May 15, 2017 15
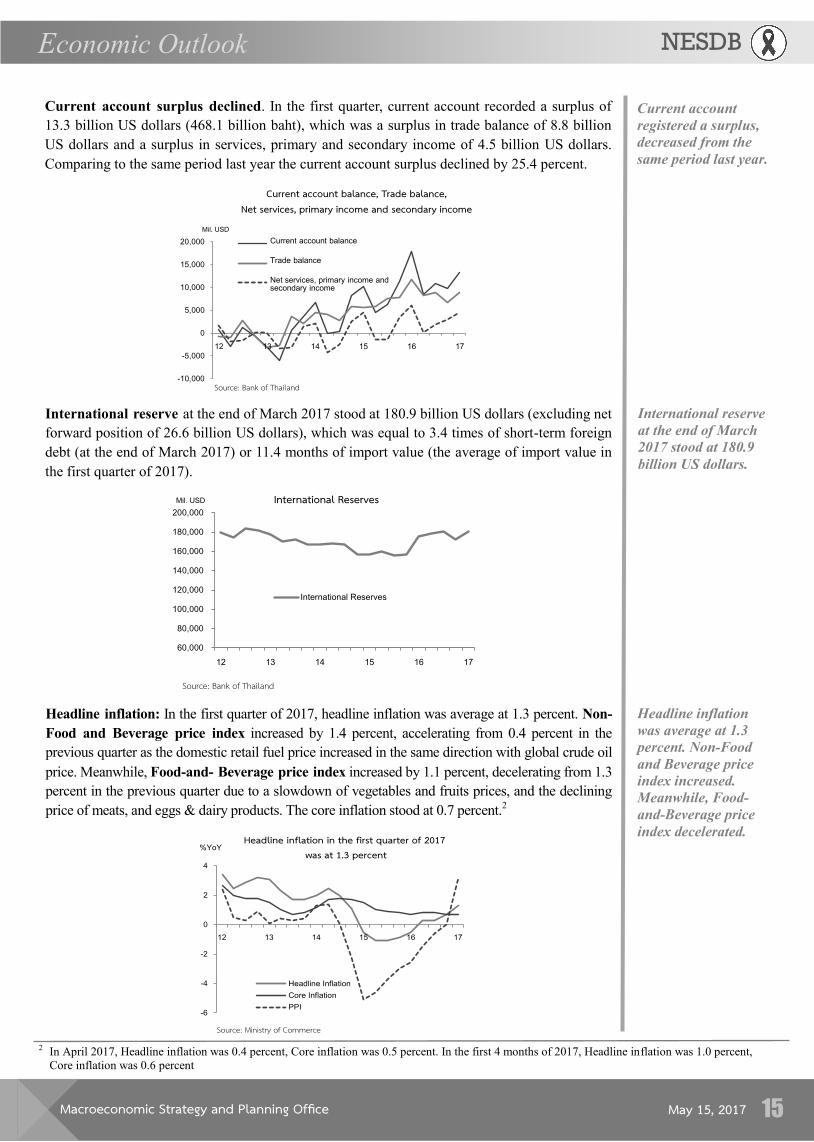
Current account surplus declined. In the first quarter, current account recorded a surplus of
13.3 billion US dollars (468.1 billion baht), which was a surplus in trade balance of 8.8 billion
US dollars and a surplus in services, primary and secondary income of 4.5 billion US dollars.
Comparing to the same period last year the current account surplus declined by 25.4 percent.
Current account
registered a surplus,
decreased from the
same period last year.
International reserve
at the end of March
2017 stood at 180.9
billion US dollars.
Source: Bank of Thailand-10,000
-5,000
0
5,000
10,000
15,000
20,000
Mil. USD
Current account balance, Trade balance,Net services, primary income and secondary income
Current account balance
Trade balance
Net services, primary income and secondary income
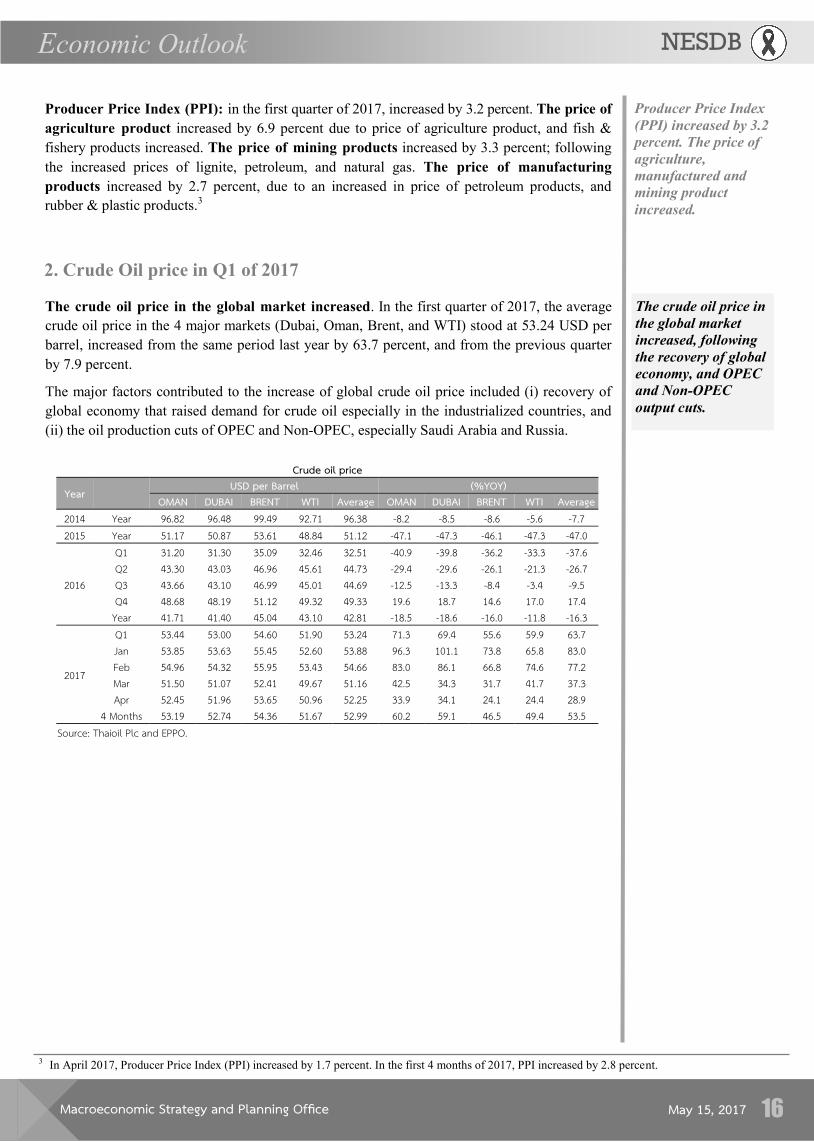
International reserve at the end of March 2017 stood at 180.9 billion US dollars (excluding net
forward position of 26.6 billion US dollars), which was equal to 3.4 times of short-term foreign
debt (at the end of March 2017) or 11.4 months of import value (the average of import value in
the first quarter of 2017).
Source: Bank of Thailand
60,000
80,000
100,000
120,000
140,000
160,000
180,000
200,000
Mil. USD International Reserves
International Reserves
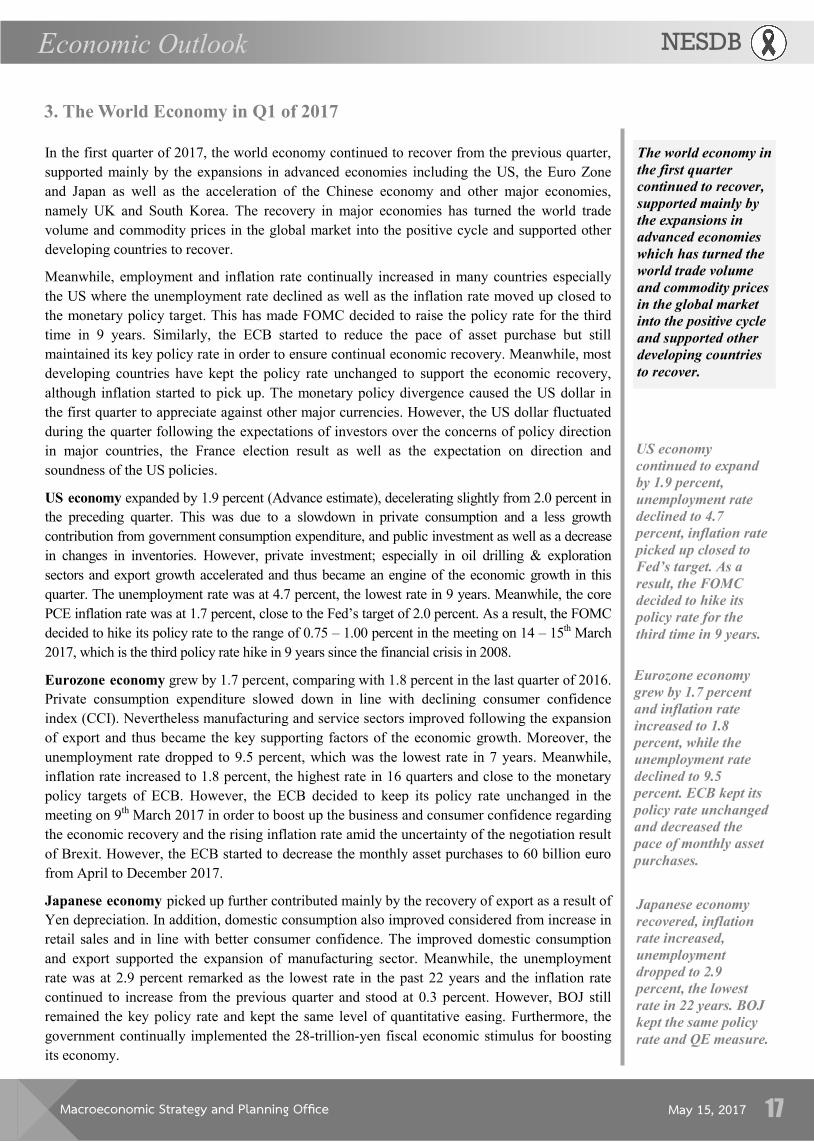
Headline inflation: In the first quarter of 2017, headline inflation was average at 1.3 percent. Non-
Food and Beverage price index increased by 1.4 percent, accelerating from 0.4 percent in the
previous quarter as the domestic retail fuel price increased in the same direction with global crude oil
price. Meanwhile, Food-and- Beverage price index increased by 1.1 percent, decelerating from 1.3
percent in the previous quarter due to a slowdown of vegetables and fruits prices, and the declining
price of meats, and eggs & dairy products. The core inflation stood at 0.7 percent.2
-6
-4
-2
0
2
4
%YoYHeadline inflation in the first quarter of 2017
was at 1.3 percent
Headline Inflation
Core Inflation
PPI
Source: Ministry of Commerce
2 In April 2017, Headline inflation was 0.4 percent, Core inflation was 0.5 percent. In the first 4 months of 2017, Headline inflation was 1.0 percent,
Core inflation was 0.6 percent
Headline inflation
was average at 1.3
percent. Non-Food
and Beverage price
index increased.
Meanwhile, Food-
and-Beverage price
index decelerated.
Macroeconomic Strategy and Planning Office
NESDB Economic Outlook
May 15, 2017 16
Producer Price Index (PPI): in the first quarter of 2017, increased by 3.2 percent. The price of
agriculture product increased by 6.9 percent due to price of agriculture product, and fish &
fishery products increased. The price of mining products increased by 3.3 percent; following
the increased prices of lignite, petroleum, and natural gas. The price of manufacturing
products increased by 2.7 percent, due to an increased in price of petroleum products, and
rubber & plastic products.3
Producer Price Index
(PPI) increased by 3.2
percent. The price of
agriculture,
manufactured and
mining product
increased.
3 In April 2017, Producer Price Index (PPI) increased by 1.7 percent. In the first 4 months of 2017, PPI increased by 2.8 percent.
2. Crude Oil price in Q1 of 2017
The crude oil price in the global market increased. In the first quarter of 2017, the average
crude oil price in the 4 major markets (Dubai, Oman, Brent, and WTI) stood at 53.24 USD per
barrel, increased from the same period last year by 63.7 percent, and from the previous quarter
by 7.9 percent.
The major factors contributed to the increase of global crude oil price included (i) recovery of
global economy that raised demand for crude oil especially in the industrialized countries, and
(ii) the oil production cuts of OPEC and Non-OPEC, especially Saudi Arabia and Russia.
Crude oil price
Year USD per Barrel (%YOY) OMAN DUBAI BRENT WTI Average OMAN DUBAI BRENT WTI Average
2014 Year 96.82 96.48 99.49 92.71 96.38 -8.2 -8.5 -8.6 -5.6 -7.7 2015 Year 51.17 50.87 53.61 48.84 51.12 -47.1 -47.3 -46.1 -47.3 -47.0
2016
Q1 31.20 31.30 35.09 32.46 32.51 -40.9 -39.8 -36.2 -33.3 -37.6 Q2 43.30 43.03 46.96 45.61 44.73 -29.4 -29.6 -26.1 -21.3 -26.7 Q3 43.66 43.10 46.99 45.01 44.69 -12.5 -13.3 -8.4 -3.4 -9.5 Q4 48.68 48.19 51.12 49.32 49.33 19.6 18.7 14.6 17.0 17.4
Year 41.71 41.40 45.04 43.10 42.81 -18.5 -18.6 -16.0 -11.8 -16.3
2017
Q1 53.44 53.00 54.60 51.90 53.24 71.3 69.4 55.6 59.9 63.7 Jan 53.85 53.63 55.45 52.60 53.88 96.3 101.1 73.8 65.8 83.0 Feb 54.96 54.32 55.95 53.43 54.66 83.0 86.1 66.8 74.6 77.2 Mar 51.50 51.07 52.41 49.67 51.16 42.5 34.3 31.7 41.7 37.3 Apr 52.45 51.96 53.65 50.96 52.25 33.9 34.1 24.1 24.4 28.9
4 Months 53.19 52.74 54.36 51.67 52.99 60.2 59.1 46.5 49.4 53.5 Source: Thaioil Plc and EPPO.
The crude oil price in
the global market
increased, following
the recovery of global
economy, and OPEC
and Non-OPEC
output cuts.
Macroeconomic Strategy and Planning Office
NESDB Economic Outlook
May 15, 2017 17
In the first quarter of 2017, the world economy continued to recover from the previous quarter,
supported mainly by the expansions in advanced economies including the US, the Euro Zone
and Japan as well as the acceleration of the Chinese economy and other major economies,
namely UK and South Korea. The recovery in major economies has turned the world trade
volume and commodity prices in the global market into the positive cycle and supported other
developing countries to recover.
Meanwhile, employment and inflation rate continually increased in many countries especially
the US where the unemployment rate declined as well as the inflation rate moved up closed to
the monetary policy target. This has made FOMC decided to raise the policy rate for the third
time in 9 years. Similarly, the ECB started to reduce the pace of asset purchase but still
maintained its key policy rate in order to ensure continual economic recovery. Meanwhile, most
developing countries have kept the policy rate unchanged to support the economic recovery,
although inflation started to pick up. The monetary policy divergence caused the US dollar in
the first quarter to appreciate against other major currencies. However, the US dollar fluctuated
during the quarter following the expectations of investors over the concerns of policy direction
in major countries, the France election result as well as the expectation on direction and
soundness of the US policies.
US economy expanded by 1.9 percent (Advance estimate), decelerating slightly from 2.0 percent in
the preceding quarter. This was due to a slowdown in private consumption and a less growth
contribution from government consumption expenditure, and public investment as well as a decrease
in changes in inventories. However, private investment; especially in oil drilling & exploration
sectors and export growth accelerated and thus became an engine of the economic growth in this
quarter. The unemployment rate was at 4.7 percent, the lowest rate in 9 years. Meanwhile, the core
PCE inflation rate was at 1.7 percent, close to the Fed’s target of 2.0 percent. As a result, the FOMC
decided to hike its policy rate to the range of 0.75 – 1.00 percent in the meeting on 14 – 15th March
2017, which is the third policy rate hike in 9 years since the financial crisis in 2008.
Eurozone economy grew by 1.7 percent, comparing with 1.8 percent in the last quarter of 2016.
Private consumption expenditure slowed down in line with declining consumer confidence
index (CCI). Nevertheless manufacturing and service sectors improved following the expansion
of export and thus became the key supporting factors of the economic growth. Moreover, the
unemployment rate dropped to 9.5 percent, which was the lowest rate in 7 years. Meanwhile,
inflation rate increased to 1.8 percent, the highest rate in 16 quarters and close to the monetary
policy targets of ECB. However, the ECB decided to keep its policy rate unchanged in the
meeting on 9th March 2017 in order to boost up the business and consumer confidence regarding
the economic recovery and the rising inflation rate amid the uncertainty of the negotiation result
of Brexit. However, the ECB started to decrease the monthly asset purchases to 60 billion euro
from April to December 2017.
Japanese economy picked up further contributed mainly by the recovery of export as a result of
Yen depreciation. In addition, domestic consumption also improved considered from increase in
retail sales and in line with better consumer confidence. The improved domestic consumption
and export supported the expansion of manufacturing sector. Meanwhile, the unemployment
rate was at 2.9 percent remarked as the lowest rate in the past 22 years and the inflation rate
continued to increase from the previous quarter and stood at 0.3 percent. However, BOJ still
remained the key policy rate and kept the same level of quantitative easing. Furthermore, the
government continually implemented the 28-trillion-yen fiscal economic stimulus for boosting
its economy.
US economy
continued to expand
by 1.9 percent,
unemployment rate
declined to 4.7
percent, inflation rate
picked up closed to
Fed’s target. As a
result, the FOMC
decided to hike its
policy rate for the
third time in 9 years.
Eurozone economy
grew by 1.7 percent
and inflation rate
increased to 1.8
percent, while the
unemployment rate
declined to 9.5
percent. ECB kept its
policy rate unchanged
and decreased the
pace of monthly asset
purchases.
3. The World Economy in Q1 of 2017
The world economy in
the first quarter
continued to recover,
supported mainly by
the expansions in
advanced economies
which has turned the
world trade volume
and commodity prices
in the global market
into the positive cycle
and supported other
developing countries
to recover.
Japanese economy
recovered, inflation
rate increased,
unemployment
dropped to 2.9
percent, the lowest
rate in 22 years. BOJ
kept the same policy
rate and QE measure.
Macroeconomic Strategy and Planning Office
NESDB Economic Outlook
May 15, 2017 18
Chinese economy expanded by 6.9 percent, slightly accelerating from 6.8 percent in the
preceding quarter which remarked as the highest rate in 6 quarters. The growth acceleration was
attributed by the export growth which was the first expansion in 8 quarters. In addition, the
growth was also supported by the expansion of manufacturing production, private consumption
and fixed asset investment under the infrastructure development plans. Meanwhile, the
implementation on capital control measure had improved the external economic stability. At the
end of March 2017, the foreign reserves increased to 3,009.1 billion US dollar, an increase for a
second straight month and had thus made the Chinese Yuan to become more stable.
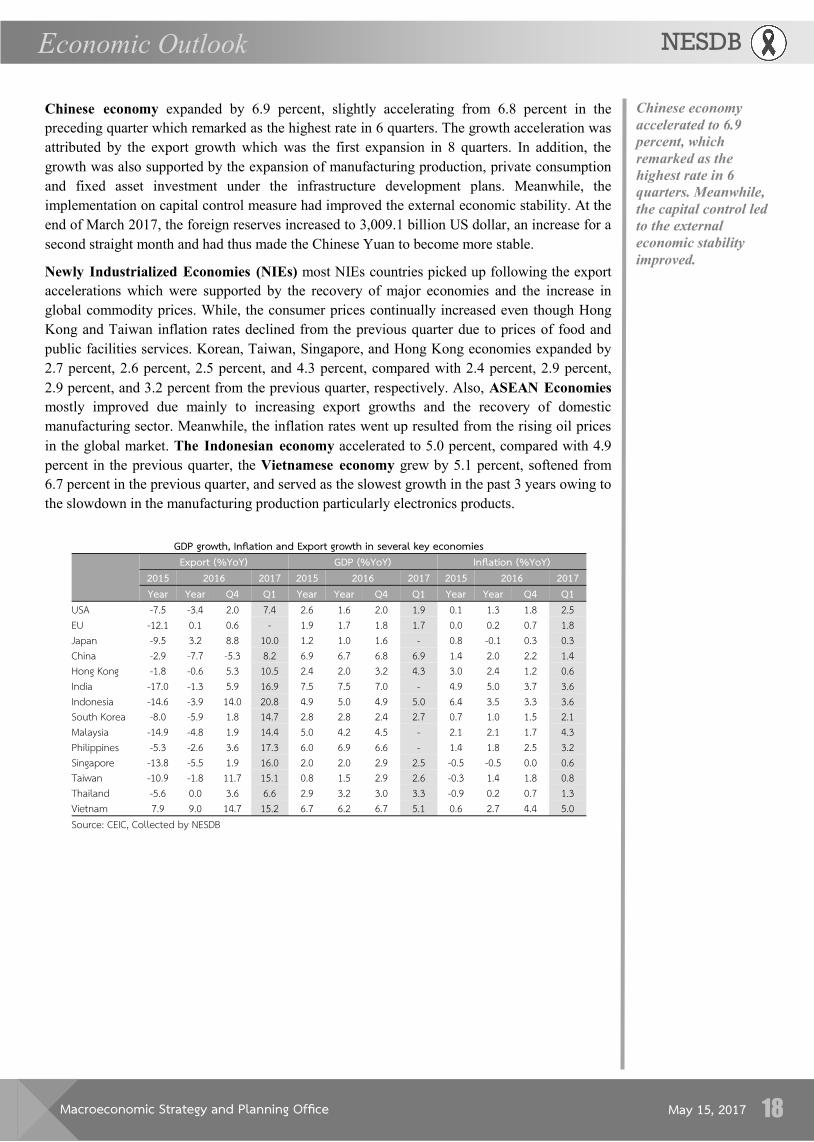
Newly Industrialized Economies (NIEs) most NIEs countries picked up following the export
accelerations which were supported by the recovery of major economies and the increase in
global commodity prices. While, the consumer prices continually increased even though Hong
Kong and Taiwan inflation rates declined from the previous quarter due to prices of food and
public facilities services. Korean, Taiwan, Singapore, and Hong Kong economies expanded by
2.7 percent, 2.6 percent, 2.5 percent, and 4.3 percent, compared with 2.4 percent, 2.9 percent,
2.9 percent, and 3.2 percent from the previous quarter, respectively. Also, ASEAN Economies
mostly improved due mainly to increasing export growths and the recovery of domestic
manufacturing sector. Meanwhile, the inflation rates went up resulted from the rising oil prices
in the global market. The Indonesian economy accelerated to 5.0 percent, compared with 4.9
percent in the previous quarter, the Vietnamese economy grew by 5.1 percent, softened from
6.7 percent in the previous quarter, and served as the slowest growth in the past 3 years owing to
the slowdown in the manufacturing production particularly electronics products.
Chinese economy
accelerated to 6.9
percent, which
remarked as the
highest rate in 6
quarters. Meanwhile,
the capital control led
to the external
economic stability
improved.
GDP growth, Inflation and Export growth in several key economies
Export (%YoY) GDP (%YoY) Inflation (%YoY)
2015 2016 2017 2015 2016 2017 2015 2016 2017 Year Year Q4 Q1 Year Year Q4 Q1 Year Year Q4 Q1
USA -7.5 -3.4 2.0 7.4 2.6 1.6 2.0 1.9 0.1 1.3 1.8 2.5 EU -12.1 0.1 0.6 - 1.9 1.7 1.8 1.7 0.0 0.2 0.7 1.8 Japan -9.5 3.2 8.8 10.0 1.2 1.0 1.6 - 0.8 -0.1 0.3 0.3 China -2.9 -7.7 -5.3 8.2 6.9 6.7 6.8 6.9 1.4 2.0 2.2 1.4 Hong Kong -1.8 -0.6 5.3 10.5 2.4 2.0 3.2 4.3 3.0 2.4 1.2 0.6 India -17.0 -1.3 5.9 16.9 7.5 7.5 7.0 - 4.9 5.0 3.7 3.6 Indonesia -14.6 -3.9 14.0 20.8 4.9 5.0 4.9 5.0 6.4 3.5 3.3 3.6 South Korea -8.0 -5.9 1.8 14.7 2.8 2.8 2.4 2.7 0.7 1.0 1.5 2.1 Malaysia -14.9 -4.8 1.9 14.4 5.0 4.2 4.5 - 2.1 2.1 1.7 4.3 Philippines -5.3 -2.6 3.6 17.3 6.0 6.9 6.6 - 1.4 1.8 2.5 3.2 Singapore -13.8 -5.5 1.9 16.0 2.0 2.0 2.9 2.5 -0.5 -0.5 0.0 0.6 Taiwan -10.9 -1.8 11.7 15.1 0.8 1.5 2.9 2.6 -0.3 1.4 1.8 0.8 Thailand -5.6 0.0 3.6 6.6 2.9 3.2 3.0 3.3 -0.9 0.2 0.7 1.3 Vietnam 7.9 9.0 14.7 15.2 6.7 6.2 6.7 5.1 0.6 2.7 4.4 5.0 Source: CEIC, Collected by NESDB
Macroeconomic Strategy and Planning Office
NESDB Economic Outlook
May 15, 2017 19
The world economy in 2017 has continued to improve according to the improvement of
economic fundamental in major countries especially in the US, Euro Zone and Japan as well as
the positive sign of Chinese external economic stability and the alleviated political uncertainty
in Europe after the French election. While the increase in world trade and commodity prices in
the global market would continually underpin the growth in developing countries in Asia.
Therefore, in 2017, the world growth is projected to accelerate to 3.3 percent in 2017 from 3.1
percent in 2016, as the key economies have already entered to the recovery phase of economic
cycle. In particular, the US economy has reached the full employment and inflation pressure
persisted, thus Fed is likely to hike its policy rate continuously in the remaining of 2017.
Meanwhile, ECB and other major economies are likely to maintain the policy rate to ensure
economic recovery and to return the inflation to monetary policy target but some countries
possibly reverse their policy directions by the fourth quarter of 2017. Therefore, the global
interest rate will be moderately uptrend.
Under the baseline scenario, the US economy is projected to expand by 2.2 percent, accelerating
from 1.6 percent in 2016. Although, the economic growth slowed down in the first quarter and the
progress of Trump’s policy still faced high uncertainty, the economic acceleration will be
supported by the improvement in economic fundamental. This includes; (i) the lowest ratio of
household debt to disposable income within 12 years, (ii) the strong growth of consumer loan of
6.0 percent brought about easing liquidity, (iii) the historical high housing and equity price, and
(iv) the lowest unemployment rate in 9 years. In addition, consumer sentiment index was at the
highest level in 12 years. Under such conditions, inflationary pressure tends to persist and the Fed
is likely to hike its policy rate twice in the rest of 2017.
Eurozone economy is expected to grow by 1.6 percent, comparing with 1.7 percent in 2016.
The supporting factors for such growth is the expansion of EU member economies due to the
progress of economic reform and QE in the past as well as the improvement of the key trading
partners economies and the improvement of consumer and business confidence after the French
presidential election 2017. The economic recovery led to the decrease of unemployment rate
gradually and clearly. As inflation rate approaches in the monetary policy targets, ECB then
decided to decrease the net asset purchases level in the past April 2017. In the remaining of this
year, the ECB is likely to keep its policy rate unchanged and to ensure sustain pace of economic
and inflation recovery through the uncertainty from Brexit negotiation and election outcome in
the German federal election 2017 as well as Italian political condition. Nevertheless, the ECB
may begin to reconsider its approach to monetary policy if the risk factors for sustainability of
economic recovery decline and inflation rate return to sustainable goals.
Japanese economy is expected to grow by 1.2 percent, a gradual pick up from 1.0-percent
growth in 2016, underpinned by the core improvement of manufacturing sector and export
following the recovery in major trading-partner economies and Yen depreciation. Likewise, the
domestic demand acceleration is supposed to be supported by the expansion of (i) household
income and consumption brought about by the improvement of manufacturing sector, low level
of interest rate and unemployment rate, and (ii) increasing government demand which is
stimulated by fiscal policy. Furthermore, the increase in energy prices is expected to help
inflation back into the positive territory sustainably but unlikely to return to its target in 2017.
Under such conditions, BOJ is likely to remain its policy rate and QE measure at the same level.
The world economy
expanded by 3.3
percent in 2017,
improved from 3.1
percent in 2016.
US economy
improved into full
employment.
Meanwhile, the
inflationary pressure
increase more clearly.
As a result, the Fed is
likely to raise its
policy rate
continually.
4. The World Economic Outlook for 2017
Eurozone economy
expand by 1.6 percent
and inflation
approaches in targets,
ECB decided to
decrease QE but tends
to maintain policy
rate throughout 2017.
Japanese economy
gradually expanded
while inflation
returned to be positive
yet still unable to
move into its policy
target. BOJ tends to
continuously
maintain the QE
measure.
Macroeconomic Strategy and Planning Office
NESDB Economic Outlook
May 15, 2017 20
Chinese economy is likely to grow by 6.6 percent; the growth will be underpinned by recovery
of export, manufacturing production, and the economic stimulus packages on infrastructure
investment by the government. Nevertheless, the economic growth in 2017 is likely to slow
down from 6.7 percent in the previous year due to the economic restructuring policy and
resolves financial instability.
The NIEs is projected to gradually improve following the recovery of export and domestic
demand. NIEs economies: Hong Kong, Singapore, and Taiwan are expected to grow by 3.0, 2.4,
and 2.0 percent, accelerating from 2.0, 2.0, and 1.5 percent in 2016, respectively. While, Korea
economy is likely to grow by 2.6 percent, decelerating from 2.8 percent in 2016. Additionally,
ASEAN economies are likely to be accelerated due mainly to the improvement of export
following the economic recovery of trade partners and rising global market commodity prices.
In the baseline scenario, the Indonesian, Malaysian, Philippines and Vietnamese economies are
expected to grow by 5.4, 4.6, 6.0 and 6.0 percent, compared to 5.0, 4.2, 6.9 and 6.2 percent in
2016, respectively.
Chinese economy is
likely to slow down
gradually following
the limitations from
the economic
restructuring policy,
and the resolves of
troubled assets in
financial sector.
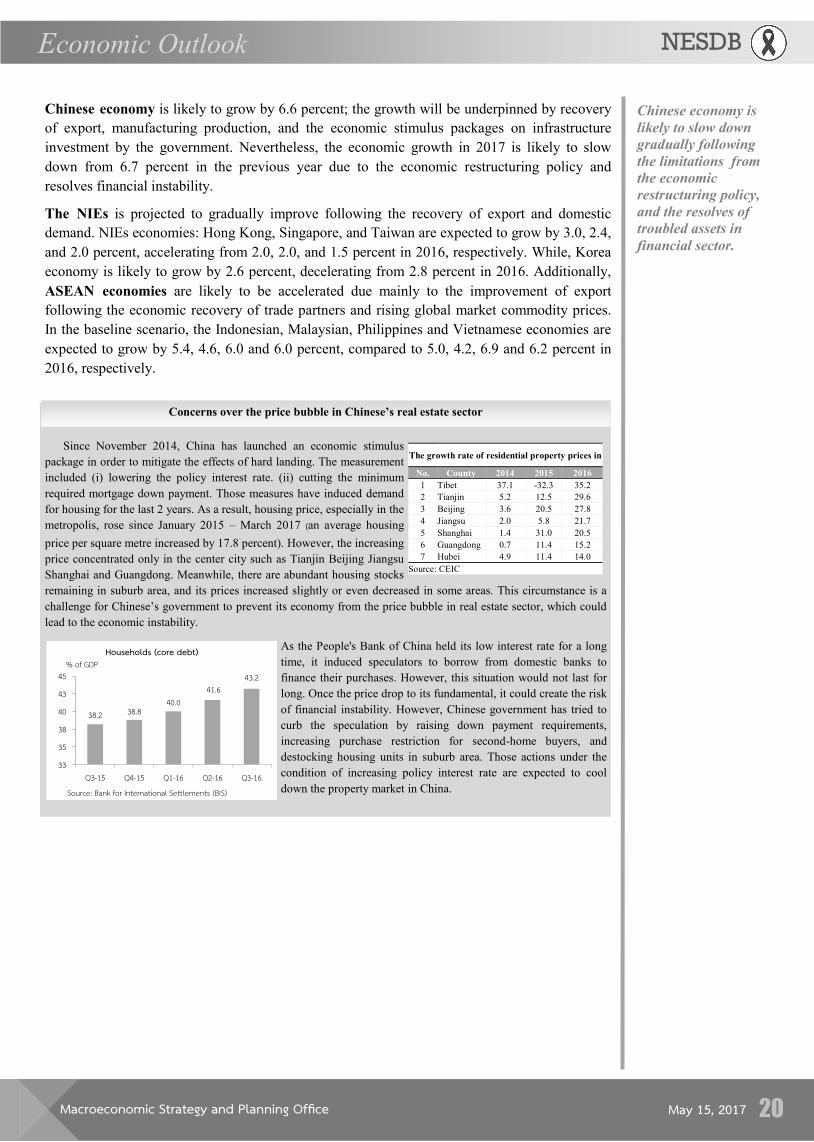
Since November 2014, China has launched an economic stimulus
package in order to mitigate the effects of hard landing. The measurement
included (i) lowering the policy interest rate. (ii) cutting the minimum
required mortgage down payment. Those measures have induced demand
for housing for the last 2 years. As a result, housing price, especially in the
metropolis, rose since January 2015 – March 2017 (an average housing
price per square metre increased by 17.8 percent). However, the increasing
price concentrated only in the center city such as Tianjin Beijing Jiangsu
Shanghai and Guangdong. Meanwhile, there are abundant housing stocks
remaining in suburb area, and its prices increased slightly or even decreased in some areas. This circumstance is a
challenge for Chinese’s government to prevent its economy from the price bubble in real estate sector, which could
lead to the economic instability.
As the People's Bank of China held its low interest rate for a long
time, it induced speculators to borrow from domestic banks to
finance their purchases. However, this situation would not last for
long. Once the price drop to its fundamental, it could create the risk
of financial instability. However, Chinese government has tried to
curb the speculation by raising down payment requirements,
increasing purchase restriction for second-home buyers, and
destocking housing units in suburb area. Those actions under the
condition of increasing policy interest rate are expected to cool
down the property market in China.
Concerns over the price bubble in Chinese’s real estate sector
The growth rate of residential property prices in
No. County 2014 2015 2016
1 Tibet 37.1 -32.3 35.2
2 Tianjin 5.2 12.5 29.6
3 Beijing 3.6 20.5 27.8
4 Jiangsu 2.0 5.8 21.7
5 Shanghai 1.4 31.0 20.5
6 Guangdong 0.7 11.4 15.2
7 Hubei 4.9 11.4 14.0
Source: CEIC
38.2 38.840.0
41.643.2
33
35
38
40
43
45
Q3-15 Q4-15 Q1-16 Q2-16 Q3-16
Households (core debt) % of GDP
Source: Bank for International Settlements (BIS)
Macroeconomic Strategy and Planning Office
NESDB Economic Outlook
May 15, 2017 21
The Thai economy tends to perform well throughout the year 2017. For the rest of the year, the
pace of growth is expected to accelerate gradually with a more broad-based expansion. Key
supporting factors include (i) the recovery of the export in tandem with the pickup of key
trading partners’ economies and the global commodity prices, (ii) the high and accelerated
growth of public investment, (iii) the acceleration of the agricultural production and favorable
agricultural prices, (iv) the favorable expansion of the tourism sector which continually support
the overall economy, and (v) the improvement of domestic car market. The economic stability is
expected to remain favorable. The headline inflation is likely to remain low; trade balance and
current account continue to be in surplus despite relatively lower than that of in 2016, as a result
of increasing oil price as well as the domestic demand and export recovery. Meanwhile,
household debt tends to gradually decline and employment is expected to improve following the
household income recovery.
Nonetheless, the improvement of the Thai economy still faces with some limitations from high
excess production capacity which become constraints for new investment to expand production
capacity. In addition, there would also be risk factors from the direction of the US trade policy
toward protectionism, the volatility of capital flows and exchange rate of major currencies, and
sustainability of agricultural price increase that can be jeopardized by oil price fluctuation.
5. Thai Economic Outlook for 2017
Supporting factors for the economic growth :
1) The export sector is expected to continue its expansion in line with the economic recovery of
major trading partners as well as increases in global commodity prices. Export value in the first
quarter of 2017 grew by 6.6 percent, accelerating from a 0.4 and 3.6 percent in the third and the
fourth quarter of 2016, respectively. This was owed to the increase in export volume and export
price of 2.8 percent and 3.7 percent, respectively. Likewise, export value (excluding unwrought
gold) increased by 9.0 percent, the highest growth rate in 17 quarters. In the remaining of 2017,
major trading partners’ economies, including US, EU, Japan and ASEAN(5) (sharing about 44.1
percent of Thailand’s export value), tend to expand at a faster pace. For China, which is
accounted for 12.7 percent share of Thailand’s export value, it is expected that the economy still
continued its expansion though might see some slowdowns from the first quarter. Similarly to
CLMV’s economies, which is accounted for 10.6 percent of the total export market, tends to
have an accelerated growth due to the recovery of agriculture production after drought conditions
eased. Altogether with increases in global primary commodity prices, it is likely that export
value in the remaining of 2017 will accelerate gradually and contribute more to the economic
expansion.
2) The high and accelerated growth of public investment, which is supported by; (i) the
remaining capital budget of 63.4 percent of total FY 2017capital budget. (ii) the remaining FY
2017 supplementary budget of 189,889.6 million baht out of 190,000 million baht. (iii) the
FY2018 annual budget of 2,900 billion baht with a capital budget amounted 667.0 billion baht
(increasing by 10 percent from the previous year) which will start disbursed in the last quarter of
2017 (October – December 2017), (iv) the 2017 SOE capital budget of 580,980 million baht
which is expected that its disbursement will increase following the progress in government
infrastructure projects, especially the projects under 2016 Transport Infrastructure Action Plan,
which worth 1,383.9 billion baht. Under such plan, 8 projects worth 330.34 billion baht already
started construction (increasing from 2 and 4 projects at the beginning of 2016 and at the end of
2016, respectively), and another 36 projects (worth 895.6 billion baht) under the 2017 Action
Plan which is expected to start construction this year.
Macroeconomic Strategy and Planning Office
NESDB Economic Outlook
May 15, 2017 22
3) The acceleration of the agricultural production and favorable agricultural prices that
started during the second half of 2016 and became more significant in 2017. In the first
quarter of 2017, agricultural production and farm income increased by 7.1 and 20.1 percent,
improving from a 0.1 percent production contraction and a 11.4 percent farm income’s
growth in the third quarter of 2016 as well as from an production increase of 2.4 percent and
farm income’s increase of 6.0 percent in the fourth quarter of 2016. This was in line with a
favorable improvement of key indicators of household expenditure in the rural economy.
During the remaining of 2017, agricultural production tended to continually expand due
mainly to the more favorable water level in 4 major dams in Chaopraya basin, and higher
price of major agricultural products comparing with last year which will lead to favorable
improvement in farm income, household consumption and overall economic expansion.
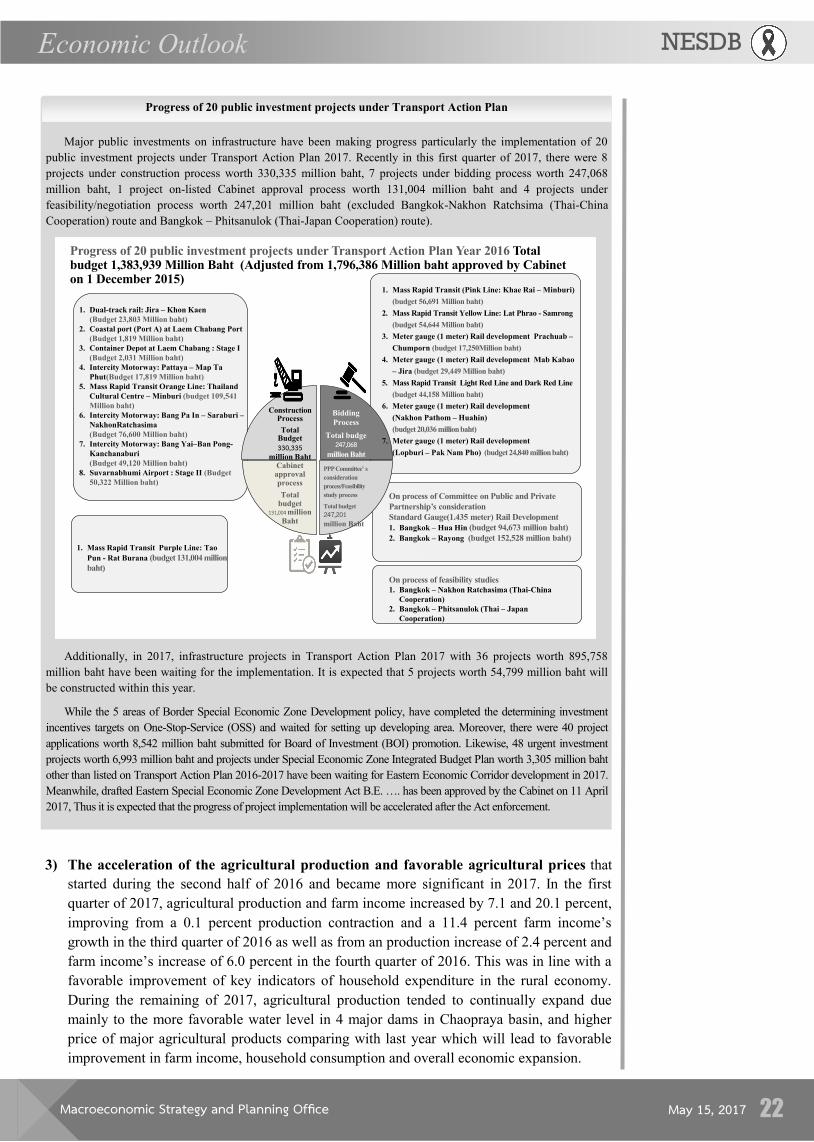
Major public investments on infrastructure have been making progress particularly the implementation of 20
public investment projects under Transport Action Plan 2017. Recently in this first quarter of 2017, there were 8
projects under construction process worth 330,335 million baht, 7 projects under bidding process worth 247,068
million baht, 1 project on-listed Cabinet approval process worth 131,004 million baht and 4 projects under
feasibility/negotiation process worth 247,201 million baht (excluded Bangkok-Nakhon Ratchsima (Thai-China
Cooperation) route and Bangkok – Phitsanulok (Thai-Japan Cooperation) route).
Additionally, in 2017, infrastructure projects in Transport Action Plan 2017 with 36 projects worth 895,758
million baht have been waiting for the implementation. It is expected that 5 projects worth 54,799 million baht will
be constructed within this year.
While the 5 areas of Border Special Economic Zone Development policy, have completed the determining investment
incentives targets on One-Stop-Service (OSS) and waited for setting up developing area. Moreover, there were 40 project
applications worth 8,542 million baht submitted for Board of Investment (BOI) promotion. Likewise, 48 urgent investment
projects worth 6,993 million baht and projects under Special Economic Zone Integrated Budget Plan worth 3,305 million baht
other than listed on Transport Action Plan 2016-2017 have been waiting for Eastern Economic Corridor development in 2017.
Meanwhile, drafted Eastern Special Economic Zone Development Act B.E. …. has been approved by the Cabinet on 11 April
2017, Thus it is expected that the progress of project implementation will be accelerated after the Act enforcement.
Progress of 20 public investment projects under Transport Action Plan
ConstructionProcess
Total Budget
0, 5 million Baht
Bidding
Process
Total budge
247,068million Baht
PPP Committee’ s
consideration
process/Feasibility
study process
Total budget
2 7,201 million Baht
Cabinet approval process
Total budget
1 1,00 million
Baht
1. Dual-track rail: Jira – Khon Kaen
(Budget 23,803 Million baht)
2. Coastal port (Port A) at Laem Chabang Port
(Budget 1,819 Million baht)
3. Container Depot at Laem Chabang : Stage I
(Budget 2,031 Million baht)
4. Intercity Motorway: Pattaya – Map Ta
Phut(Budget 17,819 Million baht)
5. Mass Rapid Transit Orange Line: Thailand
Cultural Centre – Minburi (budget 109,541
Million baht)
6. Intercity Motorway: Bang Pa In – Saraburi –
NakhonRatchasima
(Budget 76,600 Million baht)
7. Intercity Motorway: Bang Yai–Ban Pong-
Kanchanaburi
(Budget 49,120 Million baht)
8. Suvarnabhumi Airport : Stage II (Budget
50,322 Million baht)
1. Mass Rapid Transit Purple Line: Tao
Pun - Rat Burana (budget 131,004 million
baht)
1. Mass Rapid Transit (Pink Line: Khae Rai – Minburi)
(budget 56,691 Million baht)
2. Mass Rapid Transit Yellow Line: Lat Phrao - Samrong
(budget 54,644 Million baht)
3. Meter gauge (1 meter) Rail development Prachuab –
Chumporn (budget 17,250Million baht)
4. Meter gauge (1 meter) Rail development Mab Kabao
– Jira (budget 29,449 Million baht)
5. Mass Rapid Transit Light Red Line and Dark Red Line
(budget 44,158 Million baht)
6. Meter gauge (1 meter) Rail development
(Nakhon Pathom – Huahin)
(budget 20,036 million baht)
7. Meter gauge (1 meter) Rail development
(Lopburi – Pak Nam Pho) (budget 24,840 million baht)
On process of Committee on Public and Private
Partnership’s consideration
Standard Gauge(1.435 meter) Rail Development
1. Bangkok – Hua Hin (budget 94,673 million baht)
2. Bangkok – Rayong (budget 152,528 million baht)
On process of feasibility studies
1. Bangkok – Nakhon Ratchasima (Thai-China
Cooperation)
2. Bangkok – Phitsanulok (Thai – Japan
Cooperation)
Progress of 20 public investment projects under Transport Action Plan Year 2016 Total budget 1,383,939 Million Baht (Adjusted from 1,796,386 Million baht approved by Cabinet on 1 December 2015)
Macroeconomic Strategy and Planning Office
NESDB Economic Outlook
May 15, 2017 23
4) Tourism receipts tend to favorably expand and further support the economy. In the first
quarter of 2017, receipts from foreign tourists increased by 3.9 percent, accelerating from
2.9 percent in the last quarter of 2016. Higher growth was contributed by tourists from
Russia (8.0 percent share), U.S.A., (4.4 percent share), and France (4.1 percent share), with
an expansion of 32.4, 13.1, and 9.4 percent, respectively. Meanwhile, despite a 4.3 percent
contraction of tourism receipts from Chinese tourists (25.8 percent share), it improved
comparing with a 19.5 percent contraction in the fourth quarter of 2016. In the remaining of
2017, it is estimated that tourism receipts will grow at accelerated pace, contributed by (i)
the improvement of tourism receipts from Chinese tourists that is expected to show a
positive growth in the third quarter of 2017 and (ii) the continued expansion of tourism
receipts from other countries, especially from Russia, U.S.A., and France, following an
economic recovery in major countries.
5) The improvement of domestic car market supported by (i) the ending of the first-car buyer
scheme’s stipulation which allows those first-car buyers (about 1.12 million people) to sell their
vehicles and purchase a new one, (ii) the closure of debt burden from the first-car buyers, which
was in line with a gradual decrease of household debts to GDP from 81.2 percent at the end of
2015 to 79.9 percent at the end of 2016, and (iii) the increasing of farm income and the
launching of new car model in 2017. However, the car production for export will face with some
constraints of economic conditions and policy directions of some major export markets.
Limitation and Risk Factors:
1) Excess production capacity in manufacturing sector still remains high, which limits the
expansion of private investment. Over the period of 2013 to 2016, export volume contracted
by 0.7 percent on average and reduced capacity utilization in manufacturing sector and
constraints private investment as seen from a continual contraction of private investment by
1.5, 0.8, 2.2 percent in 2013, 2014, 2015 and a sluggish expansion of 0.4 percent in 2016.
However, export volume started to pick up in the last quarter of 2016 and improved further
in the first quarter of 2017 but it has not yet adequately reduced excess production capacity
and continues to limit private investment as shown by a 1.1 percent decline in private
investment in the first quarter. This was just the early stage of export recovery. Nevertheless,
as the recovery of domestic demand, exports, and the global economy will be clearer in the
remaining of the year, the industries currently running at 70 percent capacity and the BOI
approved projects tend to accelerate their investments.
2) Capital flows and exchange rate tend to be volatile. Despite the improvement of political
conditions in Europe after the result of French presidential election in May 2017, during the
remaining of 2017, the risks of capital flow and exchange rate volatility remain high due to
uncertainty from geopolitical tensions, the progress on Brexit negotiation, the expectation on
monetary policy direction of major advanced economies, the economic recovery in China that
could be jeopardized by financial instability as well as the upcoming federation election result in
Germany in September 2017 and parliamentary election in Italy during the early of 2018.
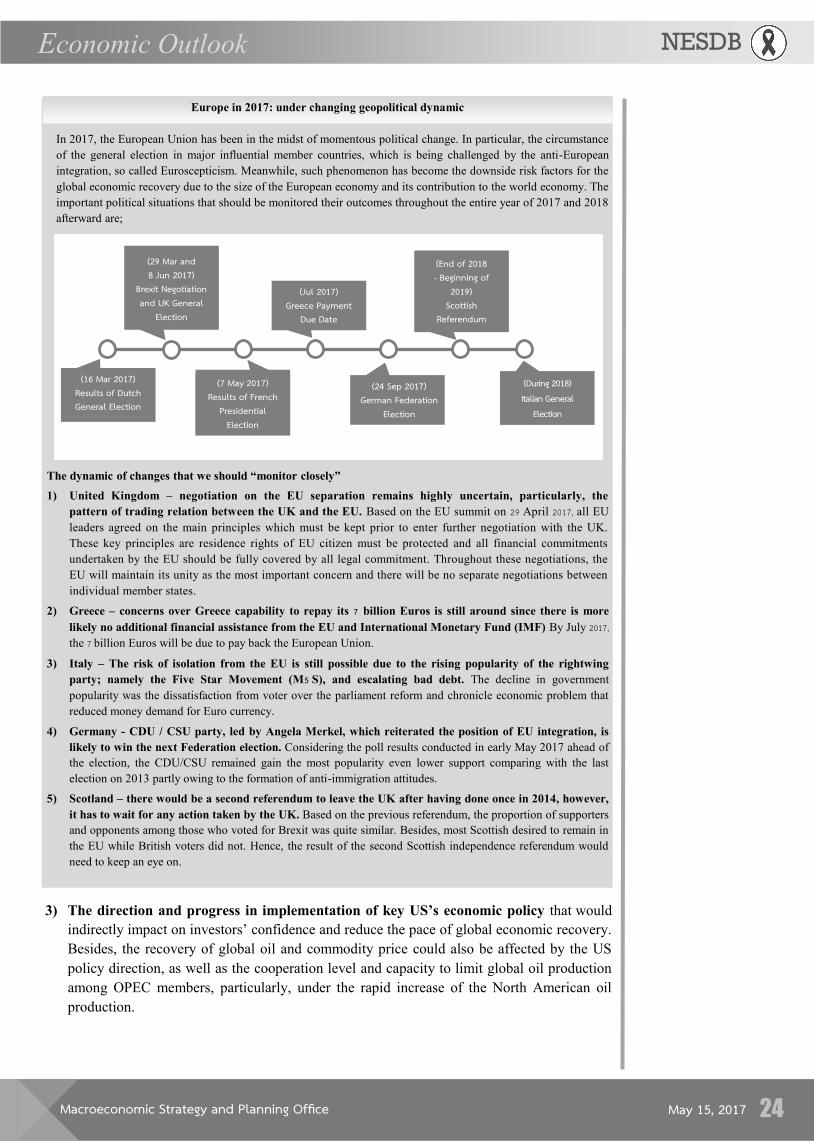
Macroeconomic Strategy and Planning Office
NESDB Economic Outlook
May 15, 2017 24
3) The direction and progress in implementation of key US’s economic policy that would
indirectly impact on investors’ confidence and reduce the pace of global economic recovery.
Besides, the recovery of global oil and commodity price could also be affected by the US
policy direction, as well as the cooperation level and capacity to limit global oil production
among OPEC members, particularly, under the rapid increase of the North American oil
production.
In 2017, the European Union has been in the midst of momentous political change. In particular, the circumstance
of the general election in major influential member countries, which is being challenged by the anti-European
integration, so called Euroscepticism. Meanwhile, such phenomenon has become the downside risk factors for the
global economic recovery due to the size of the European economy and its contribution to the world economy. The
important political situations that should be monitored their outcomes throughout the entire year of 2017 and 2018 afterward are;
The dynamic of changes that we should “monitor closely”
1) United Kingdom – negotiation on the EU separation remains highly uncertain, particularly, the
pattern of trading relation between the UK and the EU. Based on the EU summit on 29 April 2017, all EU
leaders agreed on the main principles which must be kept prior to enter further negotiation with the UK.
These key principles are residence rights of EU citizen must be protected and all financial commitments
undertaken by the EU should be fully covered by all legal commitment. Throughout these negotiations, the
EU will maintain its unity as the most important concern and there will be no separate negotiations between
individual member states.
2) Greece – concerns over Greece capability to repay its 7 billion Euros is still around since there is more
likely no additional financial assistance from the EU and International Monetary Fund (IMF) By July 2017, the 7 billion Euros will be due to pay back the European Union.
3) Italy – The risk of isolation from the EU is still possible due to the rising popularity of the rightwing
party; namely the Five Star Movement (M5 S), and escalating bad debt. The decline in government
popularity was the dissatisfaction from voter over the parliament reform and chronicle economic problem that
reduced money demand for Euro currency.
4) Germany - CDU / CSU party, led by Angela Merkel, which reiterated the position of EU integration, is
likely to win the next Federation election. Considering the poll results conducted in early May 2017 ahead of
the election, the CDU/CSU remained gain the most popularity even lower support comparing with the last
election on 2013 partly owing to the formation of anti-immigration attitudes.
5) Scotland – there would be a second referendum to leave the UK after having done once in 2014, however,
it has to wait for any action taken by the UK. Based on the previous referendum, the proportion of supporters
and opponents among those who voted for Brexit was quite similar. Besides, most Scottish desired to remain in
the EU while British voters did not. Hence, the result of the second Scottish independence referendum would
need to keep an eye on.
Europe in 2017: under changing geopolitical dynamic
(16 Mar 2017)
Results of Dutch General Election
(29 Mar and Jun 2017)
Brexit Negotiation and UK General
Election
(7 May 2017)
Results of French Presidential
Election
(Jul 2017) Greece Payment
Due Date
(During 2018) Italian General
Election
(2 Sep 2017) German Federation
Election
(End of 2018 - Beginning of
2019) Scottish
Referendum
Macroeconomic Strategy and Planning Office
NESDB Economic Outlook
May 15, 2017 25
1) In 2017, the world economy and world trade volume expand by 3.3 percent and 3.6
percent, accelerating from 3.1-percent and 2.6-percent growth rates in 2016,
respectively and equivalent to the previous projection. The expansion of economy in the
major countries in the first quarter of 2017 was in line with the baseline scenario in previous
assumption. Furthermore, the global economy during the rest of year will recover
continually led by the economic acceleration of the US and improvement of economies in
Japan, India, and several developing countries which could offset the gradual slowdown of
the Chinese economy.
2) The average Thai baht value in 2017 is expected to fall within the range of 35.0 – 36.0
Baht per US dollar, slightly depreciating from 35.29 baht per US dollar in 2015 and
revised from the assumption of 35.5 – 36.5 baht per US dollar in previous projection.
The revision is based upon following the average Thai baht value in the first 4 months at
34.95 baht per US dollar depreciating slower than the previous scenario due to alteration of
investors’ expectation on the direction and the progress of the US key economic policies as
well as the tensions over Korean Peninsula and Syria which has made the US dollar to
appreciate more than the earlier scenario. However, in the remaining of this year Thai baht
value is likely to depreciate following the acceleration of the US economy and the
expectation of the Fed rate hike which for the base line scenario it is assumed that Fed will
increase rates twice in the remaining of this year.
3) The average Dubai crude oil price in 2017 is expected to be in the range of 47.0 – 57.0
US dollar per barrel, higher than the average of 41.4 US dollar per barrel in 2016 and
remain unchanged of assumption from the previous projection. Supporting factors for
higher oil price are (i) the accomplishment of the oil reducing production agreement among
OPEC and non-OPEC member countries in which that the current data suggested OPEC and
non-OPEC compliance rate of 99 percent and 64 percent of total agreed oil cut level,
respectively (data at the end of April 2017). This reflected better collaboration compared to
average rate in the past, (ii) increasing oil demand as a result of improving global economic
conditions, and (iii) potential risks that may arise from political unrest in Libya.
Nevertheless, there are some factors that might cause oil prices to increase only gradually
including (i) high level of oil stock, (ii) increasing production of shale oil in the North
America, especially the US (data on May 5 revealed that the US’s operating oil rigs
increased to 877 rigs), (iii) a trend of US dollar appreciation in response to policy rate hike,
and (iv) slowdown of the Chinese and the EU economies which are major oil consumers.
Key assumptions for 2017 economic projection:
World Economic Projection
Actual Data Projection of 2017 2015 2016 Feb 20, 2017 May 15, 2017
World Economic Growth (%) 3.2 3.1 3.3 3.3 USA 2.6 1.6 2.2 2.2 EU 1.9 1.7 1.6 1.6 Japan 1.2 1.0 1.2 1.2 China 6.9 6.7 6.5 6.6
World Trade Volume (%) 2.8 2.6 3.6 3.6 Exchange Rate (Baht/US dollar) 34.29 35.29 35.5 - 36.5 35.0 - 36.0 Dubai Crude Oil (US Dollar/Barrel) 50.9 41.4 47.0-57.0 47.0 - 57.0 Export Price (US Dollar) (%) -4.1 -0.4 1.2 - 2.2 1.5 - 2.5 Import Price (US Dollar) (%) -10.8 -2.7 3.0 - 4.0 3.5 - 4.5 Income from Tourism (Trillion baht) 1.54 1.76 1.93 1.93 Source: NESDB
Macroeconomic Strategy and Planning Office
NESDB Economic Outlook
May 15, 2017 26
4) The export price in US dollar term increases by 1.5 -2.5 percent, comparing with the
decline of 0.4 percent in 2016. This is an upward revision from the range of 1.2 – 2.2
percent assumption in the previous forecast due partly to the revision of export price
database by the Ministry of Commerce, which made the export price in 2016 decreased from
the previous publication. The import price in dollar term increases by 3.5 - 4.5 percent,
comparing with the contraction of 2.7 percent in 2016 and revising upwardly from 3.0 –
4.0 percent assumption in the previous estimation. The reason behind this revision is the
increasing of the prices of industrial raw materials in the world market and made the import
price higher than the previously anticipated.
5) Income from foreign tourists is likely to be 1.93 trillion baht, increasing by 9.8 percent
from 1.76 trillion in 2016 and equivalent to the previous projection. The supporting factors
are (i) the increasing trend of long-haul tourists, particularly the inbound tourists from the
Eurozone, Russia, and the US, (ii) the capacity extension of major airports (Don Muang,
Phuket, and U-Tapao) to accommodate more tourists, (iii) the expansion of short-haul
international operations by low cost airlines, (iv) domestic political stability, (v) the effect of
the political unrest in some European countries which tends to make tourists changing their
destination to Thailand, and (vi) government's measures in supporting tourism sector.
6) Government budget are expected to disburse as follows; (i) FY2017 annual budget
disbursement rate of 94.8 percent of overall budget, equivalent to the previous projection
(the disbursement rate consisted of current and capital budget at 98.5 and 80.0 percent,
respectively), (ii) FY2017 supplementary budget disbursement rate of 63.4 percent, revising
downwardly from 65.0 percent of assumption in the previous projection mainly due to lower
-than-expected disbursement rate in the second quarter and the budget allocation between
the current and capital budget is revised from 30 percent and 70 percent in the previous
projection to 56 percent and 44 percent of overall supplementary budget, respectively, (iii)
state-owned enterprise’s capital budget disbursement of 78.0 percent, and revising
downwardly from 80.0 percent in the previous projection due to the disbursement rate in the
second quarter of FY2017 weaker than the earlier anticipated, (iv) carry-over budget
disbursement of 78.0 percent, (v) off-budget loans consisted of water resource management
and road transport system projects and others about 10,412.7 million baht, decreasing from
49,503.5 million baht in FY2016, and (vi) annual budget disbursement in the first quarter of
FY2018 (October - December 2017) of 32.0 percent.
Economic Projection for 2017:
The Thai economy in 2017 is projected to expand in the range of 3.3 – 3.8 percent, improving
continually from 2.9 and 3.2 percent of growth in 2015 and 2016, respectively. The headline
inflation is projected to be in the range of 0.8 – 1.3 percent. The current account balance is
forecasted to register a surplus of 8.9 percent of GDP
In the press release dated on 15th May 2017, NESDB forecasts that the Thai economy will expand in
the range of 3.3 – 3.8 percent, which remarked as the narrowing of the projection range from 3.0 -
4.0 percent in a press release dated on 20th February 2017. There were also revisions on some growth
components in line with the actual data in the first quarter and changes in key assumptions of the
projection. The details of growth revision are as follows:
1) The Thai economy in the first quarter expanded favorably by 3.3 percent, close to the projection.
As a result, the possibility of the Thai economic growth to be lower than 3.3 percent tends to be
minimal. Meanwhile, the capacity utilization rate and the growth of manufacturing production in
the first quarter still lower than previously expected. This was thus made less chance that the Thai
economy to grow higher than 3.8 percent in 2017.
Macroeconomic Strategy and Planning Office
NESDB Economic Outlook
May 15, 2017 27
2) The revision in some growth components have been revised to be in line with the actual data in
the first quarter and in line with revised key assumptions including; (i) The upward revision of
export and import prices. As a result, export and import values are higher than the previous
projection. (ii) The downward revision of the disbursement rate of both stated-owned enterprises’
capital budget and the supplementary budget FY2017 from 80 and 65 percent, to 78 and 63.4
percent, respectively. In addition, there was revision in budget allocation between current budget
and capital budget in the FY2017 Supplementary budget from 30 and 70 percent, to 56 and 44
percent, respectively. As a result, the growth structures of the government spending and public
investment were revised from the previous projection.
Key components of the economic growth :
1) Consumption: Private consumption expenditure is estimated to grow by 3.0 percent, closed to the
growth of 2016, and revised upwardly from a 2.8 percent in the previous forecast. The upward
revision could be explained by the higher-than-expected expansion trends of income base in
agricultural and export sectors which will continue to support household expenditure during
the year of 2017. While Government expenditure is forecasted to increase by 3.2 percent,
accelerating from 1.7 percent in the previous year and revised upwardly from 2.6 percent in
the previous projection. This was due to the upward revision in the budget allocation of
current budget in the FY 2017 supplementary budget from 30 percent in the previous
estimation to 56 percent in the current forecast.
2) Total Investment is expected to expand at a faster pace in 2017 by 4.4 percent, compared to
2.8 percent of growth in 2016, but revised downwardly from 5.3 percent in the previous
projection. This revision is made due mainly to the downward revision in Private
Investment from 2.5 percent to 2.0 percent expansion in the current projection due to the fact
that the private investment in the first quarter still experienced a contraction and capacity
utilization in the manufacturing sector also remained lower than expected. However, private
investment in the remaining of 2017 is likely to recover in tandem with the pickup in
domestic demand, as well as the more pronounced pace of export recovery and the expansion
of trading partner economies. These factors will also support key manufacturing sector with
capacity utilization of higher than 65-70 percent and BOI approved projects during 2014-
2016, to expand their investment. Meanwhile, Public Investment is projected to grow by
12.6 percent, accelerating from 9.9 percent in 2016, and revised downwardly from 14.4
percent in previous projection. This revision is mainly caused by the downward revision of
state-owned enterprise’s capital budget disbursement rate and the proportion of capital budget
in the FY 2017 supplementary budget assumptions, from 80 and 70 percent of growth in
preceding estimation to 78 and 44 percent in this projection respectively. In the remaining of
the year, public investment tends to accelerate in line with the significant progress of 2016 –
2017 transportation action plan (urgent phase) which will thus expedite the disbursement of
state-owned enterprises budget and, at the same time, the disbursement from the FY 2017
supplementary budget will be speeded up.
3) Export value of goods in US dollar term is likely to expand by 3.6 percent, comparing to a
null growth in 2016, and revised up from 2.9 percent in the previous projection. The revision
was due mainly to the upward revision of the export price assumption, from 1.2 – 2.2 percent
to 1.5 – 2.5 percent increase. The export volume was also revised following the higher-than-
expected actual data in the first quarter of 2017. It is expected that export of services to
expand well due to a continual expansion of both tourist number and receipts. Thus, the
export quantity of goods and services is expected to grow by 2.9 percent, increasing
from 2.1 percent in 2016.
Macroeconomic Strategy and Planning Office
NESDB Economic Outlook
May 15, 2017 28
4) Import value of goods in US dollar term is predicted to increase by 7.0 percent compared to
the decrease by 4.7 percent in 2016, upwardly revised from a 5.5 percent growth in the prior
estimation. The revision was due to the upward revision of the import price assumption from
of 3.0 – 4.0 percent in the previous estimate to 3.5 – 4.5 percent increase in this projection.
Meanwhile, the import quantity of goods was also revised to be consistent with the actual
data of import volume in the first quarter which was even higher than the expected import
quantity for the whole year in the previous forecast. Taking into account service payments,
import volume of goods and services is expected to expand by 3.5 percent, compared to
the 1.4 percent decrease in 2016.
5) Trade balance is forecasted to register a surplus of 31 billion US dollars, decreasing from a
surplus of 35.8 billion US dollars in 2016, lower than 32.2 billion US dollars in the previous
projection. The revision is mainly because import value is projected to increase at faster pace
as compared to export value growth. Meanwhile, the current account is projected to register a
surplus of 38.8 billion US dollars or equivalent to 8.9 percent of GDP, lower than 9.4 percent
of GDP in the previous projection due to a downward revision in the trade account
assumption.
6) Headline inflation in 2017 is estimated to be in the range of 0.8 – 1.3 percent, increasing
from 0.2 percent in 2016, and revised downwardly from the range of 1.2 – 2.2 percent in the
previous projection. This is because the consumer price index of fresh food prices declined at
faster pace than previously anticipated.
Macroeconomic Strategy and Planning Office
NESDB Economic Outlook
May 15, 2017 29
The Thai economy is projected to continually improve in 2017, driven by (i) the recovery of
export following the improvement of trade partners’ economies and the commodities’ prices in
the world market, (ii) the remaining high and accelerated growth of public investment, (iii) the
acceleration of the agricultural production and favorable agricultural prices, (iv) the continual
expansion of the tourism sector which continued to support the overall economy, and (v) the
improvement of domestic car market. However, the economic growth remains under limitation
of low production capacity utilization in the manufacturing sector which constraint private
investment as well as under the risk from capital flow and exchange rate fluctuation.
Additionally, there would also be risk factors from the direction of the US trade policy towards
protectionism and also the continuity of recovery in global oil and primary commodity prices.
Under such conditions, economic management in 2017 shall be given to the following
guidelines:
1) Expediting government spending and public investment to achieve disbursement target
which consist of: (i) no lower than the percentage of 94.8 disbursement rate of capital budget
in the FY2017 annual budget; (ii) no lower than 63.4 percent of the FY2017 supplementary
budget (iii) no lower than 78.0 percent disbursement rate of the FY2017 SOE’s capital
budget; (iv) no lower than 78.0 percent disbursement rate of the FY2017 carry-over budget
and (v) no lower than the percentage of 32.0 disbursement rate of annual budget in the first
quarter of FY2018, together with driving key public investment action plans (worth around
1,383,939 million bath) to be implemented as scheduled including in-process projects under
the transportation infrastructure investment action plan in 2017 (worth around 895,758
million bath), along with the Eastern Economic Corridor Investment Plan 2017 with
investment value of 6,993 million bath, and special border economic zones.
2) Facilitating export growth to achieve 5 percent growth target by focusing on (i) solving
and supporting the expansion of manufacturing export to become more broad-based
particularly in export products by SMEs, (ii) monitoring and solving the problems from trade
protection measures conducted in major markets, (iii) increasing market share in the existing
markets which economies continued to recover (e.g. US, EU, Japan, China, and ASEAN(9),
particularly CLMV which occupied 10.6 percent market share), (iv) distributing to new
export markets in order to increase export and reduce risks from protectionism policies in
major markets, and (iv) building up collaboration between key agencies aiming to drive
exports efficiently.
3) Supporting the expansion of agricultural sector, farm income and low-income people by
emphasizing (i) preparing for supportive measures for agricultural products that will be
released more into the market during the crop year 2017/2018, as well as raising market share
for farmers in market sale prices, (ii) supporting for the large-scale farming in order to reduce
production cost and distribute products directly to consumers aiming at increasing income
share for farmers, (iii) adopting proper crop plantation and production process suitable in each
areas , and switching to grow crops with higher market values, and (iv) conducting database of
poor farmers and low-income people in order to facilitate the direct assistance measures to
reach target groups effectively as well as to provide efficient measures to counter with farm
price movements which for example could decline as a result of oversupply and oil prices
fluctuation, additionally to support the low-income people and employees in the slow-recovery
sectors.
6. Economic Management for the year 2017
Macroeconomic Strategy and Planning Office
NESDB Economic Outlook
May 15, 2017 30
4) Building up confidence and supporting the recovery of private investment by
(i) promoting the acceleration of export quantity in order to reduce excess production capacity
in manufacturing sector, which will lead to investment expansion to increase production
capacity, (ii), implementing the transport infrastructure investment action plan year 2016 and
2017 particularly projects of Public Private Partnership (PPP) which will induce expansion of
private investment, (iii) expediting investment of project approved by BOI of 1,688 projects in
2016 (worth around 861.3 billion baht) to be materialized in 2017, (iv) implementing proactive
measures in order to attract investors in the targeted sector and service for future development
such as industrial clusters, International Head Quarter (IHQ) and International Trading Center
(ICT), and (v) providing information on progress of key public infrastructure projects,
particularly in the transportation infrastructure investment plans, Eastern Economic Corridor
(EEC), and Special Economic Zones (SEZs).
5) Supporting the expansion of tourism sector by focusing on (i) ensuring safety in major
tourist destinations, (ii) promoting tourism campaigns in high-income and long-haul tourist
markets, especially tourists from Russia, Eastern Europe, U.S.A, France and Japan, (iii)
supporting the recovery of Chinese tourists, particularly those high-purchasing-power
groups, (iv) encouraging the expansion of tourists from ASEAN countries, which is likely to
improve along with the economic recovery, and (v) promoting domestic tourism together
with distributing income to local and rural-area tourist destinations.
Macroeconomic Strategy and Planning Office
NESDB Economic Outlook
May 15, 2017 31
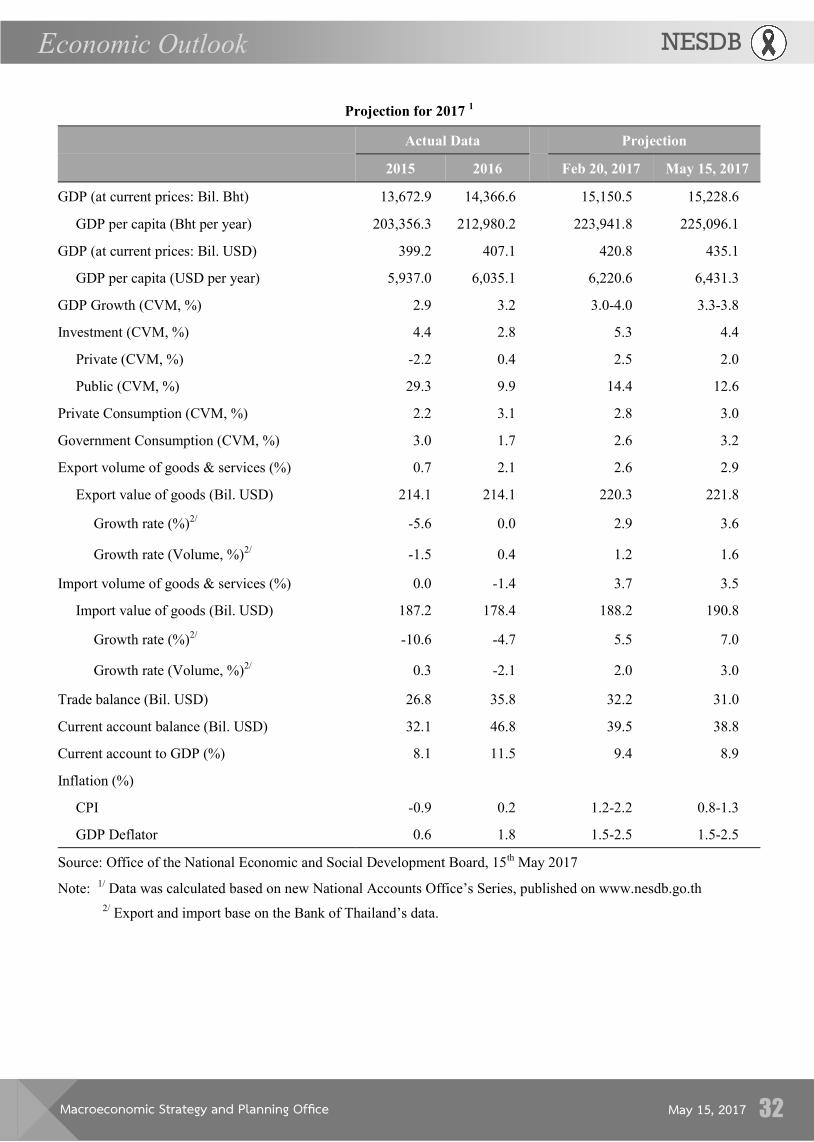
Macroeconomic Strategy and Planning Office
NESDB Economic Outlook
May 15, 2017 32
Projection for 2017 1
Actual Data Projection
2015 2016 Feb 20, 2017 May 15, 2017
GDP (at current prices: Bil. Bht) 13,672.9 14,366.6 15,150.5 15,228.6
GDP per capita (Bht per year) 203,356.3 212,980.2 223,941.8 225,096.1
GDP (at current prices: Bil. USD) 399.2 407.1 420.8 435.1
GDP per capita (USD per year) 5,937.0 6,035.1 6,220.6 6,431.3
GDP Growth (CVM, %) 2.9 3.2 3.0-4.0 3.3-3.8
Investment (CVM, %) 4.4 2.8 5.3 4.4
Private (CVM, %) -2.2 0.4 2.5 2.0
Public (CVM, %) 29.3 9.9 14.4 12.6
Private Consumption (CVM, %) 2.2 3.1 2.8 3.0
Government Consumption (CVM, %) 3.0 1.7 2.6 3.2
Export volume of goods & services (%) 0.7 2.1 2.6 2.9
Export value of goods (Bil. USD) 214.1 214.1 220.3 221.8
Growth rate (%)2/ -5.6 0.0 2.9 3.6
Growth rate (Volume, %)2/ -1.5 0.4 1.2 1.6
Import volume of goods & services (%) 0.0 -1.4 3.7 3.5
Import value of goods (Bil. USD) 187.2 178.4 188.2 190.8
Growth rate (%)2/ -10.6 -4.7 5.5 7.0
Growth rate (Volume, %)2/ 0.3 -2.1 2.0 3.0
Trade balance (Bil. USD) 26.8 35.8 32.2 31.0
Current account balance (Bil. USD) 32.1 46.8 39.5 38.8
Current account to GDP (%) 8.1 11.5 9.4 8.9
Inflation (%)
CPI -0.9 0.2 1.2-2.2 0.8-1.3
GDP Deflator 0.6 1.8 1.5-2.5 1.5-2.5
Source: Office of the National Economic and Social Development Board, 15th May 2017
Note: 1/ Data was calculated based on new National Accounts Office’s Series, published on www.nesdb.go.th
2/ Export and import base on the Bank of Thailand’s data.