Embed Size (px)
Citation preview
Neuron-specific methylome analysis reveals epigeneticregulation and tau-related dysfunction of BRCA1 inAlzheimer’s diseaseTatsuo Manoa, Kenichi Nagatab, Takashi Nonakac, Airi Tarutanic, Tomohiro Imamurad, Tadafumi Hashimotoe,Taro Bannaia, Kagari Koshi-Manoa, Takeyuki Tsuchidaa, Ryo Ohtomoa, Junko Takahashi-Fujigasakif, Satoshi Yamashitag,Yasumasa Ohyagih, Ryo Yamasakid, Shoji Tsujia, Akira Tamaokai, Takeshi Ikeuchij, Takaomi C. Saidob,Takeshi Iwatsuboe, Toshikazu Ushijimag, Shigeo Murayamaf, Masato Hasegawac, and Atsushi Iwataa,k,1
aDepartment of Neurology, Graduate School of Medicine, The University of Tokyo, Tokyo 113-8655, Japan; bLaboratory for Proteolytic Neuroscience, RIKENBrain Science Institute, Wako-shi, Saitama 351-0198, Japan; cDepartment of Dementia and Higher Brain Function, Tokyo Metropolitan Institute of MedicalScience, Tokyo 156-8506, Japan; dDepartment of Neurology, Neurological Institute, Graduate School of Medical Sciences, Kyushu University, Fukuoka812-8582, Japan; eDepartment of Neuropathology, Graduate School of Medicine, The University of Tokyo, Tokyo 113-8655, Japan; fDepartment ofNeuropathology, Tokyo Metropolitan Geriatric Hospital, Tokyo 173-0015, Japan; gDivision of Epigenomics, National Cancer Center Research Institute, Tokyo104-0045, Japan; hDepartment of Neurology and Geriatric Medicine, Ehime University Hospital, Shitsukawa, Toon, Ehime 791-0295, Japan; iDepartmentof Neurology, University of Tsukuba, Tsukuba, Ibaraki 305-8575, Japan; jDepartment of Molecular Genetics, Brain Research Institute, Niigata University,Niigata 951-8585, Japan; and kPrecursory Research for Embryonic Science and Technology, Japan Science and Technology Agency, Kawaguchi, Saitama332-0012, Japan
Edited by Solomon H. Snyder, Johns Hopkins University School of Medicine, Baltimore, MD, and approved September 25, 2017 (received for review May3, 2017)
Alzheimer’s disease (AD) is a chronic neurodegenerative diseasecharacterized by pathology of accumulated amyloid β (Aβ) andphosphorylated tau proteins in the brain. Postmortem degrada-tion and cellular complexity within the brain have limited ap-proaches to molecularly define the causal relationship betweenpathological features and neuronal dysfunction in AD. To over-come these limitations, we analyzed the neuron-specific DNAmethylome of postmortem brain samples from AD patients, whichallowed differentially hypomethylated region of the BRCA1 pro-moter to be identified. Expression of BRCA1 was significantly up-regulated in AD brains, consistent with its hypomethylation.BRCA1 protein levels were also elevated in response to DNA dam-age induced by Aβ. BRCA1 became mislocalized to the cytoplasmand highly insoluble in a tau-dependent manner, resulting in DNAfragmentation in both in vitro cellular and in vivo mouse models.BRCA1 dysfunction under Aβ burden is consistent with concomi-tant deterioration of genomic integrity and synaptic plasticity. TheBrca1 promoter region of AD model mice brain was similarly hypo-methylated, indicating an epigenetic mechanism underlying BRCA1regulation in AD. Our results suggest deterioration of DNA integrityas a central contributing factor in AD pathogenesis. Moreover, thesedata demonstrate the technical feasibility of using neuron-specificDNA methylome analysis to facilitate discovery of etiological candi-dates in sporadic neurodegenerative diseases.
Alzheimer’s disease | methylome | DNA repair | BRCA1
Alzheimer’s disease (AD) is the most prevalent form of spo-radic neurodegeneration. Although various studies have
indicated that amyloid β (Aβ) and phosphorylated tau (pTau) aredeeply involved in its pathogenesis, our current knowledge aboutthese molecules is insufficient for the introduction of drugs thatmay ameliorate or cure the disease (1). There are several dif-ferent strategies commonly used to investigate the pathogenesisof sporadic neurodegenerative diseases. The first approach hasbeen to analyze genomic data of patients (i.e., SNPs) and com-pare with existing disease phenotypic signatures. This is a ratherstraightforward method since causal relation is often clear andalso suitable when an underlying factor produces a particularlylarge effect. The discovery of the APOE e4 allele as a risk factor isan important example of successful implementation of this ap-proach in AD research (2). Despite this success, the methodologyhas not led to the discovery of additional factors largely involved indisease pathogenesis, since the effects of other genetic risk loci are
often relatively small (3–5). A second approach has been toanalyze postmortem brain samples from AD patients bio-chemically or histopathologically. While a more conventionalmethod compared with genomic analysis, difficulties remain inextracting useful information from such samples. Unlike classicpathological analysis, high-throughput screening by tran-scriptome analysis have been proved to be powerful providingus with insights into the etiology of AD (6–9). However, manyof these studies have analyzed bulk messenger RNA (mRNA)extracted from unprocessed brain samples, which are a mixtureof mRNA originating from different cell types, including neu-rons, astrocytes, oligodendrocytes, microglia, and blood cells.Laser microdissection has been used to exclusively extract
Significance
To extract critical information from Alzheimer’s disease (AD)postmortem brains that may otherwise be lost, we chose toscreen epigenetic signatures. Epigenome analysis is a robustmethodology in terms of its cell type and gene specificity, suit-ability for high-throughput analysis, and resistance to post-mortem degradation. Analysis of the neuron-specific methylomerevealed a variety of differentially methylated genes, includingBRCA1. We demonstrate the pathogenic relevance of compro-mised genomic integrity by analyzing the neuroprotective func-tion of BRCA1 against amyloid β (Aβ)-induced DNA double-strandbreaks. Furthermore, insolubility of BRCA1 under the presence ofaggregated tau suggested the reason for its dysfunction despiteenhanced expression. We provide insight into the pathomechan-ism of AD and demonstrate the potential of screening neuron-specific methylome to reveal new pathogenic contributors.
Author contributions: T.M., S.Y., S.T., T.C.S., T. Iwatsubo, T.U., S.M., M.H., and A.I. de-signed research; T.M., K.N., T.N., A. Tarutani, T. Imamura, T.H., T.B., J.T.-F., Y.O., R.Y.,A. Tamaoka, T. Ikeuchi, and M.H. performed research; K.N. contributed new reagents/analytic tools; T.M., T.B., K.K.-M., T.T., S.Y., T.U., and A.I. analyzed data; and T.M., R.O.,and A.I. wrote the paper.
The authors declare no conflict of interest.
This article is a PNAS Direct Submission.
This is an open access article distributed under the PNAS license.
Data deposition: All of the new data and analysis scripts used in this study have beendeposited in the Github repository (https://github.com/TatsuoMano/AD-neuronal-methylome).1To whom correspondence should be addressed. Email: [email protected].
This article contains supporting information online at www.pnas.org/lookup/suppl/doi:10.1073/pnas.1707151114/-/DCSupplemental.
www.pnas.org/cgi/doi/10.1073/pnas.1707151114 PNAS Early Edition | 1 of 10
MED
ICALSC
IENCE
SPN
ASPL
US
neuronal mRNA to overcome this drawback; however, therelatively small number of cells that can be analyzed (a maxi-mum of ∼1 × 10³ for each sample) and manually selected dis-section areas can lead to problems of sampling bias. Inaddition, the vulnerability of mRNA molecules to postmortemdegradation may also bias results (10, 11).DNA methylation is an epigenetic gene regulation mark that
occurs at the cytosine residue of CG dinucleotide sequences. Inthe genome, regions rich in CG doublet sequences, known asCpG islands, tend to be located at gene promoter regions.Methylation occurring at promoter regions inhibits downstreamgene expression through interaction with methyl-CpG–bindingproteins. In contrast, hypomethylated promoter CpG islandscorrespond to positive downstream gene expression (12). Com-pared with histone modification, another epigenetic mark thatoccurs in a more rapid manner, DNA methylation is thought toreflect constitutive regulation of gene expression (13). Althoughmethylome does not provide direct information about gene ex-pression, it serves as a rough representation of the entire tran-scriptome. Analysis of DNA methylation offers three significantbenefits: (i) stability of DNA methylation in postmortem brains(14, 15), (ii) high-throughput isolation of up to 1 × 10⁶–7 neu-ronal from nonneuronal nuclei by fluorescence-activated cellsorting (FACS) to eliminate any sampling bias (16), and (iii) im-plementation of high-throughput analysis using a DNA microarraysystem (17, 18).Here, we present an analysis of the neuron-specific DNA
methylome from human AD brains. Using this strategy, weidentified three candidate molecules potentially related to ADbut whose link to the disease has not been well studied. One ofthe molecules that emerged from the screen was BRCA1. Weinvestigate the role of BRCA1 in human AD brains and modelsystems and demonstrate the importance of its interaction withthe tau protein in the pathogenesis of AD.
ResultsGenome-Wide Neuron-Specific DNA Methylome Analysis RevealsDysregulated Genes in the AD Brain. We examined inferior tem-poral gyrus samples from 30 age-matched normal control (NC)and 30 AD patients (Table 1). Neuronal and nonneuronal nucleiwere separated by FACS using an anti-NeuN antibody (SI Ap-pendix, Fig. S1 A and B). Starting material of 100–400 mg ofbrain tissue resulted in yields of ∼1 × 10⁶–7 nuclei and 600–2,000 ng of genomic DNA. Extracted DNA was bisulfite con-verted and subjected to genome-wide DNA methylation analysisusing an Infinium 450k methylation array. The data were ana-lyzed using a filtering procedure described in Materials andMethods. The Infinium 450k contains 485,512 probes in total.Data with detection P values ≥ 0.01 were excluded for qualitycontrol purposes, along with probes on the sex chromosomes, toobtain 414,222 probes. Principal-component analysis of the top1,000 most variable probes showed no evidence of separation be-tween NC and AD, suggesting that there was little difference be-tween the two methylomes (SI Appendix, Fig. S1C). Subsequently,probes that met the following criteria of statistical difference be-tween the two groups were further analyzed: (i) mean β-value
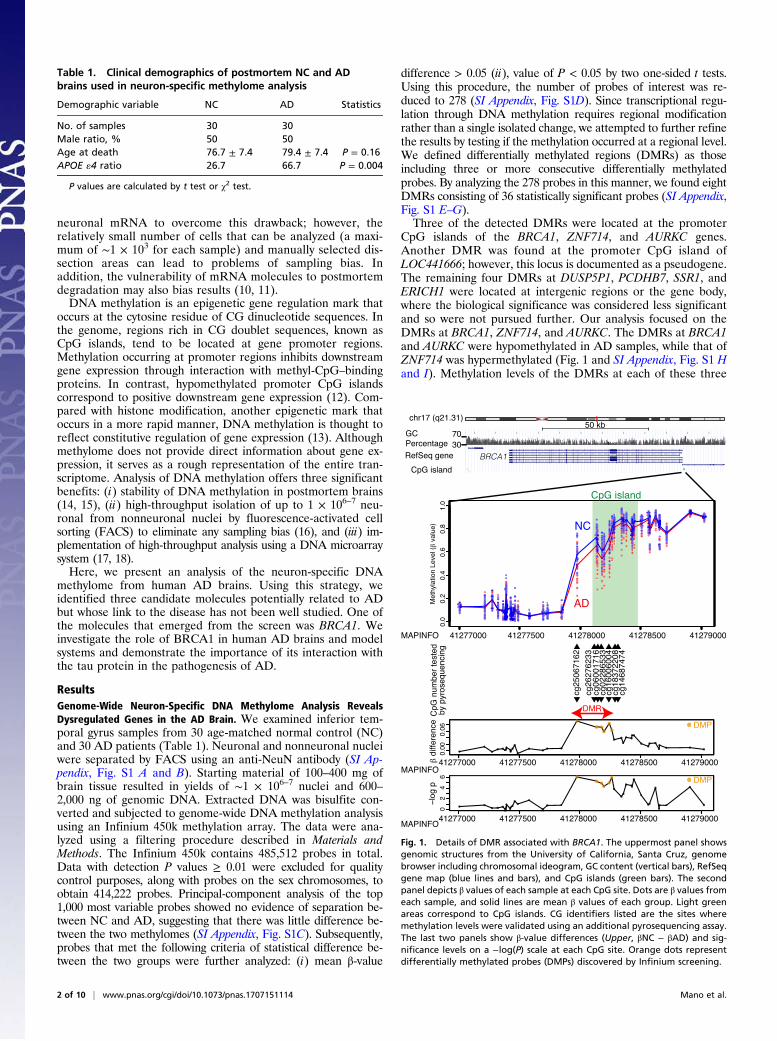
difference > 0.05 (ii), value of P < 0.05 by two one-sided t tests.Using this procedure, the number of probes of interest was re-duced to 278 (SI Appendix, Fig. S1D). Since transcriptional regu-lation through DNA methylation requires regional modificationrather than a single isolated change, we attempted to further refinethe results by testing if the methylation occurred at a regional level.We defined differentially methylated regions (DMRs) as thoseincluding three or more consecutive differentially methylatedprobes. By analyzing the 278 probes in this manner, we found eightDMRs consisting of 36 statistically significant probes (SI Appendix,Fig. S1 E–G).Three of the detected DMRs were located at the promoter
CpG islands of the BRCA1, ZNF714, and AURKC genes.Another DMR was found at the promoter CpG island ofLOC441666; however, this locus is documented as a pseudogene.The remaining four DMRs at DUSP5P1, PCDHB7, SSR1, andERICH1 were located at intergenic regions or the gene body,where the biological significance was considered less significantand so were not pursued further. Our analysis focused on theDMRs at BRCA1, ZNF714, and AURKC. The DMRs at BRCA1and AURKC were hypomethylated in AD samples, while that ofZNF714 was hypermethylated (Fig. 1 and SI Appendix, Fig. S1 Hand I). Methylation levels of the DMRs at each of these three
Table 1. Clinical demographics of postmortem NC and ADbrains used in neuron-specific methylome analysis
Demographic variable NC AD Statistics
No. of samples 30 30Male ratio, % 50 50Age at death 76.7 ± 7.4 79.4 ± 7.4 P = 0.16APOE «4 ratio 26.7 66.7 P = 0.004
P values are calculated by t test or χ2 test.
Fig. 1. Details of DMR associated with BRCA1. The uppermost panel showsgenomic structures from the University of California, Santa Cruz, genomebrowser including chromosomal ideogram, GC content (vertical bars), RefSeqgene map (blue lines and bars), and CpG islands (green bars). The secondpanel depicts β values of each sample at each CpG site. Dots are β values fromeach sample, and solid lines are mean β values of each group. Light greenareas correspond to CpG islands. CG identifiers listed are the sites wheremethylation levels were validated using an additional pyrosequencing assay.The last two panels show β-value differences (Upper, βNC − βAD) and sig-nificance levels on a −log(P) scale at each CpG site. Orange dots representdifferentially methylated probes (DMPs) discovered by Infinium screening.
2 of 10 | www.pnas.org/cgi/doi/10.1073/pnas.1707151114 Mano et al.
genes were revealed by correlation analysis and found to betightly regulated, implying that methylation levels correlate withdownstream gene regulation (SI Appendix, Fig. S2 A–C).Next, we analyzed the CpG methylation levels of the DMRs at
BRCA1, AURKC, and ZNF714 by pyrosequencing to confirm theresults of the aforementioned screening. Pyrosequencing andmethylation array analysis were found to be consistent (SI Ap-pendix, Fig. S3A). Methylation levels of the differentially methyl-ated probes (DMPs) associated with these three genes did notcorrelate with age at death of the subjects (SI Appendix, Fig. S4A).The methylation levels of the ZNF714 and AURKC DMPs diddemonstrate significant differences according to sex, whereas theBRCA1 DMPs showed no such difference (SI Appendix, Fig. S4B).Interestingly, methylation levels of the BRCA1 and AURKCDMRswere significantly correlated with the number of APOE e4 alleles,but only in AD neuronal samples (SI Appendix, Fig. S4C). Thissuggests that the amount of Aβ deposition and subsequent neu-rodegeneration could be related to their altered methylation.To test whether these results were specific to AD, we analyzed
neuronal DNA from 16 inferior temporal gyrus samples of de-mentia with Lewy bodies (DLB) (SI Appendix, Table S2). ForBRCA1 and AURKC, the differences in methylation levels be-tween the NC and DLB groups were not statistically significant,while for ZNF714 the changes observed for AD were also seen inDLB (SI Appendix, Fig. S3B). Next, we monitored differences inmethylation levels of nonneuronal samples from the inferiortemporal gyrus or neuronal samples from the cerebellum of thesame subjects. Surprisingly, the differences remained at severalCpGs of nonneuronal DNA (SI Appendix, Fig. S3C), and even inDNA from cerebellar neuronal cells (predominantly granular
cells as Purkinje cells are NeuN negative) (SI Appendix, Fig.S3D). Thus, the aberrant DNA methylation pattern appeared tobe a widespread change within AD brains. Based on this, wedecided to perform transcriptional analysis from postmortembrains using bulk mRNA. For this experiment, mRNA extractedfrom the temporal lobe in previously untested samples was usedto validate the results of the methylome analysis (SI Appendix,Table S3). In AD brains, expression of BRCA1 and AURKC wereclearly up-regulated; however, ZNF714 showed no statisticallysignificant difference between the two groups (SI Appendix, Fig.S3E). This finding was mostly in agreement with the expressionchanges postulated from the methylation changes. Together, wehypothesized that the difference in promoter methylation levelsof BRCA1 and AURKC would have a significant influence onexpression of these genes, particularly in AD brains.
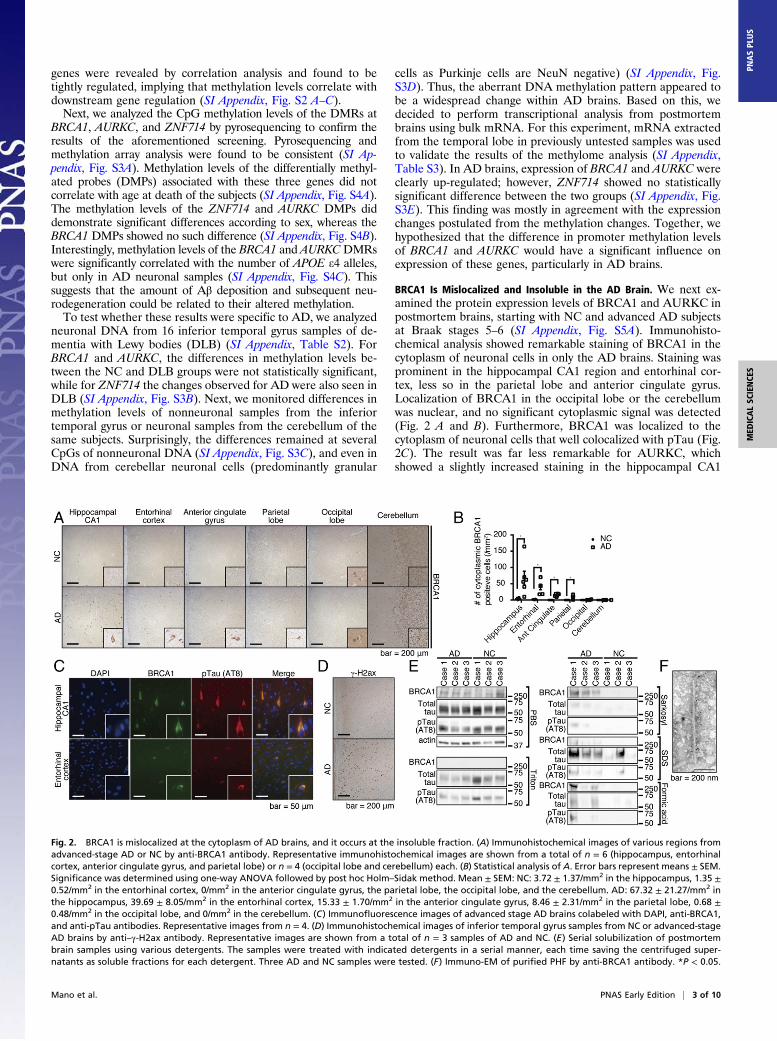
BRCA1 Is Mislocalized and Insoluble in the AD Brain. We next ex-amined the protein expression levels of BRCA1 and AURKC inpostmortem brains, starting with NC and advanced AD subjectsat Braak stages 5–6 (SI Appendix, Fig. S5A). Immunohisto-chemical analysis showed remarkable staining of BRCA1 in thecytoplasm of neuronal cells in only the AD brains. Staining wasprominent in the hippocampal CA1 region and entorhinal cor-tex, less so in the parietal lobe and anterior cingulate gyrus.Localization of BRCA1 in the occipital lobe or the cerebellumwas nuclear, and no significant cytoplasmic signal was detected(Fig. 2 A and B). Furthermore, BRCA1 was localized to thecytoplasm of neuronal cells that well colocalized with pTau (Fig.2C). The result was far less remarkable for AURKC, whichshowed a slightly increased staining in the hippocampal CA1
Fig. 2. BRCA1 is mislocalized at the cytoplasm of AD brains, and it occurs at the insoluble fraction. (A) Immunohistochemical images of various regions fromadvanced-stage AD or NC by anti-BRCA1 antibody. Representative immunohistochemical images are shown from a total of n = 6 (hippocampus, entorhinalcortex, anterior cingulate gyrus, and parietal lobe) or n = 4 (occipital lobe and cerebellum) each. (B) Statistical analysis of A. Error bars represent means ± SEM.Significance was determined using one-way ANOVA followed by post hoc Holm–Sidak method. Mean ± SEM: NC: 3.72 ± 1.37/mm2 in the hippocampus, 1.35 ±0.52/mm2 in the entorhinal cortex, 0/mm2 in the anterior cingulate gyrus, the parietal lobe, the occipital lobe, and the cerebellum. AD: 67.32 ± 21.27/mm2 inthe hippocampus, 39.69 ± 8.05/mm2 in the entorhinal cortex, 15.33 ± 1.70/mm2 in the anterior cingulate gyrus, 8.46 ± 2.31/mm2 in the parietal lobe, 0.68 ±0.48/mm2 in the occipital lobe, and 0/mm2 in the cerebellum. (C) Immunofluorescence images of advanced stage AD brains colabeled with DAPI, anti-BRCA1,and anti-pTau antibodies. Representative images from n = 4. (D) Immunohistochemical images of inferior temporal gyrus samples from NC or advanced-stageAD brains by anti–γ-H2ax antibody. Representative images are shown from a total of n = 3 samples of AD and NC. (E) Serial solubilization of postmortembrain samples using various detergents. The samples were treated with indicated detergents in a serial manner, each time saving the centrifuged super-natants as soluble fractions for each detergent. Three AD and NC samples were tested. (F) Immuno-EM of purified PHF by anti-BRCA1 antibody. *P < 0.05.
Mano et al. PNAS Early Edition | 3 of 10
MED
ICALSC
IENCE
SPN
ASPL
US
region and entorhinal cortex (SI Appendix, Fig. S5B). As changesin AURKC staining were less marked than those of BRCA1,further analysis was focused on BRCA1.The distribution pattern of BRCA1 was similar to that of ad-
vanced AD pathology, consistent with a model where the AD pa-thology itself could be driving expression (Fig. 2 A and B). To testthis hypothesis, the immunostaining pattern of BRCA1 was com-pared with those of pathological hallmarks of AD (e.g., depositionof Aβ or pTau) in subjects harboring earlier stage AD pathology. AtBraak stage 3, Aβ- and pTau-positive pathology was already presentin both the hippocampal CA1 region and the entorhinal cortex,while cytoplasmic BRCA1 was detected mainly in the hippocampalCA1 region (SI Appendix, Fig. S5 C–E), especially in the neuronalcells having prominent pTau deposition (SI Appendix, Fig. S5F).This indicates that accumulation of cytoplasmic BRCA1 may be aconsequence of pTau deposition, which well explained the obser-vation that the region without tau pathology, that is, the occipital
lobe and the cerebellum, is mostly free from cytoplasmic accumu-lation of BRCA1 despite decreased methylation.BRCA1 is a nuclear protein with a central role in DNA repair.
Among various DNA repair related proteins, only γ-H2ax, a well-established marker for initiation of DNA double-strand break(DSB) repair, was prominent in AD brains (Fig. 2D and SI Ap-pendix, Fig. S5G). This result suggested that Aβ induced DNADSBs, of which BRCA1 specializes in their repair and possiblefailure of the downstream process. Considering that aberrant cy-toplasmic localization of BRCA1 could be indicative of its dys-function, we tested its solubility in AD brains. Extraction via aseries of detergents revealed a substantial shift in BRCA1 solubilityin AD brains, suggesting that the majority of BRCA1 in the ADbrain is dysfunctional (Fig. 2E). For further assessment, we per-formed immuno-electron microscopy (EM) of the paired helicalfilaments (PHF) fraction to find that PHFs were positive with anti-BRCA1 antibodies (Fig. 2F). Immunoprecipitation of soluble taufrom human AD brain lysates showed no association of BRCA1,
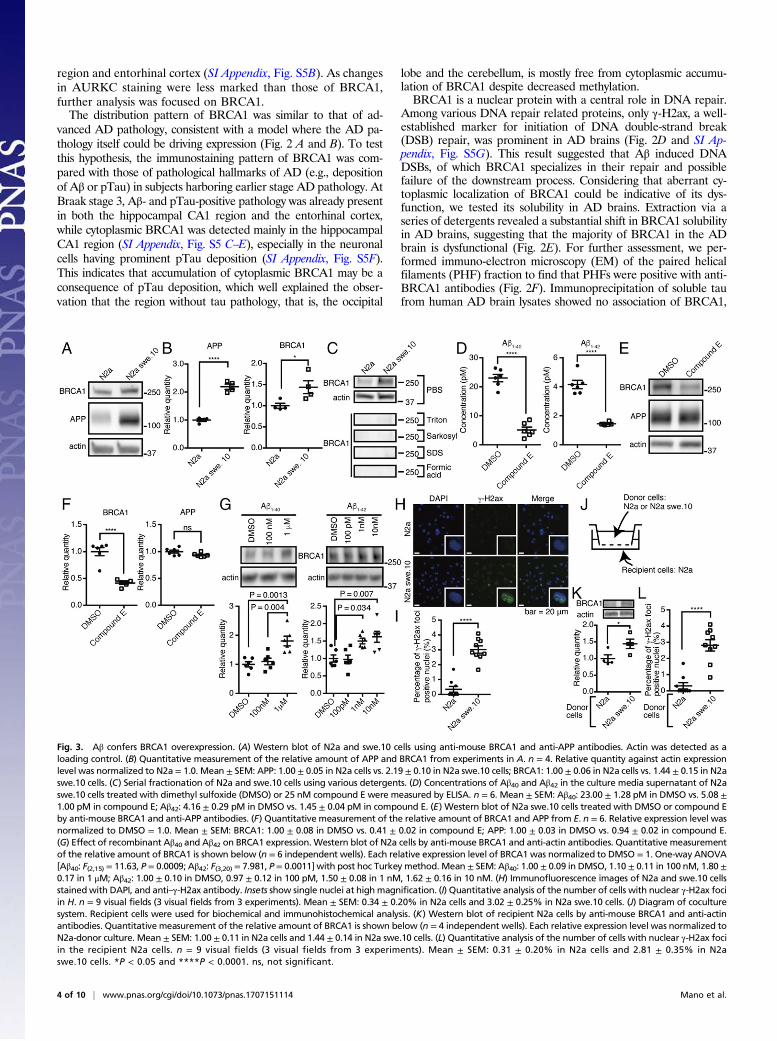
Fig. 3. Aβ confers BRCA1 overexpression. (A) Western blot of N2a and swe.10 cells using anti-mouse BRCA1 and anti-APP antibodies. Actin was detected as aloading control. (B) Quantitative measurement of the relative amount of APP and BRCA1 from experiments in A. n = 4. Relative quantity against actin expressionlevel was normalized to N2a = 1.0. Mean ± SEM: APP: 1.00 ± 0.05 in N2a cells vs. 2.19 ± 0.10 in N2a swe.10 cells; BRCA1: 1.00 ± 0.06 in N2a cells vs. 1.44 ± 0.15 in N2aswe.10 cells. (C) Serial fractionation of N2a and swe.10 cells using various detergents. (D) Concentrations of Aβ40 and Aβ42 in the culture media supernatant of N2aswe.10 cells treated with dimethyl sulfoxide (DMSO) or 25 nM compound E were measured by ELISA. n = 6. Mean ± SEM: Aβ40: 23.00 ± 1.28 pM in DMSO vs. 5.08 ±1.00 pM in compound E; Aβ42: 4.16 ± 0.29 pM in DMSO vs. 1.45 ± 0.04 pM in compound E. (E) Western blot of N2a swe.10 cells treated with DMSO or compound Eby anti-mouse BRCA1 and anti-APP antibodies. (F) Quantitative measurement of the relative amount of BRCA1 and APP from E. n = 6. Relative expression level wasnormalized to DMSO = 1.0. Mean ± SEM: BRCA1: 1.00 ± 0.08 in DMSO vs. 0.41 ± 0.02 in compound E; APP: 1.00 ± 0.03 in DMSO vs. 0.94 ± 0.02 in compound E.(G) Effect of recombinant Aβ40 and Aβ42 on BRCA1 expression. Western blot of N2a cells by anti-mouse BRCA1 and anti-actin antibodies. Quantitative measurementof the relative amount of BRCA1 is shown below (n = 6 independent wells). Each relative expression level of BRCA1 was normalized to DMSO = 1. One-way ANOVA[Aβ40: F(2,15) = 11.63, P = 0.0009; Aβ42: F(3,20)= 7.981, P = 0.0011] with post hoc Turkey method. Mean ± SEM: Aβ40: 1.00 ± 0.09 in DMSO, 1.10 ± 0.11 in 100 nM, 1.80 ±0.17 in 1 μM; Aβ42: 1.00 ± 0.10 in DMSO, 0.97 ± 0.12 in 100 pM, 1.50 ± 0.08 in 1 nM, 1.62 ± 0.16 in 10 nM. (H) Immunofluorescence images of N2a and swe.10 cellsstainedwith DAPI, and anti–γ-H2ax antibody. Insets show single nuclei at high magnification. (I) Quantitative analysis of the number of cells with nuclear γ-H2ax fociin H. n = 9 visual fields (3 visual fields from 3 experiments). Mean ± SEM: 0.34 ± 0.20% in N2a cells and 3.02 ± 0.25% in N2a swe.10 cells. (J) Diagram of coculturesystem. Recipient cells were used for biochemical and immunohistochemical analysis. (K) Western blot of recipient N2a cells by anti-mouse BRCA1 and anti-actinantibodies. Quantitative measurement of the relative amount of BRCA1 is shown below (n = 4 independent wells). Each relative expression level was normalized toN2a-donor culture. Mean ± SEM: 1.00 ± 0.11 in N2a cells and 1.44 ± 0.14 in N2a swe.10 cells. (L) Quantitative analysis of the number of cells with nuclear γ-H2ax fociin the recipient N2a cells. n = 9 visual fields (3 visual fields from 3 experiments). Mean ± SEM: 0.31 ± 0.20% in N2a cells and 2.81 ± 0.35% in N2aswe.10 cells. *P < 0.05 and ****P < 0.0001. ns, not significant.
4 of 10 | www.pnas.org/cgi/doi/10.1073/pnas.1707151114 Mano et al.
indicating no direct binding of BRCA1 to soluble tau (SI Appendix,Fig. S5H). Taken together, we concluded that insolubilized tau asPHF sequesters BRCA1 by coaggregation.
Aβ Burden Induces DNA DSBs and Up-Regulation of BRCA1 Expressionin Vitro and in Vivo. We next focused on the mechanism of BRCA1up-regulation. Since the BRCA1DMR was also hypomethylated innonneuronal cells that are essentially free of tau pathology, wereasoned that its up-regulation might be more closely related to Aβ
than tau. To test whether Aβ itself was sufficient to up-regulateBRCA1, we analyzed N2a swe.10 cell line that expresses humanamyloid precursor protein (APP) (KM670/671NL). This cell lineproduces significant levels of intracellular APP (Fig. 3 A and B andSI Appendix, Fig. S6A) and secretes extracellular Aβ40 and Aβ42into the medium (SI Appendix, Fig. S6B). N2a swe.10 cellsexpressed more soluble BRCA1 compared with control cells(mean ± SEM: 1.00 ± 0.06 in N2a cells vs. 1.44 ± 0.15 in N2aswe.10 cells) (Fig. 3 A and B). Full-length BRCA1 was found in the
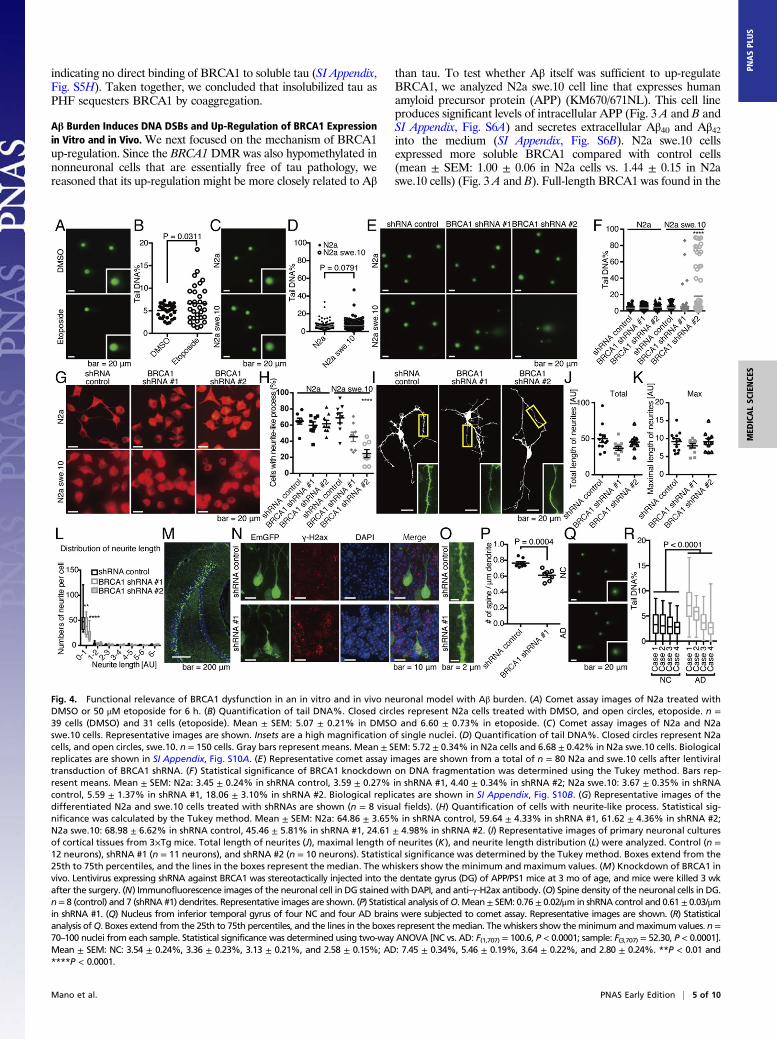
Fig. 4. Functional relevance of BRCA1 dysfunction in an in vitro and in vivo neuronal model with Aβ burden. (A) Comet assay images of N2a treated withDMSO or 50 μM etoposide for 6 h. (B) Quantification of tail DNA%. Closed circles represent N2a cells treated with DMSO, and open circles, etoposide. n =39 cells (DMSO) and 31 cells (etoposide). Mean ± SEM: 5.07 ± 0.21% in DMSO and 6.60 ± 0.73% in etoposide. (C) Comet assay images of N2a and N2aswe.10 cells. Representative images are shown. Insets are a high magnification of single nuclei. (D) Quantification of tail DNA%. Closed circles represent N2acells, and open circles, swe.10. n = 150 cells. Gray bars represent means. Mean ± SEM: 5.72 ± 0.34% in N2a cells and 6.68 ± 0.42% in N2a swe.10 cells. Biologicalreplicates are shown in SI Appendix, Fig. S10A. (E) Representative comet assay images are shown from a total of n = 80 N2a and swe.10 cells after lentiviraltransduction of BRCA1 shRNA. (F) Statistical significance of BRCA1 knockdown on DNA fragmentation was determined using the Tukey method. Bars rep-resent means. Mean ± SEM: N2a: 3.45 ± 0.24% in shRNA control, 3.59 ± 0.27% in shRNA #1, 4.40 ± 0.34% in shRNA #2; N2a swe.10: 3.67 ± 0.35% in shRNAcontrol, 5.59 ± 1.37% in shRNA #1, 18.06 ± 3.10% in shRNA #2. Biological replicates are shown in SI Appendix, Fig. S10B. (G) Representative images of thedifferentiated N2a and swe.10 cells treated with shRNAs are shown (n = 8 visual fields). (H) Quantification of cells with neurite-like process. Statistical sig-nificance was calculated by the Tukey method. Mean ± SEM: N2a: 64.86 ± 3.65% in shRNA control, 59.64 ± 4.33% in shRNA #1, 61.62 ± 4.36% in shRNA #2;N2a swe.10: 68.98 ± 6.62% in shRNA control, 45.46 ± 5.81% in shRNA #1, 24.61 ± 4.98% in shRNA #2. (I) Representative images of primary neuronal culturesof cortical tissues from 3×Tg mice. Total length of neurites (J), maximal length of neurites (K), and neurite length distribution (L) were analyzed. Control (n =12 neurons), shRNA #1 (n = 11 neurons), and shRNA #2 (n = 10 neurons). Statistical significance was determined by the Tukey method. Boxes extend from the25th to 75th percentiles, and the lines in the boxes represent the median. The whiskers show the minimum and maximum values. (M) Knockdown of BRCA1 invivo. Lentivirus expressing shRNA against BRCA1 was stereotactically injected into the dentate gyrus (DG) of APP/PS1 mice at 3 mo of age, and mice were killed 3 wkafter the surgery. (N) Immunofluorescence images of the neuronal cell in DG stained with DAPI, and anti–γ-H2ax antibody. (O) Spine density of the neuronal cells in DG.n= 8 (control) and 7 (shRNA #1) dendrites. Representative images are shown. (P) Statistical analysis ofO. Mean± SEM: 0.76 ± 0.02/μm in shRNA control and 0.61± 0.03/μmin shRNA #1. (Q) Nucleus from inferior temporal gyrus of four NC and four AD brains were subjected to comet assay. Representative images are shown. (R) Statisticalanalysis ofQ. Boxes extend from the 25th to 75th percentiles, and the lines in the boxes represent themedian. Thewhiskers show theminimum andmaximum values. n=70–100 nuclei from each sample. Statistical significance was determined using two-way ANOVA [NC vs. AD: F(1,707) = 100.6, P < 0.0001; sample: F(3,707) = 52.30, P < 0.0001].Mean ± SEM: NC: 3.54 ± 0.24%, 3.36 ± 0.23%, 3.13 ± 0.21%, and 2.58 ± 0.15%; AD: 7.45 ± 0.34%, 5.46 ± 0.19%, 3.64 ± 0.22%, and 2.80 ± 0.24%. **P < 0.01 and****P < 0.0001.
Mano et al. PNAS Early Edition | 5 of 10
MED
ICALSC
IENCE
SPN
ASPL
US
soluble fractions of both control and N2a swe.10 cells (Fig. 3C). Toconfirm that BRCA1 expression was caused by Aβ and not by APPoverexpression, we treated N2a swe.10 cells with a potent γ-sec-retase inhibitor, compound E. The treatment significantly de-creased BRCA1 expression as well as Aβ, without having any effecton APP expression in N2a swe.10 cells, while BRCA1 expressionwas not affected in N2a cells (Fig. 3 D–F and SI Appendix, Fig. S6C and D). To eliminate any off-target effect of compound E, wetreated N2a cells with recombinant Aβ40 or Aβ42 and found thatboth of them increased BRCA1 but Aβ40 required much higherconcentration compared with Aβ42, suggesting that their toxicity isdriving BRCA1 expression (Fig. 3G). Immunostaining revealedmultiple positive nuclear γ-H2ax signals only in N2a swe.10 cells,consistent with the activation of DNA repair machinery (Fig. 3 Hand I). To exclude the possibility that overexpressed APP mayaffect formation of nuclear γ-H2ax signals and BRCA1 up-regulation, N2a cells were cocultured with N2a swe.10 or N2acells (Fig. 3J). Aβ secreted from donor N2a swe.10 cells was able toinduce up-regulation of BRCA1 and multiple positive nuclearγ-H2ax signals were detected in recipient cells (Fig. 3 K and L). Weanalyzed the methylation level of Brca1 CpG island, but there wasno difference between the two cell lines (SI Appendix, Fig. S6E).To evaluate the amount of DNA damage in N2a swe.10 cells,single-cell gel electrophoresis (comet assay) was performed. Con-trol experiment using etoposide resulted in significant DNA frag-mentation (Fig. 4 A and B). We found no significant DNAfragmentation in N2a swe.10 cells compared with controls (Fig. 4 Cand D), indicating that sufficient DNA repair continued to occurdespite activated DSBs in these cells. Knockdown of BRCA1 bylentiviral shRNA impaired DNA repair to increase DNA damagein N2a swe.10 cells (Fig. 4 E and F). These data indicated that thepresence of Aβ triggers DNA DSBs, with the recruitment ofBRCA1 sufficient to neutralize Aβ toxicity.To assess the functional relevance of BRCA1 function against
Aβ in neuronal cells, we analyzed their morphological changesupon BRCA1 knockdown. BRCA1 knockdown suppressed for-mation of neurite-like processes in N2a swe.10 cells upon differ-entiation but not in N2a cells (Fig. 4 G and H). Furthermore, inprimary cultures of neuronal cells from 3×Tg-AD mice harboringAPP KM670/671NL and MAPT P301L transgenes, along withknocked-in PSEN1 M146V, which is a well-established model forboth Aβ and pTau deposition (19), BRCA1 knockdown did nothave significant effect on the global morphology (Fig. 4 I–K), butreduced the number of short neurites (mean ± SEM: for dendriteswith 0–1 AU in length, 50.50 ± 7.16 in shRNA control, 39.18 ±5.38 in shRNA #1, 22.60 ± 4.07 in shRNA #2) (Fig. 4L). Wefurther assessed in vivo function of BRCA1 in APP/PS1 mice thatexpresses APP KM670/671NL and PSEN1dE9 (20, 21). Knockingdown BRCA1 using stereotactic lentivirus injection into the den-tate gyrus (DG) induced γ-H2ax foci and reduced spine density(Fig. 4 M–P).We next used APP/PS1 mice to assess the effect of Aβ toxicity
on BRCA1 expression and DNA damage in vivo. These miceexhibit Aβ pathology, but tau pathology is absent (SI Appendix,Fig. S7 A and B). Although γ-H2ax could be detected from theearliest stage (SI Appendix, Fig. S7 C and D), suggesting DNADSBs were triggered in the hippocampal neurons, comet assaysof hippocampal cells in the mice showed no significant frag-mentation of genomic DNA (SI Appendix, Fig. S7 E and F).Immunohistochemistry showed no cytoplasmic BRCA1 in thehippocampal regions in these mice, and biochemical analysisdemonstrated increased soluble BRCA1 [mean ± SEM: 1.00 ±0.10 in wild type (WT) vs. 1.59 ± 0.09 in APP/PS1 in PBS frac-tion] (SI Appendix, Fig. S7 G–I). Data from these mice indicatedthat DNA DSBs were induced by Aβ but sufficiently repaired byBRCA1. To see whether DNA damage was actually happeningin human AD brain, temporal lobe samples were subjected to
comet assay, which showed significant DNA damage in ADbrains (Fig. 4 Q and R).If this is the case, what makes BRCA1 insoluble and dys-
functional in human AD brains? We hypothesized that aggre-gated tau could have a role in this phenomenon, since there werealmost no glial cells positive for cytoplasmic BRCA1, despite awidespread methylation change in AD brains (Fig. 2 A and B andSI Appendix, Fig. S3 A, C, and D). To evaluate its role inBRCA1 inactivation, we first tested whether BRCA1 wasinsolubilized in in vitro seed-dependent tau aggregation model(22). Upon aggregation of P301L tau by adding in vitro-generatedseed, endogenous BRCA1 was shifted to insoluble fraction (Fig.5 A and B) and cytoplasmic tau aggregates colocalized withBRCA1, precluding its nuclear localization (Fig. 5C). To in-vestigate whether this was also true in in vivo model, we histo-pathologically and biochemically analyzed 3×Tg-AD mice. Aspreviously reported, Aβ and pTau accumulate in an age-dependent manner in hippocampal CA1 neurons (19, 23) (Fig.5 D and E). In these mice, positive γ-H2ax signal preceded theappearance of cytoplasmic BRCA1 and the number of positivecells increased in an age-dependent manner (Fig. 5F). Cyto-plasmic BRCA1 was also detected from the age of 6 mo, grad-ually increasing with age up to 12 mo (Fig. 5G). Together withhippocampal tau deposition in the 3×Tg-AD mice brain, wepostulated that the cytoplasmic BRCA1 observed was the resultof neuronal tau deposition. Consistent with this hypothesis,cortical regions of 3×Tg-AD mice show only Aβ pathologywithout tau deposition (23), similar to the APP/PS1 mice. Thesesame cortical regions also exhibited increased levels of solubleBRCA1 (Fig. 5H). In contrast, the hippocampal region of 3×Tg-AD mice had increased levels of insoluble BRCA1 along withincreased insoluble pTau at the age of 12 mo (Fig. 5I).Hippocampal cells from 3×Tg mice were monitored for DNA
damage by comet assay. DNA fragmentation increased from9 mo in an age-dependent manner, suggesting that the balancebetween DNA damage and repair was significantly compromisedalong with tau accumulation in 3×Tg-AD mice (mean ± SEM:for 9 mo, 36.55 ± 0.92% in WT, vs. 41.24 ± 0.90% in 3×Tg; for12 mo, 36.32 ± 0.98% in WT, vs. 40.87 ± 1.65% in 3×Tg) (Fig. 5J and K). These data indicated that the presence of aggregatedtau induced mislocalization and insolubility of BRCA1, leadingto accelerated DNA fragmentation.BRCA1 expression was up-regulated by promoter demethyla-
tion in human AD brains. To determine whether this phenom-enon could be reproduced in the brain of an AD model mouse,we measured the methylation level of the Brca1 gene in 3×Tg-AD mice. Pyrosequencing clearly showed that the Brca1 pro-moter in hippocampal DNA from 3×Tg-AD mice was signifi-cantly hypomethylated compared with that of WT mice (SIAppendix, Fig. S8), suggesting that Aβ-induced DNA damageleads to up-regulation of BRCA1 expression through demethy-lation of the promoter region.
DiscussionGenome-Wide Neuron-Specific DNA Methylation Analysis RevealsPreviously Undiscovered Genes. The methodology adopted in thisstudy initially focused on genome-wide neuron-specific methyl-ome analysis of the postmortem brain and the successful iden-tification of biologically relevant molecules. Previous studies ofAD epigenetics have used bulk DNA from postmortem brainsand, in several instances, have demonstrated aberrant CpGmethylation at genes related to familial AD and APP processing(24) or newly discovered genes (25, 26), which were not con-firmed in our neuron-specific analysis (SI Appendix, Table S7).This discrepancy could be attributed to the level of resolutionreached by the Infinium microarray [the exact CpGs detected inthe previous study (24) are not on the array] or to the advantageof our neuron-specific analysis over a bulk DNA analysis made
6 of 10 | www.pnas.org/cgi/doi/10.1073/pnas.1707151114 Mano et al.
up of various cell types. Our FACS purification strategy dem-onstrated that the DNA amount of neuronal/nonneuronal cellratios varied among samples from 1:0.19 to 1:2.8 [mean, 1:1.20 ±0.65 (SD)], which could easily skew the methylome analysis, giventhat patterns of methylation differ among cell types (16, 27).The sample numbers used in our study are relatively small,
which does limit our capacity to perform precise statistical analysessuch as multiple comparisons. These analyses were nonethelessperformed; however, none of our probes was able to meet statis-tical criteria. Recent studies of site-directed methylation editinghave revealed that methylation changes over broader ranges(rather than a single mark) are responsible for the expression levelof mRNA (28). Thus, strict correction of multiple comparisonswith statistical methods that have been useful in detecting single,differentially methylated spots may not be as supportive fordetecting broader differential regions reflecting the transcriptome.The goal of our study was to identify a biologically relevant mol-
ecule for AD through methylome analysis. Therefore, rather thancorrecting multiple comparisons by statistically stringent method,we attached more importance to the discovery of methylationsignature related to transcriptional regulation. Additionally, wechose to directly confirm results at the mRNA or protein levelrather than simply replicating the methylome analysis in a differentsample sets, since we considered it as a screening method forintraneuronal environment alteration in AD brains. We believethat neuron-specific analysis can reduce the intragroup variation ofmethylation level and enhance the specificity and sensitivity indetecting DMRs.Methylation levels were validated independently in the DMR
of interest. Moreover, of three candidate genes extracted fromthe methylome analysis, two corresponding proteins were foundto be differentially expressed in AD brains, strongly supportingthe validity of our method. Methylome analysis is not a methodto directly analyze protein expression in the postmortem brain.
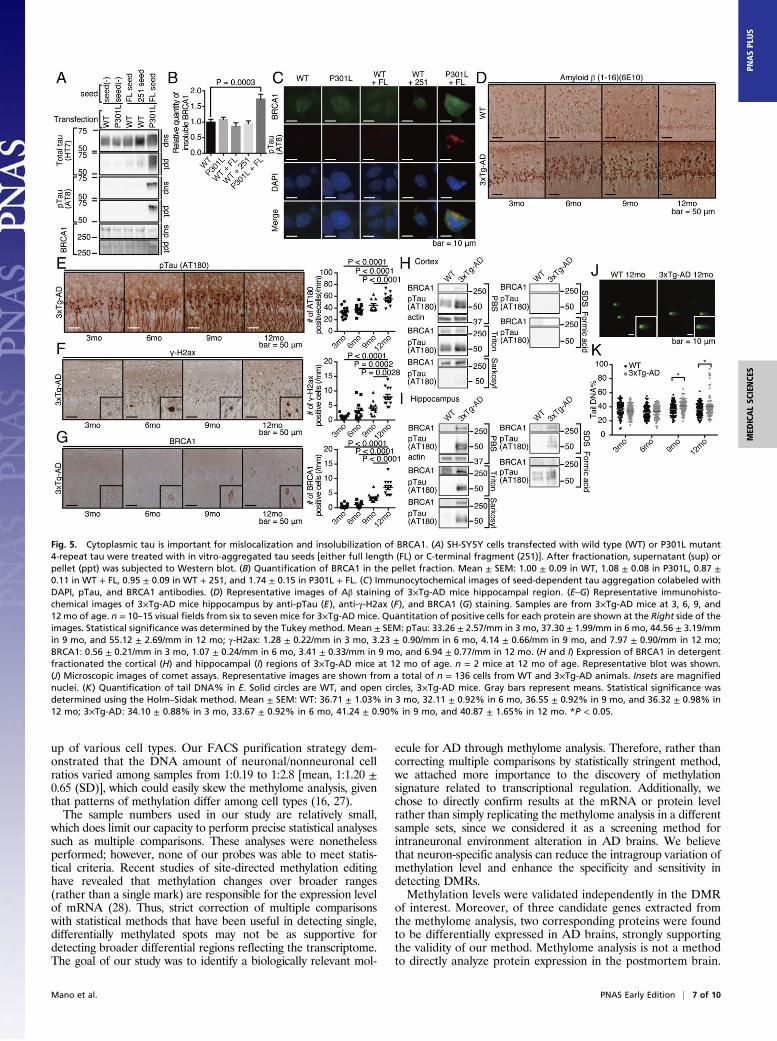
Fig. 5. Cytoplasmic tau is important for mislocalization and insolubilization of BRCA1. (A) SH-SY5Y cells transfected with wild type (WT) or P301L mutant4-repeat tau were treated with in vitro-aggregated tau seeds [either full length (FL) or C-terminal fragment (251)]. After fractionation, supernatant (sup) orpellet (ppt) was subjected to Western blot. (B) Quantification of BRCA1 in the pellet fraction. Mean ± SEM: 1.00 ± 0.09 in WT, 1.08 ± 0.08 in P301L, 0.87 ±0.11 in WT + FL, 0.95 ± 0.09 in WT + 251, and 1.74 ± 0.15 in P301L + FL. (C) Immunocytochemical images of seed-dependent tau aggregation colabeled withDAPI, pTau, and BRCA1 antibodies. (D) Representative images of Aβ staining of 3×Tg-AD mice hippocampal region. (E–G) Representative immunohisto-chemical images of 3×Tg-AD mice hippocampus by anti-pTau (E), anti-γ-H2ax (F), and BRCA1 (G) staining. Samples are from 3×Tg-AD mice at 3, 6, 9, and12 mo of age. n = 10–15 visual fields from six to seven mice for 3×Tg-AD mice. Quantitation of positive cells for each protein are shown at the Right side of theimages. Statistical significance was determined by the Tukey method. Mean ± SEM: pTau: 33.26 ± 2.57/mm in 3 mo, 37.30 ± 1.99/mm in 6 mo, 44.56 ± 3.19/mmin 9 mo, and 55.12 ± 2.69/mm in 12 mo; γ-H2ax: 1.28 ± 0.22/mm in 3 mo, 3.23 ± 0.90/mm in 6 mo, 4.14 ± 0.66/mm in 9 mo, and 7.97 ± 0.90/mm in 12 mo;BRCA1: 0.56 ± 0.21/mm in 3 mo, 1.07 ± 0.24/mm in 6 mo, 3.41 ± 0.33/mm in 9 mo, and 6.94 ± 0.77/mm in 12 mo. (H and I) Expression of BRCA1 in detergentfractionated the cortical (H) and hippocampal (I) regions of 3×Tg-AD mice at 12 mo of age. n = 2 mice at 12 mo of age. Representative blot was shown.(J) Microscopic images of comet assays. Representative images are shown from a total of n = 136 cells from WT and 3×Tg-AD animals. Insets are magnifiednuclei. (K) Quantification of tail DNA% in E. Solid circles are WT, and open circles, 3×Tg-AD mice. Gray bars represent means. Statistical significance wasdetermined using the Holm–Sidak method. Mean ± SEM: WT: 36.71 ± 1.03% in 3 mo, 32.11 ± 0.92% in 6 mo, 36.55 ± 0.92% in 9 mo, and 36.32 ± 0.98% in12 mo; 3×Tg-AD: 34.10 ± 0.88% in 3 mo, 33.67 ± 0.92% in 6 mo, 41.24 ± 0.90% in 9 mo, and 40.87 ± 1.65% in 12 mo. *P < 0.05.
Mano et al. PNAS Early Edition | 7 of 10
MED
ICALSC
IENCE
SPN
ASPL
US

However, given the limitations of previously reported method-ologies, such as postmortem degradation and sampling bias, webelieve that this methodology produced a more precise repre-sentation of molecular neuronal pathology compared with pre-vious studies. In doing so, it has the potential to be used forfurther in-depth analysis of the pathomechanisms underlying ADand other neurodegenerative diseases.
Methylome Analysis Reveals a Unique Pathological Pathway. Usingmethylome analysis, we found that BRCA1 and AURKC were up-regulated in AD brains. We also demonstrated that the meth-ylation levels at the promoter regions of these genes were, tosome extent, correlated with the number of APOE e4 alleles,whose gene product is known to impair Aβ clearance in the braincompared with other alleles, such as e2 or e3 (29). Polymorphicvariants of TREM2 gene are also the known risk factor influ-encing for developing AD on the same level as one copy of theAPOE e4 allele (30); however, there was no polymorphic variantsdetected in our cases. Together with our analyses using post-mortem human and mouse brains, this supports our hypothesisthat increased Aβ burden induces up-regulation of BRCA1 andAURKC to repair DSBs. However, BRCA1 protein was mis-localized to the cytoplasm and predominantly found in thedetergent-insoluble fraction of both human AD and 3×Tg-ADmice brains that suggested it might be dysfunctional (31). Indeed,significant DNA fragmentation could be seen in both human ADand mouse model brains. Similar finding has also been reported ina previous study (32); however, our data have suggested an alter-native role for BRCA1. In addition to the precision and relevanceof our results, we provide three pieces of information that alsosupport our interpretation. First, the methylome, transcriptome,proteome, and neuropathological analyses reported here consis-tently demonstrate BRCA1 up-regulation during the pathologicalprocess of AD. Second, we and others have shown that the mo-lecular weight of BRCA1 is always >250 kDa (33, 34) (SI Ap-pendix, Fig. S9 A–D), but the band indicated on immunoblots froma conflicting report (32) appears to be much smaller. In addition,knockdown of human and murine BRCA1 by multiple shRNAsconfirmed that the band was BRCA1 (SI Appendix, Fig. S9 B–D).Third, our data corroborated the previous result demonstratingthat large number of neurons with neurofibrillary tangles werepositive for BRCA1 (35).Differential extraction demonstrated the presence of Sarkosyl-
insoluble BRCA1 in the hippocampus of 3×Tg AD mice at
12 mo without SDS-insoluble BRCA1. SDS-insoluble tau rep-resents a later and more extensive state of aggregation thanSarkosyl-insoluble tau (36, 37). In human AD, the disease timecourse is quite long, usually 10–15 y from the beginning of tauaggregation to autopsy, whereas mice have a life expectancy ofonly 2 y. Considering the results of in vitro seed-dependent tauaggregation model and immuno-EM, BRCA1 aggregates in atau-dependent manner. The amount of insoluble tau is verysmall in mice model compared with human AD brain (Figs. 2Eand 5 H and I), even though in these mice mutant tau is moreaggregate-prone and is also overexpressed, suggesting that thetime factor is important in tau aggregation and its change insolubility. Thus, in the mouse model, tau is not insoluble enoughcompared with human disease as previously reported (38).Considering that coaggregation of BRCA1 with PHF was dem-onstrated by EM, we speculate that a relatively short time (e.g.,12 mo) is sufficient for endogenous BRCA1 to become Sarkosyl-insoluble and dysfunctional, but insufficient to become a highlyaggregated state like SDS-insoluble.BRCA1 is a DNA repair protein, whose mutation drastically
increases the risk of breast cancer (39). It is well studied in the fieldof cancer research, but its role in neurodegeneration remains un-known. Recent reports have indicated the importance of DNAdamage in AD pathogenesis (40), with evidence of activity-inducedDNA breaks governing the expression of neuronal early-responsegenes (41). Despite this potential relevant activity, its role remainselusive (32, 35, 40, 42). Since differentiated neurons do not pro-liferate, impaired DNA cannot be repaired by the precise processof homologous recombination, which uses homologous sisterchromatids as templates during mitosis. Thus, nonhomologousend joining, including microhomology-mediated end joining, is theonly alternative for neurons. Preserving the integrity of neuronalDNA at the best possible level over its life span would be a key tomaintaining the cellular functions of neurons (43–45). Therefore,the recruitment of DNA repair proteins, such as BRCA1, wouldappear to be important for neurons. Interestingly, several epide-miological studies reported that the risk for developing AD isincreased by diabetes mellitus or atherosclerosis, which are knownto induce DNA damage by producing oxidative stress (46–48).Furthermore, an inverse association between cancer and AD hasbeen reported (49–52). These observations suggest that de-terioration in the maintenance of DNA integrity could play animportant role in AD pathogenesis. We demonstrated thatknockdown of BRCA1 in neuronal cells in the presence of Aβ
Neuron
Toxic Aβ
Double strandbreak
Double strandbreak
BRCA1
upregulation upregulation
NeuronAggregated tau
Toxic Aβ
Efficientrepair
Inefficientrepair
Aggregated tau
Hypomethylation
Early stage AD Advanced stage AD
Morphologicalplasticity
DNAdamageaccumulates
DNAintegrity maintained
Neuron
BRCA1
Regular expression
Normal
Normalmethylation
DNAintegrity maintained
Hypomethylation
BRCA1promoter
CpGpromoter
CpGpromoter
CpG
Fig. 6. Schematic illustration summarizing our current hypothesis regarding Aβ-induced DNA damage, tau, and epigenetic regulation of BRCA1 in AD. Innormal brain without Aβ or tau accumulation, there is no need for BRCA1 up-regulation (Left). At an early stage of AD with no accumulated tau,BRCA1 efficiently repairs DNA DSBs induced by toxic Aβ (Middle). However, at an advanced stage of AD, cytoplasmic aggregated tau sequestrates BRCA1 toan insoluble fraction, resulting in its dysfunction (Right). While neurons try to cope with this situation by up-regulating expression of the BRCA1 gene throughepigenetic mechanisms, they are eventually overwhelmed by the accumulation of DNA damage.
8 of 10 | www.pnas.org/cgi/doi/10.1073/pnas.1707151114 Mano et al.
burden in vitro and in vivo resulted in a decrease in the number ofshort neurites and dendritic spines. Considering the decreasedspine density in brains of human AD patients and AD model mice(53, 54), these results suggest a potential mechanism underlyingneuronal dysfunction in the AD brain. That is, Aβ may impairsynaptic plasticity in neuronal cells by causing deterioration ofDNA integrity, thereby resulting in memory impairment.
BRCA1 Dysfunction Leads to Deterioration of DNA Integrity. Ourresults clearly demonstrate that Aβ-induced DSBs were effi-ciently repaired by BRCA1 in the absence of aggregated tau, andthat repair by this mechanism was impaired in its presence due tomislocalization and insolubilization of BRCA1. Among manyDNA repair markers, only γ-H2ax was positive in AD brain.Considering γ-H2ax is a scaffold for recruitment of DNA repairproteins at an early stage of DNA repair (55–57). BRCA1 is one ofthe early-phase proteins recruited to the γ-H2ax foci (58) and,therefore, could possibly fail to form the foci of DNA repairproteins due to its mislocalization and insolubilization impedingthe subsequent DNA repair process. A recent study showed thatBRCA1 nuclear export was related to susceptibility to DNAdamage (59), which suggests that the mislocalization of BRCA1 tothe cytoplasm and insolubility once there, interfered with DNAdamage repair. Our data with cellular and animal model only withAβ burden suggested that BRCA1 is up-regulated for a protectivepurpose. However, in human AD brain, BRCA1 is coaggregatedwith tau that makes BRCA1 dysfunctional. Despite its increasedexpression, coaggregation leads to insufficient DNA repair. Inother words, although BRCA1 is up-regulated, it does not reach tothe sufficient level necessary to counteract Aβ-induced DNAdamage leading to its accumulation.BRCA1 is involved primarily in homologous recombination,
but also, to some extent, in nonhomologous end joining (60).This raises the question of why BRCA1, rather than other DNArepair proteins, is recruited in response to DNA damage innondividing neuronal cells. Several reports have shown the im-portance of BRCA1 function in the developing brain (61, 62)and the accumulation of somatic mutations in neuronal cellsduring the developmental process in a transcriptional activity-dependent manner (63). However, activity-induced DNA DSBshave previously been shown to govern the expression of neuronalearly-response genes (41). These reports collectively suggest thatDNA DSBs occur frequently in neurons of highly active regions,such as the hippocampus and entorhinal cortex, and are effi-ciently repaired by BRCA1 in normal brains. However, in ADbrains, this maintenance system seems to be impaired byBRCA1 dysfunction, resulting in neuronal deterioration in theseregions. Indeed, comet assay on postmortem brains showed in-creased DNA fragmentation in AD samples.In this study, we present findings of neuron-specific DNA
methylation alterations in AD brains. Taken together with expres-sion analyses, these results suggest that BRCA1 plays an importantrole in the pathogenesis of AD, since methylome, transcriptome,proteome, and neuropathology results are all consistent with its up-regulation. Aβ induces DNA DSBs, which should be efficientlyrepaired by BRCA1 when aggregated tau is absent. The balance ofDNA damage and repair is compromised by dysfunction ofBRCA1, due to cytoplasmic mislocalization and consequential in-solubility as a result of aggregated tau accumulation (Fig. 6). In this
study, methylome analysis has directly facilitated identification ofbiologically relevant molecules for a neurodegenerative disease.Future analyses of neuron-specific methylome may also proveuseful in understanding the mechanisms of pathogenesis forsporadic neurodegenerative disorders.
Materials and MethodsSample Preparation and DNA Extraction. This research received approval fromthe ethics committee of the University of Tokyo (approval 2183-15). Wecollected postmortem brains with written consent from patients’ families andmaintained them at −80 °C until use. According to criteria established byBraak and McKeith (64–67), trained neuropathologists made a diagnosis ofAD, DLB, or NC, using hematoxylin–eosin, Nissl and silver staining, andimmunostaining (68). We diagnosed samples fulfilling Braak stage ≥4 andamyloid stage ≥C as AD (64, 65), and samples fulfilling Lewy body score ≥4,Braak stage ≤3, and amyloid stage ≤B as DLB (66, 67). Brain samples of 18AD, 15 NC, and 21 DLB subjects were obtained from Tokyo MetropolitanGeriatric Hospital brain bank; 11 AD and 3 NC subjects were from the Uni-versity of Tsukuba; and 1 AD and 12 NC subjects were from the University ofTokyo. Detailed clinical demographics of the postmortem brains, includingsex, age, and APOE e4 and TREM2 variants, are shown in Table 1 and SIAppendix, Table S1. For the preparation of neuronal nuclei, we excised thegray matter from the inferior temporal gyrus and the cerebellum. Nuclearpreparation and FACS nucleus sorting (FACSAria; BD Biosciences) were per-formed at the Support Unit for Bio-Material Analysis in RIKEN Brain ScienceInstitute, according to a published protocol (16). Following the extraction ofgenomic DNA by the phenol–chloroform method, its concentration wasmeasured using a Qubit dsDNA BR assay kit (Invitrogen).
Infinium 450k Methylation Microarray Analysis. Genomic DNA (500 ng) wasbisulfite-converted using an EZ DNA methylation kit (Zymo Research) andanalyzed using an Illumina Infinium HumanMethylation450 BeadChip (Illu-mina) and iScan scanner (Illumina). We processed the methylation array datausing the statistical computing package R 3.0.2 (www.r-project.org/) and theBioconductor package ChAMP (69). Idat files were imported to calculatemethylation levels (β values) for each probe. The β-mixture quantile (BMIQ)normalization method (70) was used to reduce probe-type bias, and batchcorrection was performed using the ComBat method (71). For each probe,we compared β values between AD and NC samples using two one-sidedStudent’s t tests: P (AD < NC) and P (AD > NC). We defined probes with Pvalues < 0.05 and mean β differences between AD and NC > 0.05 as DMPs.Regions with no less than three consecutive DMPs were defined as DMRs.
Single-Cell Gel Electrophoresis (Comet Assay). The comet assay was performedunder neutral pH conditions, using a CometAssay kit (Trevigen), following themanufacturer’s instructions. DNA was visualized with SYBR Gold, and imageswere obtained using an Axioplan 2 fluorescent microscope (Carl Zeiss) andan Axiocam HRc CCD camera system (Carl Zeiss). The head and tail of eachindividual comet were detected semiautomatically to calculate Tail DNA%using CASPLab software (72).
Additional material and methods are included in SI Appendix, SI Materialsand Methods.
ACKNOWLEDGMENTS. We are grateful for the technical support providedby Yuki Inukai and Fuyuko Suto. We are also grateful for editing by John C.Christianson, for scientific advice provided by Toshihiro Hayashi, for 3×Tgmice provided by Jun-ichi Kira, and for N2a swe.10 cells provided by SamSisodia. This study was supported by Japan Agency for Medical Research andDevelopment Strategic Research Program for Brain Sciences (15656513),Japan Science and Technology Agency Precursory Research for EmbryonicScience and Technology (4216), Japan Society of Promotion of ScienceKAKENHI (16H05319 and 17H16113), the Cell Science Research Foundation,the Ichiro Kanehara Foundation for the Promotion of Medical Sciences andMedical Care, the Takeda Science Foundation, Janssen Pharmaceutical, andEisai Company.
1. Selkoe DJ (2011) Resolving controversies on the path to Alzheimer’s therapeutics. Nat
Med 17:1060–1065.2. Strittmatter WJ, et al. (1993) Apolipoprotein E: High-avidity binding to beta-amyloid
and increased frequency of type 4 allele in late-onset familial Alzheimer disease. Proc
Natl Acad Sci USA 90:1977–1981.3. Lambert JC, et al.; European Alzheimer’s Disease Initiative (EADI); Genetic and Envi-
ronmental Risk in Alzheimer’s Disease; Alzheimer’s Disease Genetic Consortium; Co-
horts for Heart and Aging Research in Genomic Epidemiology (2013) Meta-analysis of
74,046 individuals identifies 11 new susceptibility loci for Alzheimer’s disease. Nat
Genet 45:1452–1458.4. Guerreiro R, Hardy J (2014) Genetics of Alzheimer’s disease. Neurotherapeutics 11:
732–737.5. Jun G, et al.; IGAP Consortium (2016) A novel Alzheimer disease locus located near the
gene encoding tau protein. Mol Psychiatry 21:108–117.6. Winkler JM, Fox HS (2013) Transcriptomemeta-analysis reveals a central role for sex steroids
in the degeneration of hippocampal neurons in Alzheimer’s disease. BMC Syst Biol 7:51.
Mano et al. PNAS Early Edition | 9 of 10
MED
ICALSC
IENCE
SPN
ASPL
US
7. Tan MG, et al. (2010) Genome wide profiling of altered gene expression in theneocortex of Alzheimer’s disease. J Neurosci Res 88:1157–1169.
8. Podtelezhnikov AA, et al. (2011) Molecular insights into the pathogenesis of Alz-heimer’s disease and its relationship to normal aging. PLoS One 6:e29610.
9. Twine NA, Janitz K, Wilkins MR, Janitz M (2011) Whole transcriptome sequencingreveals gene expression and splicing differences in brain regions affected byAlzheimer’s disease. PLoS One 6:e16266.
10. Sekar S, et al. (2015) Alzheimer’s disease is associated with altered expression of genesinvolved in immune response and mitochondrial processes in astrocytes. NeurobiolAging 36:583–591.
11. Simpson JE, et al.; MRC Cognitive Function and Ageing Neuropathology Study Group(2011) Microarray analysis of the astrocyte transcriptome in the aging brain: Relationshipto Alzheimer’s pathology and APOE genotype. Neurobiol Aging 32:1795–1807.
12. Klose RJ, Bird AP (2006) Genomic DNA methylation: The mark and its mediators.Trends Biochem Sci 31:89–97.
13. Cedar H, Bergman Y (2009) Linking DNA methylation and histone modification:Patterns and paradigms. Nat Rev Genet 10:295–304.
14. Matsumoto L, et al. (2010) CpG demethylation enhances alpha-synuclein expressionand affects the pathogenesis of Parkinson’s disease. PLoS One 5:e15522.
15. Barrachina M, Ferrer I (2009) DNA methylation of Alzheimer disease and tauopathy-related genes in postmortem brain. J Neuropathol Exp Neurol 68:880–891.
16. Iwamoto K, et al. (2011) Neurons show distinctive DNA methylation profile and higherinterindividual variations compared with non-neurons. Genome Res 21:688–696.
17. Bibikova M, et al. (2011) High density DNA methylation array with single CpG siteresolution. Genomics 98:288–295.
18. Dedeurwaerder S, et al. (2011) Evaluation of the Infinium Methylation 450K tech-nology. Epigenomics 3:771–784.
19. Oddo S, et al. (2003) Triple-transgenic model of Alzheimer’s disease with plaques andtangles: Intracellular Abeta and synaptic dysfunction. Neuron 39:409–421.
20. Jankowsky JL, et al. (2001) Co-expression of multiple transgenes in mouse CNS: Acomparison of strategies. Biomol Eng 17:157–165.
21. Holcomb L, et al. (1998) Accelerated Alzheimer-type phenotype in transgenic micecarrying both mutant amyloid precursor protein and presenilin 1 transgenes. Nat Med4:97–100.
22. Nonaka T, Watanabe ST, Iwatsubo T, Hasegawa M (2010) Seeded aggregation andtoxicity of alpha-synuclein and tau: Cellular models of neurodegenerative diseases.J Biol Chem 285:34885–34898.
23. Oh KJ, et al. (2010) Staging of Alzheimer’s pathology in triple transgenic mice: A lightand electron microscopic analysis. Int J Alzheimers Dis 2010:1–24.
24. Iwata A, et al. (2014) Altered CpG methylation in sporadic Alzheimer’s disease is as-sociated with APP and MAPT dysregulation. Hum Mol Genet 23:648–656.
25. De Jager PL, et al. (2014) Alzheimer’s disease: Early alterations in brain DNA meth-ylation at ANK1, BIN1, RHBDF2 and other loci. Nat Neurosci 17:1156–1163.
26. Lunnon K, et al. (2014) Methylomic profiling implicates cortical deregulation ofANK1 in Alzheimer’s disease. Nat Neurosci 17:1164–1170.
27. Lister R, et al. (2013) Global epigenomic reconfiguration during mammalian braindevelopment. Science 341:1237905.
28. Vojta A, et al. (2016) Repurposing the CRISPR-Cas9 system for targeted DNA meth-ylation. Nucleic Acids Res 44:5615–5628.
29. Verghese PB, et al. (2013) ApoE influences amyloid-β (Aβ) clearance despiteminimal apoE/Aβ association in physiological conditions. Proc Natl Acad Sci USA 110:E1807–E1816.
30. Guerreiro R, et al.; Alzheimer Genetic Analysis Group (2013) TREM2 variants in Alz-heimer’s disease. N Engl J Med 368:117–127.
31. Winklhofer KF, Tatzelt J, Haass C (2008) The two faces of protein misfolding: Gain-and loss-of-function in neurodegenerative diseases. EMBO J 27:336–349.
32. Suberbielle E, et al. (2015) DNA repair factor BRCA1 depletion occurs in Alzheimerbrains and impairs cognitive function in mice. Nat Commun 6:8897.
33. Gorrini C, et al. (2013) BRCA1 interacts with Nrf2 to regulate antioxidant signalingand cell survival. J Exp Med 210:1529–1544.
34. Zhang H, et al. (2016) A cell cycle-dependent BRCA1-UHRF1 cascade regulates DNAdouble-strand break repair pathway choice. Nat Commun 7:10201.
35. Evans TA, et al. (2007) BRCA1 may modulate neuronal cell cycle re-entry in Alzheimerdisease. Int J Med Sci 4:140–145.
36. Ksiezak-Reding H, Morgan K, Dickson DW (1994) Tau immunoreactivity and SDSsolubility of two populations of paired helical filaments that differ in morphology.Brain Res 649:185–196.
37. Ksiezak-Reding H, Wall JS (1994) Mass and physical dimensions of two distinct pop-ulations of paired helical filaments. Neurobiol Aging 15:11–19.
38. Hunter JM, et al. (2011) Biochemical and morphological characterization of theAbetaPP/PS/tau triple transgenic mouse model and its relevance to sporadic Alz-heimer’s disease. J Alzheimers Dis 27:361–376.
39. Huen MS, Sy SM, Chen J (2010) BRCA1 and its toolbox for the maintenance of genomeintegrity. Nat Rev Mol Cell Biol 11:138–148.
40. Suberbielle E, et al. (2013) Physiologic brain activity causes DNA double-strand breaksin neurons, with exacerbation by amyloid-β. Nat Neurosci 16:613–621.
41. Madabhushi R, et al. (2015) Activity-induced DNA breaks govern the expression ofneuronal early-response genes. Cell 161:1592–1605.
42. Bucholtz N, Demuth I (2013) DNA-repair in mild cognitive impairment and Alz-heimer’s disease. DNA Repair (Amst) 12:811–816.
43. Jackson SP, Bartek J (2009) The DNA-damage response in human biology and disease.Nature 461:1071–1078.
44. Bartkova J, et al. (2005) DNA damage response as a candidate anti-cancer barrier inearly human tumorigenesis. Nature 434:864–870.
45. Gorgoulis VG, et al. (2005) Activation of the DNA damage checkpoint and genomicinstability in human precancerous lesions. Nature 434:907–913.
46. Tornovsky-Babeay S, et al. (2014) Type 2 diabetes and congenital hyperinsulinismcause DNA double-strand breaks and p53 activity in β cells. Cell Metab 19:109–121.
47. Mercer JR, et al. (2010) DNA damage links mitochondrial dysfunction to atheroscle-rosis and the metabolic syndrome. Circ Res 107:1021–1031.
48. Garinis GA, van der Horst GT, Vijg J, Hoeijmakers JH (2008) DNA damage and ageing:New-age ideas for an age-old problem. Nat Cell Biol 10:1241–1247.
49. Driver JA (2014) Inverse association between cancer and neurodegenerative disease:Review of the epidemiologic and biological evidence. Biogerontology 15:547–557.
50. Roe CM, Behrens MI, Xiong C, Miller JP, Morris JC (2005) Alzheimer disease andcancer. Neurology 64:895–898.
51. Roe CM, et al. (2010) Cancer linked to Alzheimer disease but not vascular dementia.Neurology 74:106–112.
52. Musicco M, et al. (2013) Inverse occurrence of cancer and Alzheimer disease: Apopulation-based incidence study. Neurology 81:322–328.
53. Sheng M, Sabatini BL, Südhof TC (2012) Synapses and Alzheimer’s disease. Cold SpringHarb Perspect Biol 4:a005777.
54. Shankar GM, Walsh DM (2009) Alzheimer’s disease: Synaptic dysfunction and Abeta.Mol Neurodegener 4:48.
55. Bonner WM, et al. (2008) GammaH2AX and cancer. Nat Rev Cancer 8:957–967.56. Kinner A, Wu W, Staudt C, Iliakis G (2008) Gamma-H2AX in recognition and signaling of
DNA double-strand breaks in the context of chromatin. Nucleic Acids Res 36:5678–5694.57. Yuan J, Adamski R, Chen J (2010) Focus on histone variant H2AX: To be or not to be.
FEBS Lett 584:3717–3724.58. Welcsh PL, Owens KN, King MC (2000) Insights into the functions of BRCA1 and
BRCA2. Trends Genet 16:69–74.59. Jiang J, et al. (2011) p53-dependent BRCA1 nuclear export controls cellular suscepti-
bility to DNA damage. Cancer Res 71:5546–5557.60. Wu J, Lu LY, Yu X (2010) The role of BRCA1 in DNA damage response. Protein Cell 1:
117–123.61. Pulvers JN, Huttner WB (2009) Brca1 is required for embryonic development of the
mouse cerebral cortex to normal size by preventing apoptosis of early neural pro-genitors. Development 136:1859–1868.
62. Pao GM, et al. (2014) Role of BRCA1 in brain development. Proc Natl Acad Sci USA111:E1240–E1248.
63. Lodato MA, et al. (2015) Somatic mutation in single human neurons tracks de-velopmental and transcriptional history. Science 350:94–98.
64. Braak H, Braak E (1991) Neuropathological stageing of Alzheimer-related changes.Acta Neuropathol 82:239–259.
65. Braak H, Alafuzoff I, Arzberger T, Kretzschmar H, Del Tredici K (2006) Staging ofAlzheimer disease-associated neurofibrillary pathology using paraffin sections andimmunocytochemistry. Acta Neuropathol 112:389–404.
66. McKeith IG, et al.; Consortium on DLB (2005) Diagnosis and management of dementiawith Lewy bodies: Third report of the DLB Consortium. Neurology 65:1863–1872.
67. McKeith IG, et al. (1996) Consensus guidelines for the clinical and pathologic di-agnosis of dementia with Lewy bodies (DLB): Report of the consortium on DLB in-ternational workshop. Neurology 47:1113–1124.
68. Murayama S, Saito Y (2004) Neuropathological diagnostic criteria for Alzheimer’sdisease. Neuropathology 24:254–260.
69. Morris TJ, et al. (2014) ChAMP: 450k chip analysis methylation pipeline. Bioinformatics30:428–430.
70. Teschendorff AE, et al. (2013) A beta-mixture quantile normalization method forcorrecting probe design bias in Illumina Infinium 450 k DNA methylation data.Bioinformatics 29:189–196.
71. Johnson WE, Li C, Rabinovic A (2007) Adjusting batch effects in microarray expressiondata using empirical Bayes methods. Biostatistics 8:118–127.
72. Ko�nca K, et al. (2003) A cross-platform public domain PC image-analysis program forthe comet assay. Mutat Res 534:15–20.
10 of 10 | www.pnas.org/cgi/doi/10.1073/pnas.1707151114 Mano et al.


![Epigenetic Regulation of Cell Type–Specific Expression Patterns in the Human Mammary ... · 2020. 5. 18. · have been extensively studied in embryonic stem cells (ESCs) [2–4]](https://img.pdfslide.tips/doc/110x75/60214a0ccf86db0461289290/epigenetic-regulation-of-cell-typeaspecific-expression-patterns-in-the-human-mammary.jpg)