Embed Size (px)
Citation preview

The NanoDefine Methods Manual. Part 2: Evaluation of methods
The NanoDefine Methods Manual Part 2: Evaluation of methods
Agnieszka Mech, Hubert Rauscher, Kirsten Rasmussen, Frank Babick, Vasile-Dan Hodoroaba, Antoine Ghanem, Wendel Wohlleben, Hans Marvin, Raphael Brüngel, Christoph M. Friedrich
2020
EUR 29876 EN
The NanoDefine Methods Manual. Part 2: Evaluation of methods
This publication is a Technical report by the Joint Research Centre (JRC), the European Commission’s science and knowledge service. It aims to provide evidence-based scientific support to the European policymaking process. The scientific output expressed does not imply a policy position of the European Commission. Neither the European Commission nor any person acting on behalf of the Commission is responsible for the use that might be made of this publication. For information on the methodology and quality underlying the data used in this publication for which the source is neither Eurostat nor other Commission services, users should contact the referenced source. The designations employed and the presentation of material on the maps do not imply the expression of any opinion whatsoever on the part of the European Union concerning the legal status of any country, territory, city or area or of its authorities, or concerning the delimitation of its frontiers or boundaries.
Contact information
Name: Hubert Rauscher
Address: via E. Fermi. 2749, TP125
I-21027 Ispra (VA), Italy
Email: [email protected]
EU Science Hub
https://ec.europa.eu/jrc
JRC117501
EUR 29876 EN
PDF ISBN 978-92-76-11953-1 ISSN 1831-9424 doi:10.2760/071877
Print ISBN 978-92-76-11952-4 ISSN 1018-5593 doi:10.2760/06428
Luxembourg: Publications Office of the European Union, 2020
© European Union, 2020
The reuse policy of the European Commission is implemented by the Commission Decision 2011/833/EU of 12 December 2011 on the reuse of Commission documents (OJ L 330, 14.12.2011, p. 39). Except otherwise noted, the reuse of this document is authorised under the Creative Commons Attribution 4.0 International (CC BY 4.0) licence (https://creativecommons.org/licenses/by/4.0/). This means that reuse is allowed provided appropriate credit is given and any changes are indicated. For any use or reproduction of photos or other material that is not owned by the EU, permission must be sought directly from the copyright holders.
All content © European Union, 2020, except: figures 3 to 9 with permission from the Royal Society of Chemistry.
How to cite this report: Mech et al., The NanoDefine Methods Manual. Part 2: Evaluation of methods, EUR 29876 EN, Publications Office of the European Union, Luxembourg, 2020, ISBN 978-92-76-11953-1, doi:10.2760/071877, JRC117501

The NanoDefine Methods Manual. Part 2: Evaluation of methods
Authors
Agnieszka Mech, Hubert Rauscher, Kirsten Rasmussen European Commission, Joint Research Centre (JRC), Ispra, Italy
Frank Babick Technische Universität Dresden, Institute of Process Engineering and Environmental Technology, Dresden, Germany
Vasile-Dan Hodoroaba Federal Institute for Materials Research and Testing (BAM), 12205 Berlin, Germany
Antoine Ghanem Solvay – Research & Innovation Centre Brussels, 1120 Brussels, Belgium
Wendel Wohlleben BASF SE, Material Physics Research, 67056 Ludwigshafen, Germany
Hans Marvin RIKILT - Wageningen UR, 6708 Wageningen, The Netherlands
Raphael Brüngel, Christoph M. Friedrich University of Applied Sciences and Arts Dortmund (FH Dortmund), Department of Computer Science, 44227 Dortmund, Germany
Contributors
Claire Gaillard, Douglas Gilliland, Francesca Pianella, François Rossi, Thomas Linsinger, Robert Koeber,
Gert Roebben European Commission, Joint Research Centre (JRC), Ispra, Italy and Geel, Belgium
Christian Ullmann, Michael Stintz Technische Universität Dresden, Institute of Process Engineering and Environmental Technology, 01062 Dresden, Germany
Johannes Mielke, Franziska Emmerling, Andreas Thünemann, Ralf Bienert, Patrick Knappe Federal Institute for Materials Research and Testing (BAM), 12205 Berlin, Germany
Stefan Weigel RIKILT - Wageningen UR, 6708 Wageningen, The Netherlands
Stephan Wagner, Frank von der Kammer University of Vienna, Department of Environmental Geosciences, 1010 Vienna, Austria
Katrin Loeschner, Manuel Correia, Erik Huusfeldt Larsen Technical University of Denmark, National Food Institute, 2800 Kgs. Lyngby, Denmark
Kai Dirscherl Danish National Metrology Inistitute (DFM), Kogle Alle 5, DK-2970 Hørsholm, Denmark
Johannes Rückert, Thorsten Wagner University of Applied Sciences and Arts Dortmund (FH Dortmund), Department of Computer Science, 44227 Dortmund, Germany
Jutta Tentschert Federal Institute for Risk Assessment, Product Safety, 10589 Berlin, Germany
Ralf Kaegi, Toni Uusimäki Eawag - Swiss Federal Institute of Aquatic Science and Technology, 8600 Dübendorf, Switzerland
Eveline Verleysen, Jan Mast Sciensano (previously CODA-CERVA), 1050 Brussels, Belgium
Alvise Bianchin MBN Nanomaterialia s.p.a, 31050 Vascon di Carbonera, Italy
George Favre, Charles Motzkus LNE Laboratoire National de Métrologie et d'Essais, 75724 Paris, France
The NanoDefine Methods Manual. Part 2: Evaluation of methods
Legal Note
This document contains general recommendations supporting the user in the decision whether a material is a nanomaterial according to the EC Recommendation on the Definition of Nanomaterial (Commission Recommendation of 18 October 2011 on the definition of nanomaterial (2011/696/EU). OJ L 275, pp. 38-40). However, users are reminded that the texts of the appropriate EC legal acts are the only authentic legal reference and that the information in this document does not constitute legal advice. Usage of the information remains under the sole responsibility of the user. The NanoDefine Consortium Partners do not accept any liability with regard to the contents of this document.
Disclaimer
Certain commercial equipment, instrument brand names and materials are identified in this document as examples or to specify adequately an experimental procedure. In no case does such identification imply recommendation or endorsement by the NanoDefine Consortium, nor does it imply that the material or equipment is necessarily the best available for the purpose and for the material under consideration.
The NanoDefine Methods Manual. Part 2: Evaluation of methods
NanoDefine
Development of an integrated approach based
on validated and standardised methods to
support the implementation of the EC
recommendation for a definition of
nanomaterial
The NanoDefine Methods Manual
Part 1: The NanoDefiner Framework and Tools
The research leading to these results has received funding from the
European Community's Seventh Framework Programme (FP7/2007-2013)
under Grant Agreement n° 604347
Website: http://www.nanodefine.eu/
Project co-ordinator: Wageningen Food Safety Research (WFSR), NL

The NanoDefine Methods Manual. Part 2: Evaluation of methods
i
Table of contents
Executive summary ............................................................................................................................................................................. 4
1 Introduction ....................................................................................................................................................................................... 5
2 Measurement techniques .......................................................................................................................................................... 6
2.1 General introduction to the methods ................................................................................................................................................. 6
2.1.1 Counting methods .......................................................................................................................................................................... 6
2.1.2 Ensemble methods ........................................................................................................................................................................ 7
2.1.3 Fractionating methods ................................................................................................................................................................ 8
2.1.4 Integral methods............................................................................................................................................................................. 8
2.2 Performance criteria ..................................................................................................................................................................................... 8
2.2.1 Applicability to different groups of substances ........................................................................................................... 8
2.2.2 Capabilities of the measurement techniques ........................................................................................................... 13
2.2.3 Template for technical characteristics .......................................................................................................................... 14
2.3 Evaluation and performance of the techniques: overview............................................................................................... 17
3 Counting methods ...................................................................................................................................................................... 23
3.1 Electron microscopy .................................................................................................................................................................................. 23
3.2 Scanning force microscopy (SFM), or atomic force microscopy (AFM) ..................................................................... 31
3.3 Particle tracking analysis (PTA), dynamic ultramicroscopy (DUM) .............................................................................. 38
3.4 Tunable resistive pulse sensing (TRPS) / electrical sensing zone (ESZ) / nano Coulter counter .............................................................................................................................................................................. 44
3.5 Single particle ICP-MS (spICP-MS) ................................................................................................................................................... 50
4 Ensemble methods (spectroscopic) .................................................................................................................................. 57
4.1 Dynamic light scattering (DLS) ................................................................................................................................................... 57
4.2 Small-angle X-ray scattering (SAXS) ..................................................................................................................................... 64
4.3 Ultrasonic spectroscopy (USSp).................................................................................................................................................. 71
4.4 Angular light scattering (ALS), including laser diffraction (LD) ....................................................................... 77
5 Fractionating methods ............................................................................................................................................................. 84
5.1 Field-flow-fractionation (FFF) ............................................................................................................................................................ 84
5.2 Analytical centrifugation (AC) ............................................................................................................................................................. 92
5.3 Differential electrical mobility analysis (DEMA) .................................................................................................................. 100
6 Integral methods ...................................................................................................................................................................... 108
6.1 BET for determination of volume specific surface area (VSSA) ................................................................................ 108
7 References ................................................................................................................................................................................... 114
Annex 1 NanoDefine priority materials .............................................................................................................................. 120
Annex 2 International standards on particle sizing ..................................................................................................... 121

The NanoDefine Methods Manual. Part 2: Evaluation of methods
ii
Index of figures
Figure 1 Measurement techniques for particle size distribution described in this report .......................................... 7
Figure 2 Measurement principle of SFM .............................................................................................................................................. 31
Figure 3 Measurement principle of DLS .............................................................................................................................................. 58
Figure 4 Measurement principle of SAXS ............................................................................................................................................ 65
Figure 5 Measurement principle of FFF ............................................................................................................................................... 84
Figure 6 Schematic diagram of an AC cuvette centrifuge system ....................................................................................... 93
Figure 7 Fundamental components of the differential mobility analysing system (ISO 15900:2009) ....... 101
The NanoDefine Methods Manual. Part 2: Evaluation of methods
iii
Index of tables
Table 1 Types of composite particles. ............................................................................................................................................................................... 10
Table 2 Technical characteristics for assessment of measurement techniques.................................................................................... 15
Table 3 Evaluation of the methods: Size range .......................................................................................................................................................... 19
Table 4 Evaluation of the methods: Material ................................................................................................................................................................ 20
Table 5 Evaluation of the methods: single particles, agglomerates and aggregates ......................................................................... 21
Table 6 Evaluation of the methods: additional information ................................................................................................................................ 22
Table 7 General performance of electron microscopy (EM) ................................................................................................................................ 25
Table 8 Technical characteristics for electron microscopy (EM) ....................................................................................................................... 26
Table 9 General performance of scanning force microscopy (SFM) / atomic force microscopy (AFM).................................... 32
Table 10 Technical characteristics for scanning force microscopy (SFM) / atomic force microscopy (AFM) ....................... 33
Table 11 General performance of particle tracking analysis (PTA) / dynamic ultramicroscopy (DUM) ................................... 39
Table 12 Technical characteristics for particle tracking analysis (PTA) / dynamic ultramicroscopy (DUM) .......................... 39
Table 13 General performance of Tunable Resistive Pulse Sensing (TRPS) / Electrical sensing zone (ESZ) / nano Coulter counter .............................................................................................................................................................................................. 45
Table 14 Technical characteristics for tunable resistive pulse sensing (TRPS) ....................................................................................... 45
Table 15 General performance of single particle inductively coupled plasma – mass spectrometry (spICP-MS) ........... 51
Table 16 Technical characteristics for single particle inductively coupled plasma – mass spectrometry (spICP-MS) .. 52
Table 17 General performance for dynamic light scattering (DLS) ................................................................................................................ 59
Table 18 Technical characteristics for dynamic light scattering (DLS) ........................................................................................................ 60
Table 19 General performance for small-angle X-ray scattering (SAXS) ................................................................................................... 65
Table 20 Technical characteristics for small-angle X-ray scattering (SAXS) ............................................................................................ 66
Table 21: General performance of ultrasonic spectroscopy (USSp) ............................................................................................................... 72
Table 22 Technical characteristics for ultrasonic spectroscopy (USSp) ....................................................................................................... 73
Table 23 General performance of angular light scattering (ALS) .................................................................................................................... 78
Table 24 Technical characteristics for angular light scattering (ALS) ........................................................................................................... 79
Table 25 General performance of field-flow-fractionation (FFF) .................................................................................................................... 86
Table 26 Technical characteristics for field-flow-fractionation (FFF) ........................................................................................................... 88
Table 27 General Performance of analytical centrifugation (AC) .................................................................................................................... 94
Table 28 Technical characteristics of analytical centrifugation (AC) ............................................................................................................. 95
Table 29 General performance of differential electrical mobility analysis (DEMA) .......................................................................... 102
Table 30 Technical characteristics for differential electrical mobility analysis (DEMA) ................................................................. 103
Table 31 General performance table for BET for determination of specific surface area ........................................................... 109
Table 32 Technical characteristics for BET for determination of specific surface area ................................................................. 110

The NanoDefine Methods Manual. Part 2: Evaluation of methods
1
About the NanoDefine Methods Manual
The present series of reports, the NanoDefine Methods Manual, has been developed within the
NanoDefine project 'Development of an integrated approach based on validated and standardized
methods to support the implementation of the EC recommendation for a definition of nanomaterial',
funded by the European Union's 7th Framework Programme, under grant agreement 604347.
In 2011 the European Commission (EC) published a recommendation for a definition of the term
'nanomaterial', the EC NM Definition, as a reference to determine whether an unknown material can be
considered as a 'nanomaterial' for regulatory purposes1. One challenge is the development of methods
that reliably identify, characterize and quantify nanomaterials (NM) both as substances and in various
products and matrices.
The overall goal of NanoDefine was to support the implementation of the EC NM Definition. It can also
support the implementation of any NM definition based on particle size. The project has developed an
integrated approach, which allows identifying any material as a nano- or not a nanomaterial according to
the EC NM Definition. NanoDefine explicitly supported the governance challenges associated with the
implementation of legislation concerning nanomaterials by:
addressing the issues on availability of suitable measuring techniques, reference materials,
validated methods, acceptable to all stakeholders (authorities, policy makers, commercial firms),
developing an integrated and interdisciplinary approach and a close international co-operation and
networking with academia, commercial firms and standardization bodies.
Thus, the NanoDefine Methods Manual provides guidance on practical implementation of the EC NM
Definition throughout the nanomaterial characterization process, and on the characterization techniques
employed as well as their application range and limits. It assists the user in choosing the most appropriate
measurement method(s) to identify any substance or mixture for a specific purpose, according to the EC
NM Definition of a nanomaterial. The NanoDefine project also explored how to assess a material against
the criteria of the definition through proxy solutions, i.e. by applying measurement techniques that
indirectly determine the x50. Those findings were developed through empirically based scientific work and
are included in Part 1 of this Manual. As they go beyond the text of the EC NM Definition, they may be
used as practical approach to indicate whether a material is a nanomaterial or not, but keeping in mind
that they should not be taken as recommendation for the implementation of the EC NM Definition in a
regulatory context.
The NanoDefine Methods Manual consists of the following three parts:
Part 1: The NanoDefiner Framework and Tools
Part 2: Evaluation of Methods
Part 3: Standard Operating Procedures (SOPs)
Part 1 covers the NanoDefiner framework, general information on measurement methods and
performance criteria and tools developed by NanoDefine such as a materials categorisation system, a
decision support flow scheme and an e-tool.
Part 2 discusses the outcome of the evaluation of the nanomaterials characterisation methods for
measuring size.
Part 3 presents the 23 Standard Operating Procedures developed within the NanoDefine project.
The current document is part 2.

The NanoDefine Methods Manual. Part 2: Evaluation of methods
2
Abbreviations and acronyms used in the Manual
AC Analytical Centrifugation
AF4 Asymmetrical Flow Field-Flow-Fractionation
AFM Atomic Force Microscopy
ALS Angular Light Scattering
Aq. Aqueous
AR Aspect Ratio
AUC Analytical Ultra Centrifugation
BET Brunauer-Emmett-Teller
BSA Bovine Serum Albumin
CM Characterisation Method
CEN European Committee for Standardization
CFFF Centrifugal Field-Flow-Fractionation
CLS Centrifugal Liquid Sedimentation
CPC Condensation Particle Counter
DEMA Differential Electrical Mobility Analysis (also spray-DEMA)
DMA Differential Mobility Analyser
DLS Dynamic Light Scattering
DSFS Decision Support Flow Scheme
DUM Dynamic Ultramicroscopy
EC European Commission
EC NM Definition EC Recommendation on the Definition of a Nanomaterial
EDX / EDS Energy Dispersive X-ray spectrometry
EELS Electron Energy Loss Spectroscopy
EFTEM Energy-Filtered Transmission Electron Microscopy
EHS Environment, Health and Safety
EM Electron Microscopy
ESD Equivalent Spherical Diameter
ESI-SMPS Engineering System International SMPS
ESZ Electrical Sensing Zone
FFF Field-Flow-Fractionation
FTIR Fourier-transform Infrared Spectroscopy
HSE Health, Safety and Environment
ICP-MS Inductively Coupled Plasma - Mass Spectrometry
ICP-OES Inductively Coupled Plasma - Optical Emission Spectrometry
KB Knowledge Base
LD Laser Diffraction
LoD Limit of Detection
LS Light Scattering
The NanoDefine Methods Manual. Part 2: Evaluation of methods
3
MALS Multi-Angle Light Scattering
MALLS Multi angle laser light scattering
MCS Material Categorisation Scheme
MT Measurement Technique
MWCNT Multi-walled Carbon Nanotube
m/z Mass-to-Charge Ratio
NaDS Sodium Dodecyl Sulphate
NM Nanomaterial
NTA Nanoparticle Tracking Analysis
NP Nanoparticle
PSD Particle Size Distribution
PTA Particle Tracking Analysis
QELS Quasi Elastic Light Scattering
RI Refractive Index
SAXS Small-Angle X-ray Scattering
SDS Safety Data Sheet
SEM Scanning Electron Microscopy
SEM-EDX SEM-Energy Dispersive X-ray Analysis
SedFFF Sedimentation Field-Flow-Fractionation
SFM Scanning Force Microscopy
SLS Static Light Scattering
SMPS Scanning Mobility Particle Sizer
SOP Standard Operating Procedure
spICP-MS Single Particle ICP-MS
TEM Transmission Electron Microscopy
TRPS Tuneable Resistive Pulse Sensing
UF Ultrafine
USB Ultrasonic Bath Sonicator
USP Ultrasonic Probe Sonicator
USSp Ultrasonic Spectroscopy
UV Ultra Violet
UV-vis Ultra Violet - Visible
VS Vial Sonicator
VSSA Volume-Specific Specific Surface Area
The NanoDefine Methods Manual. Part 2: Evaluation of methods
4
Executive summary
This document is Part 2 ("Evaluation of methods") of the NanoDefine Methods Manual. It is based on the
results of a comprehensive study performed within the NanoDefine project ('NanoDefine') of the available
measurement techniques, which are candidates for performing a reliable analysis of the number-based
size distribution of a particulate material, with the goal to identify nanomaterials according to the
European Commission recommendation on the definition of nanomaterial1. NanoDefine was executed
under the European Community's Seventh Framework Programme (FP7/2007-2013) under Grant
Agreement n° 604347.
Based on the performance criteria established in NanoDefine the potential measurement techniques were
evaluated (i) according to studies available in the literature, (ii) in a comparative interlaboratory study with
selected real world materials ("NanoDefine priority materials"), as well as (iii) through the expertise of the
NanoDefine consortium partners. The detailed information on the evaluation process is presented in
NanoDefine Technical Reports which can be found on the project website at
http://www.nanodefine.eu/index.php/nanodefine-publications/nanodefine-technical-reports.
This document discusses most of the available size measurement techniques for nanomaterials. The
different types of the methods that allow the determination of size and size distributions are explained
and an overview of techniques and their capabilities is presented in user-friendly overview tables. These
tables provide the reader with a possibility for quick selection of the method(s) which may be appropriate
for the characterisation of given material. For the final selection of the method(s) to be employed it is
highly recommended to use the detailed performance tables. These are described in the four main
sections of the report. Each section introduces one of the four types of methods: counting, fractioning,
spectroscopic ensemble and integral methods and explains the basic principles of that type of method as
well as its performance, advantages and disadvantages.
This report presents the outcomes of the evaluatyion in two types of tables per method: one table that
presents general performance information highlighting also advantages and disadvantages of the
technique. The second table provides additional and very detailed information on the capabilities of the
method.
The NanoDefine Methods Manual. Part 2: Evaluation of methods
5
1 Introduction
This report is Part 2 of the NanoDefine Methods Manual and provides the 'Evaluation of methods'. It
reflects the outcomes of a comprehensive study performed within the NanoDefine project on the available
measurement techniques, which are candidates for performing a reliable analysis of the number-based
size distribution of a particulate material, with the goal to identify nanomaterials according to the
European Commission recommendation on the definition of nanomaterial1 the EC NM Definition. Based on
the performance criteria already established in NanoDefine and the NanoDefine Technical Reports, which
all can be found on the project website2, these measurement techniques were evaluated (i) according to
studies available in the literature, (ii) in a comparative interlaboratory study with selected real world
materials ("NanoDefine priority materials", see Annex 1 for a list of these materials), and (iii) through the
expertise of the NanoDefine consortium partners. The detailed information about the evaluation process is
presented in the NanoDefine Technical Reports.
This document discusses most of the available size measurement techniques for nanomaterials, see
Figure 1. The methods described are divided into four main groups, which are counting, spectroscopic
ensemble, fractioning and integral methods. For each evaluated measurement technique, the basic
principles are briefly explained and described in a dedicated section.
An overview of the techniques and their capabilities is presented in the form of three types of user-
friendly tables. The first table type of table is presented in section 0, which presents overview tables of
the evaluation of all the methods (see Table 3 to Table 6), providing the reader with the possibility for a
quick selection of the method(s) which may be appropriate for the characterisation of given material. As
the purpose of this report is to present the outcomes of evaluation the size measurement methods these
overview tables are also the conclusions of this report.
The second and third types of tables, general performance tables and technical characteristics tables, give
additional and much more detailed information on the capabilities of each method. The performance
tables give an overview of main features, main advantages and main disadvantages for each
measurement technique. The technical characteristics tables first present the material-related technical
characteristics of the criteria, and then the metrological aspects of the technique, and the content of the
technical characteristics tables is explained in section 2.2.1. The chapters 3 to 6 of the report have 11
sections that present one general performance table and one technical characteristics table for each
measurement technique. In particular, these tables highlight any further information that should be
considered for the choice of the most appropriate method with a yellow warning sign to draw
attention of the reader. Furthermore, the column “notes” lists additional relevant information that may be
of particular importance for specific cases.
It is highly recommended to use the technical characteristics tables, which are described in this report, for
final selection of the method(s) to be employed.
The NanoDefine Methods Manual. Part 2: Evaluation of methods
6
2 Measurement techniques
This chapter presents the summary of the results of a comprehensive study performed within the
NanoDefine project. NanoDefine studied, among others, the available measurement techniques, which
were candidates for the reliable analysis of the number-based size distribution of a particulate material
with the goal to identify nanomaterials according to the EC NM Defintion.
The following chapters explain the basic principles of each evaluated method and general performance
information is presented in a dedicated table per technique, which also highlight main advantages and
disadvantages of the technique. Furthermore, additional detailed information on the performance and
suitability of each method is presented as a table which allows the user a quick and simple identification
of the question (criterion) and clear answer. Additional information to take into consideration when
choosing the most appropriate method is highlighted with the sign . It is also strongly suggested to
pay attention to the information included in the column “notes” as it may be important for specific cases.
As already stated in chapter 1 different sets of tables help the reader to identify and select the (most)
appropriate technique for given material. A non-exhaustive list of relevant international standards (ISO) on
particle sizing is included in Annex 2 of this document.
2.1 General introduction to the methods
There are several means and physical phenomena that allow for the determination of size and size
distributions (e.g. imaging, sedimentation, light extinction). A more general distinction of particle sizing
techniques is based on how the weights of the individual size fractions are determined.
counting techniques (measuring particle properties at the level of individual particles)
ensemble techniques (measuring the spectral or parametric response of a representative particle
ensemble of the total particle system)
fractionating techniques (measuring the amount or concentration of size/property classes after
fractionating the particle system)
integral methods (measuring effective properties at the level of a whole particle system, without
being able to provide a size distribution)
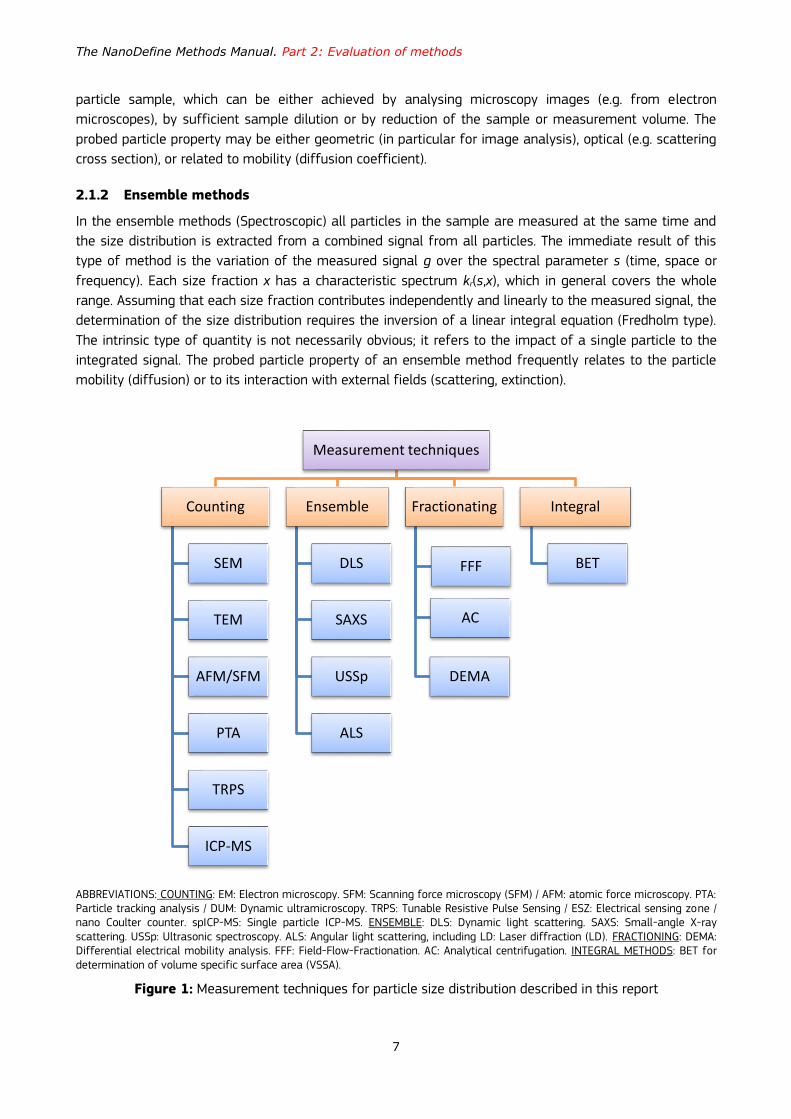
Figure 1 gives an overview of measurement techniques that can be used for each of the four types of
methods, and a description of each type of method is given below.
Screening methods give an initial indication of whether a given material is a nanomaterial according to
the EC NM Defintion or not and may under favourable conditions allow identifying nanomaterials. These
methods are called tier 1 methods. The tier 2 methods (currently only EM methods are recommended by
NanoDefine) are confirmatory methods that allow to unambiguously determine if a given material is a
nanomaterial according to the EC NM Defintion or not.
2.1.1 Counting methods
In the counting methods individual particles are measured and counts of similar-sized particles are placed
into a "size bin" or size class to construct a size distribution.
Counting methods inherently yield particle number weighted distributions (Q0) of a certain particle
property or of a physical quantity that is related to a certain particle property (e.g. particle size, or the
average displacement as a measure of the diffusion coefficient). They rely on the individualisation of the
The NanoDefine Methods Manual. Part 2: Evaluation of methods
7
particle sample, which can be either achieved by analysing microscopy images (e.g. from electron
microscopes), by sufficient sample dilution or by reduction of the sample or measurement volume. The
probed particle property may be either geometric (in particular for image analysis), optical (e.g. scattering
cross section), or related to mobility (diffusion coefficient).
2.1.2 Ensemble methods
In the ensemble methods (Spectroscopic) all particles in the sample are measured at the same time and
the size distribution is extracted from a combined signal from all particles. The immediate result of this
type of method is the variation of the measured signal g over the spectral parameter s (time, space or
frequency). Each size fraction x has a characteristic spectrum kr(s,x), which in general covers the whole
range. Assuming that each size fraction contributes independently and linearly to the measured signal, the
determination of the size distribution requires the inversion of a linear integral equation (Fredholm type).
The intrinsic type of quantity is not necessarily obvious; it refers to the impact of a single particle to the
integrated signal. The probed particle property of an ensemble method frequently relates to the particle
mobility (diffusion) or to its interaction with external fields (scattering, extinction).
ABBREVIATIONS: COUNTING: EM: Electron microscopy. SFM: Scanning force microscopy (SFM) / AFM: atomic force microscopy. PTA: Particle tracking analysis / DUM: Dynamic ultramicroscopy. TRPS: Tunable Resistive Pulse Sensing / ESZ: Electrical sensing zone / nano Coulter counter. spICP-MS: Single particle ICP-MS. ENSEMBLE: DLS: Dynamic light scattering. SAXS: Small-angle X-ray scattering. USSp: Ultrasonic spectroscopy. ALS: Angular light scattering, including LD: Laser diffraction (LD). FRACTIONING: DEMA: Differential electrical mobility analysis. FFF: Field-Flow-Fractionation. AC: Analytical centrifugation. INTEGRAL METHODS: BET for determination of volume specific surface area (VSSA).
Figure 1: Measurement techniques for particle size distribution described in this report
Measurement techniques
Counting
SEM
TEM
AFM/SFM
PTA
TRPS
ICP-MS
Ensemble
DLS
SAXS
USSp
ALS
Fractionating
FFF
AC
DEMA
Integral
BET
The NanoDefine Methods Manual. Part 2: Evaluation of methods
8
2.1.3 Fractionating methods
In the fractioning methods an external force/process is used to separate particles according to their size;
subsequently the quantities of the separated different sizes or size fractions are determined to construct
a size distribution.
Fractionating methods include the two steps of fractionation and detection. The former can either result in
a physical separation of the different size classes or in the depletion of coarse or fine particles in the
measurement zone. In the case of colloidal suspensions, the fractionating effect is usually related to the
mobility of the particles (e.g. settling velocity). The detection system monitors the fractionation process
and thus serves for evaluating the class frequencies. Detection frequently employs phase shift, extinction
or scattering of some radiation (e.g. X-rays). The applied detection system determines the type of quantity
in which the size fractions are intrinsically weighted (e.g. extinction of X-rays is mass proportional – Q3).
2.1.4 Integral methods
In additional to the methods that resolve the distribution of particle sizes, there are a few methods which
solely measure an integral (effective/mean) property of a particle system such as the specific surface
area (SV or Sm) or the turbidity of a suspension. These properties can be directly converted into mean
values of a PSD (e.g. SV harmonic mean of the volume weighted PSD). Note that ensemble methods, in
principle, also yield such integral properties (e.g. the mean decay of signal fluctuation in DLS gives xcum, i.e.
the harmonic mean of the intensity weighted size distribution).
2.2 Performance criteria
For the purpose of the NanoDefiner framework performance criteria of each measurement method were
elaborated in detail; they include: applicability to different groups of substances (chemical scope of the
method), applicability to polydisperse samples, capability to measure aggregates, agglomerates,
constituent particles (in agglomerates/aggregates) and/or non-spherical particles, accuracy of the results
determined with the measurement technique, standardisation status (traceability of the measured values
/ availability of CRMs).
Each measurement technique was evaluated against these criteria depending on the substance to analyse
(if the measurement technique is suitable for this type of substance) and on the technical factors. The
applied criteria, which are discussed below, are not listed according to their priority. The presented tables
include more information than eventually was included into the final Material Categorisation Scheme and
NanoDefiner e-tool, but as these detailed data are available they are included in the report for
information and possible use.
2.2.1 Applicability to different groups of substances
This section discusses criteria which affect the suitability and performance of particles sizing methods.
Particle sizing methods were assessed against these criteria, and the detailed results can be found in the
NanoDefine methods performance tables in chapters 3 to 6 of this report.
2.2.1.1 Nanoparticles in powder, or liquid suspensions or embedded in a matrix
Certain measurement techniques are only applicable to nanoparticles dispersed in a liquid phase; others
are for aerosols or for powders and granulates. For the characterisation of nanomaterials e.g. in articles or
formulations it is necessary to know if a method can characterise nanoparticles embedded in a matrix.
One should also take into consideration that some nanoparticles may change significantly during sample

The NanoDefine Methods Manual. Part 2: Evaluation of methods
9
preparation, which restricts the possible dispersion medium and thus excludes certain measurement
techniques. As the physical state of the sample has a major impact on the choice of the measurement
technique the primary grouping was done based on the type of the physical state of the sample:
Dispersed in liquids
Solid particulate form (powder...)
Dispersed or embedded in different types of matrices (paste, resin, elastomer...)
2.2.1.2 Dispersibility according to dispersion protocols
Some measurement techniques may be applied only to dispersed materials (in liquid and gas). Therefore
it is essential to know if the substance can be dispersed by standardised protocols that specify both a
dispersion medium and a dispersion protocol.
Measured size distributions can be severely affected by sample preparation protocols, for instance by the
choice of the dispersion media and the particle concentration but also by the selected dispersant, which
controls the state of aggregation and agglomeration. It should be underlined that the surface chemistry of
particles strongly affects their dispersibility behaviour hence they are divided in five major groups:
Dispersible in aqueous media (by generalised protocols)
Dispersible in non-polar liquids (by generalised protocols)
Dispersible in polar liquids other than water (by generalised protocols)
Dispersible in material-specific media (by specific protocols)
Can be aerosolized
2.2.1.3 Nature of the substance
One of the most important criteria is the nature of the substance considering that the measurement
technique has to be chosen and/or adapted accordingly. For instance, the lower size limit of spICP-MS is
directly related to the elemental composition of the material, and organic particles cannot be detected (in
the nanorange).
Consequently materials can be grouped as follows:
Inorganic materials such as metals, ceramics, salts, oxides (significant content of inorganic elements homogeneously incorporated in all constituent particles)
Particles which exhibit size-dependent absorption of photons / fluorescence (metals, quantum dots3…)
Carbon-based (CNT, nanodiamond, carbon black…)
Organic, particulate (polymers, dyes, etc., nanonized, precipitated)
Organic, non-particulate (dendrimers, liposomes, supramolecular assemblies…)
Biological (nucleic acid, peptide, protein)
Composite particle
Other
A composite is a solid substance where each particle consists of two or more phase-separated
constituents4. Depending on the internal structure, composite particles can be divided into three types, see Table 1. As the structure of the composite particle may influence the result of the analysis it is

The NanoDefine Methods Manual. Part 2: Evaluation of methods
10
necessary to acquire detailed knowledge on the composite particles structure in order to apply a suitable measurement technique including the correct data evaluation.
Table 1: Types of composite particles (Reproduced from Ref. [5] with permission from the Royal Society of Chemistry).
Type of composite particle Visualisation
Core-shell particles consist of at least two components, one of which (the core) lies within the other that forms the outer layer (the shell).
Multishell particles are core-shell particles with more than one outer layer (shell)
Particles with inclusions are particles in which the components are phase-separated from each other and one phase is dispersed in the other and forms the inclusions. The number and size of the domains can vary, and their spatial distribution within the particles is often not uniform.
2.2.1.4 Particle shape and number of small dimensions
Many of the currently employed measurement techniques implicitly assume that the particles are
spherical or yield an equivalent spherical size, which severely limits their applicability to particles with
non-spherical shape. Furthermore, plate- or fibre-like particles requires specific methods, which allow to
measure the smallest dimensions of the particles as often this is the dimension which should be assessed
to determine if the material meets the EC NM Definition requirements. An additional difficulty occurs if
the analysed sample consists of a mixture of particles of different shapes. In such case, only EM and
possibly scanning probe microscopy could yield reliable results. Even with EM, the analysis of plate-like
particles is problematic as the smallest dimension (thickness) could be difficult to access.
Considering the characteristics of available analytical methods, the criteria of shape and number of
nanoscale dimensions of nanoparticles can assume the following values:
1, 2 or 3 (number of nanoscale dimensions)
Mixture of nanoparticles with different shapes
In principle, indication of the number of small dimensions is sufficient, but often it is helpful to
characterise particle shape with more descriptive terms. They are also included here regardless of some
redundancy with the criterion of number of small dimensions. Descriptive criteria for particle shape are:
One small dimension: plates (flat shapes incl. irregular flakes) (ratio thickness:laterial extension ≤ 0.25)
Two small dimensions: fibres (elongated shapes such as tubes, fibres, rods) (length:diameter ≥ 3)
Three small dimensions: Spherical, equiaxial or similar (e.g. prismatic, cubic, tetrahedral)
Mixture of nanoparticles with different shapes
Other (incl. unknown)

The NanoDefine Methods Manual. Part 2: Evaluation of methods
11
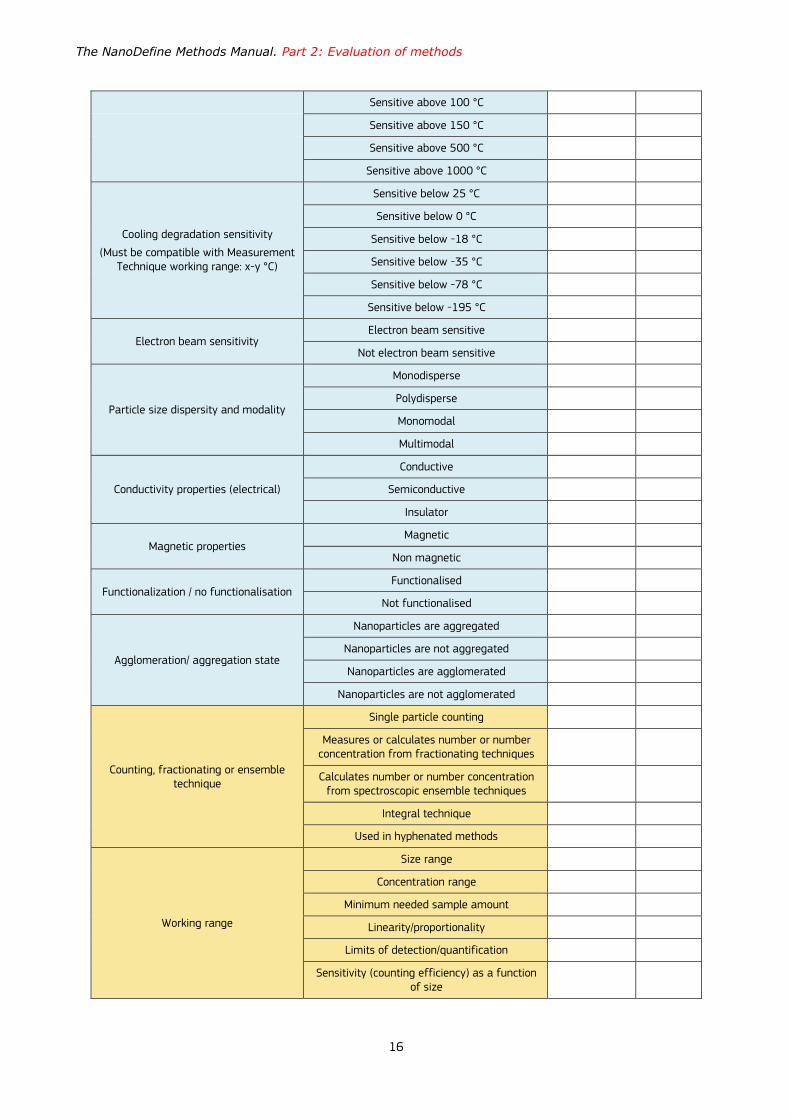
2.2.1.5 Thermal degradation sensitivity
Some measurement techniques may lead to a thermal load on the sample and consequently alter their
chemical or physical properties. Therefore it is important to know if a given measurement technique can
cause damages to heat sensitive samples, which would hamper the validity of such measurements.
Subsequently substances may be categorised as below:
Sensitive above 0 °C
Sensitive above 25 °C (room temperature)
Sensitive above 37 °C (body temperature)
Sensitive above 50 °C
Sensitive above 100 °C
Sensitive above 150 °C
Sensitive above 500 °C
Sensitive above 1000 °C
The entry 'yes' in the performance table means that the method can be used to measure a material with
the stated sensitivity.
2.2.1.6 Cooling degradation sensitivity
It is important to know if the measurement technique may cause damage to temperature sensitive
samples during a cooling process, hence jeopardising the validity of such measurements. Consequently
substances may be divided in six general groups:
Sensitive below 25 °C
Sensitive below 0 °C
Sensitive below - 18 °C (freezer)
Sensitive below - 35 °C (deep freezer)
Sensitive below - 78 °C (dry ice)
Sensitive below – 195 °C (liquid nitrogen)
The entry 'yes' in the performance table means that the method can be used to measure a material with
the stated sensitivity.
2.2.1.7 Electron beam sensitivity
This criterion takes into account that some substances are sensitive to electron irradiation and therefore
cannot be characterised reliably with EM, or require more sophisticated EM techniques, such as cryo-EM or
low-dose techniques:
Sensitive to electron beam
Not sensitive to electron beam
The entry 'yes' in the performance table means that the method can be used to measure a material with
the stated sensitivity.
The NanoDefine Methods Manual. Part 2: Evaluation of methods
12
2.2.1.8 Particle size dispersity and modality
All samples have, to a certain degree, a polydisperse particle size distribution. Therefore it is important to
recognize if a specific measurement technique can be used to analyse polydisperse samples without
obtaining false results. Hence dispersity and modality of the sample has to be considered as an important
factor in the performance of the method. The following general groups of particle size dispersity have
been identified:
(Quasi-) Monodisperse
Polydisperse
Multimodal
Monomodal
It is also important to define at which degree of polydispersity a sample may not be considered mono-
disperse anymore.
2.2.1.9 Optional criteria
Electrical conductivity
Another important criterion to be considered is electrical conductivity of the sample as certain
measurement techniques are more appropriate for electrically conductive substances.
Conductive
Semiconductive
Insulator
Magnetic properties
Magnetic particles may be characterised with some specific measurement techniques such as magnetic
force microscopy (MFM)6 or magnetic particle spectrometer7, 8. Thermomagnetic9, direct current (dc)
magnetisation10 and alternating current (ac) susceptibility11 measurements enable also to determine the
size distribution of magnetic particles. In this regard, nanoparticles can be classified as:
Magnetic
Non magnetic
Functionalisation / no functionalisation of the surface
One important criterion is to know if the nanoparticles are surface functionalised or not. Measurement
techniques have to be adapted according to this characteristic.
Functionalised
Not functionalised
It is also important to determine the difference between functionalisation of the surface and the presence
of a shell layer. For the purpose of the NanoDefiner e-tool it was established that nanoparticles
completely covered with a uniform layer belong to the category composite materials.
Most of the measurement techniques give can measure the size of the functionalised nanoparticles, but
do not give any information on the type of functionalisation.
The NanoDefine Methods Manual. Part 2: Evaluation of methods
13
Agglomeration/ aggregation state
Nanoparticles can be aggregated or have a tendency to agglomerate. This specific feature of a material
needs to be accounted for in the performed data analysis; nanoparticles can be categorised as:
Nanoparticles are aggregated
Nanoparticles are not aggregated
Nanoparticles are agglomerated
Nanoparticles are not agglomerated
2.2.2 Capabilities of the measurement techniques
2.2.2.1 What type of measurement technique is it? (Counting, ensemble technique or fractionating)
Single particle counting
Calculate number or concentration from ensemble methods
Method combination (hyphenated methods)
2.2.2.2 Working range
The working range is the range in which the method provides reliable results. The working range may be
dependent also on the material and its preparation and on the instrument type.
Size range
Concentration range
Minimum sample intake (How much material is needed?)
Linearity/proportionality
Limits of detection/quantification
Sensitivity (Counting or detection efficiency as a function of size)
2.2.2.3 Trueness
Trueness is defined as a difference between the averages of several measurements on the same sample
or material and the true value of the measured property (associated quantitative term "bias").
Trueness may be expressed either in terms of size or in terms of amount of particles.
2.2.2.4 Robustness
Robustness is defined as an influence of slight variations in the test protocol on the outcome of the test.
2.2.2.5 Precision
Precision is a test result variation within one test series (repeatability) or several test series (intermediate
precision), either in terms of size or in terms of amount of particles.
2.2.2.6 Resolution
Resolution means to which degree a certain size fraction can be distinguished from another (e.g. minimum
distance or size ratio needed between different modes so that they can be identified in a mixture of
monodisperse samples).
The NanoDefine Methods Manual. Part 2: Evaluation of methods
14
2.2.2.7 Size distribution
The following criterion was considered: Does the method provide a size distribution12 or a certain average
value?
2.2.2.8 Selectivity
Selectivity is how well the measurement technique can distinguish between:
nanoparticles and non-nanoparticles of the same composition
nanoparticles and non-nanoparticles of another composition (e.g. mixtures of powders)
nanoparticles of another composition (mixtures of powders)
Moreover, if the substance to analyse is not pure, it is essential to know if and how the results are
affected by impurities, including dissolved ionic species from the same substance. "Yes" in the
performance table means that the measurement technique can distinguish between the nanomaterial and
the impurity, whereas a "No" mean that the impurities will be detected but the measurement technique
cannot distinguish between the nanoparticles and impurity particles.
2.2.2.9 Capability to measure aggregation
Can the method identify and/or measure agglomerates or aggregates of particles?
2.2.2.10 Capability to measure single particles
Can the method measure the size and number of individual particles?
2.2.2.11 Counting constituent particles in aggregates
Is the method able to count constituent particles in aggregates?
2.2.2.12 Chemical composition
Does the method provide information on the chemical composition?
2.2.2.13 Specification of the measurand (diameter)
Size measurement is method dependent.13 Different methods address different measurands (equivalent
diameters) which need to be specified (hydrodynamic diameter, Stokes diameter, projected area diameter,
etc.).
2.2.2.14 Non-destructive / destructive
This criterion indicates whether the method is destructive or not.
2.2.3 Template for technical characteristics
An overview of the outcomes of the evaluation of each measurement technique is presented in a self-
explanatory performance table with standardised information content, giving an over view of the main
features of each method, and main advantages and disadvantages.
The outcomes of the evaluation of each measurement technique are presented in a dedicated technical
characteristics table with standardised information content; an empty table is shown as Table 2. For
clarity it is divided into two sections. The first (blue rows) is related to the type of substance being
analysed, and indicating whether the method is suitable for characterising materials with specific
properties. The second section (orange rows) is related to the technique, indicating the characteristics of
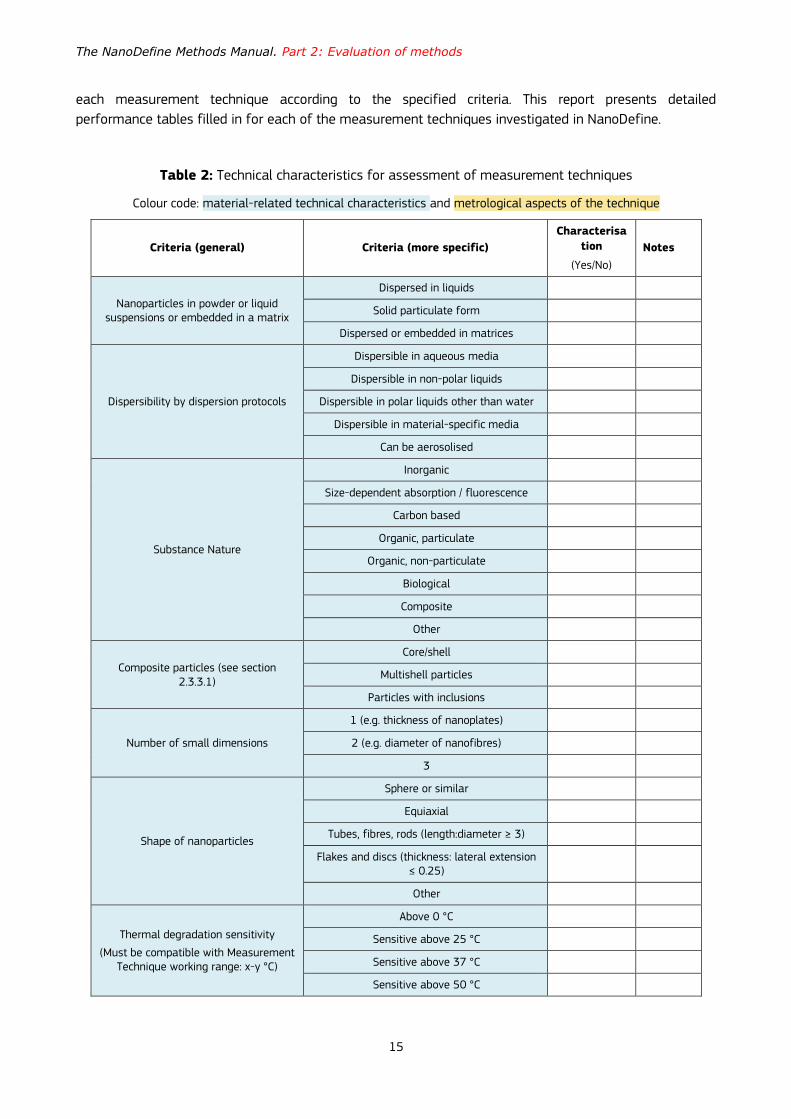
The NanoDefine Methods Manual. Part 2: Evaluation of methods
15
each measurement technique according to the specified criteria. This report presents detailed
performance tables filled in for each of the measurement techniques investigated in NanoDefine.
Table 2: Technical characteristics for assessment of measurement techniques
Colour code: material-related technical characteristics and metrological aspects of the technique
Criteria (general) Criteria (more specific)
Characterisa
tion
(Yes/No)
Notes
Nanoparticles in powder or liquid suspensions or embedded in a matrix
Dispersed in liquids
Solid particulate form
Dispersed or embedded in matrices
Dispersibility by dispersion protocols
Dispersible in aqueous media
Dispersible in non-polar liquids
Dispersible in polar liquids other than water
Dispersible in material-specific media
Can be aerosolised
Substance Nature
Inorganic
Size-dependent absorption / fluorescence
Carbon based
Organic, particulate
Organic, non-particulate
Biological
Composite
Other
Composite particles (see section 2.3.3.1)
Core/shell
Multishell particles
Particles with inclusions
Number of small dimensions
1 (e.g. thickness of nanoplates)
2 (e.g. diameter of nanofibres)
3
Shape of nanoparticles
Sphere or similar
Equiaxial
Tubes, fibres, rods (length:diameter ≥ 3)
Flakes and discs (thickness: lateral extension ≤ 0.25)
Other
Thermal degradation sensitivity
(Must be compatible with Measurement Technique working range: x-y °C)
Above 0 °C
Sensitive above 25 °C
Sensitive above 37 °C
Sensitive above 50 °C
The NanoDefine Methods Manual. Part 2: Evaluation of methods
16
Sensitive above 100 °C
Sensitive above 150 °C
Sensitive above 500 °C
Sensitive above 1000 °C
Cooling degradation sensitivity
(Must be compatible with Measurement Technique working range: x-y °C)
Sensitive below 25 °C
Sensitive below 0 °C
Sensitive below -18 °C
Sensitive below -35 °C
Sensitive below -78 °C
Sensitive below -195 °C
Electron beam sensitivity Electron beam sensitive
Not electron beam sensitive
Particle size dispersity and modality
Monodisperse
Polydisperse
Monomodal
Multimodal
Conductivity properties (electrical)
Conductive
Semiconductive
Insulator
Magnetic properties Magnetic
Non magnetic
Functionalization / no functionalisation Functionalised
Not functionalised
Agglomeration/ aggregation state
Nanoparticles are aggregated
Nanoparticles are not aggregated
Nanoparticles are agglomerated
Nanoparticles are not agglomerated
Counting, fractionating or ensemble technique
Single particle counting
Measures or calculates number or number concentration from fractionating techniques
Calculates number or number concentration from spectroscopic ensemble techniques
Integral technique
Used in hyphenated methods
Working range
Size range
Concentration range
Minimum needed sample amount
Linearity/proportionality
Limits of detection/quantification
Sensitivity (counting efficiency) as a function of size

The NanoDefine Methods Manual. Part 2: Evaluation of methods
17
Trueness Indicate the trueness of this measurement
technique in measuring the particle size
Trueness in weighting the size fractions Specify the trueness in weighting the size fractions of this measurement technique
Robustness Specify the robustness of this measurement
technique
Precision Specify the precision of the measurement
technique
Resolution Specify the resolution of this measurement
technique
Size distribution Is it possible to measure size distribution?
Selectivity
Discrimination between NPs and non-NPs of the same chemical composition
Discrimination between NPs and non-NPs of another chemical composition
Discrimination from NPs of another chemical composition
Impurities
Identifies state of aggregation Does the measurement technique reveal
whether the measured particles are aggregated or agglomerated?
Measurement of individual particles Does this measurement technique characterise individual particles?
Counting constituent particles in aggregations
Is the measurement technique able to characterise single constituent particles in
aggregates?
Chemical composition Does this measurement technique analyse
chemical composition?
Specification of the type of size (diameter)
Specify: for example hydrodynamic…
Destructive measurement technique or not
Is it a destructive measurement technique?
Other Specificity
Vacuum Does the measurement technique operate
under vacuum?
Sample support Does this measurement technique need
preparation on suitable supports?
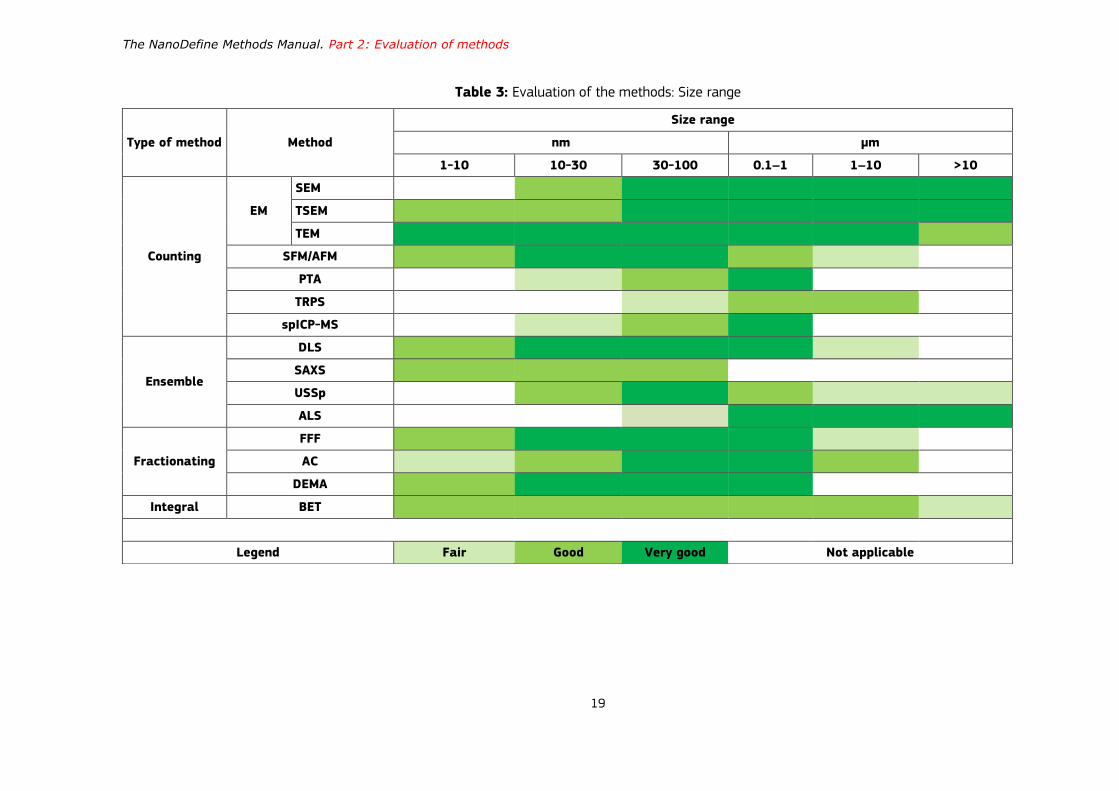
2.3 Evaluation and performance of the techniques: overview
A general overview of the recommended particle size measurement techniques described in this chapter is
shown in Table 3 to Table 6. The criteria selected are of two representative natures: direct relation to the
EC NM Definition and analytical one. For the sake of clarity, only the scores ‘fair’, ‘good’ and ‘very good’
were highlighted in the tables. Please note that these tables only aim to give a general overview of the
recommended methods and for selecting an appropriate method the detailed performance tables given in
chapters 3, 5, 4 and 6 in this report should be used.

The NanoDefine Methods Manual. Part 2: Evaluation of methods
18
The overview tables include the measurement technique scanning electron microscopy working in
transmission mode (TSEM), which does not have a detailed performance table associated. TSEM is
mentioned in the EM section.
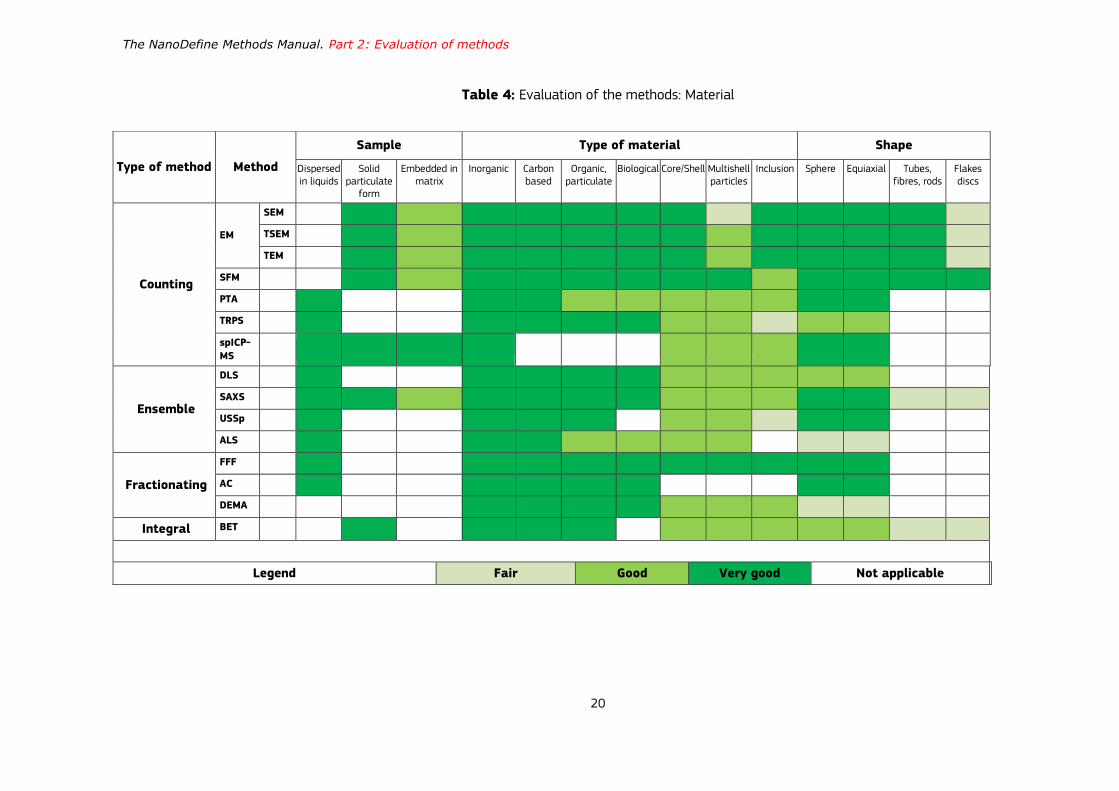
Table 3 provides an overview of the performance of the measurement techniques with regard to
measuring size. Table 4 gives an overview and an evaluation of the measurement techniques' capacities
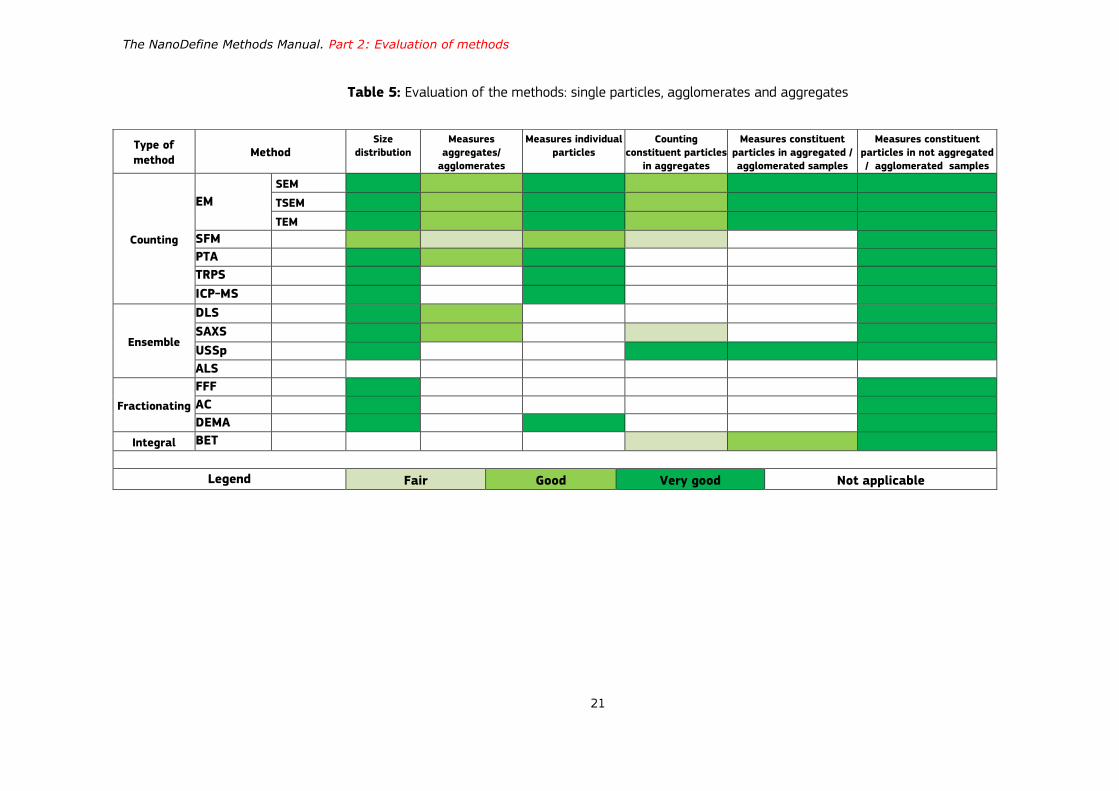
when measuring different types of materials. The overview in Table 5 is for the evaluation of the
measurement techniques with regard to their capacities for measuring single particles, agglomerates and
aggregates in the samples. Table 6 collects an overview of how the measurement techniques perform
with regard to "Additional information", i.e. if it is a direct counting technique, how easily the result of the
measurement is convertible to the number-weighted PSD (including quantitative and size accuracy), how
well the technique can measure the smallest dimension of each particle, and if it gives access to
measuring constituent particles, the chemical selectivity of the method, if it can measure the material as
it is and availability of ISO standards.
The NanoDefine Methods Manual. Part 2: Evaluation of methods
19
Table 3: Evaluation of the methods: Size range
Type of method Method
Size range
nm µm
1-10 10-30 30-100 0.1–1 1–10 >10
Counting
EM
SEM
TSEM
TEM
SFM/AFM
PTA
TRPS
spICP-MS
Ensemble
DLS
SAXS
USSp
ALS
Fractionating
FFF
AC
DEMA
Integral BET
Legend Fair Good Very good Not applicable
The NanoDefine Methods Manual. Part 2: Evaluation of methods
20
Table 4: Evaluation of the methods: Material
Type of method Method
Sample Type of material Shape
Dispersed in liquids
Solid particulate
form
Embedded in matrix
Inorganic Carbon based
Organic, particulate
Biological Core/Shell Multishell particles
Inclusion Sphere Equiaxial Tubes, fibres, rods
Flakes discs
Counting
EM
SEM
TSEM
TEM
SFM
PTA
TRPS
spICP-
MS
Ensemble
DLS
SAXS
USSp
ALS
Fractionating
FFF
AC
DEMA
Integral BET
Legend Fair Good Very good Not applicable
The NanoDefine Methods Manual. Part 2: Evaluation of methods
21
Table 5: Evaluation of the methods: single particles, agglomerates and aggregates
Type of
method Method
Size
distribution
Measures
aggregates/
agglomerates
Measures individual
particles
Counting
constituent particles
in aggregates
Measures constituent
particles in aggregated /
agglomerated samples
Measures constituent
particles in not aggregated
/ agglomerated samples
Counting
EM
SEM
TSEM
TEM
SFM
PTA
TRPS
ICP-MS
Ensemble
DLS
SAXS
USSp
ALS
Fractionating
FFF
AC
DEMA
Integral BET
Legend Fair Good Very good Not applicable

The NanoDefine Methods Manual. Part 2: Evaluation of methods
22
Table 6: Evaluation of the methods: additional information
Type of
method Method
Direct
counting
technique
Access to the smallest
dimension of each
particle
Measurement of the
material as it is
ISO standards
available Size Accuracy
Chemical
selectivity
Access to constituent
particles?
Counting
EM
SEM (+EDX)
TSEM (+EDX)
TEM (+EDX)
SFM
PTA
TRPS
spICP-MS
Ensemble
DLS
SAXS
USSp
ALS
Fractionating
FFF (+Detector)
AC
DEMA
Integral BET
Legend Fair Good Very good Not applicable
The NanoDefine Methods Manual. Part 2: Evaluation of methods
23
3 Counting methods
3.1 Electron microscopy
3.1.1 Measurement principle
One analytical method widely used for sample visualization down to the nm scale is electron
microscopy (EM), which uses an electron beam for visualization.
The preparation of the nanoparticle sample to be investigated by EM is key to successful analysis of
the particle size distribution. Ideally, particles, which are well separated, free of preparation
artefacts, and are distributed on the proper support not too far away from each other, shall be
accurately imaged. Care must be taken of possible beam or vacuum influence on the size of NPs.
Once such an accurate image is taken, the post-measurement of the particle size can be performed
with appropriate software packages. Decisive steps in the evaluation of the accurate particle size
determined with an electron microscope are the calibration of the image magnification, i.e. of the
pixel size including its re-calibration in the processing software, and the setting of the threshold in
the image histogram corresponding to the real position of the particle boundaries.
Size analysis with EM relies on counting individual particles. Depending on the number of particles
acquired in an image, most often several images are necessary to achieve good counting statistics.
The automation tools such as motorized stage and sequential image acquisition should be available
in order to speed up the whole measurement process. Also automatic image processing of batch
images speeds up the determination of the size distribution.
In scanning electron microscopy (SEM), images are constructed based on electrons coming from the
sample surface14. In case of transmission electron microscopy (TEM), images are constructed based
on electrons passing through the sample. Both SEM and TEM give 2-dimensional projections of 3-
dimensional particles. EM images facilitate the determination of number-weighted size distributions
by analysing each identifiable particle individually14. EM also allows an assessment of the
morphology of particles. The analysis of flattened particles (e.g. disks, flakes) could be problematic
because the smallest axis of the particle could be hidden. This could lead to a measured size that is
overestimated compared to the size relevant for the EC NM Definition. Most EM measurements are
performed in high vacuum chambers. Therefore, the use of EM is limited to the analysis of particles
which are not sensitive to the combined action of high vacuum and electron beams.
In SEM, the sample to be examined is bombarded with a finely (i.e. in nm range) focused electron
beam which is scanned over a defined field. Low-energy secondary electrons are released after
inelastic collisions with the atoms in the specimen, and high-energy backscattered electrons after
elastic collisions with the atoms in the specimen. Depending on their kinetic energy, the information
range carried by the released electrons varies from micrometre (typical for backscattered electrons)
down to nanometre (typical for secondary electrons). Hence, the secondary electrons are suited for
high-resolution morphological characterization of the specimen surface at nanometre scale and
even individual nanoparticles may be visualized and lateral dimensions measured with SEM.
Depending on the instrument used, but also strongly on the challenging sample preparation onto
typical sample substrates/holders, accurate size characterization of nanoparticles is possible with
sizes down to about 7 nm13.
Whereas in the case of an SEM typical beam voltages up to 30 kV may be applied and secondary
electrons/ backscattered electrons are collected by various detectors, in the case of TEM the beam
voltage is up to 300 kV. The samples to be analysed must be in the range of the electron

The NanoDefine Methods Manual. Part 2: Evaluation of methods
24
transparency so that the electrons transmitted through the thin sample can be collected. The highly
energetic electron beam is even finer than in the SEM case (more sophisticated aberration
correctors being often also available), so that spatial resolution well below 1 nm can be attained.
TEM has similar requirements as SEM for NPs regarding sample preparation, suitable substrate
(typically the so-called TEM grids), vacuum suitability15, calibration of the pixel size and automation
of both acquisition and image processing. By combining TEM imaging and semi-automatic image
analysis accurate characterization of the size, shape, and surface morphology of colloidal
nanomaterials,16 aggregated nanomaterials17,18, and primary particles in aggregates (or, in terms of
the EC NM Definition, constituent particles)19 is enabled. A characterization methodology which
includes a systematic selection procedure for unbiased random image collection, semi-automatic
image analysis and data processing has been validated for size, shape and surface morphology
measurements of silica nanoparticles. The expanded uncertainty of size measurements of two
colloidal silica certified reference materials was estimated to be about 3 %.
TEM can be operated in the scanning mode, i.e. STEM, when the electron beam is focused into a
narrow spot which is scanned over the sample. According to the range of angles by which they are
scattered in the sample, the transmitted electrons can be differentiated as: bright-field electrons
are those electrons slightly or not at all scattered and dark-field electrons are those collected
concentrically to the optical microscope axis. The so-called HAADF-STEM (High-Angle Annular Dark-
Field STEM) imaging mode results when only the strongly scattered electrons are collected with an
annular dark-field detector. The contrast of this type of imaging with atomic resolution is directly
related to the atomic number of the elements constituting the sample (Z-contrast image).
One hybrid type of electron microscopy is constituted by the SEM able to work in the transmission
mode, i.e. TSEM, T-SEM or STEM in SEM etc. This means that by using TEM grids as support for NPs,
the transmitted electrons (of lower energies than in the TEM case) are more or less absorbed by the
NPs and a so-called STEM detector placed under the sample holder detects them. The alternative is
to use a dedicated transmission sample holder, which enables performing TSEM with the available
secondary electrons/backscattered electrons detector without the need to use an additional STEM
detector. It was recently demonstrated that both types of transmission modes with SEM are well
suited for metrological measurement of NP size and size distribution down to about 10 nm20, 21, 22.
3.1.2 Performance
Current limitations in application include:
Strong dependency on sample preparation (incl. suitable substrate)
Possibility to use vacuum for certain types of material (organic, coated etc.)
SEM is not able to measure accurately the size of NPs below about 7 nm (depending on instrument)
Automation (batch image acquisition and batch image processing)
Time-consumption that depends on the complexity of sample preparation and degree of automation
High cost, but still in the same order of magnitude as e.g. ICP-MS
Accuracy in identification of the NPs in the image processing software
The size resolution of EM is good with the following analytical lower limits:
SEM minimal NP size to be measured accurately: about 7 nm depending on the instrument employed.
The NanoDefine Methods Manual. Part 2: Evaluation of methods
25
TEM minimal NP size to be measured accurately: below 1 nm depending on the applied contrast and on the instrument employed.
TSEM minimal NP size to be measured accurately: about 10 nm depending on the instrument employed.
Systematic results of metrological measurement of NP size and size distribution by SEM, TEM and
TSEM were carried out recently in the frame of various, specifically dedicated round robin tests11.
According to these reported results, EM provides traceable results, which are also consistent, i.e.
comparable, with those obtained by AFM, SAXS and SMPS, but not with DLS.
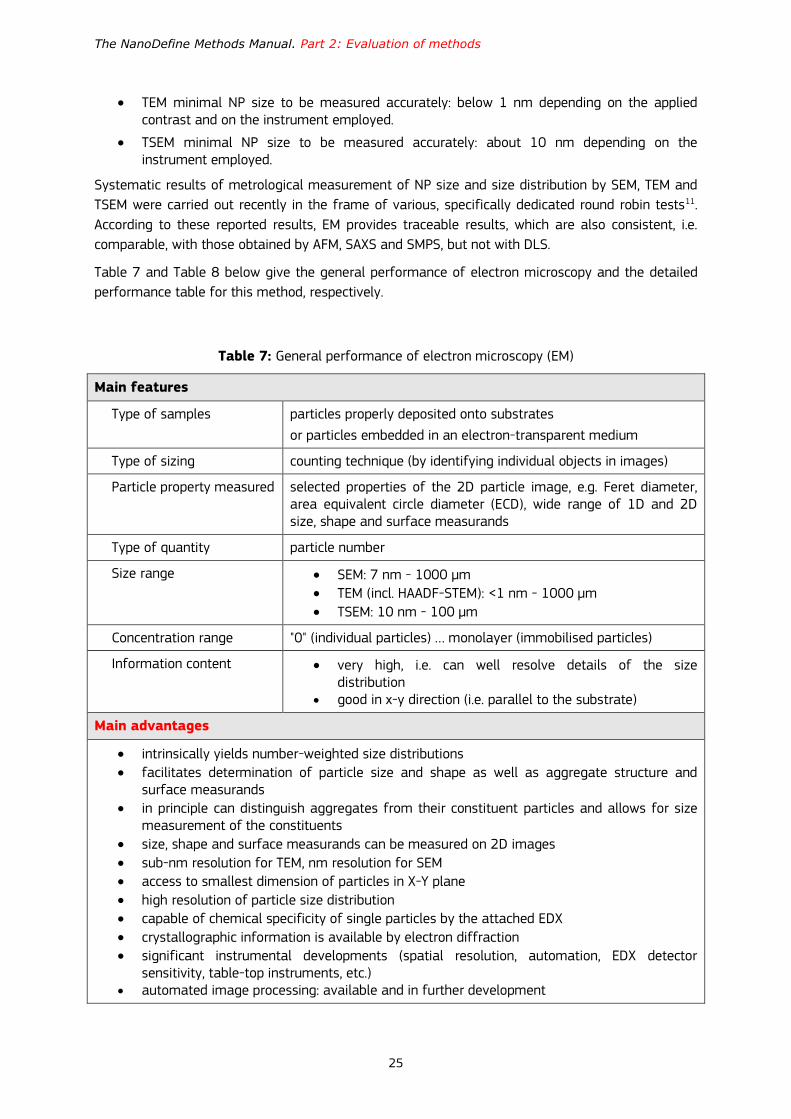
Table 7 and Table 8 below give the general performance of electron microscopy and the detailed
performance table for this method, respectively.
Table 7: General performance of electron microscopy (EM)
Main features
Type of samples particles properly deposited onto substrates
or particles embedded in an electron-transparent medium
Type of sizing counting technique (by identifying individual objects in images)
Particle property measured selected properties of the 2D particle image, e.g. Feret diameter, area equivalent circle diameter (ECD), wide range of 1D and 2D size, shape and surface measurands
Type of quantity particle number
Size range SEM: 7 nm - 1000 µm
TEM (incl. HAADF-STEM): <1 nm - 1000 µm
TSEM: 10 nm - 100 µm
Concentration range "0" (individual particles) … monolayer (immobilised particles)
Information content very high, i.e. can well resolve details of the size distribution
good in x-y direction (i.e. parallel to the substrate)
Main advantages
intrinsically yields number-weighted size distributions
facilitates determination of particle size and shape as well as aggregate structure and surface measurands
in principle can distinguish aggregates from their constituent particles and allows for size measurement of the constituents
size, shape and surface measurands can be measured on 2D images
sub-nm resolution for TEM, nm resolution for SEM
access to smallest dimension of particles in X-Y plane
high resolution of particle size distribution
capable of chemical specificity of single particles by the attached EDX
crystallographic information is available by electron diffraction
significant instrumental developments (spatial resolution, automation, EDX detector sensitivity, table-top instruments, etc.)
automated image processing: available and in further development

The NanoDefine Methods Manual. Part 2: Evaluation of methods
26
Main disadvantages
strongly dependent on sample preparation (immobilised particles on substrate need to be representative for the material)
needs vacuum and expensive instrumentation
limited dynamic range (highest size/lowest size < 40) based on one image only
Table 8: Technical characteristics for electron microscopy (EM)
Colour code: material-related technical characteristics and metrological aspects of the technique
Criteria (general) Criteria (more specific)
Characte
risation
(Yes/No)
Notes
Nanoparticles in powder or liquid suspensions or embedded in a
matrix
Dispersed in liquids
No Possible if a cryo-stage is available23
Yes successful deposition on substrates required
Solid particulate form Yes
Dispersed or embedded in matrices
Yes Only at the surface, in thin films or in ultramicrotomed sections
Dispersibility by dispersion protocols
Dispersible in aqueous media No
Yes successful deposition on substrates required
Dispersible in non-polar liquids No
Dispersible in polar liquids other than water
No
Dispersible in material-specific media
No
Can be aerosolized No
Substance Nature
Inorganic Yes
Size-dependent absorption / fluorescence
Yes
Carbon based Yes
Organic, particulate Yes
Organic, non-particulate Yes
Biological Yes
Composite particles Yes
Other Yes

The NanoDefine Methods Manual. Part 2: Evaluation of methods
27
Composite particles (see Section 2.2.1.3)
Core/shell Yes Can detect the internal
structure in some cases
Multishell particles Yes Difficult
Particles with inclusions Yes Only outer size. Can detect
the internal structure in some cases
Number of nanoscaled dimensions
1 (e.g. thickness of nanoplates)
No
( Yes)
Typically
For specialised solutions (EELS, EFTEM)
2 (e.g. diameter of nanofibres) Yes
3 Yes Measurement of Z (height) is
difficult in SEM’. In TEM it is possible (not routine)
Shape of particles
Sphere or similar Yes
Equiaxial Yes
Tubes, fibres, rods (length: diameter ≥ 3)
Yes
Flakes and discs (thickness: lateral extension ≤ 0.25)
No
( Yes)
Typically for specialised solutions (EELS, EFTEM)
Other
No
( Yes)
Typically for specialised solutions (EELS, EFTEM)
Thermal degradation
sensitivity (of test material)
(Must be compatible with Measurement Technique working range: 15-25 °C)
Above 0 °C No Yes, with cryo stage
Sensitive above 25 °C Yes
Sensitive above 37 °C Yes
Sensitive above 50 °C Yes
Sensitive above 100 °C Yes
Sensitive above 150 °C Yes
Sensitive above 500 °C Yes
Sensitive above 1000 °C Yes
Cooling degradation sensitivity (of test
material)
(Must be compatible with Measurement Technique working range: 15-25 °C)
Sensitive below 25 °C Yes
Sensitive below 0 °C Yes
Sensitive below -18 °C Yes
Sensitive below -35 °C Yes
Sensitive below -78 °C Yes
Sensitive below -195 °C Yes
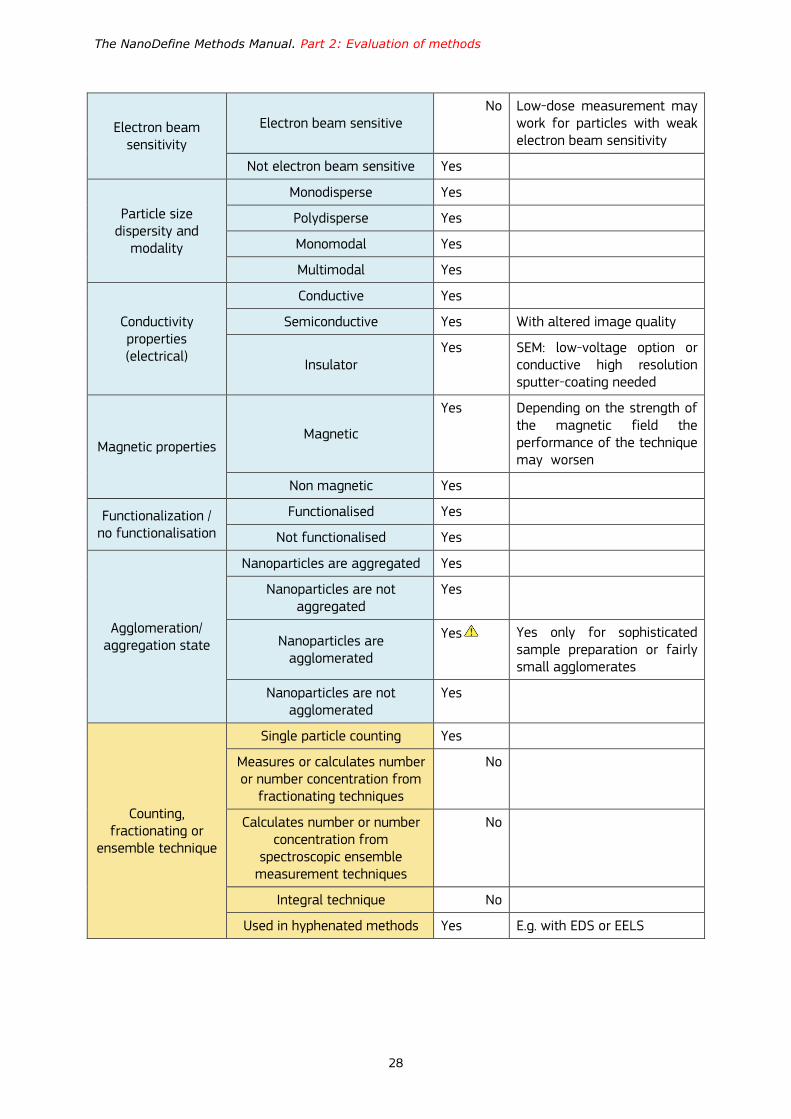
The NanoDefine Methods Manual. Part 2: Evaluation of methods
28
Electron beam sensitivity
Electron beam sensitive No Low-dose measurement may
work for particles with weak electron beam sensitivity
Not electron beam sensitive Yes
Particle size dispersity and
modality
Monodisperse Yes
Polydisperse Yes
Monomodal Yes
Multimodal Yes
Conductivity properties (electrical)
Conductive Yes
Semiconductive Yes With altered image quality
Insulator Yes SEM: low-voltage option or
conductive high resolution sputter-coating needed
Magnetic properties Magnetic
Yes Depending on the strength of the magnetic field the performance of the technique may worsen
Non magnetic Yes
Functionalization / no functionalisation
Functionalised Yes
Not functionalised Yes
Agglomeration/ aggregation state
Nanoparticles are aggregated Yes
Nanoparticles are not aggregated
Yes
Nanoparticles are agglomerated
Yes Yes only for sophisticated sample preparation or fairly small agglomerates
Nanoparticles are not agglomerated
Yes
Counting, fractionating or
ensemble technique
Single particle counting Yes
Measures or calculates number or number concentration from
fractionating techniques
No
Calculates number or number concentration from
spectroscopic ensemble measurement techniques
No
Integral technique No
Used in hyphenated methods Yes E.g. with EDS or EELS
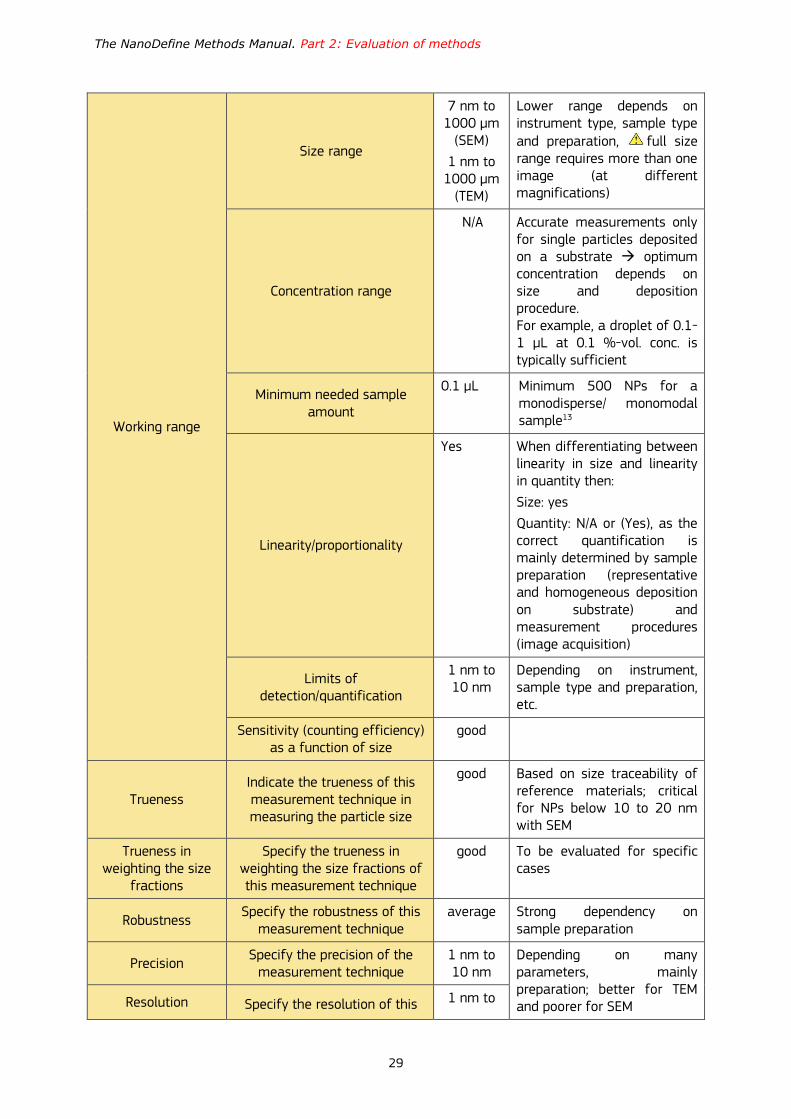
The NanoDefine Methods Manual. Part 2: Evaluation of methods
29
Working range
Size range
7 nm to 1000 µm
(SEM)
1 nm to 1000 µm
(TEM)
Lower range depends on instrument type, sample type and preparation, full size range requires more than one image (at different magnifications)
Concentration range
N/A Accurate measurements only for single particles deposited on a substrate optimum concentration depends on size and deposition procedure. For example, a droplet of 0.1-1 µL at 0.1 %-vol. conc. is typically sufficient
Minimum needed sample amount
0.1 µL Minimum 500 NPs for a monodisperse/ monomodal sample13
Linearity/proportionality
Yes When differentiating between linearity in size and linearity in quantity then:
Size: yes
Quantity: N/A or (Yes), as the correct quantification is mainly determined by sample preparation (representative and homogeneous deposition on substrate) and measurement procedures (image acquisition)
Limits of detection/quantification
1 nm to 10 nm
Depending on instrument, sample type and preparation, etc.
Sensitivity (counting efficiency) as a function of size
good
Trueness Indicate the trueness of this measurement technique in measuring the particle size
good Based on size traceability of reference materials; critical for NPs below 10 to 20 nm with SEM
Trueness in weighting the size
fractions
Specify the trueness in weighting the size fractions of this measurement technique
good To be evaluated for specific cases
Robustness Specify the robustness of this
measurement technique average Strong dependency on
sample preparation
Precision Specify the precision of the
measurement technique 1 nm to 10 nm
Depending on many parameters, mainly preparation; better for TEM and poorer for SEM Resolution Specify the resolution of this 1 nm to
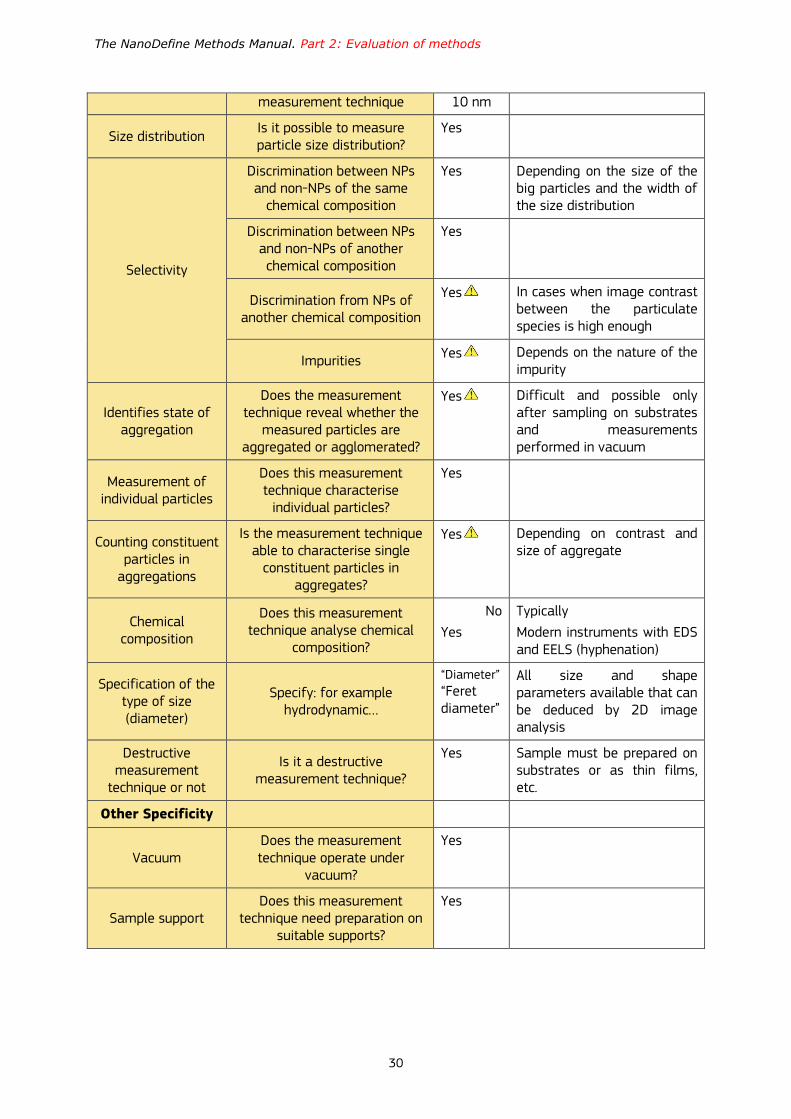
The NanoDefine Methods Manual. Part 2: Evaluation of methods
30
measurement technique 10 nm
Size distribution Is it possible to measure particle size distribution?
Yes
Selectivity
Discrimination between NPs and non-NPs of the same
chemical composition
Yes Depending on the size of the big particles and the width of the size distribution
Discrimination between NPs and non-NPs of another chemical composition
Yes
Discrimination from NPs of another chemical composition
Yes In cases when image contrast between the particulate species is high enough
Impurities Yes Depends on the nature of the
impurity
Identifies state of aggregation
Does the measurement technique reveal whether the
measured particles are aggregated or agglomerated?
Yes Difficult and possible only after sampling on substrates and measurements performed in vacuum
Measurement of individual particles
Does this measurement technique characterise
individual particles?
Yes
Counting constituent particles in
aggregations
Is the measurement technique able to characterise single
constituent particles in aggregates?
Yes Depending on contrast and size of aggregate
Chemical composition
Does this measurement technique analyse chemical
composition?
No
Yes
Typically
Modern instruments with EDS and EELS (hyphenation)
Specification of the type of size (diameter)
Specify: for example hydrodynamic…
“Diameter” “Feret diameter”
All size and shape parameters available that can be deduced by 2D image analysis
Destructive measurement
technique or not
Is it a destructive measurement technique?
Yes Sample must be prepared on substrates or as thin films, etc.
Other Specificity
Vacuum Does the measurement technique operate under
vacuum?
Yes
Sample support Does this measurement
technique need preparation on suitable supports?
Yes
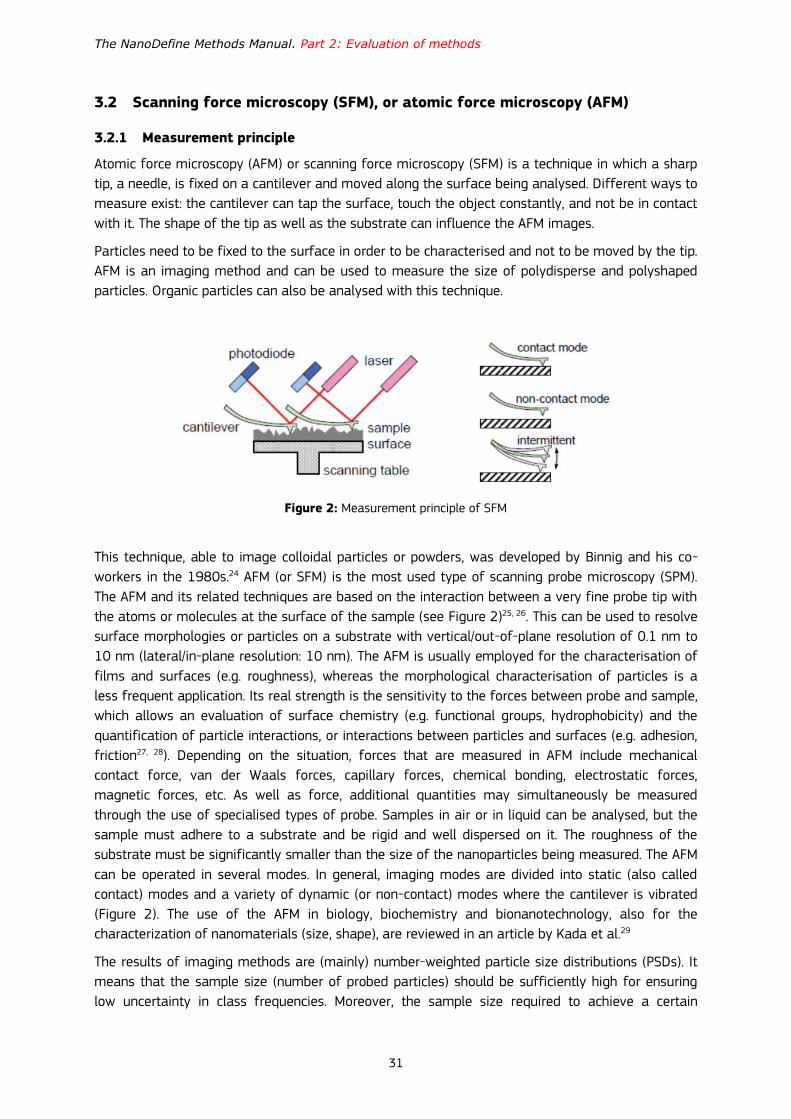
The NanoDefine Methods Manual. Part 2: Evaluation of methods
31
3.2 Scanning force microscopy (SFM), or atomic force microscopy (AFM)
3.2.1 Measurement principle
Atomic force microscopy (AFM) or scanning force microscopy (SFM) is a technique in which a sharp
tip, a needle, is fixed on a cantilever and moved along the surface being analysed. Different ways to
measure exist: the cantilever can tap the surface, touch the object constantly, and not be in contact
with it. The shape of the tip as well as the substrate can influence the AFM images.
Particles need to be fixed to the surface in order to be characterised and not to be moved by the tip.
AFM is an imaging method and can be used to measure the size of polydisperse and polyshaped
particles. Organic particles can also be analysed with this technique.
Figure 2: Measurement principle of SFM
This technique, able to image colloidal particles or powders, was developed by Binnig and his co-
workers in the 1980s.24 AFM (or SFM) is the most used type of scanning probe microscopy (SPM).
The AFM and its related techniques are based on the interaction between a very fine probe tip with
the atoms or molecules at the surface of the sample (see Figure 2)25, 26. This can be used to resolve
surface morphologies or particles on a substrate with vertical/out-of-plane resolution of 0.1 nm to
10 nm (lateral/in-plane resolution: 10 nm). The AFM is usually employed for the characterisation of
films and surfaces (e.g. roughness), whereas the morphological characterisation of particles is a
less frequent application. Its real strength is the sensitivity to the forces between probe and sample,
which allows an evaluation of surface chemistry (e.g. functional groups, hydrophobicity) and the
quantification of particle interactions, or interactions between particles and surfaces (e.g. adhesion,
friction27, 28). Depending on the situation, forces that are measured in AFM include mechanical
contact force, van der Waals forces, capillary forces, chemical bonding, electrostatic forces,
magnetic forces, etc. As well as force, additional quantities may simultaneously be measured
through the use of specialised types of probe. Samples in air or in liquid can be analysed, but the
sample must adhere to a substrate and be rigid and well dispersed on it. The roughness of the
substrate must be significantly smaller than the size of the nanoparticles being measured. The AFM
can be operated in several modes. In general, imaging modes are divided into static (also called
contact) modes and a variety of dynamic (or non-contact) modes where the cantilever is vibrated
(Figure 2). The use of the AFM in biology, biochemistry and bionanotechnology, also for the
characterization of nanomaterials (size, shape), are reviewed in an article by Kada et al.29
The results of imaging methods are (mainly) number-weighted particle size distributions (PSDs). It
means that the sample size (number of probed particles) should be sufficiently high for ensuring
low uncertainty in class frequencies. Moreover, the sample size required to achieve a certain
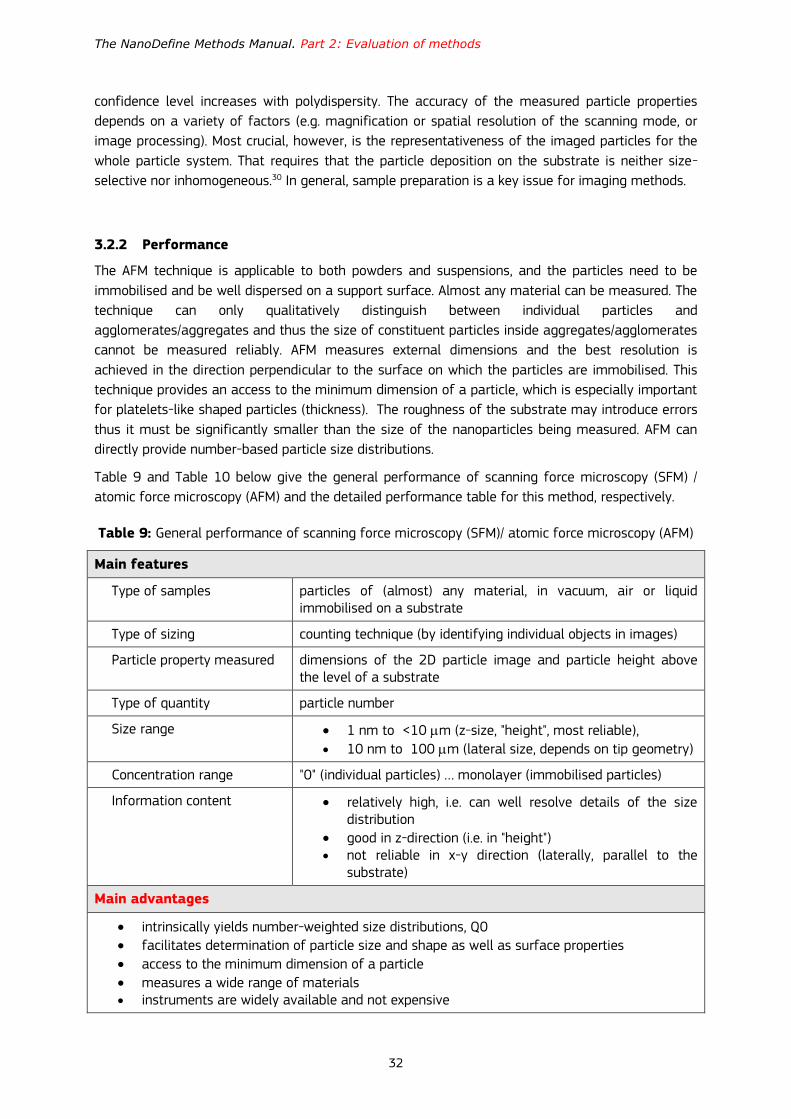
The NanoDefine Methods Manual. Part 2: Evaluation of methods
32
confidence level increases with polydispersity. The accuracy of the measured particle properties
depends on a variety of factors (e.g. magnification or spatial resolution of the scanning mode, or
image processing). Most crucial, however, is the representativeness of the imaged particles for the
whole particle system. That requires that the particle deposition on the substrate is neither size-
selective nor inhomogeneous.30 In general, sample preparation is a key issue for imaging methods.
3.2.2 Performance
The AFM technique is applicable to both powders and suspensions, and the particles need to be
immobilised and be well dispersed on a support surface. Almost any material can be measured. The
technique can only qualitatively distinguish between individual particles and
agglomerates/aggregates and thus the size of constituent particles inside aggregates/agglomerates
cannot be measured reliably. AFM measures external dimensions and the best resolution is
achieved in the direction perpendicular to the surface on which the particles are immobilised. This
technique provides an access to the minimum dimension of a particle, which is especially important
for platelets-like shaped particles (thickness). The roughness of the substrate may introduce errors
thus it must be significantly smaller than the size of the nanoparticles being measured. AFM can
directly provide number-based particle size distributions.
Table 9 and Table 10 below give the general performance of scanning force microscopy (SFM) /
atomic force microscopy (AFM) and the detailed performance table for this method, respectively.
Table 9: General performance of scanning force microscopy (SFM)/ atomic force microscopy (AFM)
Main features
Type of samples particles of (almost) any material, in vacuum, air or liquid immobilised on a substrate
Type of sizing counting technique (by identifying individual objects in images)
Particle property measured dimensions of the 2D particle image and particle height above the level of a substrate
Type of quantity particle number
Size range 1 nm to <10 m (z-size, "height", most reliable),
10 nm to 100 m (lateral size, depends on tip geometry)
Concentration range "0" (individual particles) … monolayer (immobilised particles)
Information content relatively high, i.e. can well resolve details of the size distribution
good in z-direction (i.e. in "height") not reliable in x-y direction (laterally, parallel to the
substrate)
Main advantages
intrinsically yields number-weighted size distributions, Q0
facilitates determination of particle size and shape as well as surface properties
access to the minimum dimension of a particle
measures a wide range of materials instruments are widely available and not expensive

The NanoDefine Methods Manual. Part 2: Evaluation of methods
33
Main disadvantages
strongly dependent on sample preparation (immobilised particles on substrate need to be representative for the material)
lateral size measurements are less reliable than altitude measurements (dependent on tip conditions)
low sample throughput, slow limited dynamic range
Table 10: Technical characteristics for scanning force microscopy (SFM) / atomic force microscopy (AFM)
Colour code: material-related technical characteristics and metrological aspects of the technique
Criteria (general) Criteria (more specific)
Characte
risation
(Yes/No)
Notes
Nanoparticles in powder or liquid suspensions or embedded in a
matrix
Dispersed in liquids No Yes after successful
immobilization on substrates
Solid particulate form Yes
After successful immobilization on substrates, generally from a liquid dispersion
Dispersed or embedded in different kinds of matrices
Yes
Only at the surface or in thin films or in ultramicrotomed sections, as long as the surface is smooth enough with respect to the particle size and there is enough contrast with the matrix; possible bias due to random sectioning at non-controlled distance from the diameter plane (for spheres)
Dispersibility by dispersion protocols
Dispersible in aqueous media No
Yes after successful immobilization on substrates
Dispersible in non-polar liquids
No
Dispersible in polar liquids other than water
No
Dispersible in material-specific media
No
Can be aerosolized No
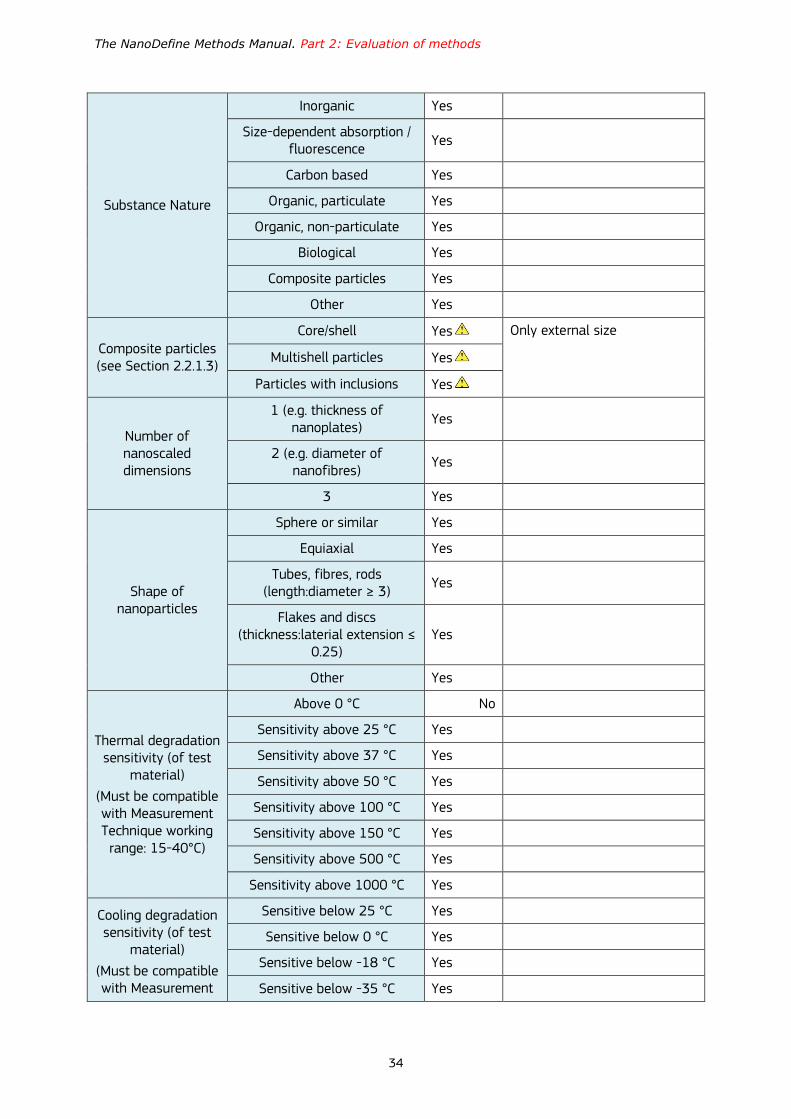
The NanoDefine Methods Manual. Part 2: Evaluation of methods
34
Substance Nature
Inorganic Yes
Size-dependent absorption / fluorescence
Yes
Carbon based Yes
Organic, particulate Yes
Organic, non-particulate Yes
Biological Yes
Composite particles Yes
Other Yes
Composite particles (see Section 2.2.1.3)
Core/shell Yes Only external size
Multishell particles Yes
Particles with inclusions Yes
Number of nanoscaled dimensions
1 (e.g. thickness of nanoplates)
Yes
2 (e.g. diameter of nanofibres)
Yes
3 Yes
Shape of nanoparticles
Sphere or similar Yes
Equiaxial Yes
Tubes, fibres, rods (length:diameter ≥ 3)
Yes
Flakes and discs (thickness:laterial extension ≤
0.25) Yes
Other Yes
Thermal degradation sensitivity (of test
material)
(Must be compatible with Measurement Technique working range: 15-40°C)
Above 0 °C No
Sensitivity above 25 °C Yes
Sensitivity above 37 °C Yes
Sensitivity above 50 °C Yes
Sensitivity above 100 °C Yes
Sensitivity above 150 °C Yes
Sensitivity above 500 °C Yes
Sensitivity above 1000 °C Yes
Cooling degradation sensitivity (of test
material)
(Must be compatible with Measurement
Sensitive below 25 °C Yes
Sensitive below 0 °C Yes
Sensitive below -18 °C Yes
Sensitive below -35 °C Yes

The NanoDefine Methods Manual. Part 2: Evaluation of methods
35
Technique working range: 15-40 °C)
Sensitive below -78 °C Yes
Sensitive below -195 °C Yes
Electron beam sensitivity
Electron beam sensitive Yes
Not electron beam sensitive Yes
Particle size dispersity and
modality
Monodisperse Yes
Polydisperse Yes
Monomodal Yes
Multimodal Yes
Conductivity properties (electrical)
Conductive Yes
Semiconductive Yes
Insulator Yes
Magnetic properties Magnetic Yes
Non magnetic Yes
Functionalization / no functionalisation
Functionalised Yes
Not functionalised Yes
Agglomeration/ aggregation state
Nanoparticles are aggregated Yes Only aggregate size, with limitations (size and roughness)
Nanoparticles are not aggregated
Yes
Nanoparticles are agglomerated
Yes Only for small agglomerates or sophisticated sample preparation
Nanoparticles are not agglomerated
Yes
Counting, fractionating or
ensemble technique
Single particle counting Yes
Measures or calculates number or number concentration from
fractionating techniques
No
Calculates number or number concentration from
spectroscopic ensemble techniques
No
Integral technique No
Used in hyphenated methods No
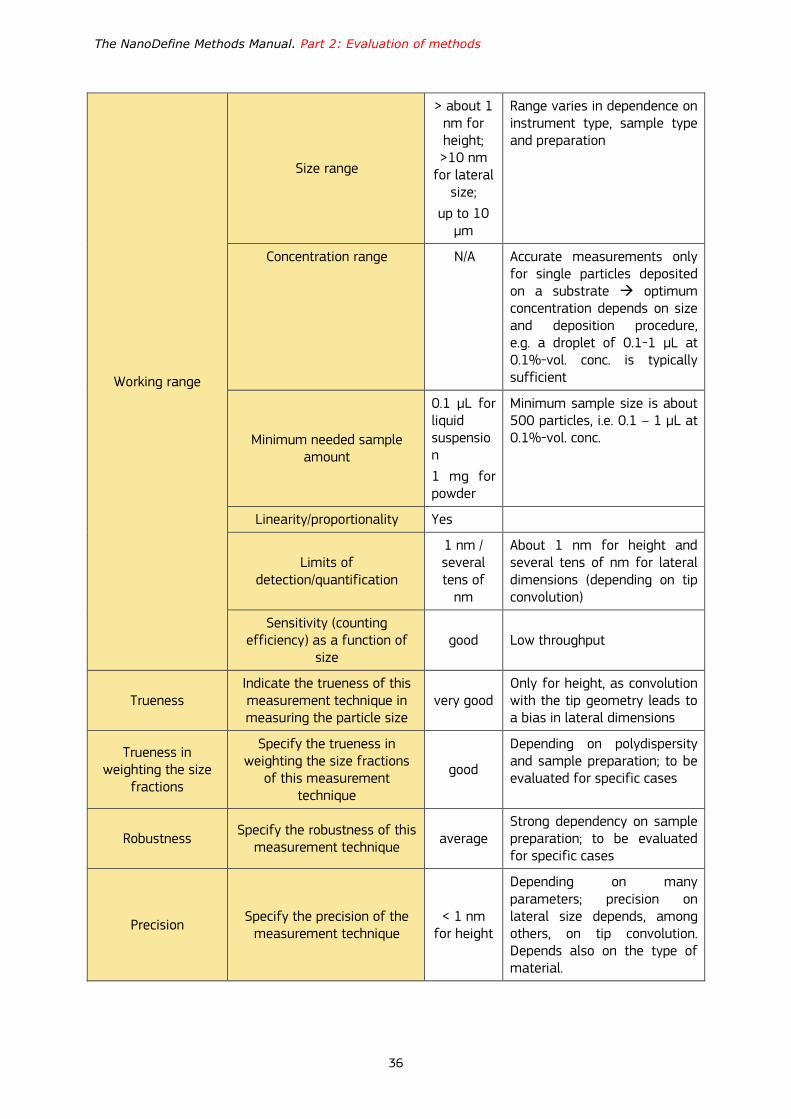
The NanoDefine Methods Manual. Part 2: Evaluation of methods
36
Working range
Size range
> about 1 nm for height; >10 nm
for lateral size;
up to 10 µm
Range varies in dependence on instrument type, sample type and preparation
Concentration range N/A Accurate measurements only for single particles deposited on a substrate optimum concentration depends on size and deposition procedure, e.g. a droplet of 0.1-1 µL at 0.1%-vol. conc. is typically sufficient
Minimum needed sample amount
0.1 µL for liquid suspension
1 mg for powder
Minimum sample size is about 500 particles, i.e. 0.1 – 1 µL at 0.1%-vol. conc.
Linearity/proportionality Yes
Limits of detection/quantification
1 nm / several tens of
nm
About 1 nm for height and several tens of nm for lateral dimensions (depending on tip convolution)
Sensitivity (counting efficiency) as a function of
size good Low throughput
Trueness Indicate the trueness of this measurement technique in measuring the particle size
very good Only for height, as convolution with the tip geometry leads to a bias in lateral dimensions
Trueness in weighting the size
fractions
Specify the trueness in weighting the size fractions
of this measurement technique
good
Depending on polydispersity and sample preparation; to be evaluated for specific cases
Robustness Specify the robustness of this
measurement technique average
Strong dependency on sample preparation; to be evaluated for specific cases
Precision Specify the precision of the
measurement technique < 1 nm
for height
Depending on many parameters; precision on lateral size depends, among others, on tip convolution. Depends also on the type of material.
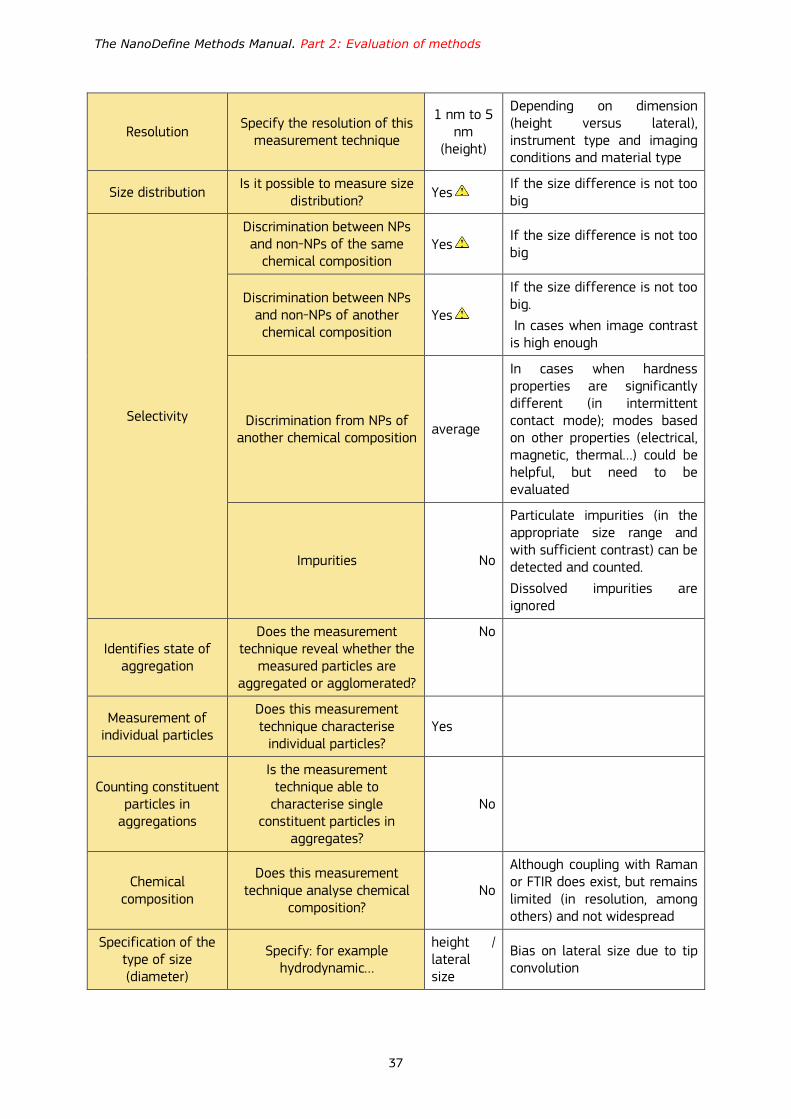
The NanoDefine Methods Manual. Part 2: Evaluation of methods
37
Resolution Specify the resolution of this
measurement technique
1 nm to 5 nm
(height)
Depending on dimension (height versus lateral), instrument type and imaging conditions and material type
Size distribution Is it possible to measure size
distribution? Yes
If the size difference is not too big
Selectivity
Discrimination between NPs and non-NPs of the same
chemical composition Yes
If the size difference is not too big
Discrimination between NPs and non-NPs of another chemical composition
Yes
If the size difference is not too big.
In cases when image contrast is high enough
Discrimination from NPs of another chemical composition
average
In cases when hardness properties are significantly different (in intermittent contact mode); modes based on other properties (electrical, magnetic, thermal…) could be helpful, but need to be evaluated
Impurities No
Particulate impurities (in the appropriate size range and with sufficient contrast) can be detected and counted.
Dissolved impurities are ignored
Identifies state of aggregation
Does the measurement technique reveal whether the
measured particles are aggregated or agglomerated?
No
Measurement of individual particles
Does this measurement technique characterise
individual particles? Yes
Counting constituent particles in
aggregations
Is the measurement technique able to
characterise single constituent particles in
aggregates?
No
Chemical composition
Does this measurement technique analyse chemical
composition? No
Although coupling with Raman or FTIR does exist, but remains limited (in resolution, among others) and not widespread
Specification of the type of size (diameter)
Specify: for example hydrodynamic…
height / lateral size
Bias on lateral size due to tip convolution
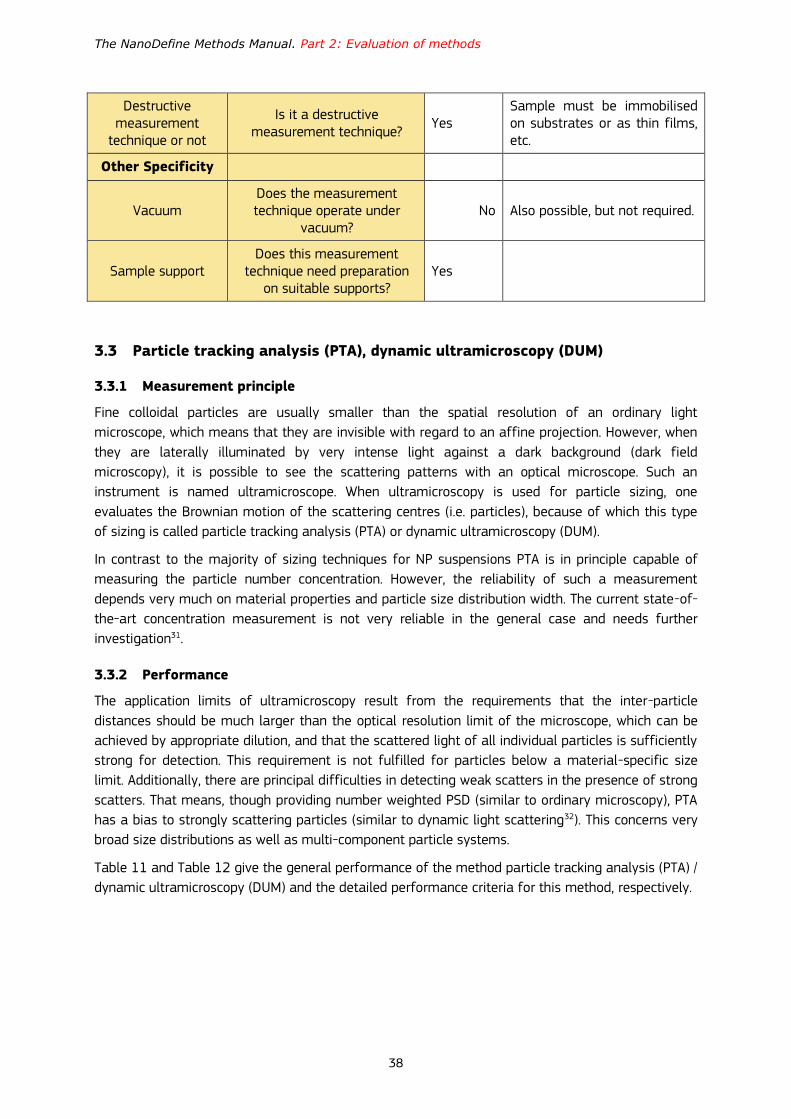
The NanoDefine Methods Manual. Part 2: Evaluation of methods
38
Destructive measurement
technique or not
Is it a destructive measurement technique?
Yes Sample must be immobilised on substrates or as thin films, etc.
Other Specificity
Vacuum Does the measurement technique operate under
vacuum? No Also possible, but not required.
Sample support Does this measurement
technique need preparation on suitable supports?
Yes
3.3 Particle tracking analysis (PTA), dynamic ultramicroscopy (DUM)
3.3.1 Measurement principle
Fine colloidal particles are usually smaller than the spatial resolution of an ordinary light
microscope, which means that they are invisible with regard to an affine projection. However, when
they are laterally illuminated by very intense light against a dark background (dark field
microscopy), it is possible to see the scattering patterns with an optical microscope. Such an
instrument is named ultramicroscope. When ultramicroscopy is used for particle sizing, one
evaluates the Brownian motion of the scattering centres (i.e. particles), because of which this type
of sizing is called particle tracking analysis (PTA) or dynamic ultramicroscopy (DUM).
In contrast to the majority of sizing techniques for NP suspensions PTA is in principle capable of
measuring the particle number concentration. However, the reliability of such a measurement
depends very much on material properties and particle size distribution width. The current state-of-
the-art concentration measurement is not very reliable in the general case and needs further
investigation31.
3.3.2 Performance
The application limits of ultramicroscopy result from the requirements that the inter-particle
distances should be much larger than the optical resolution limit of the microscope, which can be
achieved by appropriate dilution, and that the scattered light of all individual particles is sufficiently
strong for detection. This requirement is not fulfilled for particles below a material-specific size
limit. Additionally, there are principal difficulties in detecting weak scatters in the presence of strong
scatters. That means, though providing number weighted PSD (similar to ordinary microscopy), PTA
has a bias to strongly scattering particles (similar to dynamic light scattering32). This concerns very
broad size distributions as well as multi-component particle systems.
Table 11 and Table 12 give the general performance of the method particle tracking analysis (PTA) /
dynamic ultramicroscopy (DUM) and the detailed performance criteria for this method, respectively.
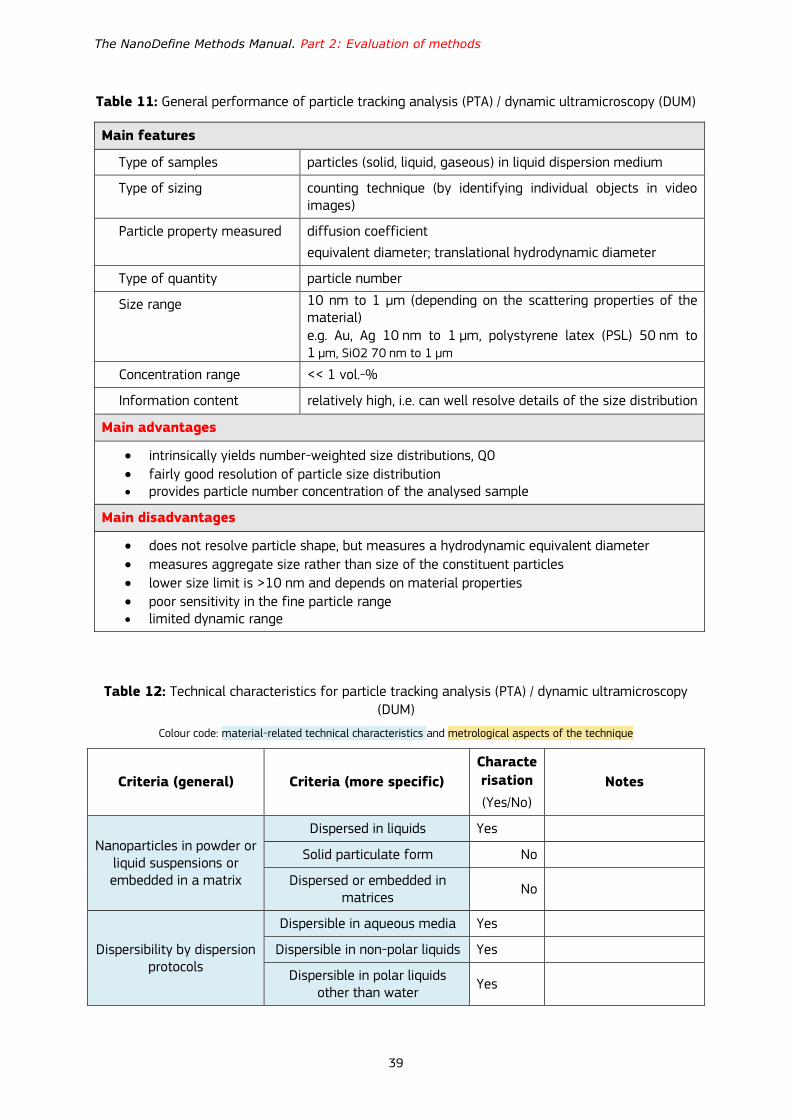
The NanoDefine Methods Manual. Part 2: Evaluation of methods
39
Table 11: General performance of particle tracking analysis (PTA) / dynamic ultramicroscopy (DUM)
Main features
Type of samples particles (solid, liquid, gaseous) in liquid dispersion medium
Type of sizing counting technique (by identifying individual objects in video images)
Particle property measured diffusion coefficient
equivalent diameter; translational hydrodynamic diameter
Type of quantity particle number
Size range 10 nm to 1 µm (depending on the scattering properties of the material) e.g. Au, Ag 10 nm to 1 µm, polystyrene latex (PSL) 50 nm to 1 µm, SiO2 70 nm to 1 µm
Concentration range << 1 vol.-%
Information content relatively high, i.e. can well resolve details of the size distribution
Main advantages
intrinsically yields number-weighted size distributions, Q0
fairly good resolution of particle size distribution provides particle number concentration of the analysed sample
Main disadvantages
does not resolve particle shape, but measures a hydrodynamic equivalent diameter
measures aggregate size rather than size of the constituent particles
lower size limit is >10 nm and depends on material properties
poor sensitivity in the fine particle range limited dynamic range
Table 12: Technical characteristics for particle tracking analysis (PTA) / dynamic ultramicroscopy (DUM)
Colour code: material-related technical characteristics and metrological aspects of the technique
Criteria (general) Criteria (more specific)
Characte
risation
(Yes/No)
Notes
Nanoparticles in powder or liquid suspensions or embedded in a matrix
Dispersed in liquids Yes
Solid particulate form No
Dispersed or embedded in matrices
No
Dispersibility by dispersion protocols
Dispersible in aqueous media Yes
Dispersible in non-polar liquids Yes
Dispersible in polar liquids other than water
Yes
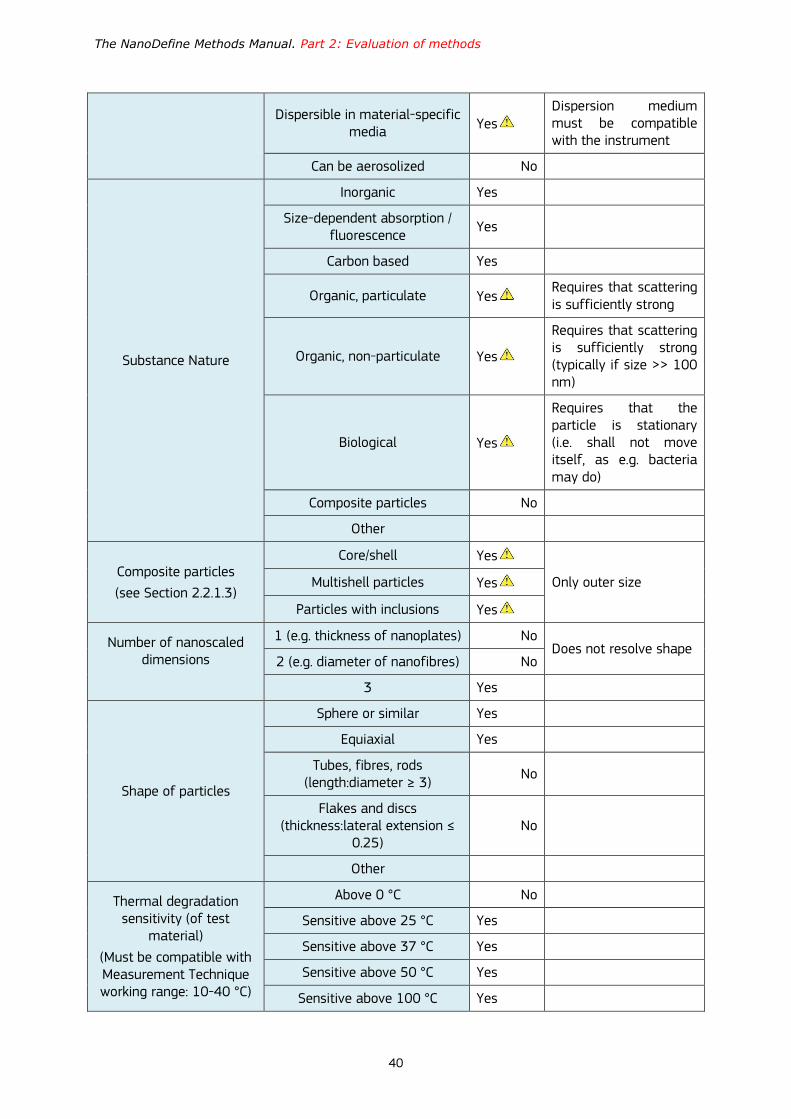
The NanoDefine Methods Manual. Part 2: Evaluation of methods
40
Dispersible in material-specific media
Yes Dispersion medium must be compatible with the instrument
Can be aerosolized No
Substance Nature
Inorganic Yes
Size-dependent absorption / fluorescence
Yes
Carbon based Yes
Organic, particulate Yes Requires that scattering is sufficiently strong
Organic, non-particulate Yes
Requires that scattering is sufficiently strong (typically if size >> 100 nm)
Biological Yes
Requires that the particle is stationary (i.e. shall not move itself, as e.g. bacteria may do)
Composite particles No
Other
Composite particles
(see Section 2.2.1.3)
Core/shell Yes
Only outer size Multishell particles Yes
Particles with inclusions Yes
Number of nanoscaled dimensions
1 (e.g. thickness of nanoplates) No Does not resolve shape
2 (e.g. diameter of nanofibres) No
3 Yes
Shape of particles
Sphere or similar Yes
Equiaxial Yes
Tubes, fibres, rods (length:diameter ≥ 3)
No
Flakes and discs (thickness:lateral extension ≤
0.25) No
Other
Thermal degradation sensitivity (of test
material)
(Must be compatible with Measurement Technique working range: 10-40 °C)
Above 0 °C No
Sensitive above 25 °C Yes
Sensitive above 37 °C Yes
Sensitive above 50 °C Yes
Sensitive above 100 °C Yes

The NanoDefine Methods Manual. Part 2: Evaluation of methods
41
Sensitive above 150 °C Yes
Sensitive above 500 °C Yes
Sensitive above 1000 °C Yes
Cooling degradation sensitivity (of test
material)
(Must be compatible with Measurement Technique working range: 10-40 °C)
Sensitive below 25 °C Yes
Sensitive below 0 °C Yes
Sensitive below -18 °C Yes
Sensitive below -35 °C Yes
Sensitive below -78 °C Yes
Sensitive below -195 °C Yes
Electron beam sensitivity Electron beam sensitive Yes
Not electron beam sensitive Yes
Particle size dispersity and modality
Monodisperse Yes
Polydisperse Yes Insensitive to fine NPs for very broad PSDs
Monomodal Yes
Multimodal Yes Insensitive to fine NPs for very broad PSDs
Conductivity properties (electrical)
Conductive Yes
Semiconductive Yes
Insulator Yes
Magnetic properties Magnetic Yes
Non magnetic Yes
Functionalization / no functionalisation
Functionalised Yes
Not functionalised Yes
Agglomeration/ aggregation state
Nanoparticles are aggregated Yes Measurement technique measures only aggregate size
Nanoparticles are not aggregated
Yes
Nanoparticles are agglomerated
Yes Measurement technique measures only agglomerate size
Nanoparticles are not agglomerated
Yes
Counting, fractionating or ensemble technique
Single particle counting Yes
Measures or calculates number or number concentration from
fractionating techniques No
Calculates number or number No
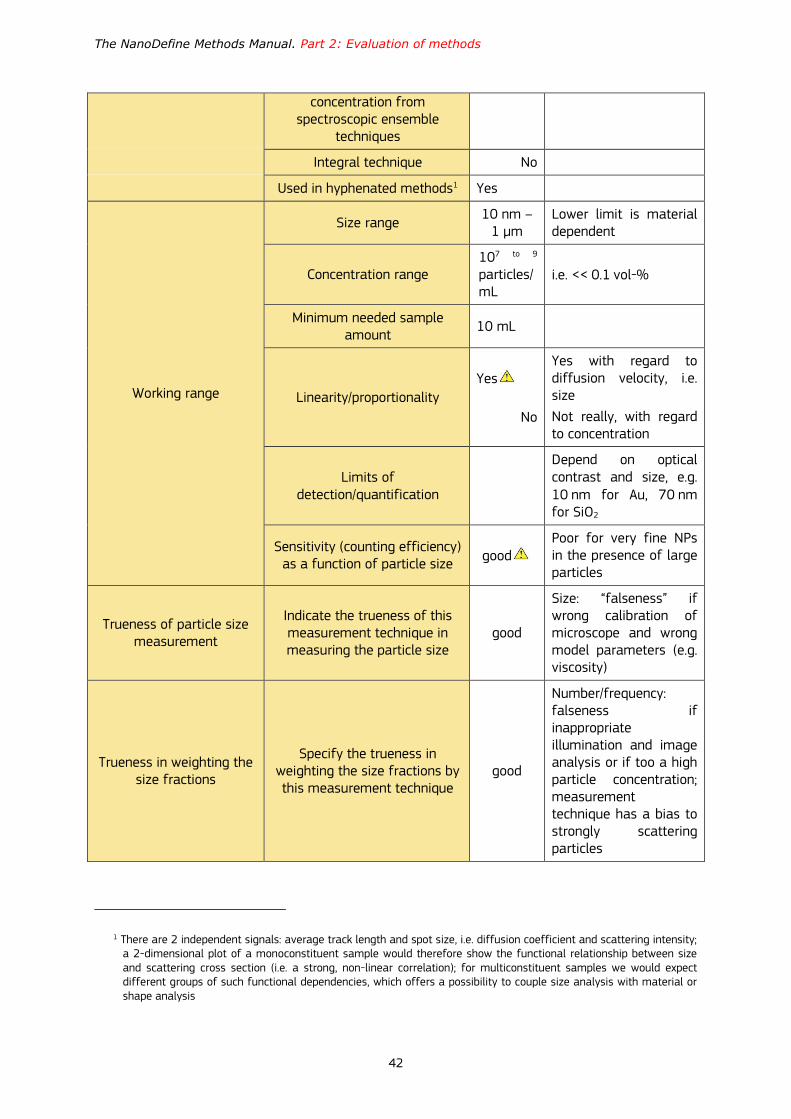
The NanoDefine Methods Manual. Part 2: Evaluation of methods
42
concentration from spectroscopic ensemble
techniques
Integral technique No
Used in hyphenated methods1 Yes
Working range
Size range 10 nm –
1 µm Lower limit is material dependent
Concentration range 107 to 9 particles/mL
i.e. << 0.1 vol-%
Minimum needed sample amount
10 mL
Linearity/proportionality
Yes
No
Yes with regard to diffusion velocity, i.e. size
Not really, with regard to concentration
Limits of detection/quantification
Depend on optical contrast and size, e.g. 10 nm for Au, 70 nm for SiO2
Sensitivity (counting efficiency) as a function of particle size
good Poor for very fine NPs in the presence of large particles
Trueness of particle size measurement
Indicate the trueness of this measurement technique in measuring the particle size
good
Size: “falseness” if wrong calibration of microscope and wrong model parameters (e.g. viscosity)
Trueness in weighting the size fractions
Specify the trueness in weighting the size fractions by this measurement technique
good
Number/frequency: falseness if inappropriate illumination and image analysis or if too a high particle concentration; measurement technique has a bias to strongly scattering particles
1 There are 2 independent signals: average track length and spot size, i.e. diffusion coefficient and scattering intensity; a 2-dimensional plot of a monoconstituent sample would therefore show the functional relationship between size and scattering cross section (i.e. a strong, non-linear correlation); for multiconstituent samples we would expect different groups of such functional dependencies, which offers a possibility to couple size analysis with material or shape analysis
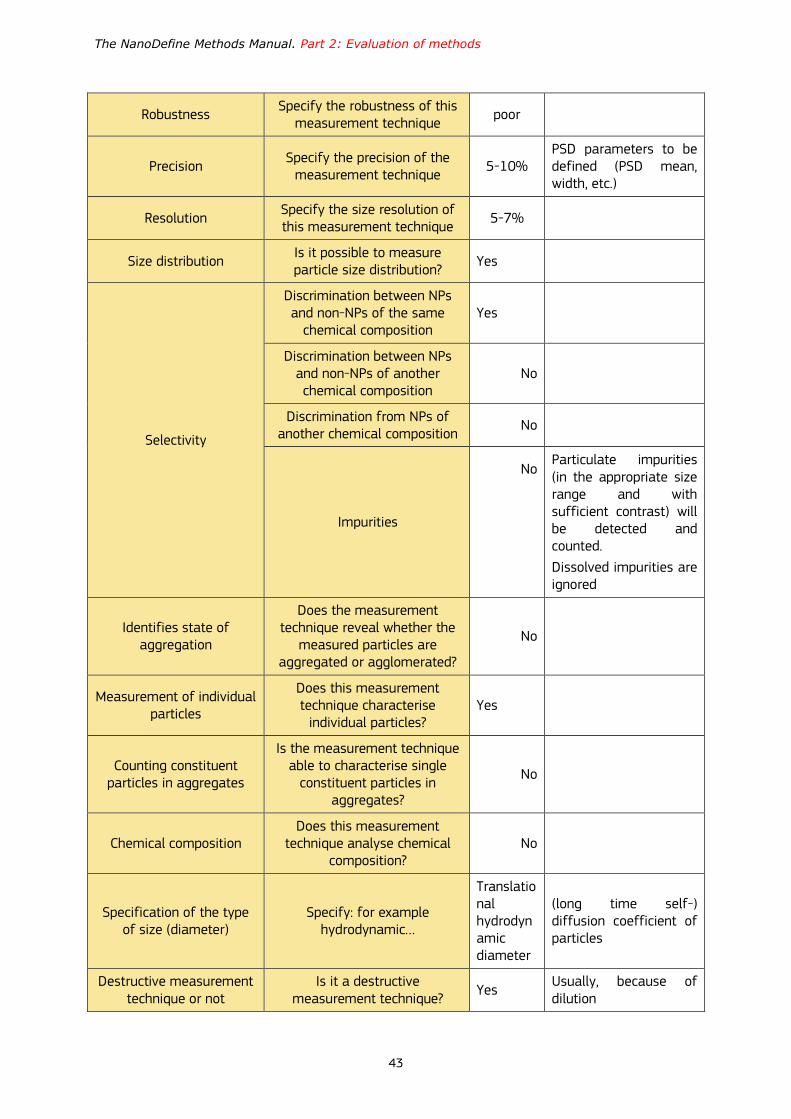
The NanoDefine Methods Manual. Part 2: Evaluation of methods
43
Robustness Specify the robustness of this
measurement technique poor
Precision Specify the precision of the
measurement technique 5-10%
PSD parameters to be defined (PSD mean, width, etc.)
Resolution Specify the size resolution of this measurement technique
5-7%
Size distribution Is it possible to measure particle size distribution?
Yes
Selectivity
Discrimination between NPs and non-NPs of the same
chemical composition Yes
Discrimination between NPs and non-NPs of another chemical composition
No
Discrimination from NPs of another chemical composition
No
Impurities
No
Particulate impurities (in the appropriate size range and with sufficient contrast) will be detected and counted.
Dissolved impurities are ignored
Identifies state of aggregation
Does the measurement technique reveal whether the
measured particles are aggregated or agglomerated?
No
Measurement of individual particles
Does this measurement technique characterise
individual particles? Yes
Counting constituent particles in aggregates
Is the measurement technique able to characterise single
constituent particles in aggregates?
No
Chemical composition Does this measurement
technique analyse chemical composition?
No
Specification of the type of size (diameter)
Specify: for example hydrodynamic…
Translational hydrodynamic diameter
(long time self-) diffusion coefficient of particles
Destructive measurement technique or not
Is it a destructive measurement technique?
Yes Usually, because of dilution

The NanoDefine Methods Manual. Part 2: Evaluation of methods
44
Other Specificity
Vacuum Does the measurement technique operate under
vacuum? No
Sample support Does this measurement
technique need preparation on suitable supports?
No
3.4 Tunable resistive pulse sensing (TRPS)2 / electrical sensing zone (ESZ) / nano
Coulter counter
3.4.1 Measurement principle
A Coulter counter is an apparatus for counting and sizing particles suspended in electrolytes33; the
measuring technique is also called electrical sensing zone. It is used for cells, bacteria, prokaryotic
cells and virus particles and more recently for fine particles. A typical Coulter counter has one or
more microchannels that separate two chambers containing electrolyte solutions. As fluid
containing particles or cells is drawn through each micro channel, each particle causes a brief
change to the electrical resistance of the liquid. The counter detects these changes in electrical
resistance. The Coulter principle relies on the fact that particles moving in an electric field cause
measurable disturbances in that field. The magnitudes of these disturbances are proportional to the
volume of the particles in the field34, 35, 36. For accurate measurement a few prerequisites should be
fulfilled. Firstly, the particles should be suspended in a conducting liquid. Secondly, the electrical
field should be physically constricted so that the movement of particles in the field causes
detectable changes in the current. Finally, the sample should be sufficiently dilute so that only one
particle at a time passes through the physical constriction, preventing an artefact known as
coincidence.
3.4.2 Performance
The Coulter counter needs calibration (usually with spherical polymer latex). This calibration holds
true for any other non-conducting material with particles that do not deviate considerably from
spherical shape. The calibration constants should be changed for non-spherical particles (even
though the signal is still proportional to the particle volume). Conducting particles require a defined
adjustment of the applied voltage. Porous particles or aggregates need appropriate models or
calibration, which means that the morphology of such particles has to be known.
The electrical sensing zone technique principally allows the measurement of number-weighted size
distributions with high resolution. In addition, it can be used to measure the particle number
concentration and their volume concentration (because the signal is volume proportional).
2 TRPS (tunable resistive pulse sensing) is the preferred designation of the manufacturer (izon) for their newly introduced instrument (qnano): particles dispersed in water with dissolved salt move through the single pore of an elastic separator (hence the 'tunable' detection interval) which separates two electrodes that detect the ion current. Whenever a single particle blocks the pore, the current reduces, and the duration and depth of this 'pulse' provide information on size. The sequential detection of blockade events constitutes a size distribution in number metrics without further conversion. This detection principle is related, but not identical to the conventional ESZ (electrical sensing zone), and hence the designation 'Nano Coulter counter' for TRPS is not preferred.

The NanoDefine Methods Manual. Part 2: Evaluation of methods
45
Table 13 and Table 14 below give the general performance of the method Tuneable Resistive Pulse
Sensing and the performance table for this method, respectively.
Table 13: General performance of Tunable Resistive Pulse Sensing (TRPS) / Electrical sensing zone (ESZ) / nano Coulter counter
Main features
Type of samples particles (solid, liquid, gaseous) in liquid dispersion medium
Type of sizing counting technique (by identifying individual objects in continuous signals)
Particle property measured particle volume
equivalent sphere diameter: volume equivalent diameter
Type of quantity particle number
size range minimum size 50 nm maximum is in the range 1-10 µm
concentration range 105 - 1012 particles / mL
information content very high, i.e. can well resolve details of the size distribution
Main advantages
intrinsically yields number-weighted size distributions, Q0
good resolution of particle size distribution provides number concentration of analysed sample
Main disadvantages
does not resolve particle shape, but measures a volume equivalent diameter,
measures aggregate size rather than size of the constituent particles
lower size limit is clearly above 10 nm limited dynamic range because of clogging
Table 14: Technical characteristics for tunable resistive pulse sensing (TRPS)
Colour code: material-related technical characteristics and metrological aspects of the technique
Criteria (general) Criteria (more specific)
Characteri
sation
(Yes/No)
Notes
Nanoparticles in powder or liquid suspensions or embedded in a matrix
Dispersed in liquids Yes
Solid particulate form No
Dispersed or embedded in different kinds of matrices
No
Dispersibility by dispersion protocols
Dispersible in aqueous media
Yes
Dispersible in non-polar No

The NanoDefine Methods Manual. Part 2: Evaluation of methods
46
liquids
Dispersible in polar liquids other than water
Yes
Dispersible in material-specific media
Yes
Can be aerosolized No
Substance Nature
Inorganic Yes
Size-dependent absorption / fluorescence
Yes
Carbon based Yes
Organic, particulate Yes
Organic, non-particulate No
Biological Yes
Composite particles Yes Only outer size
Other
Composite particles (see Section 2.2.1.3)
Core/shell Yes Only outer size
Multishell particles Yes
Particles with inclusions Yes Possible in certain cases
Number of nanoscaled dimensions
1 (e.g. thickness of nanoplates)
No Measurement technique does not resolve shape
2 (e.g. diameter of nanofibres)
No Volume correct, if aspect ratio length/diameter<3
3 Yes Measures particle volume replacing liquid volume
Shape of nanoparticles
Sphere or similar Yes
Measurement technique can measure objects of different shapes, but only provides an equivalent diameter
Equiaxial Yes
Tubes, fibres, rods (length:diameter ≥ 3)
No
Flakes and discs (thickness:laterial extension ≤ 0.25)
No
Other No

The NanoDefine Methods Manual. Part 2: Evaluation of methods
47
Thermal degradation sensitivity (of test
material)
(Must be compatible with Measurement Technique working range: 15-25 °C)
Above 0 °C No
Sensitivity above 25 °C Yes
Sensitivity above 37 °C Yes
Sensitivity above 50 °C Yes
Sensitivity above 100 °C Yes
Sensitivity above 150 °C Yes
Sensitivity above 500 °C Yes
Sensitivity above 1000 °C Yes
Cooling degradation sensitivity (of test
material)
(Must be compatible with Measurement Technique working range: 15-25 °C)
Sensitive below 25 °C Yes
Sensitive below 0 °C Yes
Sensitive below -18 °C Yes
Sensitive below -35 °C Yes
Sensitive below -78 °C Yes
Sensitive below -195 °C Yes
Electron beam sensitivity
Electron beam sensitive Yes
Not electron beam sensitive
Yes
Particle size dispersity and modality
Monodisperse Yes
Polydisperse Yes
Monomodal Yes
Multimodal Yes
Conductivity properties (electrical)
Conductive Yes
Semiconductive Yes
Insulator Yes
Magnetic properties Magnetic Yes
Non magnetic Yes
Functionalization / no functionalisation
Functionalised Yes
Not functionalised Yes

The NanoDefine Methods Manual. Part 2: Evaluation of methods
48
Agglomeration/ aggregation state
Nanoparticles are aggregated
Yes Measurement technique measures only aggregate size
Nanoparticles are not aggregated
Yes Provided that they fit to the measurement range of the instrument
Nanoparticles are agglomerated
Yes
Measurement technique measures only agglomerate size, and only if they are small enough to avoid capillary clogging
Nanoparticles are not agglomerated
Yes Provided that they fit to the measurement range of the instrument
Counting, fractionating or ensemble technique
Single particle counting Yes
Measures or calculates number or number concentration from
fractionating techniques
No
Calculates number or number concentration
from spectroscopic ensemble techniques
No
Integral technique No
Used in hyphenated methods
No
Working range
Size range
50 nm - 10 μm
Lower size limit depends on sensing pore size, which may be blocked.
50 nm - 10 μm for flow through membrane;
0.4µm – 1200 µm classical for capillary flow
Concentration range 105 - 1012 particles/m
L for porous
membrane;
101-109 mL-1:
capillary flow
Minimum needed sample amount
500 µL
Linearity/proportionality Yes Pulse amplitude linear to displaced electrolyte volume
Limits of detection/quantification
50 nm For membrane flow technique
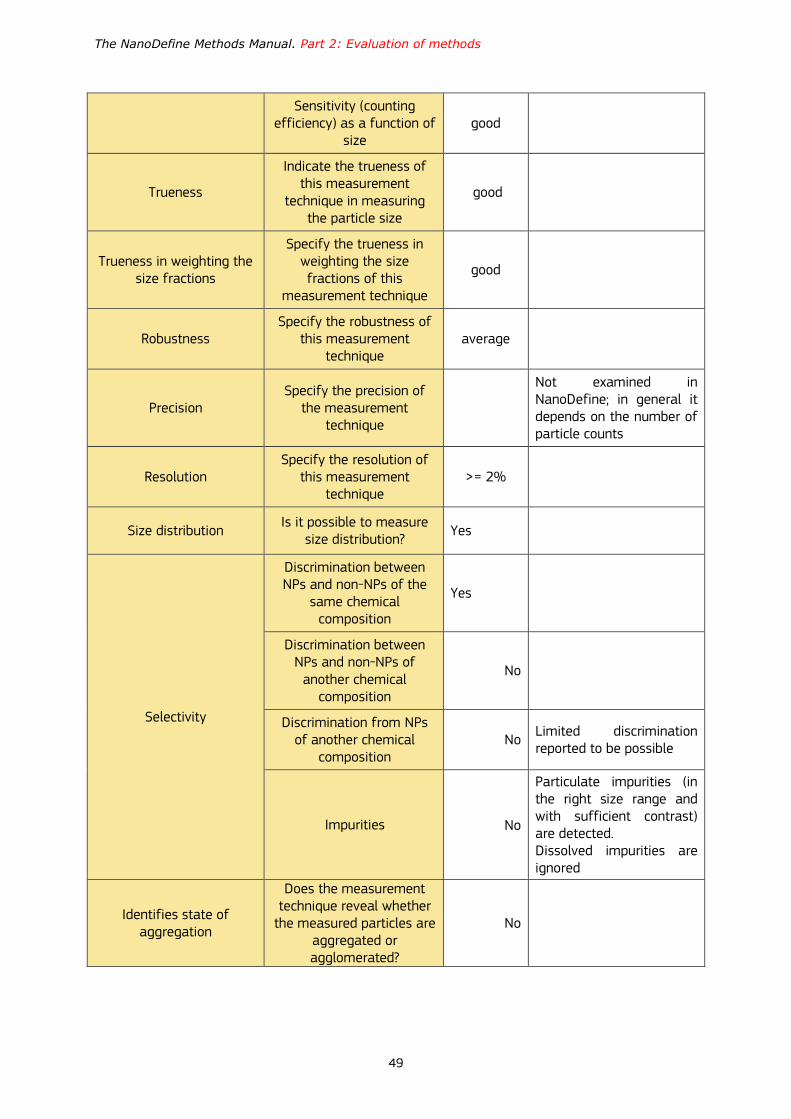
The NanoDefine Methods Manual. Part 2: Evaluation of methods
49
Sensitivity (counting efficiency) as a function of
size good
Trueness
Indicate the trueness of this measurement
technique in measuring the particle size
good
Trueness in weighting the size fractions
Specify the trueness in weighting the size fractions of this
measurement technique
good
Robustness Specify the robustness of
this measurement technique
average
Precision Specify the precision of
the measurement technique
Not examined in NanoDefine; in general it depends on the number of particle counts
Resolution Specify the resolution of
this measurement technique
>= 2%
Size distribution Is it possible to measure
size distribution? Yes
Selectivity
Discrimination between NPs and non-NPs of the
same chemical composition
Yes
Discrimination between NPs and non-NPs of
another chemical composition
No
Discrimination from NPs of another chemical
composition No
Limited discrimination reported to be possible
Impurities
No
Particulate impurities (in the right size range and with sufficient contrast) are detected. Dissolved impurities are ignored
Identifies state of aggregation
Does the measurement technique reveal whether
the measured particles are aggregated or agglomerated?
No
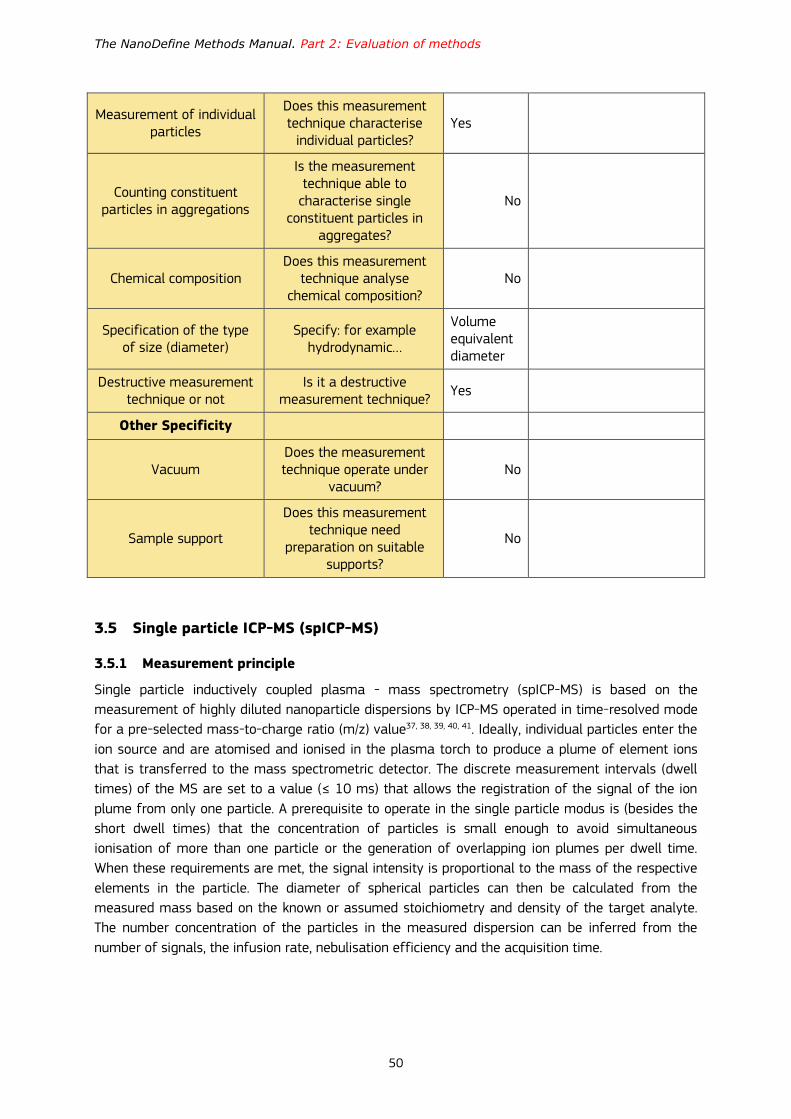
The NanoDefine Methods Manual. Part 2: Evaluation of methods
50
Measurement of individual particles
Does this measurement technique characterise
individual particles? Yes
Counting constituent particles in aggregations
Is the measurement technique able to
characterise single constituent particles in
aggregates?
No
Chemical composition Does this measurement
technique analyse chemical composition?
No
Specification of the type of size (diameter)
Specify: for example hydrodynamic…
Volume equivalent diameter
Destructive measurement technique or not
Is it a destructive measurement technique?
Yes
Other Specificity
Vacuum Does the measurement technique operate under
vacuum? No
Sample support
Does this measurement technique need
preparation on suitable supports?
No
3.5 Single particle ICP-MS (spICP-MS)
3.5.1 Measurement principle
Single particle inductively coupled plasma - mass spectrometry (spICP-MS) is based on the
measurement of highly diluted nanoparticle dispersions by ICP-MS operated in time-resolved mode
for a pre-selected mass-to-charge ratio (m/z) value37, 38, 39, 40, 41. Ideally, individual particles enter the
ion source and are atomised and ionised in the plasma torch to produce a plume of element ions
that is transferred to the mass spectrometric detector. The discrete measurement intervals (dwell
times) of the MS are set to a value (≤ 10 ms) that allows the registration of the signal of the ion
plume from only one particle. A prerequisite to operate in the single particle modus is (besides the
short dwell times) that the concentration of particles is small enough to avoid simultaneous
ionisation of more than one particle or the generation of overlapping ion plumes per dwell time.
When these requirements are met, the signal intensity is proportional to the mass of the respective
elements in the particle. The diameter of spherical particles can then be calculated from the
measured mass based on the known or assumed stoichiometry and density of the target analyte.
The number concentration of the particles in the measured dispersion can be inferred from the
number of signals, the infusion rate, nebulisation efficiency and the acquisition time.

The NanoDefine Methods Manual. Part 2: Evaluation of methods
51
3.5.2 Performance
This measurement technique has a number of unique features. It is a relatively robust technique
and can be run on conventional ICP-MS instruments that are widely available in both commercial
and official control laboratories. Sample preparation is simple (often only dilution) and the
measurement time per sample very short (1 min) which allows high throughput analysis.
Furthermore, it is chemically specific and provides actual number-based size distributions.
Current application limits include:
The detection limits in terms of size are constrained by (i) the sensitivity of the detector for the target element, and (ii) isobaric interferences/background for the target isotope. In general, sensitivity is higher for heavier elements.
The correct size determination is limited to spherical particles of known density.
Current instruments only allow mono-isotopic detection, i.e. different particles that carry the same target element cannot be distinguished (e.g. Ag NP from Ag/Au NP). New instruments are on the edge to allow bi-isotopic detection (at the cost of compromising correct quantification and thus size determination).
Constituent particles in aggregates are not resolved, in agglomerates only by appropriate dispersion in the sample preparation step (not in the instrument).
Table 15 and Table 16 below give the general performance of the method single particle Inductively
Coupled Plasma – Mass Spectrometry and the performance table for this method, respectively.
Table 15: General performance of single particle inductively coupled plasma – mass spectrometry (spICP-MS)
Main features
Type of samples particles (typically solid) in liquid dispersion medium
Type of sizing counting technique (by identifying individual objects in continuous signals)
Particle property measured mass of specified elements
equivalent diameter: mass or volume equivalent diameter
Type of quantity particle number
Size range depending on target element, e.g.:
Au 15 – 1000 nm, Ag 20 - 1000 nm, TiO2 50 – 1000 nm, SiO2 200 – 1000 nm
Concentration range depending on element, particle size, instrument (e.g. Ag 60 nm: 5 – 500 ng/L)
Information content very high with respect to size distribution, i.e. can well resolve details of the size distribution
good (particle size, particle number concentration, mass concentration)
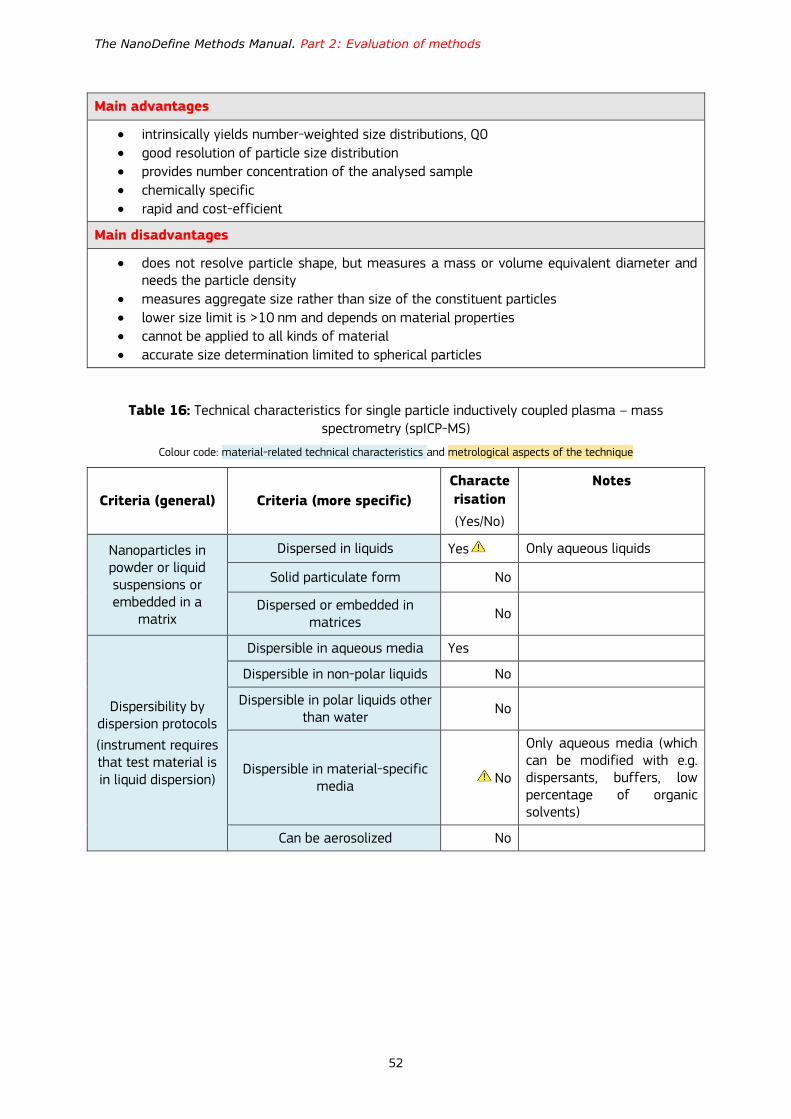
The NanoDefine Methods Manual. Part 2: Evaluation of methods
52
Main advantages
intrinsically yields number-weighted size distributions, Q0
good resolution of particle size distribution
provides number concentration of the analysed sample
chemically specific
rapid and cost-efficient
Main disadvantages
does not resolve particle shape, but measures a mass or volume equivalent diameter and needs the particle density
measures aggregate size rather than size of the constituent particles
lower size limit is >10 nm and depends on material properties
cannot be applied to all kinds of material
accurate size determination limited to spherical particles
Table 16: Technical characteristics for single particle inductively coupled plasma – mass spectrometry (spICP-MS)
Colour code: material-related technical characteristics and metrological aspects of the technique
Criteria (general) Criteria (more specific)
Characte
risation
(Yes/No)
Notes
Nanoparticles in powder or liquid suspensions or embedded in a
matrix
Dispersed in liquids Yes Only aqueous liquids
Solid particulate form No
Dispersed or embedded in matrices
No
Dispersibility by dispersion protocols
(instrument requires that test material is in liquid dispersion)
Dispersible in aqueous media Yes
Dispersible in non-polar liquids No
Dispersible in polar liquids other than water
No
Dispersible in material-specific media
No
Only aqueous media (which can be modified with e.g. dispersants, buffers, low percentage of organic solvents)
Can be aerosolized No
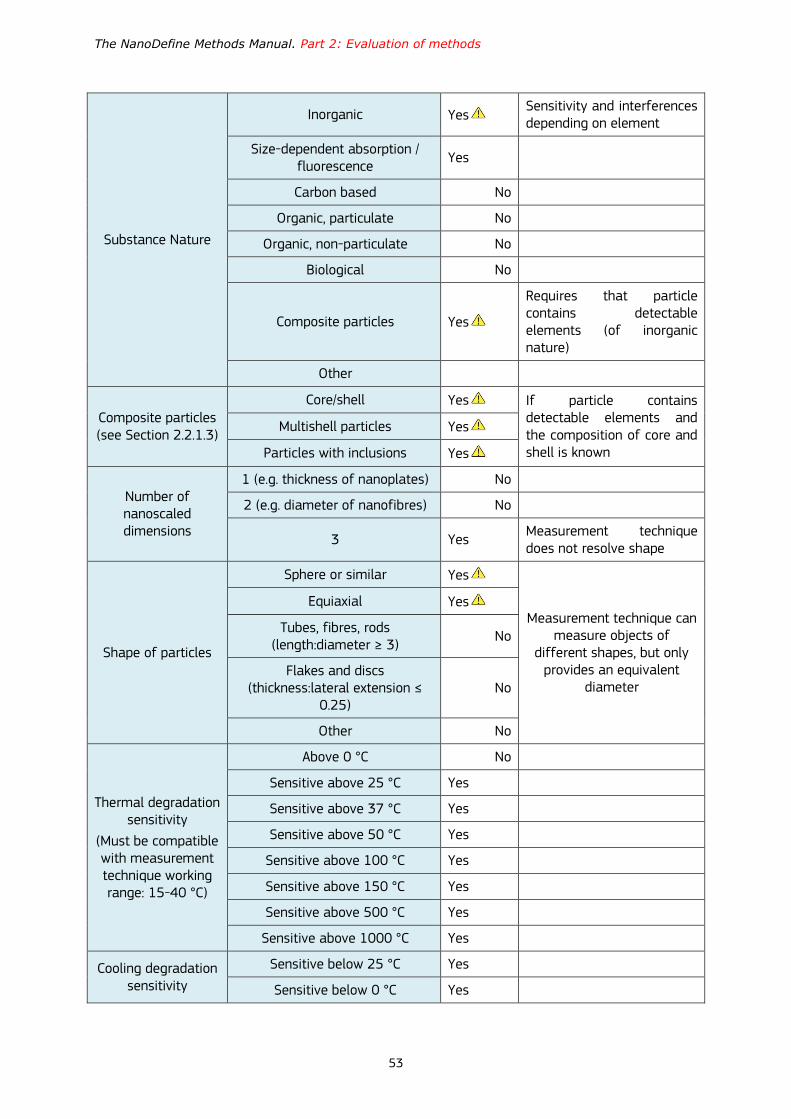
The NanoDefine Methods Manual. Part 2: Evaluation of methods
53
Substance Nature
Inorganic Yes Sensitivity and interferences depending on element
Size-dependent absorption / fluorescence
Yes
Carbon based No
Organic, particulate No
Organic, non-particulate No
Biological No
Composite particles Yes
Requires that particle contains detectable elements (of inorganic nature)
Other
Composite particles (see Section 2.2.1.3)
Core/shell Yes If particle contains detectable elements and the composition of core and shell is known
Multishell particles Yes
Particles with inclusions Yes
Number of nanoscaled dimensions
1 (e.g. thickness of nanoplates) No
2 (e.g. diameter of nanofibres) No
3 Yes Measurement technique does not resolve shape
Shape of particles
Sphere or similar Yes
Measurement technique can measure objects of
different shapes, but only provides an equivalent
diameter
Equiaxial Yes
Tubes, fibres, rods (length:diameter ≥ 3)
No
Flakes and discs (thickness:lateral extension ≤
0.25) No
Other No
Thermal degradation sensitivity
(Must be compatible with measurement technique working range: 15-40 °C)
Above 0 °C No
Sensitive above 25 °C Yes
Sensitive above 37 °C Yes
Sensitive above 50 °C Yes
Sensitive above 100 °C Yes
Sensitive above 150 °C Yes
Sensitive above 500 °C Yes
Sensitive above 1000 °C Yes
Cooling degradation sensitivity
Sensitive below 25 °C Yes
Sensitive below 0 °C Yes
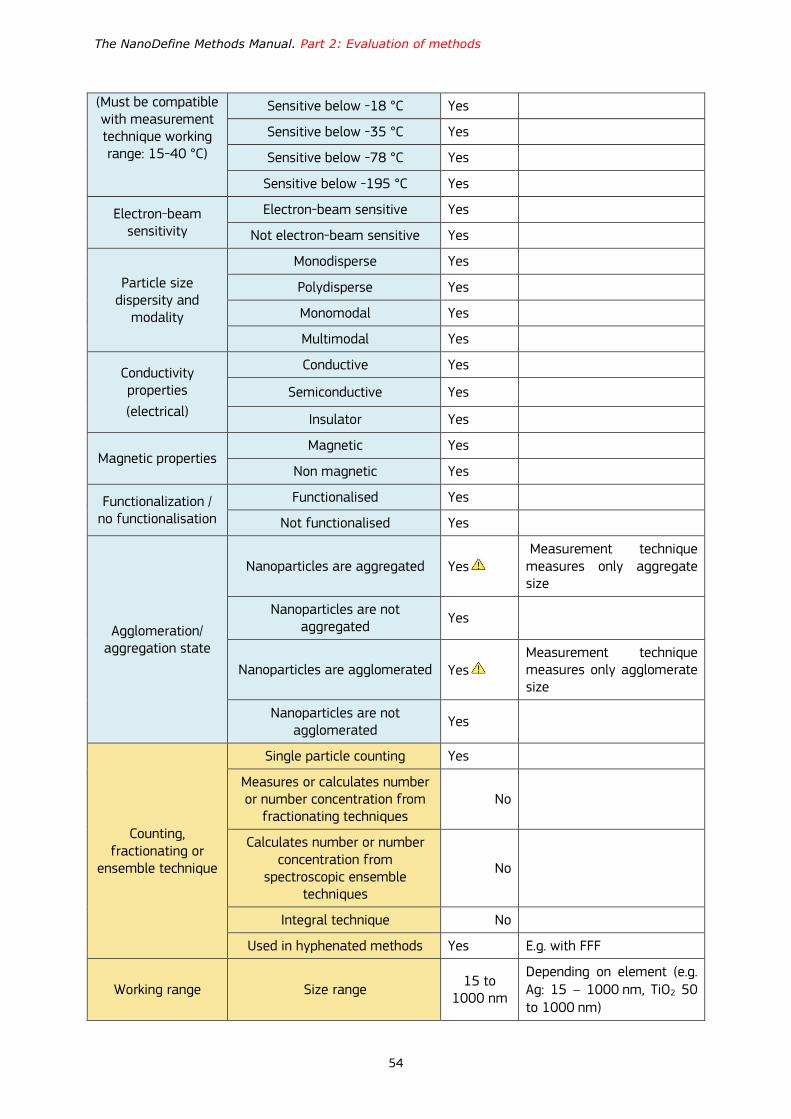
The NanoDefine Methods Manual. Part 2: Evaluation of methods
54
(Must be compatible with measurement technique working range: 15-40 °C)
Sensitive below -18 °C Yes
Sensitive below -35 °C Yes
Sensitive below -78 °C Yes
Sensitive below -195 °C Yes
Electron-beam sensitivity
Electron-beam sensitive Yes
Not electron-beam sensitive Yes
Particle size dispersity and
modality
Monodisperse Yes
Polydisperse Yes
Monomodal Yes
Multimodal Yes
Conductivity properties
(electrical)
Conductive Yes
Semiconductive Yes
Insulator Yes
Magnetic properties Magnetic Yes
Non magnetic Yes
Functionalization / no functionalisation
Functionalised Yes
Not functionalised Yes
Agglomeration/ aggregation state
Nanoparticles are aggregated Yes Measurement technique measures only aggregate size
Nanoparticles are not aggregated
Yes
Nanoparticles are agglomerated Yes Measurement technique measures only agglomerate size
Nanoparticles are not agglomerated
Yes
Counting, fractionating or
ensemble technique
Single particle counting Yes
Measures or calculates number or number concentration from
fractionating techniques No
Calculates number or number concentration from
spectroscopic ensemble techniques
No
Integral technique No
Used in hyphenated methods Yes E.g. with FFF
Working range Size range 15 to
1000 nm
Depending on element (e.g. Ag: 15 – 1000 nm, TiO2 50 to 1000 nm)

The NanoDefine Methods Manual. Part 2: Evaluation of methods
55
Concentration range N/A
Depending on element, particle size, instrument (e.g. Ag 60 nm: 5 – 500 ng/L). Result is mass
Minimum needed sample amount
5 mL of injection dispersion
Usually not an issue due to the high dilution factors (1000 – 100 000) of the original sample
Linearity/proportionality
size: no
quantity: yes
Linear range depending on element, particle size, instrument
Limits of detection (LoD)/quantification
N/A Depending on element it is between 10 and 30 nm
Sensitivity (counting efficiency) as a function of size
N/A
Trueness
Indicate the trueness of the results of this measurement technique in measuring the
particle size
good
Depending on analyte, matrix, laboratory
Trueness in weighting the size
fractions
Specify the trueness in weighting the size fractions of this measurement technique
good Starting from 2 x LoD
Robustness Specify the robustness of this
measurement technique good
Precision Specify the precision of the
measurement technique 0.1% to
2% for x50,0 53
Resolution Specify the resolution of this
measurement technique 1%
Size distribution Is it possible to measure size
distribution? Yes
Size distribution will be measured as a mass distribution
Selectivity
Discrimination between NPs and non-NPs of the same chemical
composition Yes
Discrimination between NPs and non-NPs of another chemical
composition No
The technique is tuned to a single m/z value during measurement
Discrimination from NPs of another chemical composition
No The technique is tuned to a single m/z value during measurement
Impurities Yes Dissolved impurities are ignored
Identifies state of aggregation
Does the measurement technique reveal whether the
measured particles are aggregated or agglomerated?
No

The NanoDefine Methods Manual. Part 2: Evaluation of methods
56
Measurement of individual particles
Does this measurement technique characterise
individual particles? Yes
Counting constituent particles in
aggregations
Is the measurement technique able to characterise single
constituent particles in aggregates?
No
Chemical composition
Does this measurement technique analyse chemical
composition? Yes At the moment only one m/z
Specification of the type of size (diameter)
Specify: for example hydrodynamic…
mass equivalent diameter
Can be used to calculate diameter for spherical, non-porous particles by using a density
Destructive measurement
technique or not
Is it a destructive measurement technique?
Yes
Other Specificity
Vacuum Does the measurement technique operate under
vacuum? No
Sample support Does this measurement
technique need preparation on suitable supports?
No

The NanoDefine Methods Manual. Part 2: Evaluation of methods
57
4 Ensemble methods (spectroscopic)
4.1 Dynamic light scattering (DLS)
4.1.1 Measurement principle
Dynamic Light Scattering (DLS), also called Photon Correlation Spectroscopy (PCS) or Quasi-Elastic
Light Scattering (QELS), is a technique for characterisation of colloidal systems based on the
scattering of visible light resulting from the difference in refractive index between the dispersed
colloids and the dispersion medium. Fluctuations of scattered light may be caused by any changes
in the microstructure of the suspension, e.g. by particle motion or vibrations of particle networks. For
this reason, there are manifold applications for DLS, e.g. particle sizing, molecular weight
determination, studying particle aggregation, monitoring phase transition in colloidal suspensions, or
measuring the strength of colloidal gels.
The principle in DLS is measurement of fluctuations in laser light scattered by vibrating particles
suspended in a liquid as function of time (Figure 3). The vibration is due to Brownian motion caused
by collision with solvent molecules of the liquid. The Brownian motion varies as a function of
particle size and causes variation in the intensity of scattered light as function of time. A correlator
compares the signal measured at a time t0 with different very short time delays t
(autocorrelation). As the particles move, the correlation between t0 and subsequent t signals
decreases with time, from a perfect correlation (1) at t0, to a complete decorrelation (0) at infinite
time (order of milliseconds). In the case of large particles, the signal changes slowly and the
correlation persists for a long time, whereas small particles have fast Brownian movement causing
rapid decorrelation.
Thus, a DLS instrument measures the velocity of Brownian motion, defined by the translational
diffusion coefficient D of the particles. The particle size, or more precisely its hydrodynamic
diameter dh, is then estimated using the Stokes-Einstein equation assuming spherical shape:
D
kTdh
3
k: Boltzmann’s constant
D: translational diffusion coefficient
T: absolute temperature
η: viscosity
It should be noted that even if a particle is truly spherical, the spherical DLS size is fundamentally
different from the physical spherical size. The hydrodynamic size includes the double-layer of highly
polarized water molecules around the physical particle. When the particle morphology is highly non-
spherical, the hydrodynamic size should be understood as the equivalent hydrodynamic spherical
size. Establishment of mean hydrodynamic size and size distributions (intensity, number, volume) is
reached software algorithms, by fitting the correlation function in the data treatment.

The NanoDefine Methods Manual. Part 2: Evaluation of methods
58
Figure 3: Measurement principle of DLS
The intensity fluctuations of DLS experiments can be analysed in terms of (ISO 22412 and 43):
a frequency spectrum (frequency analysis, FA), or
a time correlation function (photon correlation spectroscopy, PCS).
PCS requires a different hardware than FA, but it can be shown that the results of both techniques
are equivalent42, 43. Today, a large variety of commercial or “self-made” DLS instruments are used.
Apart from data processing (FA or PCS), they can be distinguished with regard to laser optics and
signal modulation.
In quiescent, dilute suspensions, the light fluctuations result essentially from the Brownian
displacement of the single particles and thus reflect the particles’ translational diffusion coefficient
Dt. For spherical particles, this parameter (Dt) is inversely proportional to the sphere diameter
(Stokes-Einstein equation).
4.1.2 Performance
Limits for the applicability of DLS are mainly set by size and concentration of particles. First of all, the
concentration should be low enough to avoid strong multiple scattering. For particle sizing the
concentration should be low enough to ensure measurement of short time self-diffusion of
particles. As a rule of thumb, this may be achieved for concentrations below 0.01 to 0.1 vol.-%, but
lower concentration values may be necessary for very fine nanoparticles.
Additionally to the upper concentration limits, there is also one at the lower range, where the
intensity fluctuations start to become affected by the statistic variation of particle number in the
measurement zone44, a minimum of 100 particles should stay in the measurement zone. This is
fulfilled for most colloidal suspensions; problems may arise for micrometre particles (i.e. ≥1 μm).
Sedimentation sets a limit to the detection of large particles because the particle displacement of
micrometre particles is governed by sedimentation rather than by diffusion. This is of particular
importance for polydisperse particle systems, where diffusion and sedimentation are coupled45.
Moreover, sedimentation may affect the size distribution in the measurement zone. However, in the
colloidal size range (x ≤1 μm) there is virtually no impact of sedimentation on DLS results46. A lower
size limit exists only as much as the scattering intensity of the particles should considerably exceed
that of the fluid molecules. Xu43 proposes a minimum factor of 2.5; however, for highly reliable DLS
this value should be multiplied by 10.
During the last two decades, dynamic light scattering has evolved into a major characterisation
technique for colloidal suspensions. A recent interlaboratory study of the characterisation of a
monomodal colloidal silica47 showed that state-of-the-art DLS instrumentation facilitates a highly

The NanoDefine Methods Manual. Part 2: Evaluation of methods
59
reproducible and very reliable acquisition of correlation function and corresponding mean particle
size xcum. The study involved 17 participants from EU and USA, which provided 19 independent data
sets from 6 different commercial instruments covering sideward scattering (90°) and
backscattering. An earlier study with a different test material already indicated the high
interlaboratory comparability48.
Table 17 and Table 18 below give the general performance of the method dynamic light scattering
and the detailed performance table for this method, respectively.
Table 17: General performance for dynamic light scattering (DLS)
Main features
Type of samples particles (solid, liquid, gaseous) in liquid dispersion medium
Type of sizing spectroscopic ensemble technique
Particle property measured diffusion coefficient,
equivalent diameter: (apparent) hydrodynamic diameter (apparent because signal is affected by Brownian rotation)
Type of quantity intrinsically: intensity of scattered light; for NPs: Isca x6
Size range 1 nm to 1 µm
Concentration range ≤1 vol.-% (depends on the material)
Information content relatively low, only few details of the PSD can be resolved
Main advantages
lower size limit <10 nm
relatively wide dynamic range
when DLS detects NPs then there are certainly NPs,
fast and robust
a minimum amount of information about the sample is needed to run the analysis
testing is non-destructive (sample may be recovered)
small amount of sample is needed to run a test
Main disadvantages
number-weighted size distributions Q0 cannot directly be measured
does not resolve particle shape, but measures a hydrodynamic/mobility equivalent diameter, non-spherical particles will introduce errors
measures aggregate size rather than size of the constituent particles
size distribution obtained by inverting a signal spectrum principally limits resolution low resolution
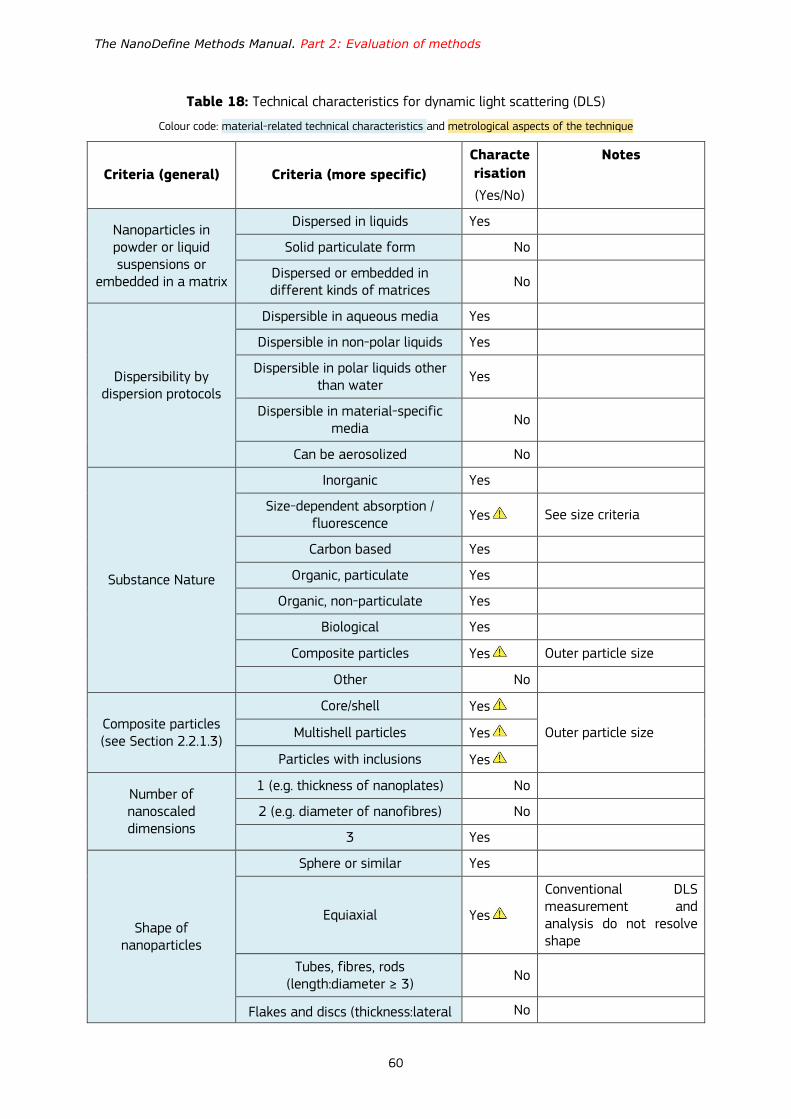
The NanoDefine Methods Manual. Part 2: Evaluation of methods
60
Table 18: Technical characteristics for dynamic light scattering (DLS)
Colour code: material-related technical characteristics and metrological aspects of the technique
Criteria (general) Criteria (more specific)
Characte
risation
(Yes/No)
Notes
Nanoparticles in powder or liquid suspensions or
embedded in a matrix
Dispersed in liquids Yes
Solid particulate form No
Dispersed or embedded in different kinds of matrices
No
Dispersibility by dispersion protocols
Dispersible in aqueous media Yes
Dispersible in non-polar liquids Yes
Dispersible in polar liquids other than water
Yes
Dispersible in material-specific media
No
Can be aerosolized No
Substance Nature
Inorganic Yes
Size-dependent absorption / fluorescence
Yes See size criteria
Carbon based Yes
Organic, particulate Yes
Organic, non-particulate Yes
Biological Yes
Composite particles Yes Outer particle size
Other No
Composite particles (see Section 2.2.1.3)
Core/shell Yes
Outer particle size Multishell particles Yes
Particles with inclusions Yes
Number of nanoscaled dimensions
1 (e.g. thickness of nanoplates) No
2 (e.g. diameter of nanofibres) No
3 Yes
Shape of nanoparticles
Sphere or similar Yes
Equiaxial Yes
Conventional DLS measurement and analysis do not resolve shape
Tubes, fibres, rods (length:diameter ≥ 3)
No
Flakes and discs (thickness:lateral No

The NanoDefine Methods Manual. Part 2: Evaluation of methods
61
extension ≤ 0.25)
Other
Thermal degradation sensitivity (of test
material)
(Must be compatible with Measurement Technique working
range: 5-60 °C)
Above 0 °C No
Sensitive above 25 °C Yes
Sensitive above 37 °C Yes
Sensitive above 50 °C Yes
Sensitive above 100 °C Yes
Sensitive above 150 °C Yes
Sensitive above 500 °C Yes
Sensitive above 1000 °C Yes
Cooling degradation sensitivity
(Must be compatible with Measurement Technique working
range: 5-60 °C)
Sensitive below 25 °C Yes
Sensitive below 0 °C Yes
Sensitive below -18 °C Yes
Sensitive below -35 °C Yes
Sensitive below -78 °C Yes
Sensitive below -195 °C Yes
Electron beam sensitivity
Electron beam sensitive Yes
Not electron beam sensitive Yes
Particle size dispersity and modality
Monodisperse Yes
Polydisperse Yes Insensitive to fine NPs for (very) broad PSDs
Monomodal Yes
Multimodal Yes Insensitive to fine NPs for (very) broad PSDs
Conductivity properties (electrical)
Conductive Yes
Semiconductive Yes
Insulator Yes
Magnetic properties Magnetic Yes
Non magnetic Yes
Functionalization / no functionalisation
Functionalised Yes
Not functionalised Yes
Agglomeration/ aggregation state
Nanoparticles are aggregated Yes Only aggregate size
Nanoparticles are not aggregated Yes
Nanoparticles are agglomerated Yes Only agglomerate size
Nanoparticles are not agglomerated
Yes
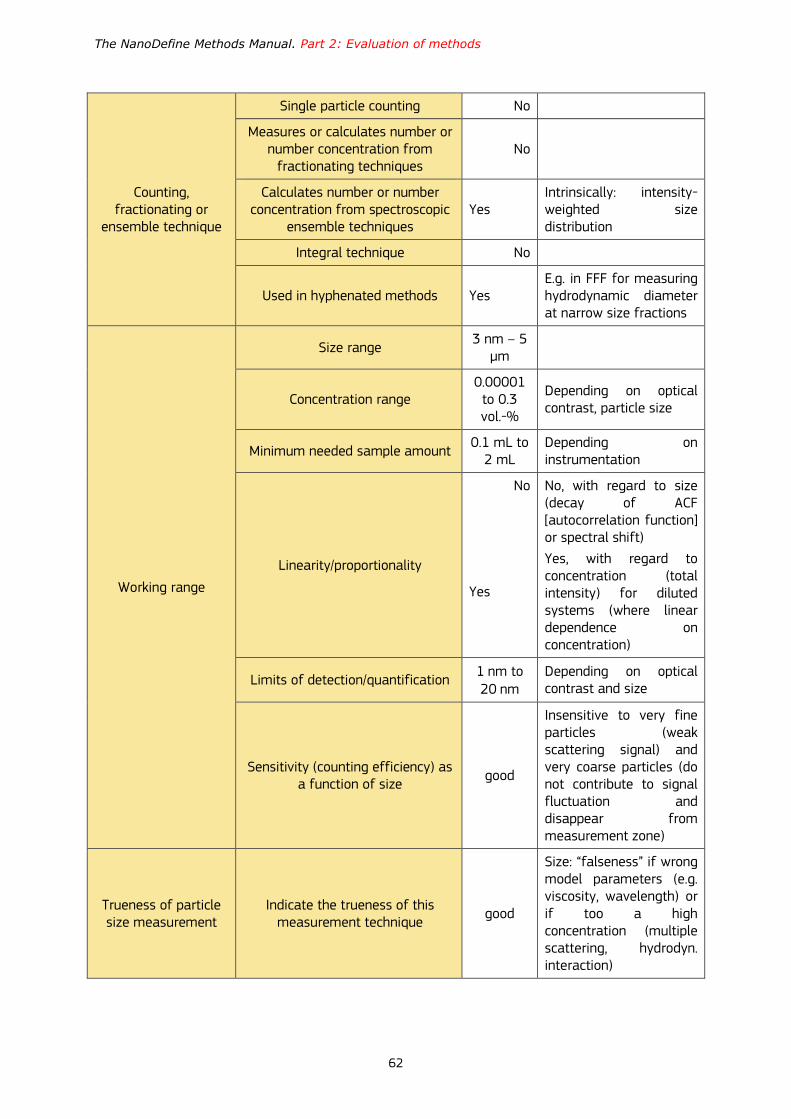
The NanoDefine Methods Manual. Part 2: Evaluation of methods
62
Counting, fractionating or
ensemble technique
Single particle counting No
Measures or calculates number or number concentration from
fractionating techniques No
Calculates number or number concentration from spectroscopic
ensemble techniques Yes
Intrinsically: intensity-weighted size distribution
Integral technique No
Used in hyphenated methods Yes E.g. in FFF for measuring hydrodynamic diameter at narrow size fractions
Working range
Size range 3 nm – 5
µm
Concentration range 0.00001
to 0.3 vol.-%
Depending on optical contrast, particle size
Minimum needed sample amount 0.1 mL to
2 mL Depending on instrumentation
Linearity/proportionality
No
Yes
No, with regard to size (decay of ACF [autocorrelation function] or spectral shift)
Yes, with regard to concentration (total intensity) for diluted systems (where linear dependence on concentration)
Limits of detection/quantification 1 nm to 20 nm
Depending on optical contrast and size
Sensitivity (counting efficiency) as a function of size
good
Insensitive to very fine particles (weak scattering signal) and very coarse particles (do not contribute to signal fluctuation and disappear from measurement zone)
Trueness of particle size measurement
Indicate the trueness of this measurement technique
good
Size: “falseness” if wrong model parameters (e.g. viscosity, wavelength) or if too a high concentration (multiple scattering, hydrodyn. interaction)

The NanoDefine Methods Manual. Part 2: Evaluation of methods
63
Trueness in weighting the size fractions
Specify the trueness in weighting the size fractions of this measurement technique
moderate
Intensity weights: “falseness” if multiple scattering or if too high laser intensities
Robustness Specify the robustness of this
measurement technique good
Precision Specify the precision of the
measurement technique
0.2% to 20%
0.4% to 5%
For x50,0 (NanoDefine)
For x50,int3 (NanoDefine)
Resolution Specify the resolution of this
measurement technique 20% to
50%
Size distribution Is it possible to measure size
distribution? Yes
Selectivity
Discrimination between NPs and non-NPs of the same chemical
composition Yes If NP dominate
Discrimination between NPs and non-NPs of another chemical
composition
No
Discrimination from NPs of another chemical composition
No
Impurities
No
Particulate impurities (in the right size range and with sufficient contrast) are detected.
Dissolved impurities are ignored
Identifies state of aggregation
Does the measurement technique reveal whether the measured particles are aggregated or
agglomerated?
No
Measurement of individual particles
Does this measurement technique characterise individual particles?
No
Counting constituent particles in
aggregations
Is the measurement technique able to characterise single
constituent particles in aggregates?
No
Chemical composition Does this measurement technique
analyse chemical composition? No
Specification of the type of size
Specify: for example hydrodynamic…
apparent hydrodyn
Short time self-diffusion: translation affected by
3 x50,int is a median of (scattering) intensity-weighted size distribution Qint, which is intrinsically measured by DLS; the term Qint is given in ISO 22412:2017
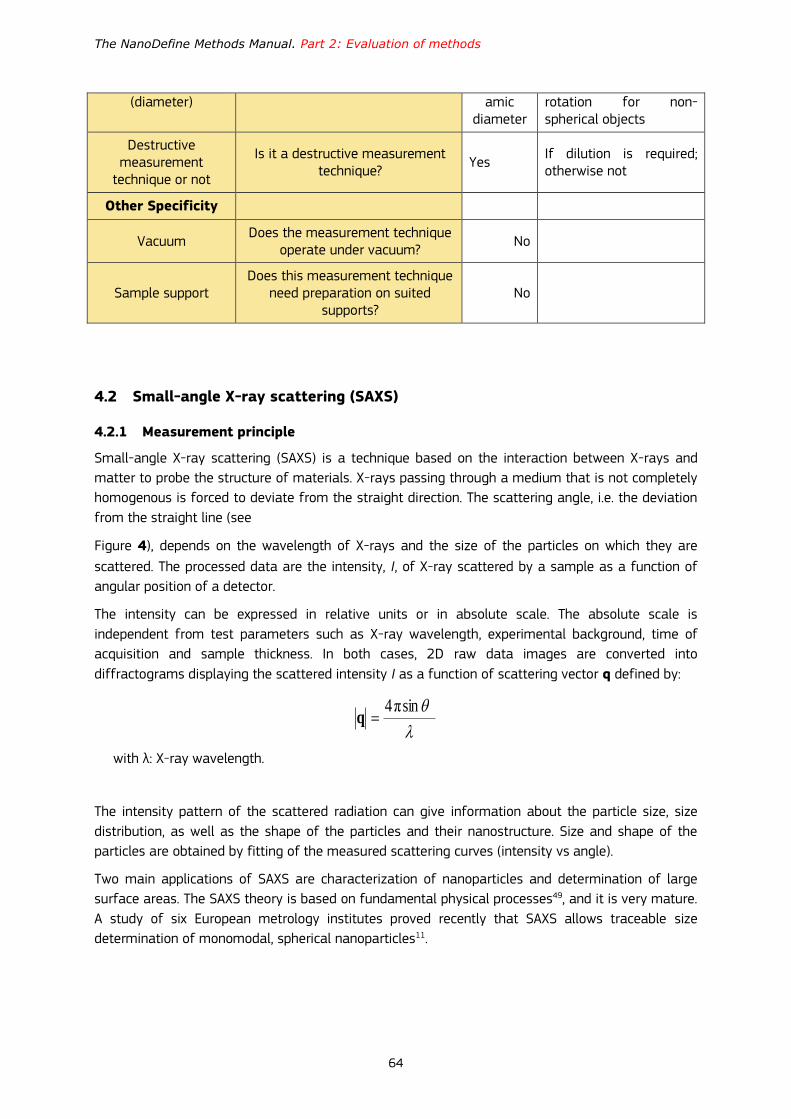
The NanoDefine Methods Manual. Part 2: Evaluation of methods
64
(diameter) amic diameter
rotation for non-spherical objects
Destructive measurement
technique or not
Is it a destructive measurement technique?
Yes If dilution is required; otherwise not
Other Specificity
Vacuum Does the measurement technique
operate under vacuum? No
Sample support Does this measurement technique
need preparation on suited supports?
No
4.2 Small-angle X-ray scattering (SAXS)
4.2.1 Measurement principle
Small-angle X-ray scattering (SAXS) is a technique based on the interaction between X-rays and
matter to probe the structure of materials. X-rays passing through a medium that is not completely
homogenous is forced to deviate from the straight direction. The scattering angle, i.e. the deviation
from the straight line (see
Figure 4), depends on the wavelength of X-rays and the size of the particles on which they are
scattered. The processed data are the intensity, I, of X-ray scattered by a sample as a function of
angular position of a detector.
The intensity can be expressed in relative units or in absolute scale. The absolute scale is
independent from test parameters such as X-ray wavelength, experimental background, time of
acquisition and sample thickness. In both cases, 2D raw data images are converted into
diffractograms displaying the scattered intensity I as a function of scattering vector q defined by:
sinπ4q
with λ: X-ray wavelength.
The intensity pattern of the scattered radiation can give information about the particle size, size
distribution, as well as the shape of the particles and their nanostructure. Size and shape of the
particles are obtained by fitting of the measured scattering curves (intensity vs angle).
Two main applications of SAXS are characterization of nanoparticles and determination of large
surface areas. The SAXS theory is based on fundamental physical processes49, and it is very mature.
A study of six European metrology institutes proved recently that SAXS allows traceable size
determination of monomodal, spherical nanoparticles11.

The NanoDefine Methods Manual. Part 2: Evaluation of methods
65
Figure 4: Measurement principle of SAXS
4.2.2 Performance
The method is accurate, non-destructive and requires only a minimum of sample preparation. SAXS
covers only the lower range of interest from 1 to 100 nm. The experimental devices at synchrotrons
and common laboratories are well developed. Numerous technical improvements have been made
during the last five years. High throughput instruments were realized by using sample changing
robots50 and new X-ray detectors for low noise data recording are available51 for elesynchrotron and
laboratory SAXS. Currently, numerous SAXS manufacturers in Europe have improved SAXS
instruments. These instruments are suitable for routine and standardized measurements in
accordance with ISO standards.
Table 19 and Table 20 below give the general performance of the method small-angle X-ray
scattering and the detailed performance table for this method, respectively.
Table 19: General performance for small-angle X-ray scattering (SAXS)
Main features
Type of samples particles (solid, liquid) dispersed in liquid media or in solid matrices; or solid particles in powder form
(any two-phase systems where the phases have different density)
Type of sizing spectroscopic ensemble technique
Particle property measured scattering pattern (which reflects particle size, shape and orientation as well as state of aggregation)
a) size analysis for particle with defined shape:
external dimensions of the particles (e.g. diameter and length of rod-like particle)
b) size analysis for particles of arbitrary (irregular) shape
scattering equivalent diameter
Type of quantity intrinsically: particle surface (for typical size analysis)
Size range 1 to 100 nm (upper limit depends on specific instrument)
Concentration range 0.01 vol.-% to 100 vol.-%
(lower limit depends strongly on size and density of particles, as well as on the quality of the instrument)
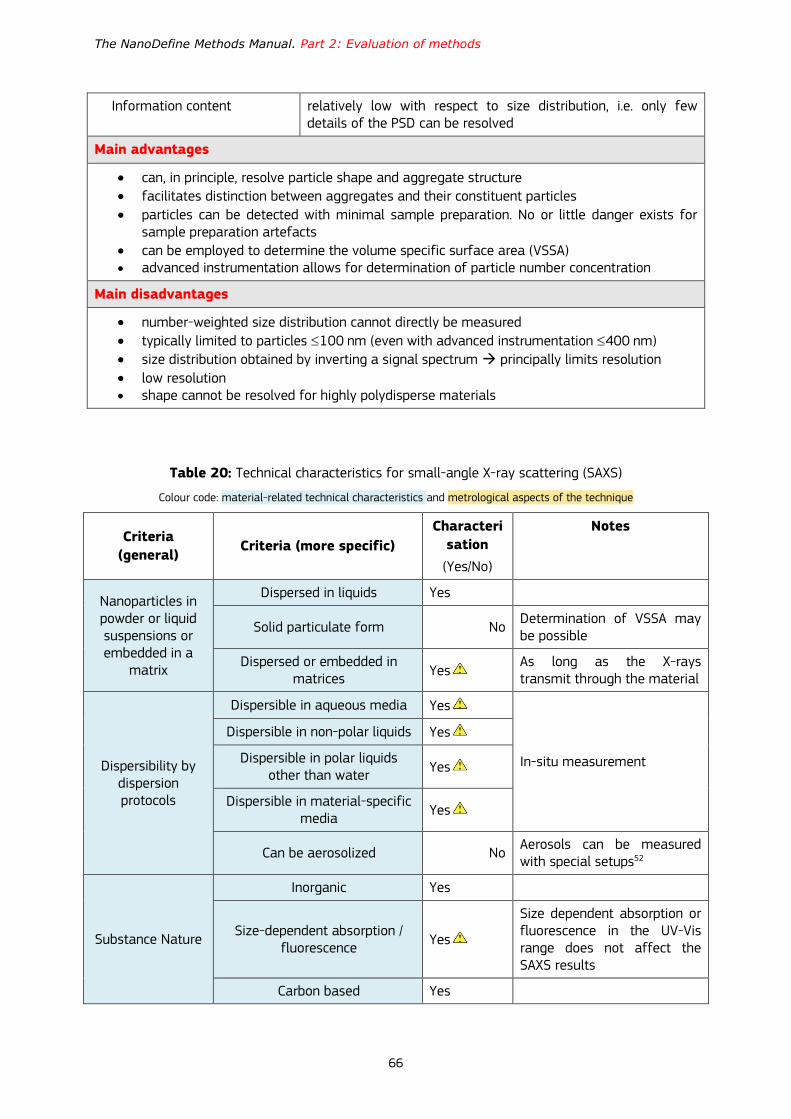
The NanoDefine Methods Manual. Part 2: Evaluation of methods
66
Information content relatively low with respect to size distribution, i.e. only few details of the PSD can be resolved
Main advantages
can, in principle, resolve particle shape and aggregate structure
facilitates distinction between aggregates and their constituent particles
particles can be detected with minimal sample preparation. No or little danger exists for sample preparation artefacts
can be employed to determine the volume specific surface area (VSSA) advanced instrumentation allows for determination of particle number concentration
Main disadvantages
number-weighted size distribution cannot directly be measured
typically limited to particles 100 nm (even with advanced instrumentation 400 nm)
size distribution obtained by inverting a signal spectrum principally limits resolution
low resolution shape cannot be resolved for highly polydisperse materials
Table 20: Technical characteristics for small-angle X-ray scattering (SAXS)
Colour code: material-related technical characteristics and metrological aspects of the technique
Criteria
(general) Criteria (more specific)
Characteri
sation
(Yes/No)
Notes
Nanoparticles in powder or liquid suspensions or embedded in a
matrix
Dispersed in liquids Yes
Solid particulate form No Determination of VSSA may be possible
Dispersed or embedded in matrices
Yes As long as the X-rays transmit through the material
Dispersibility by dispersion protocols
Dispersible in aqueous media Yes
In-situ measurement
Dispersible in non-polar liquids Yes
Dispersible in polar liquids other than water
Yes
Dispersible in material-specific media
Yes
Can be aerosolized No Aerosols can be measured with special setups52
Substance Nature
Inorganic Yes
Size-dependent absorption / fluorescence
Yes
Size dependent absorption or fluorescence in the UV-Vis range does not affect the SAXS results
Carbon based Yes

The NanoDefine Methods Manual. Part 2: Evaluation of methods
67
Organic, particulate Yes
Organic, non-particulate Yes
Biological Yes
Composite particles Yes
Other
Composite particles (see
Section 2.2.1.3)
Core/shell
No
Yes
For unknown materials with increased polydispersity it is rather difficult to predict the measurement result of SAXS. Thickness of individual coatings can be determined if core and shell have different electron densities
Multishell particles Yes
Particles with inclusions Yes
Number of nanoscaled dimensions
1 (e.g. thickness of nanoplates) Yes Size and size distribution can be measured after knowledge of shape (from EM) 2 (e.g. diameter of nanofibres) Yes
3 Yes
Shape of particles
Sphere or similar Yes
Equiaxial Yes
Tubes, fibres, rods (length:diameter ≥ 3)
Yes Yes for low polydispersity
Flakes and discs (thickness:lateral extension ≤
0.25) Yes
Yes for low polydispersity
Other No
If different shapes are mixed in the same sample SAXS analysis is possible only with additional information such as shape information from imaging methods
Thermal degradation
sensitivity (of test material)
(Must be compatible with Measurement
Technique working range: -10-60 °C)
Above 0 °C No
Sensitivity above 25 °C Yes
Sensitivity above 37 °C Yes
Sensitivity above 50 °C Yes
Sensitivity above 100 °C Yes
Sensitivity above 150 °C Yes
Sensitivity above 500 °C Yes
Sensitivity above 1000 °C Yes

The NanoDefine Methods Manual. Part 2: Evaluation of methods
68
Cooling degradation
sensitivity (of test material)
(Must be compatible with Measurement
Technique working range: -10-60 °C)
Sensitive below 25 °C Yes
Sensitive below 0 °C Yes
Sensitive below -18 °C Yes
Sensitive below -35 °C Yes
Sensitive below -78 °C Yes
Sensitive below -195 °C Yes
Electron beam sensitivity
Electron beam sensitive Yes
Not electron beam sensitive Yes
Particle size dispersity and
modality
Monodisperse Yes
Polydisperse Yes
If polydispersity is above ~20%, data evaluation may become ambiguous without further information
Monomodal Yes
Multimodal Yes If modes are too close to each other, distinction of the modes is difficult
Conductivity properties (electrical)
Conductive Yes
Semiconductive Yes
Insulator Yes
Magnetic properties
Magnetic Yes
Non magnetic Yes
Functionalization / no
functionalisation
Functionalised Yes
Not functionalised Yes
Agglomeration/ aggregation state
Nanoparticles are aggregated Yes
Nanoparticles are not aggregated
Yes
Nanoparticles are agglomerated
Yes
Nanoparticles are not agglomerated
Yes
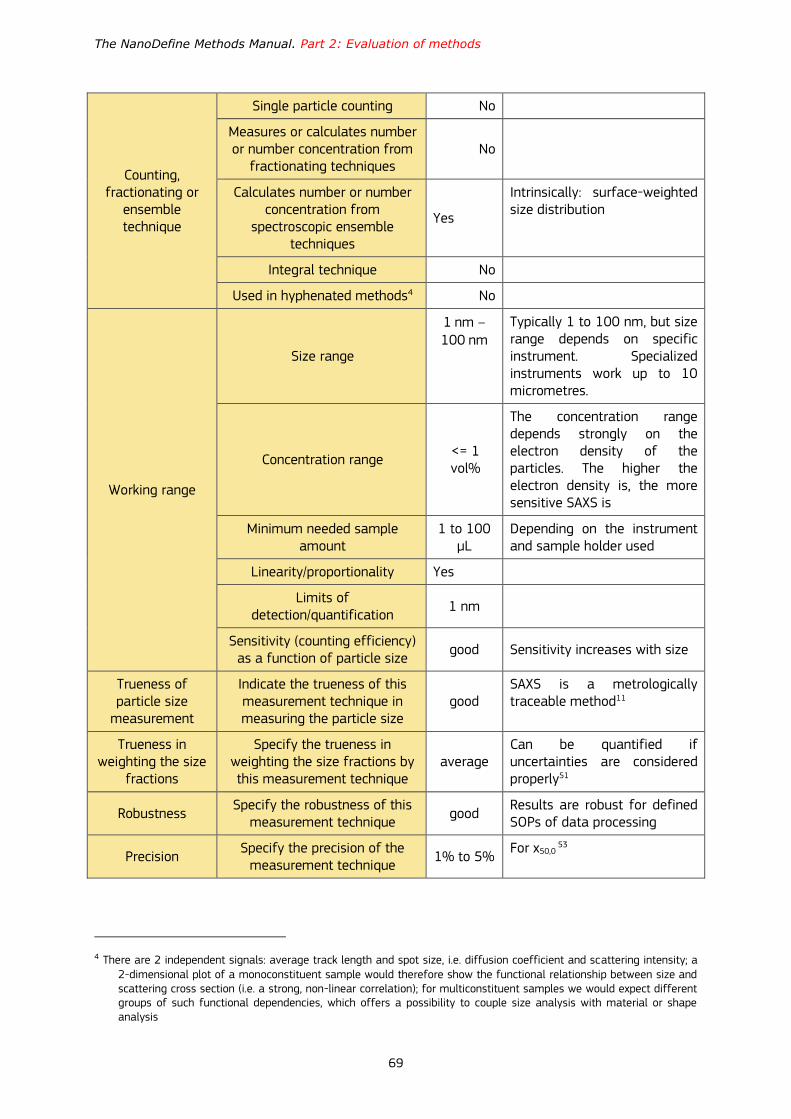
The NanoDefine Methods Manual. Part 2: Evaluation of methods
69
Counting, fractionating or
ensemble technique
Single particle counting No
Measures or calculates number or number concentration from
fractionating techniques No
Calculates number or number concentration from
spectroscopic ensemble techniques
Yes
Intrinsically: surface-weighted size distribution
Integral technique No
Used in hyphenated methods4 No
Working range
Size range
1 nm – 100 nm
Typically 1 to 100 nm, but size range depends on specific instrument. Specialized instruments work up to 10 micrometres.
Concentration range <= 1 vol%
The concentration range depends strongly on the electron density of the particles. The higher the electron density is, the more sensitive SAXS is
Minimum needed sample amount
1 to 100 µL
Depending on the instrument and sample holder used
Linearity/proportionality Yes
Limits of detection/quantification
1 nm
Sensitivity (counting efficiency) as a function of particle size
good Sensitivity increases with size
Trueness of particle size
measurement
Indicate the trueness of this measurement technique in measuring the particle size
good SAXS is a metrologically traceable method11
Trueness in weighting the size
fractions
Specify the trueness in weighting the size fractions by this measurement technique
average Can be quantified if uncertainties are considered properly51
Robustness Specify the robustness of this
measurement technique good
Results are robust for defined SOPs of data processing
Precision Specify the precision of the
measurement technique 1% to 5%
For x50,0 53
4 There are 2 independent signals: average track length and spot size, i.e. diffusion coefficient and scattering intensity; a 2-dimensional plot of a monoconstituent sample would therefore show the functional relationship between size and scattering cross section (i.e. a strong, non-linear correlation); for multiconstituent samples we would expect different groups of such functional dependencies, which offers a possibility to couple size analysis with material or shape analysis
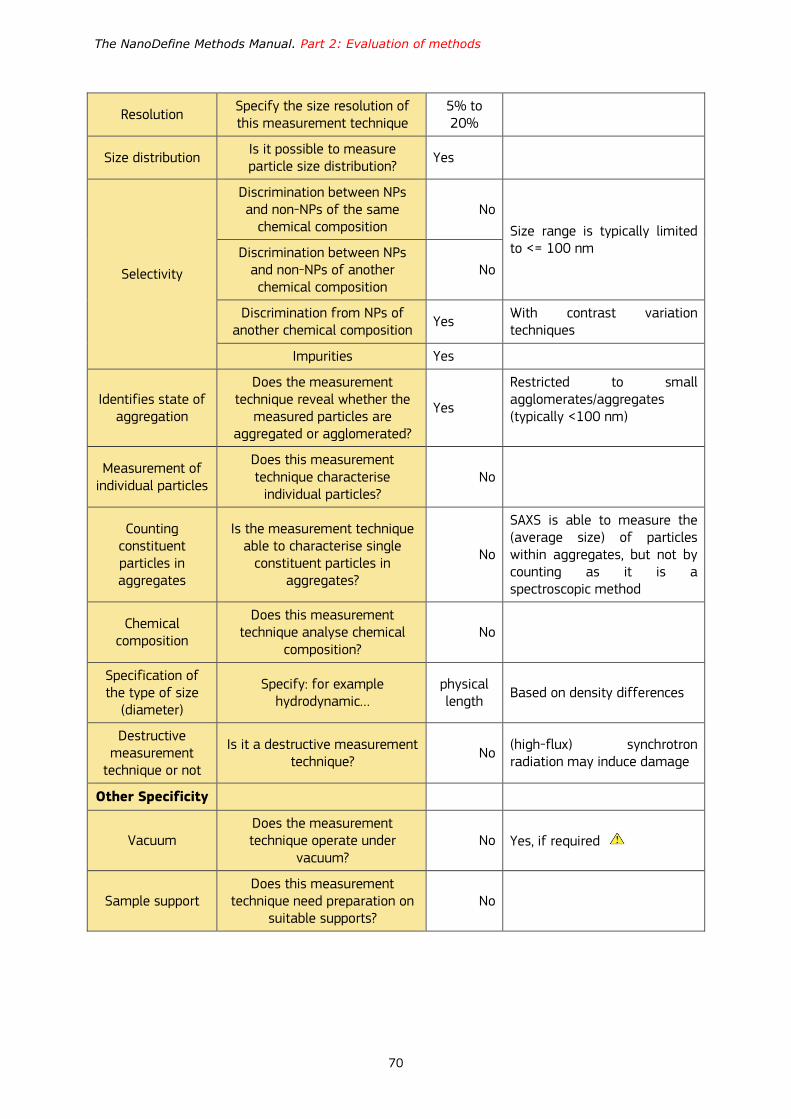
The NanoDefine Methods Manual. Part 2: Evaluation of methods
70
Resolution Specify the size resolution of this measurement technique
5% to 20%
Size distribution Is it possible to measure particle size distribution?
Yes
Selectivity
Discrimination between NPs and non-NPs of the same
chemical composition No
Size range is typically limited to <= 100 nm Discrimination between NPs
and non-NPs of another chemical composition
No
Discrimination from NPs of another chemical composition
Yes With contrast variation techniques
Impurities Yes
Identifies state of aggregation
Does the measurement technique reveal whether the
measured particles are aggregated or agglomerated?
Yes
Restricted to small agglomerates/aggregates (typically <100 nm)
Measurement of individual particles
Does this measurement technique characterise
individual particles? No
Counting constituent particles in aggregates
Is the measurement technique able to characterise single
constituent particles in aggregates?
No
SAXS is able to measure the (average size) of particles within aggregates, but not by counting as it is a spectroscopic method
Chemical composition
Does this measurement technique analyse chemical
composition? No
Specification of the type of size
(diameter)
Specify: for example hydrodynamic…
physical length
Based on density differences
Destructive measurement
technique or not
Is it a destructive measurement technique?
No (high-flux) synchrotron radiation may induce damage
Other Specificity
Vacuum Does the measurement technique operate under
vacuum? No Yes, if required
Sample support Does this measurement
technique need preparation on suitable supports?
No

The NanoDefine Methods Manual. Part 2: Evaluation of methods
71
4.3 Ultrasonic spectroscopy (USSp)
4.3.1 Measurement principle
Ultrasonic spectroscopy is the generic term for all particle sizing techniques that are based on the
frequency-dependent measurement of sound velocity or attenuation in the ultrasonic domain
(mostly within 100 kHz to 200 MHz). While velocity spectroscopy is mainly used for the study of
inter- and intramolecular processes, attenuation spectroscopy has found its major application in
particle sizing54,55. The most promising feature of acoustic characterisation techniques is their
applicability to highly concentrated particle systems (up to 70 vol.-%) under non-equilibrium
conditions56. That means it offers the opportunity to monitor the state of dispersion of dense
product streams, to control the de-agglomeration of suspensions or the homogenisation of
emulsions, and to study polymerisation or crystallisation processes.
As mentioned before, the attenuation spectroscopy has found application in particle sizing55. The
principle of this technique is that plane sound waves moving through a particle suspension are
attenuated in a predictable manner according to size and concentration of the particles in
suspension.
Attenuation of an ultrasonic wave passing through a suspension may be modelled given a set of
mechanical, thermodynamic and transport properties describing both the continuous and particulate
media. The relationship between spectral data and particle size is illustrated by the attenuation
curves. Each curve shows the attenuation of sound waves of a particular frequency as a function of
the size of a monosize population of fixed volume concentration. Due to the measurement noise
along with modelling errors, for the reliable analysis, measurements should be performed for a
greater number of frequencies.
4.3.2 Performance
In principle, ultrasonic spectroscopy can be used for the characterisation of particles in the colloidal
and micrometre size range, provided that the particle concentration is sufficiently high (at least 1
vol.-%) and that the signal contribution by the particles is significant compared to those by the
continuous phase (may be a problem for attenuation measurements in highly viscous solvents).
A major difficulty for the particle sizing by USSp is that the acoustic behaviour depends on a variety
of material parameters. This is of particular relevance for emulsions (14 properties), whereas for
aqueous suspensions only the viscosity and sound speed of liquid and the density contrast have to
be known57.
In colloidal suspensions, the sound propagation is typically governed by the acoustophoretic motion
of particles. For monodisperse spheroids that are not extremely flat or stretched (1/10 < aspect
ratio < 10/1) the attenuation spectrum essentially reflects the volume specific surface area of the
particles58. Similar results would probably be obtained for any convex particle shape. For particle
aggregates, the inner structure is decisive. Regarding the type of quantity, acoustically measured
size distributions are ideally volume-weighted distributions.
It could be shown that the results of ultrasonic spectroscopy agree fairly well with those of other
characterization methods and are hardly affected by the extent of sample dilution59. Interlaboratory
comparisons of ultrasonic spectroscopy measurements on suspensions of inorganic particles also
showed good agreement60. That is why ultrasonic spectroscopy is considered as a powerful tool for
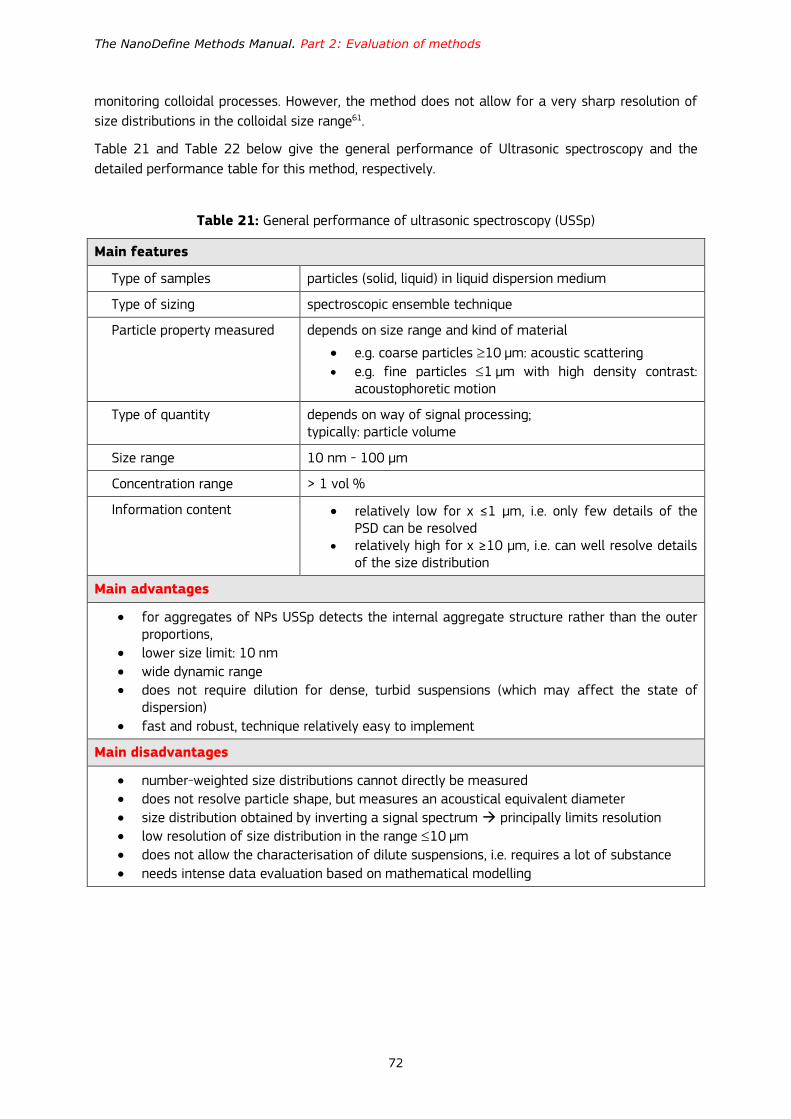
The NanoDefine Methods Manual. Part 2: Evaluation of methods
72
monitoring colloidal processes. However, the method does not allow for a very sharp resolution of
size distributions in the colloidal size range61.
Table 21 and Table 22 below give the general performance of Ultrasonic spectroscopy and the
detailed performance table for this method, respectively.
Table 21: General performance of ultrasonic spectroscopy (USSp)
Main features
Type of samples particles (solid, liquid) in liquid dispersion medium
Type of sizing spectroscopic ensemble technique
Particle property measured depends on size range and kind of material
e.g. coarse particles 10 µm: acoustic scattering
e.g. fine particles 1 µm with high density contrast: acoustophoretic motion
Type of quantity depends on way of signal processing; typically: particle volume
Size range 10 nm - 100 µm
Concentration range > 1 vol %
Information content relatively low for x ≤1 μm, i.e. only few details of the PSD can be resolved
relatively high for x ≥10 μm, i.e. can well resolve details of the size distribution
Main advantages
for aggregates of NPs USSp detects the internal aggregate structure rather than the outer proportions,
lower size limit: 10 nm
wide dynamic range
does not require dilution for dense, turbid suspensions (which may affect the state of dispersion)
fast and robust, technique relatively easy to implement
Main disadvantages
number-weighted size distributions cannot directly be measured
does not resolve particle shape, but measures an acoustical equivalent diameter
size distribution obtained by inverting a signal spectrum principally limits resolution
low resolution of size distribution in the range 10 µm
does not allow the characterisation of dilute suspensions, i.e. requires a lot of substance
needs intense data evaluation based on mathematical modelling
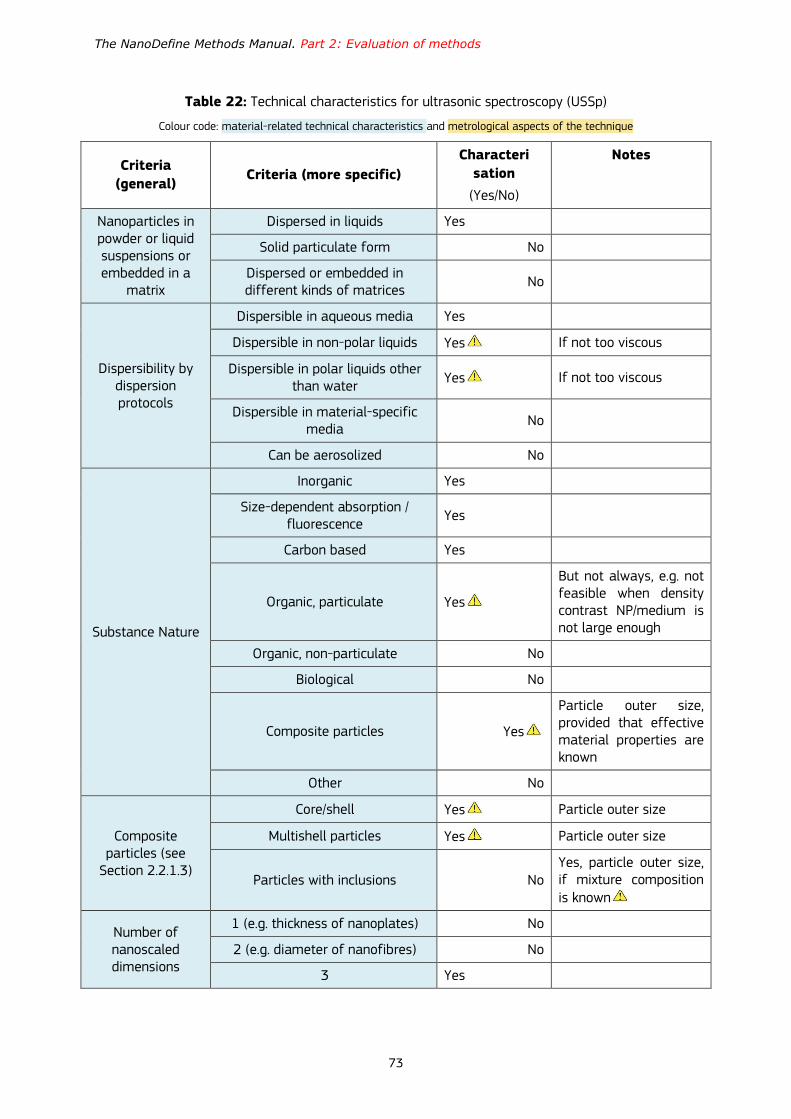
The NanoDefine Methods Manual. Part 2: Evaluation of methods
73
Table 22: Technical characteristics for ultrasonic spectroscopy (USSp)
Colour code: material-related technical characteristics and metrological aspects of the technique
Criteria
(general) Criteria (more specific)
Characteri
sation
(Yes/No)
Notes
Nanoparticles in powder or liquid suspensions or embedded in a
matrix
Dispersed in liquids Yes
Solid particulate form No
Dispersed or embedded in different kinds of matrices
No
Dispersibility by dispersion protocols
Dispersible in aqueous media Yes
Dispersible in non-polar liquids Yes If not too viscous
Dispersible in polar liquids other than water
Yes If not too viscous
Dispersible in material-specific media
No
Can be aerosolized No
Substance Nature
Inorganic Yes
Size-dependent absorption / fluorescence
Yes
Carbon based Yes
Organic, particulate Yes
But not always, e.g. not feasible when density contrast NP/medium is not large enough
Organic, non-particulate No
Biological No
Composite particles Yes
Particle outer size, provided that effective material properties are known
Other No
Composite particles (see
Section 2.2.1.3)
Core/shell Yes Particle outer size
Multishell particles Yes Particle outer size
Particles with inclusions No Yes, particle outer size, if mixture composition is known
Number of nanoscaled dimensions
1 (e.g. thickness of nanoplates) No
2 (e.g. diameter of nanofibres) No
3 Yes
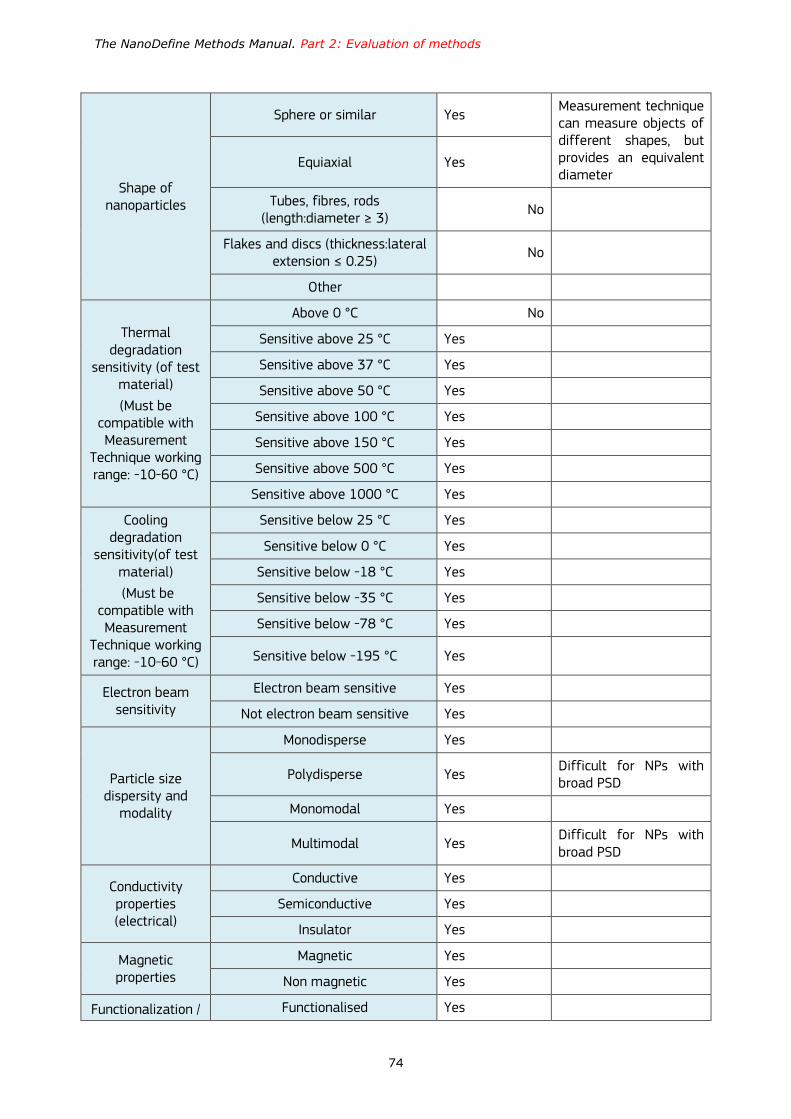
The NanoDefine Methods Manual. Part 2: Evaluation of methods
74
Shape of nanoparticles
Sphere or similar Yes Measurement technique can measure objects of different shapes, but provides an equivalent diameter
Equiaxial Yes
Tubes, fibres, rods (length:diameter ≥ 3)
No
Flakes and discs (thickness:lateral extension ≤ 0.25)
No
Other
Thermal degradation
sensitivity (of test material)
(Must be compatible with Measurement
Technique working range: -10-60 °C)
Above 0 °C No
Sensitive above 25 °C Yes
Sensitive above 37 °C Yes
Sensitive above 50 °C Yes
Sensitive above 100 °C Yes
Sensitive above 150 °C Yes
Sensitive above 500 °C Yes
Sensitive above 1000 °C Yes
Cooling degradation
sensitivity(of test material)
(Must be compatible with Measurement
Technique working range: -10-60 °C)
Sensitive below 25 °C Yes
Sensitive below 0 °C Yes
Sensitive below -18 °C Yes
Sensitive below -35 °C Yes
Sensitive below -78 °C Yes
Sensitive below -195 °C Yes
Electron beam sensitivity
Electron beam sensitive Yes
Not electron beam sensitive Yes
Particle size dispersity and
modality
Monodisperse Yes
Polydisperse Yes Difficult for NPs with broad PSD
Monomodal Yes
Multimodal Yes Difficult for NPs with broad PSD
Conductivity properties (electrical)
Conductive Yes
Semiconductive Yes
Insulator Yes
Magnetic properties
Magnetic Yes
Non magnetic Yes
Functionalization / Functionalised Yes

The NanoDefine Methods Manual. Part 2: Evaluation of methods
75
no functionalisation Not functionalised Yes
Agglomeration/ aggregation state
Nanoparticles are aggregated Yes Reflects internal lengths (e.g. pore size, inter-particle distance)
Nanoparticles are not aggregated Yes
Nanoparticles are agglomerated Yes Reflects internal lengths (e.g. pore size, inter-particle distance)
Nanoparticles are not agglomerated
Yes
Counting, fractionating or
ensemble technique
Single particle counting No
Measures or calculates number or number concentration from
fractionating techniques No
Calculates number or number concentration from spectroscopic
ensemble techniques Yes
Intrinsically: volume-weighted size distribution
Integral technique No
Used in hyphenated methods No
Working range
Size range 1 nm to 100 µm
Concentration range 2 to 70 vol.-%
Minimum needed sample amount 1 mL to 100 mL Depends on instrumentation
Linearity/proportionality
No
Yes
No, with regard to size
Yes, with regard to quantity (volume) for dilute suspensions
Limits of detection/quantification 1 nm to 50 nm Depends on density/ thermoacoustic contrast and size
Sensitivity (counting efficiency) as a function of size
N/A
Trueness of particle size
measurement
Indicate the trueness of this measurement technique
average
Size: “falseness” if wrong model parameters (e.g. viscosity, sound speed) or if too a high particle concentration (>> 10 vol.-%)

The NanoDefine Methods Manual. Part 2: Evaluation of methods
76
Trueness in weighting the size
fractions
Specify the trueness in weighting the size fractions of this measurement technique
average
Volume weights: “falseness” if frequency range too narrow or PSD too broad (low information content below 5 µm)
Robustness Specify the robustness of this
measurement technique good
Precision Specify the precision of the
measurement technique 1% to 5%
Estimate based on Dukhin et al. 201260
Resolution Specify the resolution of this
measurement technique
10% to 50%
5% to 20%
For x<10 µm
For x>10 µm
Size distribution Is it possible to measure size
distribution? Yes
Selectivity
Discrimination between NPs and non-NPs of the same composition
Yes
Discrimination between NPs and non-NPs of another composition
Yes No, if similar acoustic properties
Discrimination from NPs of another chemical composition
No
Impurities No Dissolved impurities are ignored
Identifies state of aggregation
Does the measurement technique reveal whether the measured particles are aggregated or
agglomerated?
No
However for known suspension/emulsion it is possible to recognise agglomeration from signals
Measurement of individual particles
Does this measurement technique characterise individual particles?
No
Counting constituent particles in
aggregations
Is the measurement technique able to characterise single
constituent particles in aggregates?
Yes Reflects internal lengths (e.g. pore size, inter-particle distance)
Chemical composition
Does this measurement technique analyse chemical composition?
No
Specification of the type of size
(diameter)
Specify: for example hydrodynamic…
“acoustophoretic diameter”
For inorganic particles in water (i.e. high-frequency hydrodynamic diameter) which is approx. the specific surface area
Destructive measurement
technique or not
Is it a destructive measurement technique?
No
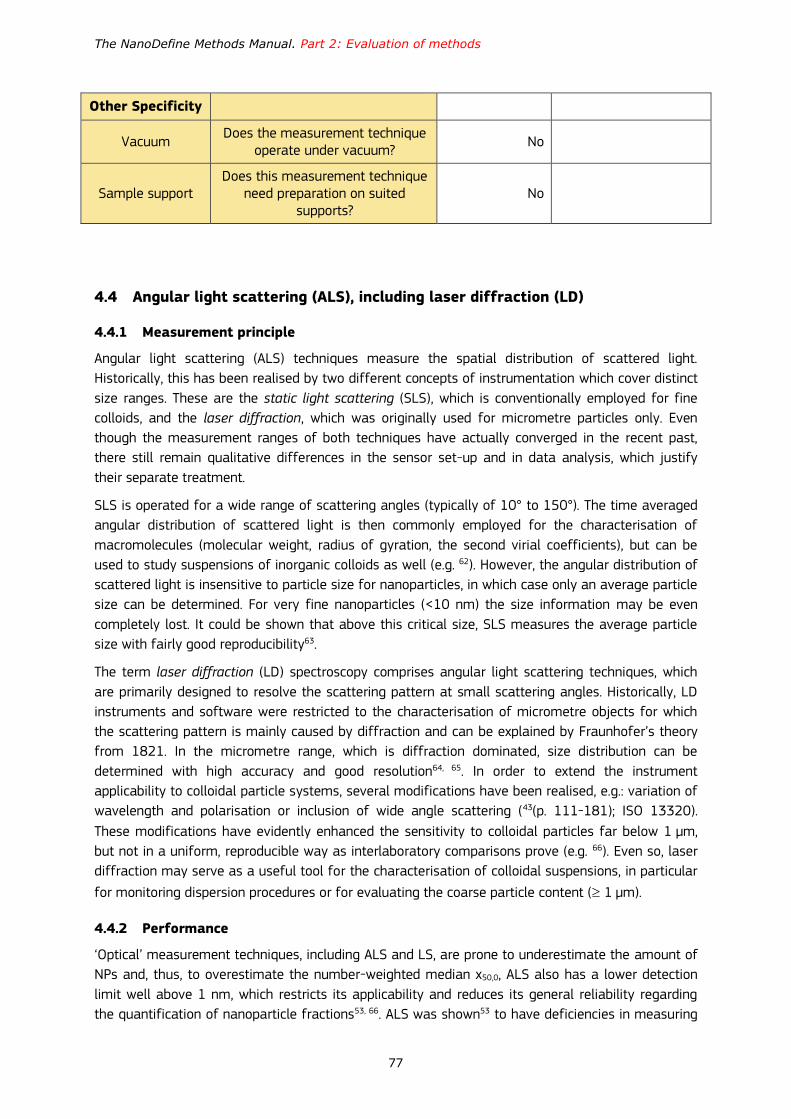
The NanoDefine Methods Manual. Part 2: Evaluation of methods
77
Other Specificity
Vacuum Does the measurement technique
operate under vacuum? No
Sample support Does this measurement technique
need preparation on suited supports?
No
4.4 Angular light scattering (ALS), including laser diffraction (LD)
4.4.1 Measurement principle
Angular light scattering (ALS) techniques measure the spatial distribution of scattered light.
Historically, this has been realised by two different concepts of instrumentation which cover distinct
size ranges. These are the static light scattering (SLS), which is conventionally employed for fine
colloids, and the laser diffraction, which was originally used for micrometre particles only. Even
though the measurement ranges of both techniques have actually converged in the recent past,
there still remain qualitative differences in the sensor set-up and in data analysis, which justify
their separate treatment.
SLS is operated for a wide range of scattering angles (typically of 10° to 150°). The time averaged
angular distribution of scattered light is then commonly employed for the characterisation of
macromolecules (molecular weight, radius of gyration, the second virial coefficients), but can be
used to study suspensions of inorganic colloids as well (e.g. 62). However, the angular distribution of
scattered light is insensitive to particle size for nanoparticles, in which case only an average particle
size can be determined. For very fine nanoparticles (<10 nm) the size information may be even
completely lost. It could be shown that above this critical size, SLS measures the average particle
size with fairly good reproducibility63.
The term laser diffraction (LD) spectroscopy comprises angular light scattering techniques, which
are primarily designed to resolve the scattering pattern at small scattering angles. Historically, LD
instruments and software were restricted to the characterisation of micrometre objects for which
the scattering pattern is mainly caused by diffraction and can be explained by Fraunhofer’s theory
from 1821. In the micrometre range, which is diffraction dominated, size distribution can be
determined with high accuracy and good resolution64, 65. In order to extend the instrument
applicability to colloidal particle systems, several modifications have been realised, e.g.: variation of
wavelength and polarisation or inclusion of wide angle scattering (43(p. 111-181); ISO 13320).
These modifications have evidently enhanced the sensitivity to colloidal particles far below 1 μm,
but not in a uniform, reproducible way as interlaboratory comparisons prove (e.g. 66). Even so, laser
diffraction may serve as a useful tool for the characterisation of colloidal suspensions, in particular
for monitoring dispersion procedures or for evaluating the coarse particle content ( 1 µm).
4.4.2 Performance
‘Optical’ measurement techniques, including ALS and LS, are prone to underestimate the amount of
NPs and, thus, to overestimate the number-weighted median x50,0, ALS also has a lower detection
limit well above 1 nm, which restricts its applicability and reduces its general reliability regarding
the quantification of nanoparticle fractions53, 66. ALS was shown53 to have deficiencies in measuring
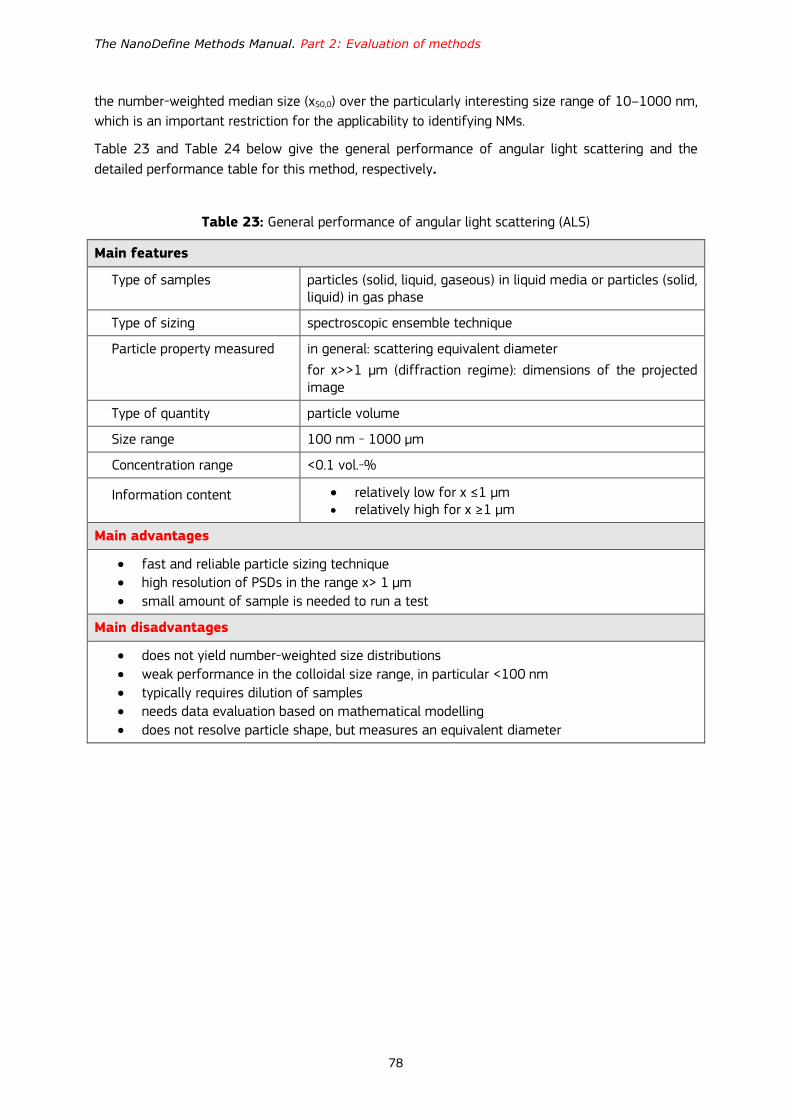
The NanoDefine Methods Manual. Part 2: Evaluation of methods
78
the number-weighted median size (x50,0) over the particularly interesting size range of 10–1000 nm,
which is an important restriction for the applicability to identifying NMs.
Table 23 and Table 24 below give the general performance of angular light scattering and the
detailed performance table for this method, respectively.
Table 23: General performance of angular light scattering (ALS)
Main features
Type of samples particles (solid, liquid, gaseous) in liquid media or particles (solid, liquid) in gas phase
Type of sizing spectroscopic ensemble technique
Particle property measured in general: scattering equivalent diameter
for x>>1 µm (diffraction regime): dimensions of the projected image
Type of quantity particle volume
Size range 100 nm - 1000 µm
Concentration range <0.1 vol.-%
Information content relatively low for x ≤1 μm relatively high for x ≥1 μm
Main advantages
fast and reliable particle sizing technique
high resolution of PSDs in the range x> 1 µm
small amount of sample is needed to run a test
Main disadvantages
does not yield number-weighted size distributions
weak performance in the colloidal size range, in particular <100 nm
typically requires dilution of samples
needs data evaluation based on mathematical modelling
does not resolve particle shape, but measures an equivalent diameter
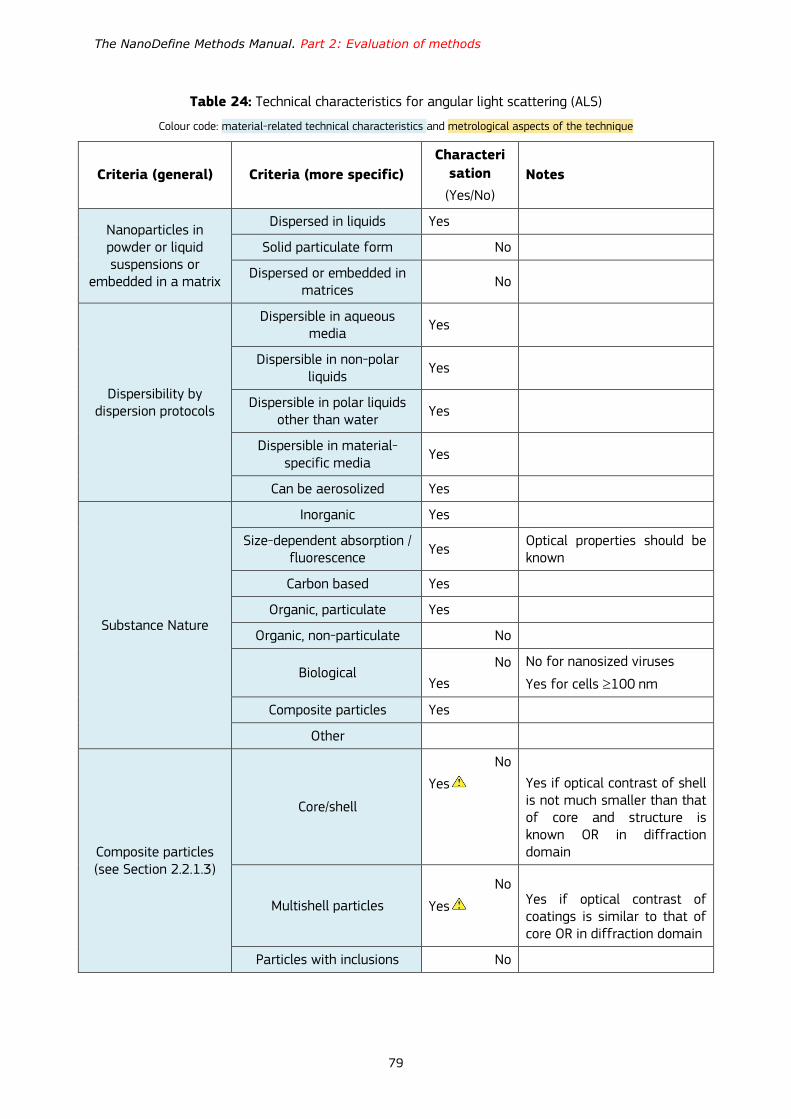
The NanoDefine Methods Manual. Part 2: Evaluation of methods
79
Table 24: Technical characteristics for angular light scattering (ALS)
Colour code: material-related technical characteristics and metrological aspects of the technique
Criteria (general) Criteria (more specific)
Characteri
sation
(Yes/No)
Notes
Nanoparticles in powder or liquid suspensions or
embedded in a matrix
Dispersed in liquids Yes
Solid particulate form No
Dispersed or embedded in matrices
No
Dispersibility by dispersion protocols
Dispersible in aqueous media
Yes
Dispersible in non-polar liquids
Yes
Dispersible in polar liquids other than water
Yes
Dispersible in material-specific media
Yes
Can be aerosolized Yes
Substance Nature
Inorganic Yes
Size-dependent absorption / fluorescence
Yes Optical properties should be known
Carbon based Yes
Organic, particulate Yes
Organic, non-particulate No
Biological No
Yes
No for nanosized viruses
Yes for cells 100 nm
Composite particles Yes
Other
Composite particles (see Section 2.2.1.3)
Core/shell
No
Yes
Yes if optical contrast of shell is not much smaller than that of core and structure is known OR in diffraction domain
Multishell particles
No
Yes
Yes if optical contrast of coatings is similar to that of core OR in diffraction domain
Particles with inclusions No
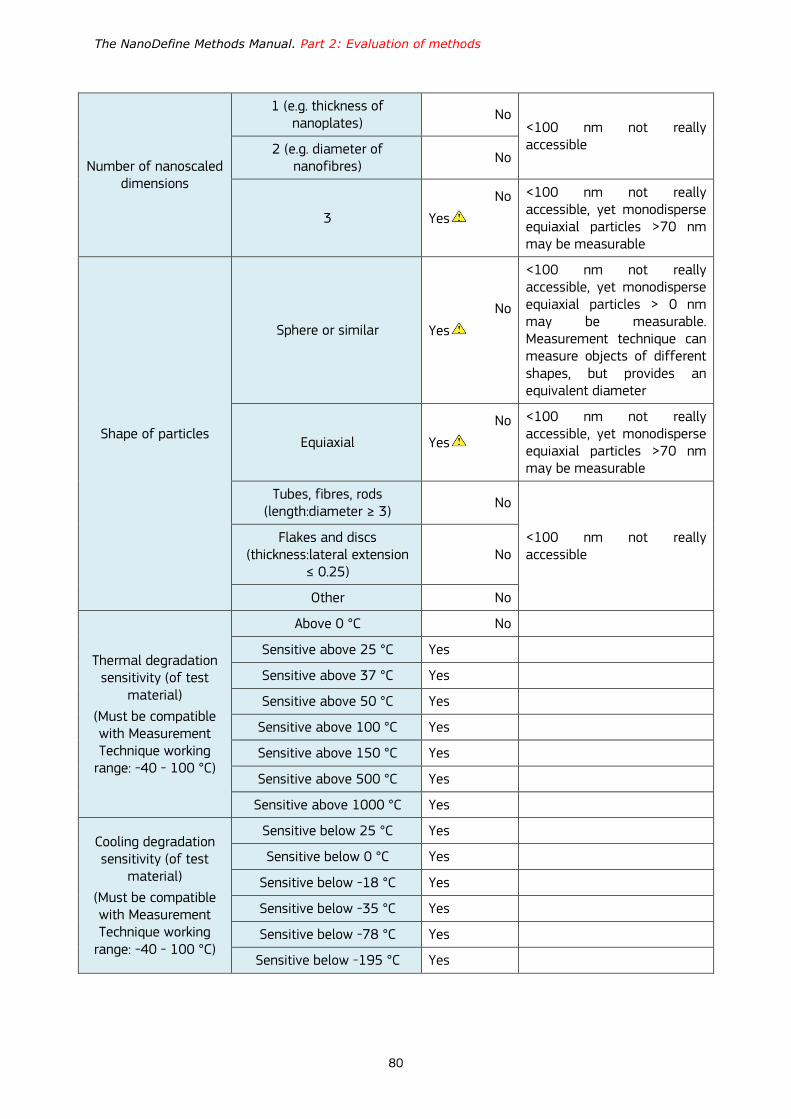
The NanoDefine Methods Manual. Part 2: Evaluation of methods
80
Number of nanoscaled dimensions
1 (e.g. thickness of nanoplates)
No <100 nm not really accessible 2 (e.g. diameter of
nanofibres) No
3
No
Yes
<100 nm not really accessible, yet monodisperse equiaxial particles >70 nm may be measurable
Shape of particles
Sphere or similar
No
Yes
<100 nm not really accessible, yet monodisperse equiaxial particles > 0 nm may be measurable. Measurement technique can measure objects of different shapes, but provides an equivalent diameter
Equiaxial
No
Yes
<100 nm not really accessible, yet monodisperse equiaxial particles >70 nm may be measurable
Tubes, fibres, rods (length:diameter ≥ 3)
No
<100 nm not really accessible
Flakes and discs (thickness:lateral extension
≤ 0.25) No
Other No
Thermal degradation sensitivity (of test
material)
(Must be compatible with Measurement Technique working
range: -40 - 100 °C)
Above 0 °C No
Sensitive above 25 °C Yes
Sensitive above 37 °C Yes
Sensitive above 50 °C Yes
Sensitive above 100 °C Yes
Sensitive above 150 °C Yes
Sensitive above 500 °C Yes
Sensitive above 1000 °C Yes
Cooling degradation sensitivity (of test
material)
(Must be compatible with Measurement Technique working
range: -40 - 100 °C)
Sensitive below 25 °C Yes
Sensitive below 0 °C Yes
Sensitive below -18 °C Yes
Sensitive below -35 °C Yes
Sensitive below -78 °C Yes
Sensitive below -195 °C Yes
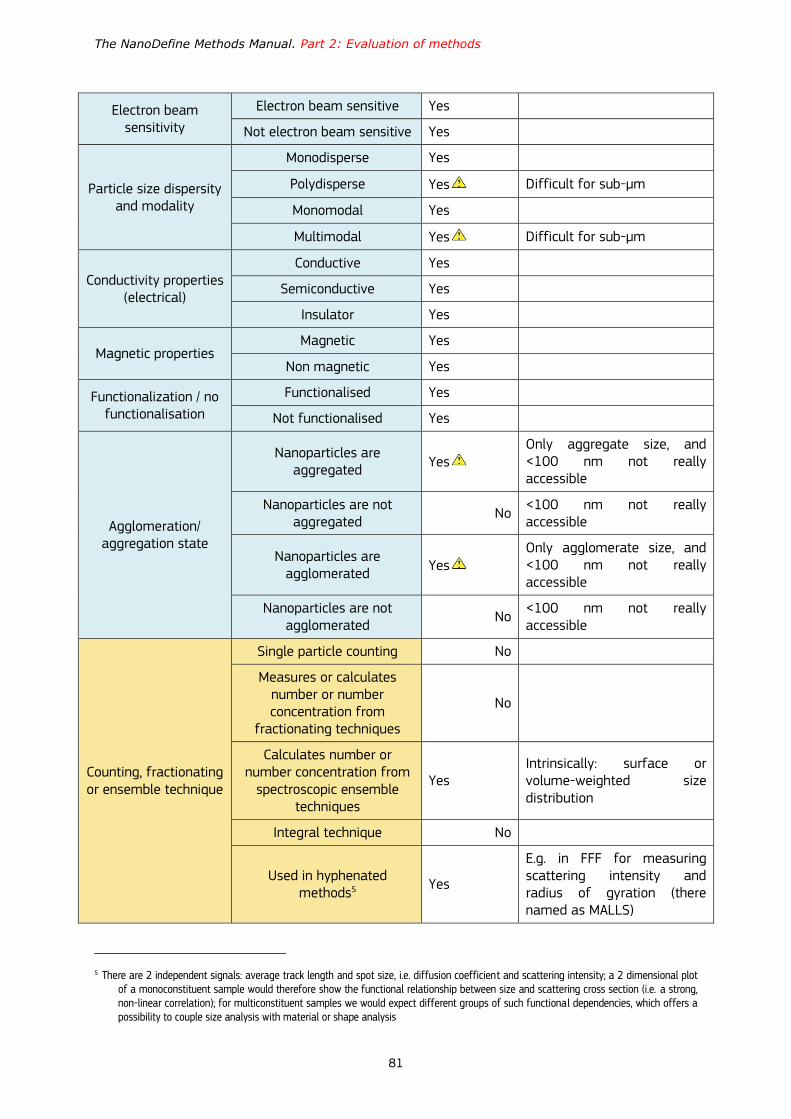
The NanoDefine Methods Manual. Part 2: Evaluation of methods
81
Electron beam sensitivity
Electron beam sensitive Yes
Not electron beam sensitive Yes
Particle size dispersity and modality
Monodisperse Yes
Polydisperse Yes Difficult for sub-µm
Monomodal Yes
Multimodal Yes Difficult for sub-µm
Conductivity properties (electrical)
Conductive Yes
Semiconductive Yes
Insulator Yes
Magnetic properties Magnetic Yes
Non magnetic Yes
Functionalization / no functionalisation
Functionalised Yes
Not functionalised Yes
Agglomeration/ aggregation state
Nanoparticles are aggregated
Yes Only aggregate size, and <100 nm not really accessible
Nanoparticles are not aggregated
No <100 nm not really accessible
Nanoparticles are agglomerated
Yes Only agglomerate size, and <100 nm not really accessible
Nanoparticles are not agglomerated
No <100 nm not really accessible
Counting, fractionating or ensemble technique
Single particle counting No
Measures or calculates number or number concentration from
fractionating techniques
No
Calculates number or number concentration from
spectroscopic ensemble techniques
Yes Intrinsically: surface or volume-weighted size distribution
Integral technique No
Used in hyphenated methods5
Yes
E.g. in FFF for measuring scattering intensity and radius of gyration (there named as MALLS)
5 There are 2 independent signals: average track length and spot size, i.e. diffusion coefficient and scattering intensity; a 2 dimensional plot of a monoconstituent sample would therefore show the functional relationship between size and scattering cross section (i.e. a strong, non-linear correlation); for multiconstituent samples we would expect different groups of such functional dependencies, which offers a possibility to couple size analysis with material or shape analysis

The NanoDefine Methods Manual. Part 2: Evaluation of methods
82
Working range
Size range 70 nm to 10
mm
Range dependent on instrument type, <100 nm only mean size
Concentration range 0.0001 to 0.1 vol.-%
The concentration should be adjusted so that „obscuration“ lies within 2% to 20%
Minimum needed sample amount
10 μL to 50 mL
Depends on instrumentation
Linearity/proportionality
No
Yes
No, with regard to size
Yes with regard to concentration (total intensity)
Limits of detection/quantification
50 nm to 100 nm
Depends on optical contrast and size
Sensitivity (counting efficiency) as a function of
particle size good
Insensitive to very fine particles (weak scattering signal) and very coarse particles (which mainly scatter in forward direction)
Trueness of particle size measurement
Indicate the trueness of this measurement technique in measuring the particle size
average
Size: “falseness” if wrong model parameters (e.g. refractive index, wavelength) or if too a high concentration (multiple scattering)
Trueness in weighting the size fractions
Specify the trueness in weighting the size fractions
by this measurement technique
average Intensity weights: “falseness” if multiple scattering or if too high laser intensities
Robustness Specify the robustness of
this measurement technique good
Precision Specify the precision of the
measurement technique 0.1% to 2% For x50,3
Resolution Specify the size resolution
of this measurement technique
10% to 50%
10% to 20%
For x <1 µm
For x >1 µm
Size distribution Is it possible to measure particle size distribution?
Yes
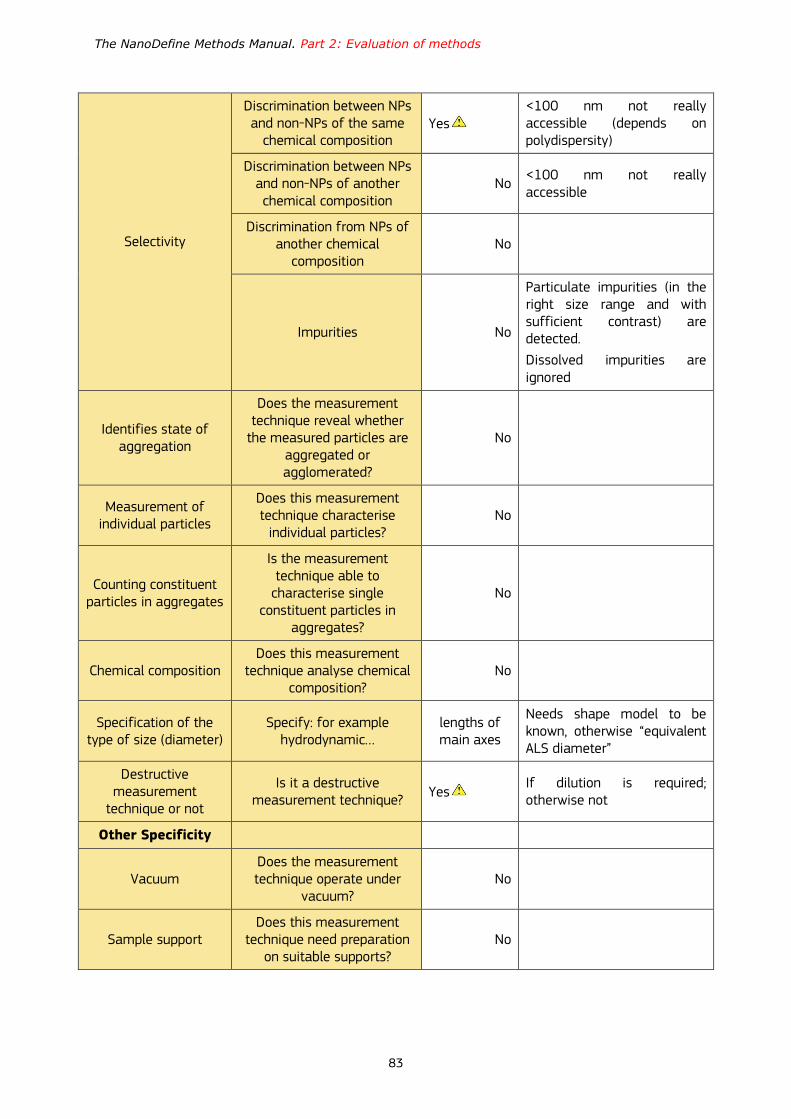
The NanoDefine Methods Manual. Part 2: Evaluation of methods
83
Selectivity
Discrimination between NPs and non-NPs of the same
chemical composition Yes
<100 nm not really accessible (depends on polydispersity)
Discrimination between NPs and non-NPs of another chemical composition
No <100 nm not really accessible
Discrimination from NPs of another chemical
composition No
Impurities No
Particulate impurities (in the right size range and with sufficient contrast) are detected.
Dissolved impurities are ignored
Identifies state of aggregation
Does the measurement technique reveal whether
the measured particles are aggregated or agglomerated?
No
Measurement of individual particles
Does this measurement technique characterise
individual particles? No
Counting constituent particles in aggregates
Is the measurement technique able to
characterise single constituent particles in
aggregates?
No
Chemical composition Does this measurement
technique analyse chemical composition?
No
Specification of the type of size (diameter)
Specify: for example hydrodynamic…
lengths of main axes
Needs shape model to be known, otherwise “equivalent ALS diameter”
Destructive measurement
technique or not
Is it a destructive measurement technique?
Yes If dilution is required; otherwise not
Other Specificity
Vacuum Does the measurement technique operate under
vacuum? No
Sample support Does this measurement
technique need preparation on suitable supports?
No
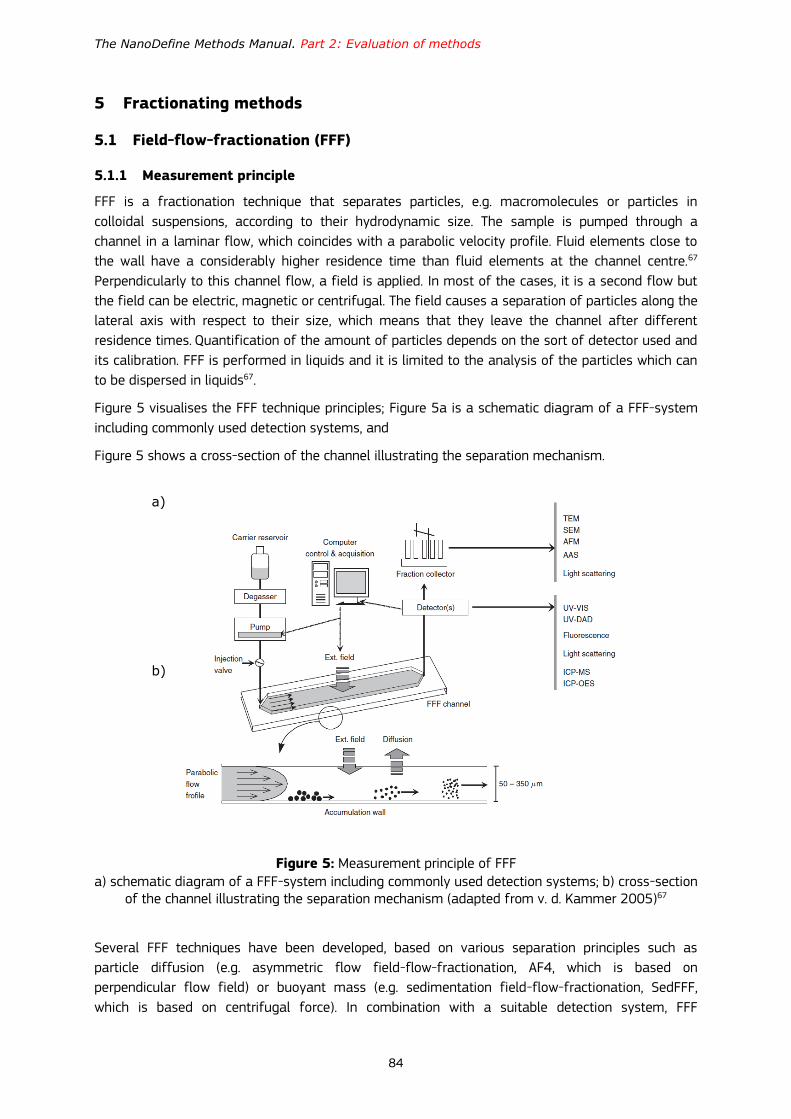
The NanoDefine Methods Manual. Part 2: Evaluation of methods
84
5 Fractionating methods
5.1 Field-flow-fractionation (FFF)
5.1.1 Measurement principle
FFF is a fractionation technique that separates particles, e.g. macromolecules or particles in
colloidal suspensions, according to their hydrodynamic size. The sample is pumped through a
channel in a laminar flow, which coincides with a parabolic velocity profile. Fluid elements close to
the wall have a considerably higher residence time than fluid elements at the channel centre.67
Perpendicularly to this channel flow, a field is applied. In most of the cases, it is a second flow but
the field can be electric, magnetic or centrifugal. The field causes a separation of particles along the
lateral axis with respect to their size, which means that they leave the channel after different
residence times. Quantification of the amount of particles depends on the sort of detector used and
its calibration. FFF is performed in liquids and it is limited to the analysis of the particles which can
to be dispersed in liquids67.
Figure 5 visualises the FFF technique principles; Figure 5a is a schematic diagram of a FFF-system
including commonly used detection systems, and
Figure 5 shows a cross-section of the channel illustrating the separation mechanism.
Figure 5: Measurement principle of FFF a) schematic diagram of a FFF-system including commonly used detection systems; b) cross-section
of the channel illustrating the separation mechanism (adapted from v. d. Kammer 2005)67
Several FFF techniques have been developed, based on various separation principles such as
particle diffusion (e.g. asymmetric flow field-flow-fractionation, AF4, which is based on
perpendicular flow field) or buoyant mass (e.g. sedimentation field-flow-fractionation, SedFFF,
which is based on centrifugal force). In combination with a suitable detection system, FFF
a)
b)

The NanoDefine Methods Manual. Part 2: Evaluation of methods
85
techniques enable us to derive particle size or molecular mass from sample specific properties, such
as particle diffusion. The separation concept of all FFF techniques is similar, as described above.
NanoDefine analysed in particular AF4 separation, during which a force drives the sample (i.e.
dissolved and particulate components) towards the accumulation wall that is covered by an
ultrafiltration membrane which is permeable for components smaller than the cut-off of the
membrane. Components which are retained in the channel, will be distributed in the channel profile
according to their diffusional properties (i.e. size), and as described above, depending on these
properties the particles will experience different laminar flows resulting in a separation according to
their hydrodynamic size. The separated sample is detected online by a suitable detector; the
combination studied in NanoDefine was AF4-LS, asymmetric flow field flow fractionation –light
scattering.
5.1.2 Performance
FFF separation methods provide a robust technique to separate particles according to their size or
molecular mass. Together with a subsequent detection technique, FFF can provide distributions of
both physical and chemical properties.
Current limits of application include:
particle size determined by FFF is always an equivalent spherical particle diameter. Thus, values obtained for non-spherical particles from different sub-techniques will differ from each other,
in case of ideal conditions in AF4 only diffusional properties of the sample affect the separation. However, in practice, completely ideal conditions cannot be achieved. Therefore, particle sizing might be affected by a number of potentially interfering instrumental factors. It has to be emphasized that optimization of the run conditions for both size standard and sample have to be performed rigorously until behaviour close to ideal elution is achieved,
for SedFFF no size calibration is required. For size determination the knowledge of buoyant mass of the particle sample is required.
Table 25 and

The NanoDefine Methods Manual. Part 2: Evaluation of methods
86
Table 26 below give the general performance of field-flow-fractionation and the detailed
performance table for this method, respectively.
Table 25: General performance of field-flow-fractionation (FFF)
Main features
Type of samples particles (solid, liquid) in liquid dispersion medium
Type of sizing fractionating technique
Particle property measured a) FFF with concentration detectors
dependent on applied field,
e.g. FlowFFF: particle diffusion coefficient (equivalent diameter : hydrodynamic / mobility diameter)
b) FFF with concentration and size detectors
dependent on size measurement behind FFF unit
e.g. MALLS: radius of gyration, DLS: apparent hydrodynamic diameter
Type of quantity detector dependent:
UV/VIS: extinction (turbidity), for transparent nanoparticles ~ squared particle volume, for light-absorbing nanoparticles ~ particle volume
fluorescence: particle mass concentration if particle is fluorescing,
MALLS intensity of scattered light;
ICP-MS element mass concentration (element must be constituent of the particle and stoichiometry known);
if counting detectors are used, particle number concentrations can be determined (e.g. spICP-MS)
Size range in general 1-1000 nm. Instrumental settings need to be tuned for the size range of interest, dynamic range (ratio of upper to lower measurable diameter) is typically 20 – 40
Concentration range adjustable, case-specific, the minimum and maximum acceptable concentration depends strongly on the sample characteristics, the size range and applied detector
Information content relatively high, i.e. can well resolve details of the size distribution
for AF4: diffusion coefficient, hydrodynamic radius;
for Sedimentation FFF: volumetric radius
further information depending on coupled detector, e.g. - light scattering (SLS): root-mean-square (rms)-radius
and geometric radius, intensity-weighted size distribution
- ICP-MS: chemical composition, mass concentration, mass-based size distribution)
- UV/DAD: indicator for chemical composition (element specific wavelength absorption and surface plasmon resonance)
Main advantages

The NanoDefine Methods Manual. Part 2: Evaluation of methods
87
physical separation of particles: can operate on complex mixtures and matrices
element specific: can operate on complex mixtures and matrices
coupling of FFF with arbitrary techniques for size and concentration measurement principally allows a comprehensive analysis with respect to sample chemical composition and particle shape
Main disadvantages
typically: number-weighted size distribution Q0 cannot directly be measured.
does not resolve particle shape, but measures a hydrodynamic/mobility equivalent diameter,
measures aggregate size rather than size of constituent particles
lower size limit depends on detectors, design of the FFF unit and parameters of operation
limited dynamic range (different elution regimes for different particle sizes)
high efforts for preparing FFF unit and sample
operators require high level of proficiency
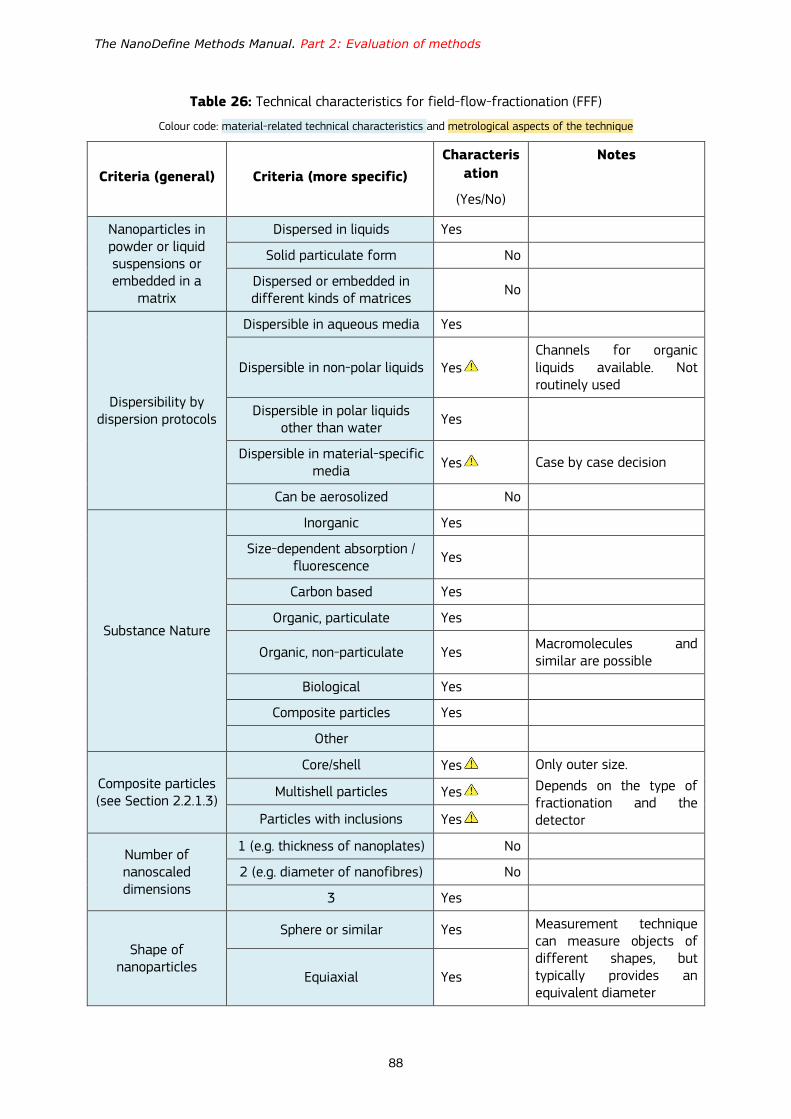
The NanoDefine Methods Manual. Part 2: Evaluation of methods
88
Table 26: Technical characteristics for field-flow-fractionation (FFF)
Colour code: material-related technical characteristics and metrological aspects of the technique
Criteria (general) Criteria (more specific)
Characteris
ation
(Yes/No)
Notes
Nanoparticles in powder or liquid suspensions or embedded in a
matrix
Dispersed in liquids Yes
Solid particulate form No
Dispersed or embedded in different kinds of matrices
No
Dispersibility by dispersion protocols
Dispersible in aqueous media Yes
Dispersible in non-polar liquids Yes Channels for organic liquids available. Not routinely used
Dispersible in polar liquids other than water
Yes
Dispersible in material-specific media
Yes Case by case decision
Can be aerosolized No
Substance Nature
Inorganic Yes
Size-dependent absorption / fluorescence
Yes
Carbon based Yes
Organic, particulate Yes
Organic, non-particulate Yes Macromolecules and similar are possible
Biological Yes
Composite particles Yes
Other
Composite particles (see Section 2.2.1.3)
Core/shell Yes Only outer size.
Depends on the type of fractionation and the detector
Multishell particles Yes
Particles with inclusions Yes
Number of nanoscaled dimensions
1 (e.g. thickness of nanoplates) No
2 (e.g. diameter of nanofibres) No
3 Yes
Shape of nanoparticles
Sphere or similar Yes Measurement technique can measure objects of different shapes, but typically provides an equivalent diameter
Equiaxial Yes
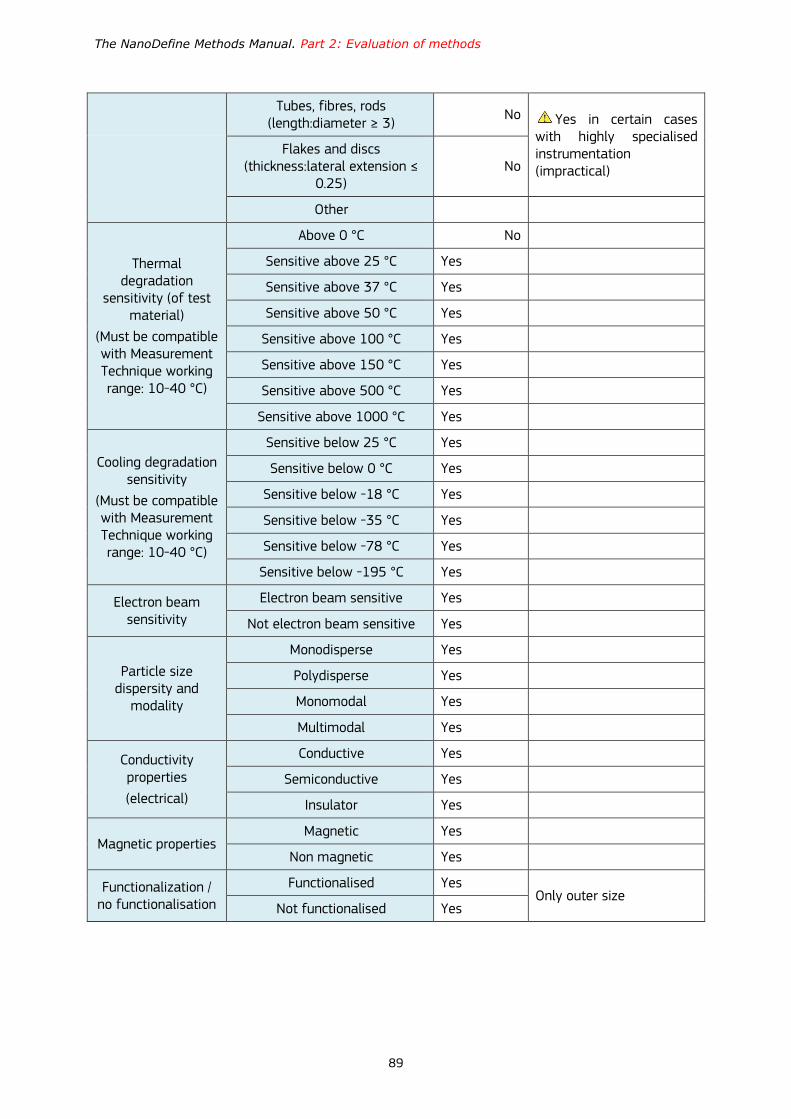
The NanoDefine Methods Manual. Part 2: Evaluation of methods
89
Tubes, fibres, rods (length:diameter ≥ 3)
No Yes in certain cases with highly specialised instrumentation (impractical)
Flakes and discs (thickness:lateral extension ≤
0.25) No
Other
Thermal degradation
sensitivity (of test material)
(Must be compatible with Measurement Technique working range: 10-40 °C)
Above 0 °C No
Sensitive above 25 °C Yes
Sensitive above 37 °C Yes
Sensitive above 50 °C Yes
Sensitive above 100 °C Yes
Sensitive above 150 °C Yes
Sensitive above 500 °C Yes
Sensitive above 1000 °C Yes
Cooling degradation sensitivity
(Must be compatible with Measurement Technique working range: 10-40 °C)
Sensitive below 25 °C Yes
Sensitive below 0 °C Yes
Sensitive below -18 °C Yes
Sensitive below -35 °C Yes
Sensitive below -78 °C Yes
Sensitive below -195 °C Yes
Electron beam sensitivity
Electron beam sensitive Yes
Not electron beam sensitive Yes
Particle size dispersity and
modality
Monodisperse Yes
Polydisperse Yes
Monomodal Yes
Multimodal Yes
Conductivity properties
(electrical)
Conductive Yes
Semiconductive Yes
Insulator Yes
Magnetic properties Magnetic Yes
Non magnetic Yes
Functionalization / no functionalisation
Functionalised Yes Only outer size
Not functionalised Yes

The NanoDefine Methods Manual. Part 2: Evaluation of methods
90
Agglomeration/ aggregation state
Nanoparticles are aggregated Yes Only aggregate size
Nanoparticles are not aggregated
Yes
Nanoparticles are agglomerated
Yes Only agglomerate size
Nanoparticles are not agglomerated
Yes
Counting, fractionating or
ensemble technique
Single particle counting No
Measures or calculates number or number concentration from
fractionating techniques Yes
Yes in special FFF-setups with a detection system that counts particles of narrow fractions provided by FFF
Calculates number or number concentration from
spectroscopic ensemble techniques
No
Integral technique No
Used in hyphenated methods Yes
Intrinsically hyphenated as fractionation and detection are locally separated, e.g. FFF+UV/VIS+MALS+spICP-MS
Working range
Size range 1 - 1000 nm Depending on the detector and type of field, e.g. AF4-MALS: 3 nm to 1000 nm
Concentration range 20 µg/L – 500 mg/L
Depending on the detector
Minimum needed sample amount
10 µL
Linearity/proportionality
Size: No (for diffusion, volume, settling velocity or MALS)
Quantity: Yes for light scattering. No for extinction -since measured via transmission
Depending on detector

The NanoDefine Methods Manual. Part 2: Evaluation of methods
91
Limits of detection/quantification
1-10 nm Depending on detector
Sensitivity (counting efficiency) as a function of size
good Detector dependent
Trueness of particle size measurement
Indicate the trueness of this measurement technique
average If reference materials available
Trueness in weighting the size
fractions
Specify the trueness in weighting the size fractions of this measurement technique
excellent Mass quantification if performed by mass specific detector
Robustness Specify the robustness of this
measurement technique good
Important parameter is the membrane quality
Precision Specify the precision of the
measurement technique 1 nm to 10
nm
Resolution Specify the resolution of this
measurement technique 1 nm to 10
nm
Size distribution Is it possible to measure size
distribution? Yes
Selectivity
Discrimination between NPs and non-NPs of the same
chemical composition Yes
Pre-treatment of the sample is necessary6
Discrimination between NPs and non-NPs of another chemical composition
No
Yes
Pre-treatment of the sample is necessary6. Depends on detection technique
Discrimination from NPs of another chemical composition
Yes Depends on detection technique
Impurities
Depends on the detector.
Dissolved impurities are ignored
Identifies state of aggregation
Does the measurement technique reveal whether the
measured particles are aggregated or agglomerated?
No
Measurement of individual particles
Does this measurement technique characterise
individual particles? No
6 Pretreatment of the sample is necessary because of an steric effect combined with a hydrodynamic lift effect; both phenomena push coarse particles back in the channel centre and cause them to leave the channel together with fine, rapidly diffusing particles; ‘coarse’ depends on the specific conditions of operation, but typically we talk about particles > 0.5 µm

The NanoDefine Methods Manual. Part 2: Evaluation of methods
92
Counting constituent particles in
aggregations
Is the measurement technique able to characterise single
constituent particles in aggregates?
No
Chemical composition
Does this measurement technique analyse chemical
composition? N/A
For chemical analysis the FFF needs to be coupled to ICP-MS or ICP-OES
Specification of the type of size (diameter)
Specify: for example hydrodynamic…
Hydrodynamic diameter
Diffusion coefficient (FlowFFF) hydrodynamic diameter can be derived, volumetric diameter (SedFFF or CFFF). In few cases when MALS is applicable also root-mean-square and geometrical diameter, respectively
Destructive measurement
technique or not
Is it a destructive measurement technique?
No Fractions can be collected for the case that sample was not diluted
Other Specificity
Vacuum Does the measurement technique operate under
vacuum? No
Sample support Does this measurement
technique need preparation on suited supports?
No
5.2 Analytical centrifugation (AC)
5.2.1 Measurement principle
Analytical centrifugation (AC) techniques employ the principle of particle migration in a viscous fluid
under influence of a centrifugal force. This leads to variations in the local particle concentration
when measured along the settling path and/or over time. Settling distance and settling time
correspond to the terminal settling velocity, which in the case of isolated particles solely depends on
their individual size, shape, and density. Hence, concentration profiles or time curves reflect the size
distribution of the particle system.
Analytical centrifugation is realised in disc-centrifuges, cuvette centrifuges and analytical
ultracentrifuge (i.e. cuvette centrifuges with extremely high centrifugal accelerations up to 106 g).
The sedimentation process can be monitored by means of (spectral) light and X-ray extinction or via
the interferometric measurement of the refractive index (RI). Cuvette and ultracentrifuges are
operated in the “homogenous” mode, where the particles are homogenously distributed in the
cuvette before measurement. Disc centrifuges also allow this mode of operation, yet are frequently
operated in the “line-start” mode, where a thin strap of suspension is added on particle-free solvent
with density gradient. This variety of centrifuges, detection systems and modes of operations
makes it difficult to provide general answers on the specification. This report is restricted to disc

The NanoDefine Methods Manual. Part 2: Evaluation of methods
93
and cuvette centrifuges with light extinction measurement (discAc-turb, cuvAC-turb) and to
ultracentrifuges with refractive index measurement (AUC-RI).
Figure 6: Schematic diagram of an AC cuvette centrifuge system
Disc centrifuges consist of a hollow disc which contains the suspension medium. Upon rotation, the
liquid forms a stagnant layer on which a thin layer of the particle system is injected (line-start
technique). The particles migrate according to their settling velocity to the outer diameter of the
disc. All particles of a certain size (or settling velocity) move in a narrow band with growing distance
from the initial position. In the case of multidisperse particle systems, one can observe several of
such bands in analogy to chromatographic techniques. The radial concentration profile is, hence, a
distorted projection of the density function of the size distribution (q(xStokes)). The line-start
technique requires a density gradient in the suspension medium (e.g. by sugar) before the particles
are injected; otherwise, there would be a convective transport of particles within strands of the
(heavy) suspension layer. The density gradient sets some practical limits to the measurement (e.g.
duration) and has to be calibrated before conducting size measurements.
A different set-up and mode of operation is found in cuvette centrifuges, where the particle
sedimentation is observed in small cuvettes that are fixed on a rotating table. In this case, the
particles are homogeneously suspended in the continuous phase before the centrifugation starts
(homogeneous technique which is schematically presented, see Figure 6). During the centrifugation,
all particles migrate towards the bottom of the cuvette, which results in the formation of a
sediment, in a continuous decline of local particle concentrations above the sediment, and in a
monotonous decrease of particle concentration in the direction from the sediment to the meniscus.
The two types of variation in particle concentration, the temporal evolution, and the radial profile,
can be considered as distorted projections of the cumulative function of the particle size distribution
(Q(xStokes)). The cuvette centrifuge was introduced by Svedberg and co-workers68,69. They called the
instrument "ultra-centrifuge". Nowadays the term “Analytical Ultracentrifugation” (AUC) is only used
for centrifugal accelerations above 100,000g.
The NanoDefine Methods Manual. Part 2: Evaluation of methods
94
Apart from the centrifuge type, instruments differ with regard to the measurement of particle
concentration. The most important principles are:
optical extinction (photocentrifuge), which yields volume-weighted size distributions (q3) for light-absorbing nanoparticles and intensity-weighted size distribution for non-absorbing nanoparticles (q6);
X-ray absorption (X-ray centrifuge), which always yields volume weighted size distributions (q3);
refractive index determination by interferometry, which (approximately) yields volume-weighted size distributions for nanoparticles (q3).
Last but not least it should be mentioned that the AUC usually employs a set of different detection
systems.
5.2.2 Performance
The AC technique is applicable to both suspensions and powders that can be suspended in liquids.
All type pf materials (organic, inorganic) can be measured, however the effective density of
particles must be different from the density of the dispersing liquid. Most instruments require that
the particle density is higher than the density of water, which can make the measurement of
organic particles difficult (note that some instruments also allow measurement of particles with a
lower density than the surrounding liquid). The effective density of all particles must be
homogenous and known before measurements. Sample preparation and the stability of the
suspension are of key importance for the reliability of the measurements. The technique can
measure particles below 10 nm but it measures the size of aggregates/agglomerates rather than
constituent particles. The technique does not measure actual external dimensions but gives the
diameter of an equivalent spheres, i.e. spheres that sediment as fast as the particles measured. It
does not provide number-based particle size distribution within acceptable limits of uncertainty.
Table 27 and Table 28 below give the general performance of analytical centrifugation and the
detailed performance table for this method, respectively.
Table 27: General Performance of analytical centrifugation (AC)
Main features
Type of samples particles (solid, liquid, gaseous) in liquid dispersion medium
Type of sizing fractionating technique
Particle property measured
settling velocity
equivalent diameter:
Stokes diameter determined from settling velocity and skeletal density, or
hydrodynamic diameter from settling velocity and the effective particle density (used for compact aggregates)
Type of quantity dependent on detector
solid volume by X-ray, refractive index or turbidity measurement of light-absorbing nano-particles (q3)
squared solid volume by turbidity measurement non-absorbing nano-particles (q6)
for non-nanoparticles the physical quantity should be stated (e.g. extinction)

The NanoDefine Methods Manual. Part 2: Evaluation of methods
95
Size range < 5 nm - 10 µm with minimum depending on particle density
Concentration range ≤ 0.1 wt.%
Information content relatively high, i.e. can well resolve details of the size distribution
Main advantages
lower size limit < 10 nm
good resolution of particle size distribution (for discAC even high resolution)
in principle wide dynamic range
rapid screening
Main disadvantages
number-weighted size distribution Q0 cannot directly be measured
does not resolve particle shape, but measures a settling velocity equivalent diameter (i.e. Stokes diameter), non-spherical particle geometry will introduce errors
measures aggregate size rather than size of constituent particles
only discAC: limited dynamic range - needs a balance between sedimentation rate (depending on particle size), density of gradient and centrifugal speed.
Table 28: Technical characteristics of analytical centrifugation (AC)
Colour code: material-related technical characteristics and metrological aspects of the technique
Criteria (general) Criteria (more specific)
Characteri
sation
(Yes/No)
Notes
Nanoparticles in powder or liquid suspensions or embedded in a
matrix
Dispersed in liquids Yes
Solid particulate form No
Dispersed or embedded in different kinds of matrices
No
Dispersibility by dispersion protocols
Dispersible in aqueous media Yes
Dispersible in non-polar liquids Yes Depending on compatibility of liquid with instrument
Dispersible in polar liquids other than water
Yes
Dispersible in material-specific media
Yes Depending on compatibility of liquid with instrument
Can be aerosolized No
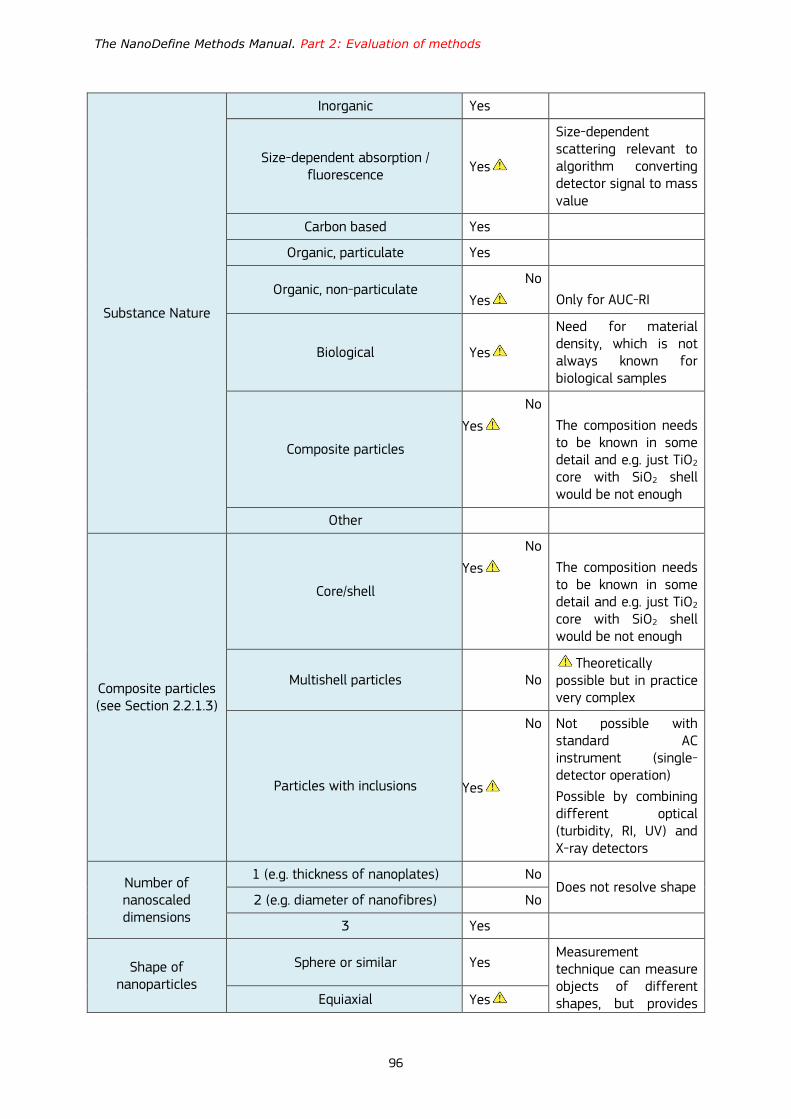
The NanoDefine Methods Manual. Part 2: Evaluation of methods
96
Substance Nature
Inorganic Yes
Size-dependent absorption / fluorescence
Yes
Size-dependent scattering relevant to algorithm converting detector signal to mass value
Carbon based Yes
Organic, particulate Yes
Organic, non-particulate No
Yes
Only for AUC-RI
Biological Yes
Need for material density, which is not always known for biological samples
Composite particles
No
Yes
The composition needs to be known in some detail and e.g. just TiO2 core with SiO2 shell would be not enough
Other
Composite particles (see Section 2.2.1.3)
Core/shell
No
Yes
The composition needs to be known in some detail and e.g. just TiO2 core with SiO2 shell would be not enough
Multishell particles No Theoretically
possible but in practice very complex
Particles with inclusions
No
Yes
Not possible with standard AC instrument (single-detector operation)
Possible by combining different optical (turbidity, RI, UV) and X-ray detectors
Number of nanoscaled dimensions
1 (e.g. thickness of nanoplates) No Does not resolve shape
2 (e.g. diameter of nanofibres) No
3 Yes
Shape of nanoparticles
Sphere or similar Yes Measurement technique can measure objects of different shapes, but provides Equiaxial Yes
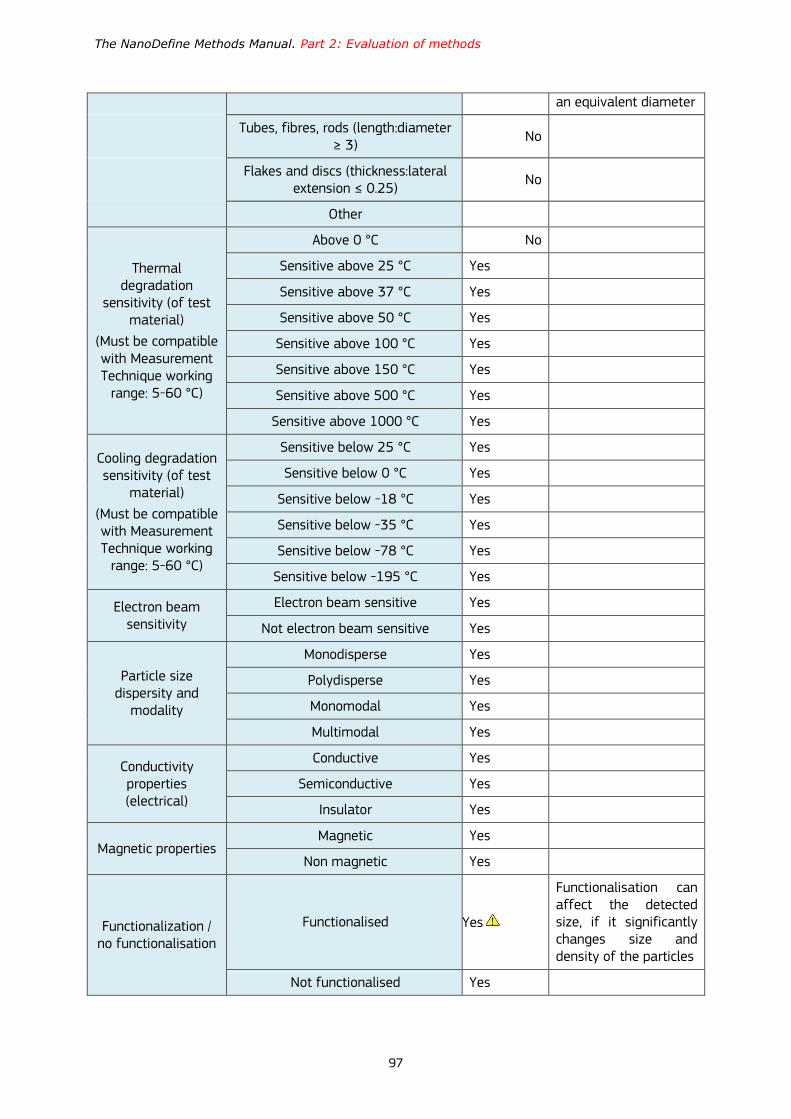
The NanoDefine Methods Manual. Part 2: Evaluation of methods
97
an equivalent diameter
Tubes, fibres, rods (length:diameter ≥ 3)
No
Flakes and discs (thickness:lateral extension ≤ 0.25)
No
Other
Thermal degradation
sensitivity (of test material)
(Must be compatible with Measurement Technique working
range: 5-60 °C)
Above 0 °C No
Sensitive above 25 °C Yes
Sensitive above 37 °C Yes
Sensitive above 50 °C Yes
Sensitive above 100 °C Yes
Sensitive above 150 °C Yes
Sensitive above 500 °C Yes
Sensitive above 1000 °C Yes
Cooling degradation sensitivity (of test
material)
(Must be compatible with Measurement Technique working
range: 5-60 °C)
Sensitive below 25 °C Yes
Sensitive below 0 °C Yes
Sensitive below -18 °C Yes
Sensitive below -35 °C Yes
Sensitive below -78 °C Yes
Sensitive below -195 °C Yes
Electron beam sensitivity
Electron beam sensitive Yes
Not electron beam sensitive Yes
Particle size dispersity and
modality
Monodisperse Yes
Polydisperse Yes
Monomodal Yes
Multimodal Yes
Conductivity properties (electrical)
Conductive Yes
Semiconductive Yes
Insulator Yes
Magnetic properties Magnetic Yes
Non magnetic Yes
Functionalization / no functionalisation
Functionalised Yes
Functionalisation can affect the detected size, if it significantly changes size and density of the particles
Not functionalised Yes
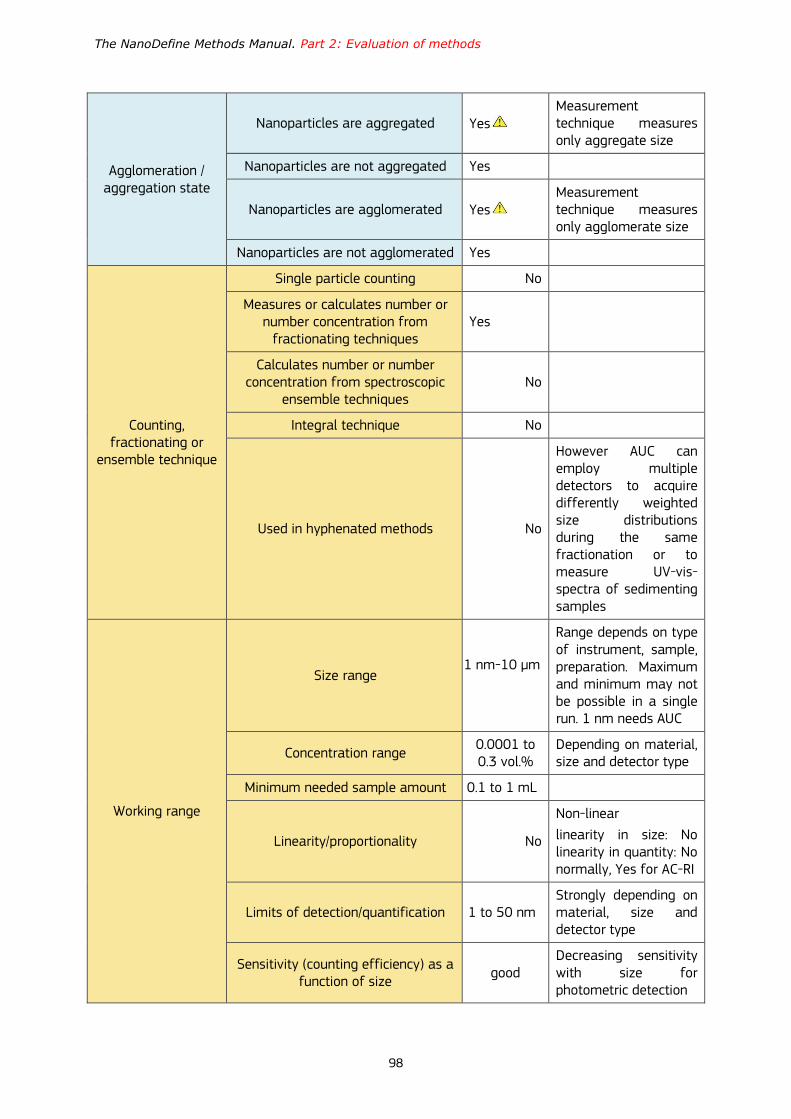
The NanoDefine Methods Manual. Part 2: Evaluation of methods
98
Agglomeration / aggregation state
Nanoparticles are aggregated Yes Measurement technique measures only aggregate size
Nanoparticles are not aggregated Yes
Nanoparticles are agglomerated Yes Measurement technique measures only agglomerate size
Nanoparticles are not agglomerated Yes
Counting, fractionating or
ensemble technique
Single particle counting No
Measures or calculates number or number concentration from
fractionating techniques Yes
Calculates number or number concentration from spectroscopic
ensemble techniques No
Integral technique No
Used in hyphenated methods No
However AUC can employ multiple detectors to acquire differently weighted size distributions during the same fractionation or to measure UV-vis-spectra of sedimenting samples
Working range
Size range 1 nm-10 µm
Range depends on type of instrument, sample, preparation. Maximum and minimum may not be possible in a single run. 1 nm needs AUC
Concentration range 0.0001 to 0.3 vol.%
Depending on material, size and detector type
Minimum needed sample amount 0.1 to 1 mL
Linearity/proportionality No
Non-linear
linearity in size: No linearity in quantity: No normally, Yes for AC-RI
Limits of detection/quantification 1 to 50 nm Strongly depending on material, size and detector type
Sensitivity (counting efficiency) as a function of size
good Decreasing sensitivity with size for photometric detection
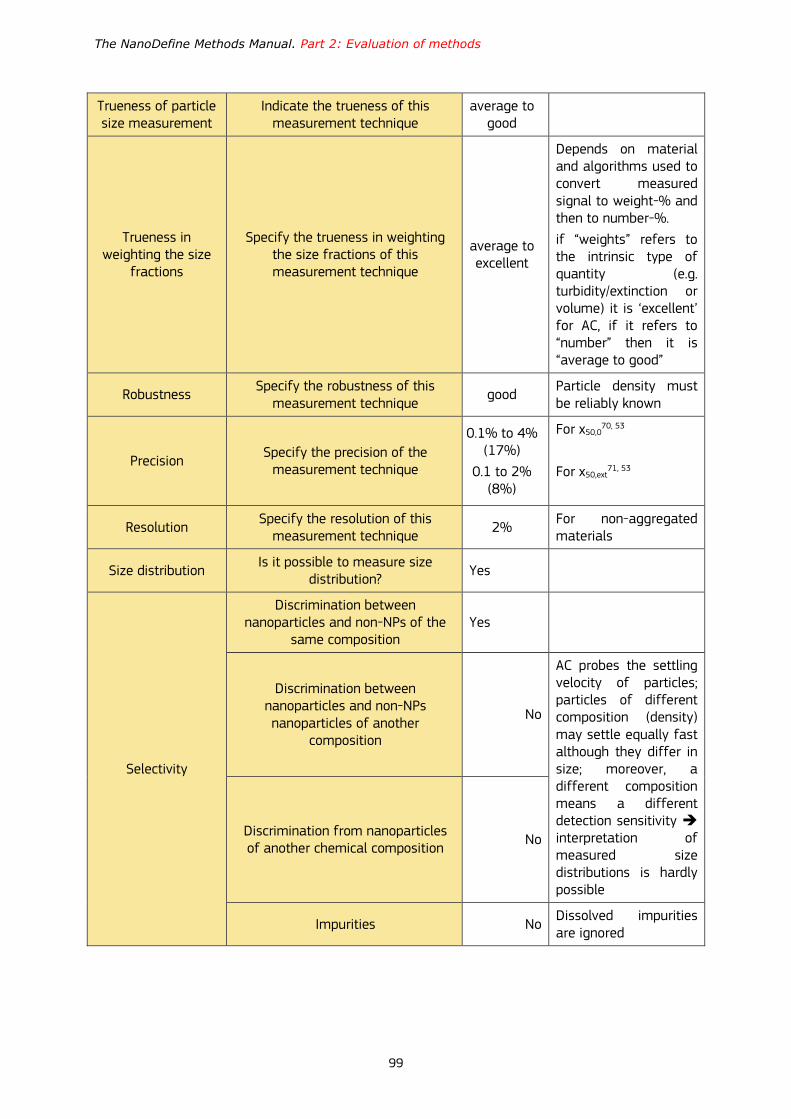
The NanoDefine Methods Manual. Part 2: Evaluation of methods
99
Trueness of particle size measurement
Indicate the trueness of this measurement technique
average to good
Trueness in weighting the size
fractions
Specify the trueness in weighting the size fractions of this measurement technique
average to excellent
Depends on material and algorithms used to convert measured signal to weight-% and then to number-%.
if “weights” refers to the intrinsic type of quantity (e.g. turbidity/extinction or volume) it is ‘excellent’ for AC, if it refers to “number” then it is “average to good”
Robustness Specify the robustness of this
measurement technique good
Particle density must be reliably known
Precision Specify the precision of the
measurement technique
0.1% to 4% (17%)
0.1 to 2% (8%)
For x50,070, 53
For x50,ext71, 53
Resolution Specify the resolution of this
measurement technique 2%
For non-aggregated materials
Size distribution Is it possible to measure size
distribution? Yes
Selectivity
Discrimination between nanoparticles and non-NPs of the
same composition Yes
Discrimination between nanoparticles and non-NPs nanoparticles of another
composition
No
AC probes the settling velocity of particles; particles of different composition (density) may settle equally fast although they differ in size; moreover, a different composition means a different detection sensitivity interpretation of measured size distributions is hardly possible
Discrimination from nanoparticles of another chemical composition
No
Impurities No Dissolved impurities are ignored

The NanoDefine Methods Manual. Part 2: Evaluation of methods
100
Identifies state of aggregation
Does the measurement technique reveal whether the measured particles are aggregated or
agglomerated?
No
Measurement of individual particles
Does this measurement technique characterise individual particles?
No
Counting constituent particles in
aggregations
Is the measurement technique able to characterise single constituent
particles in aggregates? No
Chemical composition
Does this measurement technique analyse chemical composition?
No
Specification of the type of size (diameter)
Specify: for example hydrodynamic…
Stokes diameter
i.e. equivalent diameter for settling velocity based on the particles’ skeleton density
Destructive measurement
technique or not
Is it a destructive measurement technique?
Yes
Other Specificity
Vacuum Does the measurement technique
operate under vacuum? No
Sample support Does this measurement technique
need preparation on suited supports?
No
5.3 Differential electrical mobility analysis (DEMA)
5.3.1 Measurement principle
The differential electrical mobility analysis is a technique for sizing submicron aerosol particles
based on their electrical mobility. For this purpose, the particles needs to be electrically charged in a
defined manner, classified according to their electrical mobility and finally quantified for each
mobility fraction. There are different ways to realise the DEMA principle in technical instruments, for
which reasons there is a number of varying terms: MPSS for mobility particle size spectrometer,
SMPS for scanning mobility particle sizer, DMPS for differential mobility particle sizer and DMAS for
differential mobility analysing system.
DMAS combines a particle classifier (differential mobility analyser DMA or DEMC for differential
electrical mobility classifier) that transmits particles within a narrow interval of sizes from an
initially polydisperse aerosol, and a detector (for example, a condensation particle counter CPC) that
counts the particles within that differential size interval. First, the aerosol passes through an inertial
impactor to avoid that particles larger than 1 micrometre enter the DMA column, then the aerosol
enters a particle charge conditioner like a charge neutraliser to be conditioned, so, particles that
carry several charges lose their charge excess. Once the aerosol is well conditioned, particles are
selected using electrical classification inside DMA column: an electric field is created and the
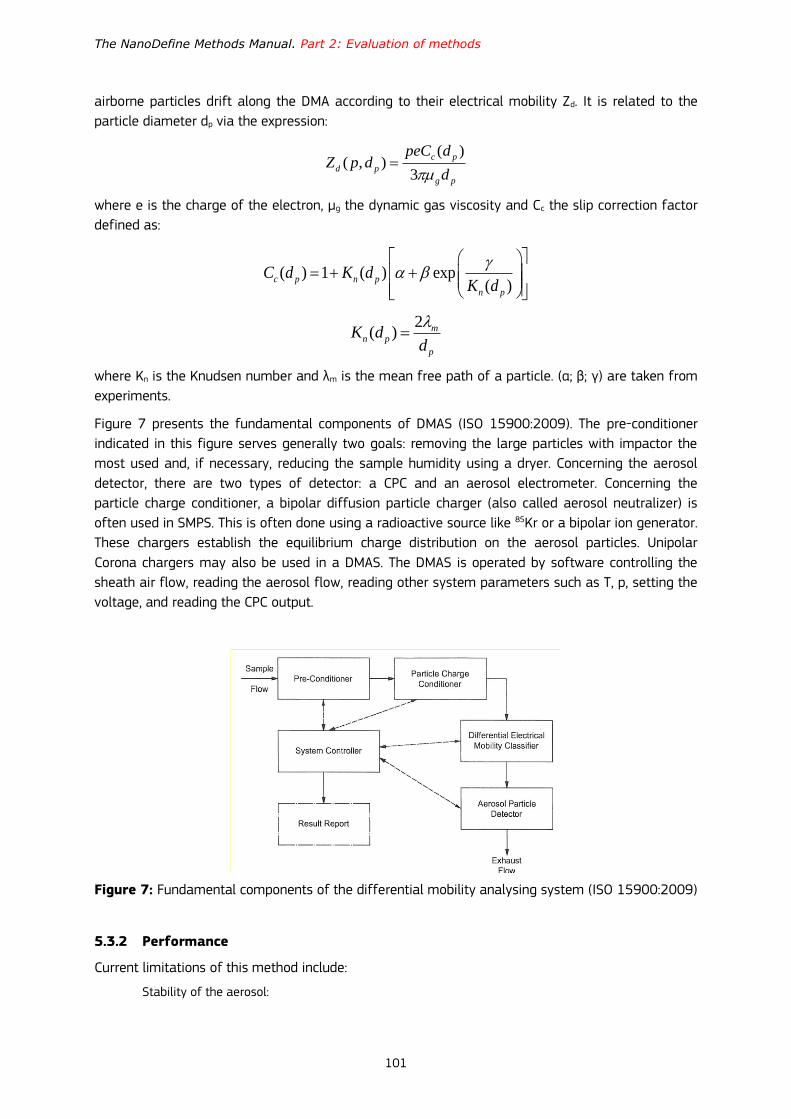
The NanoDefine Methods Manual. Part 2: Evaluation of methods
101
airborne particles drift along the DMA according to their electrical mobility Zd. It is related to the
particle diameter dp via the expression:
( )( , )
3
c p
d p
g p
peC dZ p d
d
where e is the charge of the electron, μg the dynamic gas viscosity and Cc the slip correction factor
defined as:
( ) 1 ( ) exp( )
c p n p
n p
C d K dK d
2( ) m
n p
p
K dd
where Kn is the Knudsen number and λm is the mean free path of a particle. (α; β; γ) are taken from
experiments.
Figure 7 presents the fundamental components of DMAS (ISO 15900:2009). The pre-conditioner
indicated in this figure serves generally two goals: removing the large particles with impactor the
most used and, if necessary, reducing the sample humidity using a dryer. Concerning the aerosol
detector, there are two types of detector: a CPC and an aerosol electrometer. Concerning the
particle charge conditioner, a bipolar diffusion particle charger (also called aerosol neutralizer) is
often used in SMPS. This is often done using a radioactive source like 85Kr or a bipolar ion generator.
These chargers establish the equilibrium charge distribution on the aerosol particles. Unipolar
Corona chargers may also be used in a DMAS. The DMAS is operated by software controlling the
sheath air flow, reading the aerosol flow, reading other system parameters such as T, p, setting the
voltage, and reading the CPC output.
Figure 7: Fundamental components of the differential mobility analysing system (ISO 15900:2009)
5.3.2 Performance
Current limitations of this method include:
Stability of the aerosol:
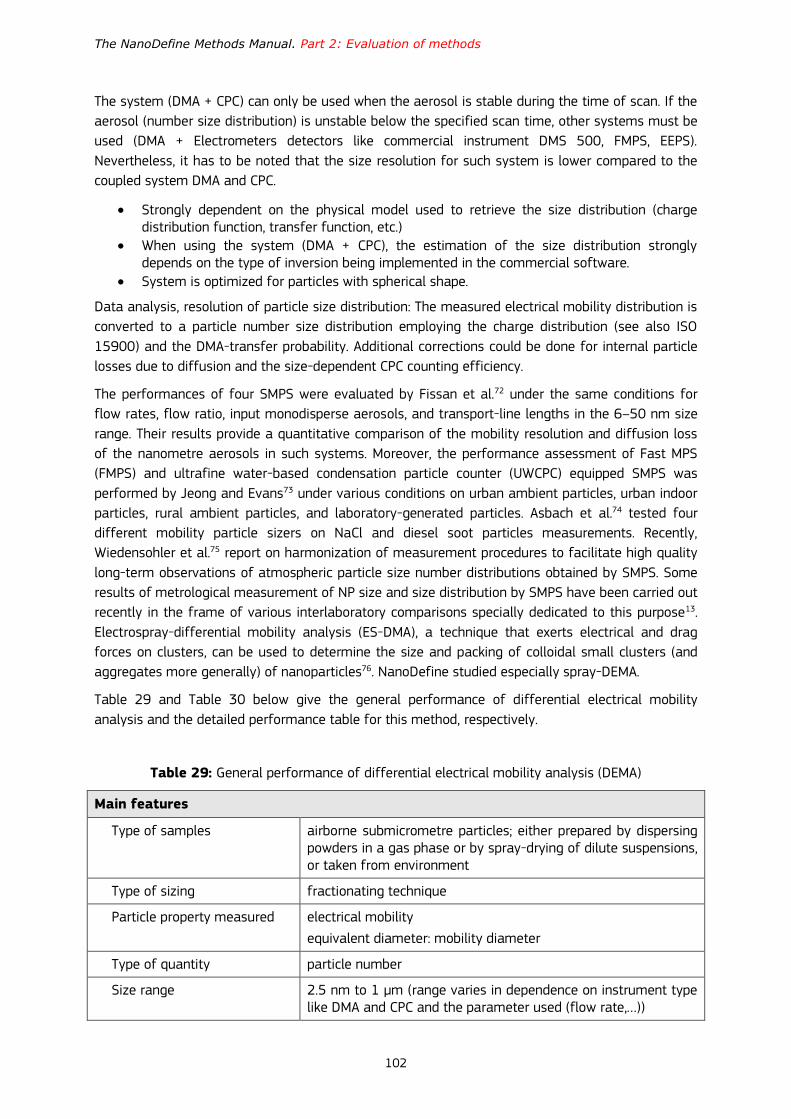
The NanoDefine Methods Manual. Part 2: Evaluation of methods
102
The system (DMA + CPC) can only be used when the aerosol is stable during the time of scan. If the
aerosol (number size distribution) is unstable below the specified scan time, other systems must be
used (DMA + Electrometers detectors like commercial instrument DMS 500, FMPS, EEPS).
Nevertheless, it has to be noted that the size resolution for such system is lower compared to the
coupled system DMA and CPC.
Strongly dependent on the physical model used to retrieve the size distribution (charge distribution function, transfer function, etc.)
When using the system (DMA + CPC), the estimation of the size distribution strongly depends on the type of inversion being implemented in the commercial software.
System is optimized for particles with spherical shape.
Data analysis, resolution of particle size distribution: The measured electrical mobility distribution is
converted to a particle number size distribution employing the charge distribution (see also ISO
15900) and the DMA-transfer probability. Additional corrections could be done for internal particle
losses due to diffusion and the size-dependent CPC counting efficiency.
The performances of four SMPS were evaluated by Fissan et al.72 under the same conditions for
flow rates, flow ratio, input monodisperse aerosols, and transport-line lengths in the 6–50 nm size
range. Their results provide a quantitative comparison of the mobility resolution and diffusion loss
of the nanometre aerosols in such systems. Moreover, the performance assessment of Fast MPS
(FMPS) and ultrafine water-based condensation particle counter (UWCPC) equipped SMPS was
performed by Jeong and Evans73 under various conditions on urban ambient particles, urban indoor
particles, rural ambient particles, and laboratory-generated particles. Asbach et al.74 tested four
different mobility particle sizers on NaCl and diesel soot particles measurements. Recently,
Wiedensohler et al.75 report on harmonization of measurement procedures to facilitate high quality
long-term observations of atmospheric particle size number distributions obtained by SMPS. Some
results of metrological measurement of NP size and size distribution by SMPS have been carried out
recently in the frame of various interlaboratory comparisons specially dedicated to this purpose13.
Electrospray-differential mobility analysis (ES-DMA), a technique that exerts electrical and drag
forces on clusters, can be used to determine the size and packing of colloidal small clusters (and
aggregates more generally) of nanoparticles76. NanoDefine studied especially spray-DEMA.
Table 29 and Table 30 below give the general performance of differential electrical mobility
analysis and the detailed performance table for this method, respectively.
Table 29: General performance of differential electrical mobility analysis (DEMA)
Main features
Type of samples airborne submicrometre particles; either prepared by dispersing powders in a gas phase or by spray-drying of dilute suspensions, or taken from environment
Type of sizing fractionating technique
Particle property measured electrical mobility
equivalent diameter: mobility diameter
Type of quantity particle number
Size range 2.5 nm to 1 µm (range varies in dependence on instrument type like DMA and CPC and the parameter used (flow rate,…))
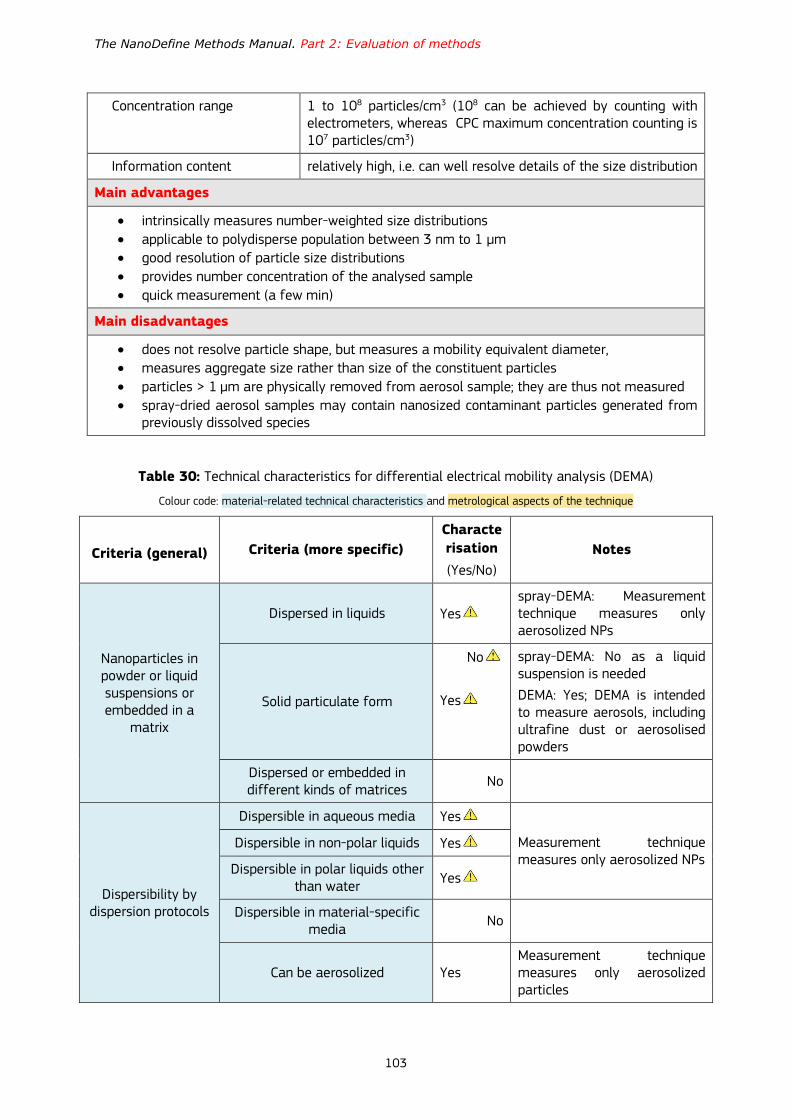
The NanoDefine Methods Manual. Part 2: Evaluation of methods
103
Concentration range 1 to 108 particles/cm3 (108 can be achieved by counting with electrometers, whereas CPC maximum concentration counting is 107 particles/cm3)
Information content relatively high, i.e. can well resolve details of the size distribution
Main advantages
intrinsically measures number-weighted size distributions
applicable to polydisperse population between 3 nm to 1 µm
good resolution of particle size distributions
provides number concentration of the analysed sample
quick measurement (a few min)
Main disadvantages
does not resolve particle shape, but measures a mobility equivalent diameter,
measures aggregate size rather than size of the constituent particles
particles > 1 µm are physically removed from aerosol sample; they are thus not measured
spray-dried aerosol samples may contain nanosized contaminant particles generated from previously dissolved species
Table 30: Technical characteristics for differential electrical mobility analysis (DEMA)
Colour code: material-related technical characteristics and metrological aspects of the technique
Criteria (general) Criteria (more specific)
Characte
risation
(Yes/No)
Notes
Nanoparticles in powder or liquid suspensions or embedded in a
matrix
Dispersed in liquids Yes spray-DEMA: Measurement technique measures only aerosolized NPs
Solid particulate form
No
Yes
spray-DEMA: No as a liquid suspension is needed
DEMA: Yes; DEMA is intended to measure aerosols, including ultrafine dust or aerosolised powders
Dispersed or embedded in different kinds of matrices
No
Dispersibility by dispersion protocols
Dispersible in aqueous media Yes
Measurement technique measures only aerosolized NPs
Dispersible in non-polar liquids Yes
Dispersible in polar liquids other than water
Yes
Dispersible in material-specific media
No
Can be aerosolized Yes Measurement technique measures only aerosolized particles
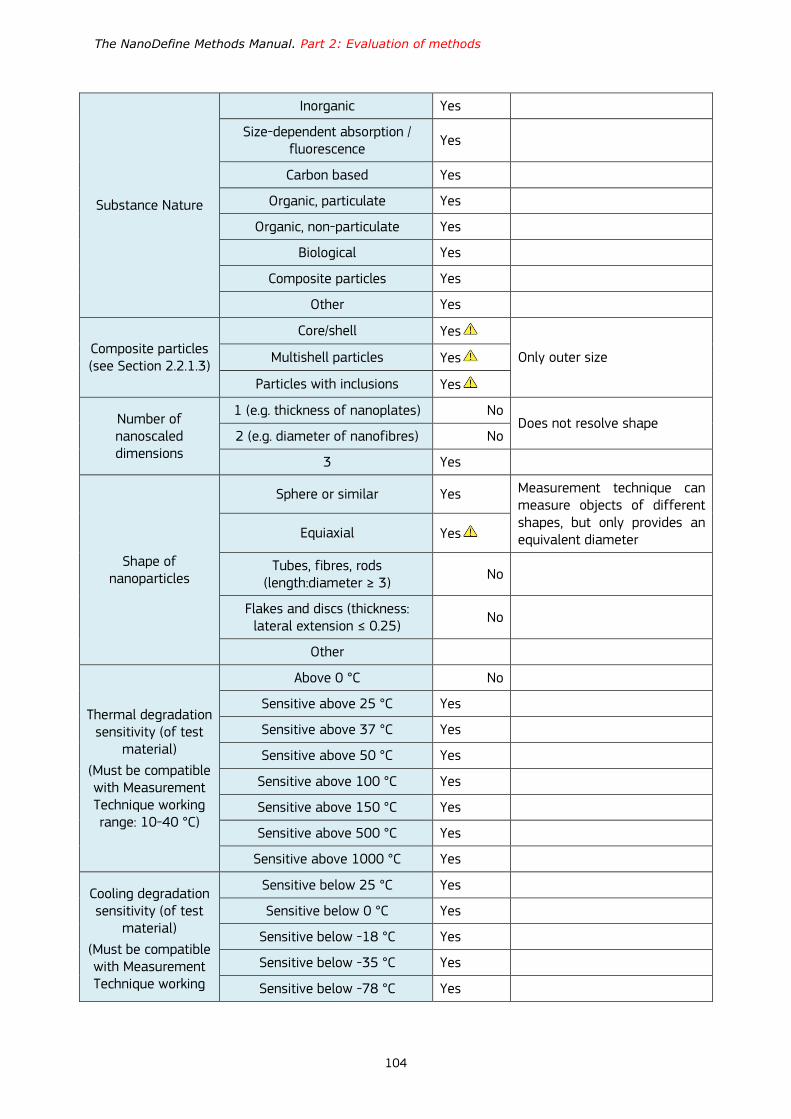
The NanoDefine Methods Manual. Part 2: Evaluation of methods
104
Substance Nature
Inorganic Yes
Size-dependent absorption / fluorescence
Yes
Carbon based Yes
Organic, particulate Yes
Organic, non-particulate Yes
Biological Yes
Composite particles Yes
Other Yes
Composite particles (see Section 2.2.1.3)
Core/shell Yes
Only outer size Multishell particles Yes
Particles with inclusions Yes
Number of nanoscaled dimensions
1 (e.g. thickness of nanoplates) No Does not resolve shape
2 (e.g. diameter of nanofibres) No
3 Yes
Shape of nanoparticles
Sphere or similar Yes Measurement technique can measure objects of different shapes, but only provides an equivalent diameter Equiaxial Yes
Tubes, fibres, rods (length:diameter ≥ 3)
No
Flakes and discs (thickness: lateral extension ≤ 0.25)
No
Other
Thermal degradation sensitivity (of test
material)
(Must be compatible with Measurement Technique working range: 10-40 °C)
Above 0 °C No
Sensitive above 25 °C Yes
Sensitive above 37 °C Yes
Sensitive above 50 °C Yes
Sensitive above 100 °C Yes
Sensitive above 150 °C Yes
Sensitive above 500 °C Yes
Sensitive above 1000 °C Yes
Cooling degradation sensitivity (of test
material)
(Must be compatible with Measurement Technique working
Sensitive below 25 °C Yes
Sensitive below 0 °C Yes
Sensitive below -18 °C Yes
Sensitive below -35 °C Yes
Sensitive below -78 °C Yes

The NanoDefine Methods Manual. Part 2: Evaluation of methods
105
range: 10-40 °C) Sensitive below -195 °C Yes
Electron beam sensitivity
Electron beam sensitive Yes
Not electron beam sensitive Yes
Particle size dispersity and
modality
Monodisperse Yes
Polydisperse Yes
Monomodal Yes
Multimodal Yes
Conductivity properties (electrical)
Conductive Yes
Semiconductive Yes
Insulator Yes
Magnetic properties Magnetic Yes
Non magnetic Yes
Functionalization / no functionalisation
Functionalised Yes
Not functionalised Yes
Agglomeration/ aggregation state
Nanoparticles are aggregated Yes Only aggregate size
Nanoparticles are not aggregated
Yes
Nanoparticles are agglomerated Yes
Only agglomerate size.
Spray-DEMA: only if agglomerates are small enough to avoid capillary clogging
Nanoparticles are not agglomerated
Yes
Counting, fractionating or
ensemble technique
Single particle counting No
Measures or calculates number or number concentration from
fractionating techniques Yes
Measurement technique measures the number concentration of very narrow particle size fractions
Calculates number or number concentration from
spectroscopic ensemble methods
No
Integral technique No
Used in hyphenated methods Yes E.g. by coupling DEMA with aerosol centrifuges (not standard)
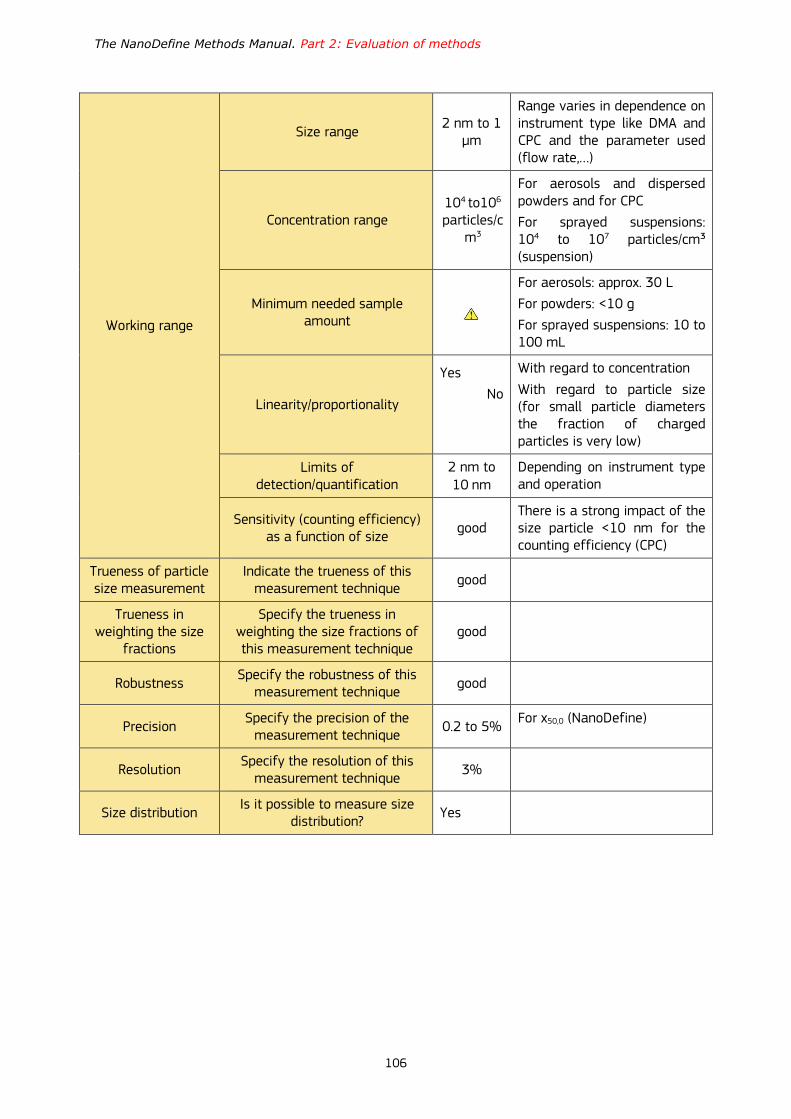
The NanoDefine Methods Manual. Part 2: Evaluation of methods
106
Working range
Size range 2 nm to 1
µm
Range varies in dependence on instrument type like DMA and CPC and the parameter used (flow rate,…)
Concentration range 104 to106 particles/c
m3
For aerosols and dispersed powders and for CPC
For sprayed suspensions: 104 to 107 particles/cm³ (suspension)
Minimum needed sample amount
For aerosols: approx. 30 L
For powders: <10 g
For sprayed suspensions: 10 to 100 mL
Linearity/proportionality
Yes
No
With regard to concentration
With regard to particle size (for small particle diameters the fraction of charged particles is very low)
Limits of detection/quantification
2 nm to 10 nm
Depending on instrument type and operation
Sensitivity (counting efficiency) as a function of size
good There is a strong impact of the size particle <10 nm for the counting efficiency (CPC)
Trueness of particle size measurement
Indicate the trueness of this measurement technique
good
Trueness in weighting the size
fractions
Specify the trueness in weighting the size fractions of this measurement technique
good
Robustness Specify the robustness of this
measurement technique good
Precision Specify the precision of the
measurement technique 0.2 to 5%
For x50,0 (NanoDefine)
Resolution Specify the resolution of this
measurement technique 3%
Size distribution Is it possible to measure size
distribution? Yes
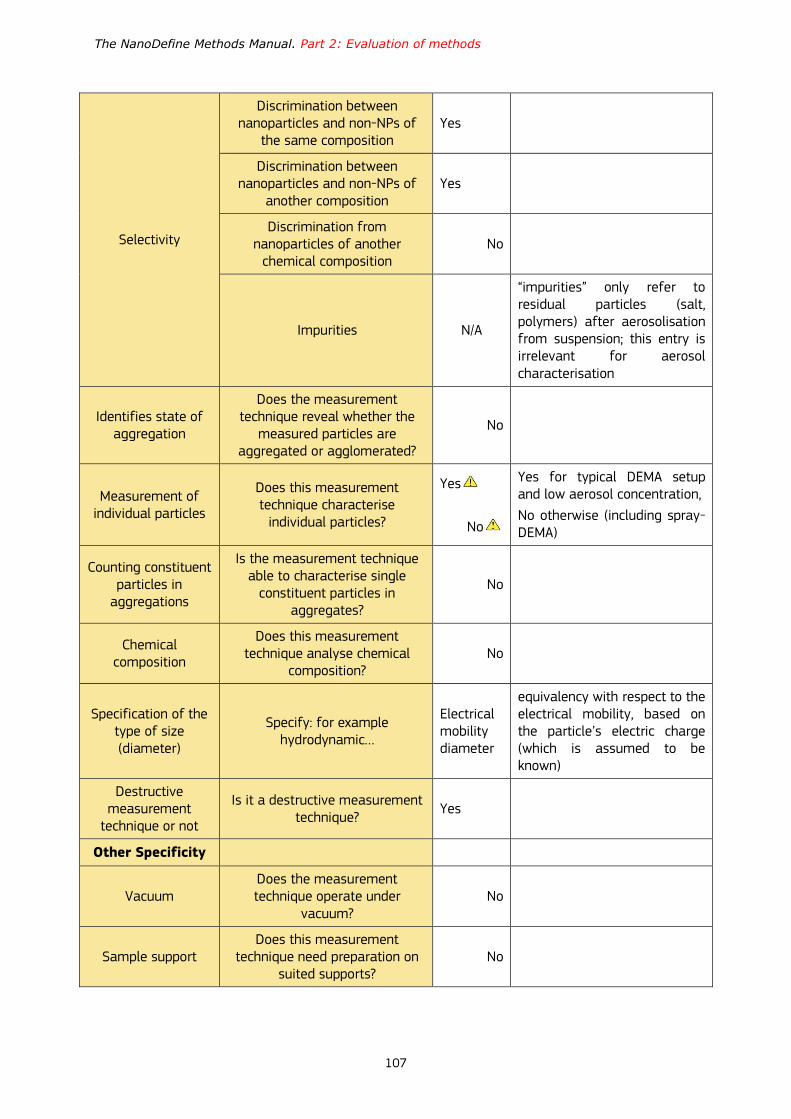
The NanoDefine Methods Manual. Part 2: Evaluation of methods
107
Selectivity
Discrimination between nanoparticles and non-NPs of
the same composition Yes
Discrimination between nanoparticles and non-NPs of
another composition Yes
Discrimination from nanoparticles of another
chemical composition No
Impurities N/A
“impurities” only refer to residual particles (salt, polymers) after aerosolisation from suspension; this entry is irrelevant for aerosol characterisation
Identifies state of aggregation
Does the measurement technique reveal whether the
measured particles are aggregated or agglomerated?
No
Measurement of individual particles
Does this measurement technique characterise
individual particles?
Yes
No
Yes for typical DEMA setup and low aerosol concentration,
No otherwise (including spray-DEMA)
Counting constituent particles in
aggregations
Is the measurement technique able to characterise single
constituent particles in aggregates?
No
Chemical composition
Does this measurement technique analyse chemical
composition? No
Specification of the type of size (diameter)
Specify: for example hydrodynamic…
Electrical mobility diameter
equivalency with respect to the electrical mobility, based on the particle’s electric charge (which is assumed to be known)
Destructive measurement
technique or not
Is it a destructive measurement technique?
Yes
Other Specificity
Vacuum Does the measurement technique operate under
vacuum? No
Sample support Does this measurement
technique need preparation on suited supports?
No
The NanoDefine Methods Manual. Part 2: Evaluation of methods
108
6 Integral methods
6.1 BET for determination of volume specific surface area (VSSA)
6.1.1 Measurement principle
The Brunauer-Emmett-Teller (BET) theory was derived in 1938 to explain the physical adsorption of
gas molecules on a solid surface77. BET serves as the most often applied technique for the
measurement of the specific surface of powders. BET explains mono- and multilayer adsorption of
gas molecules on a solid and dry material. Nitrogen and argon gas are widely used for
measurements. BET is based on three hypotheses:
1.) gas molecules physically adsorb in infinite layers,
2.) no interactions exist between adsorbed layers, and
3.) the Langmuir theory is applicable for each layer of gas molecules.
The resulting BET equation is applied for fitting experimental gas adsorption isotherms and gives
the adsorbed monolayer gas quantity. Knowledge of gas quantity, adsorption cross section of the
adsorbing gas and the molar gas volume allows calculation of the specific surface area of the
material78.
The BET equation is
1
𝑣[(𝑝0 𝑝⁄ ) − 1]=
𝑐 − 1
𝑣𝑚𝑐 (
𝑝
𝑝0) +
1
𝑣𝑚𝑐
where p and p0 are the equilibrium and the saturation pressure of adsorbates at the temperature of
adsorption, v is the adsorbed gas quantity (for example, in volume units), and vmono is the monolayer
adsorbed gas quantity, c is the BET constant.
𝑐 = 𝑒𝑥𝑝 (𝐸1 − 𝐸𝐿1
𝑅𝑇)
where E1 is the heat of adsorption for the first layer, and EL is that for the second and higher layers
and is equal to the heat of liquefaction.
The equation is an adsorption isotherm and can be plotted as a straight line with the y-axis showing
1/v[(p0/p)-1] and φ = p/p0 on the x-axis according to experimental results (BET plot). p is the
equilibrium pressure and p0 is the saturation pressure. The value of the slope, A, and the y-intercept,
I, of the line are used to calculate the monolayer adsorbed gas quantity vmono and the BET constant
c. The following equations are used:
𝑣𝑚 =1
𝐴+𝐼 𝑎𝑛𝑑 𝑐 = 1 +
𝐴
𝐼
A total surface area SBET, total and a specific surface area SBET are estimated by the following
equations:
𝑆𝐵𝐸𝑇,𝑇𝑜𝑡𝑎𝑙 =𝑣𝑚𝑁𝑠
𝑉 𝑎𝑛𝑑 𝑆𝐵𝐸𝑇 =
𝑆𝑇𝑜𝑡𝑎𝑙
𝑎
where vm is in units of volume which are also the units of the molar volume of the adsorbate gas,
NA is Avogadro's number, S is the adsorption cross section of the adsorbing species, V is the molar
volume of adsorbate gas, α is the mass of adsorbent (in g).

The NanoDefine Methods Manual. Part 2: Evaluation of methods
109
6.1.2 Performance
The BET method is widely used and accepted in industry, academia and (governmental and
regulatory) research institutes. For example, the National Institute of Standards and Technology
(NIST, USA) and BAM provide a practical guide for its application which is available without charge
from NIST79. BET can be applied easily and is also standardized by ISO (ISO 9277:2010). The BET
theory is based on expansive assumptions (see above), and therefore, the results obtained by BET
are method-defined80. Also different values for the same material can be obtained if different
gases are used. As a consequence, the specific surface area values should be named BET surface
area and must often be considered as apparent. Nevertheless, Round-Robin tests for the
development of reference materials for BET as performed by BAM proved good accuracy of the BET
method81.
Table 31 and Table 32 below give the general performance of BET for determination of specific
surface area and the detailed performance table for this method, respectively.
Table 31: General performance table for BET for determination of specific surface area
Main features
Type of samples dry powder
Type of sizing integral sizing technique (yielding a mean size of the particle system)
Particle property measured mass specific surface area,
mean size for non-porous particles of unknown shape: surface-weighted mean of VSSA equivalent diameter
mean size for non-porous particles of known dimensionality: surface-weighted mean of VSSA equivalent smallest external dimension
Type of quantity surface-weighted
size range all size ranges
concentration range not applicable (measurements at dry powders)
information content one piece of information
Main advantages
measures size of constituent particles within aggregates
lower size limit < 10 nm
wide dynamic range
certified reference materials are available for a wide range of SSA up to 1300 m2/g,
Main disadvantages
cannot resolve size distribution
mean size is surface-weighted
does not resolve particle shape, application to material classification according to the EC NM Definition requires knowledge of dimensionality
Materials must be free of any volatile compounds, for example, water-free
Measurement times can be in the range of hours and increase with increasing surface area

The NanoDefine Methods Manual. Part 2: Evaluation of methods
110
Table 32: Technical characteristics for BET for determination of specific surface area
Colour code: material-related technical characteristics and metrological aspects of the technique
Criteria (general) Criteria (more specific)
Characte
risation
(Yes/No)
Notes
Nanoparticles in powder or liquid suspensions or embedded in a
matrix
Dispersed in liquids No
Solid particulate form Yes
Dispersed or embedded in matrices
No
Dispersibility by dispersion protocols
Dispersible in aqueous media No
Dispersible in non-polar liquids No
Dispersible in polar liquids other than water
No
Dispersible in material-specific media
No
Can be aerosolized No
Substance Nature
Inorganic Yes
Size-dependent light absorption / fluorescence
Yes
Carbon based Yes
Organic, particulate Yes
Organic, non-particulate Yes
Biological No
Composite particles7 Yes
Other
Composite particles (see Section 2.2.1.3)
Core/shell Yes Measures only surface accessible by the probe gas
Multishell particles Yes
Particles with inclusions Yes
Number of nanoscaled dimensions
1 (e.g. thickness of nanoplates) Yes Size derived from measured surfaces as available for gas sorption with pre-knowledge on particle shape (from a descriptive SEM micrograph)
2 (e.g. diameter of nanofibres) Yes
3 Yes Size derived from measured surfaces as available for gas sorption
7 See NanoDefine Manual, part 1 for definition
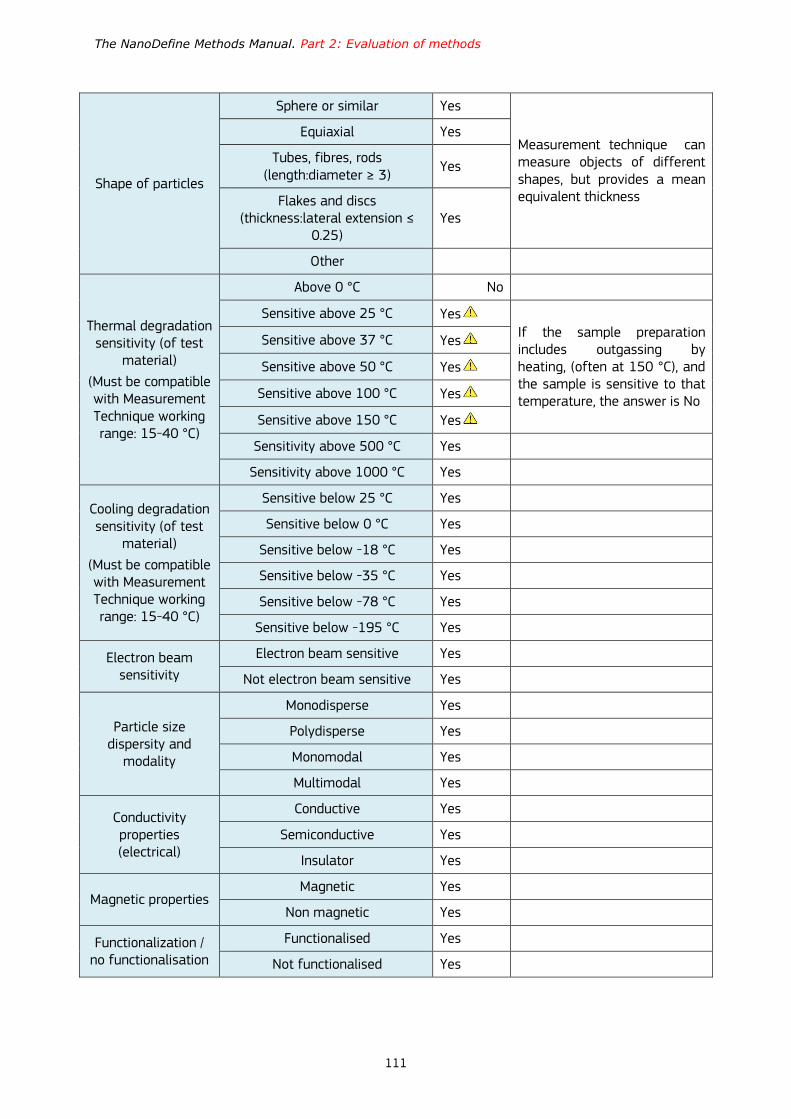
The NanoDefine Methods Manual. Part 2: Evaluation of methods
111
Shape of particles
Sphere or similar Yes
Measurement technique can measure objects of different shapes, but provides a mean equivalent thickness
Equiaxial Yes
Tubes, fibres, rods (length:diameter ≥ 3)
Yes
Flakes and discs (thickness:lateral extension ≤
0.25) Yes
Other
Thermal degradation sensitivity (of test
material)
(Must be compatible with Measurement Technique working range: 15-40 °C)
Above 0 °C No
Sensitive above 25 °C Yes If the sample preparation includes outgassing by heating, (often at 150 °C), and the sample is sensitive to that temperature, the answer is No
Sensitive above 37 °C Yes
Sensitive above 50 °C Yes
Sensitive above 100 °C Yes
Sensitive above 150 °C Yes
Sensitivity above 500 °C Yes
Sensitivity above 1000 °C Yes
Cooling degradation sensitivity (of test
material)
(Must be compatible with Measurement Technique working range: 15-40 °C)
Sensitive below 25 °C Yes
Sensitive below 0 °C Yes
Sensitive below -18 °C Yes
Sensitive below -35 °C Yes
Sensitive below -78 °C Yes
Sensitive below -195 °C Yes
Electron beam sensitivity
Electron beam sensitive Yes
Not electron beam sensitive Yes
Particle size dispersity and
modality
Monodisperse Yes
Polydisperse Yes
Monomodal Yes
Multimodal Yes
Conductivity properties (electrical)
Conductive Yes
Semiconductive Yes
Insulator Yes
Magnetic properties Magnetic Yes
Non magnetic Yes
Functionalization / no functionalisation
Functionalised Yes
Not functionalised Yes

The NanoDefine Methods Manual. Part 2: Evaluation of methods
112
Agglomeration/ aggregation state
Nanoparticles are aggregated Yes
Resulting surface will be smaller than the sum of the surfaces of the individual particles
Nanoparticles are not aggregated
Yes
Nanoparticles are agglomerated Yes
Nanoparticles are not agglomerated
Yes
Counting, fractionating or
ensemble technique
Single particle counting No
Measures or calculates number or number concentration from
fractionating techniques No
Calculates number or number concentration from
spectroscopic ensemble techniques
No
Integral technique Yes
Used in hyphenated methods8 No
Working range
Size range 1 nm to ~10 µm
Concentration range N/A Measurements on dry powders
Minimum needed sample amount
~100 mg
Linearity/proportionality Yes
Limits of detection/quantification
1 nm
Sensitivity (counting efficiency) as a function of particle size
good
Trueness of particle size measurement
Indicate the trueness of this measurement technique in measuring the particle size
average
The values are often apparent BET surfaces. For large specific surfaces these are not real. The measured surface depends often on the type of gas used for measurement
Trueness in weighting the size
fractions
Specify the trueness in weighting the size fractions by this measurement technique
average
Robustness Specify the robustness of this good For a defined SOP or the ISO
8 There are 2 independent signals: average track length and spot size, i.e. diffusion coefficient and scattering intensity; a 2-dimensional plot of a monoconstituent sample would therefore show the functional relationship between size and scattering cross section (i.e. a strong, non-linear correlation); for multiconstituent samples we would expect different groups of such functional dependencies, which offers a possibility to couple size analysis with material or shape analysis.
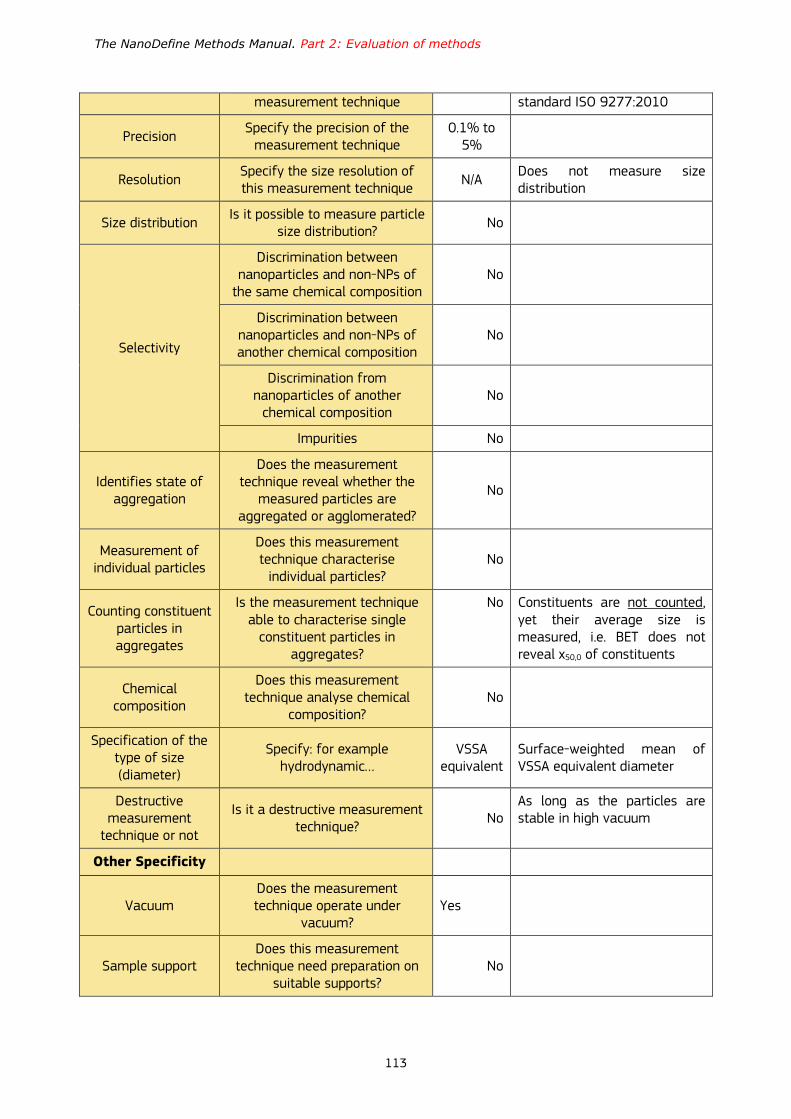
The NanoDefine Methods Manual. Part 2: Evaluation of methods
113
measurement technique standard ISO 9277:2010
Precision Specify the precision of the
measurement technique 0.1% to
5%
Resolution Specify the size resolution of this measurement technique
N/A Does not measure size distribution
Size distribution Is it possible to measure particle
size distribution? No
Selectivity
Discrimination between nanoparticles and non-NPs of
the same chemical composition No
Discrimination between nanoparticles and non-NPs of another chemical composition
No
Discrimination from nanoparticles of another
chemical composition No
Impurities No
Identifies state of aggregation
Does the measurement technique reveal whether the
measured particles are aggregated or agglomerated?
No
Measurement of individual particles
Does this measurement technique characterise
individual particles? No
Counting constituent particles in aggregates
Is the measurement technique able to characterise single
constituent particles in aggregates?
No Constituents are not counted, yet their average size is measured, i.e. BET does not reveal x50,0 of constituents
Chemical composition
Does this measurement technique analyse chemical
composition? No
Specification of the type of size (diameter)
Specify: for example hydrodynamic…
VSSA equivalent
Surface-weighted mean of VSSA equivalent diameter
Destructive measurement
technique or not
Is it a destructive measurement technique?
No As long as the particles are stable in high vacuum
Other Specificity
Vacuum Does the measurement technique operate under
vacuum? Yes
Sample support Does this measurement
technique need preparation on suitable supports?
No
114
7 References
1 European Commission, Commission Recommendation 2011/696/EU of 18 October 2011 on the definition of nanomaterial, OJ L 275, p. 38–40, 2011.
2 http://www.nanodefine.eu/index.php/nanodefine-publications/nanodefine-technical-reports
3 Mutavdzic, D., Xu, J., Thakur, G., Triulzi, R., Kasas, S., Jeremic, M., Leblanc, R., Radotic, K., Determination of the size of quantum dots by fluorescence spectroscopy. Analyst 136. 2391, 2011.
4 ISO 3252:1999(en). Powder metallurgy — Vocabulary, see definition 1115 'composite powder'.
5 Gaillard C., Mech A., Wohlleben W., Babick F., Hodoroaba V.-D., Ghanem A., Weigel S., Rauscher H., A technique-driven materials categorisation scheme to support regulatory identification of nanomaterials, Nanoscale Adv., 2019, http://dx.doi.org/10.1039/C8NA00175H
6 De Lozanne, A., Application of magnetic force microscopy in nanomaterials characterization. Microscopy Research and Technique 69. 550, 2006,
7 Snyder, S.R., Heinen, U., Characterization of Magnetic Nanoparticles for Therapy and Diagnostics. Bruker., Available from: http://www.bruker.com/fileadmin/user_upload/8-PDF-Docs/MagneticResonance/MRI/brochures/MPS_app-note.pdf [Accessed 6th December 2013], 2011.
8 Biederer, S., Knopp, T., Sattel, T.F., Lüdtke-Buzug, T.M., Gleich, B., Weizenecker, J., Borgert, J., Buzug, T.M., Estimation of Magnetic Nanoparticle Diameter with a Magnetic Particle Spectrometer. In: Dössel O., Schlegel W.C. (eds) World Congress on Medical Physics and Biomedical Engineering, September 7 - 12, 2009, Munich, Germany.
9 DiPietro, R.S., Johnson, H.G., Bennett, S.P., Nummy, T.J.,. Lewis, L.H., Heiman, D., 2010. Determining magnetic nanoparticle size distributions from thermomagnetic measurements. Applied Physics Letters 96. 222506, 2010.
10 Yoon, S., Determination of the Size Distribution of Magnetite Nanoparticles from Magnetic Measurements, J. Magnetics 13. 368, 2011.
11 Meli, F., Klein, T., Buhr, E., Frase, C.G., Gleber, G., Krumrey, M., Duta, A., Duta, S., Korpelainen, V., Bellotti, R., Picotto, G.B., Boyd R.D., Cuenat, A., Traceable size determination of nanoparticles, a comparison among European metrology institutes, Measurement Science and Technology 23. 125005, 2012.
12 Linsinger, T.P.J., Chaudhry, Q., Dehalu, V., Delahaut, P., Dudkiewicz, A., Grombe, R., von der Kammer, F., Larsen, E.H., Legros, S., Loeschner, K., Peters, R., Ramsch, R., Roebben, G., Tiede, K., Weigel, S,. Validation of methods for the detection and quantification of engineered nanoparticles in food. Food Chemistry 138. 1959, 2013.
13 Motzkus, C., Macé, T., Gaie-Levrel, F., Ducourtieux, S., Delvallee, A., Dirscherl, K., Hodoroaba, V.-D. , Popov, I., Popov, O., Kuselman, I., Takahat, K., Ehara, K., Ausset, P., Maillé, M., Michielsen, N., Bondiguel, S., Gensdarmes, F., Morawska, L., Johnson, G., Faghihi, EM., Kim, C.S., Kim, Y.H., Chu, M.C., Guardado, J.A., Salas, A., Capannelli, G., Costa, C., Bostrom, T., Jämting, A.K., Lawn, M.A., Adlem L., Vaslin-Reimann, S., Size characterization of airborne SiO2 nanoparticles with on-line and off-line measurement techniques: an interlaboratory comparison study. J. Nanoparticle Research 15:1919, 2013.
115
14 Linsinger T., Roebben G., Gilliland D., Calzolai L., Rossi F., Gibson N., Klein C., Requirements on measurements for the implementation of the European Commission definition of the term "nanomaterial", Joint Research Centre of the European Commission, EUR 25404, 2012.
15 Jung, K.Y., Park, B.C., Song, W.Y., Oa, B.-H., Eom, T.B., Measurement of 100-nm polystyrene sphere by transmission electron microscope. Powder Technol. 126:255–265, 2002.
16 De Temmerman, P.-J., Lammertyn, J., De Ketelaere, B., Kestens, V., Roebben, G., Verleysen, E., Mast, J., Measurement uncertainties of size, shape, and surface measurements using transmission electron microscopy of near-monodisperse, near-spherical nanoparticles. J Nanopart. Res. 16(1):1-22, 2013.
17 De Temmerman, P.-J., Van Doren, E., Verleysen, E., Van der Stede, Y., Abi Daoud Francisco, M., Mast, J., Quantitative characterization of agglomerates and aggregates of pyrogenic and precipitated amorphous silica nanomaterials by transmission electron microscopy. J. Nanobiotechnology 10:24, 2012.
18 Verleysen, E., De Temmerman, P.-J., Van Doren, E., Abi Daoud Francisco, M., Mast, J., Quantitative characterization of aggregated and agglomerated titanium oxide nanomaterials by transmission electron microscopy. Powder Technol. 258(1):180-188, 2014.
19 De Temmerman, P.-J., Verleysen, E., Lammertyn, J., Mast, J., Semi-automatic size measurement of primary particles in aggregated nanomaterials by transmission electron microscopy. Powder Technol. 261(1):191-200, 2014.
20 Buhr, E., Senftleben, N., Klein, T., Bergmann, D., Gnieser, D., Frase, C.G., Bosse, H., Characterization of nanoparticles by scanning electron microscopy in transmission mode. Meas. Sci. Technol. 20:084025, 2009.
21 Klein, T., Buhr, E., Johnsen, K.-P., Frase, C.G., Traceable measurement of nanoparticles size using a scanning electron microscope in transmission mode (TSEM). Meas. Sci. Technol. 22:094002, 2011.
22 Hodoroaba, V.-D., Motzkus, C., Macé, T., Vaslin-Reimann, S., Performance of High-Resolution SEM/EDS Systems Equipped with Transmission Mode (TSEM) for Imaging and Measurement of Size and Size Distribution of Spherical Nanoparticles. Microsc. Microanal. 20:602–612, 2014.
23 Gilmore, B. L., Showalter, S. P. , Dukes, M. J., Tanner, J. R., Demmert, A. C., McDonald, S. M., Kelly, D. F., Visualizing viral assemblies in a nanoscale biosphere., Lab on a Chip 13(2):216-219, 2013.
24 Binnig, G., Quate, C.F., Gerber, C., Atomic force microscope. Phys. Rev. Lett. 56(9):930-933, 1986.
25 Giessibl, F. J., Advances in atomic force microscopy. Rev. Mod. Phys. 75(3):949-983, 2003.
26 Danzebrink, H.-U., Koenders, L., Wilkening, G., Yacoot, A., Kunzmann, H., Advances in scanning force microscopy for dimensional metrology, Ann. CIRP 55(2):841-878, 2006.
27 Heim, L.-O., Blum, J., Preuss, M., Butt, H.-J., Adhesion and friction forces between spherical micrometre-sized particles. Phys. Rev. Lett. 83(16):3328-3331, 1999.
28 Butt, H.-J. Berger, R., Bonaccurso, E., Chen, Y., Wang, J., Impact of atomic force microscopy on interface and colloid science. Adv. Colloid Interface Sci. 133(2):91-104, 2007.
29 Kada G., Kienberger F., Hinterdorfer P. Atomic Force Microscopy in Bionanotechnology. Nano Today 3:12-19, 2008.
30 Fiala, P., Göhler, D., Buhr, E., Dziomba, T., Klein, T., Realisierung und Optimierung von Präparationsmethoden für zuverlässige Größenmessungen mit AFM und TSEM. DIN-INS

116
report, Technische Universität Dresden, Physikalisch-Technische Bundesanstalt, Braunschweig. 2011.
31 Hole, P., Sillence, K., Hannell, C., Maguire, C.M., Roesslein, M., Suarez, G., Capracotta, S., Magdolenova, Z., Horev-Azaria, L., Dybowska, A., Cooke, L., Haase, A., Contal, S., Manø, S, Vennemann, A., Sauvain, J.-J., Staunton, K.C., Anguissola, S., Luch, A., Dusinska, M., Korenstein, R., Gutleb, A.C., Wiemann, M., Prina-Mello, A., Riediker, M., Wick, P., Interlaboratory comparison of size measurements on nanoparticles using nanoparticle tracking analysis (NTA). J. Nanopart. Res. 15:2101 (12 pp.), 2013.
32 Domingos, R.F., Baalousha, M.A., Ju-Nam, Y., Reid, M.M., Tufenkji, N., Lead, J.R., Leppard, G.G., Wilkinson, K.J., Characterizing manufactured nanoparticles in the environment: multimethod determination of particle sizes. Environ. Sci. Technol. 43(19):7277-7284, 2009.
33 Coulter, W.H., US Patent No. 2,656,508, 1953.
34 Scarlett, B., Theoretical derivation of the response of a Coulter counter, 2nd Eur. symp. on particle characterization, Partec, Nuremberg, pp. 681-693, 1979.
35 Lines, R.W., The Electrical Sensing Zone Method (The Coulter Principle). Particle Size Analysis, Cambridge: Royal Society of Chemistry, pp. 350-373, 1992.
36 Harfield, J.G., Wharton, R.T., Lines, R.W., Response of the Coulter counter® model ZM to spheres. Part. Charact., 1:32-36, 1984.
37 Degueldre, C., Favarger, P.Y., Colloid analysis by single particle inductively coupled plasma-mass spectroscopy: a feasibility study, Coll. Surf. A 217:137-142, 2003.
38 Laborda, F., Jiménez-Lamana, J., Bolea, E., Castillo, J.R. Selective identification, characterization and determination of dissolved silver(I) and silver nanoparticles based on single particle detection by inductively coupled plasma mass spectrometry, J Anal At Spectrom 26:1362-1371, 2011.
39 Laborda, F., Bolea, E., Jimenez-Lamana, J., Single Particle Inductively Coupled Plasma Mass Spectrometry: A Powerful Tool for Nanoanalysis, Anal. Chem. 86:2270−2278, 2014.
40 Pace, H.E., Rogers, N.J., Jarolimek, C., Coleman, V.A., Gray, E.P., Higgins, C.P., Ranville, J.F. Single Particle Inductively Coupled Plasma-Mass Spectrometry: A Performance Evaluation and Method Comparison in the Determination of Nanoparticle Size, Environ. Sci. Technol. 46:12272−12280, 2012.
41 Linsinger, T., Peters, R., Weigel, S. International interlaboratory study for sizing and quantification of Ag nanoparticles in food simulants by single-particle ICPMS, Analytical and Bioanalytical Chemistry 406(16):3835, 2014.
42 Jakeman, E. Theory of optical spectroscopy by digital autocorrelation of photon-counting fluctuations. J. Phys. A 3(2):201-215, 1970.
43 Xu, R., Particle Characterization: Light Scattering Methods. Kluwer Academic Publishers, Dordrecht, 2000.
44 Willemse, A.W., Marijnissen, J.C.M., van Wuyckhuyse, A.L., Roos, R., Merkus, H.G., Scarlett, B., Low-Concentration Photon Correlation Spectroscopy. Part. Part. Syst. Charact. 14(4):157-162, 1997.
45 Batchelor, G.K., Sedimentation in a dilute polydisperse system of interacting spheres. Part 1. General theory. J. Fluid Mech., 119:379-408, 1982.
46 Paul, G.L., Pusey, P.N., Observation of a long-time tail in Brownian motion. J. Phys. A: Math. Gen. 14(12):3301-3327, 1981.

117
47 Braun, A., Franks, K., Kestens, V., Roebben, G., Lamberty, A., Linsinger, T., Certification Report. Certification of Equivalent Spherical Diameters of Silica Nanoparticles in Water. Certified Reference Material ERM®-FD100. Luxembourg: Publications Office of the European Union. ISSN 1018-5593, 2011.
48 Lamberty, A., Franks, K., Braun, A., Kestens, V., Roebben, G., Linsinger, T., Interlaboratory comparison for the measurement of particle size and zeta potential of silica nanoparticles in an aqueous suspension. J. Nanopart. Res., 13(12):7317-7329, 2011.
49 Glatter, O., Kratky, O., Small-Angle X-ray Scattering. Academic Press, London, 1982.
50 Round, A.R., Franke, D., Moritz, S., Huchler, R., Fritsche, M., Malthan, D., Klaering, R., Svergun, D. I., Roessle, M.,. Automated sample-changing robot for solution scattering experiments at the EMBL Hamburg SAXS station X33. J. Appl. Cryst. 41: 913-917, 2008.
51 Pauw, B.R., Everything SAXS: small-angle scattering pattern collection and correction. J. Phys.: Condens. Matter 25: 383201 (24 pp.), 2013.
52 Shyjumon, I., Rappolt, M., Sartori, B., Amenitsch, H., Laggner, P., Novel in situ setup to study the formation of nanoparticles in the gas phase by small angle x-ray scattering. Rev. Sci. Instrum., 79:043905 (5 pp.), 2008.
53 Babick, F., Mielke, J., Wohlleben, W., Weigel, S., Hodoroaba, V.-D. How reliably can a material be classified as a nanomaterial? Available particle-sizing techniques at work. J Nanopart Res 18: 158, 2016.
54 McClements, D.J., Principles of ultrasonic droplet size determination in emulsion. Langmuir 12(2):3454-3461, 1996.
55 Kachanovskaya, L.D., Datskevich, E.V., Sperkach, V.S., Usenko, Y.D. Acoustic studies of aqueous solutions of biomacromolecules. Colloids Surf. A 106(2-3):103-107, 1996.
56 McClements, D.J., Ultrasonic characterisation of emulsions and suspensions. Adv. Colloid Interface Sci. 37(1-2):34-72, 1991.
57 Babick, F., Hinze, F., Ripperger, S., Dependence of ultrasonic attenuation on the material properties. Colloids Surf. A 172(1-3):33-46, 2000.
58 Babick, F., Richter, A., Sound attenuation by small spheroidal particles due to visco-inertial coupling. J. Acoust. Soc. Am. 119(3):1441-1448, 2006.
59 Dukhin, A.S., Goetz, P.J., Acoustic spectroscopy for concentrated polydisperse colloids with high density contrast. Langmuir 12(21):4987-4997, 1996.
60 Dukhin, A., Parlia, S., Klank, D., Lesti, M., Particle sizing and zeta potential of silica Koestrosol (basis for certified reference material ERM-FD100 for nanoparticles) by acoustics and electroacoustics. Part. Part. Syst. Charact. 27(5-6):165-171, 2012.
61 Babick, F., Ripperger, S., Information content of acoustic attenuation spectra. Part. Part. Syst. Charact. 19(3):176-185, 2002.
62 Heimer, S. and Tezak, D., Structure of polydispersed colloids characterised by light scattering and electron microscopy, Adv. Colloid Interface Sci. 98, 1-23, 2002.
63 Just, U., Werthmann, B., Static Light Scattering of Polystyrene Reference Materials: Round-Robin Test. Int. J. Polymer Anal. and Charac. Pp. 195-207, 1999.
64 Mori, Y., Yoshida, H., Masuda, H., Characterization of reference particles of transparent glass by laser diffraction method. Part Part Syst Charact 24:91–96, 2007.
118
65 Witt, W., Stübinger, T., Köhler, U., List, J., Jordan, J., Partikelgrößenanalyse mit absoluter Genauigkeit (Particle Size Analysis with Absolute Precision). Chemie Ingenieur Technik. 84, No. 3, 211–222, 2012.
66 Kuchenbecker, P., Gemeinert, M., Rabe, T., Interlaboratory study of particle size distribution measurements by laser diffraction. Part. Part. Syst. Charact., 29(4):304-310, 2012.
67 von der Kammer, F., Baborowski, M., Friese, K., Application of a high-performance liquid chromatography fluorescence detector as a nephelometric turbidity detector following Field-Flow Fractionation to analyse size distributions of environmental colloids. J. Chromatogr. A 1100: 81–89, 2005.
68 Svedberg, T., Nichols, J.B., Determination of size and distribution of size of particle by centrifugal methods. J. Am. Chem. Soc. 45: .2910-2917, 1923.
69 Svedberg, T., Rinde, H., The ultra-centrifuge, a new instrument for the determination of size and distribution of size of particle in a microscopic colloids. J. Am. Chem. Soc. 46: 2677-2693, Part 2, 1924.
70 x50,r is the median value of type "r"-weighted size distribution (ISO 9276-1&2; however, both standards only refer to geometric types of quantities like volume i.e. r=3)
71 x50,ext is median of extinction-weighted size distribution Q_ext, which is intrinsically measured by AC-turb; the term is not standardised, yet commonly used (e.g. https://doi.org/10.1007/978-3-319-30663-6_2)
72 Fissan, H., Hummes, D., Stratmann, F., Büscher, P., Neumann, S., Pui, D.Y.H., Chen, D., Experimental comparison of four differential mobility analyzers for nanometer aerosol measurements. Aerosol Sci. Technol. 24:1–13, 1996.
73 Jeong, C.-H., Evans, G.J., Inter-comparison of a fast mobility particle sizer and a scanning mobility particle sizer incorporating an ultrafine water-based condensation particle counter. Aerosol Sci Technol. 43:364–373, 2009.
74 Asbach, C., Kaminski, H., Fissan, H., Monz, C., Dahmann, D., Mülhopt, S., Paur, H.R., Heinz, J.K., Herrmann, F., Voetz, M., Kuhlbusch, T., Comparison of four mobility particle sizers with different time resolution for stationary exposure measurements. J. Nanopart. Res. 11:1593–1609, 2009.
75 Wiedensohler, A., Birmili, W., Nowak, A., Sonntag, A., Weinhold, K., Merkel, M., Wehner, B., Tuch, T., Pfeifer, S., Fiebig, M., Fjäraa, A.M., Asmi, E., Sellegri, K., Depuy, R., Venzac, H., Villani, P., Laj, P., Aalto, P., Ogren, J.A., Swietlicki, E., Roldin, P., Williams, P., Quincey, P., Hüglin, C., Fierz-Schmidhauser, R., Gysel, M., Weingartner, E., Riccobono, F., Santos, S., Grüning, C., Faloon, K., Beddows, D., Harrison, R.M., Monahan, C., Jennings, S.G., O’Dowd, C.D., Marinoni, A., Horn, H.-G., Keck, L., Jiang, J., Scheckman, J., McMurry, P.H., Deng, Z., Zhao, C.S., Moerman, M., Henzing, B., de Leeuw, G., Mobility particle size spectrometers: harmonization of technical standards and data structure to facilitate high quality long-term observations of atmospheric particle number size distributions. Atmos. Meas. Technol. 5:657–685, 2012.
76 Pease, L.F., Tsai, D.-H., Hertz, J.L., Zangmeister, R.A., Zachariah, M.R., Tarlov, M.J., Packing and Size Determination of Colloidal Nanoclusters. Langmuir 26(13): 11384–11390, 2010.
77 Brunauer, S., Emmett, P.H., Teller, E., Adsorption of gases in multimolecular layers. J. Am. Chem. Soc. 60: 309-319, 1938.
78 Dabrowski, A., Adsorption--from theory to practice. Advances in Colloid and Interface Science 93, 135-224, 2001.
119
79 Klobes, P., Meyer, K., Munro, R.G., Porosity and Specific Surface Area Measurements for Solid Materials. NIST recommended practice guide, Special Publication 960-17, 2006.
80 Hackley, V.A., Stefaniak, A.B., ‘‘Real-world’’ precision, bias, and between-laboratory variation for surface area measurement of a titanium dioxide nanomaterial in powder form. J. Nanopart. Res. 15:1742 (8 pp.), 2013.
81 BAM: Certification Report. Certified Reference Material BAM-P110. BET Specific Surface Area of Titanium Dioxide (Anatase) calculated from the nitrogen adsorption isotherm at 77.3 K, 2017. Available at https://rrr.bam.de/RRR/Content/EN/Downloads/RM-certificates/RM-cert-porous-materials/bam_p110repe.pdf?__blob=publicationFile.

120
Annex 1 NanoDefine priority materials
Material Description
IRMM-380
Pigment yellow 83 (transparent grade)
Organic diarylide dye with hydrophobic character. Sub-100 nm particulates
IRMM-381
BaSO4 (fine grade)
Inorganic hydrophilic metal salt with low water solubility
IRMM-382
MWCNT
Highly tangled fibrous carbonaceous materials which are strongly hydrophobic in nature
IRMM-383
Nano steel
Highly anisotropic (platelets) particulates with negatively charged surface at neutral pH
IRMM-384
CaCO3 (fine grade)
Inorganic hydrophilic metal salt with low but non-negligible water solubility
IRMM-385
Kaolin
Highly anisotropic ceramic/mineral (platelets) particulates with negatively charged metal-oxide surface at neutral pH
IRMM-386
Pigment yellow 83 (opaque grade)
Organic diarylide dye with hydrophobic character. Mainly non-nano (>100 nm) particulates
IRMM-387
BaSO4 (ultrafine grade)
Inorganic salt/mineral with low water solubility
IRMM-388
Coated TiO2 (pigment grade)
Inorganic metal oxide with thin hydrophilic coating, code Kronos 2360
IRMM-389
Basic methacrylate copolymer particles (BMC)
Hydrophilic organic particles, insoluble in water and highly soluble in most organic liquids
BAM-11
Zeolite powder
Nanoporous ceramic/mineral particulates of irregular shape with negatively charged metal-oxide surface at neutral pH

121
Annex 2 International standards on particle sizing
This Annex includes a non-exhaustive list of international standards available for particle sizing techniques.
Sizing
ISO 9276-1:1998, Representation of results of particle size analysis – Part 1: Graphical representation
ISO 9276-1:1998/Cor 1:2004
ISO 9276-2:2014, Representation of results of particle size analysis - Part 2: Calculation of average particle sizes/diameters and moments from particle size distributions
ISO 9276-3:2008, Representation of results of particle size analysis - Part 3: Adjustment of an experimental curve to a reference model
ISO 9276-6:2008, Representation of results of particle size analysis – Part 6: Descriptive and quantitative representation of particle shape and morphology
ISO 26824:2013, Particle characterization of particulate systems – Vocabulary
ISO/TS 11888:2011, Nanotechnologies – Characterization of multiwall carbon nanotubes – Mesoscopic shape factors
Sampling and sample preparation
ISO 14887:2000, Sample preparation – Dispersing procedures for powders in liquids
ISO 8780-1:1990, Pigments and extenders – Methods of dispersion for assessment of dispersion characteristics – Part 1: Introduction
ISO 8780-2:1990, Pigments and extenders – Methods of dispersion for assessment of dispersion characteristics – Part 2: Dispersion using an oscillatory shaking machine
ISO 8780-3:1990, Pigments and extenders – Methods of dispersion for assessment of dispersion characteristics – Part 3: Dispersion using a high-speed impeller mill
ISO 8780-4:1990, Pigments and extenders – Methods of dispersion for assessment of dispersion characteristics – Part 4: Dispersion using a bead mill
ISO 8780-5:1990, Pigments and extenders – Methods of dispersion for assessment of dispersion characteristics – Part 5: Dispersion using an automatic muller
ISO 8780-6:1990, Pigments and extenders – Methods of dispersion for assessment of dispersion characteristics – Part 6: Dispersion using a triple-roll mill
ISO 23900-1:2015, Pigments and extenders – Methods of dispersion and assessment of dispersibility in plastics – Part 1: General introduction
ISO/TS 16176:2011, Rubber compounding ingredients – Carbon black – Determination of the aggregate-size distribution at ultimate dispersion
Electron microscopy
ISO 13322-1:2014, Particle size analysis – Image analysis methods – Part 1: Static image analysis methods
ISO/TS 10797:2012, Nanotechnologies – Characterization of single-wall carbon nanotubes using transmission electron microscopy
ISO/TS 10798:2011, Nanotechnologies – Characterization of single-wall carbon nanotubes using scanning electron microscopy and energy dispersive X-ray spectrometry analysis
ISO 22493:2014, Microbeam analysis – Scanning electron microscopy – Vocabulary
ISO 15932:2013, Microbeam analysis – Analytical electron microscopy – Vocabulary
122
Particle tracking analysis/ Dynamic ultramicroscopy
ISO/DIS 19430, Determination of particle size distribution – Particle tracking analysis
Tunable resistive pulse sensing / electrical sensing zone / nano-Coulter-counter
ISO 13319:2007, Determination of particle size distributions – Electrical sensing zone method
Inductively coupled plasma – mass spectrometry
ISO/TS 19590:2017, Nanotechnologies - Size distribution and concentration of inorganic nanoparticles in aqueous media via single particle inductively coupled plasma mass spectrometry
ISO/TS 16965:2013, Soil quality - Determination of trace elements using inductively coupled plasma mass spectrometry (ICP-MS)
ISO 17294-1:2004, Water quality - Application of inductively coupled plasma mass spectrometry (ICP-MS) – Part 1: General guidelines
ISO 17294-2:2003, Water quality: 'Application of inductively coupled plasma mass spectroscopy (ICP-MS) – Part 2: Determination of 62 elements
ISO 30011:2010, Workplace air – Determination of metals and metalloids in airborne particulate matter by inductively coupled plasma mass spectrometry
ISO/TR 17276:2014, Cosmetics – Analytical approach for screening and quantification methods for heavy metals in cosmetics
Differential mobility analysing system / Differential electrical mobility analysis
ISO 15900:2009, Determination of particle size distribution – Differential electrical mobility analysis for aerosol particles
ISO 27891:2015, Aerosol particle number concentration – Calibration of condensation particle counters
ISO 12025:2012, Nanomaterials -- Quantification of nano-object release from powders by generation of aerosols
Analytical centrifugation
ISO 13318-1:2001, Determination of particle size distribution by centrifugal liquid sedimentation methods – Part 1: General principles and guidelines
ISO 13318-2:2007, Determination of particle size distribution by centrifugal liquid sedimentation methods – Part 2: Photocentrifuge method
ISO 13318-3:2004, Determination of particle size distribution by centrifugal liquid sedimentation methods – Part 3: Centrifugal X-ray method
ISO 15825:2017, Rubber compounding ingredients – Carbon black – Determination of aggregate size distribution by disc centrifuge photosedimentometry
Dynamic light scattering
ISO 13321:1996, Particle Size Analysis – Photon Correlation Spectroscopy
ISO 22412:2017, Particle size analysis – Dynamic light scattering (DLS)
Angular light scattering – laser diffraction
ISO 13320:2009, Particle size analysis - Laser diffraction methods.
ISO 24235:2007, Fine ceramics (advanced ceramics, advanced technical ceramics) – Determination of particle size distribution of ceramic powders by laser diffraction method
ISO 8130-13:2001, Coating powders – Part 13: Particle size analysis by laser diffraction
123
Small angle light scattering
ISO 17867:2015, Particle size analysis – Small-angle X-ray scattering
Ultrasonic spectroscopy
ISO 20998-1:2006, Measurement and characterization of particles by acoustic methods — Part 1: Concepts and procedures in ultrasonic attenuation spectroscopy
ISO 20998-2:2013, Measurement and characterization of particles by acoustic methods — Part 2: Guidelines for linear theory
ISO/CD 20998-3, Measurement and characterization of particles by acoustic methods — Part 3: Guidelines for non-linear theory
BET, Brunauer-Emmett-Teller
ISO 9277:2010, Determination of the specific surface area of solids by gas adsorption – BET method
ISO 18757:2003, Fine ceramics (advanced ceramics, advanced technical ceramics) – Determination of specific surface area of ceramic powders by gas adsorption using the BET method

GETTING IN TOUCH WITH THE EU
In person
All over the European Union there are hundreds of Europe Direct information centres. You can find the address of the centre nearest you at: https://europa.eu/european-union/contact_en
On the phone or by email
Europe Direct is a service that answers your questions about the European Union. You can contact this service:
- by freephone: 00 800 6 7 8 9 10 11 (certain operators may charge for these calls),
- at the following standard number: +32 22999696, or
- by electronic mail via: https://europa.eu/european-union/contact_en
FINDING INFORMATION ABOUT THE EU
Online
Information about the European Union in all the official languages of the EU is available on the Europa website at: https://europa.eu/european-union/index_en
EU publications
You can download or order free and priced EU publications from EU Bookshop at: https://publications.europa.eu/en/publications.
Multiple copies of free publications may be obtained by contacting Europe Direct or your local information centre (see https://europa.eu/european-union/contact_en).

KJ-N
B-2
9876-E
N-N
doi:10.2760/071877
ISBN 978-92-76-11953-1