Embed Size (px)
Citation preview
7/29/2019 Ni Hms 106724
http://slidepdf.com/reader/full/ni-hms-106724 1/12
Changing the School Environment to Increase Physical Activi ty in
Children
Lorraine Lanningham-Foster 1, Randal C. Foster 1, Shelly K. McCrady1, Chinmay Manohar 1,
Teresa B. Jensen2, Naim G. Mitre1, James O. Hill3, and James A. Levine1
1 Endocrine Research Unit Mayo Clinic, Rochester MN 55905
2 Department of Family Medicine, Mayo Clinic, Rochester, MN, 55905
3University of Colorado Health Sciences Center, Denver, Colorado 80262, USA
Abstract
OBJECTIVE—We examined the hypothesis that elementary school-age children will be more
physically active while attending school in a novel, activity-permissive school environment
compared to their traditional school environment
RESEARCH METHODS AND PROCEDURES—Twenty-four children were monitored with a
single triaxial accelerometer worn on the thigh. The students attended school in three different
environments: traditional school with chairs and desks, an activity-permissive environment, and
finally their traditional school with desks which encouraged standing. Data from the school children
was compared with another group of age-matched children (n = 16) whose physical activity was
monitored during summer vacation.
RESULTS—When children attended school in their traditional environment, they moved an average
(mean ± standard deviation) 71 ± 0.4 m/s2. When the children attended school in the activity-
permissive environment, they moved an average of 115 ± 3 m/s2. The children moved 71 ± 0.7 m/
s2
while attending the traditional school with standing desks. Children moved significantly morewhile attending school in the activity-permissive environment compared to the amount that they
moved in either of the traditional school environments (P<0.0001 for both). Comparing children’s
activity while they were on summer vacation (113 ± 8 m/s2) to school-bound children in their
traditional environment showed significantly more activity for the children on summer vacation
(P<0.0001). The school children in the activity-permissive environment were as active as children
on summer vacation.
DISCUSSION—Children will move more in an activity-permissive environment. Strategies to
increase the activity of school children may involve re-designing the school itself.
Keywords
accelerometry; environmental factors; pediatrics
Introduction
Poor diet and physical inactivity are associated with 400,000 deaths per year (1). The situation
is projected to get far worse because now there are three times more obese children than there
were 2 decades ago (2,3). It is imperative for both health (4,5) and fiscal (6,7) reasons that
Correspondence: James A. Levine, M.D., Ph.D., Endocrine Research Unit, 5-194 Joseph, Mayo Clinic, 200 First Street, SW, Rochester,MN 55905, Phone: (507) 284-2191; Fax: (507) 255-4828, e-mail: E-mail: [email protected].
NIH Public AccessAuthor ManuscriptObesity (Silver Spring). Author manuscript; available in PMC 2009 June 4.
Published in final edited form as:
Obesity (Silver Spring). 2008 August ; 16(8): 1849–1853. doi:10.1038/oby.2008.282.
NI H-P A A u
t h or Manus c r i pt
NI H-P A A ut h or Manus c r i pt
NI H-P A A ut h or M
anus c r i pt
7/29/2019 Ni Hms 106724
http://slidepdf.com/reader/full/ni-hms-106724 2/12
effective childhood obesity prevention and intervention programs be developed immediately.
Previous approaches to reverse low levels of physical activity in children have generally
focused on impacting the behaviors that children and their parents engage in at school and/or
at home (8,9). However, these approaches, in general, vary in success. Rather than trying to
impact behavior, one wonders whether a redesigned physical infrastructure could impact how
children behave.
Collaborators from the local school board, private developers, a large computer company, and ourselves built a new type of school environment we called ‘The Neighborhood’. The
Neighborhood was designed specifically to encourage an active learning environment. While
children were learning everything that they would in a traditional classroom, they were moving
about in a dynamic, fun space that promoted physical activity. One aspect of the redesigned
physical infrastructure was to provide the children with more opportunities for standing during
the school day. We have previously shown in adults that obese adults stand for significantly
fewer minutes per day compared to lean adults (10). In the present study we examined the
hypothesis that elementary school-age children will be more physically active while attending
school in a novel, activity-permissive school environment compared to their traditional school
environment. We also examined a more practical approach that could be easily adopted in
schools across the country: replacing traditional classroom tables and chairs with vertical work
stations. Finally, we compared the level of physical activity of children in the three school
environments to the level of physical activity of children who were on summer vacation.
Methods
Participants
One classroom of grade 4/5 students (14 girls, 10 boys) and their teacher were selected from
the Rochester Public School district to participate in the study. Another group of similarly-
aged children (6 girls, 10 boys) underwent physical activity monitoring during the summer
months when school was not in session. Each child’s weight and height were measured using
a calibrated digital scale (Scale-Tronix 5005 Stand-On Scale, White Plains, NY) and attached
stadiometer. BMI percentile was determined using Centers for Disease Control (CDC) growth
charts. Using these growth charts, 2 children were underweight, 7 children were at risk for
overweight, 7 children were overweight and 24 children were normal weight (Table 1). The
study was approved by the Mayo Clinic’s Pediatric and Adolescent Medicine Research
Committee and the Institutional Review Board. Informed written assent was obtained from the
child and informed written consent was obtained from the parent(s).
School Environments
The focus of the project was evaluating the impact of novel school environments on physical
activity in elementary-school children. The students attended school in three different
environments: traditional school with chairs and desks, an activity-permissive environment
called “The Neighborhood” which allowed more activities and movement, and finally their
traditional school with desks which encouraged standing called the “Standing Classroom”.
Learning tools (notebook computers and video iPods) were generously borrowed from Apple
Computers for use both in The Neighborhood and in the Standing Classroom.
The traditional school environment was a grade 4/5 classroom at Elton Hills Elementary
School in Rochester, MN. The classroom had individual table/chair desks for each student and
the seating chart was fixed and assigned by the teacher weekly. Children were allowed to get
out of their desks for breaks, lunch, class projects, and physical education, but were encouraged
to sit at their assigned seat for the majority of the school day.
Lanningham-Foster et al. Page 2
Obesity (Silver Spring). Author manuscript; available in PMC 2009 June 4.
NI H-P A A
ut h or Manus c r i pt
NI H-P A A ut h or Manus c r i pt
NI H-P A A ut h or
Manus c r i pt
7/29/2019 Ni Hms 106724
http://slidepdf.com/reader/full/ni-hms-106724 3/12
The activity permissive environment was housed at the Rochester Athletic Club, Rochester,
MN. The Neighborhood was designed specifically to encourage an active learning
environment; it was enclosed, centrally heated and air conditioned. It was 35,000 feet2 and
resembled a village square. The actual “classroom” was a plasticized hockey rink complete
with standing desks and vertical, mobile white-boards that allowed for activity-permissive
lessons. The Neighborhood also included miniature golf, basketball hoops, indoor soccer,
climbing mazes and activity promoting games (11). The children used wireless laptop
computers and portable video display units to facilitate mobile learning. Children were allowed to move throughout the Neighborhood during lesson plans.
The third environment, the Standing Classroom, combined aspects of the traditional school
environment and The Neighborhood. Although The Neighborhood offered many and varied
opportunities for physical activity and alternative learning, the study investigators recognized
that this environment was likely not a feasible environment for typical U.S. schools to adopt
considering such issues as funding, space, and safety concerns. We therefore utilized the
traditional grade 4/5 classroom and replaced the chair/table desks with the same vertical desks
from The Neighborhood where children could stand during lessons. We retained 4–5 of the
traditional chairs/tables in this environment as an option for children. Anti-fatigue floor-mats
were provided to the students. The desks were arranged daily by the students under the
supervision of their teacher. The vertical desks were adjustable in height which allowed the
students to stand or kneel at their workstations. The students were also given 3 stability ballswhich could be shared in the classroom and used for more active sitting time.
Physical Activity Monitors
Students wore a triaxial accelerometer (Model MMA 7260Q, Spark Fun Electronics, Boulder,
CO) on the thigh with a range of ± 2 g’s with the data being sampled at 10 times per second.
The zero g point on the sensor occurs at 1.66 V, and 1 g =0.303 V. For physical activity
monitoring during the summer vacation, children wore a biaxial inclinometer (Model CXTA02,
Crossbow Technology Inc., San Jose, CA.) on the thigh with a reported range of ± 1.25 g’s
(12). The inclinometer is an analog sensor and data is sampled 2 times per second. The zero
g point on the sensor occurs at 2.5 V, and 1 g = 2.0 V.
We used different physical activity monitors with the students and children who were on
summer vacation. We have performed comparison tests to measure movement in children using
both types of accelerometers. Seven children (2 males, 5 females, mean ± SD age 10.4 ± 1.5
years) wore the Spark Fun and Crossbow monitors simultaneously on the right thigh while
they were lying, sitting, standing, and walking at 0.5, 1.0, 1.5 and 2.0 mph. The two physical
activity monitors were tested in this validation experiment where the two systems were co-
located on participants and the accelerometer results were compared between the systems. The
results were not significantly different. The two systems correlated very well (r 2 > 0.95) with
the slope of the regression between the two systems of 1.015 and the intercept of the regression
of the two systems not significantly different from 0. A residual plot of the regression showed
a random distribution of residuals with > 99% of the residuals (measured value – fitted value)
falling below the acceleration difference between 0.5 mph (0.22 m/s) speed increments on the
treadmill. Another important consideration when choosing monitors used for the study was
cost. The Spark Fun accelerometer was more affordable ($25 US dollars compared to $230 USdollars). Because we needed to produce enough monitors for 24 children at the same time, we
elected to use the Spark Fun accelerometer for the students.
Lanningham-Foster et al. Page 3
Obesity (Silver Spring). Author manuscript; available in PMC 2009 June 4.
NI H-P A A
ut h or Manus c r i pt
NI H-P A A ut h or Manus c r i pt
NI H-P A A ut h or
Manus c r i pt
7/29/2019 Ni Hms 106724
http://slidepdf.com/reader/full/ni-hms-106724 4/12
Protocol
School-time Physical Activit y Monitoring
The duration of the protocol was 12 weeks during the springtime (March – May). The typical
school day started at 9:15 AM. The children experienced a play break at 10 AM and lunch time
was around the noon hour. During lunch time, the children were also allowed free-play after
their meal. The students remained in their classroom for a majority of their school day, but
attended weekly music, art, and physical education classes outside of their classroom. Amajority of the free-play time at recess and lunch occurred outside where playground
equipment, basketball courts, and playing fields were available to all students. The school day
ended at 3:35 PM. The usual school-day schedule was adhered to throughout the study period
in all school environments. The state curriculum was adhered to at all times.
The Superintendent, School Principal, and teacher attended preliminary planning meetings to
help develop the research protocol so that the study investigators took into consideration
specific concerns about lesson plans, disruption to the school day, and parent involvement.
Parents and students were invited to attend preliminary informational meetings about the study
presented by the study investigators, and they were also allowed to visit the activity-permissive
environment at the Rochester Athletic Club.
Week one of the study occurred in the traditional school environment with no changes in theschool classroom design (Table 2). For each school environment, the goal was to collect 3–4
days of physical activity data (13–15). This number of days of data collection was chosen in
order to obtain a more stable and reliable measure of physical activity. At the start of the school
day, study investigators placed the triaxial accelerometer onto the right outer thigh using elastic
material (Coban, 3M, St. Paul, MN). The accelerometer was connected to a data logger (Ready
DAQ AD2000, Valitec, Dayton, OH) that was worn in a waist-pack (Figure 1). The study
investigators started the data collection for each child. Placement of sensors on all children
occurred during the first 10 minutes or less of class time, to minimize disruption to the school
day. Children wore the accelerometers for the entire school day. At the end of the school day,
the study investigators returned to stop the data loggers and help the students remove the
accelerometers. The removal process occurred in the last 10 minutes of the school day. The
data loggers were downloaded daily at Mayo Clinic and returned each morning for the next
day’s data collection period. Physical activity was monitored for 4 days during study week 1.
During study week 2 the children attended classes in The Neighborhood. During study week
2, students attended classes without physical activity monitoring for 2 days in order to adjust
to the new school environment (Table 2). Each morning the children arrived to Elton Hills
Elementary and then they were bused 1.5 miles to the Rochester Athletic Club. After the
acclimation period, physical activity was monitored in the same manner as described above.
The accelerometers were placed in the morning by study investigators and removed at the end
of the school day. The data loggers were downloaded daily onto a personal computer and
returned each morning for the next day’s data collection period. Physical activity was
monitored for one day during week 2 and for 2 days during week 3 while students were in The
Neighborhood.
After attending classes in The Neighborhood, children returned to attending classes at EltonHills Elementary in the Standing Classroom. Physical activity was monitored for the first 3
days after returning to the modified traditional environment using the thigh-worn
accelerometers (Figure 1). For the next 8 weeks of the study, children attended school in the
Standing Classroom. Physical activity was not monitored during this time period. During the
last week of the study, physical activity was once again monitored for 4 days using the thigh-
worn accelerometers.
Lanningham-Foster et al. Page 4
Obesity (Silver Spring). Author manuscript; available in PMC 2009 June 4.
NI H-P A A
ut h or Manus c r i pt
NI H-P A A ut h or Manus c r i pt
NI H-P A A ut h or
Manus c r i pt
7/29/2019 Ni Hms 106724
http://slidepdf.com/reader/full/ni-hms-106724 5/12
Summer Vacation Physical Activity Monitoring
Physical activity was monitored in a separate group of similarly aged children using one axis
of a biaxial thigh-worn inclinometer and data logger (Ready DAQ AD2000, Valitec) over a
10 day period. The inclinometer was fixed onto Lycra® shorts using Velcro® straps (12).
Children reported daily to the Mayo Clinic General Clinical Research Center (GCRC) where
study investigators placed the inclinometer and performed daily downloads of the previous
day’s data. Children were allowed to continue all of their normal activities except for swimming
because the monitoring equipment was not waterproof. All waking hours were monitored.
Data Analysis
Height, weight, age, sex, BMI, and acceleration data were calculated for each child. Data from
the accelerometers worn by students were analyzed through standard kinematic equations
(ΣΔA/Δt over a 1 minute epoch) (16,17,18). Data from the accelerometers worn by the students
were transformed to match inclinometers worn by the children whose physical activity was
monitored during summer vacation. To compare the two activity monitors, one axis on the
accelerometer that matched one axis on the inclinometer was compared: 1) The axis coincident
with the long axis of the femur from the school accelerometer data was sampled 2 times each
second to match the axis and the sampling rate of the summer vacation inclinometer data. All
resampled signals (resampled from 10 times each second to 2 times each second) from each
subject were compared to ensure no aliasing of the signal occurred (data not shown). 2) Datafrom the students was “clipped” to a maximum output of ± 1.25 V by changing any value
outside the ± 1.25 V range to exactly 1.25 V or −1.25 V. This mimics the behavior of the sensor
used for the summer vacation inclinometer data. 3) Both sensor outputs were mathematically
converted to m/s2. Acceleration was recorded as the sign-corrected differential of each
consecutive data point summated over a 1 minute epoch.
To address our hypothesis that the activity permissive school environment increases student
physical activity, we used ANOVA with post hoc paired t-tests. To evaluate school-time and
summer vacation physical activity, we used ANOVA with post hocunpaired t-tests. Statistical
analyses were conducted using StatView v. 5.0 (SAS Institute, Cary, N.C.).
Results
All children in the study tolerated the protocol well and enjoyed participating in the study.
Characteristics of the children are listed in Table 1. For the students, the children (10 ± 1 years,
10 M, 14 F) were of varying height (142 ± 9 cm) and weight (41 ± 15 kg); BMI was 20 ± 5
kg/m2. Seventeen of the students were considered normal weight according to their BMI
(15th percentile<BMI<85th percentile) 1 student was at risk for overweight (85th
percentile<BMI≤ 94th percentile), 4 students were overweight (BMI ≥ 95th percentile) and 2
students were underweight (BMI ≤ 15th percentile). The children on summer vacation (10 ± 1
years, 10 M, 6 F) were of varying height (145 ± 12 cm) and weight (45 ± 13 kg); BMI was 21
± 5 kg/m2. Seven of the children were considered normal weight according to their BMI
(15th percentile<BMI<85th percentile), 6 students were at risk for overweight (85th
percentile<BMI≤ 94th percentile), and 3 students were overweight (BMI ≥ 95th percentile).
There were no significant differences in age, height, weight, and BMI percentile between the
students and the children on summer vacation.
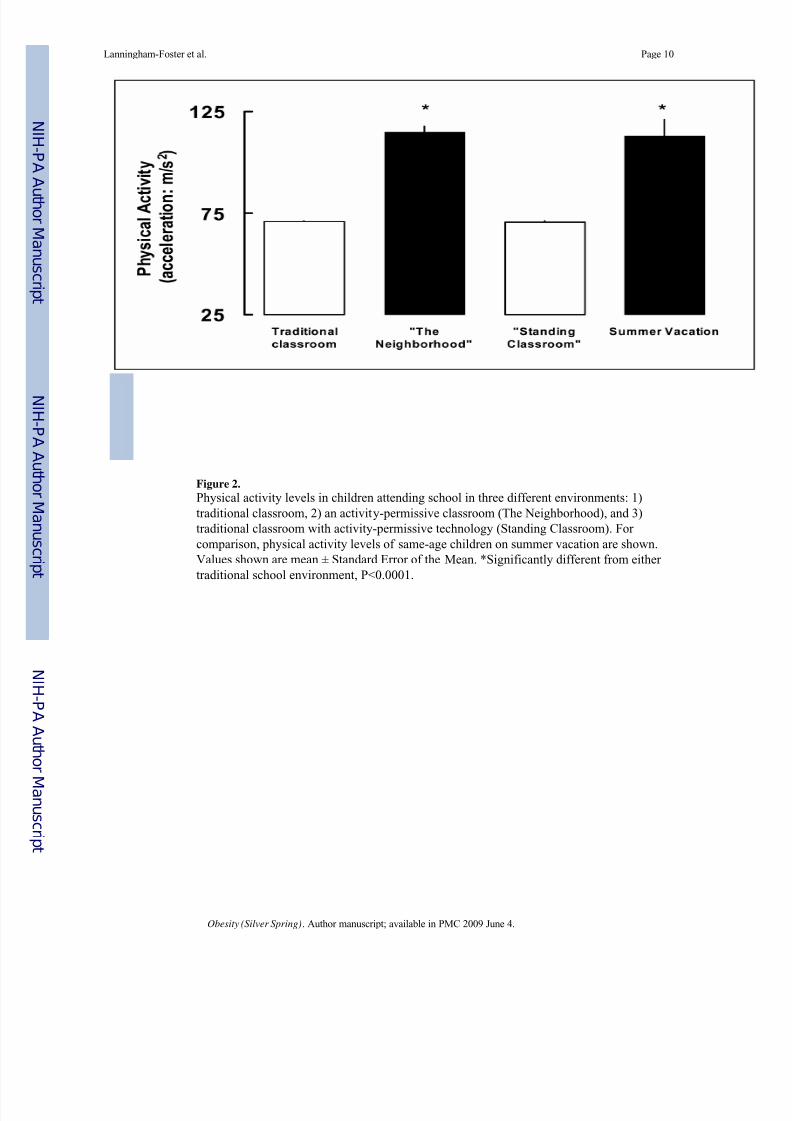
There was no significant difference in activity in the Standing Classroom between weeks 3 and
12 and these days of monitoring were averaged in our analysis. When placed in The
Neighborhood the children moved an average of 115 ± 3 m/s2 vs. 71 ± 0.4 m/s2 at traditional
school and 71 ± 0.7 m/s2 at traditional school with standing desks (Figure 2). There was a
significant difference in activity between The Neighborhood and both school environments
Lanningham-Foster et al. Page 5
Obesity (Silver Spring). Author manuscript; available in PMC 2009 June 4.
NI H-P A A
ut h or Manus c r i pt
NI H-P A A ut h or Manus c r i pt
NI H-P A A ut h or
Manus c r i pt
7/29/2019 Ni Hms 106724
http://slidepdf.com/reader/full/ni-hms-106724 6/12
(P<0.0001 for both). There was no significant difference in activity between in the traditional
school environments. Upon comparing free-living (113 ± 32 m/s2) to school-bound children
(71 ± 0.4 m/s2), we found that there was significantly more activity in the children on summer
vacation (P<0.0001, Figure 2). The physical activity of school children in The Neighborhood
was virtually identical to the physical activity of children who were out of school for summer
vacation.
DiscussionObesity is a complex disease and the mechanisms targeted thus far in childhood obesity
prevention/intervention strategies include behavioral, biological processes, genetics, social,
and environmental approaches (19–23). Behavioral and environmental approaches are
accepted as important frontline therapies for children, primarily due to ethical considerations.
However, it is also becoming increasingly apparent that more novel approaches beyond
encouraging children to eat less and be more physically active are needed (24). In the present
study we focused on a novel school-based environmental approach to the obesity epidemic in
children.
We first compared physical activity levels, measured using validated technology (12), between
a traditional school environment and an activity permissive school environment, ‘The
Neighborhood’. The Neighborhood was associated with a 50% increase in physical activity(Figure 2). In general, the increase in physical activity was dispersed throughout the school
day, for example children would walk or play games while they reviewed lessons with mobile
learning technologies.
To determine if the increase in physical activity associated with The Neighborhood was
because the students were given the opportunity to move or because of the building per se we
replaced the chairs and desks in the children’s traditional classroom with the same standing
desks and educational technology that were used in The Neighborhood. Physical activity levels
of students attending class in the traditional school environment and the physical activity levels
of students attending class in the Standing Classroom were remarkably similar to each other.
It therefore appeared that The Neighborhood building was associated with the increase in
physical activity rather than the educational technologies. Interestingly, the increased physical
activity associated with The Neighborhood enabled the children to be as active as similarlyaged-children would be during their summer vacation, where the activity-restricting effects of
school are absent.
Presently, there is little information about modifying the school environment to increase
physical activity in children (25). There has been an association with physical activity levels
and the number of activity-related equipment and structures (such as balls and soccer nets)
(26,27). For example if children have greater access to the soccer balls and goals with nets
during recess, they are more likely to be active compared to when the equipment and structures
are absent. This observation appears to be more robust when children are under adult
supervision.
In a different approach, one group modified the school environment by using colorful,
fluorescent playground markings to encourage play in school children (28). Heart ratemonitoring was used to compare time spent in moderate vigorous physical activity and vigorous
physical activity of children (n = 99, 51 boys, 48 girls) attending school in either intervention
or control schools. This interesting and low-cost approach to modifying the school environment
was associated with increased time spent in moderate vigorous and vigorous physical activity
in intervention schools compared with control schools. It has also been reported that larger
school space is associated with higher levels of physical activity in middle school students
Lanningham-Foster et al. Page 6
Obesity (Silver Spring). Author manuscript; available in PMC 2009 June 4.
NI H-P A A
ut h or Manus c r i pt
NI H-P A A ut h or Manus c r i pt
NI H-P A A ut h or
Manus c r i pt
7/29/2019 Ni Hms 106724
http://slidepdf.com/reader/full/ni-hms-106724 7/12
(29). Children attending school in the largest spaces who had their physical activity monitored
by accelerometry were walking approximately 2 extra miles over the course of a school week.
Although our study demonstrates that changing the school environment can impact students’
physical activity levels, we recognize that there are limitations to our study. This study focused
on a single classroom of students during part of the school year. Future studies with more
classrooms and for a longer period of time may address the sustainability of such an
intervention. We also only monitored physical activity during the school day. It would beinteresting to monitor all daily physical activity in future studies to more thoroughly understand
the impact of school environmental changes on children’s physical activity levels. With our
study design, there was a potential for period effects. It would have been helpful if we had
monitored physical activity in another classroom that had been transformed into the Standing
Classroom before experiencing the activity permissive environment in The Neighborhood. We
did not evaluate the impact of this intervention on academic performance. However we
included the District Elementary Facilitator with our study team to help ensure that academics
were not compromised during the research protocol. The Facilitator’s role is to oversee
curriculum and Minnesota Academic Standards for elementary grades in the district. Finally,
there may be various psychosocial factors (such as enthusiasm of teacher, social acceptance
for exercise and movement) that impacted our observations of physical activity in the three
environments. Future studies in this area will include psychosocial measurements to help us
to better understand how these factors impact physical activity levels in children.
One way to address the recent increase in childhood obesity is to develop new approaches to
increase daily physical activity levels during school. If our studies are confirmed in larger future
studies, these data suggest that we may need to design activity-promoting buildings so that
children can move more. Reversing low physical activity and obesity in children may require
broad-based collaboration whereby physical infrastructure becomes coupled to health.
Acknowledgements
We would like to acknowledge Phil Rynearson, Greg Lappin, John Couch, Jerry Williams, Mary Fitzwater, Carol
Lucido, Stephanie Rupp, Ron Gerling, and Diane Trisko for their assistance in planning and implementing the study.
This work was supported by DK 50456, 56650, 63226, 66270, HD 52001 and M01-RR00585.
References
1. Mokdad AH, Marks JS, Stroup DF, Gerberding JL. Actual causes of death in the United States, 2000.
JAMA 2004;291(10):1238–1245. [PubMed: 15010446]
2. Ogden CL, Carroll MD, Curtin LR, McDowell MA, Tabak CJ, Flegal KM. Prevalence of overweight
and obesity in the United States, 1999–2004. JAMA 2006;295(13):1549–1555. [PubMed: 16595758]
3. Flegal KM, Troiano RP. Changes in the distribution of body mass index of adults and children in the
US population. Int J Obes Relat Metab Disord 2000;24(7):807–818. [PubMed: 10918526]
4. Finkelstein EA, Brown DS, Trogdon JG, Segel JE, Ben-Joseph RH. Age-specific impact of obesity on
prevalence and costs of diabetes and dyslipidemia. Value Health 2007;10(Suppl 1):S45–S51.
5. Must A, Strauss RS. Risks and consequences of childhood and adolescent obesity. Int J Obes Relat
Metab Disord 1999;23(Suppl 2):S2–S11. [PubMed: 10340798]
6. Finkelstein EA, Ruhm CJ, Kosa KM. Economic causes and consequences of obesity. Annu Rev Public
Health 2005;26:239–257. [PubMed: 15760288]
7. Gortmaker SL, Must A, Perrin JM, Sobol AM, Dietz WH. Social and economic consequences of
overweight in adolescence and young adulthood. N Engl J Med 1993;329(14):1008–1012. [PubMed:
8366901]
8. Reilly JJ, McDowell ZC. Physical activity interventions in the prevention and treatment of paediatric
obesity: systematic review and critical appraisal. Proc Nutr Soc 2003;62(3):611–619. [PubMed:
14692597]
Lanningham-Foster et al. Page 7
Obesity (Silver Spring). Author manuscript; available in PMC 2009 June 4.
NI H-P A A
ut h or Manus c r i pt
NI H-P A A ut h or Manus c r i pt
NI H-P A A ut h or
Manus c r i pt
7/29/2019 Ni Hms 106724
http://slidepdf.com/reader/full/ni-hms-106724 8/12
9. Flodmark CE, Marcus C, Britton M. Interventions to prevent obesity in children and adolescents: a
systematic literature review. Int J Obes (Lond) 2006;30(4):579–589. [PubMed: 16570086]
10. Levine JA, Lanningham-Foster LM, McCrady SK, Krizan AC, Olson LR, Kane PH, et al.
Interindividual variation in posture allocation: possible role in human obesity. Science 2005;307
(5709):584–586. [PubMed: 15681386]
11. Lanningham-Foster L, Jensen TB, Foster RC, Redmond AB, Walker BA, Heinz D, et al. Energy
expenditure of sedentary screen time compared with active screen time for children. Pediatrics
2006;118(6):e1831–e1835. [PubMed: 17142504]
12. Lanningham-Foster LM, Jensen TB, McCrady SK, Nysse LJ, Foster RC, Levine JA. Laboratory
measurement of posture allocation and physical activity in children. Med Sci Sports Exerc 2005;37
(10):1800–1805. [PubMed: 16260984]
13. Trost SG, Pate RR, Freedson PS, Sallis JF, Taylor WC. Using objective physical activity measures
with you: how many days of monitoring are needed? Med Sci Sports Exerc 2000;32(2):426–431.
[PubMed: 10694127]
14. Tudor-Locke C, Burkett L, Reis JP, Ainsworth BE, Macera CA, Wilson DK. How many days of
pedometer monitoring predict weekly physical activity in adults? Prev Med 2004;40(3):293–298.
[PubMed: 15533542]
15. Vincent SD, Pangrazi RP. Does reactivity exist in children when measuring activity levels with
pedometers? Pediatr Exerc Sci 2002;14(1):56–63.
16. Winter, DA. Kinematics. In: Winter, DA., editor. Biomechanics and Motor Control of Human
Movement. Vol. 3rd ed. Hoboken, NJ, USA: John Wiley; p. 13-59.
17. Robertson, DGE.; Caldwell, GE.; Hamill, J.; Selbie, WS. Part I, Kinematics. In: Robertson, DGE.;
Caldwell, EC.; Hamill, J.; Selbie, WS.; Kamen, G.; Whittlesey, SN., editors. Research Methods in
Biomechanics. Vol. 1st ed. Champaign, IL, USA: Human Kinetics Pub; p. 1-9.
18. Foster RC, Lanningham-Foster LM, Levine JA. Optimization of accelerometers for measuring
walking. Journal of Sports Engineering and Technology. 2008In press
19. Hill JO, Wyatt HR, Reed GW, Peters JC. Obesity and the environment: where do we go from here?
Science 2003;299(5608):853–855. [PubMed: 12574618]
20. Dowda M, Ainsworth BE, Addy CL, Saunders R, Riner W. Environmental influences, physical
activity, and weight status in 8- to 16-year-olds. Arch Pediatr Adolesc Med 2001;155(6):711–717.
[PubMed: 11386963]
21. Gortmaker SL, Must A, Sobol AM, Peterson K, Colditz GA, Dietz WH. Television viewing as a cause
of increasing obesity among children in the United States, 1986–1990. Arch Pediatr Adolesc Med
1996;150(4):356–362. [PubMed: 8634729]
22. Vandewater EA, Shim MS, Caplovitz AG. Linking obesity and activity level with children's television
and video game use. J Adolesc 2004;27(1):71–85. [PubMed: 15013261]
23. Dietz WH. Overweight in childhood and adolescence. N Engl J Med 2004;350(9):855–857. [PubMed:
14985480]
24. Huang TT, Horlick MN. Trends in Childhood Obesity Research: A Brief Analysis of NIH-Supported
Efforts. J Law Med Ethics 2007;35(1):148–153. [PubMed: 17341223]
25. Davison KK, Lawson CT. Do attributes in the physical environment influence children's physical
activity? A review of the literature. Int J Behav Nutr Phys Act 2006;3:19. [PubMed: 16872543]
26. Sallis JF, Conway TL, Prochaska JJ, McKenzie TL, Marshall SJ, Brown M. The association of school
environments with youth physical activity. Am J Public Health 2001;91(4):618–620. [PubMed:
11291375]
27. Fein AJ, Plotnikoff RC, Wild TC, Spence JC. Perceived environment and physical activity in youth.
Int J Behav Med 2004;11(3):135–142. [PubMed: 15496341]28. Stratton G, Mullan E. The effect of multicolor playground markings on children’s physical activity
level during recess. Prev Med 2005;41(56):828–833. [PubMed: 16137756]
29. Cradock AL, Melly SJ, Allen JG, Morris JS, Gortmaker SL. Characteristics of school campuses and
physical activity among youth. Am J Prev Med 2007;33(2):106–113. [PubMed: 17673097]
Lanningham-Foster et al. Page 8
Obesity (Silver Spring). Author manuscript; available in PMC 2009 June 4.
NI H-P A A
ut h or Manus c r i pt
NI H-P A A ut h or Manus c r i pt
NI H-P A A ut h or
Manus c r i pt
7/29/2019 Ni Hms 106724
http://slidepdf.com/reader/full/ni-hms-106724 9/12
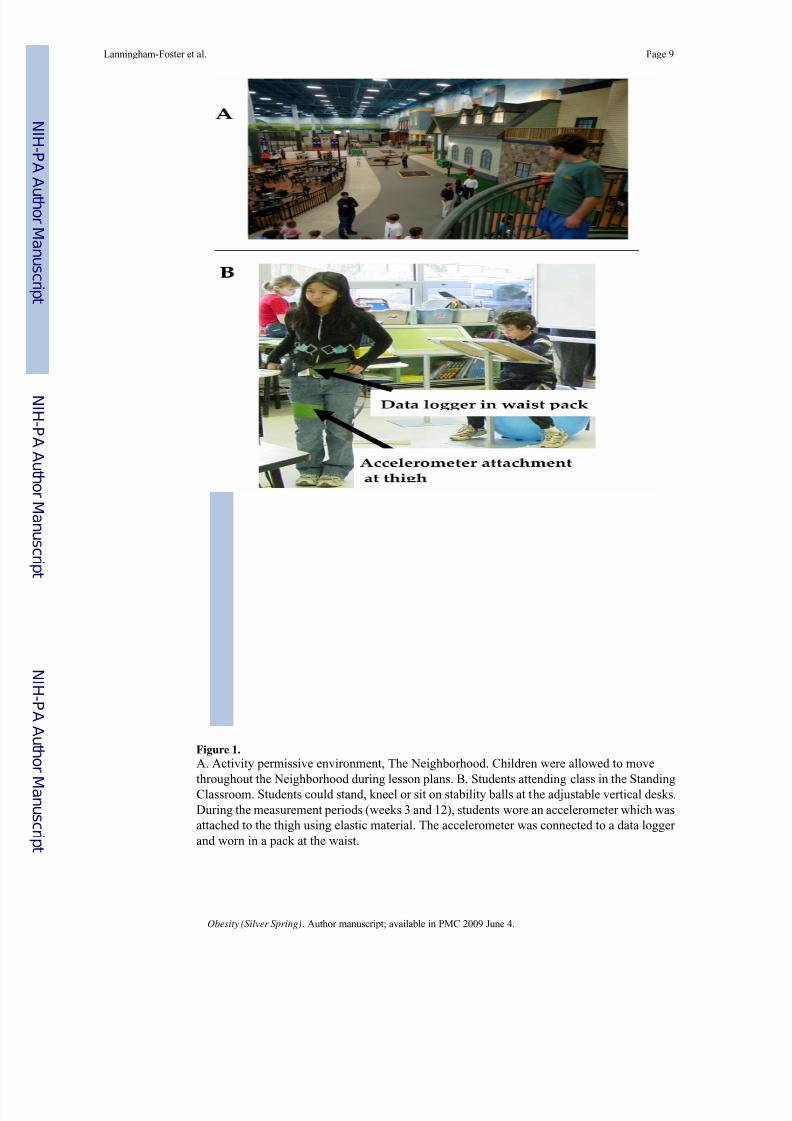
Figure 1.
A. Activity permissive environment, The Neighborhood. Children were allowed to move
throughout the Neighborhood during lesson plans. B. Students attending class in the Standing
Classroom. Students could stand, kneel or sit on stability balls at the adjustable vertical desks.
During the measurement periods (weeks 3 and 12), students wore an accelerometer which was
attached to the thigh using elastic material. The accelerometer was connected to a data logger
and worn in a pack at the waist.
Lanningham-Foster et al. Page 9
Obesity (Silver Spring). Author manuscript; available in PMC 2009 June 4.
NI H-P A A
ut h or Manus c r i pt
NI H-P A A ut h or Manus c r i pt
NI H-P A A ut h or
Manus c r i pt
7/29/2019 Ni Hms 106724
http://slidepdf.com/reader/full/ni-hms-106724 10/12
Figure 2.
Physical activity levels in children attending school in three different environments: 1)
traditional classroom, 2) an activity-permissive classroom (The Neighborhood), and 3)
traditional classroom with activity-permissive technology (Standing Classroom). For
comparison, physical activity levels of same-age children on summer vacation are shown.
Values shown are mean ± Standard Error of the Mean. *Significantly different from either
traditional school environment, P<0.0001.
Lanningham-Foster et al. Page 10
Obesity (Silver Spring). Author manuscript; available in PMC 2009 June 4.
NI H-P A A
ut h or Manus c r i pt
NI H-P A A ut h or Manus c r i pt
NI H-P A A ut h or
Manus c r i pt
7/29/2019 Ni Hms 106724
http://slidepdf.com/reader/full/ni-hms-106724 11/12
NI H-P A
A ut h or Manus c r i pt
NI H-P A A ut h or Manus c r
i pt
NI H-P A A ut h
or Manus c r i pt
Lanningham-Foster et al. Page 11
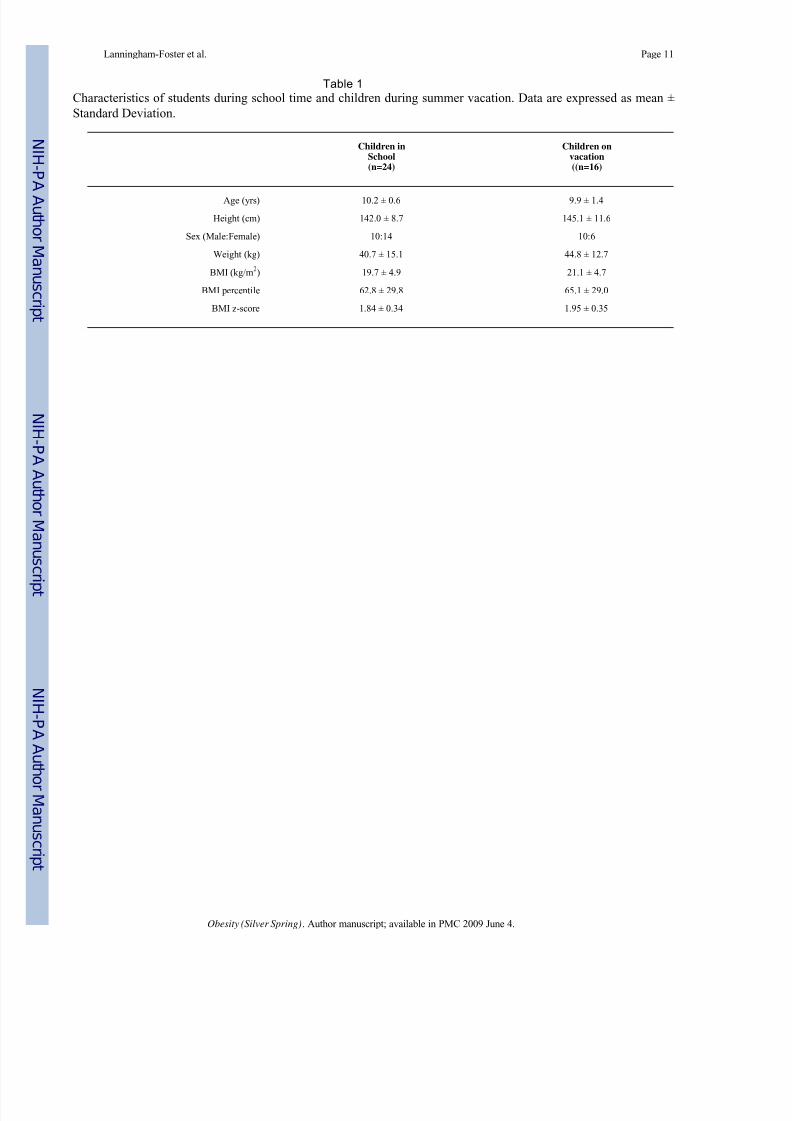
Table 1
Characteristics of students during school time and children during summer vacation. Data are expressed as mean ±
Standard Deviation.
Children inSchool(n=24)
Children onvacation((n=16)
Age (yrs) 10.2 ± 0.6 9.9 ± 1.4
Height (cm) 142.0 ± 8.7 145.1 ± 11.6
Sex (Male:Female) 10:14 10:6
Weight (kg) 40.7 ± 15.1 44.8 ± 12.7
BMI (kg/m2) 19.7 ± 4.9 21.1 ± 4.7
BMI percentile 62.8 ± 29.8 65.1 ± 29.0
BMI z-score 1.84 ± 0.34 1.95 ± 0.35
Obesity (Silver Spring). Author manuscript; available in PMC 2009 June 4.
7/29/2019 Ni Hms 106724
http://slidepdf.com/reader/full/ni-hms-106724 12/12
NI H-P A
A ut h or Manus c r i pt
NI H-P A A ut h or Manus c r
i pt
NI H-P A A ut h
or Manus c r i pt
Lanningham-Foster et al. Page 12
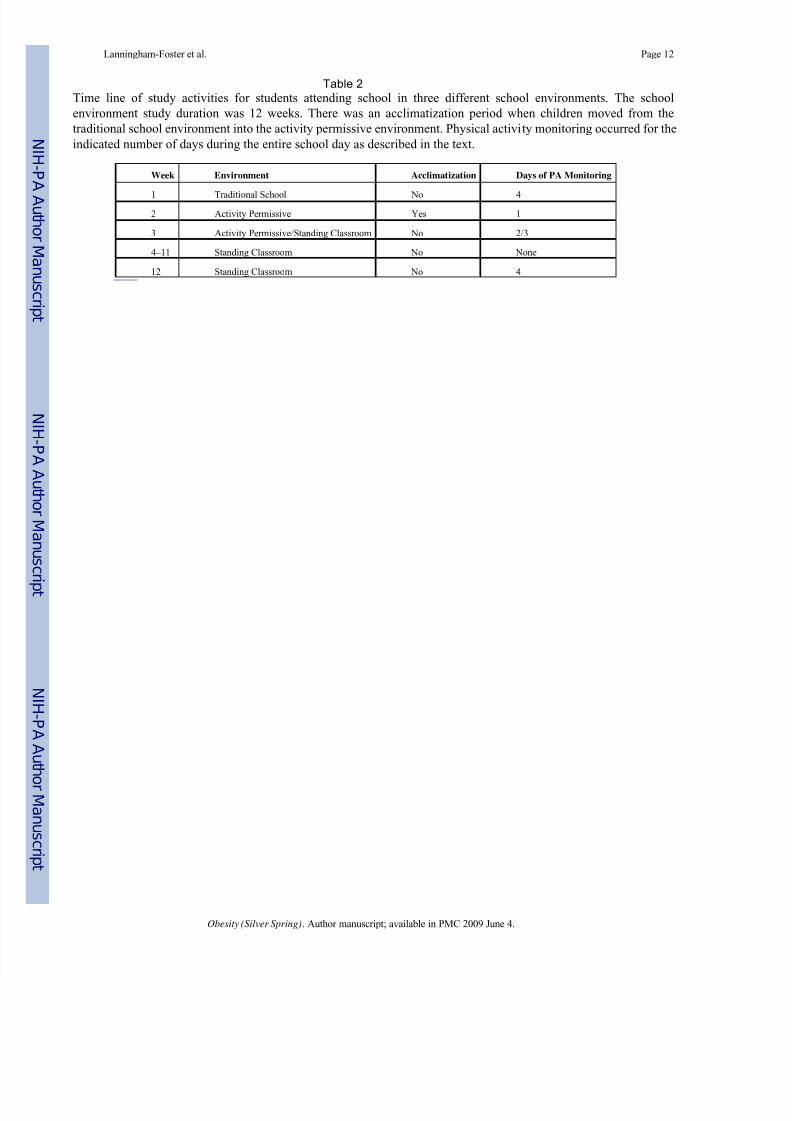
Table 2
Time line of study activities for students attending school in three different school environments. The school
environment study duration was 12 weeks. There was an acclimatization period when children moved from the
traditional school environment into the activity permissive environment. Physical activity monitoring occurred for the
indicated number of days during the entire school day as described in the text.
Week Environment Acclimatization Days of PA Monitoring
1 Traditional School No 4
2 Activity Permissive Yes 1
3 Activity Permissive/Standing Classroom No 2/3
4–11 Standing Classroom No None
12 Standing Classroom No 4
Obesity (Silver Spring). Author manuscript; available in PMC 2009 June 4.