Embed Size (px)
Citation preview
78
NITROGEN CYCLING AND COMPOSTING TECHNOLOGIES IN LIVESTOCK MANURE
MANAGEMENT
(Siklus Nitrogen dan Teknologi Pengomposan pada Manajemen Pupuk Asal Ternak)
Ladiyani Retno Widowati, Rochayati S, Saraswati R
Indonesian Soil Research Institute Jl. Tentara Pelajar No. 12, Bogor 16114, Indonesia
ABSTRAK
Pada sistem produksi ternak, produksi limbah berlangsung dalam jumlah yang signifikan sejalan dengan pertumbuhan populasi. Limbah ternak memiliki fraksi biokimia, dengan level N dan C total yang relatif tinggi yang memungkinkan untuk digunakan sebagai sumber pupuk organik, tetapi memerlukan penanganan lebih karena limbah berpotensi untuk menghasilkan green house gas (GHG) dalam bentuk N2O. Telah diprediksi bahwa kontribusi dari sistem produksi ternak sekitar 19,2% dari jumlah totalnya. Emisi tersebut harus direduksi sesuai dengan sejumlah prosedur yang tertera pada Keputusan Presiden No. 61/2011 pada rencana aksi nasional untuk pengurangan emisi GHG. Dari usaha ini, tujuan utamanya adalah memodifikasi pemineralan nitrogen untuk mereduksi limbah N2O. Disamping itu, limbah peternakan akan sangat menguntungkan jika dikelola dengan baik (contohnya pengomposan) dan secara tidak langsung menekan dampak lingkungan secara luas seperti emisi N2O dan NO3 dengan membersihkannya ke dalam air. Ada beberapa cara pengkomposan yang dapat dipilih sesuai dengan tujuan pengkomposan. Metode pengkomposan aerob adalah alternatif terbaik dibandingkan dengan yang anaerob. Tetapi jika CH4 yang dihasilkan akan digunakan sebagai biogas, maka yang digunakan adalah proses anaerob. Parameter dari kematangan kompos biasanya tergantung pada rasio C/N dan temperatur, akan tetapi ada beberapa pertimbangan parameter untuk mengenali kualitas kompos.
Kata Kunci: Siklus Nitrogen, Limbah Peternakan, Dekomposisi, Pengkomposan, Kualitas Kompos
Nitrogen Cycling and Composting Technologies
79
ABSTRACT
In livestock production systems, waste production continues in significant amounts in line with population growth. Livestock waste has each specific bio-chemical fraction, with relatively high levels of N and C-total where it able to be used as a source of organic fertilizer, but require proper handling since the waste has potency to contribute to green house gas (GHG) in the form of N2O. It is predicted contribution of emissions from livestock production system about 19.2% of the total. The emission has to be reduced through several procedures listed in Presidential Decree No. 61/2011 on the National Action Plan for GHG emission reduction. Of these efforts, the main goal is to modify nitrogen mineralization to reduce N2O byproduct. Beside that, livestock waste will be very beneficial to the plants when properly managed (e.g. Composting) and indirectly suppress considerably environmental impacts such as N2O emissions and NO3 leaching into water bodies. There are several composting procedures that can be chosen according to the purpose of composting. Aerobic composting method is the best alternative compares to anaerobic, but if the CH4 production will be harvested as biogas then anaerobic process is used. Parameter for compost maturity usually depends on C/N ratio and temperature, however there are some parameters list considering to compost quality recognition.
Key Words: Nitrogen Cycle, Livestock Waste, Decomposition, Composting, Compost Quality
INTRODUCTION
The population of livestock in Indonesia tent to increase in
line with the increasing protein demand. In addition to increasing
the farmers’ income, livestocks have potential to contribute to
the greenhouse gas (GHG) in the form of N2O, since it plays a
significant role in the N cycling. Manure from different type of
livestock varied in the N content, but most of them are relatively
high in N content, so that if managed properly it will able to serve
a significant contributor to N for plants and indirectly reduce N2O
release. When manure is produced, then the decomposition
process begins to take place. There are several processes that
are related to each other (nitrogen cycling). The intermediate
Data Inventory and Mitigation on Carbon and Nitrogen
80
product (N2O) present when decomposition conditions lack of
oxygen. N2O gases emitted mainly as a byproduct of nitrification
and denitrification processes. Indirect emissions also occur from
leaching or runoff that carry nitrogen compound from the soil
and then is converted into N2O through denitrification processes
(IPCC 2006).
According to the IPCC 2006, the source of GHG from
agricultural activities are grouped as follows: (1) enteric
fermentation, (2) livestock waste management, (3) burning as an
agricultural activity (burning grassland), (4) burning pastures, (5)
use of agricultural lime, (6) urea fertilization, (7) direct and
indirect emissions of N2O from the soil, and (8) irrigated paddy
field. The main sources of emissions from the agricultural sector
are: lowland rice, soil N2O, and livestock industries which are
approximately 46.2%, 28.1%, and 19.2%, respectively (General
Guidelines 2011). Animal production systems have a relatively
large share in the emissions of ammonia (NH3), nitrous oxide
(N2O) and methane (CH4) into the atmosphere. The estimated
mean amount of NH3–N volatilized ranges from 5% to 15% of N
excreted in pastures and from 5% to 30% of N excreted by
confined animals in animal manure management systems
(AMMSs) (Oenema 2006).
Mitigating the gas emission from livestock production system
could be implemented through the improvement of feed quality,
utilisation of supplements block (FBS), a long-term breeding
program, and composting and biogas production from livestock
waste management. These four scenarios expected to reduce
emissions by 12.5% by 2030.
This mitigation programs in animal husbandry sector is part
of the implementation of Presidential Decree No. 61/2011 on the
National Action Plan for GHG emission reduction including: (1)
The use of bioenergy and agricultural waste for composting, (2)
Development of organic fertilizer to increase carbon storage in
the soil, (3) Development of biogas technology and feed to
Nitrogen Cycling and Composting Technologies
81
reduce GHG emissions from livestock, and (4) Development of
ICEF (Indonesian Carbon Efficient Farming), ISPO (Indonesian
Sustainable Palm Oil), and KRPL (Region Home Sustainable
Food).
This paper will discuss on nitrogen cycling from livestock
waste and describe the waste composting process and
technology.
Nitrogen Cycling from Livestock Waste
Type and characteristics of Livestock Waste
The scope of this paper are the livestock waste production
and the N cycling and composting technologies in relation to
GHG emission. Animal wastes contain a variable amount of
organic N. Its behavior in soil depends on the biodegradation of
organic pools characterized by different mineralization rates and
C/N ratios.
Chicken manure contains of 2.61% N, 0.80% P, 0.40% K,
and moisture of 55% (Lingga 1991; Widowati et al. 2012).
Nutrient content of cow dunk is about 30% organic matters,
1.14-4.38% N, and 0.3% P2O5 and 0.65% K2O (Widowati et al.
2012). Cattle account for 56% of the estimated total N excretion
followed by dairy cattle (16%), sheep (12%), pigs (11%) and
poultry (9%) (Oenema 2006). Manure composition is varies
depending on the physiological properties of animals, feed
quality, the environment including temperature and humidity.
Chicken manure is one of the organic materials that have good
effects on soil physical, chemical, and biological properties, as
well as on plant growth.
Bio-chemical fractions characteristic of manure is influenced
by feed type. For example chicken feed beeing rich in protein
produce manure that is high in water soluble fractions and N
content. Cattle and goats feed grass containing more
Data Inventory and Mitigation on Carbon and Nitrogen
82
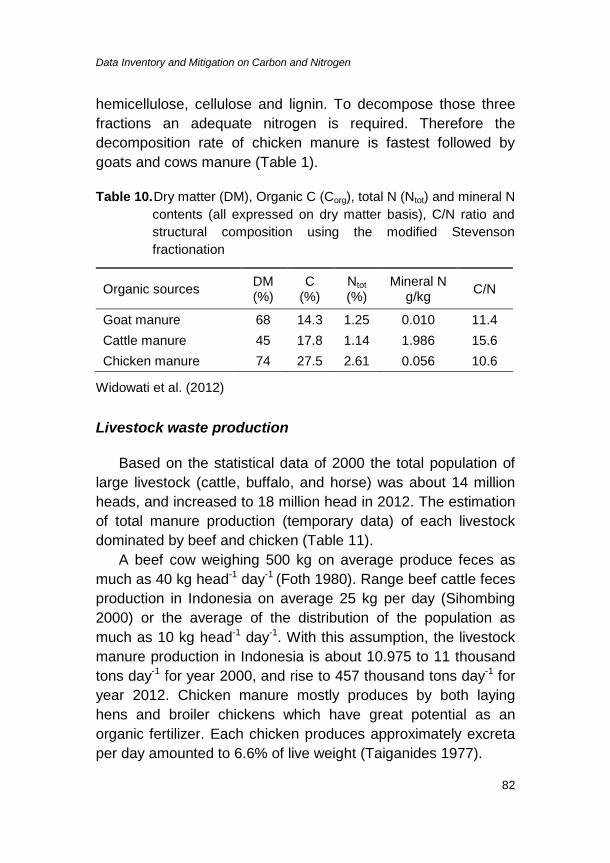
hemicellulose, cellulose and lignin. To decompose those three
fractions an adequate nitrogen is required. Therefore the
decomposition rate of chicken manure is fastest followed by
goats and cows manure (Table 1).
Table 10. Dry matter (DM), Organic C (Corg), total N (Ntot) and mineral N
contents (all expressed on dry matter basis), C/N ratio and
structural composition using the modified Stevenson
fractionation
Organic sources DM (%)
C (%)
Ntot (%)
Mineral N g/kg
C/N
Goat manure 68 14.3 1.25 0.010 11.4
Cattle manure 45 17.8 1.14 1.986 15.6
Chicken manure 74 27.5 2.61 0.056 10.6
Widowati et al. (2012)
Livestock waste production
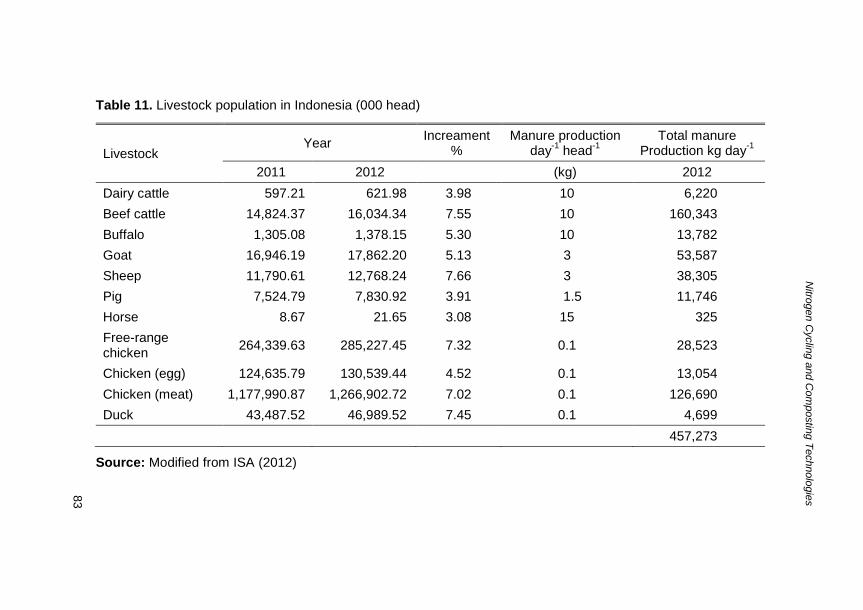
Based on the statistical data of 2000 the total population of
large livestock (cattle, buffalo, and horse) was about 14 million
heads, and increased to 18 million head in 2012. The estimation
of total manure production (temporary data) of each livestock
dominated by beef and chicken (Table 11).
A beef cow weighing 500 kg on average produce feces as
much as 40 kg head-1 day-1 (Foth 1980). Range beef cattle feces
production in Indonesia on average 25 kg per day (Sihombing
2000) or the average of the distribution of the population as
much as 10 kg head-1 day-1. With this assumption, the livestock
manure production in Indonesia is about 10.975 to 11 thousand
tons day-1 for year 2000, and rise to 457 thousand tons day-1 for
year 2012. Chicken manure mostly produces by both laying
hens and broiler chickens which have great potential as an
organic fertilizer. Each chicken produces approximately excreta
per day amounted to 6.6% of live weight (Taiganides 1977).
83
Table 11. Livestock population in Indonesia (000 head)
Livestock Year
Increament %
Manure production day
-1 head
-1
Total manure Production kg day
-1
2011 2012 (kg) 2012
Dairy cattle 597.21 621.98 3.98 10 6,220
Beef cattle 14,824.37 16,034.34 7.55 10 160,343
Buffalo 1,305.08 1,378.15 5.30 10 13,782
Goat 16,946.19 17,862.20 5.13 3 53,587
Sheep 11,790.61 12,768.24 7.66 3 38,305
Pig 7,524.79 7,830.92 3.91 1.5 11,746
Horse 8.67 21.65 3.08 15 325
Free-range chicken
264,339.63 285,227.45 7.32 0.1 28,523
Chicken (egg) 124,635.79 130,539.44 4.52 0.1 13,054
Chicken (meat) 1,177,990.87 1,266,902.72 7.02 0.1 126,690
Duck 43,487.52 46,989.52 7.45 0.1 4,699
457,273
Source: Modified from ISA (2012)
Nitro
gen C
yclin
g a
nd C
om
postin
g T
echnolo
gie
s
83
Data Inventory and Mitigation on Carbon and Nitrogen
84
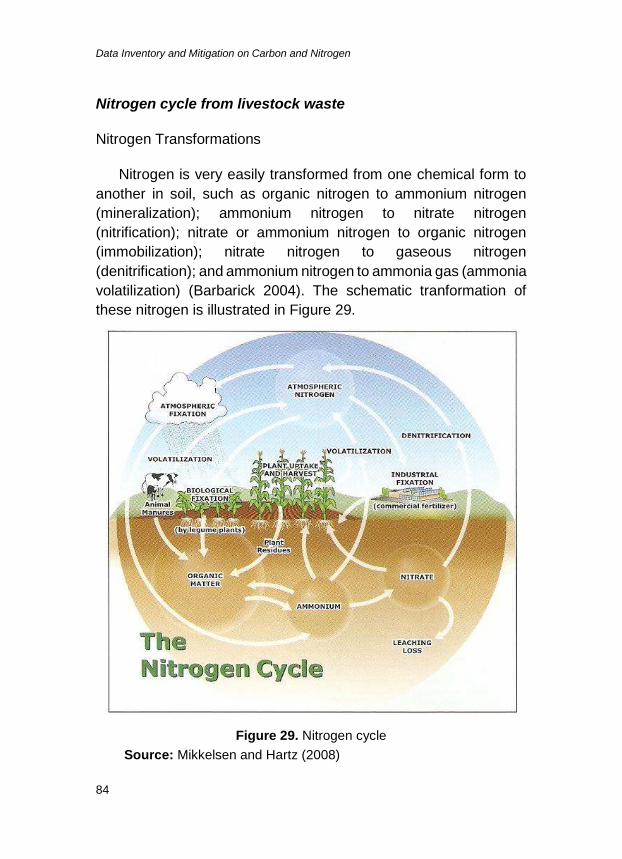
Nitrogen cycle from livestock waste
Nitrogen Transformations
Nitrogen is very easily transformed from one chemical form to
another in soil, such as organic nitrogen to ammonium nitrogen
(mineralization); ammonium nitrogen to nitrate nitrogen
(nitrification); nitrate or ammonium nitrogen to organic nitrogen
(immobilization); nitrate nitrogen to gaseous nitrogen
(denitrification); and ammonium nitrogen to ammonia gas (ammonia
volatilization) (Barbarick 2004). The schematic tranformation of
these nitrogen is illustrated in Figure 29.
Figure 29. Nitrogen cycle
Source: Mikkelsen and Hartz (2008)
Nitrogen Cycling and Composting Technologies
85
Nitrogen present in manures is converted to the inorganic form
by the process of mineralization (Figure 1). Initially, larger organic
matter molecules are broken down into smaller ones by specific
enzymes produced by soil micoorganisms. The transformation of
organic nitrogen to the ammonia (NH3) and the ammonium (NH4+)
forms is referred to as ammonification. The ammonia produced
can then be transformed to the nitrate form (NO3-) by a process
called nitrification. Since the decomposition process is carried out
by living organisms, it is affected by several environmental
variables including material moisture, temperature, pH, the C/N
ratio and the type of organic materials in the residue e.g. cattle
manure are relatively high in carbon and low in nitrogen.
Mineralization and Nitrification
The first step in the N mineralization process of organic
material and SOM is ammonification, or the formation of NH4+ from
organic N. This process involves a large diversity of microorganisms
and occurs under a wide range of temperatures, pH levels and
moisture contents (Hansen et al. 1995). The reactions involve in
the of N-organic to N-inorganic forms can be simplified as follows:
Protein → R-NH2 + CO2 + energy + other components materials
R-NH2 + H2O → NH3 + R-OH + energy
NH3 + H+ → NH4+
Amines and amino acids are then decomposed by
heterotrophic bacteria, releasing NH4+. The ammonium nitrogen
can then be transformed into NO3--N by nitrification according to
following reactions:
2NH4+ + 3 O2 → 2 NO2
- + 2 H2O + 4 H+
2NO2- + O2 → 2 NO3
-
The first reaction is carried out by Nitrosomonas sp., while the
second reaction is performed by Nitrobacter sp. These two
Data Inventory and Mitigation on Carbon and Nitrogen
86
microorganism species are active in a narrow range of
temperature, pH and moisture content. Nitrogen in the form of
NH4+-N or NO3
--N is available for plants and microorganisms.
The amount of mineral N released varies due to differences in
the organic material characteristics as a result of the quantity and
type of the microbial population. The NO3--N is taken up by plants,
used directly by heterotrophic microbes for the decomposition of
C-organic, fixed by clay minerals in the inner space, or changed
into N2 (Havlin et al. 1999).
The N contribution depends on the type and quality of
materials. Easily degraded organic material often have a high
nitrogen (N) content and can therefore release large amounts of N
through mineralization. In contrast, as with straw, having a high
cellulose content, less N was released by the straw and
immobilization occurred (Shindo and Nishio 2005). Nitrogen will
mineralize until the C/N ratio is less than 20, which typically occurs
after 4 weeks of decomposition.
Denitrification
Denitrification occurs through a form of respiration conducted
by microorganisms, primarily bacteria. These microorganisms have
the ability to use nitrate instead of oxygen to perform their metabolic
functions. In this microbial reduction process, nitrate is reduced to
NO2- and then to gaseous forms, including N2O and N2. Because the
bacteria responsible for denitrification are facultative anaerobes,
denitrification is more likely to occur in situations with high water
tables where anaerobic conditions are more likely to be present.
Whether denitrification or nitrification dominates depends on
many different factors. Nitrification is a relatively constant
ecosystem process, whereas denitrification rates are temporally
and spatially variable. In most condition, the availability of NH4+ and
oxygen are the most important factors controlling nitrification. The
Nitrogen Cycling and Composting Technologies
87
primary controls on biological denitrification include the availability
of organic carbon, oxygen and nitrate (NO3-) or other N oxides.
Various studies have found high denitrification activity in hot
spots created by decomposing organic matter, which generates
anaerobic microsites. This phenomenon may explain some of the
high spatial variability of soil denitrification commonly observed.
N2/N2O ratios observed under different conditions in laboratory
experiments were found to be extremely variable and dependent
on available C and NO3- contents and on the moisture content of
the soil. The NO/N2O emission ratio has been proposed as an
indicator of the importance of nitrification and denitrification (IFA
and FAO 2001).
Denitrification varies widely across locations and the time of
year, but it normally represents only a small percentage of total N
loss (Zhu et al. 2005). Few data are available on the emission
rates of these N trace gases from agricultural soil amended with
animal manure (Oenema et al. 2005; He et al. 2007). Among
organic material sources, the application of easily mineralizable C
with manure might increase the denitrification potential of the soil
and enhance N2O production (Paul and Beauchamp 1989; Velthof
et al. 2003; Kamedawa 2007) when conditions that favor
denitrification are optimum. This process is controlled by mineral
N and available C, O2 partial pressure, water content, pH and
temperature (Granly and Bøckman 1994).
NH3 Volatilization
Ammonia is formed constantly in soil due to the biological
degradation of organic compounds and NH4+-yielding mineral and
organic fertilizers. As it is a gas, any NH3 present in soils, water or
fertilizer can volatilize into the atmosphere. However, NH3 reacts
with protons, metals and acidic compounds to form ions,
compounds or complexes of varying stability. Ammonia has a
Data Inventory and Mitigation on Carbon and Nitrogen
88
strong affinity for water, and its reactions in water are fundamental
in regulating the rate of loss.
After its application to the soil, NH4+ from manure can remain
on the exchange sites, nitrify to NO3, or form NH3, depending on
soil and environmental conditions:
NH4+ (absorbed) → NH4
+ (solution) → NH3 (solution) → NH3 (Soil)
→ NH3 (atmosphere)
In fertilized fields, the input of NH4+ depends on many factors:
manure type, the rate and mode of manure storage, moisture
content. Ammonia emission from manure is dependent on pH of
media, with the greatest losses at pH 7.5, and a lower pH
decrease ammonia volatilization (Freney et al. 1983; He et al.
1999. reported that ammonia volatilization from surface applied
ammonium sulfate increased with increasing pH from 4.5 to 8.5,
and the N losses were much greater during the first 7 days.
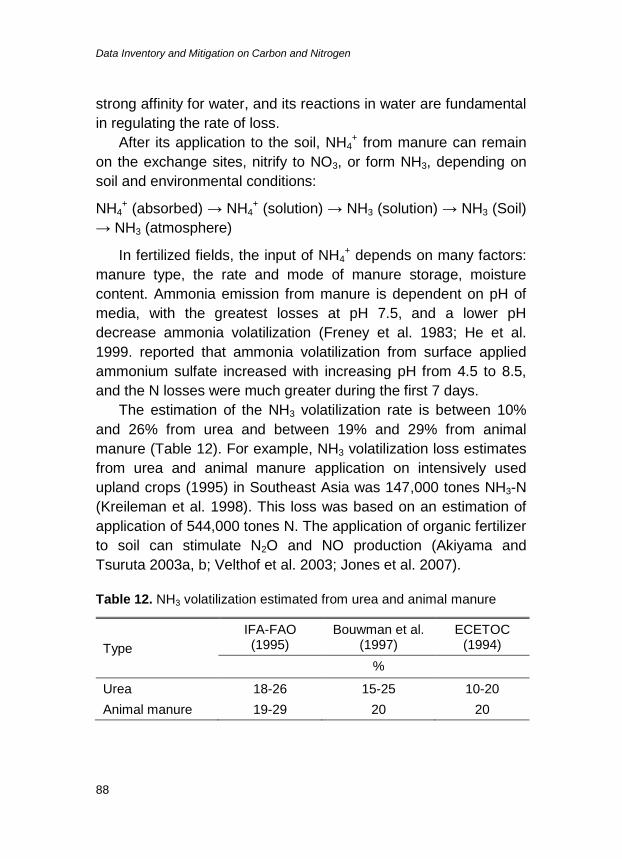
The estimation of the NH3 volatilization rate is between 10%
and 26% from urea and between 19% and 29% from animal
manure (Table 12). For example, NH3 volatilization loss estimates
from urea and animal manure application on intensively used
upland crops (1995) in Southeast Asia was 147,000 tones NH3-N
(Kreileman et al. 1998). This loss was based on an estimation of
application of 544,000 tones N. The application of organic fertilizer
to soil can stimulate N2O and NO production (Akiyama and
Tsuruta 2003a, b; Velthof et al. 2003; Jones et al. 2007).
Table 12. NH3 volatilization estimated from urea and animal manure
Type
IFA-FAO (1995)
Bouwman et al. (1997)
ECETOC (1994)
%
Urea 18-26 15-25 10-20
Animal manure 19-29 20 20
Nitrogen Cycling and Composting Technologies
89
Nitrogen Loss From Animal Production
Animal manure as source of organic fertilizer is often applied
by the farmer for crop production, mainly in horticulture production.
Central vegetable farmer in Indonesia used to applied manure
(mostly chicken and followed by cattle manure and goat manure)
in the range of 15-40 t season-1 containing 154-579 kg N, such as
at Wonosobo, Karang Anyar, Kopeng, and Lembang (Widowati et
al. 2012). Farmers in Australia and New Zealand relied almost
exclusively on fixation by clover to supply nitrogen to pastures,
and the main source of atmospheric ammonia was the excreta of
grazing animals. Then farmers were using organic wastes (e.g.
dairy shed effluent, pig slurry) at < 200 kg N ha-1 y-1 to supply
nitrogen to pastures and crops (Cameron et al. 1997), and were
applying up to 400 kg synthetic fertilizer nitrogen ha-1 y-1 to
pastures to provide feed for dairy cows (Cameron et al. 2002).
Application of effluent or slurry increases the dry matter yield of the
pasture so that the stocking rate can be increased. Fertilization
also increases the concentration of nitrogen in the pasture which
results in increased intake of nitrogen by the grazing animals. The
combined result is increased excretion of urinary nitrogen and
increased ammonia volatilization (Bussink 1992).
Animals do not utilize the nitrogen they ingest efficiently; very
little of the nitrogen ingested is converted into milk, meat, eggs or
wool and the remainder is excreted in dung and urine (Table 13).
Because of the inefficiency of use, large quantities of nitrogen are
deposited on pasture. The greater part (55-95%) is voided by the
animals. The ratio of N in urine to N in dung depends on animal
species, the protein content of the animal feed and the production
level of the animal.
Animals supplied with high-protein diets excrete a large
proportion (<50%) of the excreted N via urine, whereas low-
protein diets yield a larger proportion of the N via dung. The total
amount of N excreted depends on animal species, animal feeding
Data Inventory and Mitigation on Carbon and Nitrogen
90
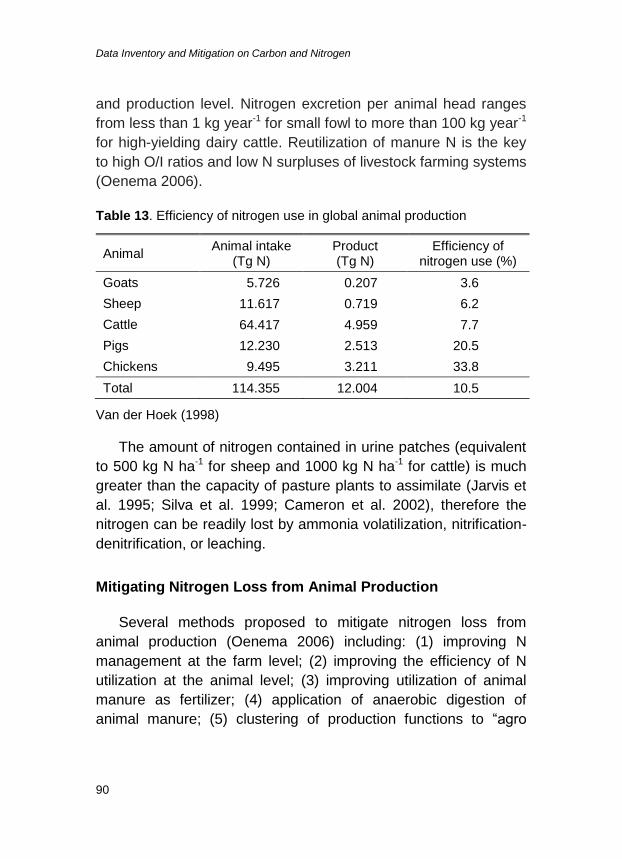
and production level. Nitrogen excretion per animal head ranges
from less than 1 kg year-1 for small fowl to more than 100 kg year-1
for high-yielding dairy cattle. Reutilization of manure N is the key
to high O/I ratios and low N surpluses of livestock farming systems
(Oenema 2006).
Table 13. Efficiency of nitrogen use in global animal production
Animal Animal intake
(Tg N) Product (Tg N)
Efficiency of nitrogen use (%)
Goats 5.726 0.207 3.6
Sheep 11.617 0.719 6.2
Cattle 64.417 4.959 7.7
Pigs 12.230 2.513 20.5
Chickens 9.495 3.211 33.8
Total 114.355 12.004 10.5
Van der Hoek (1998)
The amount of nitrogen contained in urine patches (equivalent
to 500 kg N ha-1 for sheep and 1000 kg N ha-1 for cattle) is much
greater than the capacity of pasture plants to assimilate (Jarvis et
al. 1995; Silva et al. 1999; Cameron et al. 2002), therefore the
nitrogen can be readily lost by ammonia volatilization, nitrification-
denitrification, or leaching.
Mitigating Nitrogen Loss from Animal Production
Several methods proposed to mitigate nitrogen loss from
animal production (Oenema 2006) including: (1) improving N
management at the farm level; (2) improving the efficiency of N
utilization at the animal level; (3) improving utilization of animal
manure as fertilizer; (4) application of anaerobic digestion of
animal manure; (5) clustering of production functions to “agro
Nitrogen Cycling and Composting Technologies
91
production parks”. The nitrogen management in the following
discussion will only be emphasized on point 3, 4 and 5.
Improving the Utilization of Animal Manure as Fertilizer
N from animal manure could be utilized as a means for
decreasing N losses from animal production systems. The other
potential benefit is to replace fertilizer N and thereby decreasing N
losses associated with N fertilizer production and use. Attempt to
maximize the N efficiency of animal manure could be approached
from the N availability. The application should be closed to the
time when the plant requires the nutrients. Calculations suggested
that the improvement of animal manure management in
combination with the implementation of techniques for low-
emission stables, animal storage systems and application of
animal manure can potentially decrease N losses from globally
housed-animal production by some 10 to 20 Tg N (Oenema
2005).
Some approach by decreasing the water content of the slurry,
and delaying application until a substantial canopy has developed
(to reduce wind speeds) would also appear to have a large impact
on ammonia loss (Sommer et al. 1997; Sommer and Olesen,
2000). Other techniques proposed for reducing loss of ammonia
include applying during rainfall, incorporation or injection of the
waste into the soil, application with trail hoses, applying in bands
instead of broadcasting, acidification before application and
matching nitrogen supply to the demand of the crop (Sommer et
al. 1997; Stevens and Laughlin 1997).
Anaerobic digestion of animal manure
When manure is collected immediately following deposition
and stored anaerobically in closed tanks, the emissions of
gaseous N compounds can be lowered. The process occurs is
Data Inventory and Mitigation on Carbon and Nitrogen
92
anaerobic digestion of the animal manure during storage has the
additional advantage of producing CH4 to be used as biofuel. It
encompasses the perspectives of minimizing emissions of odors,
NH3, N2O and CH4 during storage, and minimizing emissions of
N2O following application to land (Velthof et al. 2003). It has been
estimate that anaerobic digestion of the manure can be an option
for about one-quarter of the global animal manure produced (from
pigs, poultry, and housed cattle) (Rotz 2004). The effectiveness of
the manure as N fertilizer is also increased following application of
the digested manure to land, but the digested manure has to be
injected in the soil to minimize NH3 losses following application.
Clustering of Production Functions
Clustering of confined animal production systems with other
intensive agricultural production systems based on novel concepts
from industrial ecology may contribute to improving the
management and especially the N management of these systems.
These novel systems are based on optimizing resource use
through exchange of products between sub systems and on
recycling of manure products. This clustering of production
functions combines the economics of scale with the efficiency of
specialization and the recycling and control in (industrial) ecology.
Such systems also include end-of-pipe technologies such as liquid
manure treatment and scrubbing exhaust air to minimize N
emissions to the environment. Various designs and prototypes
have been made and model calculations indicate that these novel
systems may improve resource use efficiency, including N use
efficiency (Oenema 2005). This kind of model has been
implemented in a model named Indonesian Carbon Efficient
Farming (ICEF), by integrating animals, crops and environments.
Nitrogen Cycling and Composting Technologies
93
Composting Process and Technology
Composting Process
Composting is a decomposition process in which the substrate
is progressively broken down by a succession of populations of
living organisms. The products of degradation of one
microorganism population serve as the substrate for the
succeeding microorganism population. The succession is initiated
by breaking down the complex molecules in the raw substrate to
simpler forms by microbes indigenous to the substrate.
Decomposition of organic materials occur in a way of bio-
physico-chemical processes, involve biological activity of microbial
and mesofauna. Primary decomposer is mesofauna like
Colembolla, Acarina which serves friable organic material became
smaller. The secondary decomposer is microbial decomposer
such as T. reesei, T. harzianum, T. koningii, Phanerochaeta
crysosporium, Cellulomonas, Pseudomonas, Thermospora,
Aspergillus niger, A. terreus and Penicillium sp. Earthworms eat
the remains of the last crumb then released as feces after
digestion in the intestines.
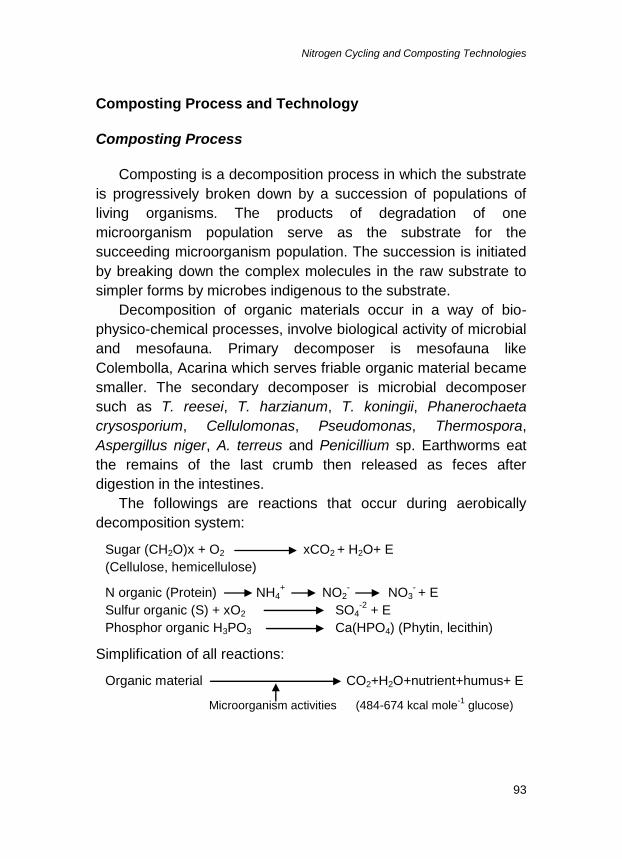
The followings are reactions that occur during aerobically
decomposition system:
Sugar (CH2O)x + O2 xCO2 + H2O+ E
(Cellulose, hemicellulose)
N organic (Protein) NH4+ NO2
- NO3
- + E
Sulfur organic (S) + xO2 SO4-2
+ E
Phosphor organic H3PO3 Ca(HPO4) (Phytin, lecithin)
Simplification of all reactions:
Organic material CO2+H2O+nutrient+humus+ E
Microorganism activities (484-674 kcal mole-1
glucose)
Data Inventory and Mitigation on Carbon and Nitrogen
94
Endo-b-1,4 glucanase (endo-b-1,4-D- glukan 4-selobiohidrolase)
Exo-b-1,4 glukanase or selobiohidrolase (Exo-b-1,4-D-
glukanselobiohidrolase)
B-glukosidase. Laccase, peroxidase, and oxidase
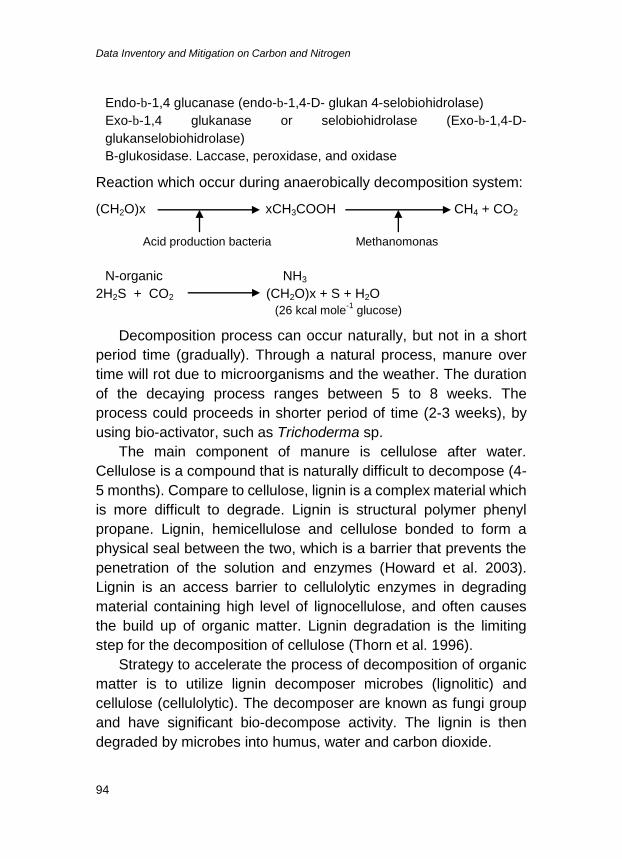
Reaction which occur during anaerobically decomposition system:
(CH2O)x xCH3COOH CH4 + CO2
Acid production bacteria Methanomonas
N-organic NH3
2H2S + CO2 (CH2O)x + S + H2O
(26 kcal mole-1
glucose)
Decomposition process can occur naturally, but not in a short
period time (gradually). Through a natural process, manure over
time will rot due to microorganisms and the weather. The duration
of the decaying process ranges between 5 to 8 weeks. The
process could proceeds in shorter period of time (2-3 weeks), by
using bio-activator, such as Trichoderma sp.
The main component of manure is cellulose after water.
Cellulose is a compound that is naturally difficult to decompose (4-
5 months). Compare to cellulose, lignin is a complex material which
is more difficult to degrade. Lignin is structural polymer phenyl
propane. Lignin, hemicellulose and cellulose bonded to form a
physical seal between the two, which is a barrier that prevents the
penetration of the solution and enzymes (Howard et al. 2003).
Lignin is an access barrier to cellulolytic enzymes in degrading
material containing high level of lignocellulose, and often causes
the build up of organic matter. Lignin degradation is the limiting
step for the decomposition of cellulose (Thorn et al. 1996).
Strategy to accelerate the process of decomposition of organic
matter is to utilize lignin decomposer microbes (lignolitic) and
cellulose (cellulolytic). The decomposer are known as fungi group
and have significant bio-decompose activity. The lignin is then
degraded by microbes into humus, water and carbon dioxide.
Nitrogen Cycling and Composting Technologies
95
Maturity Standard
To be used in agriculture, compost should be completely
stable (mature). Some methods and parameters determining the
degree of stability of compost are: (1) carbon/nitrogen (C/N) ratio,
(2) stability against heating; (3) reduction in organic matter; and
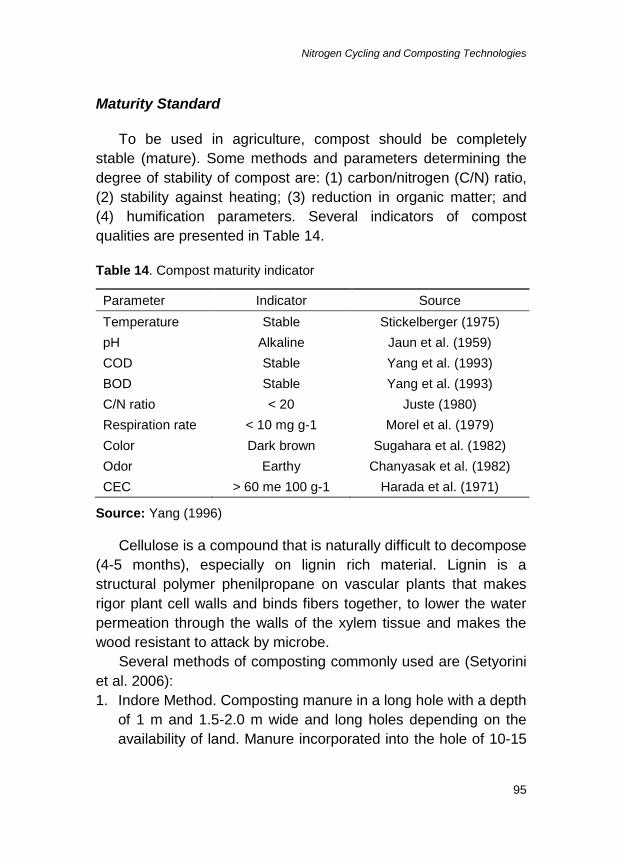
(4) humification parameters. Several indicators of compost
qualities are presented in Table 14.
Table 14. Compost maturity indicator
Parameter Indicator Source
Temperature Stable Stickelberger (1975)
pH Alkaline Jaun et al. (1959)
COD Stable Yang et al. (1993)
BOD Stable Yang et al. (1993)
C/N ratio < 20 Juste (1980)
Respiration rate < 10 mg g-1 Morel et al. (1979)
Color Dark brown Sugahara et al. (1982)
Odor Earthy Chanyasak et al. (1982)
CEC > 60 me 100 g-1 Harada et al. (1971)
Source: Yang (1996)
Cellulose is a compound that is naturally difficult to decompose
(4-5 months), especially on lignin rich material. Lignin is a
structural polymer phenilpropane on vascular plants that makes
rigor plant cell walls and binds fibers together, to lower the water
permeation through the walls of the xylem tissue and makes the
wood resistant to attack by microbe.
Several methods of composting commonly used are (Setyorini
et al. 2006):
1. Indore Method. Composting manure in a long hole with a depth
of 1 m and 1.5-2.0 m wide and long holes depending on the
availability of land. Manure incorporated into the hole of 10-15
Data Inventory and Mitigation on Carbon and Nitrogen
96
cm thick evenly then sprinkled with cattle urine, then mixed
with the soil, and incubated for 3 months.
2. Heap Method. Composting is done on the surface soil with 2 m
wide, 1.5 m height and 2 m length. Compacted around the
edges, shaded and covered. As first layer is carbon-rich
material that is as thick as 15 cm, and the following layer is
material rich nitrogen (manure) and continuously as alternating
layer until it reaches 1.5 m height.
3. Bangalore Method. This method is suitable for areas with less
rainfall. Principally the manure fills into the hole and then
covered with mud and incubated for 3 months without a
reversal. This method is less popular.
4. Berkeley Method. This categorized as relatively rapid
composting method is about 2 weeks by applying a mixture of
two parts of the basic ingredients of organic matter-rich
cellulose and one part nitrogen-rich organic material with a
value of C/N ratio around 30:1. Materials are prepared plated
2.4 × 2.2 × 1.5 m3 and composted within 2 weeks.
5. Vermicompost. The principle of this method is using worms as
decomposer of organic matter. Earthworms are able to eat all
types of organic materials with the ability to eat is equivalent of
its body weight per day.
The selection of composting method depends on the ability
and condition of material and composting site.
Composting technology which has been introduced by the
Indonesian Soil Research Institute is modified aforementioned
method and improves with decomposition factors i.e.
1. Composting straw stack and inversion methods. The pile is
reversed every day, three days and every week.
2. Composting by means stacked with ventilation. The straw is
crushed and moistened overnight (humidity ranging from 60-
80%). By using a bamboo nest-box is placed in the bottom of
the stack (the bamboo nest 30 cm above ground level) to
provide aeration in the bottom of the pile. Haystack inoculated
Nitrogen Cycling and Composting Technologies
97
with decomposer in layers, and create holes by putting a
hollow bamboo into piles of organic materials horizontally,
fermented for a week, and maintain 60-80% moisture so that
the decomposition process occur maximally.
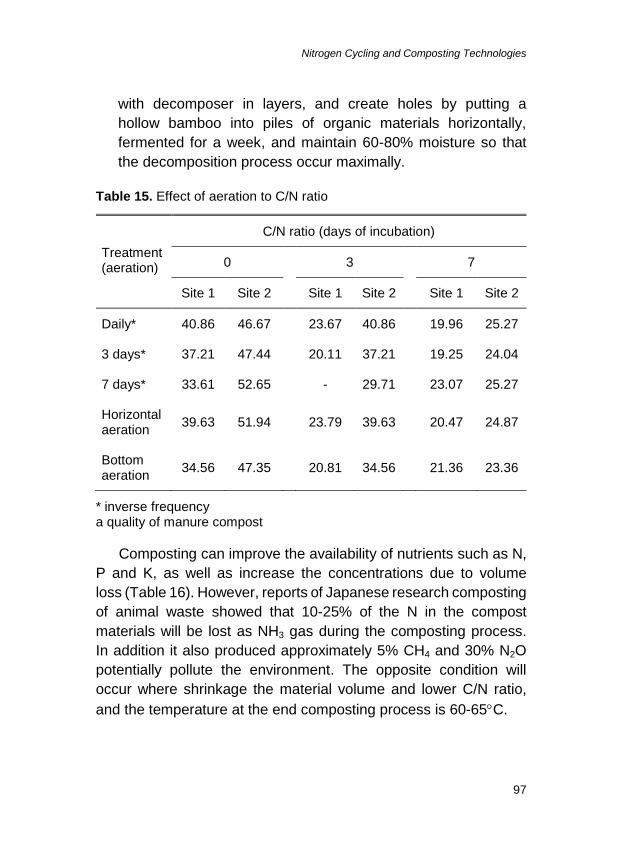
Table 15. Effect of aeration to C/N ratio
Treatment (aeration)
C/N ratio (days of incubation)
0 3 7
Site 1 Site 2 Site 1 Site 2 Site 1 Site 2
Daily* 40.86 46.67 23.67 40.86 19.96 25.27
3 days* 37.21 47.44 20.11 37.21 19.25 24.04
7 days* 33.61 52.65 - 29.71 23.07 25.27
Horizontal aeration
39.63 51.94 23.79 39.63 20.47 24.87
Bottom aeration
34.56 47.35 20.81 34.56 21.36 23.36
* inverse frequency a quality of manure compost
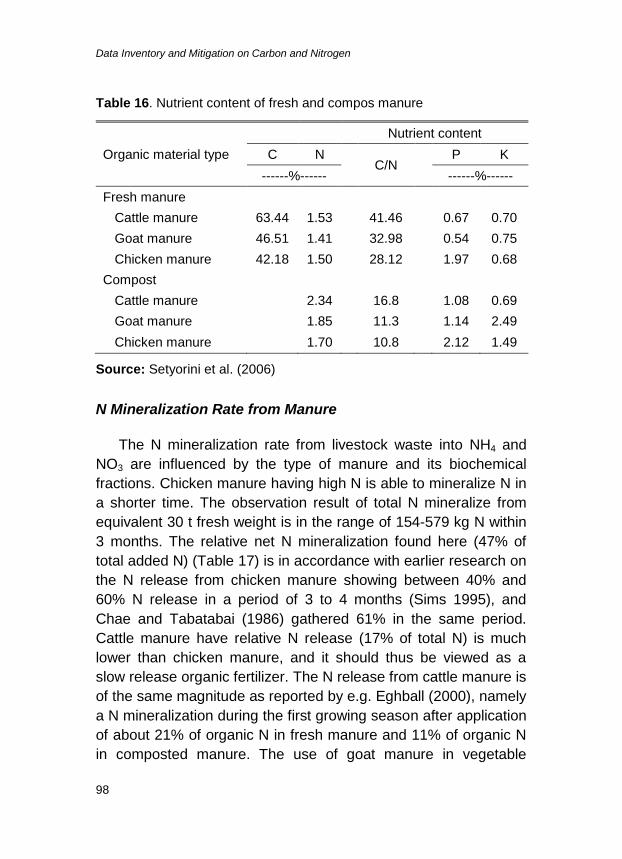
Composting can improve the availability of nutrients such as N,
P and K, as well as increase the concentrations due to volume
loss (Table 16). However, reports of Japanese research composting
of animal waste showed that 10-25% of the N in the compost
materials will be lost as NH3 gas during the composting process.
In addition it also produced approximately 5% CH4 and 30% N2O
potentially pollute the environment. The opposite condition will
occur where shrinkage the material volume and lower C/N ratio,
and the temperature at the end composting process is 60-65C.
Data Inventory and Mitigation on Carbon and Nitrogen
98
Table 16. Nutrient content of fresh and compos manure
Organic material type
Nutrient content
C N C/N
P K
------%------ ------%------
Fresh manure
Cattle manure 63.44 1.53 41.46 0.67 0.70
Goat manure 46.51 1.41 32.98 0.54 0.75
Chicken manure 42.18 1.50 28.12 1.97 0.68
Compost
Cattle manure 2.34 16.8 1.08 0.69
Goat manure 1.85 11.3 1.14 2.49
Chicken manure 1.70 10.8 2.12 1.49
Source: Setyorini et al. (2006)
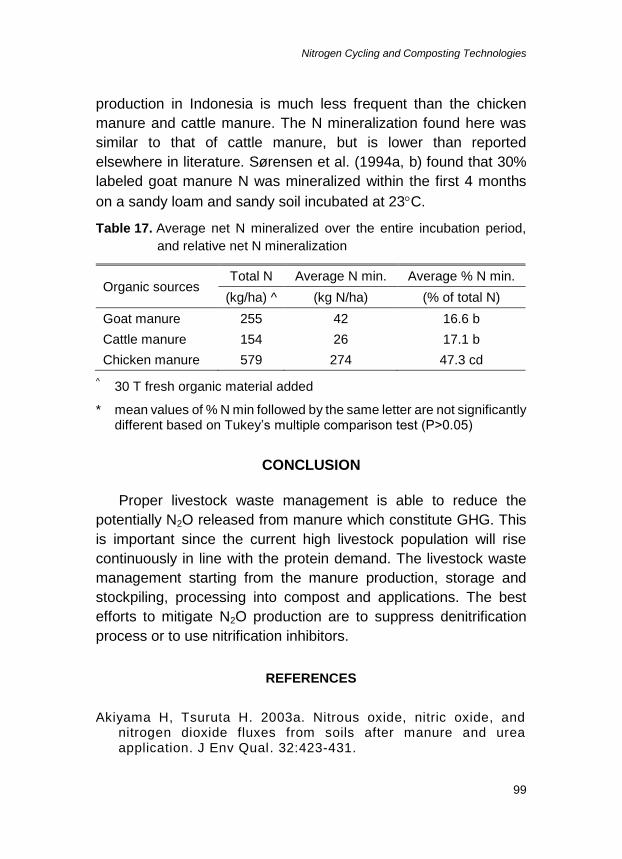
N Mineralization Rate from Manure
The N mineralization rate from livestock waste into NH4 and
NO3 are influenced by the type of manure and its biochemical
fractions. Chicken manure having high N is able to mineralize N in
a shorter time. The observation result of total N mineralize from
equivalent 30 t fresh weight is in the range of 154-579 kg N within
3 months. The relative net N mineralization found here (47% of
total added N) (Table 17) is in accordance with earlier research on
the N release from chicken manure showing between 40% and
60% N release in a period of 3 to 4 months (Sims 1995), and
Chae and Tabatabai (1986) gathered 61% in the same period.
Cattle manure have relative N release (17% of total N) is much
lower than chicken manure, and it should thus be viewed as a
slow release organic fertilizer. The N release from cattle manure is
of the same magnitude as reported by e.g. Eghball (2000), namely
a N mineralization during the first growing season after application
of about 21% of organic N in fresh manure and 11% of organic N
in composted manure. The use of goat manure in vegetable
Nitrogen Cycling and Composting Technologies
99
production in Indonesia is much less frequent than the chicken
manure and cattle manure. The N mineralization found here was
similar to that of cattle manure, but is lower than reported
elsewhere in literature. Sørensen et al. (1994a, b) found that 30%
labeled goat manure N was mineralized within the first 4 months
on a sandy loam and sandy soil incubated at 23C.
Table 17. Average net N mineralized over the entire incubation period,
and relative net N mineralization
Organic sources Total N Average N min. Average % N min.
(kg/ha) ^ (kg N/ha) (% of total N)
Goat manure 255 42 16.6 b
Cattle manure 154 26 17.1 b
Chicken manure 579 274 47.3 cd
^ 30 T fresh organic material added
* mean values of % N min followed by the same letter are not significantly different based on Tukey’s multiple comparison test (P>0.05)
CONCLUSION
Proper livestock waste management is able to reduce the
potentially N2O released from manure which constitute GHG. This
is important since the current high livestock population will rise
continuously in line with the protein demand. The livestock waste
management starting from the manure production, storage and
stockpiling, processing into compost and applications. The best
efforts to mitigate N2O production are to suppress denitrification
process or to use nitrification inhibitors.
REFERENCES
Akiyama H, Tsuruta H. 2003a. Nitrous oxide, nitric oxide, and nitrogen dioxide fluxes from soils after manure and urea application. J Env Qual. 32:423-431.
Data Inventory and Mitigation on Carbon and Nitrogen
100
Akiyama H, Tsuruta H. 2003b. Effect of organic matter application on N2O, NO, and NO2 fluxes from an Andisols field. Glob Biogeochem Cycles. 17(4):1100.
Barbarick AK. 2004. Nitrogen sources and transformation. Colorado State University, Soil and Crop Sciences.
Bussink DW. 1992. Ammonia volatilization from grassland receiving nitrogen fertilizer and rotationally grazed by dairy cattle. Fert Res. 33:257-265.
Cameron KC, Di HJ, McLaren RG. 1997. Is soil an appropriate dumping ground for our wastes? Aust J Soil Res. 35:995-1035.
Cameron KC, Di HJ, Condron LM. 2002. Nutrient and pesticide transfer from agricultural soils to water in New Zealand. In: Haygarth P, Jarvis S, editors. Agriculture, hydrology and water quality. Wallingford (UK): CABI. p. 373-393.
Chae YM, Tabatabai MA. 1986. Mineralization of nitrogen in soils amended with organic waste. J Env Qual. 15:193-198.
Eghball B. 2000. Nitrogen mineralization from field-applied beef cattle feedlot manure or compost. Sci Soc Am J. 64:2024-2030.
Foth HO. 1980. Fundamentals of Soil Science. Canada: John Wiley and Sons Inc. p. 157-166.
Freney JR, Simpson JR, Denmead OT. 1983. Volatilization of ammonia. In: Freney JR, Simpson JR, editors. Gaseous loss of nitrogen from plant-soil systems. Martinus Nijhoff/Dr. W. Junk, The Hague. p. 1-31.
General Guideline. 2011. Guideline of Green House Gas Inventory and Climate Change Mitigation on Agricultural Sector. Ministry of Agriculture.
Granly T, Bøckman OC. 1994. Nitrogen oxide from agriculture. Nor J Agric Sci. 12:7-127.
Hansen S, Jensen HE, Schaffer MJ. 1995. Developments in modelling nitrogen transformations in soil. In Bacon PE, editor. Nitrogen fertilization in the environment. New York (USA): Marcel Dekker. p. 295-325.
Nitrogen Cycling and Composting Technologies
101
Hansen JI, Henriksen K, Blakburn TH. 1981. Seasonal distribution of nitrifying bacteria and rates of nitrification in coastal marine sediments. Microb Ecol. 7:291-304.
Havlin JL, Beaton DJ, Tisdale SL, Nelson WL. 1999. Soil fertility and fertilizer: an introduction to nutrient management. 6th edition. Saddle River (New Jersey): Prentice Hall. Inc.
He F, Chen Q, Jiang R, Chen X, Zhang F. 2007. Yield and nitrogen balance of greenhouse tomato (Lycopersicum esculentum Mill.) with conventional and site-specific nitrogen management in Northern China. Nutrient Cycle in Agroecosyst . 77:1-14.
He ZL, Alva AK, Calvert DV, Banks DJ. 1999. Ammonia volatilization from different fertilizer source and effects of temperature and soil pH. Soil Sci. 164:750-758.
Howard RL, Abotsi E, Jansen van Rensburg EL, Howards S. 2003. Lignocellulose biotechnology: is issues of bioconversion and enzyme production. Afr J Biotechnol. 2:602-619.
ISA. 2012. Temporary Data-ASEM 2012. Statistic Indonesia of the Republik Indonesia. Indonesia Statistic Agency.
IFA (International Fertilizer Industry Association) FAO (Food and Agriculture Organization of the United Nations). 2001. Global estimates of gaseous emissions of NH3, NO and N2O from agricultural land. 1st version. Published by FAO and IFA. Rome, 2001. ISBN 92-5-104689-1.
IPCC (Intergovernmental Panel on Climate Change). 2006. Guidelines for National Greenhouse Gas Inventories. http://www.ipcc-nggip.iges.or.jp/public/2006gl/.
Jarvis SC, Scholefield D, Pain B. 1995. Nitrogen cycling in grazing systems. In: Bacon PE, editor. Nitrogen Fertilization in the Environment.
Jones SK, Rees RM, Skiba UM, Ball BC. 2007. Influence of organic and mineral N fertilizer on N2O fluxes from a temperate grassland. Agric Ecosyst Environ. 121:74-83.
Kamewada K. 2007. Vertical distribution of denitrification activity in an Andisol upland field and its relationship with dissolved organic carbon: effect of lonterm organic matter application. Soil Sci Plant Nutr. 53:401-412.
Data Inventory and Mitigation on Carbon and Nitrogen
102
Kreileman E, van Woerden J, Bakkes J. 1998. RIVM Environmental Research. M025/98, Report M025/98. Bilthoven (the Netherlands): National Institute of Public Health and the Environment.
Lingga P. 1991. Type and nutrient content of poultry waste. Center for Training of Agricultural and Self-supporting Villages (P4S). ANTANAN. Bogor (Un-publish).
Mikkelsen R, Hartz TK. 2008. Nitrogen sources for organic crop production. Better Crop with Plant Food: Vol. VCII (92) 2008, No. 4.
Oenema O, Tamminga S. 2005. Nitrogen in global animal production, management options for improving nitrogen use efficiency. Sci. China 48:1-17.
Oenema O. 2006. Nitrogen budgets and losses in livestock systems. International Congress Series 1293. 2006. 262–271.
Paul JW, Beauchamp EG. 1989. Effect of carbon contituents in manure on denitrification in soil. Can J Soil Sci. 69:49-61.
Rotz CA, 2004. Management to reduce nitrogen losses in animal production. Anim J Sci. 82:E119-E137.
Setyorini D, Saraswati R, Kosman EA. 2006. Compos in Organic Fertilizer and Biofertilizer. Simanungkalit RDM, Suriadikarta DA, Saraswati R, Setyorini D, and Hartatik W, editors. ICALRD, CIAR (Litbang). p. 11-40.
Shindo H, Nishio T. 2005. Immobilization and remineralization of N following addition of wheat straw into soil: determination of gross N transformation rates by 15N-ammonium isotope dilution technique. Soil Biol Biochem. 37:425-432.
Sihombing DTH. 2000. Teknik Pengelolaan Limbah Kegiatan/ Usaha Peternakan. Bogor (Indonesia): Pusat Penelitian Lingkungan Hidup Lembaga Penelitian, Institut Pertanian Bogor.
Silva RG, Cameron KC, Di HJ, Hendry T. 1999. A lysimeter study of the impact of cow urine, dairy shed effluent and nitrogen fertilizer on drainage water quality. Aust J Soil Res. 37:357-369.
Sims JT. 1995. Organic wastes as alternative nitrogen sources. In: Bacon PE, editor. Nitrogen fertilization in the environment. New York (NY): Marcel Dekker Inc. pp.487-535.
Nitrogen Cycling and Composting Technologies
103
Sommer SG, Olesen JE. 2000. Modeling ammonia volatilization from animal slurry applied with trail hoses to cereals. Atmos Environ. 34:2361-2372.
Sommer SG, Friis E, Bach A, Schjøerring JK. 1997. Ammonia volatilization from pig slurry applied with trail hoses or broadspread to winter wheat: effects of crop developmental stage, microclimate, and leaf ammonia absorption. J Environ Qual. 26:1153-1160.
Sørensen P, Jensen ES, Nielsen NE. 1994a. Labeling of animal manure nitrogen with 15N. Plant and Soil 162:31-37.
Sørensen P, Jensen ES, Nielsen NE. 1994b. The fate of 15N-labelled organic nitrogen in sheep manure applied to soils of different texture under field conditions. Plant and Soil 162:39-47.
Stevens RJ, Laughlin RJ. 1997. The impact of cattle slurries and their management on ammonia and nitrous oxide emissions from grassland. In: Jarvis SC, Pain BF, editors. Gaseous nitrogen emissions from grasslands. Wallingford (UK):CABI. p. 233-256.
Taiganides EP. 1977. Animal waste. Applied Science. London (UK). 423 pp. ISBN. 0 85334 721 2.
Thorn GR, Reddy CA, Harris D, Paul EA. 1996. Isolation of Saprophytic Basidiomycetes from soil. Appl. Environ. Microbiol. 62:4288-4292.
Van der Hoek KW. 1998. Nitrogen efficiency in global animal production. Environ Poll. 102:127-132.
Velthof GL, Kuikman PJ, Oenema O. 2003. Nitrous oxide emissions from animal manure applied to soil under controlled conditions. Biol Fertil Soils. p. 221-230.
Widowati LR, Sleutel S, Setyorini D, Sukristyonubowo and De Neve S. 2012. Nitrogen mineralization from amended and unamended intensively managed tropical Andisols and Inceptisols. Soil Res. 50:136-144.
Yang SS. 1996. Preparation and characterization of compost. In: Proceedings of International Training Workshop on Microbial Fertilizers and Composting. October 15-22, 1998. Taichung, Taiwan (Republic of China): Taiwan Agricultural Research Institute, FFTC and Tari.
Data Inventory and Mitigation on Carbon and Nitrogen
104
Zhu JH, Li XL, Christie P, Li JL. 2005. Environmental implications of low nitrogen use efficiency in excessively fertilized hot pepper (Capsicum frutescens L.) cropping systems. Agric Ecosyst Environ. 111:70-80.