Embed Size (px)
Citation preview
Non linear seismic response analysis of the
Aratsu cable-stayed bridge
K. Yamahira/') H. Otsuka, K. Uno,<*> Y Doujou, I. Katou, A.
FujinoSumitomo Heavy Industries, Ltd. 5-33 Kitahama 4 Chome Chuoku Osaka,
Japan, Email: [email protected]
Kyushu University, 10-1 Hakozaki 6 Chome Higashiku Hukuoka, Japan
Email: [email protected]
Kyushu-Kyoritu University, 1-8 Jiyuugaoka Yahatanishiku Kitakyuusyuu,
Japan, Email: [email protected]
Fukuoka-Kitakyushu Expressway Public Corporation
Pasco Corporation, Email:[email protected]
Yokogawa Techno-Information Service Inc., E-mail:[email protected]
Abstract
In this paper, the seismic capability of existing steel cable-stayed bridges waschecked by nonlinear seismic response analysis using the observed records that
were obtained at the 1995 Hyogoken Nanbu Earthquake. The effect of boundary
condition (consideration of soil spring), modeling of bearing supports on the pier,
existence of tuned mass damper at the top of the tower are investigated.
As a result, it is evident that the main steel tower, the main steel girder and the
main part of the reinforced concrete pier are safe but there is some defect at the
bearing supports.
In the case of longitudinal excitation, relative displacement between upper and
lower part of a movable bearing becomes ten times of displacement allowance.
On the other hand for transverse excitation, reaction forces for the bearings of
the girder are larger than design force, and axial forces of set bolts are larger than
the tensile strength of them.
Transactions on the Built Environment vol 38 © 1999 WIT Press, www.witpress.com, ISSN 1743-3509
176 Earthquake Resistant Engineering Structures
1. Introduction
Design specifications for highway bridges in Japan* being based on
experience of the 1995 Hyogoken Nanbu Earthquake were revised on December
1996. According to the new specification, bridges that show complicated
behavior during earthquake, for example cable-stayed bridges, must be analyzed
dynamically, and the results must be reflected for the design. Even existing
important bridges that make great influence to the society, also must be checked
by the same method. If serious damages are expected, counter measures must be
taken swiftly.This paper investigates the validity of analytical modeling for seismic
response analysis, performs nonlinear seismic response analysis of a steel cable-
stayed bridge, and studies the results.
2. The Aratsu Bridge
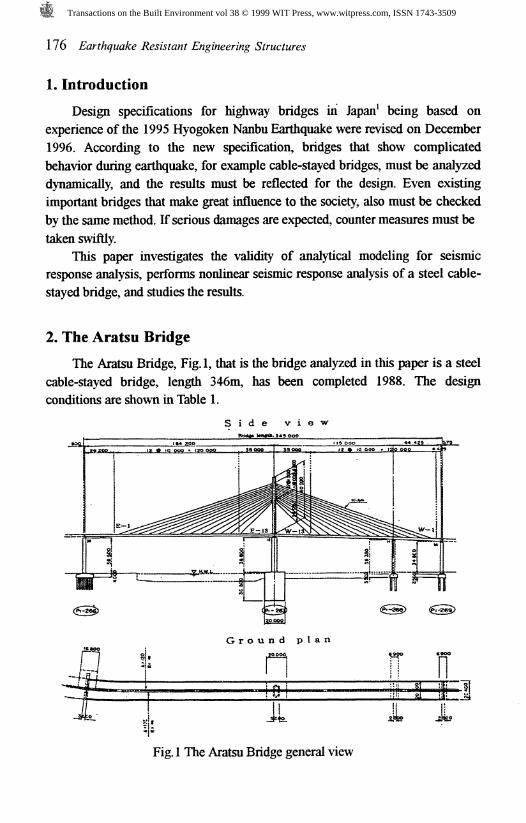
The Aratsu Bridge, Fig.l, that is the bridge analyzed in this paper is a steel
cable-stayed bridge, length 346m, has been completed 1988. The design
conditions are shown in Table 1.
S i d e v i e w
G r o u n d p l a n
__u * n n n
-«.* j, jlta. A JL
-i
Fig. 1 The Aratsu Bridge general view
Transactions on the Built Environment vol 38 © 1999 WIT Press, www.witpress.com, ISSN 1743-3509
Earthquake Resistant Engineering Structures 177
The shape of the bridge is multi-fan, single-plane cables (13 stairs) and
single tower. Three pivot bearings are installed on the top of the reinforced
concrete (RC) pier to sustain the steel main tower and the girder. The tower and
the girder is combined rigidly on this pier. A TMD(Tuned Mass Damper) is set at
the top of the tower for aerodynamic stability.
Table 1 The design conditions of the Aratsu BridgeSuperstructureBridge lengthWidthSubstructure
Foundation
GgroundApplied specification
3 span continuous steel cable-stayed bridgeL = 345.0 m (184.2m+115.0m+44.4m)W = 8.5 mPier Pl-266(Move),268(Hinge),269(Move) : Steel multi-column bentPier Pl-267 (Hinge) : RC single-column hollow bentPier Pl-266,268,269 : Cast-in-place concrete pile, <& 1200mm, n=36,12,12Pier Pl-267 : Pneumatic caissonClass HSpecifications for highway bridges (1980 edition)
n; number of piles
3. Analytical Modeling and Conditions
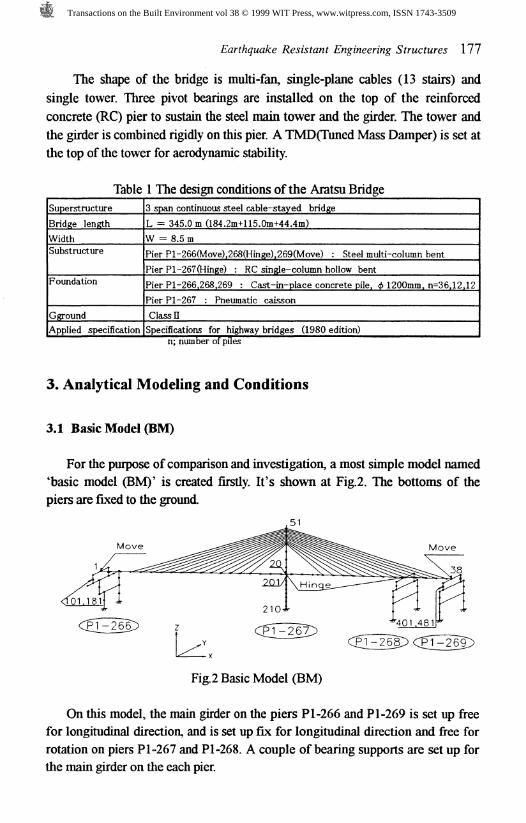
3.1 Basic Model (BM)
For the purpose of comparison and investigation, a most simple model named
'basic model (BM)' is created firstly. It's shown at Fig.2. The bottoms of the
piers are fixed to the ground
Move
Fig.2 Basic Model (BM)
On this model, the main girder on the piers PI-266 and PI-269 is set up free
for longitudinal direction, and is set up fix for longitudinal direction and free for
rotation on piers Pl-267 and Pl-268. A couple of bearing supports are set up forthe main girder on the each pier.
Transactions on the Built Environment vol 38 © 1999 WIT Press, www.witpress.com, ISSN 1743-3509
178 Earthquake Resistant Engineering Structures
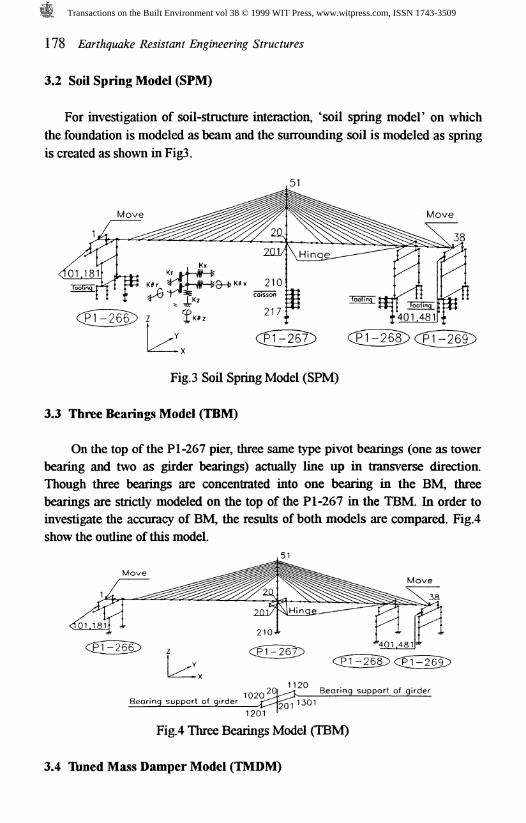
3.2 Soil Spring Model (SPM)
For investigation of soil-structure interaction, 'soil spring model' on which
the foundation is modeled as beam and the surrounding soil is modeled as spring
is created as shown in Fig3.
Move
Fig.3 Soil Spring Model (SPM)
3.3 Three Bearings Model (TBM)
On the top of the Pl-267 pier, three same type pivot bearings (one as tower
bearing and two as girder bearings) actually line up in transverse direction.
Though three bearings are concentrated into one bearing in the BM, three
bearings are strictly modeled on the top of the Pl-267 in the TBM. In order toinvestigate the accuracy of BM, the results of both models are compared. Fig.4
show the outline of this model.
Bearing support of girderBearing support of girder 1301
1201
Fig.4 Three Bearings Model (TBM)
3.4 Tuned Mass Damper Model (TMDM)
Transactions on the Built Environment vol 38 © 1999 WIT Press, www.witpress.com, ISSN 1743-3509
Earthquake Resistant Engineering Structures 179
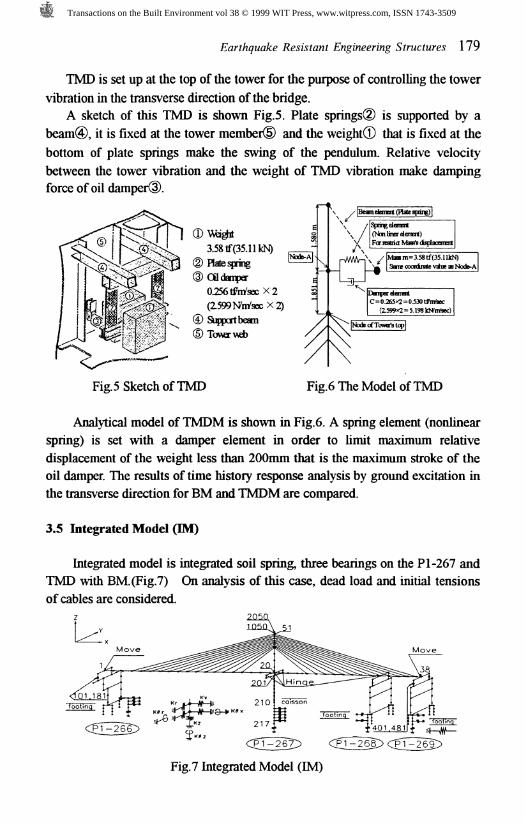
TMD is set up at the top of the tower for the purpose of controlling the tower
vibration in the transverse direction of the bridge.A sketch of this TMD is shown Fig.5. Plate springs® is supported by a
beam®, it is fixed at the tower member® and the weight® that is fixed at the
bottom of plate springs make the swing of the pendulum. Relative velocity
between the tower vibration and the weight of TMD vibration make dampingforce of oil damper®.
3.58tf(35.11kN)Plate springOldanper(X256tfcn's0cX2
® Suppcrtbeam©Tov«rweb
Fig. 5 Sketch of TMD Fig.6 The Model of TMD
Analytical model of TMDM is shown in Fig.6. A spring element (nonlinear
spring) is set with a damper element in order to limit maximum relative
displacement of the weight less than 200mm that is the maximum stroke of the
oil damper. The results of time history response analysis by ground excitation in
the transverse direction for BM and TMDM are compared.
3.5 Integrated Model (IM)
Integrated model is integrated soil spring, three bearings on the PI-267 and
TMD with BM.(Fig.7) On analysis of this case, dead load and initial tensions
of cables are considered.z 205%
L±\
Fig.7 Integrated Model (IM)
Transactions on the Built Environment vol 38 © 1999 WIT Press, www.witpress.com, ISSN 1743-3509
180 Earthquake Resistant Engineering Structures
3.6 Analytical Condition
Table 2 Conditions of the analysisInput seismic wave
Modification factor for zoneDamping factorNonlinear force-displacement relationCalculation time of responseTime intervals of numerical integration
JR-Takatori EW component for longitudinal direction of the bridgeJR-Takatori NS component for transverse direction of the bridgeJR-Takatori UD component for vertical direction0.70.02(Rayleigh damping)tri-linear Takeda model for RC pier20 second0.01 secondJR.; Japan Railroad
4. Results of Analyses
4.1 Comparison between BM and SPM
4.1.1 Acceleration and displacement
Acceleration and displacement are compared at the top of the tower(node
51) and the top of the RC pier(node 201). Table 3 shows the results. In the case
of ground excitation in the longitudinal direction there are almost no difference
between two models. In the case of ground excitation in the transverse direction,
response values of SPM are greater than that of BM.
Table 3 Maximum response acceleration and displacementGround excitation in longitudinal direction of the bridge
N o d e n u m b e r51 (Top of the tow er)
20 1 (Top of the P 1-267)Ground excitation in t
N o d e n u m b e r51 (Top of the tow er)
20 1 (Top of the P 1-267)
Basic m o d e lG max(gal)
40 1.038 1.3
6 m a x (m )-0.422-0.433
ransverse direction of thBasic m o d e l
G max(gal)- 1739.2
685.9
6 max (m )1.239
-0.049
Soil spring m o d e lG m ax(gal)
-592.7399.0
6 m a x(m )-0.4 18-0 .43 1
e b ridgeSoil spring m o d e l
G m a x(g a 1)2155.8-843.8
6 m ax(m )1 .4280.088
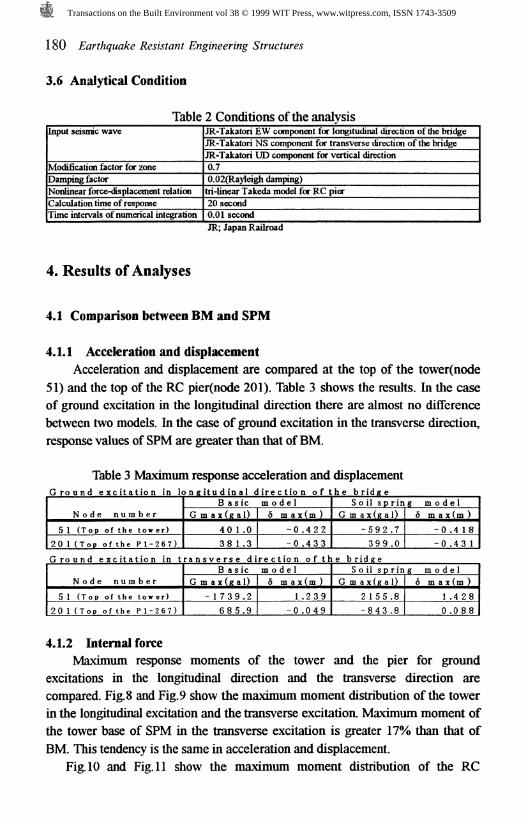
4.1.2 Internal forceMaximum response moments of the tower and the pier for ground
excitations in the longitudinal direction and the transverse direction arecompared. Fig. 8 and Fig. 9 show the maximum moment distribution of the tower
in the longitudinal excitation and the transverse excitation. Maximum moment of
the tower base of SPM in the transverse excitation is greater 17% than that of
BM. This tendency is the same in acceleration and displacement.
Fig. 10 and Fig. 11 show the maximum moment distribution of the RC
Transactions on the Built Environment vol 38 © 1999 WIT Press, www.witpress.com, ISSN 1743-3509
Earthquake Resistant Engineering Structures 181
pier(Pl-267) under the tower in the longitudinal excitation and the transverse
excitation. These show the same tendency as the moment of the tower.
Fig.8 Tower bending moment
in the longitudinal excitation
Fig.9 Tower bending moment
in the transverse excitation
Fig. 10 RC pier bending momentin the longitudinal excitation
4.2 Comparison between BM and TBM
Fig. 11 RC pier bending momentin the transverse excitation
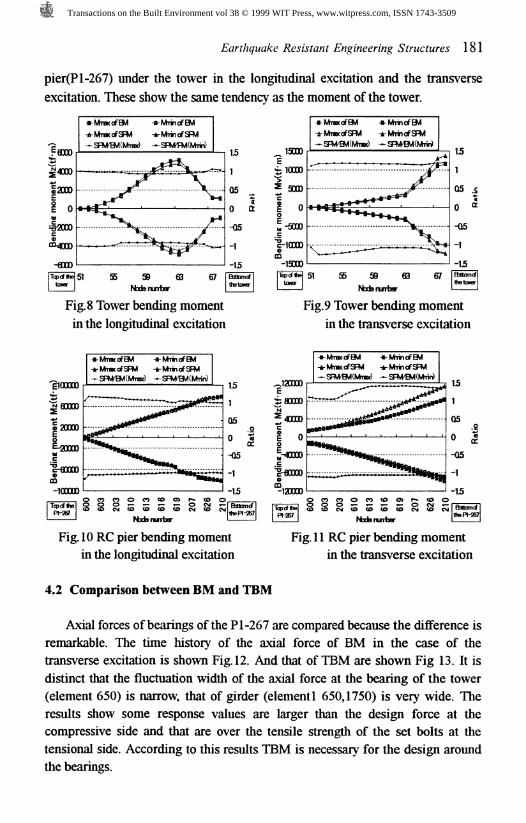
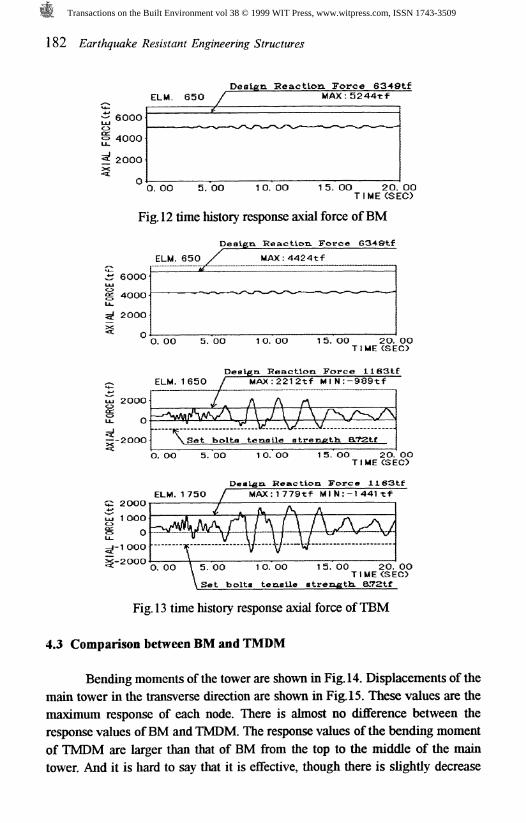
Axial forces of bearings of the PI-267 are compared because the difference is
remarkable. The time history of the axial force of BM in the case of thetransverse excitation is shown Fig. 12. And that of TBM are shown Fig 13. It is
distinct that the fluctuation width of the axial force at the bearing of the tower
(element 650) is narrow, that of girder (element 1 650,1750) is very wide. The
results show some response values are larger than the design force at thecompressive side and that are over the tensile strength of the set bolts at the
tensional side. According to this results TBM is necessary for the design around
the bearings.
Transactions on the Built Environment vol 38 © 1999 WIT Press, www.witpress.com, ISSN 1743-3509
182 Earthquake Resistant Engineering Structures
Design Reaction Force 6349tfELM. 650 / M A X : 5 2 4 4 t f
6OOO
4OOO
2000
O O. OO 5. OO 1 0. OO 1 5. OO 2O. OOTIME (SEC)
Fig. 12 time history response axial force of BM
ELM. 650Design. Reaction. Force 634Qtf
MAX:4424tf
6000
4OOO
2OOO
O. OO 5. OO 1 O. OO 1 5. OO 2O. OOTIME (SEC)
Design Reaction Force
u_ O
g-2000
ELM. 1 650 / MAX:2212tf MlN:-989tf
2000 j A A A n
\Set?
bolta tensileO. OO 5. OO 1 O. OO 1 5. OO 2O. OO
TIME (SEC)
Design. Reaction ForceELM. 1 75O I MAX: 1 779tf Ml N:-1 441 tf
Fig. 13 time history response axial force of TBM
4.3 Comparison between BM and TMDM
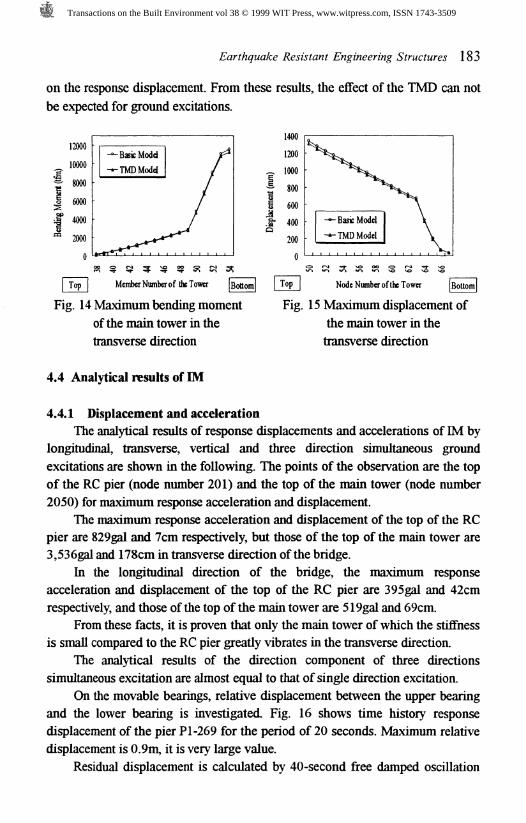
Bending moments of the tower are shown in Fig. 14. Displacements of the
main tower in the transverse direction are shown in Fig. 15. These values are the
maximum response of each node. There is almost no difference between the
response values of BM and TMDM. The response values of the bending moment
of TMDM are larger than that of BM from the top to the middle of the main
tower. And it is hard to say that it is effective, though there is slightly decrease
Transactions on the Built Environment vol 38 © 1999 WIT Press, www.witpress.com, ISSN 1743-3509
Earthquake Resistant Engineering Structures 183
on the response displacement. From these results, the effect of the TMD can not
be expected for ground excitations.
12000
10000
8000
6000
4000
2000
0
1400
1200_ 1000g 800§ 600.g- 400Q
2000
Top Member Number of the Tower Bottom
Fig. 14 Maximum bending moment
of the main tower in the
transverse direction
4.4 Analytical results of EVf
I Top I Node Number of the Tower | Bottom |
Fig. 15 Maximum displacement of
the main tower in the
transverse direction
4.4.1 Displacement and accelerationThe analytical results of response displacements and accelerations of IM by
longitudinal, transverse, vertical and three direction simultaneous ground
excitations are shown in the following. The points of the observation are the top
of the RC pier (node number 201) and the top of the main tower (node number
2050) for maximum response acceleration and displacement.
The maximum response acceleration and displacement of the top of the RC
pier are 829gal and 7cm respectively, but those of the top of the main tower are3,536gal and 178cm in transverse direction of the bridge.
In the longitudinal direction of the bridge, the maximum response
acceleration and displacement of the top of the RC pier are 395gal and 42cm
respectively, and those of the top of the main tower are 519gal and 69cm.From these facts, it is proven that only the main tower of which the stiffness
is small compared to the RC pier greatly vibrates in the transverse direction.
The analytical results of the direction component of three directions
simultaneous excitation are almost equal to that of single direction excitation.
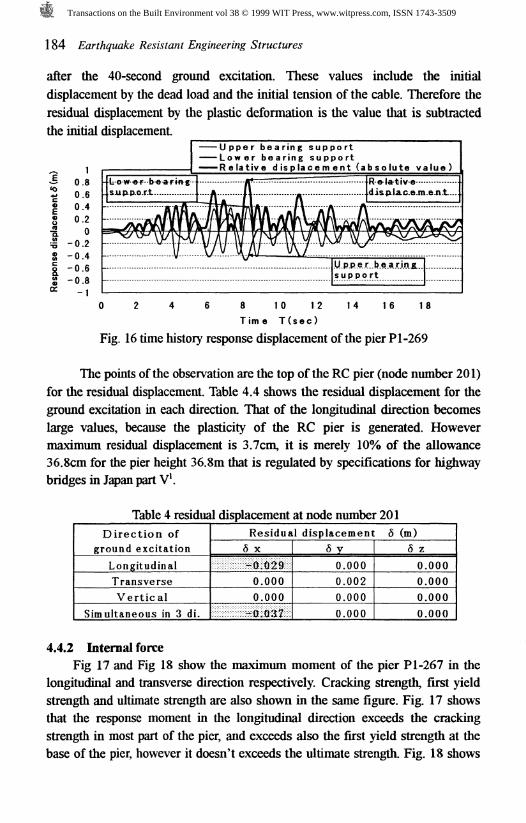
On the movable bearings, relative displacement between the upper bearing
and the lower bearing is investigated. Fig. 16 shows time history response
displacement of the pier PI-269 for the period of 20 seconds. Maximum relative
displacement is 0.9m, it is very large value.
Residual displacement is calculated by 40-second free damped oscillation
Transactions on the Built Environment vol 38 © 1999 WIT Press, www.witpress.com, ISSN 1743-3509
184 Earthquake Resistant Engineering Structures
after the 40-second ground excitation. These values include the initial
displacement by the dead load and the initial tension of the cable. Therefore the
residual displacement by the plastic deformation is the value that is subtracted
the initial displacement.
10.80.60.40.20
-0.2-0.4-0.6-0.8-1
Upper bearing supportLower bearing support
— Relative displacement (absolute value)
6 14 16 188 10 12T im e T(sec)
Fig. 16 time history response displacement of the pier PI-269
The points of the observation are the top of the RC pier (node number 201)
for the residual displacement. Table 4.4 shows the residual displacement for the
ground excitation in each direction. That of the longitudinal direction becomes
large values, because the plasticity of the RC pier is generated. However
maximum residual displacement is 3.7cm, it is merely 10% of the allowance36.8cm for the pier height 36.8m that is regulated by specifications for highway
bridges in Japan part V*.
Table 4 residual displacement at node number 201
Direction ofground excitation
LongitudinalTransverseVertical
Simultaneous in 3 di.
Residual displacement d (m)6 x-0:0290.0000.000
-0.037
6 y0.0000.0020.0000.000
6 z0.0000.0000.0000.000
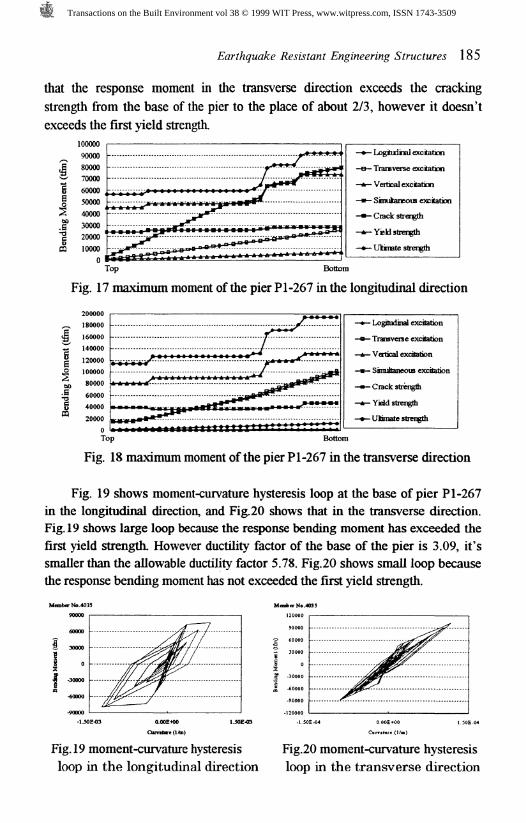
4.4.2 Internal forceFig 17 and Fig 18 show the maximum moment of the pier P1-267 in the
longitudinal and transverse direction respectively. Cracking strength, first yield
strength and ultimate strength are also shown in the same figure. Fig. 17 shows
that the response moment in the longitudinal direction exceeds the cracking
strength in most part of the pier, and exceeds also the first yield strength at the
base of the pier, however it doesn't exceeds the ultimate strength. Fig. 18 shows
Transactions on the Built Environment vol 38 © 1999 WIT Press, www.witpress.com, ISSN 1743-3509
Earthquake Resistant Engineering Structures 185
that the response moment in the transverse direction exceeds the cracking
strength from the base of the pier to the place of about 2/3, however it doesn't
exceeds the first yield strength.
—+— Logtudinal excitation-e— Transverse excitation—a— Vertical excitation-*— SiTiukaneous excitation-#-Crack strengthA YBIU strength
-+- Ultimate strength
Bottom
Fig. 17 maximum moment of the pier Pl-267 in the longitudinal direction
20000018000016000014000012000010000080000600004000020000
0TO]
—•— Logitudinal excitation—e— Transverse excitation—*— Vertical excitation-*- Simultaneous excitation• Crack strength-*—Yidd strength-»- Ultimate strength
Bottom
Fig. 18 maximum moment of the pier Pl-267 in the transverse direction
Fig. 19 shows moment-curvature hysteresis loop at the base of pier Pl-267in the longitudinal direction, and Fig.20 shows that in the transverse direction.Fig. 19 shows large loop because the response bending moment has exceeded the
first yield strength. However ductility factor of the base of the pier is 3.09, it'ssmaller than the allowable ductility factor 5.78. Fig.20 shows small loop because
the response bending moment has not exceeded the first yield strength.
obcrN«.40351200009000000000000
0000000000000
Cvmrare (Mm)
Fig. 19 moment-curvature hysteresis
loop in the longitudinal direction
Fig.20 moment-curvature hysteresis
loop in the transverse direction
Transactions on the Built Environment vol 38 © 1999 WIT Press, www.witpress.com, ISSN 1743-3509
186 Earthquake Resistant Engineering Structures
5. Conclusions
The displacement, acceleration, internal force for the transverse excitation
tends to increase, when the soil is modeled in the spring.
All the bearings must be modeled. Especially large axial force occurs at the
bearings of the girder by the transverse excitation. Same results have been
obtained in other studies for urban viaduct, so the attention is necessary for
the design of the bearing support.
TMD setting at the top of the tower for aerodynamic stability has no effect
for strong earthquake, inversely sometimes increase section force.
The maximum displacement of the top of the tower is 70cm in the
longitudinal direction, exceeds 2m in the transverse direction.
The maximum relative displacement of the movable bearings between
upper and lower bearings is 90cm at the pier Pl-269. This must be considered for
the design of the bearings.The maximum bending moment of the pier PI-267 exceeds the first yields
strength, but does not exceed the ultimate strength yet in the longitudinal
direction. And that exceeds the cracking strength, but does not exceed the first
yields strength in the transverse direction.The maximum residual displacement is very small, so it would not become
a problem.
References
1. Japan Road Association, Specifications for highway bridges Part V
Seismic Design (English edition), Maruzen, Tokyo, 1996.
2. Yamahira, K., Nonlinear dynamic analysis of a bridge total system, Proc.
of the 52th annual Conf of the JSCE, 1-(B), eds. T. Okamoto, S. Endou,
JSCE, Tokyo, pp.244-245, 1997.3. Yamahira, K., The analysis of damage factor of the bearings of the urban
viaduct by the three-dimensional nonlinear seismic response analysis,
Proc. of the 53th annual Conf of the JSCE. 1-(B), eds. N. Nishimura,
JSCE, Tokyo, pp.294-295, 1998.4. Kansai Branch of JSCE, Damages of Steel Steel Structures, Restoration,
Retrofit and Design Methods, Part3, Lessons from the Hanshin-Awaji
Great Earthquake Disaster, Vol. 1, Kansai Branch of JSCE, Osaka,
pp.113-121,1998.
Transactions on the Built Environment vol 38 © 1999 WIT Press, www.witpress.com, ISSN 1743-3509