Embed Size (px)
Citation preview
North-south anisotropy of galactic cosmic raysobserved with the Global Muon Detector Network
34th ICRC (August 4, 2015, Den Hague) SH07 ID117
GCR anisotropy vector in 3D consists of three components…
•Equatorial components: diurnal anisotropy⇒
•North-south anisotropy (NSA): See Munakata+ ApJ 791 2014
(Analyzed NM & Nagoya MD and found a hard rigidity spectrum of NSA.)
NSA is necessary to construct the anisotropy in 3D, but has been most difficult component to accurately observe.
This paper will present preliminary analyses of NSA observed with the GMDN & Nagoya GG-component in 1994-2014.
K. Munakataa, M. Kozaia, C. Katoa, T. Kuwabarab, M. Rockenbachc, A. Dal Lagod,
N.J. Schuchc, H. K. Al Jassare, M. M. Sharmae, M. L. Duldigf, J. E. Humblef,
J. W. Bieberg, P. Evensong, I. Sabbahh and M. Tokumaruy
aShinshu Univ., bChiba Univ., cCRS/INPE, dINPE, eKuwait Univ., fUniv. of Tasmania, gUniv. of Delaware, hCollege of Health Sciences, iNagoya Univ.
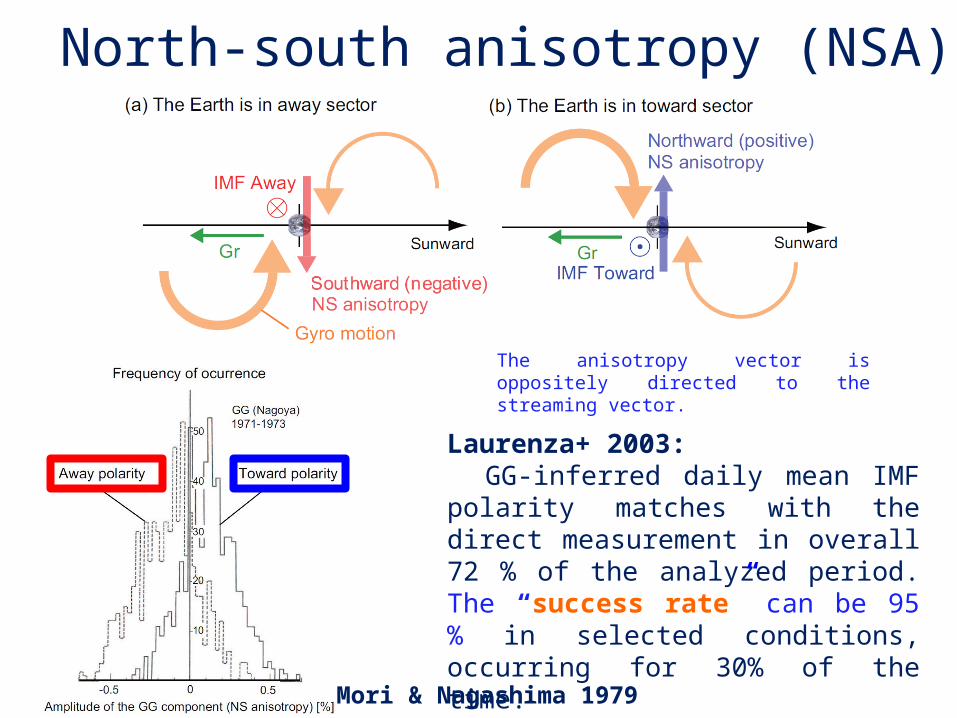
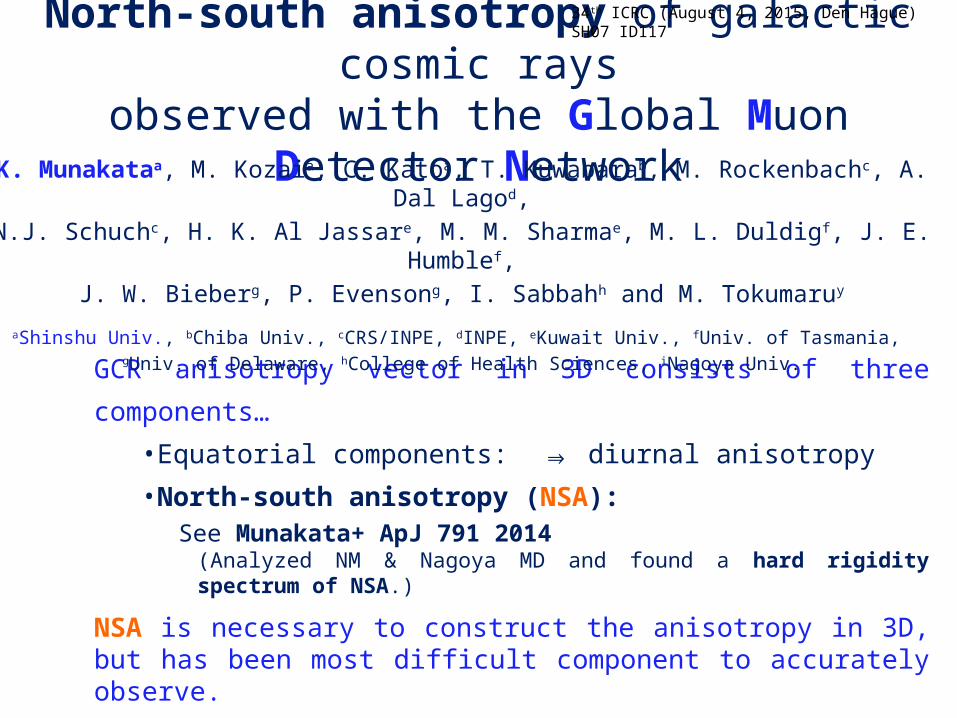
North-south anisotropy (NSA)
The anisotropy vector is oppositely directed to the streaming vector.
Laurenza+ 2003:GG-inferred daily mean IMF polarity
matches with the direct measurement in overall 72 % of the analyzed period. The “success rate” can be 95 % in selected conditions, occurring for 30% of the time.
Mori & Nagashima 1979

Nagoya GG-component
• Eliminate the temperature effect by the subtraction between two directional channels with a common zenith angle.
• Two subtractions are averaged to eliminate the effect of cut-off rigidity difference.
𝐺𝐺=(49 °𝑁−49 °𝑆 )+(49 °𝑁−49 °𝐸)
NSA by GMDN
: coupling coefficients
𝑷𝒎 𝟖𝟎𝐆𝐕
𝑷𝒎 𝟔𝟎𝐆𝐕
Nagashima 1971

Asymptotic viewing directions of GMDN
36 m2 32 m2 16 m2 25 m2
GMDN is described in Okazaki+ ApJ 682 2008
• ☆indicates the location of the detector.
• ○□△display the asymptotic viewing directions of median energy CRs corrected for the geomagnetic bending.
• Thin lines indicate the spread of viewing direction for the central 80 % of the energy response to primary CRs.
Data available at… http://cosray.shinshu-u.ac.jp/crest/

by GG-comp. & GMDN
Okazaki+ ApJ 681 2008
CR2043 (2006 May 8 to June 4).
A A AT T
Count rate error~0.3%G
GG
MD
N

Seasonal variation of
Ecliptic plane
Equatorial plane
𝜉 𝑧𝐺𝐸𝑂 𝜉 𝑧
𝐺𝑆𝐸𝜉 𝑧𝐺𝑆𝐸
𝜉 𝑧𝐺𝐸𝑂
𝜉 𝑥, 𝑦𝐺𝑆𝐸 𝜉 𝑥, 𝑦
𝐺𝑆𝐸
September March
Equatorial plane
observed by GG-comp.(2002-2014)
is different from , and influenced by in the ecliptic plane.

Histograms of daily mean
𝜉 𝑧𝐺𝐸𝑂 (𝐺𝐺 )(%)
no. o
f da
ys
1994~2014
Solar min.2009
Solar max.2000
<T> - <A>: 0.165%SDV: (0.319%)
0.078%(0.200%)
0.217%(0.386%)
TowardAway
Success rate ~ 70%if Gaussian

Long-term variation of
Toward
Away
: by GG : by GMDN
Success rate
SDV
(%)
(%)
(%)
year
Toward
Away
: by GG : by GMDN
Success rate
SDV
(%)
(%)
(%)
year
Summary The NSAs observed with the GMDN and the GG-
component are analyzed.
We find for the first time a significant seasonal variation of NSA indicating the influence of the anisotropy component in the ecliptic plane.
The temporal variations of the NSA observed with the GMDN and GG-component are consistent with each other.
The T-A separation between average NSAs in each CR shows a solar cycle variation with minimum (maximum) around the solar activity minimum (maximum).
The standard deviation in each CR also shows a similar variation, keeping the ”success rate” roughly constant.

Thank youfor your attention!