Embed Size (px)
Citation preview

Nuevas Soluciones en DP, Sirven?
Prueba en diabéticos con transporte peritoneal alto y promedio alto
Nuevas Soluciones en DP, Sirven?
Prueba en diabéticos con transporte peritoneal alto y promedio alto
Dr. José Ramón Paniagua SierraUnidad de Investigación Médica en Enfermedades Nefrológicas. UMAE HE CMN S XXI, México, D. F.
Dr. José Ramón Paniagua SierraUnidad de Investigación Médica en Enfermedades Nefrológicas. UMAE HE CMN S XXI, México, D. F.

Background
Sodium intake and extracellular fluid volume expansion have been associated with hypertension and cardiovascular mortality in the general population
Extracellular fluid volume expansion is the most frequent cause of hypertension in ESRD patients with or without dialysis treatment. It has been related with other predictors of death like left ventricular hypertrophy
Extracellular fluid volume expansion has also been related with lost of RRF and low grade chronic inflammation

Background
Several clinical conditions and serum markers are now known as predictors of clinical outcomes in ESRD patients. Among them: Diabetes Cardiovascular morbidity (LVH, HT, proBNP, TNt) Malnutrition (SA, TF, LBM, TBW, MAC) Inflammation (CRP, TNF, IL-6) Fluid and sodium removal
The variety of predictors suggest a complex network of interactions between them. ECFv expansion may have a significant role

ADEMEX Mortality ADEMEX Mortality
IL 6 and mortalityIL 6 and mortality
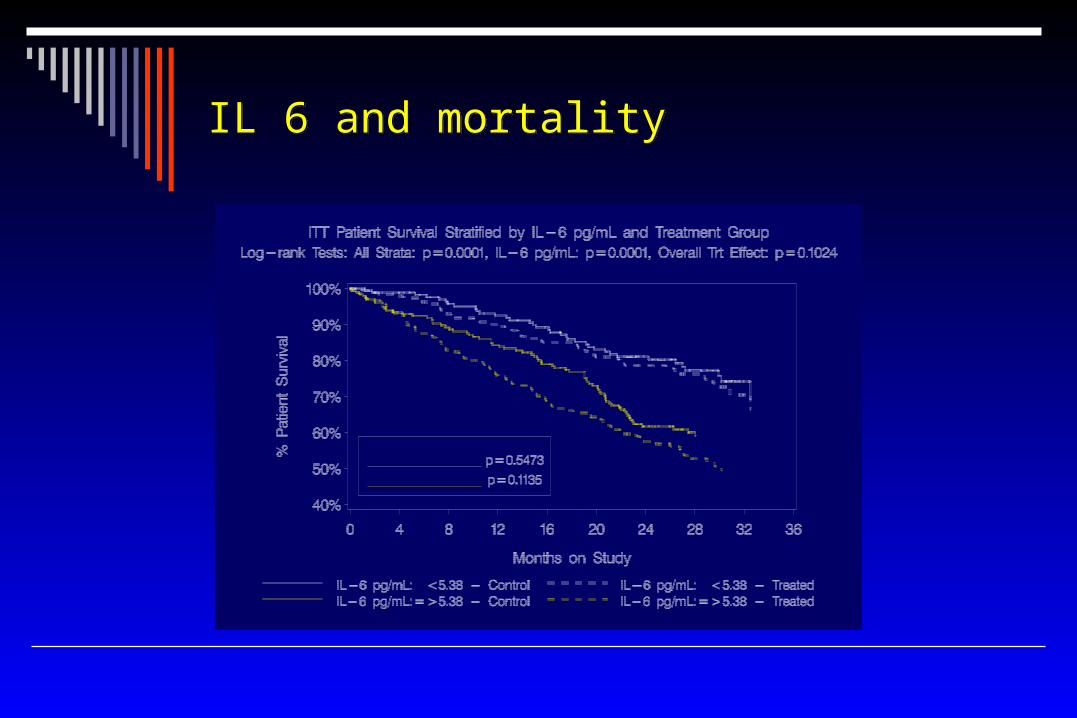
C-reactive protein and mortality
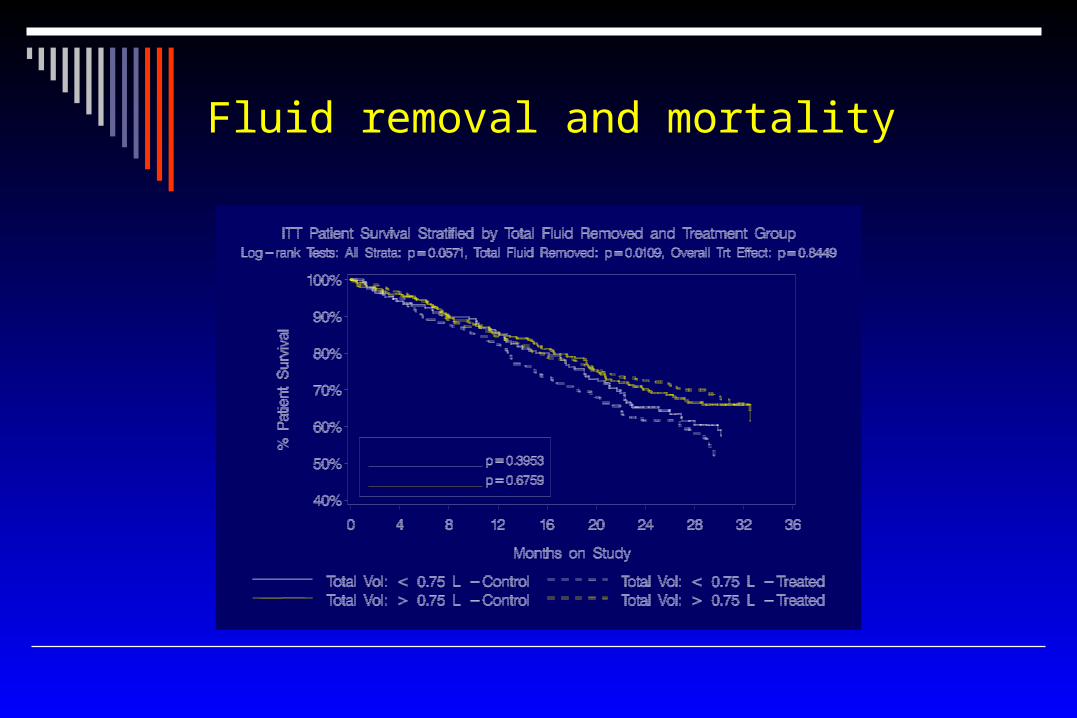
Fluid removal and mortality
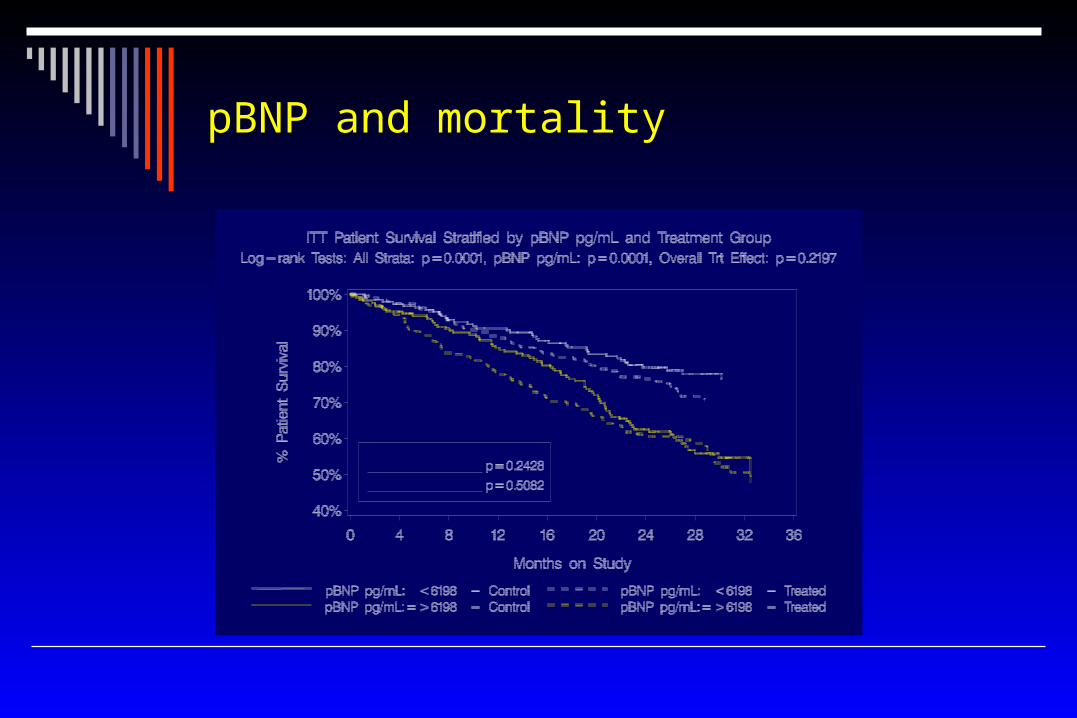
pBNP and mortality
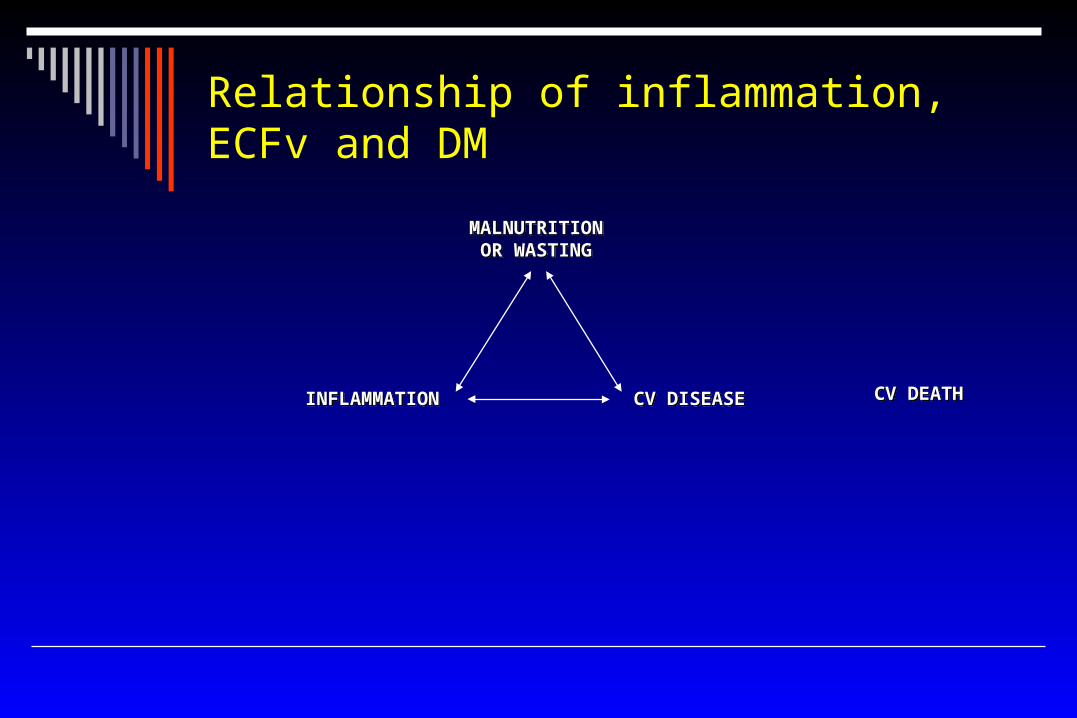
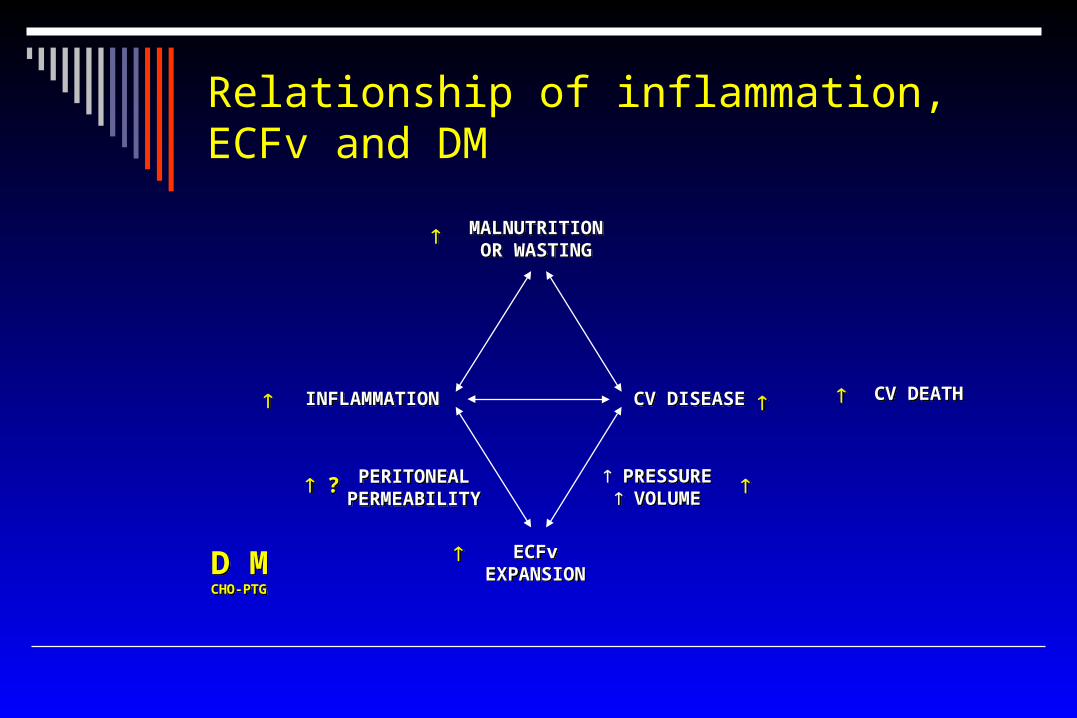
Relationship of inflammation, ECFv and DM
MALNUTRITIONOR WASTING
MALNUTRITIONOR WASTING
INFLAMMATIONINFLAMMATION CV DISEASECV DISEASE CV DEATHCV DEATH
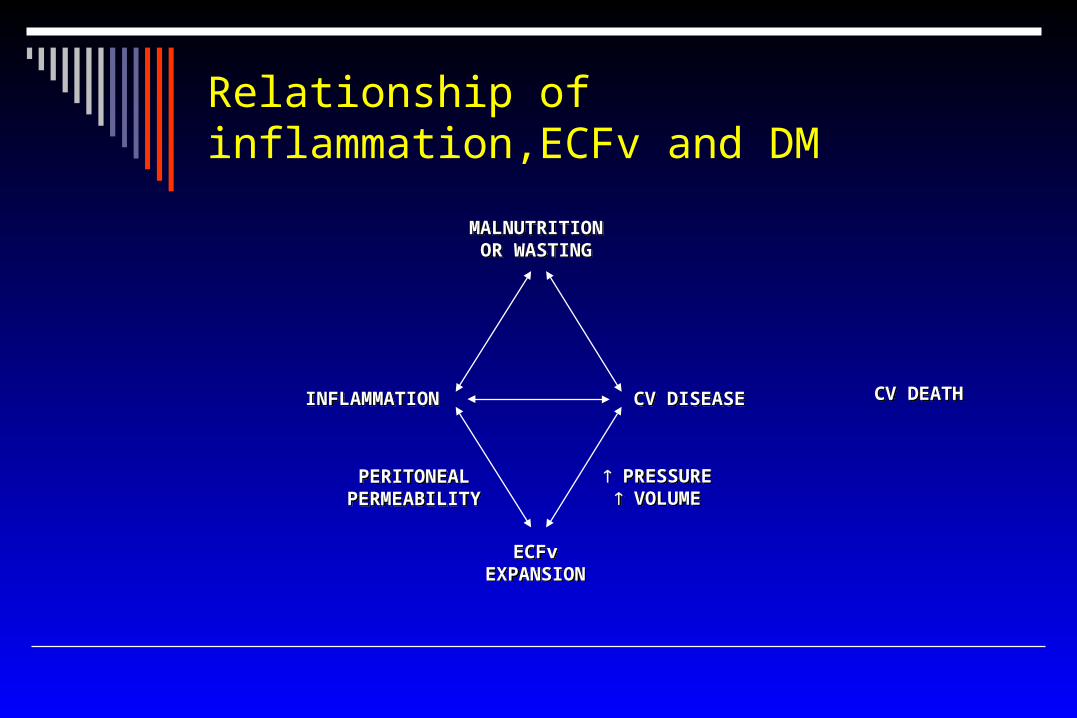
Relationship of inflammation,ECFv and DM
MALNUTRITIONOR WASTING
MALNUTRITIONOR WASTING
INFLAMMATIONINFLAMMATION CV DISEASECV DISEASE CV DEATHCV DEATH
ECFvEXPANSION
ECFvEXPANSION
PERITONEALPERMEABILITYPERITONEAL
PERMEABILITY PRESSURE VOLUME
PRESSURE VOLUME
Relationship of inflammation, ECFv and DM
MALNUTRITIONOR WASTING
MALNUTRITIONOR WASTING
INFLAMMATIONINFLAMMATION CV DISEASECV DISEASE CV DEATHCV DEATH
ECFvEXPANSION
ECFvEXPANSION
PERITONEALPERMEABILITYPERITONEAL
PERMEABILITY PRESSURE VOLUME
PRESSURE VOLUME
D MCHO-PTG
D MCHO-PTG
? ?
Background
The success in the control of ECFv of PD patients depends on:
Sodium and fluid intake Residual renal function Peritoneal transport type (PET) Type and concentration of the osmotic agent in the
dialysis solution
The success in the control of ECFv of PD patients depends on:
Sodium and fluid intake Residual renal function Peritoneal transport type (PET) Type and concentration of the osmotic agent in the
dialysis solution
BackgroundBackground
Glucose is the most commonly used osmotic agent. Disadvantages:
Damage of mesothelial cells by glucose degradation products and advanced glycation products
Peritoneal glucose absorption. Then: Loss of osmotic gradient = deficient UF Obesity, low protein intake, impairment in metabolic
control
Diabetes increases glucose disadvantages
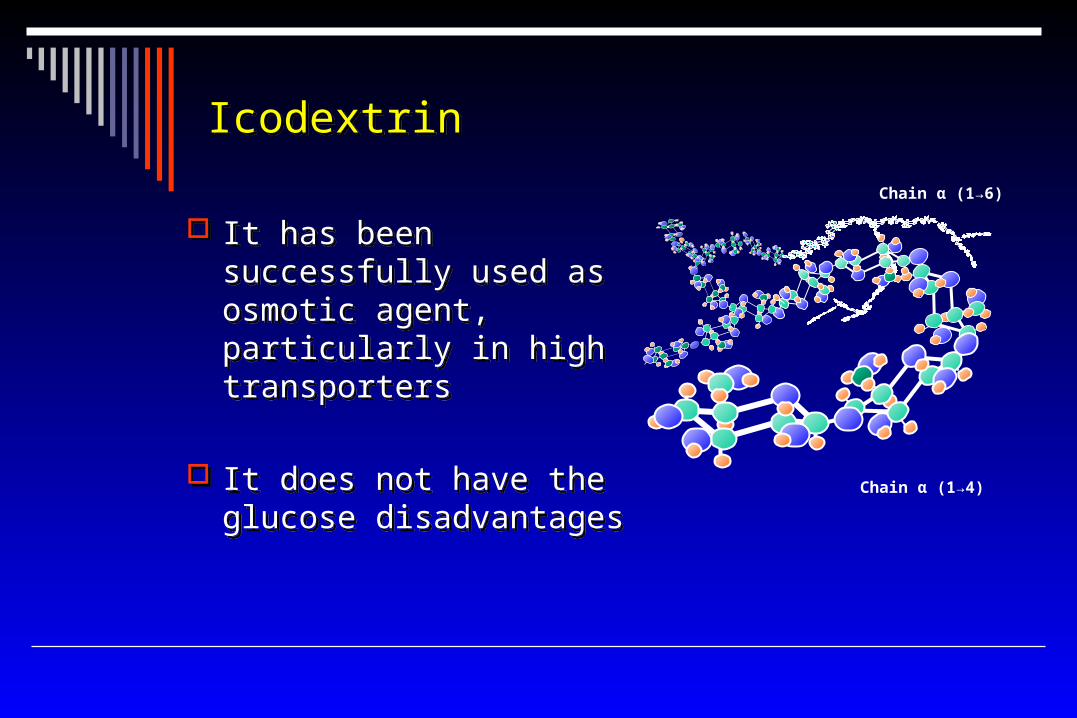
IcodextrinIcodextrin
It has been successfully used as osmotic agent, particularly in high transporters
It does not have the glucose disadvantages
It has been successfully used as osmotic agent, particularly in high transporters
It does not have the glucose disadvantages Chain α (1→4)
Chain α (1→6)
Background Background
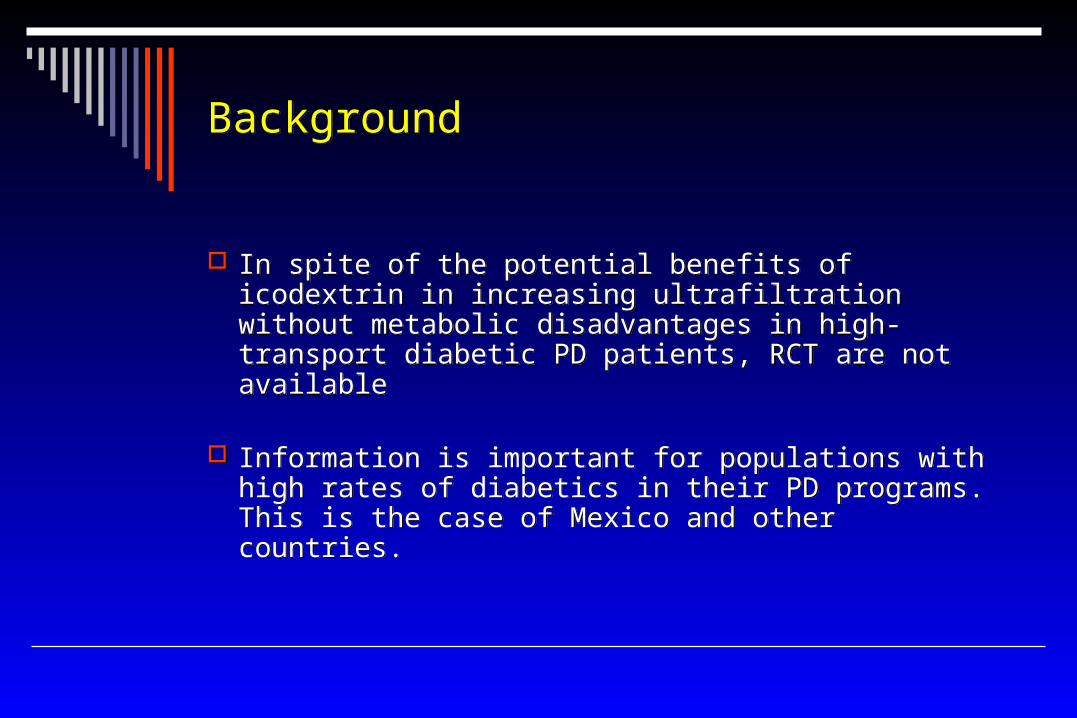
In spite of the potential benefits of icodextrin in increasing ultrafiltration without metabolic disadvantages in high-transport diabetic PD patients, RCT are not available
Information is important for populations with high rates of diabetics in their PD programs. This is the case of Mexico and other countries.
Objective Objective
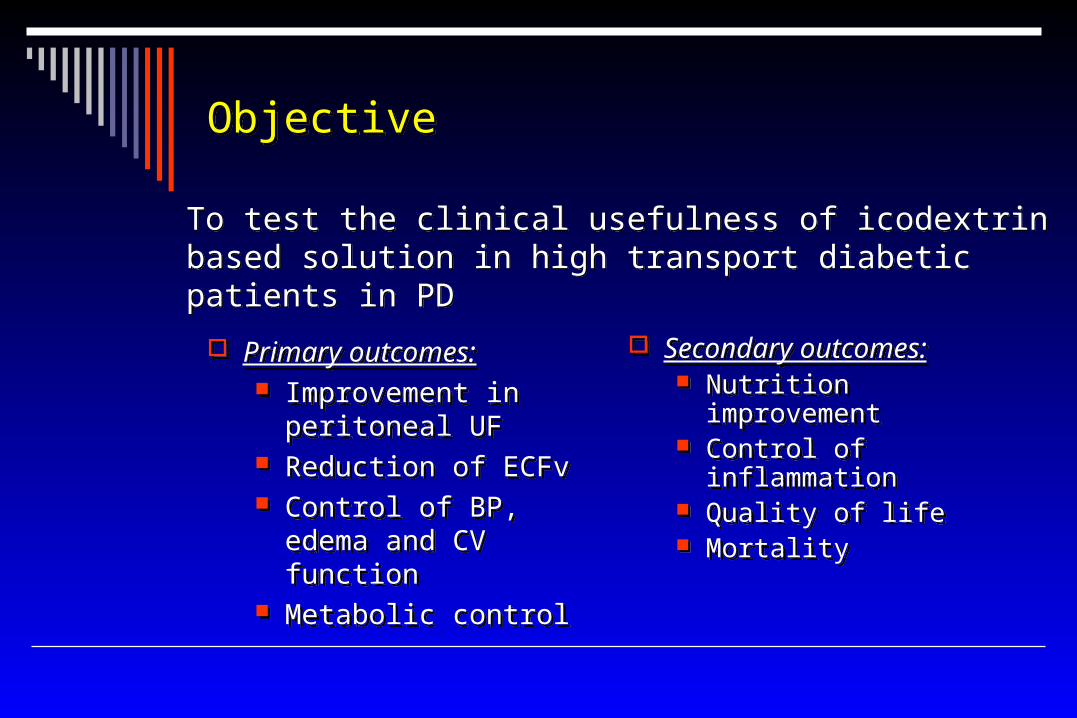
Primary outcomes: Improvement in
peritoneal UF Reduction of ECFv Control of BP, edema
and CV function Metabolic control
Primary outcomes: Improvement in
peritoneal UF Reduction of ECFv Control of BP, edema
and CV function Metabolic control
Secondary outcomes: Nutrition improvement Control of inflammation Quality of life Mortality
Secondary outcomes: Nutrition improvement Control of inflammation Quality of life Mortality
To test the clinical usefulness of icodextrin based solution in high transport diabetic patients in PDTo test the clinical usefulness of icodextrin based solution in high transport diabetic patients in PD
Study designTarget of treatment
Study designTarget of treatment
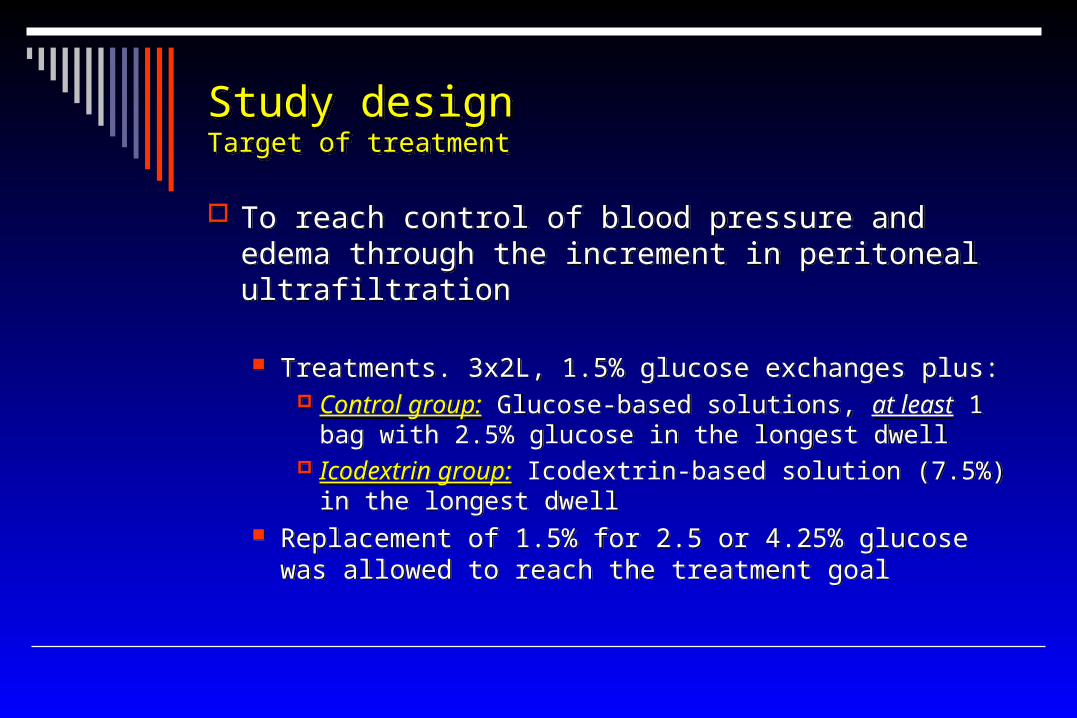
To reach control of blood pressure and edema through the increment in peritoneal ultrafiltration
Treatments. 3x2L, 1.5% glucose exchanges plus: Control group: Glucose-based solutions, at least 1 bag
with 2.5% glucose in the longest dwell Icodextrin group: Icodextrin-based solution (7.5%) in the
longest dwell Replacement of 1.5% for 2.5 or 4.25% glucose was
allowed to reach the treatment goal
Study designStudy design
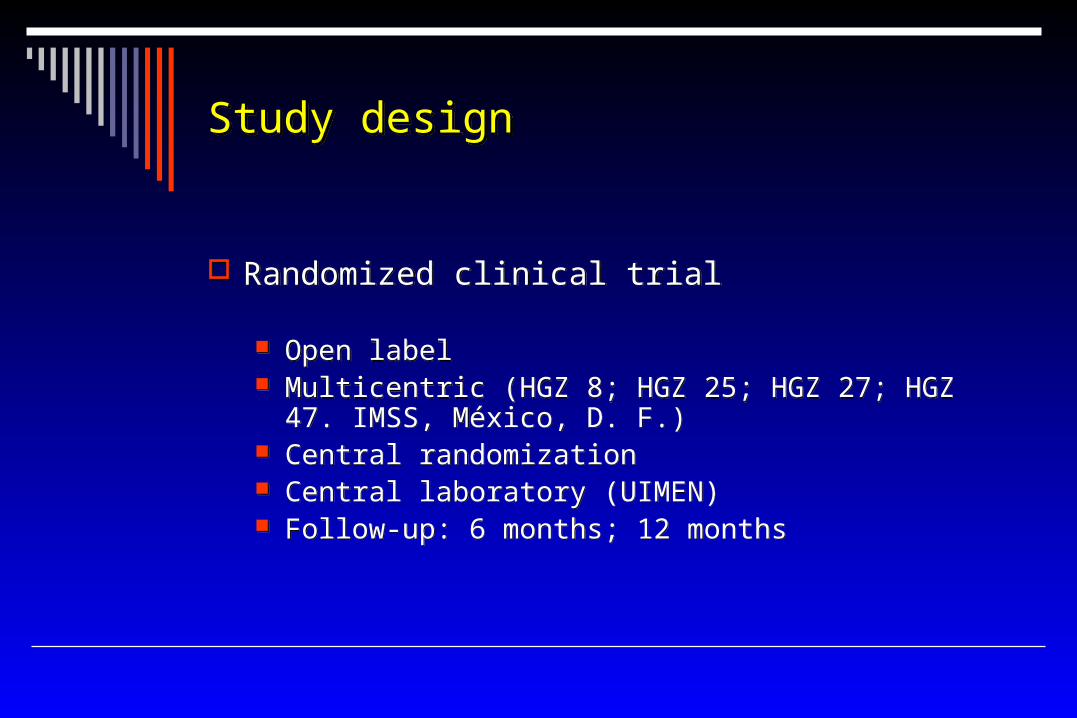
Randomized clinical trial
Open label Multicentric (HGZ 8; HGZ 25; HGZ 27; HGZ 47. IMSS,
México, D. F.) Central randomization Central laboratory (UIMEN) Follow-up: 6 months; 12 months
Randomized clinical trial
Open label Multicentric (HGZ 8; HGZ 25; HGZ 27; HGZ 47. IMSS,
México, D. F.) Central randomization Central laboratory (UIMEN) Follow-up: 6 months; 12 months
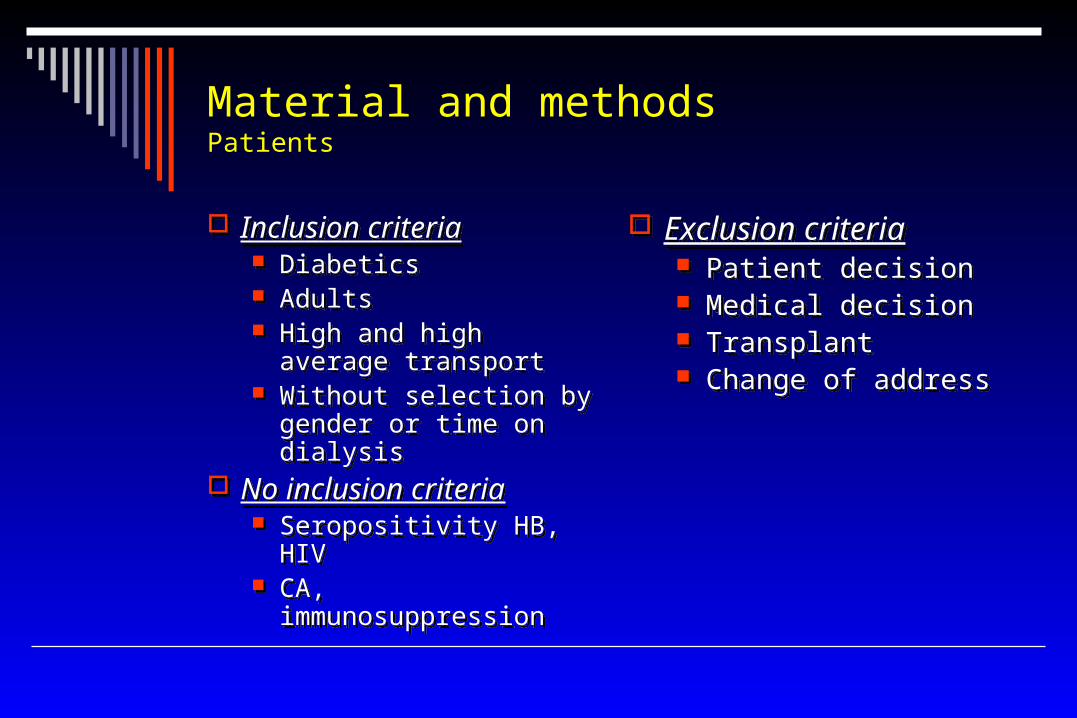
Inclusion criteria Diabetics Adults High and high average
transport Without selection by
gender or time on dialysis
No inclusion criteria Seropositivity HB, HIV CA, immunosuppression
Inclusion criteria Diabetics Adults High and high average
transport Without selection by
gender or time on dialysis
No inclusion criteria Seropositivity HB, HIV CA, immunosuppression
Exclusion criteria Patient decision Medical decision Transplant Change of address
Exclusion criteria Patient decision Medical decision Transplant Change of address
Material and methodsPatients

ResultsResults
Without differences between groups at baseline in:
Age Gender Blood pressure Body composition Dialysis adequacy Biochemical parameters Comorbidity
Without differences between groups at baseline in:
Age Gender Blood pressure Body composition Dialysis adequacy Biochemical parameters Comorbidity
Results
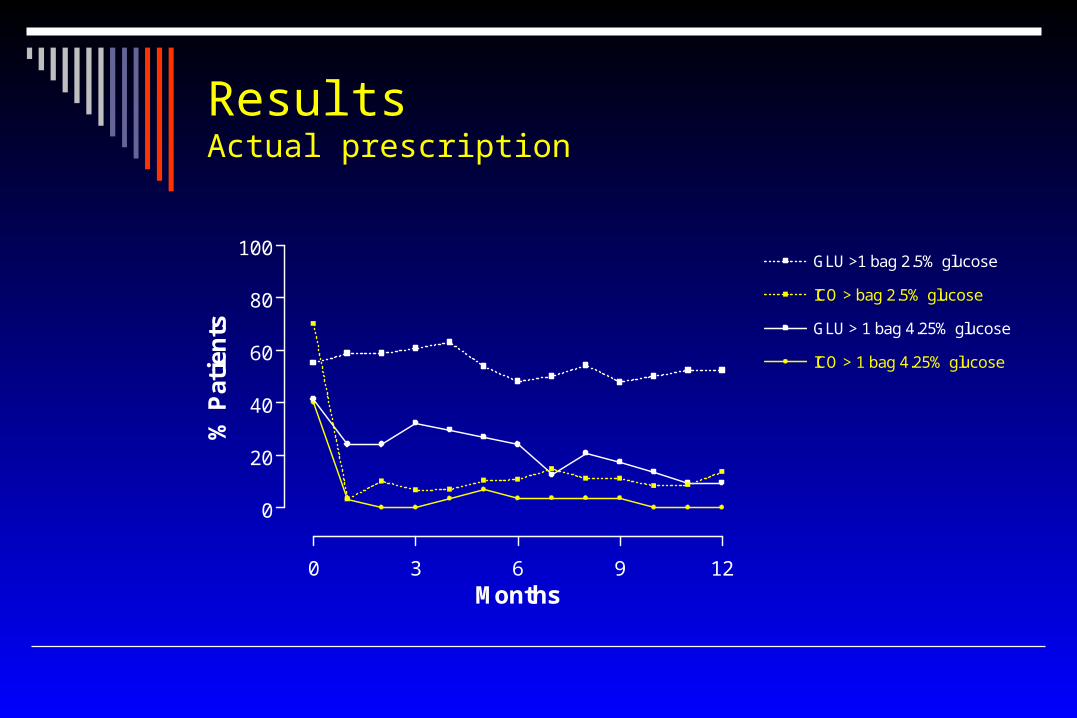
Prescription In the control group two thirds of the patients needed more
than one bag of 2.5% glucose or at least one bag of 4.25% glucose. In the icodextrin group only 9% needed a bag with more than 1.5% of glucose
Prescription In the control group two thirds of the patients needed more
than one bag of 2.5% glucose or at least one bag of 4.25% glucose. In the icodextrin group only 9% needed a bag with more than 1.5% of glucose
0 3 6 9 12
0
20
40
60
80
100GLU >1 bag 2.5% glucose
ICO > bag 2.5% glucose
GLU > 1 bag 4.25% glucose
ICO > 1 bag 4.25% glucose
Months
% P
atie
nts
ResultsActual prescription
Results
Metabolic control
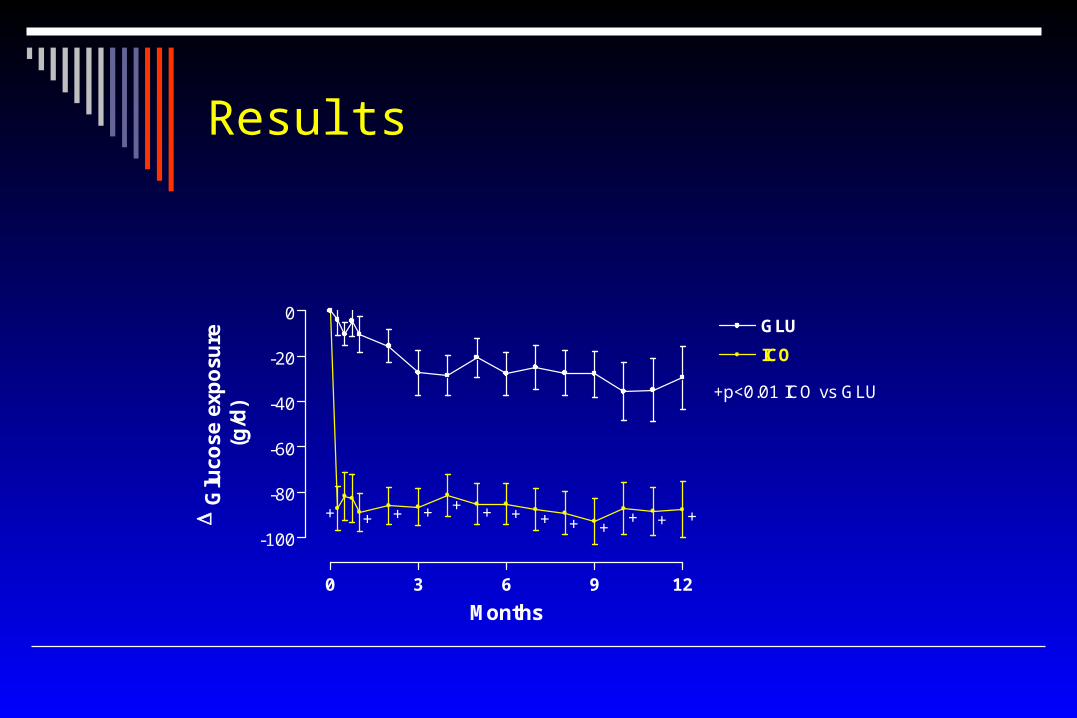
Results
0 3 6 9 12
-100
-80
-60
-40
-20
0GLU
ICO
+p<0.01 ICO vs GLU
+ + + + + + + + + ++ + +
Months
G
luco
se e
xpo
sure
(g/d
)
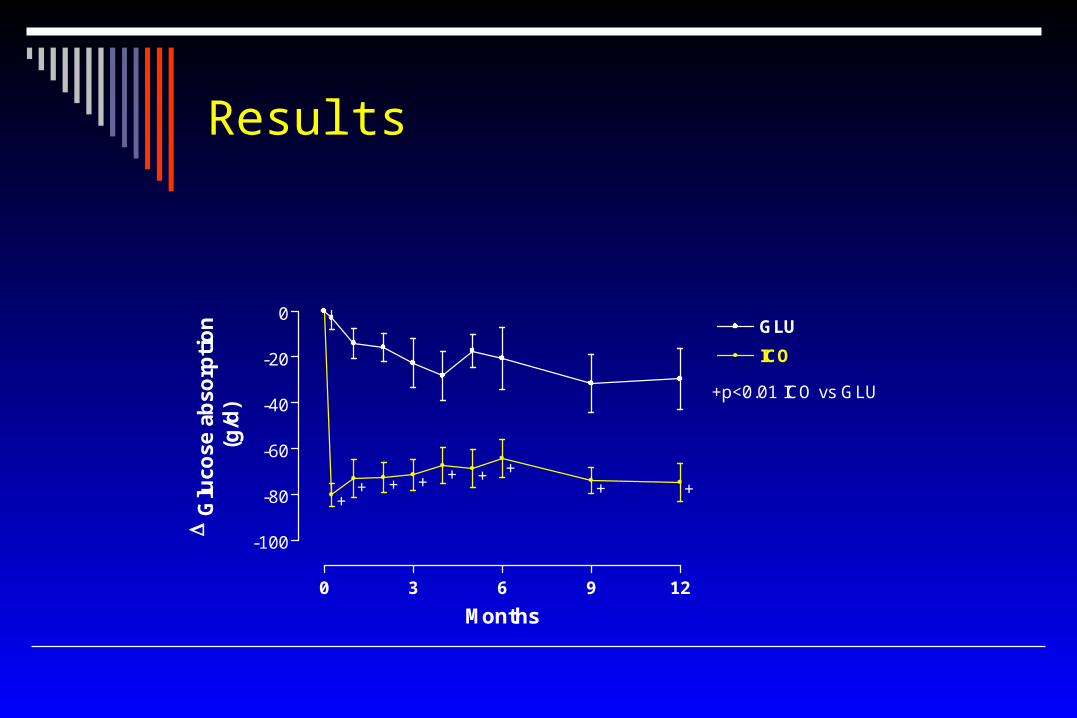
Results
0 3 6 9 12
-100
-80
-60
-40
-20
0GLU
ICO
+p<0.01 ICO vs GLU
++
+ + + + + ++
Months
G
luco
se a
bso
rpti
on
(g/d
)

Mean±EEM*p<0.05; ** p<0.03; *** p<0.01 vs Control‡p<0.05; ‡ ‡ p<0.03; ‡ ‡ ‡ p<0.01 vs Basal
Mean±EEM*p<0.05; ** p<0.03; *** p<0.01 vs Control‡p<0.05; ‡ ‡ p<0.03; ‡ ‡ ‡ p<0.01 vs Basal
0 3 6 9 12
-5-4-3-2-10123456
GLU
ICO
A
GBS vs IBS p<0.001
Months
B
od
y w
eig
ht
(kg
)
Results
Results
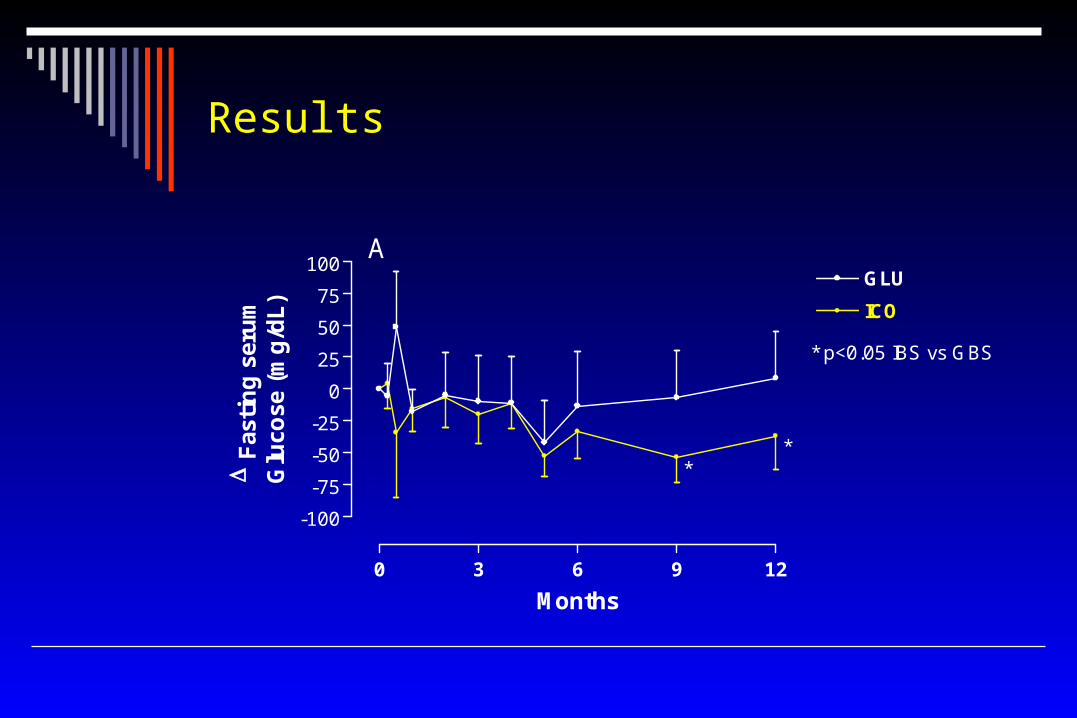
0 3 6 9 12
-100
-75
-50
-25
0
25
50
75
100GLU
ICO
A
* p<0.05 IBS vs GBS
**
Months
F
asti
ng
ser
um
Glu
cose
(m
g/d
L)
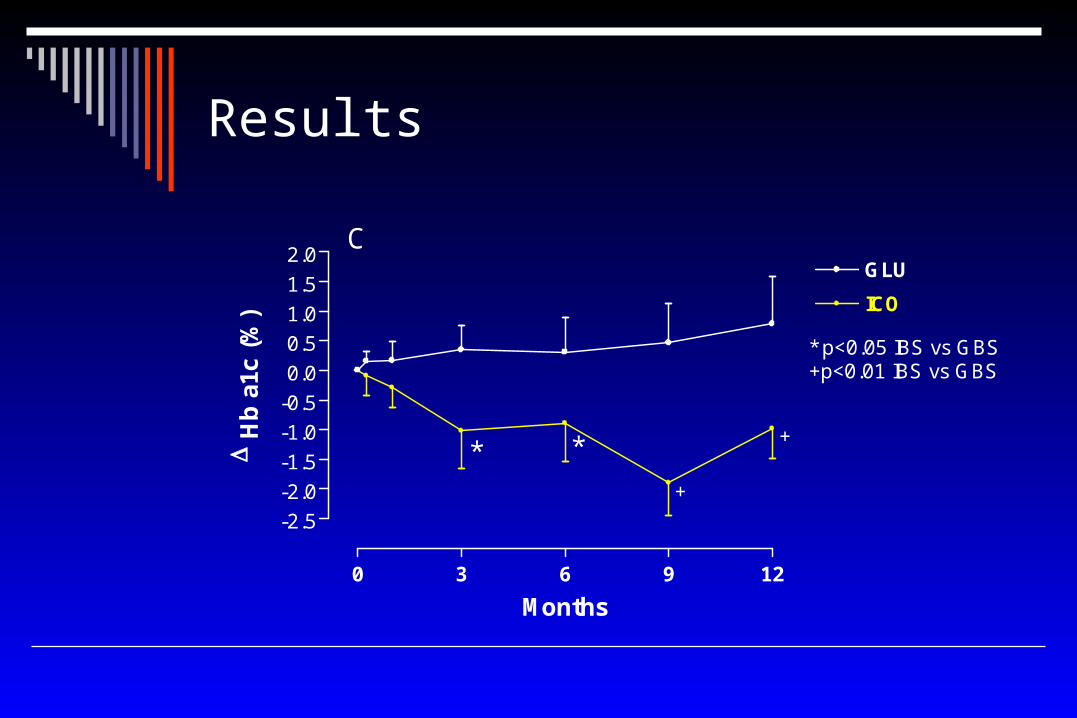
0 3 6 9 12
-2.5
-2.0
-1.5
-1.0
-0.5
0.0
0.5
1.0
1.5
2.0GLU
ICO
C
* p<0.05 IBS vs GBS+p<0.01 IBS vs GBS
* *
+
+
Months
H
b a
1c (
%)
Results
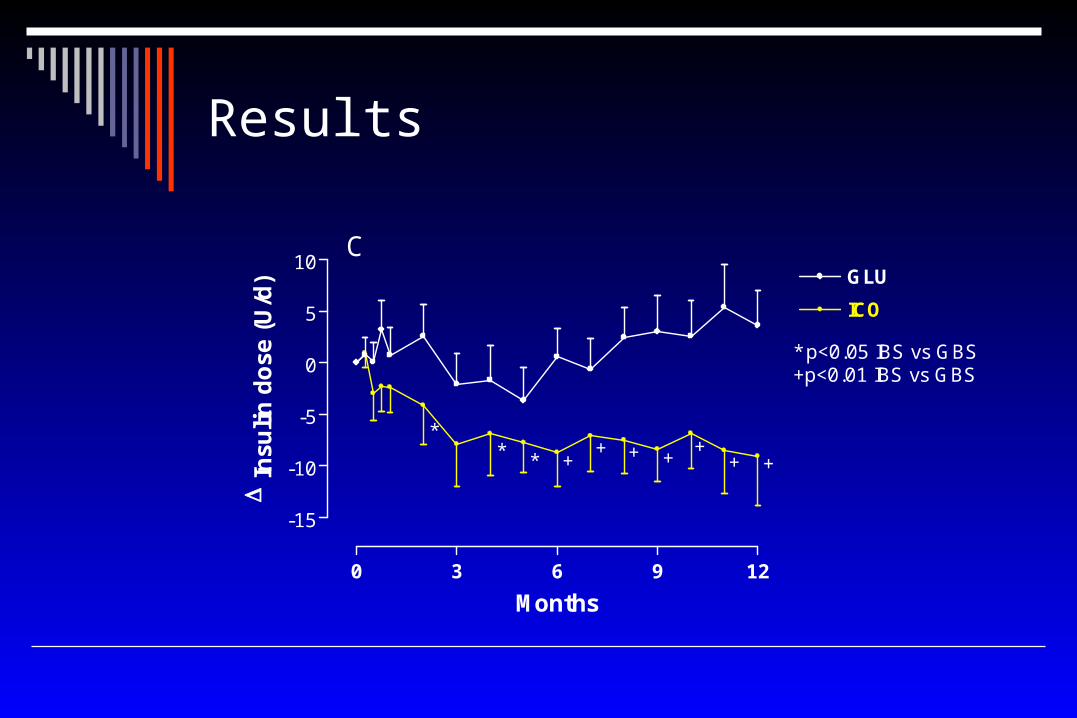
0 3 6 9 12
-15
-10
-5
0
5
10GLU
ICO
C
* p<0.05 IBS vs GBS+p<0.01 IBS vs GBS
+++
++++**
*
Months
I
nsu
lin
do
se (
U/d
)
Results
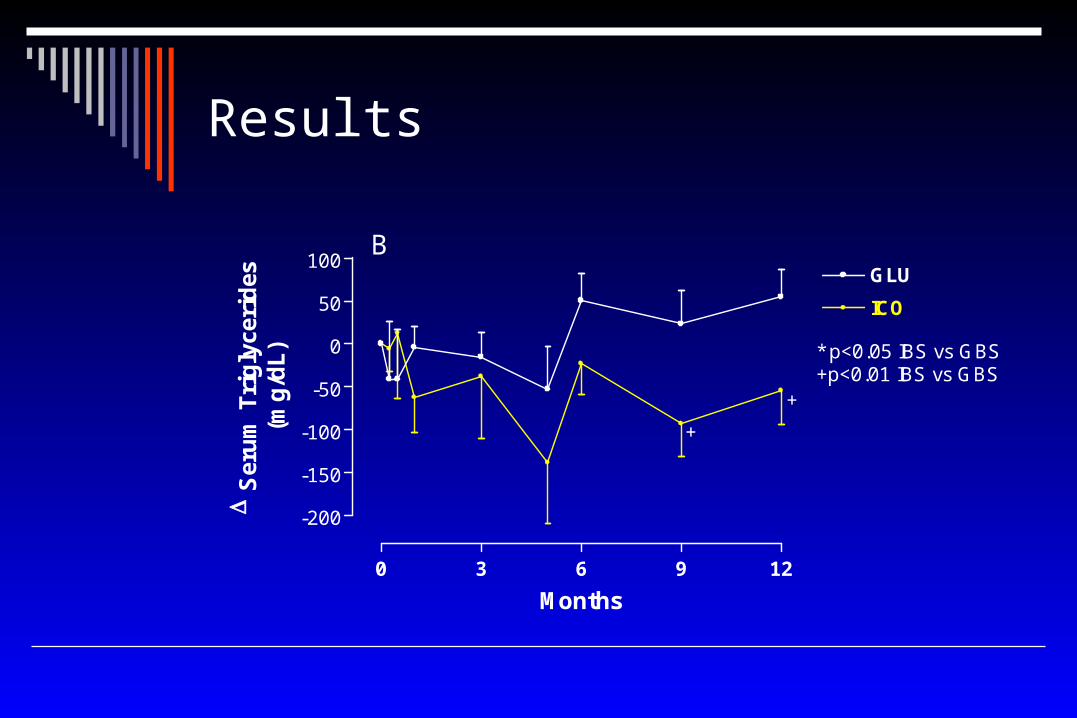
0 3 6 9 12
-200
-150
-100
-50
0
50
100GLU
ICO
B
* p<0.05 IBS vs GBS+p<0.01 IBS vs GBS
+
+
Months
S
eru
m T
rig
lyce
rid
es(m
g/d
L)
Results
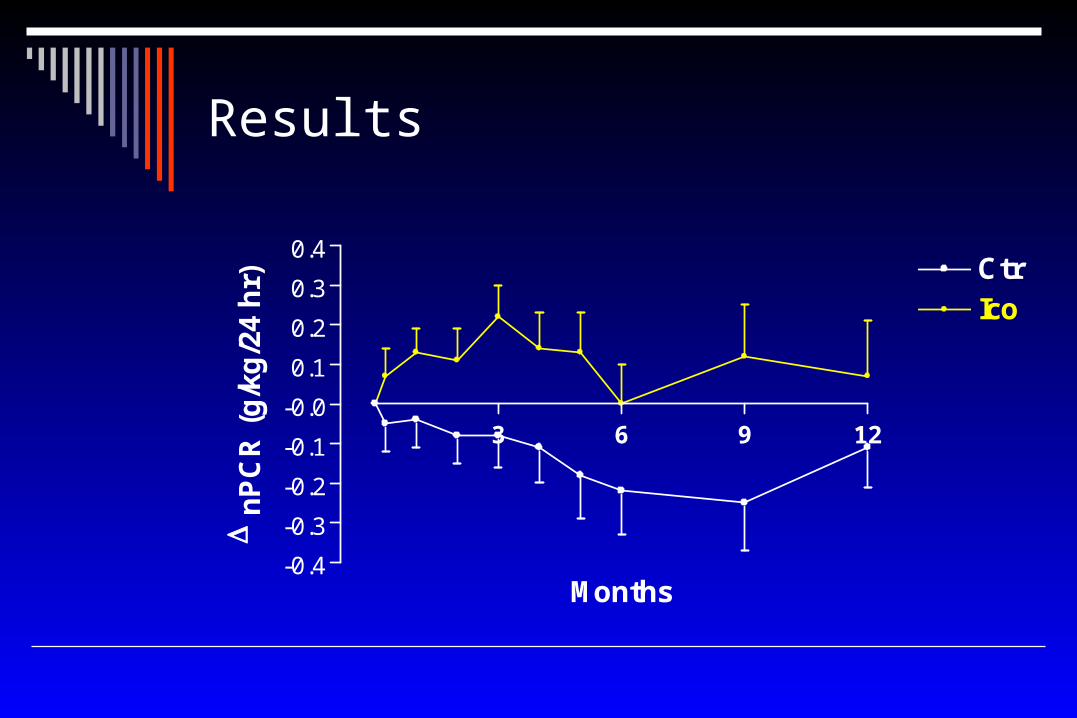
3 6 9 12
-0.4
-0.3
-0.2
-0.1
-0.0
0.1
0.2
0.3
0.4CtrIco
Months
n
PC
R (
g/k
g/2
4 h
r)
Results
Results
Body fluids and cardiovascular parameters
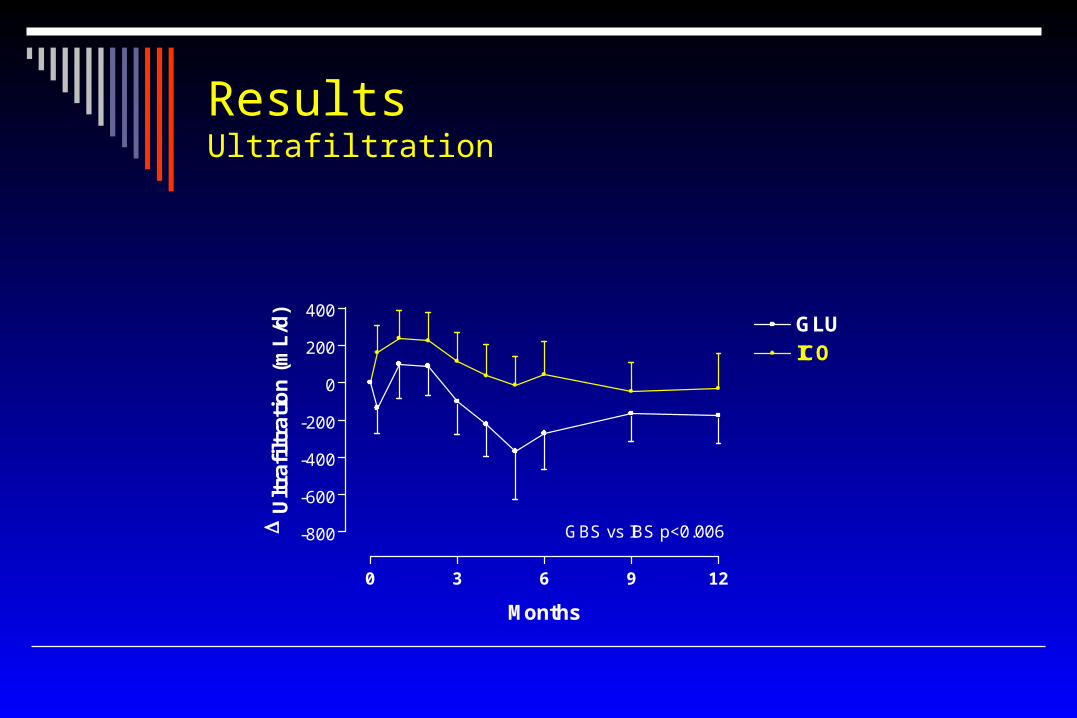
ResultsUltrafiltration
0 3 6 9 12
-800
-600
-400
-200
0
200
400GLUICO
GBS vs IBS p<0.006
Months
U
ltra
filt
rati
on
(m
L/d
)
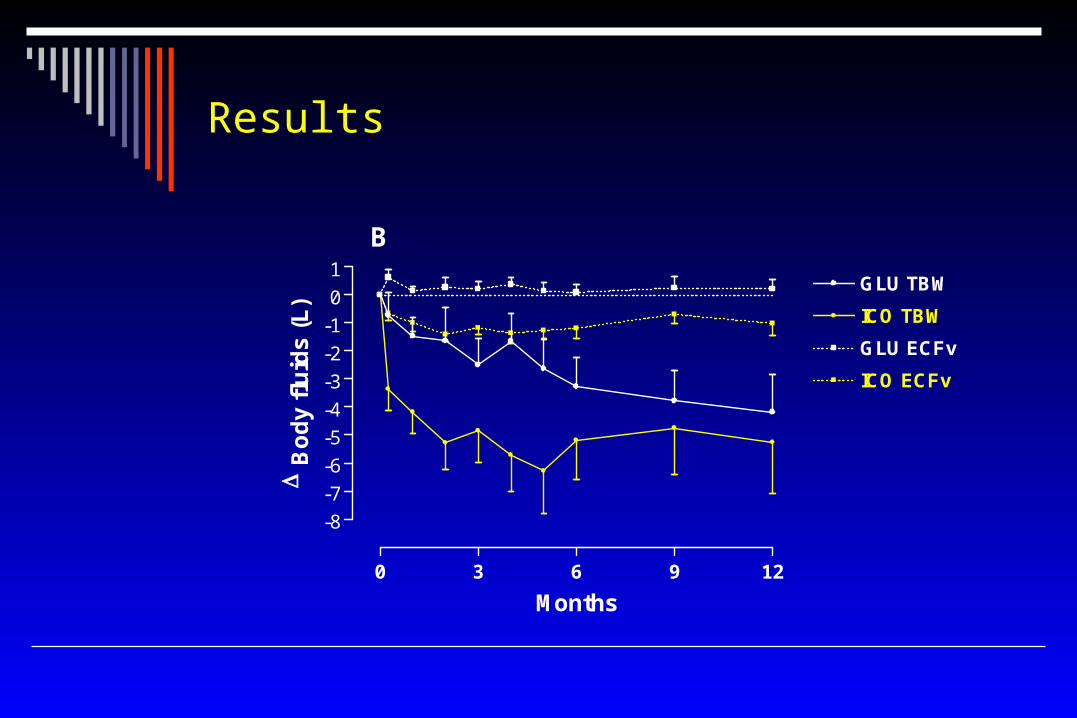
Results
0 3 6 9 12
-8
-7
-6
-5
-4
-3
-2
-1
0
1GLU TBW
ICO TBW
GLU ECFv
ICO ECFv
B
Months
B
od
y fl
uid
s (L
)

ResultsBP (in office)
0 3 6 9 12
-25-20-15-10
-505
10152025
GLU systolic BP
ICO systolic BP
GLU diastolic BP
ICO diastolic BP
* p<0.05 IBS vs GBS+p<0.01 IBS vs GBS+ +
+ + +
+++ + + + *
A
Months
B
loo
d p
ress
ure
(mm
Hg
)

ResultsBP (ambulatory)
0 6 12
-30
-20
-10
0
10GLU
ICO
Months
S
BP
-day
(m
mH
g)
**
**
0 6 12
-10
-5
0
5
10GLU
ICO
Months
D
BP
-day
(m
mH
g)
** *
0 6 12
-30
-20
-10
0
10GLU
ICO
Months
S
BP
-nig
ht
(mm
Hg
)
***
0 6 12
-10
-5
0
5
10GLU
ICO
Months
D
BP
-nig
ht
(mm
Hg
)**
****
**
*= p<0.05 vs basal; **= p<0.01 vs basal; = p<0.05 vs glucose group; = p<0.01 vs glucose group

ResultsEKG basal
Parameter
Glucose
Icodextrin
p
Heart rate (beats/min) 79.4 ± 8.3 78.9 ± 5.9 0.31 In office Systolic BP (mmHg) 139.8 ± 29.4 148.9 ± 24.1 0.20 In office diastolic BP (mmHg) 80.2 ± 16.4 84.9 ± 15.0 0.27 Cardiothoracic ratio (%) 49.8 ± 6.3 49.6 ± 6.4 0.75 LVEDD (mm) 48.2 ± 6.7 49.2 ± 5.8 0.53 IVS thickness (mm) 1.20 ± 0.40 1.20 ± 0.29 0.59 Posterior wall thickness (mm) 1.22 ± 0.30 1.22 ± 0.26 0.38 LVM (g) 266 ± 82 279 ± 83 0.71 Ejection fraction (%) 59.2 ± 12.3 60.3 ± 10.0 0.93 Fractional shortening (%) 32.8 ± 7.5 32.9 ± 5.8 0.56 E:A wave ratio 0.75 ± 0.47 1.07 ± 0.75 0.40 Inferior vena cava diameter (mm) 12.7 ± 4.4 14.5 ± 5.3 0.27 LF (0.05-0.15 Hz) 28.3 ± 14.1 29.8 ± 13.9 0.45 HF (0.15-0.40 Hz) 25.5 ± 16.4 25.7 ± 15.2 0.41 NT-pro-BNP (mL) 5.1 ± 2.5 4.8 ± 2.0 TNT (mL) 2.13 ± 2.57 2.11 ± 1.80
Values are mean ± SD or *= frequencies; **= median ? interquartile range; BP= blood pressure; LVEDD= left ventricular end diastolic diameter; IVD= interventricular septum; LVM= left ventricular mass; LF= power in the low frequency domain; HF= powering the high frequency domain; P values are based on the Student t test, Wilcoxon rank-sum test, or 2 tests according to the variable characteristics

ResultsEKG changes
Parameter
Group
Baseline
6 months from baseline
(n=23, 20)
12 months from baseline
(n=26, 19) Glucose 0.0 -3.1 ± 6.6* -3.2 ± 9.1* LVEDD (mm) Icodextrin 0.0 -4.2 ± 8.4* -3.8 ± 7.0* Glucose 0.0 1.7 ± 6.7 2.7 ± 8.0* Inferior vena cava diameter (mm) Icodextrin 0.0 -0.3 ± 7.6 3.5 ± 9.8* Glucose 0.0 -1.7 ± 15.9 -2.7 ± 12.5 LF (0.05-0.15 Hz) Icodextrin 0.0 3.1 ± 17.6 6.1 ± 15.0* Glucose 0.0 -3.0 ± 9.5 -0.7 ± 11.0 HF (0.15-0.40 Hz) Icodextrin 0.0 0.5 ± 17.6 5.2 ± 18.0 Glucose 0.0 -2.9 ± 2.8* -3.9 ± 3.3* NT-pro-BNP (mL) Icodextrin 0.0 -2.5 ± 1.9* -4.2 ± 2.5* Glucose 0.0 -0.9 ± 2.8* -0.9 ± 3.2* TNT (mL) Icodextrin 0.0 -0.9 ± 2.1* -1.2 ± 1.8*
Values are mean ± SD; BP= blood pressure; LVEDD= left ventricular end diastolic diameter; IVD= interventricular septum; LVM= left ventricular mass; LF= power in the low frequency domain; HF= powering the high frequency domain; P values are based on the Student t test, Wilcoxon rank-sum test, or 2 tests according to the variable characteristics. *= p<0.05 vs basal; = p<0.05 vs glucose
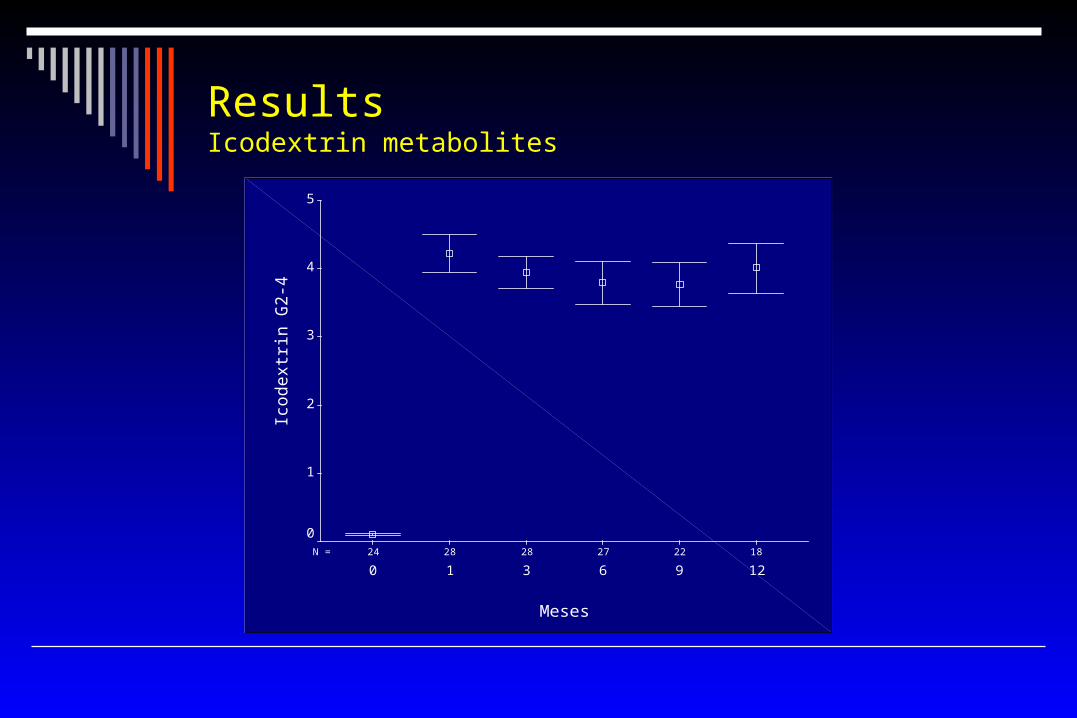
ResultsIcodextrin metabolites
182227282824N =
Meses
1296310
Icodext
rin G
2-4
5
4
3
2
1
0
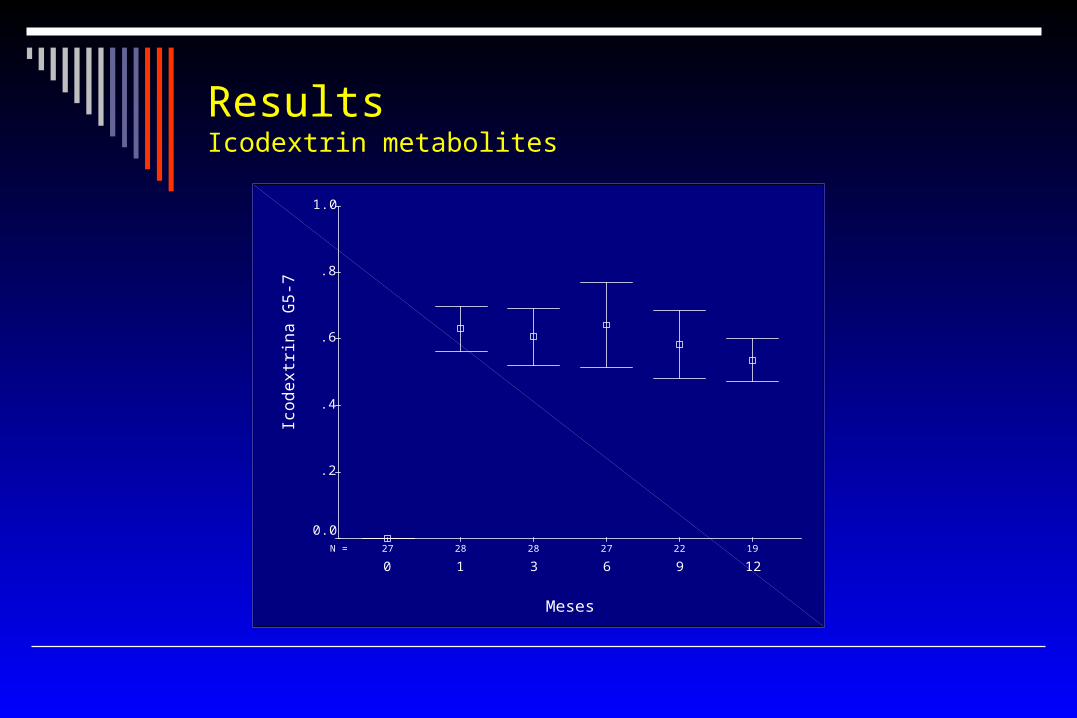
192227282827N =
Meses
1296310
Icodext
rina G
5-7
1.0
.8
.6
.4
.2
0.0
ResultsIcodextrin metabolites
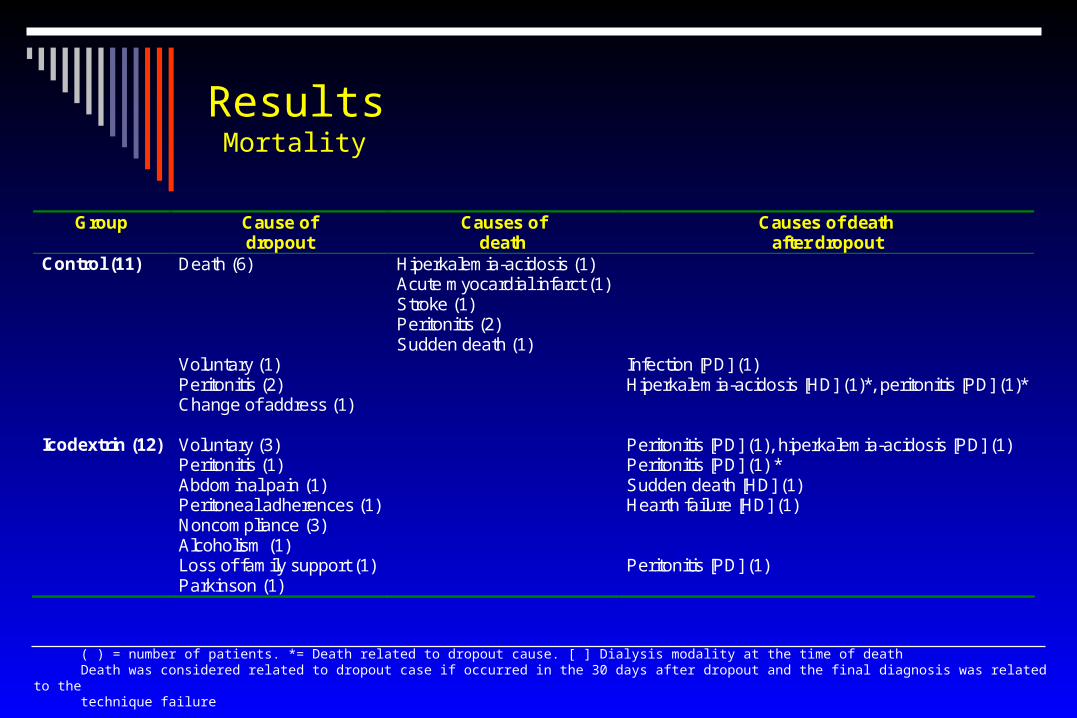
Results Mortality
Group Cause of dropout
Causes of death
Causes of death after dropout
Control (11) Death (6) Hiperkalemia-acidosis (1) Acute myocardial infarct (1) Stroke (1) Peritonitis (2) Sudden death (1) Voluntary (1) Infection [PD] (1) Peritonitis (2) Hiperkalemia-acidosis [HD] (1)*, peritonitis [PD] (1)* Change of address (1) Icodextrin (12) Voluntary (3) Peritonitis [PD] (1), hiperkalemia-acidosis [PD] (1) Peritonitis (1) Peritonitis [PD] (1) * Abdominal pain (1) Sudden death [HD] (1) Peritoneal adherences (1) Hearth failure [HD] (1) Noncompliance (3) Alcoholism (1) Loss of family support (1) Peritonitis [PD] (1) Parkinson (1)
( ) = number of patients. *= Death related to dropout cause. [ ] Dialysis modality at the time of deathDeath was considered related to dropout case if occurred in the 30 days after dropout and the final diagnosis was
related to the technique failure
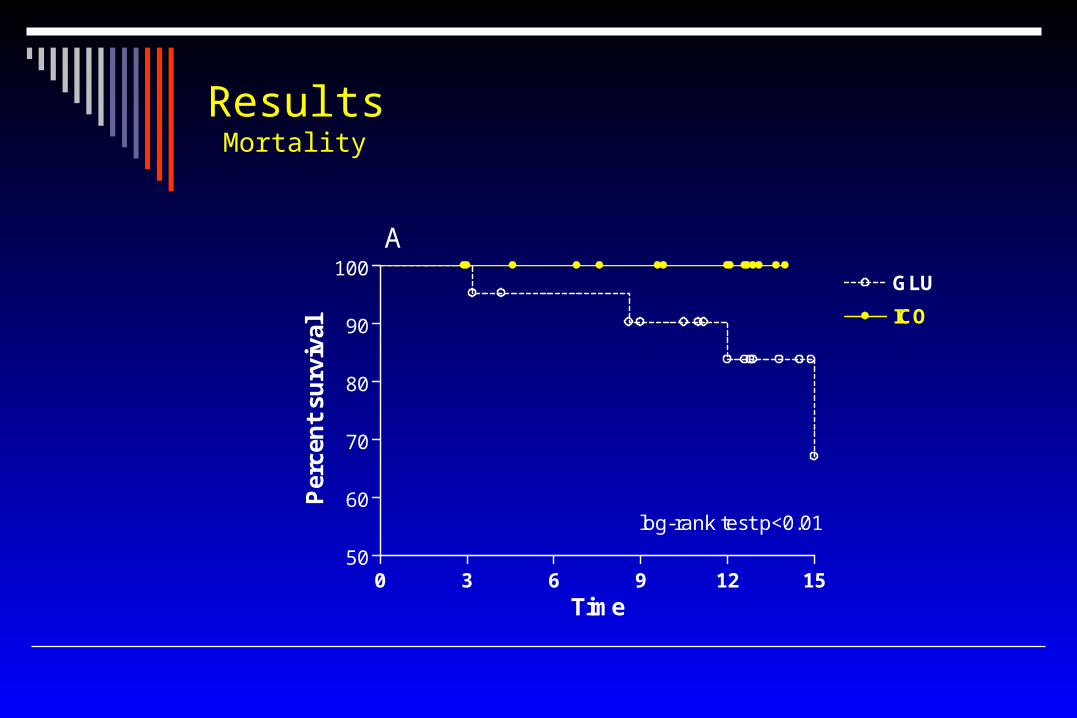
Results Mortality
0 3 6 9 12 1550
60
70
80
90
100GLU
ICO
log-rank test p<0.01
A
Time
Per
cen
t su
rviv
al
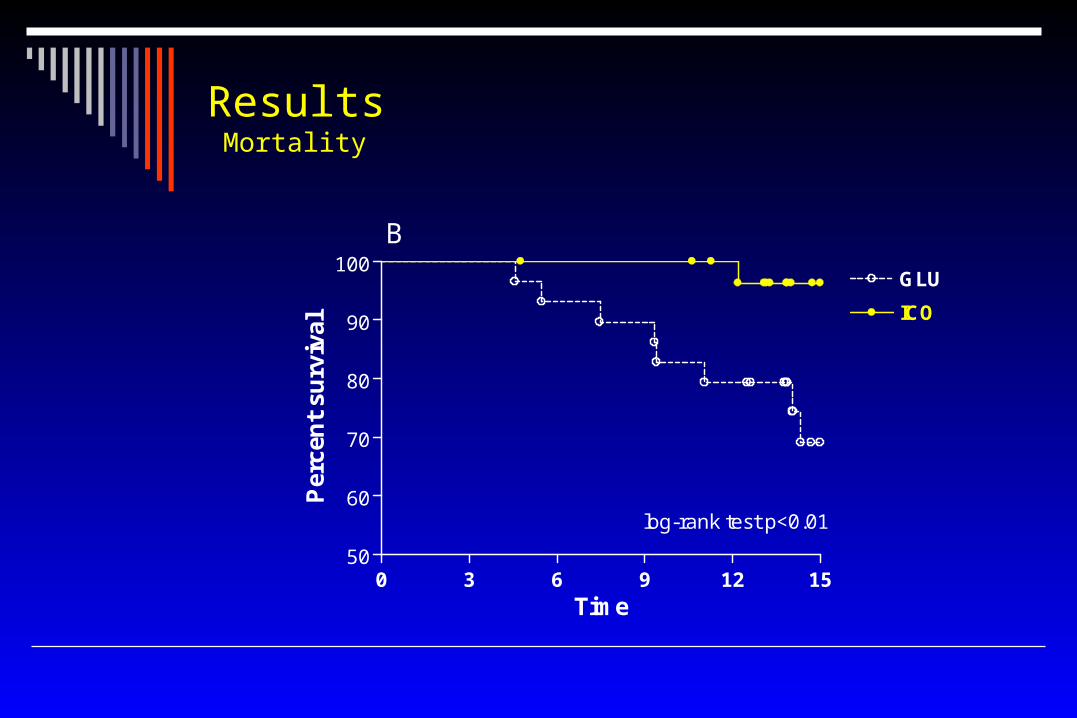
Results Mortality
0 3 6 9 12 1550
60
70
80
90
100GLU
ICO
log-rank test p<0.01
B
Time
Per
cen
t su
rviv
al
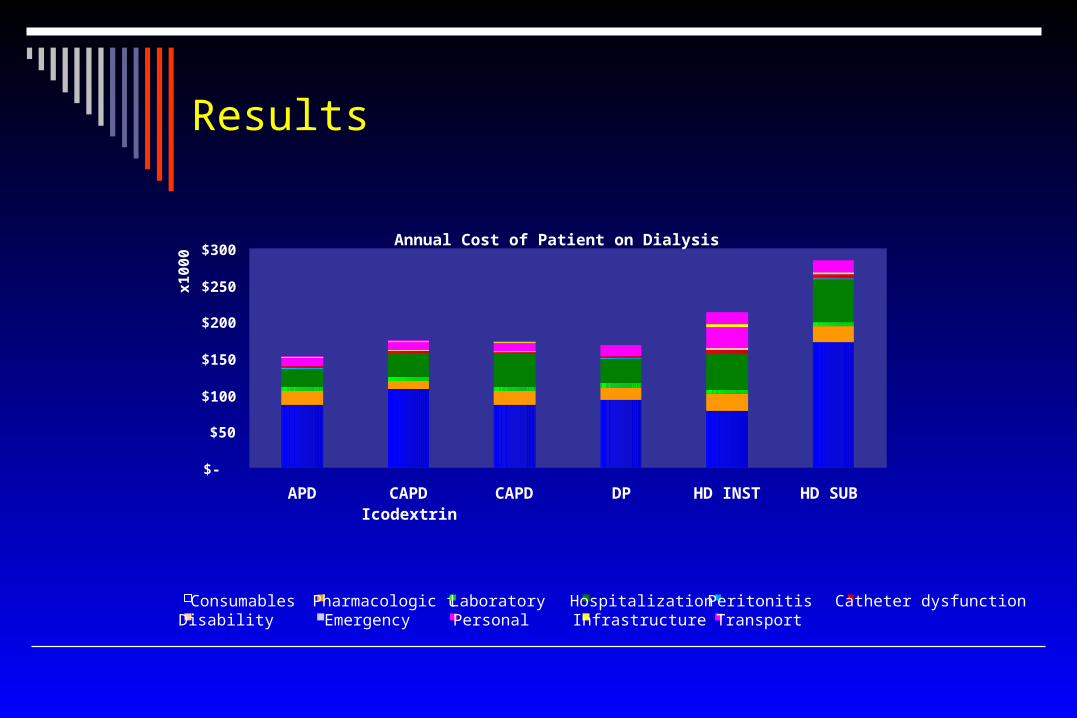
Annual Cost of Patient on Dialysis
$-
$50
$100
$150
$200
$250
$300
APD CAPDIcodextrin
CAPD DP HD INST HD SUB
x100
0
Consumables Pharmacologic t Laboratory Hospitalization Peritonitis Catheter dysfunctionDisability Emergency Personal Infrastructure Transport
Results
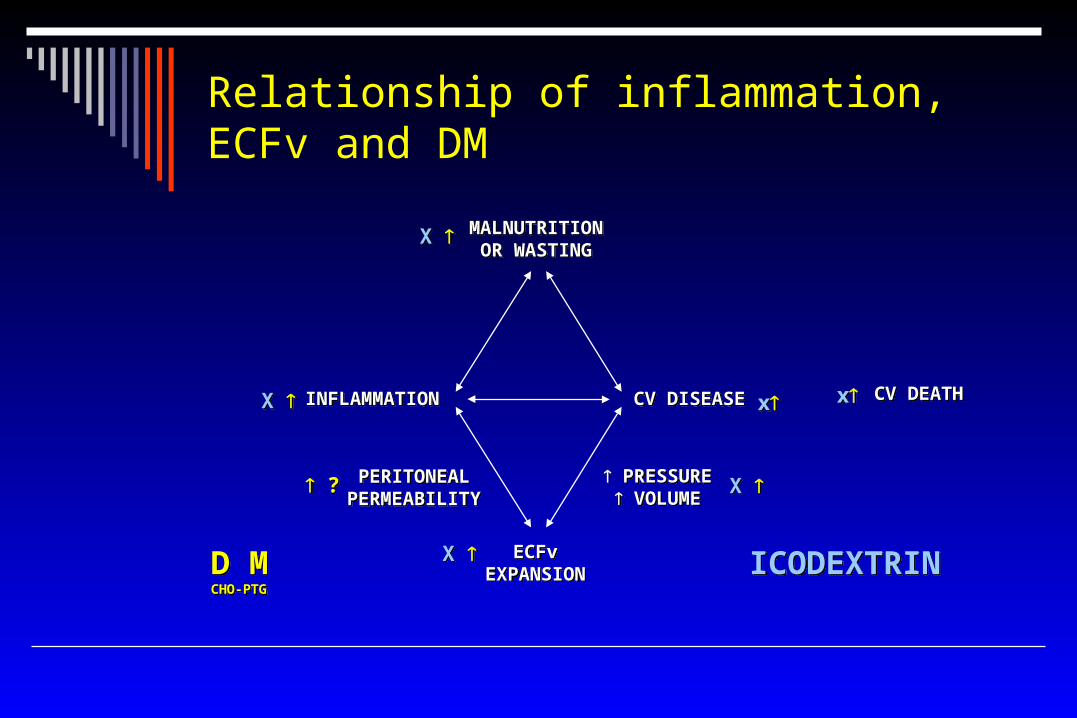
Relationship of inflammation, ECFv and DM
MALNUTRITIONOR WASTING
MALNUTRITIONOR WASTING
INFLAMMATIONINFLAMMATION CV DISEASECV DISEASE CV DEATHCV DEATH
ECFvEXPANSION
ECFvEXPANSION
PERITONEALPERMEABILITYPERITONEAL
PERMEABILITY PRESSURE VOLUME
PRESSURE VOLUME
D MCHO-PTG
D MCHO-PTG
X X
X X
? ?
xx xx
X X
X X
ICODEXTRINICODEXTRIN

ConclusionConclusion
Patients in the Icodextrin group had better metabolic control and nutrition
Icodextrin-based solution was superior to glucose-based solution in fluid and sodium removal.
Patients in the Icodextrin group had better control of blood pressure and reduction in left ventricular mass
Patients in the Icodextrin group had better metabolic control and nutrition
Icodextrin-based solution was superior to glucose-based solution in fluid and sodium removal.
Patients in the Icodextrin group had better control of blood pressure and reduction in left ventricular mass