Embed Size (px)
Citation preview
Ohio Community College Portraits
October 2009
Ohio Community College Portraits
Table of Contents
Ohio’s Community Colleges (Aggregate Portrait) ‐‐‐‐‐‐‐‐‐‐‐‐‐‐‐‐‐‐‐‐‐‐‐‐‐‐‐‐‐‐‐‐‐‐‐‐‐‐‐‐‐‐‐‐‐‐‐‐ Page 1
Belmont Technical College ‐‐‐‐‐‐‐‐‐‐‐‐‐‐‐‐‐‐‐‐‐‐‐‐‐‐‐‐‐‐‐‐‐‐‐‐‐‐‐‐‐‐‐‐‐‐‐‐‐‐‐‐‐‐‐‐‐‐‐‐‐‐‐‐‐‐‐‐‐‐‐‐‐‐‐‐‐ Page 3
Clark State Community College ‐‐‐‐‐‐‐‐‐‐‐‐‐‐‐‐‐‐‐‐‐‐‐‐‐‐‐‐‐‐‐‐‐‐‐‐‐‐‐‐‐‐‐‐‐‐‐‐‐‐‐‐‐‐‐‐‐‐‐‐‐‐‐‐‐‐‐‐‐‐‐ Page 5
Cincinnati State Technical & Community College ‐‐‐‐‐‐‐‐‐‐‐‐‐‐‐‐‐‐‐‐‐‐‐‐‐‐‐‐‐‐‐‐‐‐‐‐‐‐‐‐‐‐‐‐‐‐‐ Page 7
Central Ohio Technical College ‐‐‐‐‐‐‐‐‐‐‐‐‐‐‐‐‐‐‐‐‐‐‐‐‐‐‐‐‐‐‐‐‐‐‐‐‐‐‐‐‐‐‐‐‐‐‐‐‐‐‐‐‐‐‐‐‐‐‐‐‐‐‐‐‐‐‐‐‐‐‐ Page 9
Columbus State Community College ‐‐‐‐‐‐‐‐‐‐‐‐‐‐‐‐‐‐‐‐‐‐‐‐‐‐‐‐‐‐‐‐‐‐‐‐‐‐‐‐‐‐‐‐‐‐‐‐‐‐‐‐‐‐‐‐‐‐‐‐‐‐‐‐ Page 11
Cuyahoga Community College ‐‐‐‐‐‐‐‐‐‐‐‐‐‐‐‐‐‐‐‐‐‐‐‐‐‐‐‐‐‐‐‐‐‐‐‐‐‐‐‐‐‐‐‐‐‐‐‐‐‐‐‐‐‐‐‐‐‐‐‐‐‐‐‐‐‐‐‐‐‐‐‐ Page 13
Edison State Community College ‐‐‐‐‐‐‐‐‐‐‐‐‐‐‐‐‐‐‐‐‐‐‐‐‐‐‐‐‐‐‐‐‐‐‐‐‐‐‐‐‐‐‐‐‐‐‐‐‐‐‐‐‐‐‐‐‐‐‐‐‐‐‐‐‐‐‐‐‐ Page 15
Hocking Technical College ‐‐‐‐‐‐‐‐‐‐‐‐‐‐‐‐‐‐‐‐‐‐‐‐‐‐‐‐‐‐‐‐‐‐‐‐‐‐‐‐‐‐‐‐‐‐‐‐‐‐‐‐‐‐‐‐‐‐‐‐‐‐‐‐‐‐‐‐‐‐‐‐‐‐‐‐‐ Page 17
Jefferson Community College ‐‐‐‐‐‐‐‐‐‐‐‐‐‐‐‐‐‐‐‐‐‐‐‐‐‐‐‐‐‐‐‐‐‐‐‐‐‐‐‐‐‐‐‐‐‐‐‐‐‐‐‐‐‐‐‐‐‐‐‐‐‐‐‐‐‐‐‐‐‐‐‐‐ Page 19
Lorain County Community College ‐‐‐‐‐‐‐‐‐‐‐‐‐‐‐‐‐‐‐‐‐‐‐‐‐‐‐‐‐‐‐‐‐‐‐‐‐‐‐‐‐‐‐‐‐‐‐‐‐‐‐‐‐‐‐‐‐‐‐‐‐‐‐‐‐‐‐ Page 21
Lakeland Community College ‐‐‐‐‐‐‐‐‐‐‐‐‐‐‐‐‐‐‐‐‐‐‐‐‐‐‐‐‐‐‐‐‐‐‐‐‐‐‐‐‐‐‐‐‐‐‐‐‐‐‐‐‐‐‐‐‐‐‐‐‐‐‐‐‐‐‐‐‐‐‐‐‐ Page 23
James A. Rhodes State College ‐‐‐‐‐‐‐‐‐‐‐‐‐‐‐‐‐‐‐‐‐‐‐‐‐‐‐‐‐‐‐‐‐‐‐‐‐‐‐‐‐‐‐‐‐‐‐‐‐‐‐‐‐‐‐‐‐‐‐‐‐‐‐‐‐‐‐‐‐‐‐ Page 25
Zane State College ‐‐‐‐‐‐‐‐‐‐‐‐‐‐‐‐‐‐‐‐‐‐‐‐‐‐‐‐‐‐‐‐‐‐‐‐‐‐‐‐‐‐‐‐‐‐‐‐‐‐‐‐‐‐‐‐‐‐‐‐‐‐‐‐‐‐‐‐‐‐‐‐‐‐‐‐‐‐‐‐‐‐‐‐‐‐‐ Page 27
Marion Technical College ‐‐‐‐‐‐‐‐‐‐‐‐‐‐‐‐‐‐‐‐‐‐‐‐‐‐‐‐‐‐‐‐‐‐‐‐‐‐‐‐‐‐‐‐‐‐‐‐‐‐‐‐‐‐‐‐‐‐‐‐‐‐‐‐‐‐‐‐‐‐‐‐‐‐‐‐‐‐ Page 29
North Central State College ‐‐‐‐‐‐‐‐‐‐‐‐‐‐‐‐‐‐‐‐‐‐‐‐‐‐‐‐‐‐‐‐‐‐‐‐‐‐‐‐‐‐‐‐‐‐‐‐‐‐‐‐‐‐‐‐‐‐‐‐‐‐‐‐‐‐‐‐‐‐‐‐‐‐‐ Page 31
Northwest State Community College ‐‐‐‐‐‐‐‐‐‐‐‐‐‐‐‐‐‐‐‐‐‐‐‐‐‐‐‐‐‐‐‐‐‐‐‐‐‐‐‐‐‐‐‐‐‐‐‐‐‐‐‐‐‐‐‐‐‐‐‐‐‐‐ Page 33
Owens State Community College ‐‐‐‐‐‐‐‐‐‐‐‐‐‐‐‐‐‐‐‐‐‐‐‐‐‐‐‐‐‐‐‐‐‐‐‐‐‐‐‐‐‐‐‐‐‐‐‐‐‐‐‐‐‐‐‐‐‐‐‐‐‐‐‐‐‐‐‐ Page 35
Rio Grande Community College ‐‐‐‐‐‐‐‐‐‐‐‐‐‐‐‐‐‐‐‐‐‐‐‐‐‐‐‐‐‐‐‐‐‐‐‐‐‐‐‐‐‐‐‐‐‐‐‐‐‐‐‐‐‐‐‐‐‐‐‐‐‐‐‐‐‐‐‐‐‐ Page 37
Sinclair Community College ‐‐‐‐‐‐‐‐‐‐‐‐‐‐‐‐‐‐‐‐‐‐‐‐‐‐‐‐‐‐‐‐‐‐‐‐‐‐‐‐‐‐‐‐‐‐‐‐‐‐‐‐‐‐‐‐‐‐‐‐‐‐‐‐‐‐‐‐‐‐‐‐‐‐‐ Page 39
Southern State Community College ‐‐‐‐‐‐‐‐‐‐‐‐‐‐‐‐‐‐‐‐‐‐‐‐‐‐‐‐‐‐‐‐‐‐‐‐‐‐‐‐‐‐‐‐‐‐‐‐‐‐‐‐‐‐‐‐‐‐‐‐‐‐‐‐‐ Page 41
Stark State College of Technology ‐‐‐‐‐‐‐‐‐‐‐‐‐‐‐‐‐‐‐‐‐‐‐‐‐‐‐‐‐‐‐‐‐‐‐‐‐‐‐‐‐‐‐‐‐‐‐‐‐‐‐‐‐‐‐‐‐‐‐‐‐‐‐‐‐‐‐ Page 43
Terra State Community College ‐‐‐‐‐‐‐‐‐‐‐‐‐‐‐‐‐‐‐‐‐‐‐‐‐‐‐‐‐‐‐‐‐‐‐‐‐‐‐‐‐‐‐‐‐‐‐‐‐‐‐‐‐‐‐‐‐‐‐‐‐‐‐‐‐‐‐‐‐‐ Page 45
Washington State Community College ‐‐‐‐‐‐‐‐‐‐‐‐‐‐‐‐‐‐‐‐‐‐‐‐‐‐‐‐‐‐‐‐‐‐‐‐‐‐‐‐‐‐‐‐‐‐‐‐‐‐‐‐‐‐‐‐‐‐‐‐‐ Page 47
59%
0% 10% 20% 30% 40% 50% 60% 70%
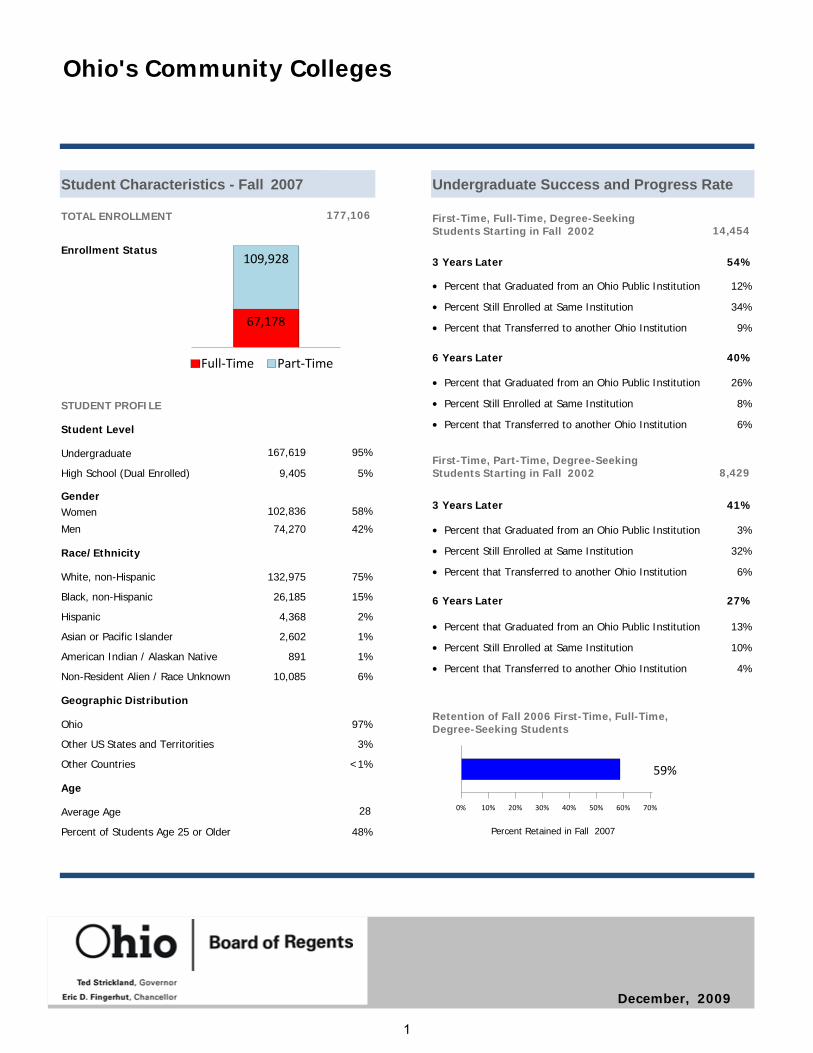
177,106TOTAL ENROLLMENT
Gender
Student Characteristics - Fall 2007
102,836Women
74,270Men
75%
Race/Ethnicity
White, non-Hispanic
15%Black, non-Hispanic
2%Hispanic
1%Asian or Pacific Islander
1%American Indian / Alaskan Native
6%Non-Resident Alien / Race Unknown
Ohio
58%
97%
Geographic Distribution
42%
132,975
26,185
4,368
2,602
891
10,085
Other US States and Territorities 3%
Other Countries <1%
Student Level
167,619Undergraduate
9,405High School (Dual Enrolled)
95%
5%
Age
Average Age
Percent of Students Age 25 or Older
28
48%
Ohio's Community Colleges
Undergraduate Success and Progress Rate
14,454
Percent that Graduated from an Ohio Public Institution
3 Years Later
•Percent Still Enrolled at Same Institution•
12%
34%
Percent that Transferred to another Ohio Institution• 9%
Percent that Graduated from an Ohio Public Institution
6 Years Later
•Percent Still Enrolled at Same Institution•
26%
8%
Percent that Transferred to another Ohio Institution• 6%
8,429
Percent that Graduated from an Ohio Public Institution
3 Years Later
•Percent Still Enrolled at Same Institution•
3%
32%
Percent that Transferred to another Ohio Institution• 6%
Percent that Graduated from an Ohio Public Institution
6 Years Later
•Percent Still Enrolled at Same Institution•
13%
10%
Percent that Transferred to another Ohio Institution• 4%
54%
40%
41%
27%
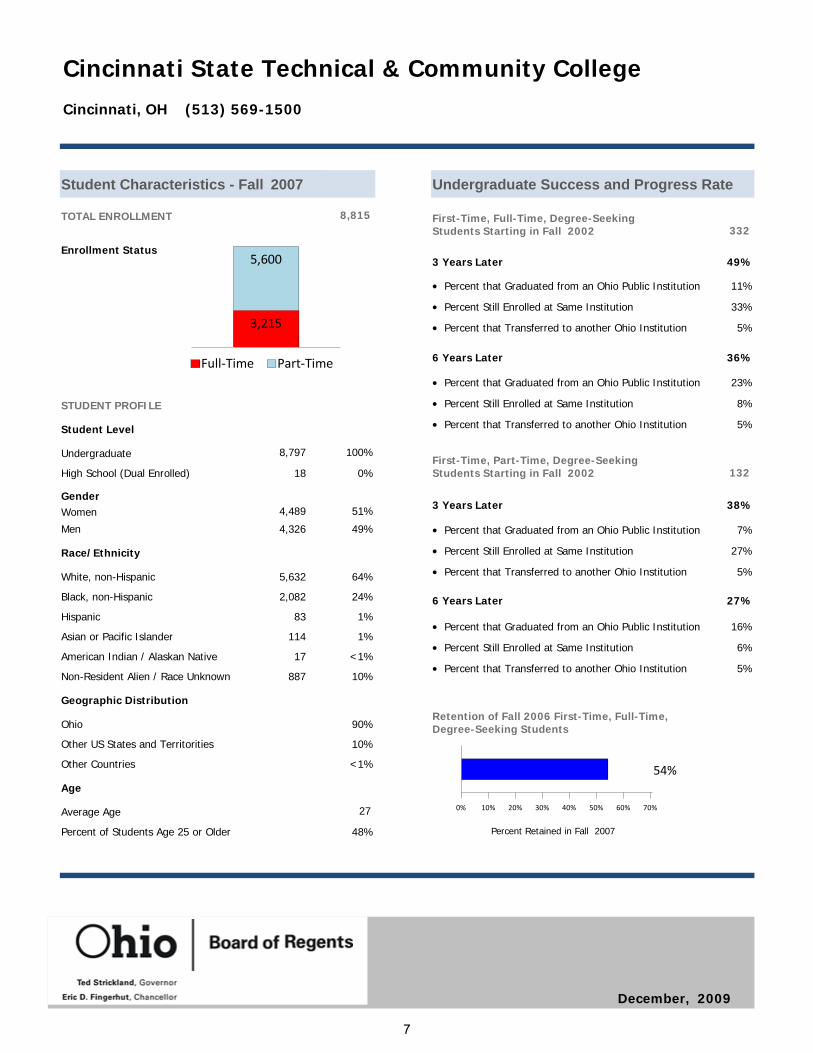
Full‐Time Part‐Time
67,178
109,928Enrollment Status
STUDENT PROFILE
Retention of Fall 2006 First-Time, Full-Time, Degree-Seeking Students
Percent Retained in Fall 2007
First-Time, Full-Time, Degree-Seeking Students Starting in Fall 2002
First-Time, Part-Time, Degree-Seeking Students Starting in Fall 2002
December, 2009
1

Employed, not in CollegeEnrolled in College in OhioOther58%29%
14%
Post-Graduation Outcomes of Spring 2007 Associate Degree Graduates
65%
42%
13%
33%
38%Student Loans
State Grants
Institutional Aid
Federal Grants
Any Financial Aid
14,740
Degrees and Areas of Study
Associate Degrees
5,567Certificates
Ohio's Community Colleges Page 2
Tuition and Financial Aid
Financial Aid Awarded to Students
65% of first-time, full-time, degree-seeking students in 2007-08 received financial aid of some type including need-based grants and loans, work-study, and non need-based scholarships.
Average annual FY 2009 tuition and fees (sticker price) for in-state, undergraduate students before financial aid was $3,099. The cost to attend Ohio's Community Colleges varies based on the individual circumstances of students and may be reduced through grants and scholarships.
•
42% of first-time, full-time, degree-seeking students in 2007-08 received a federal grant. The average grant for the year was $2,535.
•
13% of first-time, full-time, degree-seeking students in 2007-08 received an institutional grant. The average grant for the year was $1,683.
•
Overall Financial Aid
Federal Financial Aid
Institutional Aid
38% of first-time, full-time, degree-seeking students in 2007-08 received a federal loan. The average loan amount for the year was $2,698.
•Federal Loans
Percent of First-Time Students in FY 2007 Receiving Each Type of Financial Aid.
Degrees Awarded at Ohio's Community Colleges in FY 2007-08
Total 20,307
6,461 1,797
1,995 696
8,456 2,493
All
Students
First-Generation
College
Minority
Areas of Study with the Largest Number of Associate Degrees Awarded in 2007-08
Health 31%
Arts & Humanities 19%
Business 16%
Engineering 12%
Natural Science & Mathematics 6%
All Other Degree Areas 16%
100%
NOTE: Students may receive aid from more than one source.
33% of first-time, full-time, degree-seeking students in 2007-08 received a federal grant. The average grant for the year was $1,581.
•State Financial Aid
Study at Ohio's Community Colleges
Classroom Environment
% of Classes with Fewer than 30 Students 87%
98%% of Classes with Fewer than 50 Students
Full-Time Instructional Faculty
Total Faculty
% Women
% from Minority Groups
% with Master's Degree or Higher
2,782
55%
8%
74%
Students Engaged in Internships/Co-Op/Field Experience 17,058
College Enrollment in Ohio in 2007-08•Employment in Ohio in 4th Quarter 2007•
December, 2009
2
55%
0% 10% 20% 30% 40% 50% 60% 70%
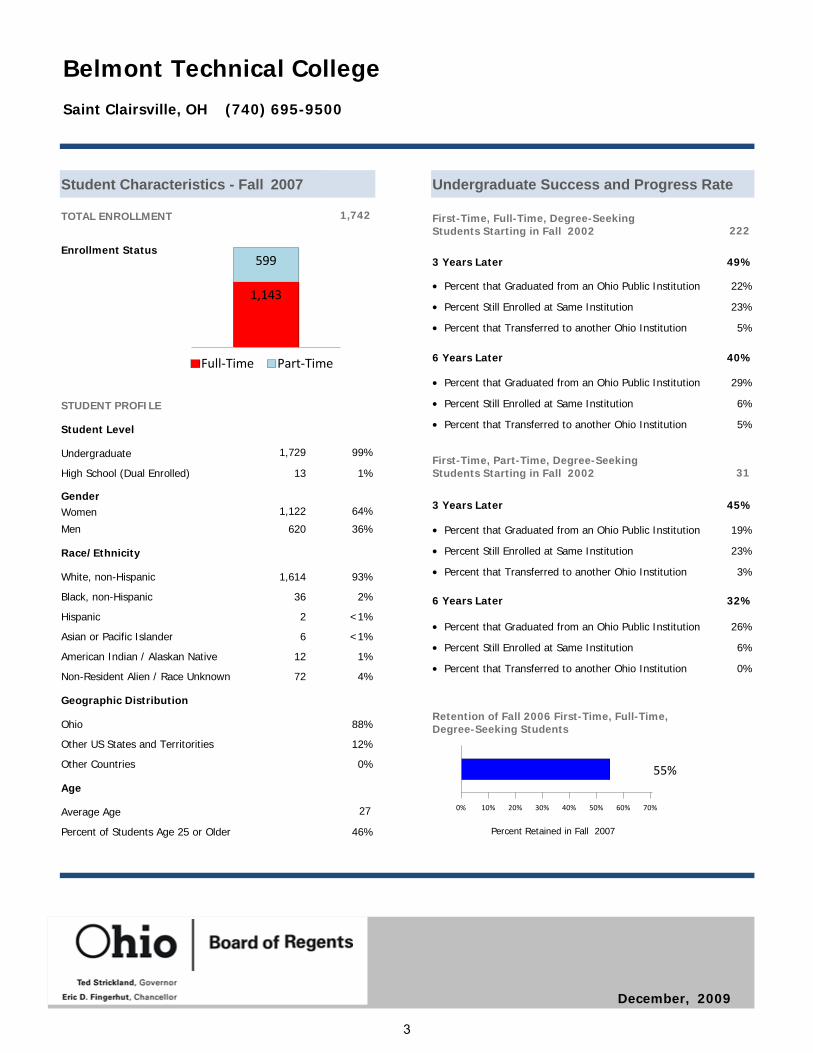
1,742TOTAL ENROLLMENT
Gender
Student Characteristics - Fall 2007
1,122Women
620Men
93%
Race/Ethnicity
White, non-Hispanic
2%Black, non-Hispanic
<1%Hispanic
<1%Asian or Pacific Islander
1%American Indian / Alaskan Native
4%Non-Resident Alien / Race Unknown
Ohio
64%
88%
Geographic Distribution
36%
1,614
36
2
6
12
72
Other US States and Territorities 12%
Other Countries 0%
Student Level
1,729Undergraduate
13High School (Dual Enrolled)
99%
1%
Age
Average Age
Percent of Students Age 25 or Older
27
46%
Belmont Technical College
Undergraduate Success and Progress Rate
222
Percent that Graduated from an Ohio Public Institution
3 Years Later
•Percent Still Enrolled at Same Institution•
22%
23%
Percent that Transferred to another Ohio Institution• 5%
Percent that Graduated from an Ohio Public Institution
6 Years Later
•Percent Still Enrolled at Same Institution•
29%
6%
Percent that Transferred to another Ohio Institution• 5%
31
Percent that Graduated from an Ohio Public Institution
3 Years Later
•Percent Still Enrolled at Same Institution•
19%
23%
Percent that Transferred to another Ohio Institution• 3%
Percent that Graduated from an Ohio Public Institution
6 Years Later
•Percent Still Enrolled at Same Institution•
26%
6%
Percent that Transferred to another Ohio Institution• 0%
49%
40%
45%
32%
Full‐Time Part‐Time
1,143
599Enrollment Status
STUDENT PROFILE
Saint Clairsville, OH (740) 695-9500
Retention of Fall 2006 First-Time, Full-Time, Degree-Seeking Students
Percent Retained in Fall 2007
First-Time, Full-Time, Degree-Seeking Students Starting in Fall 2002
First-Time, Part-Time, Degree-Seeking Students Starting in Fall 2002
December, 2009
3
Employed, not in CollegeEnrolled in College in OhioOther
48%
21%
32%
Post-Graduation Outcomes of Spring 2007 Associate Degree Graduates
97%
66%
71%
51%
36%Student Loans
State Grants
Institutional Aid
Federal Grants
Any Financial Aid
227
Degrees and Areas of Study
Associate Degrees
98Certificates
Belmont Technical College Page 2
Tuition and Financial Aid
Financial Aid Awarded to Students
97% of first-time, full-time, degree-seeking students in 2007-08 received financial aid of some type including need-based grants and loans, work-study, and non need-based scholarships.
Annual FY 2009 tuition and fees (sticker price) for in-state, undergraduate students before financial aid was $3,784. The cost to attend Belmont Technical College varies based on the individual circumstances of students and may be reduced through grants and scholarships.
•
66% of first-time, full-time, degree-seeking students in 2007-08 received a federal grant. The average grant for the year was $1,292.
•
71% of first-time, full-time, degree-seeking students in 2007-08 received an institutional grant. The average grant for the year was $1,910.
•
Overall Financial Aid
Federal Financial Aid
Institutional Aid
36% of first-time, full-time, degree-seeking students in 2007-08 received a federal loan. The average loan amount for the year was $1,710.
•Federal Loans
Percent of First-Time Students in FY 2007 Receiving Each Type of Financial Aid.
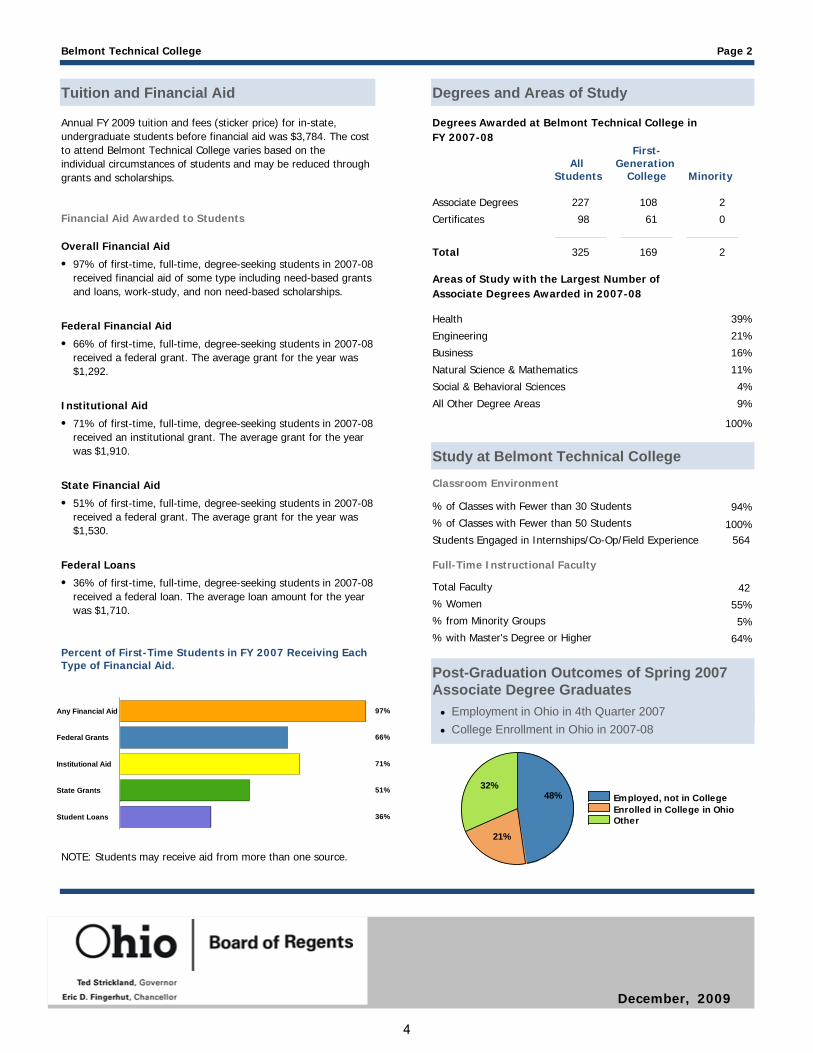
Degrees Awarded at Belmont Technical College in FY 2007-08
Total 325
108 2
61 0
169 2
All
Students
First-Generation
College
Minority
Areas of Study with the Largest Number of Associate Degrees Awarded in 2007-08
Health 39%
Engineering 21%
Business 16%
Natural Science & Mathematics 11%
Social & Behavioral Sciences 4%
All Other Degree Areas 9%
100%
NOTE: Students may receive aid from more than one source.
51% of first-time, full-time, degree-seeking students in 2007-08 received a federal grant. The average grant for the year was $1,530.
•State Financial Aid
Study at Belmont Technical College
Classroom Environment
% of Classes with Fewer than 30 Students 94%
100%% of Classes with Fewer than 50 Students
Full-Time Instructional Faculty
Total Faculty
% Women
% from Minority Groups
% with Master's Degree or Higher
42
55%
5%
64%
Students Engaged in Internships/Co-Op/Field Experience 564
College Enrollment in Ohio in 2007-08•Employment in Ohio in 4th Quarter 2007•
December, 2009
4

52%
0% 10% 20% 30% 40% 50% 60% 70%
3,392TOTAL ENROLLMENT
Gender
Student Characteristics - Fall 2007
2,286Women
1,106Men
82%
Race/Ethnicity
White, non-Hispanic
11%Black, non-Hispanic
1%Hispanic
1%Asian or Pacific Islander
<1%American Indian / Alaskan Native
5%Non-Resident Alien / Race Unknown
Ohio
67%
100%
Geographic Distribution
33%
2,791
372
30
28
8
163
Other US States and Territorities <1%
Other Countries 0%
Student Level
3,225Undergraduate
167High School (Dual Enrolled)
95%
5%
Age
Average Age
Percent of Students Age 25 or Older
27
50%
Clark State Community College
Undergraduate Success and Progress Rate
334
Percent that Graduated from an Ohio Public Institution
3 Years Later
•Percent Still Enrolled at Same Institution•
11%
25%
Percent that Transferred to another Ohio Institution• 10%
Percent that Graduated from an Ohio Public Institution
6 Years Later
•Percent Still Enrolled at Same Institution•
22%
8%
Percent that Transferred to another Ohio Institution• 5%
167
Percent that Graduated from an Ohio Public Institution
3 Years Later
•Percent Still Enrolled at Same Institution•
3%
31%
Percent that Transferred to another Ohio Institution• 5%
Percent that Graduated from an Ohio Public Institution
6 Years Later
•Percent Still Enrolled at Same Institution•
14%
9%
Percent that Transferred to another Ohio Institution• 4%
46%
34%
40%
27%
Full‐Time Part‐Time
1,505
1,887
Enrollment Status
STUDENT PROFILE
Springfield, OH (937) 325-0691
Retention of Fall 2006 First-Time, Full-Time, Degree-Seeking Students
Percent Retained in Fall 2007
First-Time, Full-Time, Degree-Seeking Students Starting in Fall 2002
First-Time, Part-Time, Degree-Seeking Students Starting in Fall 2002
December, 2009
5

Employed, not in CollegeEnrolled in College in OhioOther62%
26%
12%
Post-Graduation Outcomes of Spring 2007 Associate Degree Graduates
67%
45%
10%
32%
39%Student Loans
State Grants
Institutional Aid
Federal Grants
Any Financial Aid
265
Degrees and Areas of Study
Associate Degrees
46Certificates
Clark State Community College Page 2
Tuition and Financial Aid
Financial Aid Awarded to Students
67% of first-time, full-time, degree-seeking students in 2007-08 received financial aid of some type including need-based grants and loans, work-study, and non need-based scholarships.
Annual FY 2009 tuition and fees (sticker price) for in-state, undergraduate students before financial aid was $3,485. The cost to attend Clark State Community College varies based on the individual circumstances of students and may be reduced through grants and scholarships.
•
45% of first-time, full-time, degree-seeking students in 2007-08 received a federal grant. The average grant for the year was $2,732.
•
10% of first-time, full-time, degree-seeking students in 2007-08 received an institutional grant. The average grant for the year was $1,538.
•
Overall Financial Aid
Federal Financial Aid
Institutional Aid
39% of first-time, full-time, degree-seeking students in 2007-08 received a federal loan. The average loan amount for the year was $2,906.
•Federal Loans
Percent of First-Time Students in FY 2007 Receiving Each Type of Financial Aid.
Degrees Awarded at Clark State Community College in FY 2007-08
Total 311
118 24
18 8
136 32
All
Students
First-Generation
College
Minority
Areas of Study with the Largest Number of Associate Degrees Awarded in 2007-08
Health 36%
Arts & Humanities 25%
Business 17%
Social & Behavioral Sciences 7%
Natural Science & Mathematics 5%
All Other Degree Areas 10%
100%
NOTE: Students may receive aid from more than one source.
32% of first-time, full-time, degree-seeking students in 2007-08 received a federal grant. The average grant for the year was $1,613.
•State Financial Aid
Study at Clark State Community College
Classroom Environment
% of Classes with Fewer than 30 Students 91%
100%% of Classes with Fewer than 50 Students
Full-Time Instructional Faculty
Total Faculty
% Women
% from Minority Groups
% with Master's Degree or Higher
73
67%
10%
81%
Students Engaged in Internships/Co-Op/Field Experience 205
College Enrollment in Ohio in 2007-08•Employment in Ohio in 4th Quarter 2007•
December, 2009
6
54%
0% 10% 20% 30% 40% 50% 60% 70%
8,815TOTAL ENROLLMENT
Gender
Student Characteristics - Fall 2007
4,489Women
4,326Men
64%
Race/Ethnicity
White, non-Hispanic
24%Black, non-Hispanic
1%Hispanic
1%Asian or Pacific Islander
<1%American Indian / Alaskan Native
10%Non-Resident Alien / Race Unknown
Ohio
51%
90%
Geographic Distribution
49%
5,632
2,082
83
114
17
887
Other US States and Territorities 10%
Other Countries <1%
Student Level
8,797Undergraduate
18High School (Dual Enrolled)
100%
0%
Age
Average Age
Percent of Students Age 25 or Older
27
48%
Cincinnati State Technical & Community College
Undergraduate Success and Progress Rate
332
Percent that Graduated from an Ohio Public Institution
3 Years Later
•Percent Still Enrolled at Same Institution•
11%
33%
Percent that Transferred to another Ohio Institution• 5%
Percent that Graduated from an Ohio Public Institution
6 Years Later
•Percent Still Enrolled at Same Institution•
23%
8%
Percent that Transferred to another Ohio Institution• 5%
132
Percent that Graduated from an Ohio Public Institution
3 Years Later
•Percent Still Enrolled at Same Institution•
7%
27%
Percent that Transferred to another Ohio Institution• 5%
Percent that Graduated from an Ohio Public Institution
6 Years Later
•Percent Still Enrolled at Same Institution•
16%
6%
Percent that Transferred to another Ohio Institution• 5%
49%
36%
38%
27%
Full‐Time Part‐Time
3,215
5,600Enrollment Status
STUDENT PROFILE
Cincinnati, OH (513) 569-1500
Retention of Fall 2006 First-Time, Full-Time, Degree-Seeking Students
Percent Retained in Fall 2007
First-Time, Full-Time, Degree-Seeking Students Starting in Fall 2002
First-Time, Part-Time, Degree-Seeking Students Starting in Fall 2002
December, 2009
7

Employed, not in CollegeEnrolled in College in OhioOther56%
25%
19%
Post-Graduation Outcomes of Spring 2007 Associate Degree Graduates
66%
39%
6%
33%
50%Student Loans
State Grants
Institutional Aid
Federal Grants
Any Financial Aid
983
Degrees and Areas of Study
Associate Degrees
223Certificates
Cincinnati State Technical & Community College Page 2
Tuition and Financial Aid
Financial Aid Awarded to Students
66% of first-time, full-time, degree-seeking students in 2007-08 received financial aid of some type including need-based grants and loans, work-study, and non need-based scholarships.
Annual FY 2009 tuition and fees (sticker price) for in-state, undergraduate students before financial aid was $3,702. The cost to attend Cincinnati State Technical & Community College varies based on the individual circumstances of students and may be reduced through grants and scholarships.
•
39% of first-time, full-time, degree-seeking students in 2007-08 received a federal grant. The average grant for the year was $2,089.
•
6% of first-time, full-time, degree-seeking students in 2007-08 received an institutional grant. The average grant for the year was $2,790.
•
Overall Financial Aid
Federal Financial Aid
Institutional Aid
50% of first-time, full-time, degree-seeking students in 2007-08 received a federal loan. The average loan amount for the year was $2,638.
•Federal Loans
Percent of First-Time Students in FY 2007 Receiving Each Type of Financial Aid.
Degrees Awarded at Cincinnati State Technical & Community College in FY 2007-08
Total 1,206
370 176
72 45
442 221
All
Students
First-Generation
College
Minority
Areas of Study with the Largest Number of Associate Degrees Awarded in 2007-08
Engineering 21%
Health 21%
Business 20%
Arts & Humanities 18%
Social & Behavioral Sciences 6%
All Other Degree Areas 14%
100%
NOTE: Students may receive aid from more than one source.
33% of first-time, full-time, degree-seeking students in 2007-08 received a federal grant. The average grant for the year was $1,929.
•State Financial Aid
Study at Cincinnati State
Classroom Environment
% of Classes with Fewer than 30 Students 94%
100%% of Classes with Fewer than 50 Students
Full-Time Instructional Faculty
Total Faculty
% Women
% from Minority Groups
% with Master's Degree or Higher
182
54%
16%
49%
Students Engaged in Internships/Co-Op/Field Experience 1,795
College Enrollment in Ohio in 2007-08•Employment in Ohio in 4th Quarter 2007•
December, 2009
8

61%
0% 10% 20% 30% 40% 50% 60% 70%
3,112TOTAL ENROLLMENT
Gender
Student Characteristics - Fall 2007
2,278Women
834Men
85%
Race/Ethnicity
White, non-Hispanic
7%Black, non-Hispanic
1%Hispanic
1%Asian or Pacific Islander
1%American Indian / Alaskan Native
6%Non-Resident Alien / Race Unknown
Ohio
73%
99%
Geographic Distribution
27%
2,634
209
29
38
20
182
Other US States and Territorities 1%
Other Countries 0%
Student Level
2,981Undergraduate
131High School (Dual Enrolled)
96%
4%
Age
Average Age
Percent of Students Age 25 or Older
27
49%
Central Ohio Technical College
Undergraduate Success and Progress Rate
185
Percent that Graduated from an Ohio Public Institution
3 Years Later
•Percent Still Enrolled at Same Institution•
21%
23%
Percent that Transferred to another Ohio Institution• 8%
Percent that Graduated from an Ohio Public Institution
6 Years Later
•Percent Still Enrolled at Same Institution•
33%
7%
Percent that Transferred to another Ohio Institution• 7%
132
Percent that Graduated from an Ohio Public Institution
3 Years Later
•Percent Still Enrolled at Same Institution•
5%
31%
Percent that Transferred to another Ohio Institution• 6%
Percent that Graduated from an Ohio Public Institution
6 Years Later
•Percent Still Enrolled at Same Institution•
18%
12%
Percent that Transferred to another Ohio Institution• 5%
51%
47%
42%
36%
Full‐Time Part‐Time
1,456
1,656
Enrollment Status
STUDENT PROFILE
Newark, OH (740) 366-1351
Retention of Fall 2006 First-Time, Full-Time, Degree-Seeking Students
Percent Retained in Fall 2007
First-Time, Full-Time, Degree-Seeking Students Starting in Fall 2002
First-Time, Part-Time, Degree-Seeking Students Starting in Fall 2002
December, 2009
9
Employed, not in CollegeEnrolled in College in OhioOther68%
19%
14%
Post-Graduation Outcomes of Spring 2007 Associate Degree Graduates
81%
54%
10%
47%
56%Student Loans
State Grants
Institutional Aid
Federal Grants
Any Financial Aid
413
Degrees and Areas of Study
Associate Degrees
85Certificates
Central Ohio Technical College Page 2
Tuition and Financial Aid
Financial Aid Awarded to Students
81% of first-time, full-time, degree-seeking students in 2007-08 received financial aid of some type including need-based grants and loans, work-study, and non need-based scholarships.
Annual FY 2009 tuition and fees (sticker price) for in-state, undergraduate students before financial aid was $3,600. The cost to attend Central Ohio Technical College varies based on the individual circumstances of students and may be reduced through grants and scholarships.
•
54% of first-time, full-time, degree-seeking students in 2007-08 received a federal grant. The average grant for the year was $2,679.
•
10% of first-time, full-time, degree-seeking students in 2007-08 received an institutional grant. The average grant for the year was $2,005.
•
Overall Financial Aid
Federal Financial Aid
Institutional Aid
56% of first-time, full-time, degree-seeking students in 2007-08 received a federal loan. The average loan amount for the year was $3,659.
•Federal Loans
Percent of First-Time Students in FY 2007 Receiving Each Type of Financial Aid.
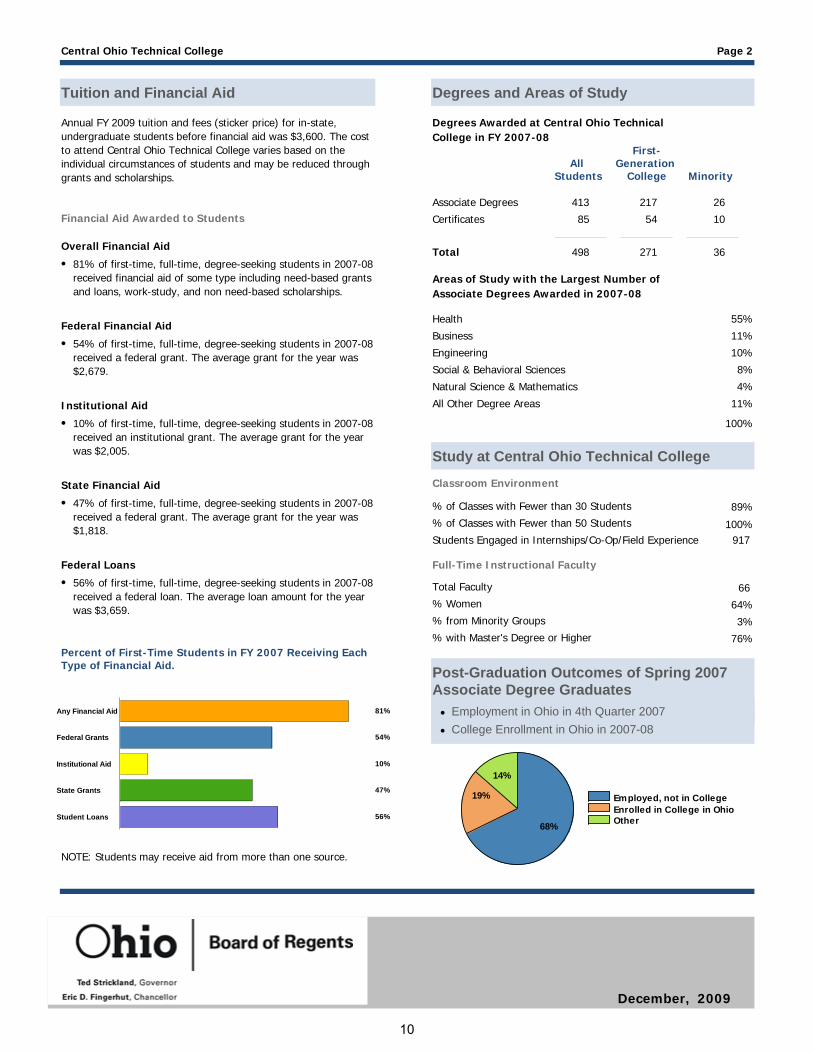
Degrees Awarded at Central Ohio Technical College in FY 2007-08
Total 498
217 26
54 10
271 36
All
Students
First-Generation
College
Minority
Areas of Study with the Largest Number of Associate Degrees Awarded in 2007-08
Health 55%
Business 11%
Engineering 10%
Social & Behavioral Sciences 8%
Natural Science & Mathematics 4%
All Other Degree Areas 11%
100%
NOTE: Students may receive aid from more than one source.
47% of first-time, full-time, degree-seeking students in 2007-08 received a federal grant. The average grant for the year was $1,818.
•State Financial Aid
Study at Central Ohio Technical College
Classroom Environment
% of Classes with Fewer than 30 Students 89%
100%% of Classes with Fewer than 50 Students
Full-Time Instructional Faculty
Total Faculty
% Women
% from Minority Groups
% with Master's Degree or Higher
66
64%
3%
76%
Students Engaged in Internships/Co-Op/Field Experience 917
College Enrollment in Ohio in 2007-08•Employment in Ohio in 4th Quarter 2007•
December, 2009
10

59%
0% 10% 20% 30% 40% 50% 60% 70%
23,056TOTAL ENROLLMENT
Gender
Student Characteristics - Fall 2007
13,286Women
9,770Men
69%
Race/Ethnicity
White, non-Hispanic
20%Black, non-Hispanic
2%Hispanic
3%Asian or Pacific Islander
<1%American Indian / Alaskan Native
4%Non-Resident Alien / Race Unknown
Ohio
58%
97%
Geographic Distribution
42%
15,975
4,726
465
744
111
1,035
Other US States and Territorities 2%
Other Countries 1%
Student Level
22,737Undergraduate
319High School (Dual Enrolled)
99%
1%
Age
Average Age
Percent of Students Age 25 or Older
26
45%
Columbus State Community College
Undergraduate Success and Progress Rate
1,913
Percent that Graduated from an Ohio Public Institution
3 Years Later
•Percent Still Enrolled at Same Institution•
6%
38%
Percent that Transferred to another Ohio Institution• 10%
Percent that Graduated from an Ohio Public Institution
6 Years Later
•Percent Still Enrolled at Same Institution•
21%
10%
Percent that Transferred to another Ohio Institution• 6%
1,170
Percent that Graduated from an Ohio Public Institution
3 Years Later
•Percent Still Enrolled at Same Institution•
2%
30%
Percent that Transferred to another Ohio Institution• 9%
Percent that Graduated from an Ohio Public Institution
6 Years Later
•Percent Still Enrolled at Same Institution•
9%
12%
Percent that Transferred to another Ohio Institution• 5%
54%
37%
42%
26%
Full‐Time Part‐Time
9,910
13,146
Enrollment Status
STUDENT PROFILE
Columbus, OH (614) 287-5353
Retention of Fall 2006 First-Time, Full-Time, Degree-Seeking Students
Percent Retained in Fall 2007
First-Time, Full-Time, Degree-Seeking Students Starting in Fall 2002
First-Time, Part-Time, Degree-Seeking Students Starting in Fall 2002
December, 2009
11

Employed, not in CollegeEnrolled in College in OhioOther52%
30%
18%
Post-Graduation Outcomes of Spring 2007 Associate Degree Graduates
62%
42%
3%
33%
42%Student Loans
State Grants
Institutional Aid
Federal Grants
Any Financial Aid
1,591
Degrees and Areas of Study
Associate Degrees
640Certificates
Columbus State Community College Page 2
Tuition and Financial Aid
Financial Aid Awarded to Students
62% of first-time, full-time, degree-seeking students in 2007-08 received financial aid of some type including need-based grants and loans, work-study, and non need-based scholarships.
Annual FY 2009 tuition and fees (sticker price) for in-state, undergraduate students before financial aid was $3,555. The cost to attend Columbus State Community College varies based on the individual circumstances of students and may be reduced through grants and scholarships.
•
42% of first-time, full-time, degree-seeking students in 2007-08 received a federal grant. The average grant for the year was $2,790.
•
3% of first-time, full-time, degree-seeking students in 2007-08 received an institutional grant. The average grant for the year was $1,465.
•
Overall Financial Aid
Federal Financial Aid
Institutional Aid
42% of first-time, full-time, degree-seeking students in 2007-08 received a federal loan. The average loan amount for the year was $3,069.
•Federal Loans
Percent of First-Time Students in FY 2007 Receiving Each Type of Financial Aid.
Degrees Awarded at Columbus State Community College in FY 2007-08
Total 2,231
602 283
199 136
801 419
All
Students
First-Generation
College
Minority
Areas of Study with the Largest Number of Associate Degrees Awarded in 2007-08
Health 29%
Arts & Humanities 25%
Business 16%
Engineering 10%
Social & Behavioral Sciences 5%
All Other Degree Areas 15%
100%
NOTE: Students may receive aid from more than one source.
33% of first-time, full-time, degree-seeking students in 2007-08 received a federal grant. The average grant for the year was $1,688.
•State Financial Aid
Study at Columbus State Community College
Classroom Environment
% of Classes with Fewer than 30 Students 89%
99%% of Classes with Fewer than 50 Students
Full-Time Instructional Faculty
Total Faculty
% Women
% from Minority Groups
% with Master's Degree or Higher
277
49%
10%
71%
Students Engaged in Internships/Co-Op/Field Experience 2,359
College Enrollment in Ohio in 2007-08•Employment in Ohio in 4th Quarter 2007•
December, 2009
12
56%
0% 10% 20% 30% 40% 50% 60% 70%
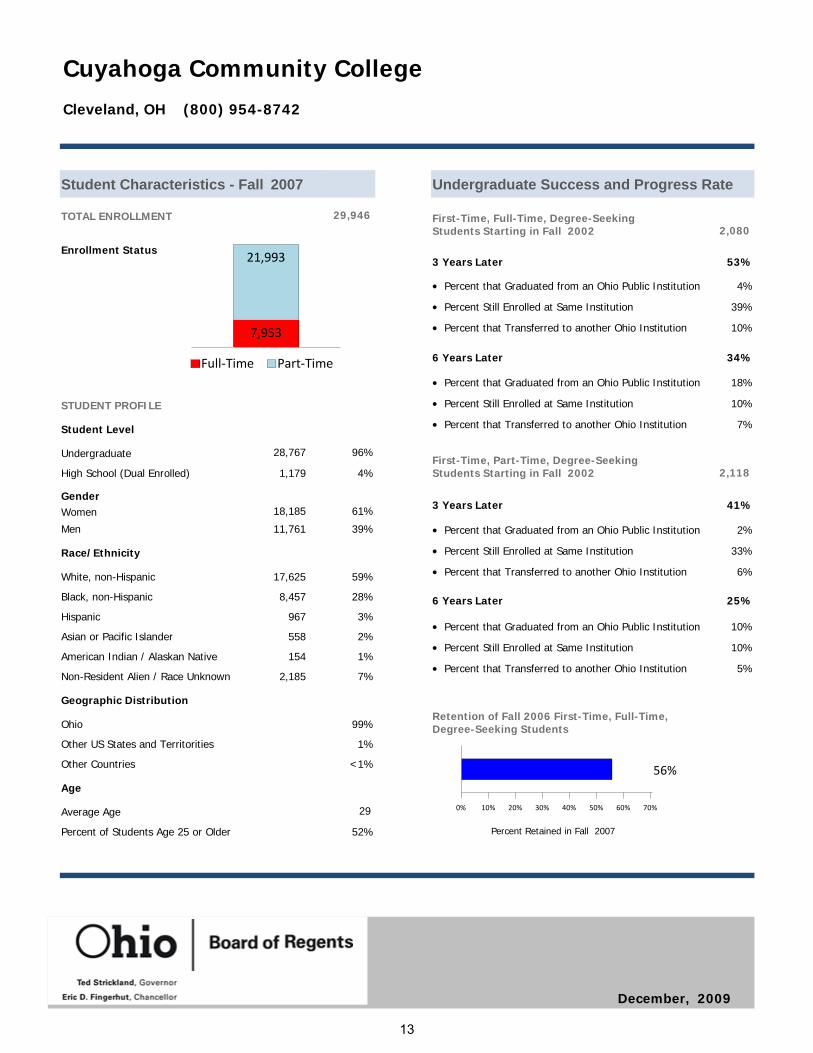
29,946TOTAL ENROLLMENT
Gender
Student Characteristics - Fall 2007
18,185Women
11,761Men
59%
Race/Ethnicity
White, non-Hispanic
28%Black, non-Hispanic
3%Hispanic
2%Asian or Pacific Islander
1%American Indian / Alaskan Native
7%Non-Resident Alien / Race Unknown
Ohio
61%
99%
Geographic Distribution
39%
17,625
8,457
967
558
154
2,185
Other US States and Territorities 1%
Other Countries <1%
Student Level
28,767Undergraduate
1,179High School (Dual Enrolled)
96%
4%
Age
Average Age
Percent of Students Age 25 or Older
29
52%
Cuyahoga Community College
Undergraduate Success and Progress Rate
2,080
Percent that Graduated from an Ohio Public Institution
3 Years Later
•Percent Still Enrolled at Same Institution•
4%
39%
Percent that Transferred to another Ohio Institution• 10%
Percent that Graduated from an Ohio Public Institution
6 Years Later
•Percent Still Enrolled at Same Institution•
18%
10%
Percent that Transferred to another Ohio Institution• 7%
2,118
Percent that Graduated from an Ohio Public Institution
3 Years Later
•Percent Still Enrolled at Same Institution•
2%
33%
Percent that Transferred to another Ohio Institution• 6%
Percent that Graduated from an Ohio Public Institution
6 Years Later
•Percent Still Enrolled at Same Institution•
10%
10%
Percent that Transferred to another Ohio Institution• 5%
53%
34%
41%
25%
Full‐Time Part‐Time
7,953
21,993Enrollment Status
STUDENT PROFILE
Cleveland, OH (800) 954-8742
Retention of Fall 2006 First-Time, Full-Time, Degree-Seeking Students
Percent Retained in Fall 2007
First-Time, Full-Time, Degree-Seeking Students Starting in Fall 2002
First-Time, Part-Time, Degree-Seeking Students Starting in Fall 2002
December, 2009
13
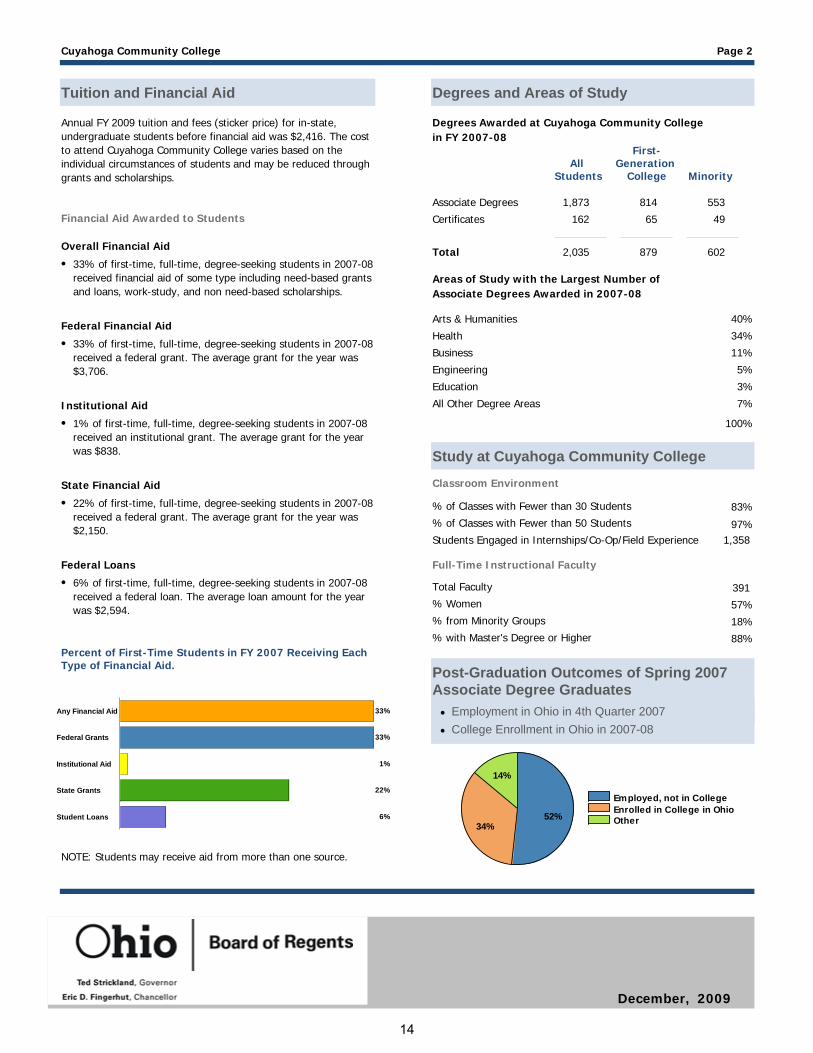
Employed, not in CollegeEnrolled in College in OhioOther52%
34%
14%
Post-Graduation Outcomes of Spring 2007 Associate Degree Graduates
33%
33%
1%
22%
6%Student Loans
State Grants
Institutional Aid
Federal Grants
Any Financial Aid
1,873
Degrees and Areas of Study
Associate Degrees
162Certificates
Cuyahoga Community College Page 2
Tuition and Financial Aid
Financial Aid Awarded to Students
33% of first-time, full-time, degree-seeking students in 2007-08 received financial aid of some type including need-based grants and loans, work-study, and non need-based scholarships.
Annual FY 2009 tuition and fees (sticker price) for in-state, undergraduate students before financial aid was $2,416. The cost to attend Cuyahoga Community College varies based on the individual circumstances of students and may be reduced through grants and scholarships.
•
33% of first-time, full-time, degree-seeking students in 2007-08 received a federal grant. The average grant for the year was $3,706.
•
1% of first-time, full-time, degree-seeking students in 2007-08 received an institutional grant. The average grant for the year was $838.
•
Overall Financial Aid
Federal Financial Aid
Institutional Aid
6% of first-time, full-time, degree-seeking students in 2007-08 received a federal loan. The average loan amount for the year was $2,594.
•Federal Loans
Percent of First-Time Students in FY 2007 Receiving Each Type of Financial Aid.
Degrees Awarded at Cuyahoga Community College in FY 2007-08
Total 2,035
814 553
65 49
879 602
All
Students
First-Generation
College
Minority
Areas of Study with the Largest Number of Associate Degrees Awarded in 2007-08
Arts & Humanities 40%
Health 34%
Business 11%
Engineering 5%
Education 3%
All Other Degree Areas 7%
100%
NOTE: Students may receive aid from more than one source.
22% of first-time, full-time, degree-seeking students in 2007-08 received a federal grant. The average grant for the year was $2,150.
•State Financial Aid
Study at Cuyahoga Community College
Classroom Environment
% of Classes with Fewer than 30 Students 83%
97%% of Classes with Fewer than 50 Students
Full-Time Instructional Faculty
Total Faculty
% Women
% from Minority Groups
% with Master's Degree or Higher
391
57%
18%
88%
Students Engaged in Internships/Co-Op/Field Experience 1,358
College Enrollment in Ohio in 2007-08•Employment in Ohio in 4th Quarter 2007•
December, 2009
14
57%
0% 10% 20% 30% 40% 50% 60% 70%
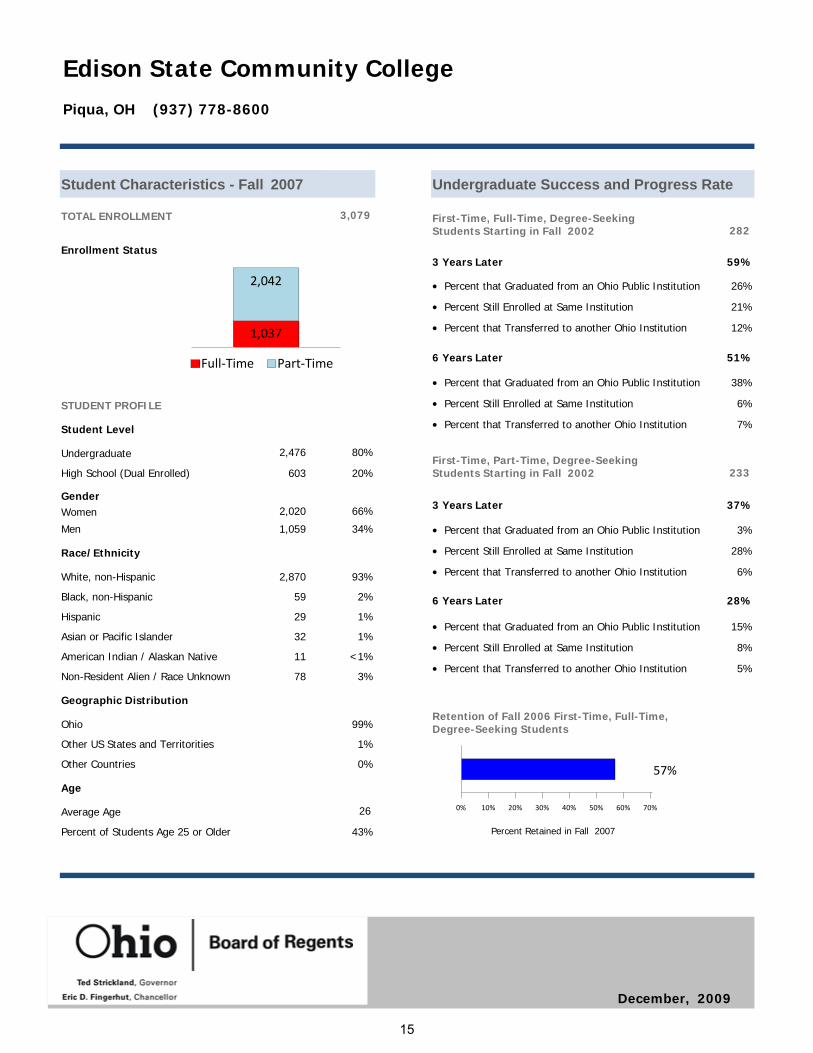
3,079TOTAL ENROLLMENT
Gender
Student Characteristics - Fall 2007
2,020Women
1,059Men
93%
Race/Ethnicity
White, non-Hispanic
2%Black, non-Hispanic
1%Hispanic
1%Asian or Pacific Islander
<1%American Indian / Alaskan Native
3%Non-Resident Alien / Race Unknown
Ohio
66%
99%
Geographic Distribution
34%
2,870
59
29
32
11
78
Other US States and Territorities 1%
Other Countries 0%
Student Level
2,476Undergraduate
603High School (Dual Enrolled)
80%
20%
Age
Average Age
Percent of Students Age 25 or Older
26
43%
Edison State Community College
Undergraduate Success and Progress Rate
282
Percent that Graduated from an Ohio Public Institution
3 Years Later
•Percent Still Enrolled at Same Institution•
26%
21%
Percent that Transferred to another Ohio Institution• 12%
Percent that Graduated from an Ohio Public Institution
6 Years Later
•Percent Still Enrolled at Same Institution•
38%
6%
Percent that Transferred to another Ohio Institution• 7%
233
Percent that Graduated from an Ohio Public Institution
3 Years Later
•Percent Still Enrolled at Same Institution•
3%
28%
Percent that Transferred to another Ohio Institution• 6%
Percent that Graduated from an Ohio Public Institution
6 Years Later
•Percent Still Enrolled at Same Institution•
15%
8%
Percent that Transferred to another Ohio Institution• 5%
59%
51%
37%
28%
Full‐Time Part‐Time
1,037
2,042
Enrollment Status
STUDENT PROFILE
Piqua, OH (937) 778-8600
Retention of Fall 2006 First-Time, Full-Time, Degree-Seeking Students
Percent Retained in Fall 2007
First-Time, Full-Time, Degree-Seeking Students Starting in Fall 2002
First-Time, Part-Time, Degree-Seeking Students Starting in Fall 2002
December, 2009
15
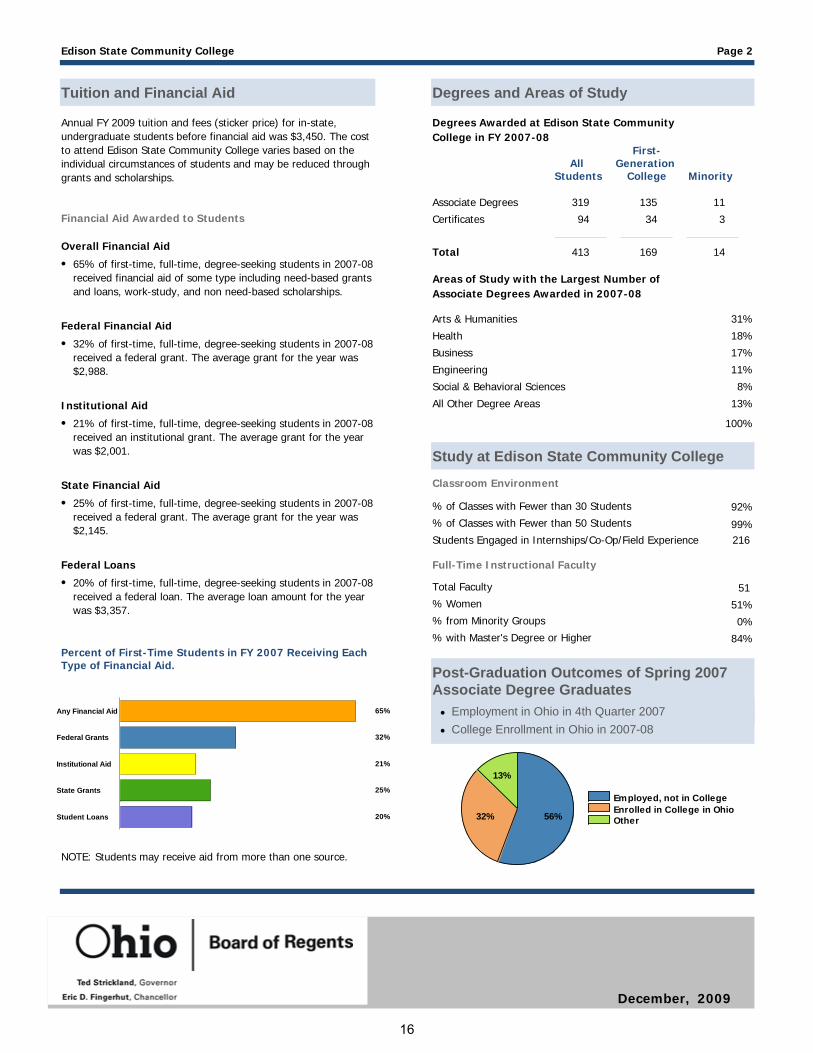
Employed, not in CollegeEnrolled in College in OhioOther56%32%
13%
Post-Graduation Outcomes of Spring 2007 Associate Degree Graduates
65%
32%
21%
25%
20%Student Loans
State Grants
Institutional Aid
Federal Grants
Any Financial Aid
319
Degrees and Areas of Study
Associate Degrees
94Certificates
Edison State Community College Page 2
Tuition and Financial Aid
Financial Aid Awarded to Students
65% of first-time, full-time, degree-seeking students in 2007-08 received financial aid of some type including need-based grants and loans, work-study, and non need-based scholarships.
Annual FY 2009 tuition and fees (sticker price) for in-state, undergraduate students before financial aid was $3,450. The cost to attend Edison State Community College varies based on the individual circumstances of students and may be reduced through grants and scholarships.
•
32% of first-time, full-time, degree-seeking students in 2007-08 received a federal grant. The average grant for the year was $2,988.
•
21% of first-time, full-time, degree-seeking students in 2007-08 received an institutional grant. The average grant for the year was $2,001.
•
Overall Financial Aid
Federal Financial Aid
Institutional Aid
20% of first-time, full-time, degree-seeking students in 2007-08 received a federal loan. The average loan amount for the year was $3,357.
•Federal Loans
Percent of First-Time Students in FY 2007 Receiving Each Type of Financial Aid.
Degrees Awarded at Edison State Community College in FY 2007-08
Total 413
135 11
34 3
169 14
All
Students
First-Generation
College
Minority
Areas of Study with the Largest Number of Associate Degrees Awarded in 2007-08
Arts & Humanities 31%
Health 18%
Business 17%
Engineering 11%
Social & Behavioral Sciences 8%
All Other Degree Areas 13%
100%
NOTE: Students may receive aid from more than one source.
25% of first-time, full-time, degree-seeking students in 2007-08 received a federal grant. The average grant for the year was $2,145.
•State Financial Aid
Study at Edison State Community College
Classroom Environment
% of Classes with Fewer than 30 Students 92%
99%% of Classes with Fewer than 50 Students
Full-Time Instructional Faculty
Total Faculty
% Women
% from Minority Groups
% with Master's Degree or Higher
51
51%
0%
84%
Students Engaged in Internships/Co-Op/Field Experience 216
College Enrollment in Ohio in 2007-08•Employment in Ohio in 4th Quarter 2007•
December, 2009
16
55%
0% 10% 20% 30% 40% 50% 60% 70%
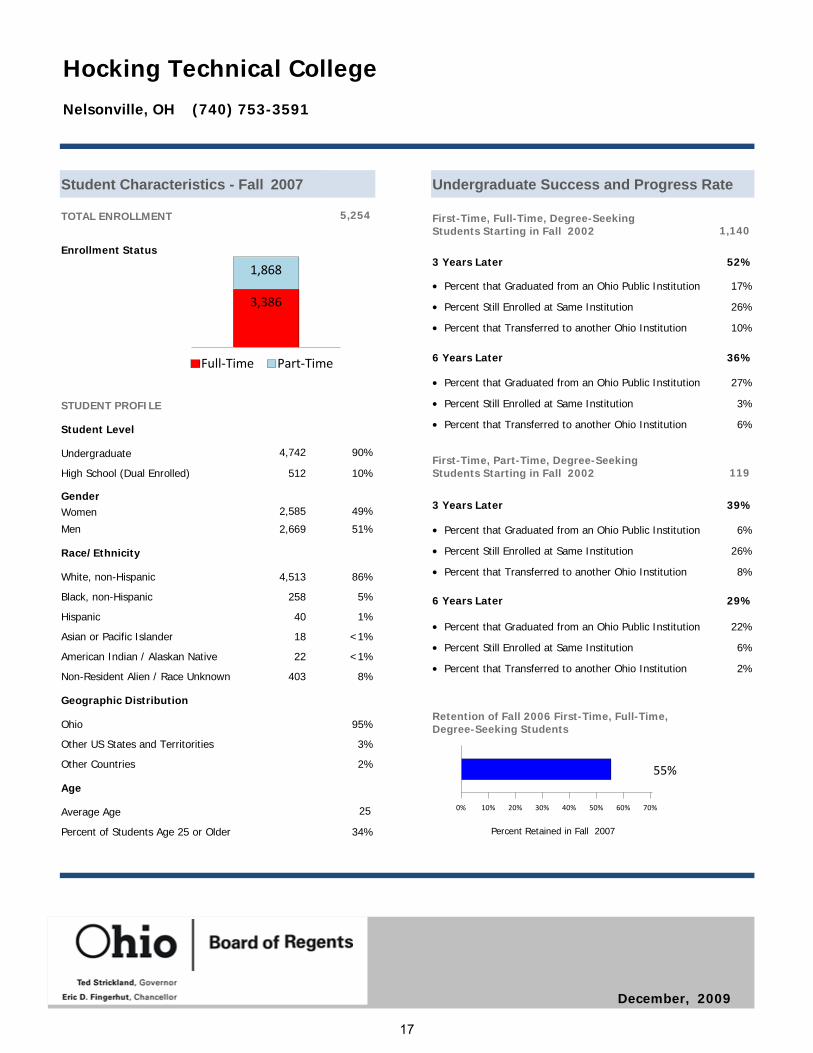
5,254TOTAL ENROLLMENT
Gender
Student Characteristics - Fall 2007
2,585Women
2,669Men
86%
Race/Ethnicity
White, non-Hispanic
5%Black, non-Hispanic
1%Hispanic
<1%Asian or Pacific Islander
<1%American Indian / Alaskan Native
8%Non-Resident Alien / Race Unknown
Ohio
49%
95%
Geographic Distribution
51%
4,513
258
40
18
22
403
Other US States and Territorities 3%
Other Countries 2%
Student Level
4,742Undergraduate
512High School (Dual Enrolled)
90%
10%
Age
Average Age
Percent of Students Age 25 or Older
25
34%
Hocking Technical College
Undergraduate Success and Progress Rate
1,140
Percent that Graduated from an Ohio Public Institution
3 Years Later
•Percent Still Enrolled at Same Institution•
17%
26%
Percent that Transferred to another Ohio Institution• 10%
Percent that Graduated from an Ohio Public Institution
6 Years Later
•Percent Still Enrolled at Same Institution•
27%
3%
Percent that Transferred to another Ohio Institution• 6%
119
Percent that Graduated from an Ohio Public Institution
3 Years Later
•Percent Still Enrolled at Same Institution•
6%
26%
Percent that Transferred to another Ohio Institution• 8%
Percent that Graduated from an Ohio Public Institution
6 Years Later
•Percent Still Enrolled at Same Institution•
22%
6%
Percent that Transferred to another Ohio Institution• 2%
52%
36%
39%
29%
Full‐Time Part‐Time
3,386
1,868
Enrollment Status
STUDENT PROFILE
Nelsonville, OH (740) 753-3591
Retention of Fall 2006 First-Time, Full-Time, Degree-Seeking Students
Percent Retained in Fall 2007
First-Time, Full-Time, Degree-Seeking Students Starting in Fall 2002
First-Time, Part-Time, Degree-Seeking Students Starting in Fall 2002
December, 2009
17
Employed, not in CollegeEnrolled in College in OhioOther55%
22%
23%
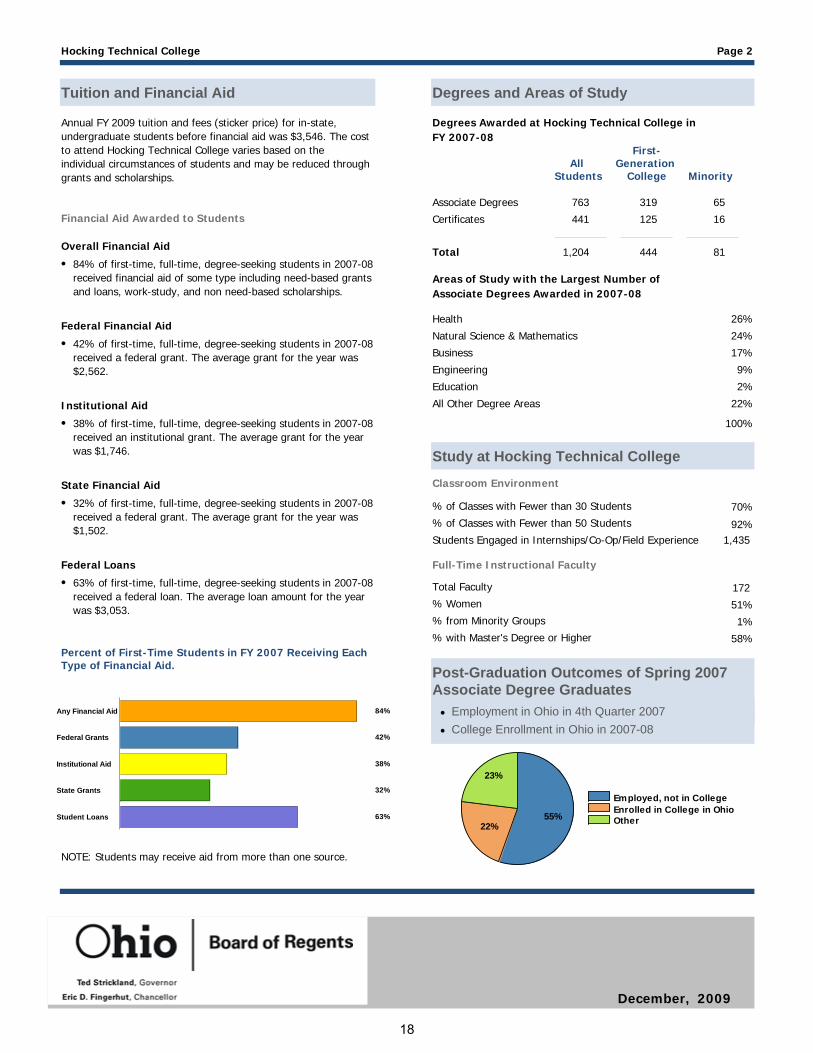
Post-Graduation Outcomes of Spring 2007 Associate Degree Graduates
84%
42%
38%
32%
63%Student Loans
State Grants
Institutional Aid
Federal Grants
Any Financial Aid
763
Degrees and Areas of Study
Associate Degrees
441Certificates
Hocking Technical College Page 2
Tuition and Financial Aid
Financial Aid Awarded to Students
84% of first-time, full-time, degree-seeking students in 2007-08 received financial aid of some type including need-based grants and loans, work-study, and non need-based scholarships.
Annual FY 2009 tuition and fees (sticker price) for in-state, undergraduate students before financial aid was $3,546. The cost to attend Hocking Technical College varies based on the individual circumstances of students and may be reduced through grants and scholarships.
•
42% of first-time, full-time, degree-seeking students in 2007-08 received a federal grant. The average grant for the year was $2,562.
•
38% of first-time, full-time, degree-seeking students in 2007-08 received an institutional grant. The average grant for the year was $1,746.
•
Overall Financial Aid
Federal Financial Aid
Institutional Aid
63% of first-time, full-time, degree-seeking students in 2007-08 received a federal loan. The average loan amount for the year was $3,053.
•Federal Loans
Percent of First-Time Students in FY 2007 Receiving Each Type of Financial Aid.
Degrees Awarded at Hocking Technical College in FY 2007-08
Total 1,204
319 65
125 16
444 81
All
Students
First-Generation
College
Minority
Areas of Study with the Largest Number of Associate Degrees Awarded in 2007-08
Health 26%
Natural Science & Mathematics 24%
Business 17%
Engineering 9%
Education 2%
All Other Degree Areas 22%
100%
NOTE: Students may receive aid from more than one source.
32% of first-time, full-time, degree-seeking students in 2007-08 received a federal grant. The average grant for the year was $1,502.
•State Financial Aid
Study at Hocking Technical College
Classroom Environment
% of Classes with Fewer than 30 Students 70%
92%% of Classes with Fewer than 50 Students
Full-Time Instructional Faculty
Total Faculty
% Women
% from Minority Groups
% with Master's Degree or Higher
172
51%
1%
58%
Students Engaged in Internships/Co-Op/Field Experience 1,435
College Enrollment in Ohio in 2007-08•Employment in Ohio in 4th Quarter 2007•
December, 2009
18

63%
0% 10% 20% 30% 40% 50% 60% 70%
1,744TOTAL ENROLLMENT
Gender
Student Characteristics - Fall 2007
1,075Women
669Men
89%
Race/Ethnicity
White, non-Hispanic
5%Black, non-Hispanic
1%Hispanic
1%Asian or Pacific Islander
<1%American Indian / Alaskan Native
4%Non-Resident Alien / Race Unknown
Ohio
62%
85%
Geographic Distribution
38%
1,560
87
17
12
2
66
Other US States and Territorities 15%
Other Countries 0%
Student Level
1,589Undergraduate
155High School (Dual Enrolled)
91%
9%
Age
Average Age
Percent of Students Age 25 or Older
26
39%
Jefferson Community College
Undergraduate Success and Progress Rate
185
Percent that Graduated from an Ohio Public Institution
3 Years Later
•Percent Still Enrolled at Same Institution•
21%
24%
Percent that Transferred to another Ohio Institution• 5%
Percent that Graduated from an Ohio Public Institution
6 Years Later
•Percent Still Enrolled at Same Institution•
30%
5%
Percent that Transferred to another Ohio Institution• 4%
47
Percent that Graduated from an Ohio Public Institution
3 Years Later
•Percent Still Enrolled at Same Institution•
4%
23%
Percent that Transferred to another Ohio Institution• 4%
Percent that Graduated from an Ohio Public Institution
6 Years Later
•Percent Still Enrolled at Same Institution•
9%
9%
Percent that Transferred to another Ohio Institution• 2%
50%
39%
32%
19%
Full‐Time Part‐Time
890
854Enrollment Status
STUDENT PROFILE
Steubenville, OH (740) 264-5591
Retention of Fall 2006 First-Time, Full-Time, Degree-Seeking Students
Percent Retained in Fall 2007
First-Time, Full-Time, Degree-Seeking Students Starting in Fall 2002
First-Time, Part-Time, Degree-Seeking Students Starting in Fall 2002
December, 2009
19
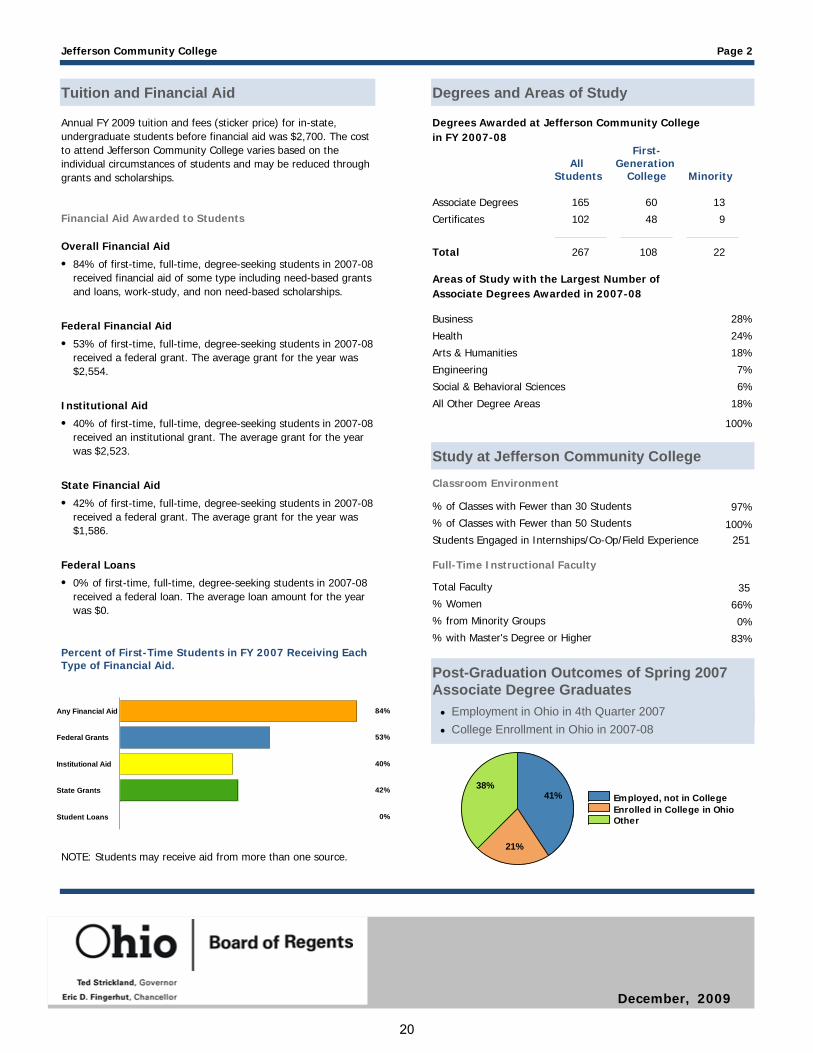
Employed, not in CollegeEnrolled in College in OhioOther
41%
21%
38%
Post-Graduation Outcomes of Spring 2007 Associate Degree Graduates
84%
53%
40%
42%
0%Student Loans
State Grants
Institutional Aid
Federal Grants
Any Financial Aid
165
Degrees and Areas of Study
Associate Degrees
102Certificates
Jefferson Community College Page 2
Tuition and Financial Aid
Financial Aid Awarded to Students
84% of first-time, full-time, degree-seeking students in 2007-08 received financial aid of some type including need-based grants and loans, work-study, and non need-based scholarships.
Annual FY 2009 tuition and fees (sticker price) for in-state, undergraduate students before financial aid was $2,700. The cost to attend Jefferson Community College varies based on the individual circumstances of students and may be reduced through grants and scholarships.
•
53% of first-time, full-time, degree-seeking students in 2007-08 received a federal grant. The average grant for the year was $2,554.
•
40% of first-time, full-time, degree-seeking students in 2007-08 received an institutional grant. The average grant for the year was $2,523.
•
Overall Financial Aid
Federal Financial Aid
Institutional Aid
0% of first-time, full-time, degree-seeking students in 2007-08 received a federal loan. The average loan amount for the year was $0.
•Federal Loans
Percent of First-Time Students in FY 2007 Receiving Each Type of Financial Aid.
Degrees Awarded at Jefferson Community College in FY 2007-08
Total 267
60 13
48 9
108 22
All
Students
First-Generation
College
Minority
Areas of Study with the Largest Number of Associate Degrees Awarded in 2007-08
Business 28%
Health 24%
Arts & Humanities 18%
Engineering 7%
Social & Behavioral Sciences 6%
All Other Degree Areas 18%
100%
NOTE: Students may receive aid from more than one source.
42% of first-time, full-time, degree-seeking students in 2007-08 received a federal grant. The average grant for the year was $1,586.
•State Financial Aid
Study at Jefferson Community College
Classroom Environment
% of Classes with Fewer than 30 Students 97%
100%% of Classes with Fewer than 50 Students
Full-Time Instructional Faculty
Total Faculty
% Women
% from Minority Groups
% with Master's Degree or Higher
35
66%
0%
83%
Students Engaged in Internships/Co-Op/Field Experience 251
College Enrollment in Ohio in 2007-08•Employment in Ohio in 4th Quarter 2007•
December, 2009
20
59%
0% 10% 20% 30% 40% 50% 60% 70%
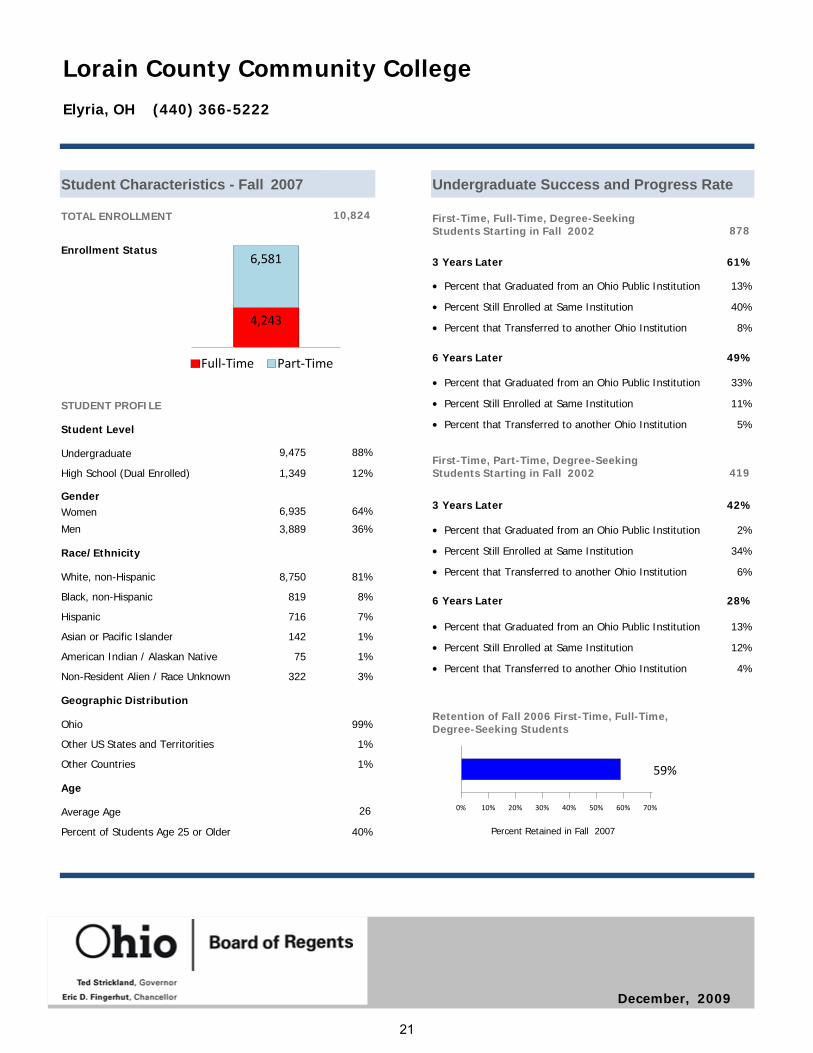
10,824TOTAL ENROLLMENT
Gender
Student Characteristics - Fall 2007
6,935Women
3,889Men
81%
Race/Ethnicity
White, non-Hispanic
8%Black, non-Hispanic
7%Hispanic
1%Asian or Pacific Islander
1%American Indian / Alaskan Native
3%Non-Resident Alien / Race Unknown
Ohio
64%
99%
Geographic Distribution
36%
8,750
819
716
142
75
322
Other US States and Territorities 1%
Other Countries 1%
Student Level
9,475Undergraduate
1,349High School (Dual Enrolled)
88%
12%
Age
Average Age
Percent of Students Age 25 or Older
26
40%
Lorain County Community College
Undergraduate Success and Progress Rate
878
Percent that Graduated from an Ohio Public Institution
3 Years Later
•Percent Still Enrolled at Same Institution•
13%
40%
Percent that Transferred to another Ohio Institution• 8%
Percent that Graduated from an Ohio Public Institution
6 Years Later
•Percent Still Enrolled at Same Institution•
33%
11%
Percent that Transferred to another Ohio Institution• 5%
419
Percent that Graduated from an Ohio Public Institution
3 Years Later
•Percent Still Enrolled at Same Institution•
2%
34%
Percent that Transferred to another Ohio Institution• 6%
Percent that Graduated from an Ohio Public Institution
6 Years Later
•Percent Still Enrolled at Same Institution•
13%
12%
Percent that Transferred to another Ohio Institution• 4%
61%
49%
42%
28%
Full‐Time Part‐Time
4,243
6,581Enrollment Status
STUDENT PROFILE
Elyria, OH (440) 366-5222
Retention of Fall 2006 First-Time, Full-Time, Degree-Seeking Students
Percent Retained in Fall 2007
First-Time, Full-Time, Degree-Seeking Students Starting in Fall 2002
First-Time, Part-Time, Degree-Seeking Students Starting in Fall 2002
December, 2009
21
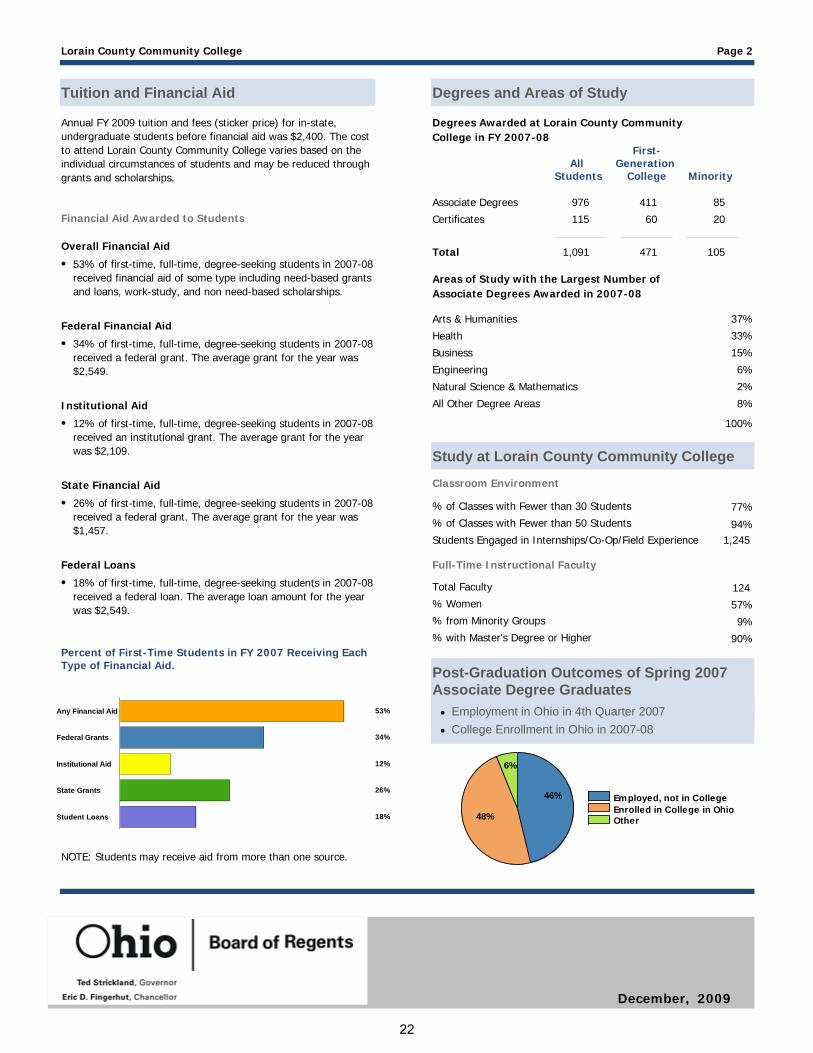
Employed, not in CollegeEnrolled in College in OhioOther
46%
48%
6%
Post-Graduation Outcomes of Spring 2007 Associate Degree Graduates
53%
34%
12%
26%
18%Student Loans
State Grants
Institutional Aid
Federal Grants
Any Financial Aid
976
Degrees and Areas of Study
Associate Degrees
115Certificates
Lorain County Community College Page 2
Tuition and Financial Aid
Financial Aid Awarded to Students
53% of first-time, full-time, degree-seeking students in 2007-08 received financial aid of some type including need-based grants and loans, work-study, and non need-based scholarships.
Annual FY 2009 tuition and fees (sticker price) for in-state, undergraduate students before financial aid was $2,400. The cost to attend Lorain County Community College varies based on the individual circumstances of students and may be reduced through grants and scholarships.
•
34% of first-time, full-time, degree-seeking students in 2007-08 received a federal grant. The average grant for the year was $2,549.
•
12% of first-time, full-time, degree-seeking students in 2007-08 received an institutional grant. The average grant for the year was $2,109.
•
Overall Financial Aid
Federal Financial Aid
Institutional Aid
18% of first-time, full-time, degree-seeking students in 2007-08 received a federal loan. The average loan amount for the year was $2,549.
•Federal Loans
Percent of First-Time Students in FY 2007 Receiving Each Type of Financial Aid.
Degrees Awarded at Lorain County Community College in FY 2007-08
Total 1,091
411 85
60 20
471 105
All
Students
First-Generation
College
Minority
Areas of Study with the Largest Number of Associate Degrees Awarded in 2007-08
Arts & Humanities 37%
Health 33%
Business 15%
Engineering 6%
Natural Science & Mathematics 2%
All Other Degree Areas 8%
100%
NOTE: Students may receive aid from more than one source.
26% of first-time, full-time, degree-seeking students in 2007-08 received a federal grant. The average grant for the year was $1,457.
•State Financial Aid
Study at Lorain County Community College
Classroom Environment
% of Classes with Fewer than 30 Students 77%
94%% of Classes with Fewer than 50 Students
Full-Time Instructional Faculty
Total Faculty
% Women
% from Minority Groups
% with Master's Degree or Higher
124
57%
9%
90%
Students Engaged in Internships/Co-Op/Field Experience 1,245
College Enrollment in Ohio in 2007-08•Employment in Ohio in 4th Quarter 2007•
December, 2009
22

67%
0% 10% 20% 30% 40% 50% 60% 70%
9,172TOTAL ENROLLMENT
Gender
Student Characteristics - Fall 2007
5,486Women
3,686Men
80%
Race/Ethnicity
White, non-Hispanic
13%Black, non-Hispanic
2%Hispanic
1%Asian or Pacific Islander
<1%American Indian / Alaskan Native
4%Non-Resident Alien / Race Unknown
Ohio
60%
99%
Geographic Distribution
40%
7,300
1,156
186
107
33
390
Other US States and Territorities <1%
Other Countries <1%
Student Level
8,689Undergraduate
483High School (Dual Enrolled)
95%
5%
Age
Average Age
Percent of Students Age 25 or Older
28
46%
Lakeland Community College
Undergraduate Success and Progress Rate
808
Percent that Graduated from an Ohio Public Institution
3 Years Later
•Percent Still Enrolled at Same Institution•
16%
31%
Percent that Transferred to another Ohio Institution• 12%
Percent that Graduated from an Ohio Public Institution
6 Years Later
•Percent Still Enrolled at Same Institution•
32%
7%
Percent that Transferred to another Ohio Institution• 7%
472
Percent that Graduated from an Ohio Public Institution
3 Years Later
•Percent Still Enrolled at Same Institution•
3%
35%
Percent that Transferred to another Ohio Institution• 7%
Percent that Graduated from an Ohio Public Institution
6 Years Later
•Percent Still Enrolled at Same Institution•
14%
10%
Percent that Transferred to another Ohio Institution• 7%
59%
46%
44%
31%
Full‐Time Part‐Time
3,848
5,324Enrollment Status
STUDENT PROFILE
Kirtland, OH (440) 525-7000
Retention of Fall 2006 First-Time, Full-Time, Degree-Seeking Students
Percent Retained in Fall 2007
First-Time, Full-Time, Degree-Seeking Students Starting in Fall 2002
First-Time, Part-Time, Degree-Seeking Students Starting in Fall 2002
December, 2009
23
Employed, not in CollegeEnrolled in College in OhioOther
48%
41%
11%
Post-Graduation Outcomes of Spring 2007 Associate Degree Graduates
64%
38%
8%
35%
47%Student Loans
State Grants
Institutional Aid
Federal Grants
Any Financial Aid
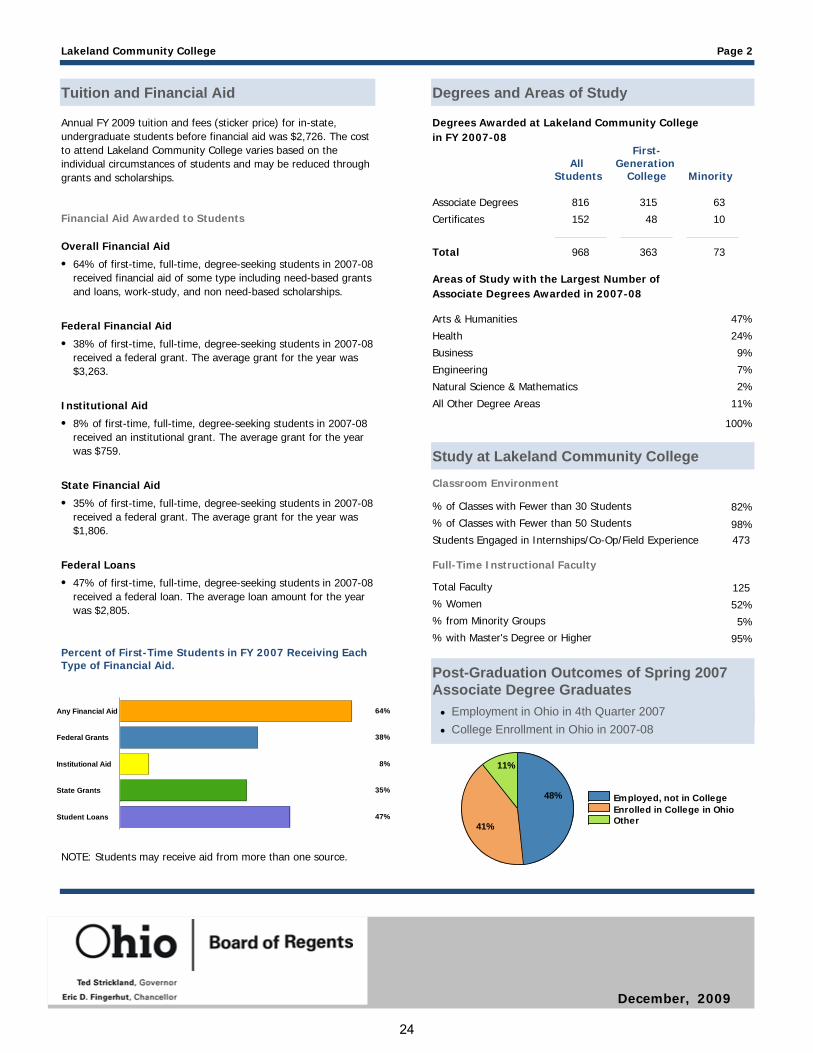
816
Degrees and Areas of Study
Associate Degrees
152Certificates
Lakeland Community College Page 2
Tuition and Financial Aid
Financial Aid Awarded to Students
64% of first-time, full-time, degree-seeking students in 2007-08 received financial aid of some type including need-based grants and loans, work-study, and non need-based scholarships.
Annual FY 2009 tuition and fees (sticker price) for in-state, undergraduate students before financial aid was $2,726. The cost to attend Lakeland Community College varies based on the individual circumstances of students and may be reduced through grants and scholarships.
•
38% of first-time, full-time, degree-seeking students in 2007-08 received a federal grant. The average grant for the year was $3,263.
•
8% of first-time, full-time, degree-seeking students in 2007-08 received an institutional grant. The average grant for the year was $759.
•
Overall Financial Aid
Federal Financial Aid
Institutional Aid
47% of first-time, full-time, degree-seeking students in 2007-08 received a federal loan. The average loan amount for the year was $2,805.
•Federal Loans
Percent of First-Time Students in FY 2007 Receiving Each Type of Financial Aid.
Degrees Awarded at Lakeland Community College in FY 2007-08
Total 968
315 63
48 10
363 73
All
Students
First-Generation
College
Minority
Areas of Study with the Largest Number of Associate Degrees Awarded in 2007-08
Arts & Humanities 47%
Health 24%
Business 9%
Engineering 7%
Natural Science & Mathematics 2%
All Other Degree Areas 11%
100%
NOTE: Students may receive aid from more than one source.
35% of first-time, full-time, degree-seeking students in 2007-08 received a federal grant. The average grant for the year was $1,806.
•State Financial Aid
Study at Lakeland Community College
Classroom Environment
% of Classes with Fewer than 30 Students 82%
98%% of Classes with Fewer than 50 Students
Full-Time Instructional Faculty
Total Faculty
% Women
% from Minority Groups
% with Master's Degree or Higher
125
52%
5%
95%
Students Engaged in Internships/Co-Op/Field Experience 473
College Enrollment in Ohio in 2007-08•Employment in Ohio in 4th Quarter 2007•
December, 2009
24

64%
0% 10% 20% 30% 40% 50% 60% 70%
3,381TOTAL ENROLLMENT
Gender
Student Characteristics - Fall 2007
2,452Women
929Men
88%
Race/Ethnicity
White, non-Hispanic
7%Black, non-Hispanic
2%Hispanic
1%Asian or Pacific Islander
<1%American Indian / Alaskan Native
2%Non-Resident Alien / Race Unknown
Ohio
73%
99%
Geographic Distribution
27%
2,987
233
52
24
15
70
Other US States and Territorities 1%
Other Countries <1%
Student Level
3,144Undergraduate
237High School (Dual Enrolled)
93%
7%
Age
Average Age
Percent of Students Age 25 or Older
25
42%
James A. Rhodes State College
Undergraduate Success and Progress Rate
356
Percent that Graduated from an Ohio Public Institution
3 Years Later
•Percent Still Enrolled at Same Institution•
26%
29%
Percent that Transferred to another Ohio Institution• 5%
Percent that Graduated from an Ohio Public Institution
6 Years Later
•Percent Still Enrolled at Same Institution•
44%
5%
Percent that Transferred to another Ohio Institution• 3%
88
Percent that Graduated from an Ohio Public Institution
3 Years Later
•Percent Still Enrolled at Same Institution•
10%
32%
Percent that Transferred to another Ohio Institution• 2%
Percent that Graduated from an Ohio Public Institution
6 Years Later
•Percent Still Enrolled at Same Institution•
24%
13%
Percent that Transferred to another Ohio Institution• 5%
60%
52%
44%
41%
Full‐Time Part‐Time
1,845
1,536
Enrollment Status
STUDENT PROFILE
Lima, OH (419) 221-1112
Retention of Fall 2006 First-Time, Full-Time, Degree-Seeking Students
Percent Retained in Fall 2007
First-Time, Full-Time, Degree-Seeking Students Starting in Fall 2002
First-Time, Part-Time, Degree-Seeking Students Starting in Fall 2002
December, 2009
25
Employed, not in CollegeEnrolled in College in OhioOther
78%
15%
7%
Post-Graduation Outcomes of Spring 2007 Associate Degree Graduates
80%
48%
17%
38%
48%Student Loans
State Grants
Institutional Aid
Federal Grants
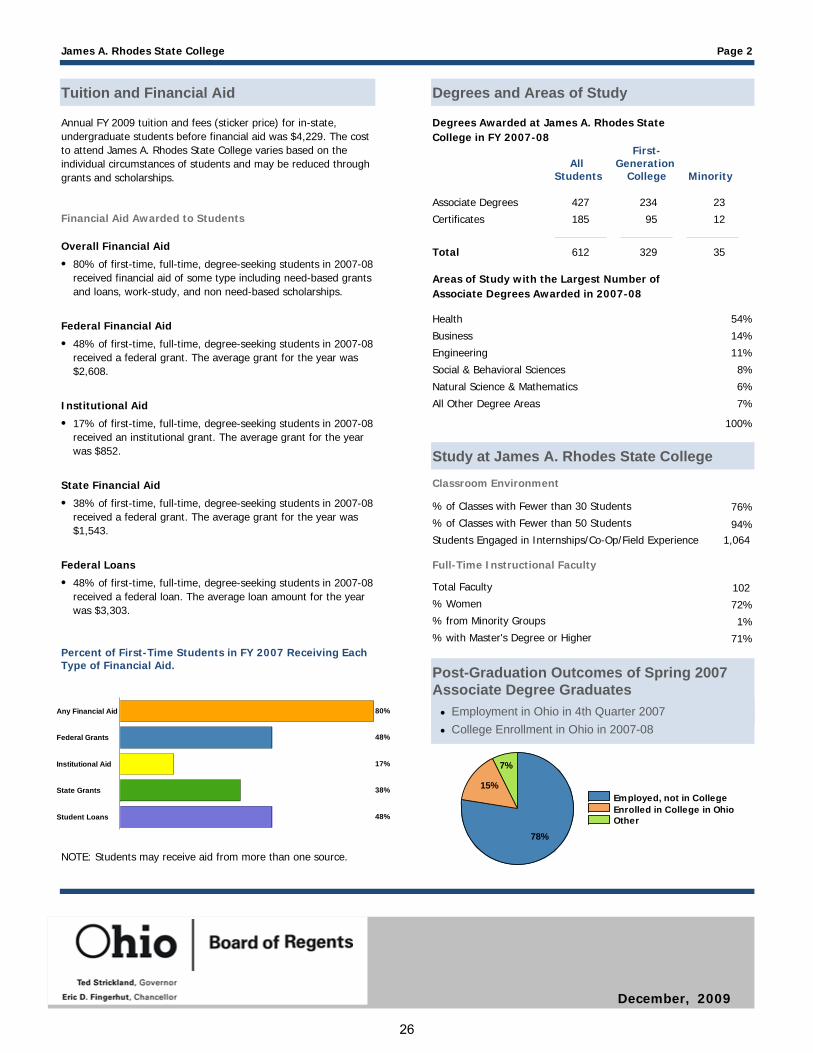
Any Financial Aid
427
Degrees and Areas of Study
Associate Degrees
185Certificates
James A. Rhodes State College Page 2
Tuition and Financial Aid
Financial Aid Awarded to Students
80% of first-time, full-time, degree-seeking students in 2007-08 received financial aid of some type including need-based grants and loans, work-study, and non need-based scholarships.
Annual FY 2009 tuition and fees (sticker price) for in-state, undergraduate students before financial aid was $4,229. The cost to attend James A. Rhodes State College varies based on the individual circumstances of students and may be reduced through grants and scholarships.
•
48% of first-time, full-time, degree-seeking students in 2007-08 received a federal grant. The average grant for the year was $2,608.
•
17% of first-time, full-time, degree-seeking students in 2007-08 received an institutional grant. The average grant for the year was $852.
•
Overall Financial Aid
Federal Financial Aid
Institutional Aid
48% of first-time, full-time, degree-seeking students in 2007-08 received a federal loan. The average loan amount for the year was $3,303.
•Federal Loans
Percent of First-Time Students in FY 2007 Receiving Each Type of Financial Aid.
Degrees Awarded at James A. Rhodes State College in FY 2007-08
Total 612
234 23
95 12
329 35
All
Students
First-Generation
College
Minority
Areas of Study with the Largest Number of Associate Degrees Awarded in 2007-08
Health 54%
Business 14%
Engineering 11%
Social & Behavioral Sciences 8%
Natural Science & Mathematics 6%
All Other Degree Areas 7%
100%
NOTE: Students may receive aid from more than one source.
38% of first-time, full-time, degree-seeking students in 2007-08 received a federal grant. The average grant for the year was $1,543.
•State Financial Aid
Study at James A. Rhodes State College
Classroom Environment
% of Classes with Fewer than 30 Students 76%
94%% of Classes with Fewer than 50 Students
Full-Time Instructional Faculty
Total Faculty
% Women
% from Minority Groups
% with Master's Degree or Higher
102
72%
1%
71%
Students Engaged in Internships/Co-Op/Field Experience 1,064
College Enrollment in Ohio in 2007-08•Employment in Ohio in 4th Quarter 2007•
December, 2009
26
62%
0% 10% 20% 30% 40% 50% 60% 70%
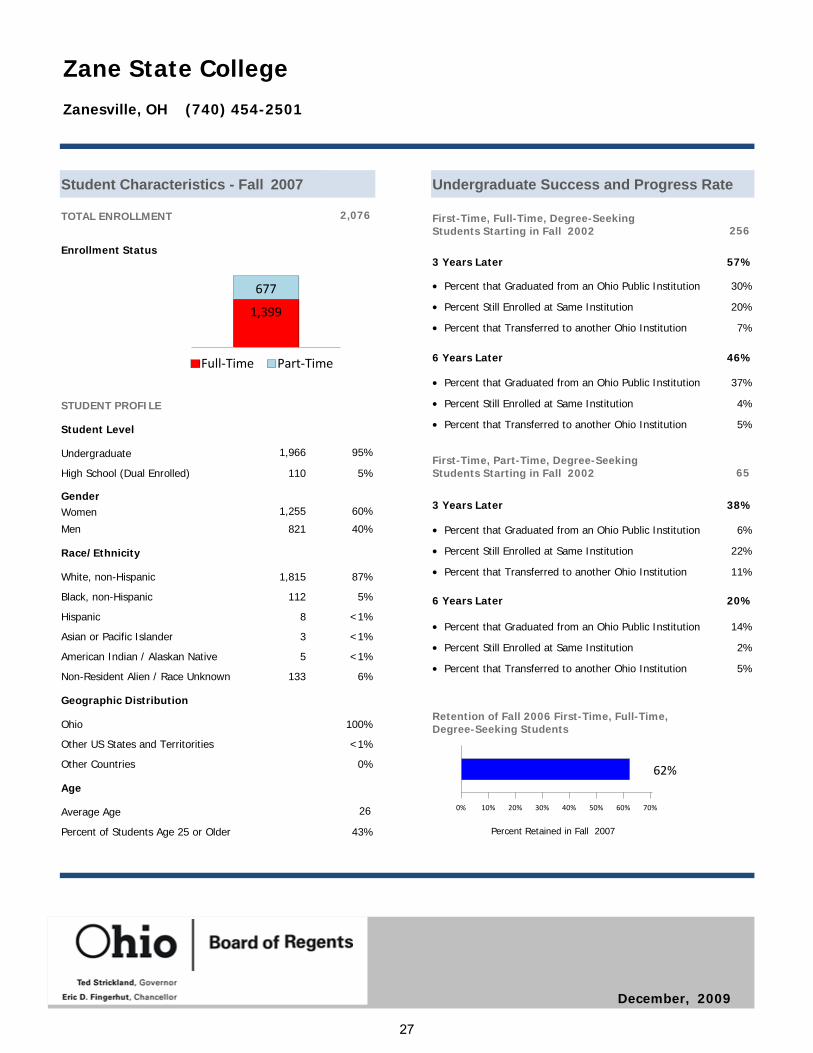
2,076TOTAL ENROLLMENT
Gender
Student Characteristics - Fall 2007
1,255Women
821Men
87%
Race/Ethnicity
White, non-Hispanic
5%Black, non-Hispanic
<1%Hispanic
<1%Asian or Pacific Islander
<1%American Indian / Alaskan Native
6%Non-Resident Alien / Race Unknown
Ohio
60%
100%
Geographic Distribution
40%
1,815
112
8
3
5
133
Other US States and Territorities <1%
Other Countries 0%
Student Level
1,966Undergraduate
110High School (Dual Enrolled)
95%
5%
Age
Average Age
Percent of Students Age 25 or Older
26
43%
Zane State College
Undergraduate Success and Progress Rate
256
Percent that Graduated from an Ohio Public Institution
3 Years Later
•Percent Still Enrolled at Same Institution•
30%
20%
Percent that Transferred to another Ohio Institution• 7%
Percent that Graduated from an Ohio Public Institution
6 Years Later
•Percent Still Enrolled at Same Institution•
37%
4%
Percent that Transferred to another Ohio Institution• 5%
65
Percent that Graduated from an Ohio Public Institution
3 Years Later
•Percent Still Enrolled at Same Institution•
6%
22%
Percent that Transferred to another Ohio Institution• 11%
Percent that Graduated from an Ohio Public Institution
6 Years Later
•Percent Still Enrolled at Same Institution•
14%
2%
Percent that Transferred to another Ohio Institution• 5%
57%
46%
38%
20%
Full‐Time Part‐Time
1,399
677
Enrollment Status
STUDENT PROFILE
Zanesville, OH (740) 454-2501
Retention of Fall 2006 First-Time, Full-Time, Degree-Seeking Students
Percent Retained in Fall 2007
First-Time, Full-Time, Degree-Seeking Students Starting in Fall 2002
First-Time, Part-Time, Degree-Seeking Students Starting in Fall 2002
December, 2009
27
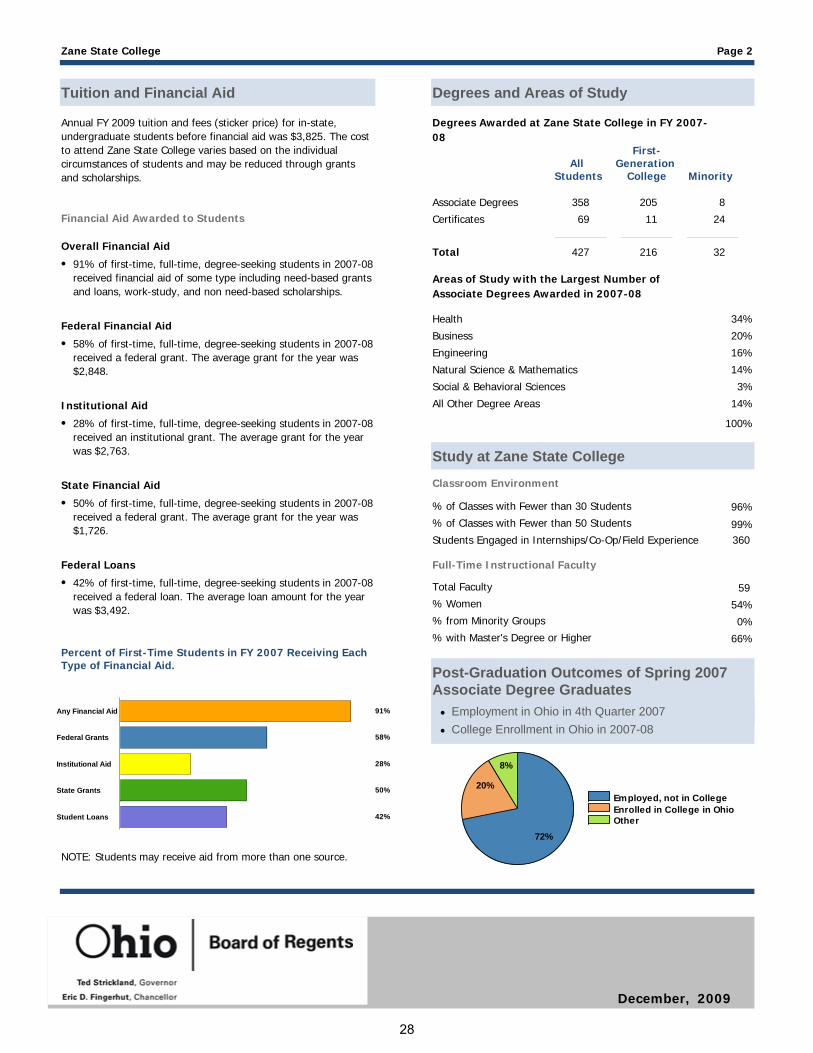
Employed, not in CollegeEnrolled in College in OhioOther
72%
20%
8%
Post-Graduation Outcomes of Spring 2007 Associate Degree Graduates
91%
58%
28%
50%
42%Student Loans
State Grants
Institutional Aid
Federal Grants
Any Financial Aid
358
Degrees and Areas of Study
Associate Degrees
69Certificates
Zane State College Page 2
Tuition and Financial Aid
Financial Aid Awarded to Students
91% of first-time, full-time, degree-seeking students in 2007-08 received financial aid of some type including need-based grants and loans, work-study, and non need-based scholarships.
Annual FY 2009 tuition and fees (sticker price) for in-state, undergraduate students before financial aid was $3,825. The cost to attend Zane State College varies based on the individual circumstances of students and may be reduced through grants and scholarships.
•
58% of first-time, full-time, degree-seeking students in 2007-08 received a federal grant. The average grant for the year was $2,848.
•
28% of first-time, full-time, degree-seeking students in 2007-08 received an institutional grant. The average grant for the year was $2,763.
•
Overall Financial Aid
Federal Financial Aid
Institutional Aid
42% of first-time, full-time, degree-seeking students in 2007-08 received a federal loan. The average loan amount for the year was $3,492.
•Federal Loans
Percent of First-Time Students in FY 2007 Receiving Each Type of Financial Aid.
Degrees Awarded at Zane State College in FY 2007-08
Total 427
205 8
11 24
216 32
All
Students
First-Generation
College
Minority
Areas of Study with the Largest Number of Associate Degrees Awarded in 2007-08
Health 34%
Business 20%
Engineering 16%
Natural Science & Mathematics 14%
Social & Behavioral Sciences 3%
All Other Degree Areas 14%
100%
NOTE: Students may receive aid from more than one source.
50% of first-time, full-time, degree-seeking students in 2007-08 received a federal grant. The average grant for the year was $1,726.
•State Financial Aid
Study at Zane State College
Classroom Environment
% of Classes with Fewer than 30 Students 96%
99%% of Classes with Fewer than 50 Students
Full-Time Instructional Faculty
Total Faculty
% Women
% from Minority Groups
% with Master's Degree or Higher
59
54%
0%
66%
Students Engaged in Internships/Co-Op/Field Experience 360
College Enrollment in Ohio in 2007-08•Employment in Ohio in 4th Quarter 2007•
December, 2009
28
52%
0% 10% 20% 30% 40% 50% 60% 70%
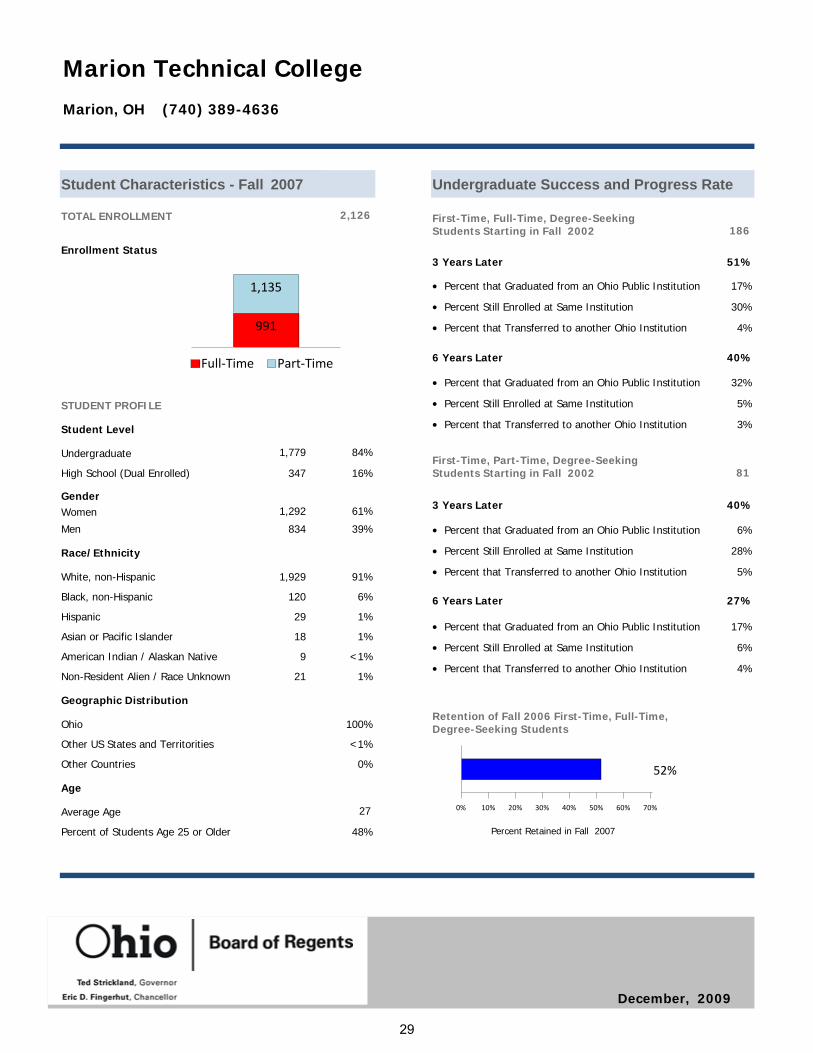
2,126TOTAL ENROLLMENT
Gender
Student Characteristics - Fall 2007
1,292Women
834Men
91%
Race/Ethnicity
White, non-Hispanic
6%Black, non-Hispanic
1%Hispanic
1%Asian or Pacific Islander
<1%American Indian / Alaskan Native
1%Non-Resident Alien / Race Unknown
Ohio
61%
100%
Geographic Distribution
39%
1,929
120
29
18
9
21
Other US States and Territorities <1%
Other Countries 0%
Student Level
1,779Undergraduate
347High School (Dual Enrolled)
84%
16%
Age
Average Age
Percent of Students Age 25 or Older
27
48%
Marion Technical College
Undergraduate Success and Progress Rate
186
Percent that Graduated from an Ohio Public Institution
3 Years Later
•Percent Still Enrolled at Same Institution•
17%
30%
Percent that Transferred to another Ohio Institution• 4%
Percent that Graduated from an Ohio Public Institution
6 Years Later
•Percent Still Enrolled at Same Institution•
32%
5%
Percent that Transferred to another Ohio Institution• 3%
81
Percent that Graduated from an Ohio Public Institution
3 Years Later
•Percent Still Enrolled at Same Institution•
6%
28%
Percent that Transferred to another Ohio Institution• 5%
Percent that Graduated from an Ohio Public Institution
6 Years Later
•Percent Still Enrolled at Same Institution•
17%
6%
Percent that Transferred to another Ohio Institution• 4%
51%
40%
40%
27%
Full‐Time Part‐Time
991
1,135
Enrollment Status
STUDENT PROFILE
Marion, OH (740) 389-4636
Retention of Fall 2006 First-Time, Full-Time, Degree-Seeking Students
Percent Retained in Fall 2007
First-Time, Full-Time, Degree-Seeking Students Starting in Fall 2002
First-Time, Part-Time, Degree-Seeking Students Starting in Fall 2002
December, 2009
29
Employed, not in CollegeEnrolled in College in OhioOther
80%
7%13%
Post-Graduation Outcomes of Spring 2007 Associate Degree Graduates
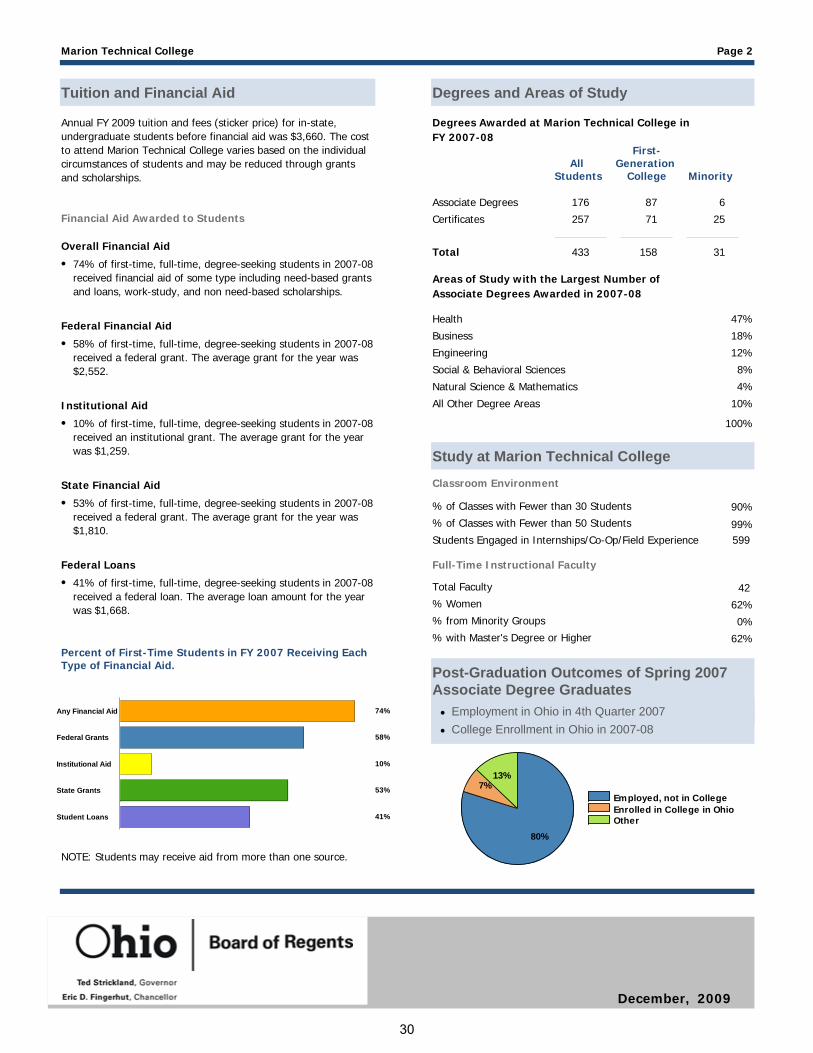
74%
58%
10%
53%
41%Student Loans
State Grants
Institutional Aid
Federal Grants
Any Financial Aid
176
Degrees and Areas of Study
Associate Degrees
257Certificates
Marion Technical College Page 2
Tuition and Financial Aid
Financial Aid Awarded to Students
74% of first-time, full-time, degree-seeking students in 2007-08 received financial aid of some type including need-based grants and loans, work-study, and non need-based scholarships.
Annual FY 2009 tuition and fees (sticker price) for in-state, undergraduate students before financial aid was $3,660. The cost to attend Marion Technical College varies based on the individual circumstances of students and may be reduced through grants and scholarships.
•
58% of first-time, full-time, degree-seeking students in 2007-08 received a federal grant. The average grant for the year was $2,552.
•
10% of first-time, full-time, degree-seeking students in 2007-08 received an institutional grant. The average grant for the year was $1,259.
•
Overall Financial Aid
Federal Financial Aid
Institutional Aid
41% of first-time, full-time, degree-seeking students in 2007-08 received a federal loan. The average loan amount for the year was $1,668.
•Federal Loans
Percent of First-Time Students in FY 2007 Receiving Each Type of Financial Aid.
Degrees Awarded at Marion Technical College in FY 2007-08
Total 433
87 6
71 25
158 31
All
Students
First-Generation
College
Minority
Areas of Study with the Largest Number of Associate Degrees Awarded in 2007-08
Health 47%
Business 18%
Engineering 12%
Social & Behavioral Sciences 8%
Natural Science & Mathematics 4%
All Other Degree Areas 10%
100%
NOTE: Students may receive aid from more than one source.
53% of first-time, full-time, degree-seeking students in 2007-08 received a federal grant. The average grant for the year was $1,810.
•State Financial Aid
Study at Marion Technical College
Classroom Environment
% of Classes with Fewer than 30 Students 90%
99%% of Classes with Fewer than 50 Students
Full-Time Instructional Faculty
Total Faculty
% Women
% from Minority Groups
% with Master's Degree or Higher
42
62%
0%
62%
Students Engaged in Internships/Co-Op/Field Experience 599
College Enrollment in Ohio in 2007-08•Employment in Ohio in 4th Quarter 2007•
December, 2009
30

60%
0% 10% 20% 30% 40% 50% 60% 70%
3,152TOTAL ENROLLMENT
Gender
Student Characteristics - Fall 2007
2,138Women
1,014Men
88%
Race/Ethnicity
White, non-Hispanic
5%Black, non-Hispanic
1%Hispanic
1%Asian or Pacific Islander
<1%American Indian / Alaskan Native
5%Non-Resident Alien / Race Unknown
Ohio
68%
100%
Geographic Distribution
32%
2,765
160
35
26
14
152
Other US States and Territorities <1%
Other Countries 0%
Student Level
3,028Undergraduate
124High School (Dual Enrolled)
96%
4%
Age
Average Age
Percent of Students Age 25 or Older
26
43%
North Central State College
Undergraduate Success and Progress Rate
201
Percent that Graduated from an Ohio Public Institution
3 Years Later
•Percent Still Enrolled at Same Institution•
17%
28%
Percent that Transferred to another Ohio Institution• 8%
Percent that Graduated from an Ohio Public Institution
6 Years Later
•Percent Still Enrolled at Same Institution•
30%
9%
Percent that Transferred to another Ohio Institution• 4%
232
Percent that Graduated from an Ohio Public Institution
3 Years Later
•Percent Still Enrolled at Same Institution•
4%
33%
Percent that Transferred to another Ohio Institution• 9%
Percent that Graduated from an Ohio Public Institution
6 Years Later
•Percent Still Enrolled at Same Institution•
18%
10%
Percent that Transferred to another Ohio Institution• 3%
53%
43%
46%
31%
Full‐Time Part‐Time
1,095
2,057
Enrollment Status
STUDENT PROFILE
Mansfield, OH (419) 755-4800
Retention of Fall 2006 First-Time, Full-Time, Degree-Seeking Students
Percent Retained in Fall 2007
First-Time, Full-Time, Degree-Seeking Students Starting in Fall 2002
First-Time, Part-Time, Degree-Seeking Students Starting in Fall 2002
December, 2009
31
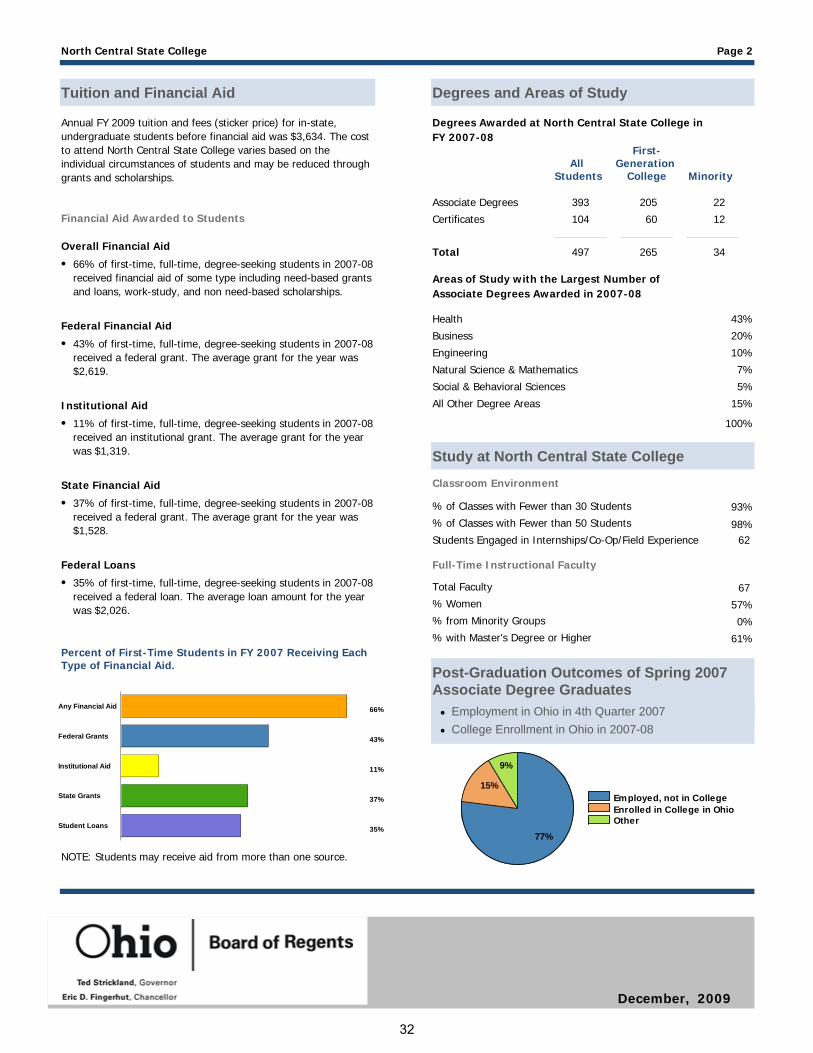
Employed, not in CollegeEnrolled in College in OhioOther
77%
15%
9%
Post-Graduation Outcomes of Spring 2007 Associate Degree Graduates
66%
43%
11%
37%
35%Student Loans
State Grants
Institutional Aid
Federal Grants
Any Financial Aid
393
Degrees and Areas of Study
Associate Degrees
104Certificates
North Central State College Page 2
Tuition and Financial Aid
Financial Aid Awarded to Students
66% of first-time, full-time, degree-seeking students in 2007-08 received financial aid of some type including need-based grants and loans, work-study, and non need-based scholarships.
Annual FY 2009 tuition and fees (sticker price) for in-state, undergraduate students before financial aid was $3,634. The cost to attend North Central State College varies based on the individual circumstances of students and may be reduced through grants and scholarships.
•
43% of first-time, full-time, degree-seeking students in 2007-08 received a federal grant. The average grant for the year was $2,619.
•
11% of first-time, full-time, degree-seeking students in 2007-08 received an institutional grant. The average grant for the year was $1,319.
•
Overall Financial Aid
Federal Financial Aid
Institutional Aid
35% of first-time, full-time, degree-seeking students in 2007-08 received a federal loan. The average loan amount for the year was $2,026.
•Federal Loans
Percent of First-Time Students in FY 2007 Receiving Each Type of Financial Aid.
Degrees Awarded at North Central State College in FY 2007-08
Total 497
205 22
60 12
265 34
All
Students
First-Generation
College
Minority
Areas of Study with the Largest Number of Associate Degrees Awarded in 2007-08
Health 43%
Business 20%
Engineering 10%
Natural Science & Mathematics 7%
Social & Behavioral Sciences 5%
All Other Degree Areas 15%
100%
NOTE: Students may receive aid from more than one source.
37% of first-time, full-time, degree-seeking students in 2007-08 received a federal grant. The average grant for the year was $1,528.
•State Financial Aid
Study at North Central State College
Classroom Environment
% of Classes with Fewer than 30 Students 93%
98%% of Classes with Fewer than 50 Students
Full-Time Instructional Faculty
Total Faculty
% Women
% from Minority Groups
% with Master's Degree or Higher
67
57%
0%
61%
Students Engaged in Internships/Co-Op/Field Experience 62
College Enrollment in Ohio in 2007-08•Employment in Ohio in 4th Quarter 2007•
December, 2009
32
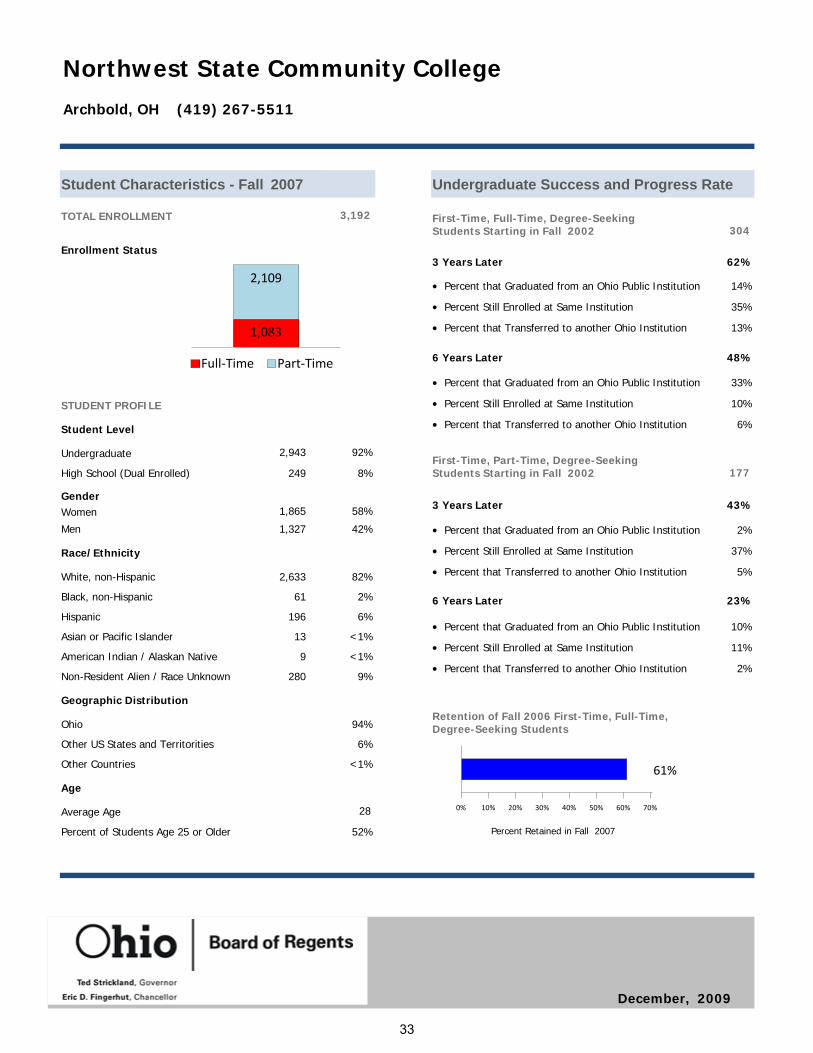
61%
0% 10% 20% 30% 40% 50% 60% 70%
3,192TOTAL ENROLLMENT
Gender
Student Characteristics - Fall 2007
1,865Women
1,327Men
82%
Race/Ethnicity
White, non-Hispanic
2%Black, non-Hispanic
6%Hispanic
<1%Asian or Pacific Islander
<1%American Indian / Alaskan Native
9%Non-Resident Alien / Race Unknown
Ohio
58%
94%
Geographic Distribution
42%
2,633
61
196
13
9
280
Other US States and Territorities 6%
Other Countries <1%
Student Level
2,943Undergraduate
249High School (Dual Enrolled)
92%
8%
Age
Average Age
Percent of Students Age 25 or Older
28
52%
Northwest State Community College
Undergraduate Success and Progress Rate
304
Percent that Graduated from an Ohio Public Institution
3 Years Later
•Percent Still Enrolled at Same Institution•
14%
35%
Percent that Transferred to another Ohio Institution• 13%
Percent that Graduated from an Ohio Public Institution
6 Years Later
•Percent Still Enrolled at Same Institution•
33%
10%
Percent that Transferred to another Ohio Institution• 6%
177
Percent that Graduated from an Ohio Public Institution
3 Years Later
•Percent Still Enrolled at Same Institution•
2%
37%
Percent that Transferred to another Ohio Institution• 5%
Percent that Graduated from an Ohio Public Institution
6 Years Later
•Percent Still Enrolled at Same Institution•
10%
11%
Percent that Transferred to another Ohio Institution• 2%
62%
48%
43%
23%
Full‐Time Part‐Time
1,083
2,109
Enrollment Status
STUDENT PROFILE
Archbold, OH (419) 267-5511
Retention of Fall 2006 First-Time, Full-Time, Degree-Seeking Students
Percent Retained in Fall 2007
First-Time, Full-Time, Degree-Seeking Students Starting in Fall 2002
First-Time, Part-Time, Degree-Seeking Students Starting in Fall 2002
December, 2009
33
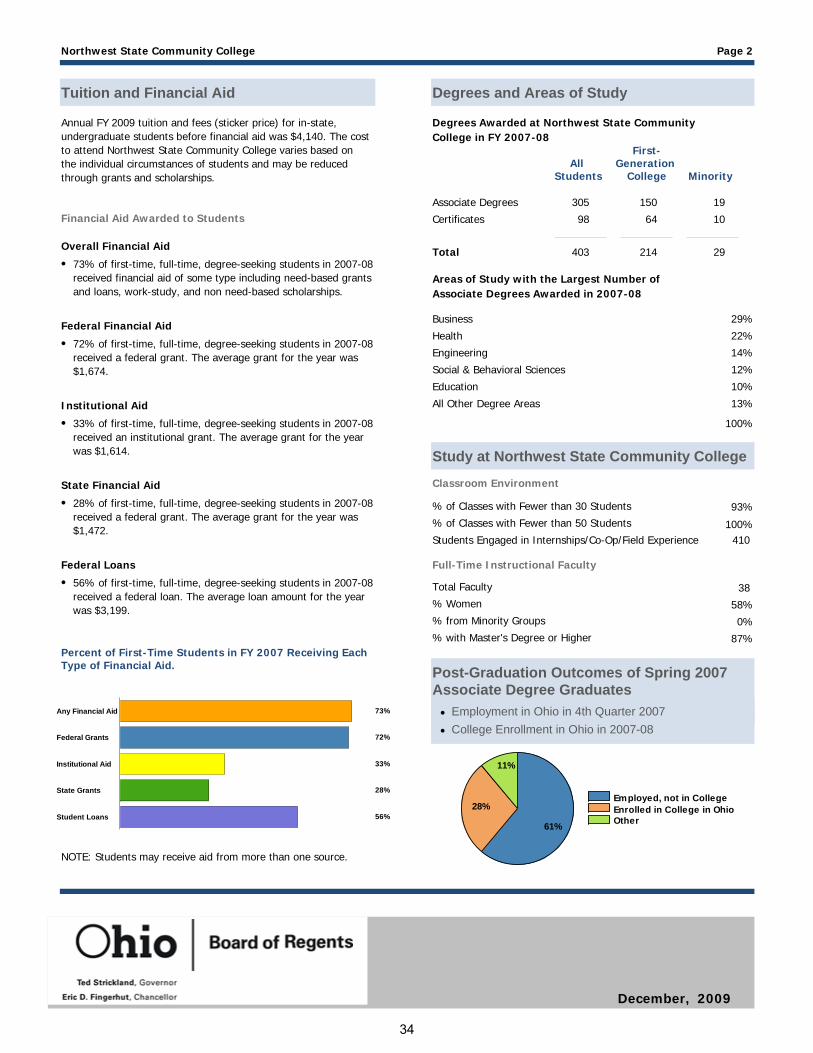
Employed, not in CollegeEnrolled in College in OhioOther61%
28%
11%
Post-Graduation Outcomes of Spring 2007 Associate Degree Graduates
73%
72%
33%
28%
56%Student Loans
State Grants
Institutional Aid
Federal Grants
Any Financial Aid
305
Degrees and Areas of Study
Associate Degrees
98Certificates
Northwest State Community College Page 2
Tuition and Financial Aid
Financial Aid Awarded to Students
73% of first-time, full-time, degree-seeking students in 2007-08 received financial aid of some type including need-based grants and loans, work-study, and non need-based scholarships.
Annual FY 2009 tuition and fees (sticker price) for in-state, undergraduate students before financial aid was $4,140. The cost to attend Northwest State Community College varies based on the individual circumstances of students and may be reduced through grants and scholarships.
•
72% of first-time, full-time, degree-seeking students in 2007-08 received a federal grant. The average grant for the year was $1,674.
•
33% of first-time, full-time, degree-seeking students in 2007-08 received an institutional grant. The average grant for the year was $1,614.
•
Overall Financial Aid
Federal Financial Aid
Institutional Aid
56% of first-time, full-time, degree-seeking students in 2007-08 received a federal loan. The average loan amount for the year was $3,199.
•Federal Loans
Percent of First-Time Students in FY 2007 Receiving Each Type of Financial Aid.
Degrees Awarded at Northwest State Community College in FY 2007-08
Total 403
150 19
64 10
214 29
All
Students
First-Generation
College
Minority
Areas of Study with the Largest Number of Associate Degrees Awarded in 2007-08
Business 29%
Health 22%
Engineering 14%
Social & Behavioral Sciences 12%
Education 10%
All Other Degree Areas 13%
100%
NOTE: Students may receive aid from more than one source.
28% of first-time, full-time, degree-seeking students in 2007-08 received a federal grant. The average grant for the year was $1,472.
•State Financial Aid
Study at Northwest State Community College
Classroom Environment
% of Classes with Fewer than 30 Students 93%
100%% of Classes with Fewer than 50 Students
Full-Time Instructional Faculty
Total Faculty
% Women
% from Minority Groups
% with Master's Degree or Higher
38
58%
0%
87%
Students Engaged in Internships/Co-Op/Field Experience 410
College Enrollment in Ohio in 2007-08•Employment in Ohio in 4th Quarter 2007•
December, 2009
34
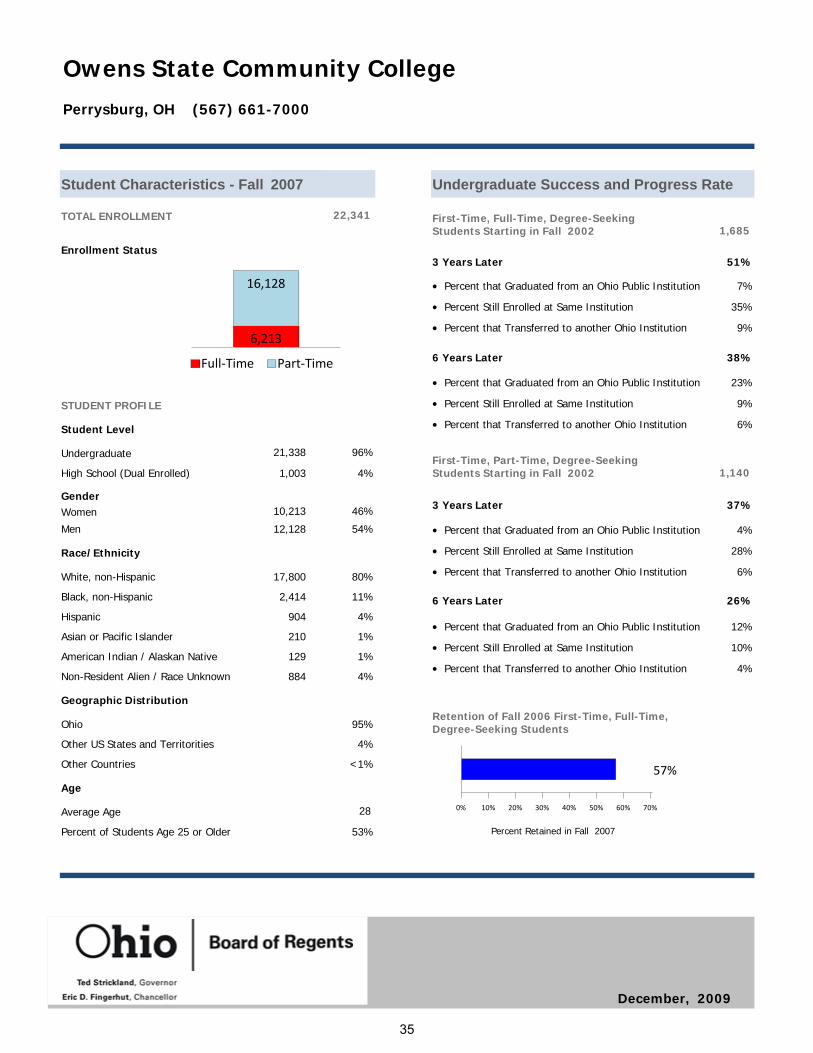
57%
0% 10% 20% 30% 40% 50% 60% 70%
22,341TOTAL ENROLLMENT
Gender
Student Characteristics - Fall 2007
10,213Women
12,128Men
80%
Race/Ethnicity
White, non-Hispanic
11%Black, non-Hispanic
4%Hispanic
1%Asian or Pacific Islander
1%American Indian / Alaskan Native
4%Non-Resident Alien / Race Unknown
Ohio
46%
95%
Geographic Distribution
54%
17,800
2,414
904
210
129
884
Other US States and Territorities 4%
Other Countries <1%
Student Level
21,338Undergraduate
1,003High School (Dual Enrolled)
96%
4%
Age
Average Age
Percent of Students Age 25 or Older
28
53%
Owens State Community College
Undergraduate Success and Progress Rate
1,685
Percent that Graduated from an Ohio Public Institution
3 Years Later
•Percent Still Enrolled at Same Institution•
7%
35%
Percent that Transferred to another Ohio Institution• 9%
Percent that Graduated from an Ohio Public Institution
6 Years Later
•Percent Still Enrolled at Same Institution•
23%
9%
Percent that Transferred to another Ohio Institution• 6%
1,140
Percent that Graduated from an Ohio Public Institution
3 Years Later
•Percent Still Enrolled at Same Institution•
4%
28%
Percent that Transferred to another Ohio Institution• 6%
Percent that Graduated from an Ohio Public Institution
6 Years Later
•Percent Still Enrolled at Same Institution•
12%
10%
Percent that Transferred to another Ohio Institution• 4%
51%
38%
37%
26%
Full‐Time Part‐Time
6,213
16,128
Enrollment Status
STUDENT PROFILE
Perrysburg, OH (567) 661-7000
Retention of Fall 2006 First-Time, Full-Time, Degree-Seeking Students
Percent Retained in Fall 2007
First-Time, Full-Time, Degree-Seeking Students Starting in Fall 2002
First-Time, Part-Time, Degree-Seeking Students Starting in Fall 2002
December, 2009
35
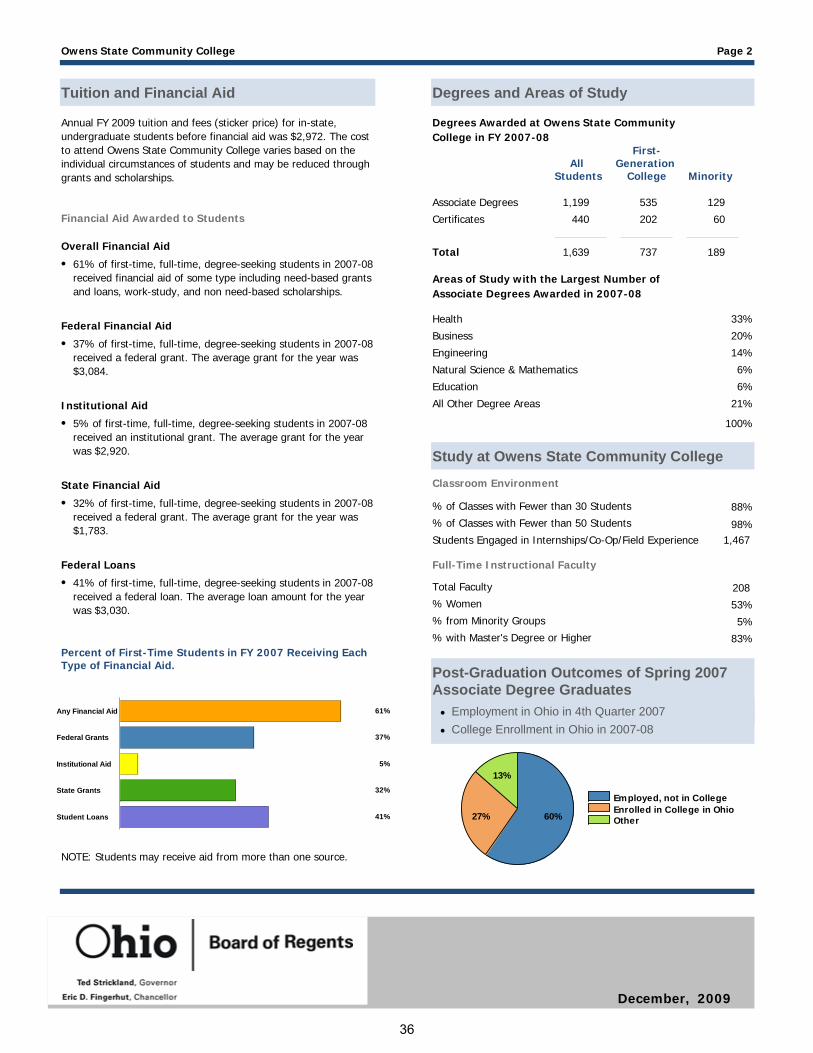
Employed, not in CollegeEnrolled in College in OhioOther60%27%
13%
Post-Graduation Outcomes of Spring 2007 Associate Degree Graduates
61%
37%
5%
32%
41%Student Loans
State Grants
Institutional Aid
Federal Grants
Any Financial Aid
1,199
Degrees and Areas of Study
Associate Degrees
440Certificates
Owens State Community College Page 2
Tuition and Financial Aid
Financial Aid Awarded to Students
61% of first-time, full-time, degree-seeking students in 2007-08 received financial aid of some type including need-based grants and loans, work-study, and non need-based scholarships.
Annual FY 2009 tuition and fees (sticker price) for in-state, undergraduate students before financial aid was $2,972. The cost to attend Owens State Community College varies based on the individual circumstances of students and may be reduced through grants and scholarships.
•
37% of first-time, full-time, degree-seeking students in 2007-08 received a federal grant. The average grant for the year was $3,084.
•
5% of first-time, full-time, degree-seeking students in 2007-08 received an institutional grant. The average grant for the year was $2,920.
•
Overall Financial Aid
Federal Financial Aid
Institutional Aid
41% of first-time, full-time, degree-seeking students in 2007-08 received a federal loan. The average loan amount for the year was $3,030.
•Federal Loans
Percent of First-Time Students in FY 2007 Receiving Each Type of Financial Aid.
Degrees Awarded at Owens State Community College in FY 2007-08
Total 1,639
535 129
202 60
737 189
All
Students
First-Generation
College
Minority
Areas of Study with the Largest Number of Associate Degrees Awarded in 2007-08
Health 33%
Business 20%
Engineering 14%
Natural Science & Mathematics 6%
Education 6%
All Other Degree Areas 21%
100%
NOTE: Students may receive aid from more than one source.
32% of first-time, full-time, degree-seeking students in 2007-08 received a federal grant. The average grant for the year was $1,783.
•State Financial Aid
Study at Owens State Community College
Classroom Environment
% of Classes with Fewer than 30 Students 88%
98%% of Classes with Fewer than 50 Students
Full-Time Instructional Faculty
Total Faculty
% Women
% from Minority Groups
% with Master's Degree or Higher
208
53%
5%
83%
Students Engaged in Internships/Co-Op/Field Experience 1,467
College Enrollment in Ohio in 2007-08•Employment in Ohio in 4th Quarter 2007•
December, 2009
36
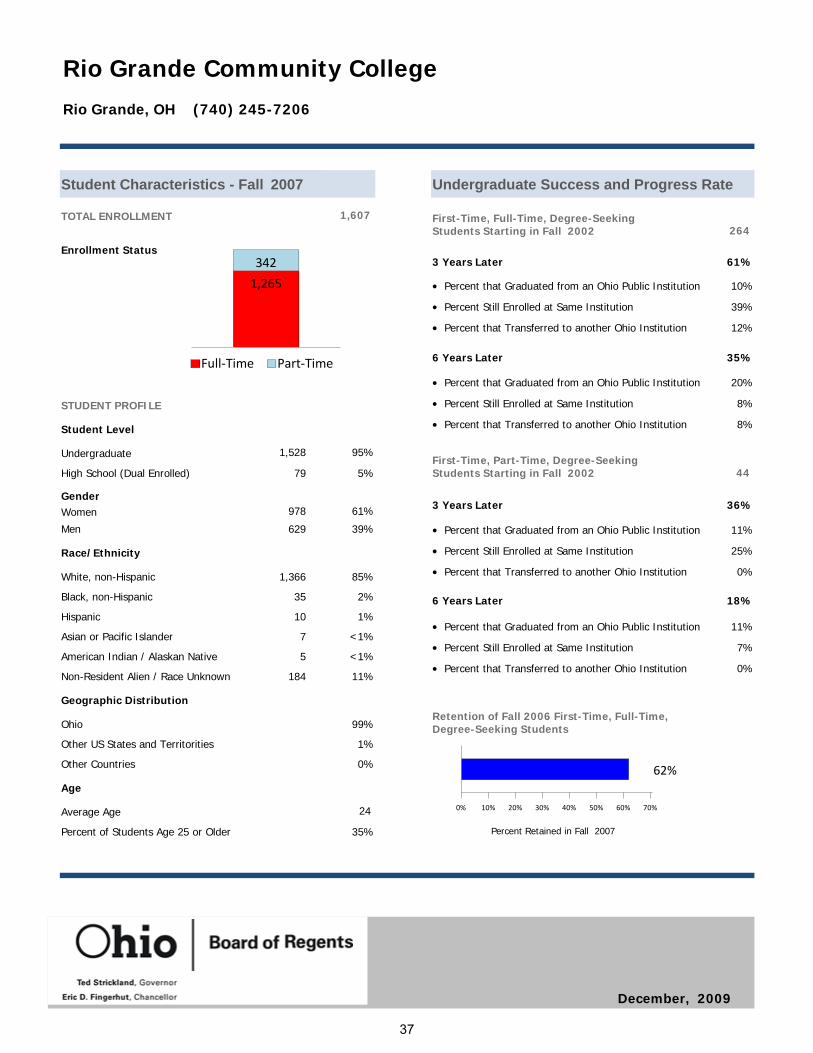
62%
0% 10% 20% 30% 40% 50% 60% 70%
1,607TOTAL ENROLLMENT
Gender
Student Characteristics - Fall 2007
978Women
629Men
85%
Race/Ethnicity
White, non-Hispanic
2%Black, non-Hispanic
1%Hispanic
<1%Asian or Pacific Islander
<1%American Indian / Alaskan Native
11%Non-Resident Alien / Race Unknown
Ohio
61%
99%
Geographic Distribution
39%
1,366
35
10
7
5
184
Other US States and Territorities 1%
Other Countries 0%
Student Level
1,528Undergraduate
79High School (Dual Enrolled)
95%
5%
Age
Average Age
Percent of Students Age 25 or Older
24
35%
Rio Grande Community College
Undergraduate Success and Progress Rate
264
Percent that Graduated from an Ohio Public Institution
3 Years Later
•Percent Still Enrolled at Same Institution•
10%
39%
Percent that Transferred to another Ohio Institution• 12%
Percent that Graduated from an Ohio Public Institution
6 Years Later
•Percent Still Enrolled at Same Institution•
20%
8%
Percent that Transferred to another Ohio Institution• 8%
44
Percent that Graduated from an Ohio Public Institution
3 Years Later
•Percent Still Enrolled at Same Institution•
11%
25%
Percent that Transferred to another Ohio Institution• 0%
Percent that Graduated from an Ohio Public Institution
6 Years Later
•Percent Still Enrolled at Same Institution•
11%
7%
Percent that Transferred to another Ohio Institution• 0%
61%
35%
36%
18%
Full‐Time Part‐Time
1,265
342Enrollment Status
STUDENT PROFILE
Rio Grande, OH (740) 245-7206
Retention of Fall 2006 First-Time, Full-Time, Degree-Seeking Students
Percent Retained in Fall 2007
First-Time, Full-Time, Degree-Seeking Students Starting in Fall 2002
First-Time, Part-Time, Degree-Seeking Students Starting in Fall 2002
December, 2009
37
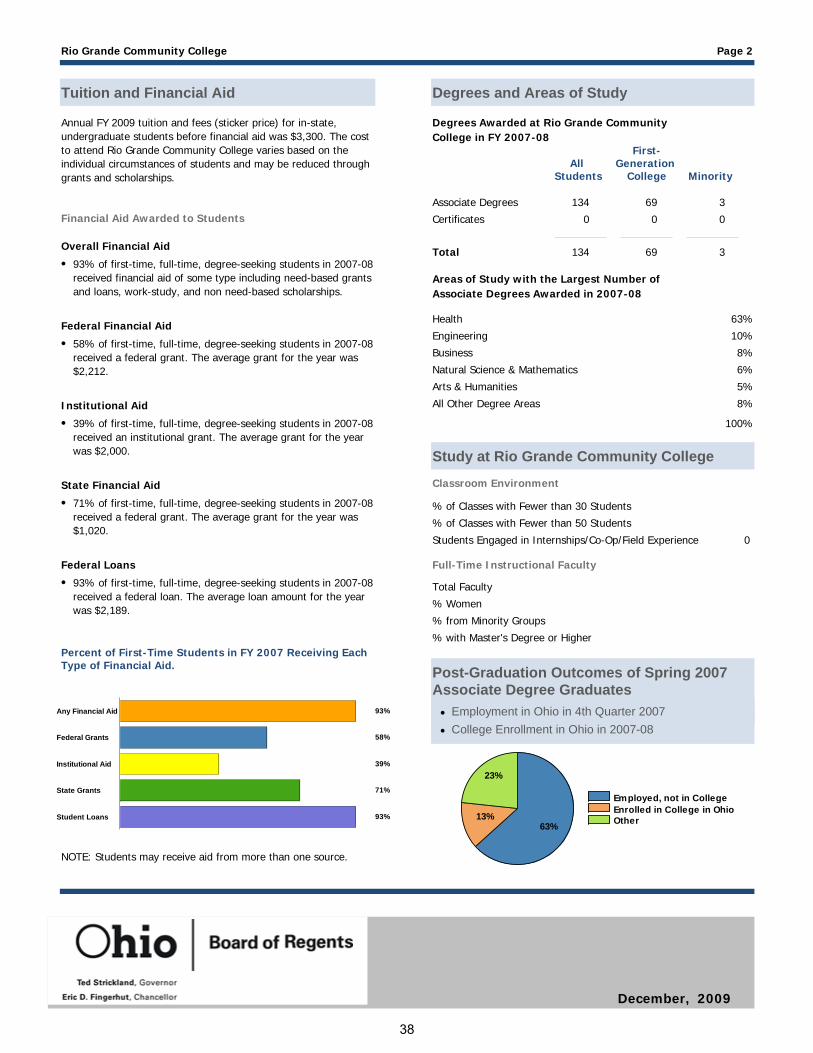
Employed, not in CollegeEnrolled in College in OhioOther63%
13%
23%
Post-Graduation Outcomes of Spring 2007 Associate Degree Graduates
93%
58%
39%
71%
93%Student Loans
State Grants
Institutional Aid
Federal Grants
Any Financial Aid
134
Degrees and Areas of Study
Associate Degrees
0Certificates
Rio Grande Community College Page 2
Tuition and Financial Aid
Financial Aid Awarded to Students
93% of first-time, full-time, degree-seeking students in 2007-08 received financial aid of some type including need-based grants and loans, work-study, and non need-based scholarships.
Annual FY 2009 tuition and fees (sticker price) for in-state, undergraduate students before financial aid was $3,300. The cost to attend Rio Grande Community College varies based on the individual circumstances of students and may be reduced through grants and scholarships.
•
58% of first-time, full-time, degree-seeking students in 2007-08 received a federal grant. The average grant for the year was $2,212.
•
39% of first-time, full-time, degree-seeking students in 2007-08 received an institutional grant. The average grant for the year was $2,000.
•
Overall Financial Aid
Federal Financial Aid
Institutional Aid
93% of first-time, full-time, degree-seeking students in 2007-08 received a federal loan. The average loan amount for the year was $2,189.
•Federal Loans
Percent of First-Time Students in FY 2007 Receiving Each Type of Financial Aid.
Degrees Awarded at Rio Grande Community College in FY 2007-08
Total 134
69 3
0 0
69 3
All
Students
First-Generation
College
Minority
Areas of Study with the Largest Number of Associate Degrees Awarded in 2007-08
Health 63%
Engineering 10%
Business 8%
Natural Science & Mathematics 6%
Arts & Humanities 5%
All Other Degree Areas 8%
100%
NOTE: Students may receive aid from more than one source.
71% of first-time, full-time, degree-seeking students in 2007-08 received a federal grant. The average grant for the year was $1,020.
•State Financial Aid
Study at Rio Grande Community College
Classroom Environment
% of Classes with Fewer than 30 Students
% of Classes with Fewer than 50 Students
Full-Time Instructional Faculty
Total Faculty
% Women
% from Minority Groups
% with Master's Degree or Higher
Students Engaged in Internships/Co-Op/Field Experience 0
College Enrollment in Ohio in 2007-08•Employment in Ohio in 4th Quarter 2007•
December, 2009
38
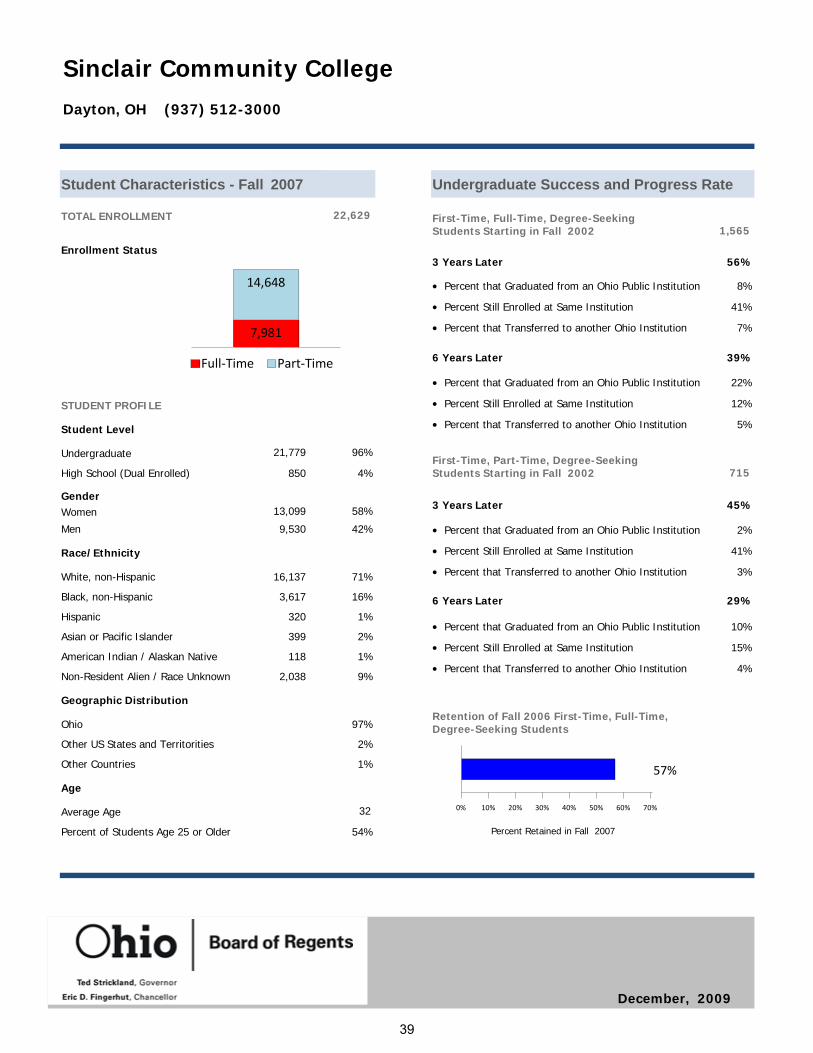
57%
0% 10% 20% 30% 40% 50% 60% 70%
22,629TOTAL ENROLLMENT
Gender
Student Characteristics - Fall 2007
13,099Women
9,530Men
71%
Race/Ethnicity
White, non-Hispanic
16%Black, non-Hispanic
1%Hispanic
2%Asian or Pacific Islander
1%American Indian / Alaskan Native
9%Non-Resident Alien / Race Unknown
Ohio
58%
97%
Geographic Distribution
42%
16,137
3,617
320
399
118
2,038
Other US States and Territorities 2%
Other Countries 1%
Student Level
21,779Undergraduate
850High School (Dual Enrolled)
96%
4%
Age
Average Age
Percent of Students Age 25 or Older
32
54%
Sinclair Community College
Undergraduate Success and Progress Rate
1,565
Percent that Graduated from an Ohio Public Institution
3 Years Later
•Percent Still Enrolled at Same Institution•
8%
41%
Percent that Transferred to another Ohio Institution• 7%
Percent that Graduated from an Ohio Public Institution
6 Years Later
•Percent Still Enrolled at Same Institution•
22%
12%
Percent that Transferred to another Ohio Institution• 5%
715
Percent that Graduated from an Ohio Public Institution
3 Years Later
•Percent Still Enrolled at Same Institution•
2%
41%
Percent that Transferred to another Ohio Institution• 3%
Percent that Graduated from an Ohio Public Institution
6 Years Later
•Percent Still Enrolled at Same Institution•
10%
15%
Percent that Transferred to another Ohio Institution• 4%
56%
39%
45%
29%
Full‐Time Part‐Time
7,981
14,648
Enrollment Status
STUDENT PROFILE
Dayton, OH (937) 512-3000
Retention of Fall 2006 First-Time, Full-Time, Degree-Seeking Students
Percent Retained in Fall 2007
First-Time, Full-Time, Degree-Seeking Students Starting in Fall 2002
First-Time, Part-Time, Degree-Seeking Students Starting in Fall 2002
December, 2009
39
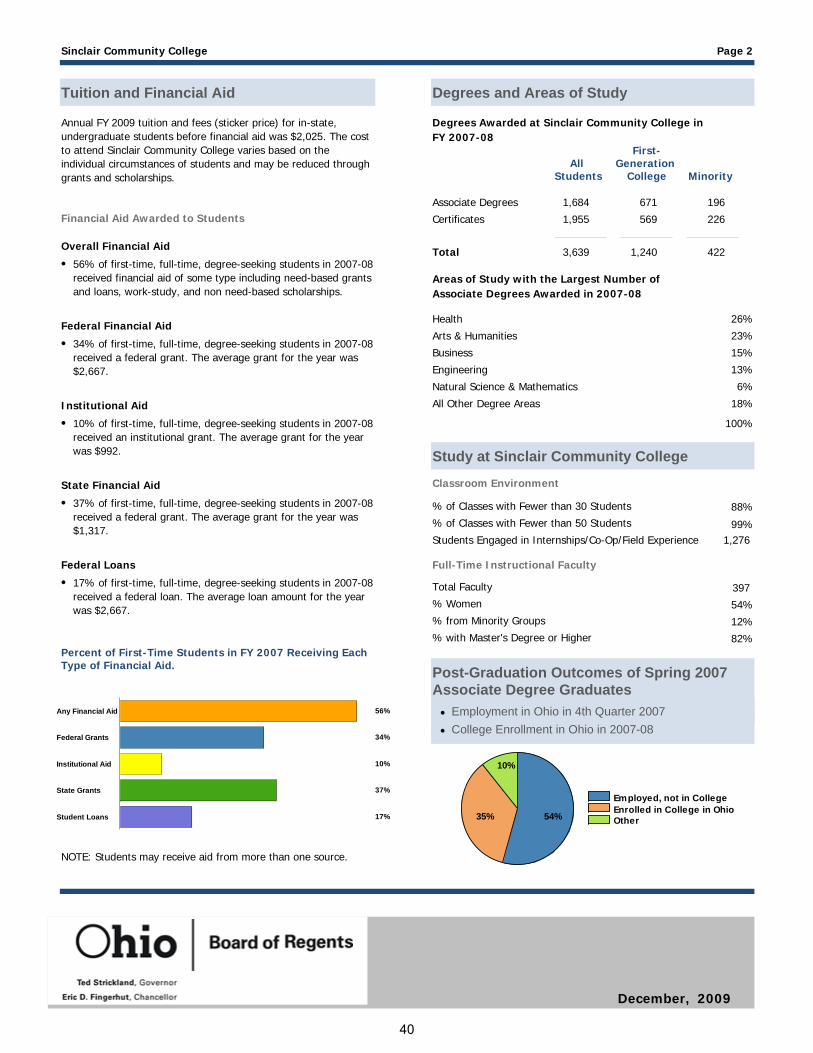
Employed, not in CollegeEnrolled in College in OhioOther54%35%
10%
Post-Graduation Outcomes of Spring 2007 Associate Degree Graduates
56%
34%
10%
37%
17%Student Loans
State Grants
Institutional Aid
Federal Grants
Any Financial Aid
1,684
Degrees and Areas of Study
Associate Degrees
1,955Certificates
Sinclair Community College Page 2
Tuition and Financial Aid
Financial Aid Awarded to Students
56% of first-time, full-time, degree-seeking students in 2007-08 received financial aid of some type including need-based grants and loans, work-study, and non need-based scholarships.
Annual FY 2009 tuition and fees (sticker price) for in-state, undergraduate students before financial aid was $2,025. The cost to attend Sinclair Community College varies based on the individual circumstances of students and may be reduced through grants and scholarships.
•
34% of first-time, full-time, degree-seeking students in 2007-08 received a federal grant. The average grant for the year was $2,667.
•
10% of first-time, full-time, degree-seeking students in 2007-08 received an institutional grant. The average grant for the year was $992.
•
Overall Financial Aid
Federal Financial Aid
Institutional Aid
17% of first-time, full-time, degree-seeking students in 2007-08 received a federal loan. The average loan amount for the year was $2,667.
•Federal Loans
Percent of First-Time Students in FY 2007 Receiving Each Type of Financial Aid.
Degrees Awarded at Sinclair Community College in FY 2007-08
Total 3,639
671 196
569 226
1,240 422
All
Students
First-Generation
College
Minority
Areas of Study with the Largest Number of Associate Degrees Awarded in 2007-08
Health 26%
Arts & Humanities 23%
Business 15%
Engineering 13%
Natural Science & Mathematics 6%
All Other Degree Areas 18%
100%
NOTE: Students may receive aid from more than one source.
37% of first-time, full-time, degree-seeking students in 2007-08 received a federal grant. The average grant for the year was $1,317.
•State Financial Aid
Study at Sinclair Community College
Classroom Environment
% of Classes with Fewer than 30 Students 88%
99%% of Classes with Fewer than 50 Students
Full-Time Instructional Faculty
Total Faculty
% Women
% from Minority Groups
% with Master's Degree or Higher
397
54%
12%
82%
Students Engaged in Internships/Co-Op/Field Experience 1,276
College Enrollment in Ohio in 2007-08•Employment in Ohio in 4th Quarter 2007•
December, 2009
40
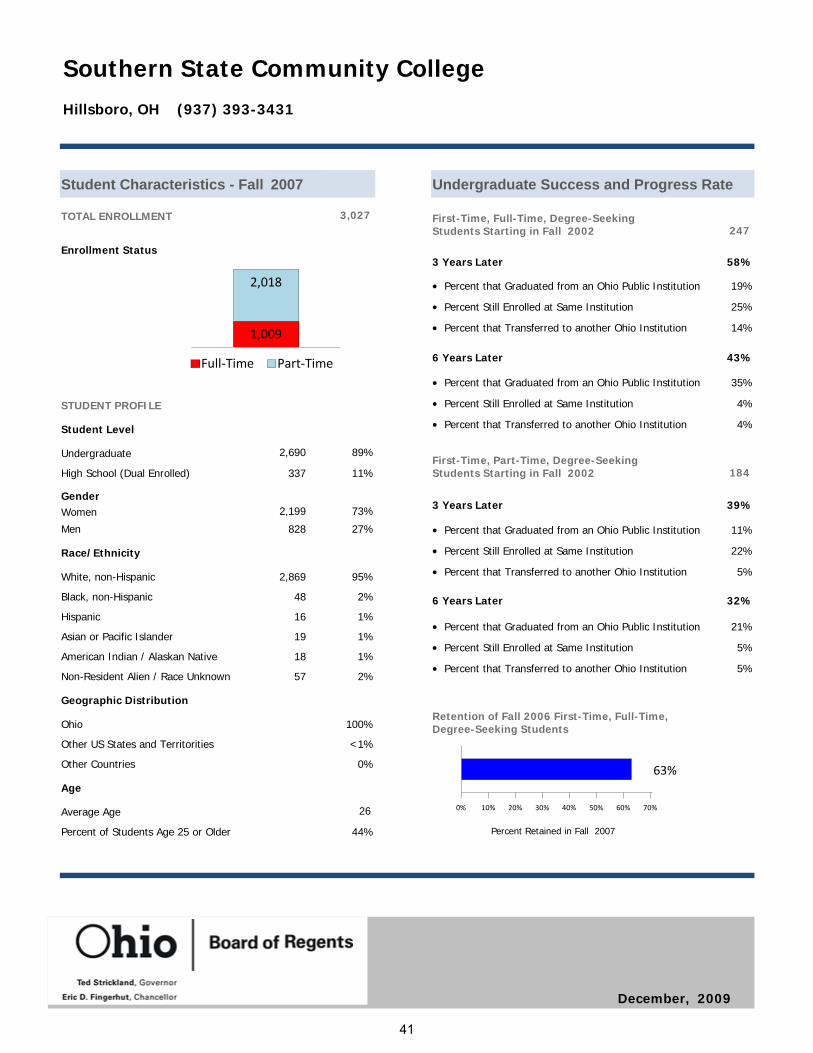
63%
0% 10% 20% 30% 40% 50% 60% 70%
3,027TOTAL ENROLLMENT
Gender
Student Characteristics - Fall 2007
2,199Women
828Men
95%
Race/Ethnicity
White, non-Hispanic
2%Black, non-Hispanic
1%Hispanic
1%Asian or Pacific Islander
1%American Indian / Alaskan Native
2%Non-Resident Alien / Race Unknown
Ohio
73%
100%
Geographic Distribution
27%
2,869
48
16
19
18
57
Other US States and Territorities <1%
Other Countries 0%
Student Level
2,690Undergraduate
337High School (Dual Enrolled)
89%
11%
Age
Average Age
Percent of Students Age 25 or Older
26
44%
Southern State Community College
Undergraduate Success and Progress Rate
247
Percent that Graduated from an Ohio Public Institution
3 Years Later
•Percent Still Enrolled at Same Institution•
19%
25%
Percent that Transferred to another Ohio Institution• 14%
Percent that Graduated from an Ohio Public Institution
6 Years Later
•Percent Still Enrolled at Same Institution•
35%
4%
Percent that Transferred to another Ohio Institution• 4%
184
Percent that Graduated from an Ohio Public Institution
3 Years Later
•Percent Still Enrolled at Same Institution•
11%
22%
Percent that Transferred to another Ohio Institution• 5%
Percent that Graduated from an Ohio Public Institution
6 Years Later
•Percent Still Enrolled at Same Institution•
21%
5%
Percent that Transferred to another Ohio Institution• 5%
58%
43%
39%
32%
Full‐Time Part‐Time
1,009
2,018
Enrollment Status
STUDENT PROFILE
Hillsboro, OH (937) 393-3431
Retention of Fall 2006 First-Time, Full-Time, Degree-Seeking Students
Percent Retained in Fall 2007
First-Time, Full-Time, Degree-Seeking Students Starting in Fall 2002
First-Time, Part-Time, Degree-Seeking Students Starting in Fall 2002
December, 2009
41
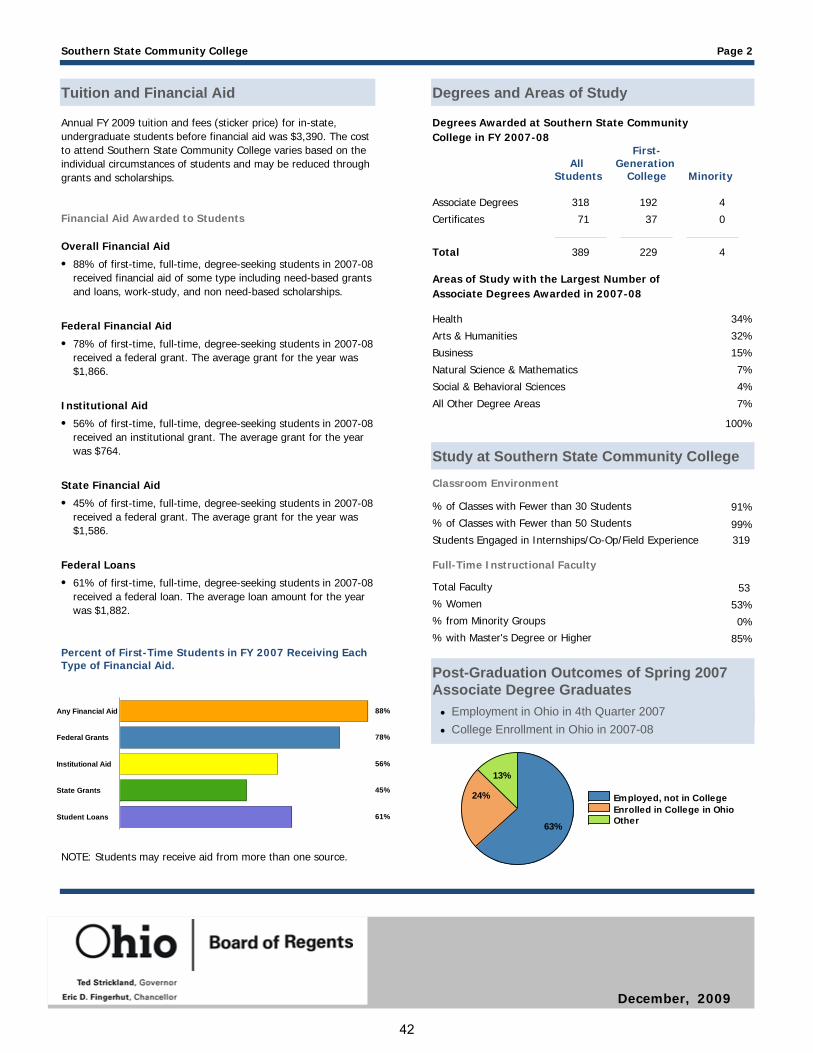
Employed, not in CollegeEnrolled in College in OhioOther63%
24%
13%
Post-Graduation Outcomes of Spring 2007 Associate Degree Graduates
88%
78%
56%
45%
61%Student Loans
State Grants
Institutional Aid
Federal Grants
Any Financial Aid
318
Degrees and Areas of Study
Associate Degrees
71Certificates
Southern State Community College Page 2
Tuition and Financial Aid
Financial Aid Awarded to Students
88% of first-time, full-time, degree-seeking students in 2007-08 received financial aid of some type including need-based grants and loans, work-study, and non need-based scholarships.
Annual FY 2009 tuition and fees (sticker price) for in-state, undergraduate students before financial aid was $3,390. The cost to attend Southern State Community College varies based on the individual circumstances of students and may be reduced through grants and scholarships.
•
78% of first-time, full-time, degree-seeking students in 2007-08 received a federal grant. The average grant for the year was $1,866.
•
56% of first-time, full-time, degree-seeking students in 2007-08 received an institutional grant. The average grant for the year was $764.
•
Overall Financial Aid
Federal Financial Aid
Institutional Aid
61% of first-time, full-time, degree-seeking students in 2007-08 received a federal loan. The average loan amount for the year was $1,882.
•Federal Loans
Percent of First-Time Students in FY 2007 Receiving Each Type of Financial Aid.
Degrees Awarded at Southern State Community College in FY 2007-08
Total 389
192 4
37 0
229 4
All
Students
First-Generation
College
Minority
Areas of Study with the Largest Number of Associate Degrees Awarded in 2007-08
Health 34%
Arts & Humanities 32%
Business 15%
Natural Science & Mathematics 7%
Social & Behavioral Sciences 4%
All Other Degree Areas 7%
100%
NOTE: Students may receive aid from more than one source.
45% of first-time, full-time, degree-seeking students in 2007-08 received a federal grant. The average grant for the year was $1,586.
•State Financial Aid
Study at Southern State Community College
Classroom Environment
% of Classes with Fewer than 30 Students 91%
99%% of Classes with Fewer than 50 Students
Full-Time Instructional Faculty
Total Faculty
% Women
% from Minority Groups
% with Master's Degree or Higher
53
53%
0%
85%
Students Engaged in Internships/Co-Op/Field Experience 319
College Enrollment in Ohio in 2007-08•Employment in Ohio in 4th Quarter 2007•
December, 2009
42
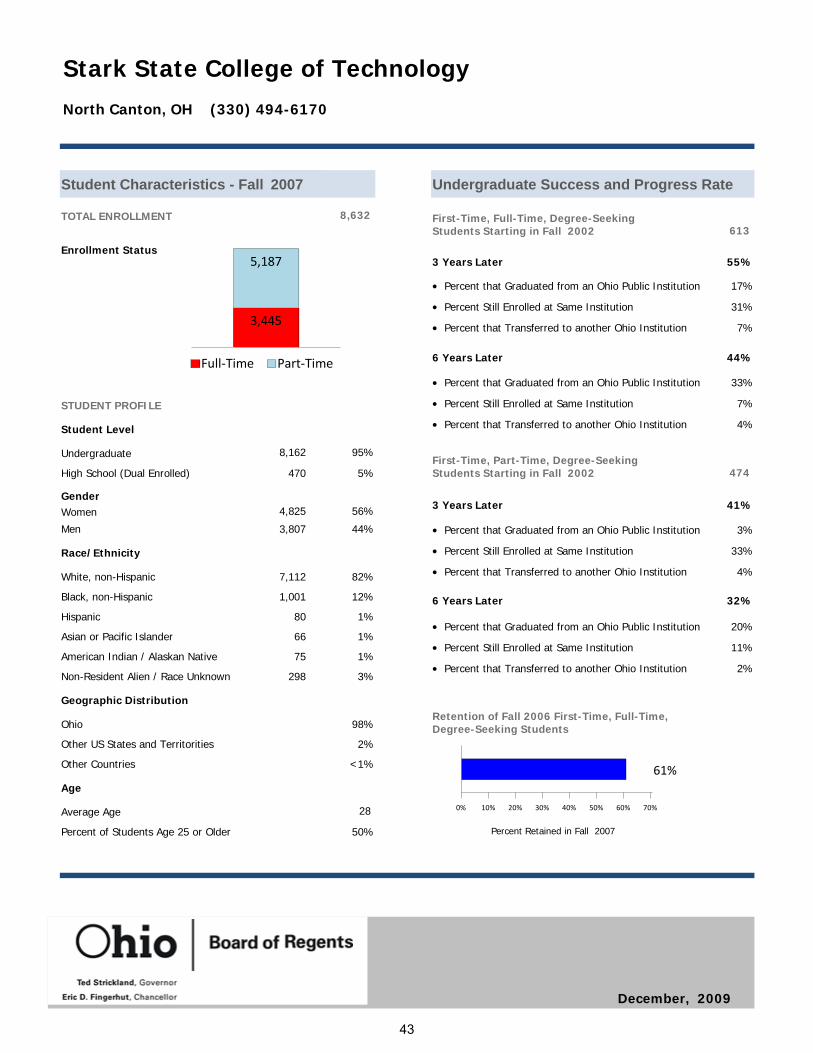
61%
0% 10% 20% 30% 40% 50% 60% 70%
8,632TOTAL ENROLLMENT
Gender
Student Characteristics - Fall 2007
4,825Women
3,807Men
82%
Race/Ethnicity
White, non-Hispanic
12%Black, non-Hispanic
1%Hispanic
1%Asian or Pacific Islander
1%American Indian / Alaskan Native
3%Non-Resident Alien / Race Unknown
Ohio
56%
98%
Geographic Distribution
44%
7,112
1,001
80
66
75
298
Other US States and Territorities 2%
Other Countries <1%
Student Level
8,162Undergraduate
470High School (Dual Enrolled)
95%
5%
Age
Average Age
Percent of Students Age 25 or Older
28
50%
Stark State College of Technology
Undergraduate Success and Progress Rate
613
Percent that Graduated from an Ohio Public Institution
3 Years Later
•Percent Still Enrolled at Same Institution•
17%
31%
Percent that Transferred to another Ohio Institution• 7%
Percent that Graduated from an Ohio Public Institution
6 Years Later
•Percent Still Enrolled at Same Institution•
33%
7%
Percent that Transferred to another Ohio Institution• 4%
474
Percent that Graduated from an Ohio Public Institution
3 Years Later
•Percent Still Enrolled at Same Institution•
3%
33%
Percent that Transferred to another Ohio Institution• 4%
Percent that Graduated from an Ohio Public Institution
6 Years Later
•Percent Still Enrolled at Same Institution•
20%
11%
Percent that Transferred to another Ohio Institution• 2%
55%
44%
41%
32%
Full‐Time Part‐Time
3,445
5,187Enrollment Status
STUDENT PROFILE
North Canton, OH (330) 494-6170
Retention of Fall 2006 First-Time, Full-Time, Degree-Seeking Students
Percent Retained in Fall 2007
First-Time, Full-Time, Degree-Seeking Students Starting in Fall 2002
First-Time, Part-Time, Degree-Seeking Students Starting in Fall 2002
December, 2009
43

Employed, not in CollegeEnrolled in College in OhioOther69%
23%
8%
Post-Graduation Outcomes of Spring 2007 Associate Degree Graduates
80%
43%
5%
34%
51%Student Loans
State Grants
Institutional Aid
Federal Grants
Any Financial Aid
835
Degrees and Areas of Study
Associate Degrees
99Certificates
Stark State College of Technology Page 2
Tuition and Financial Aid
Financial Aid Awarded to Students
80% of first-time, full-time, degree-seeking students in 2007-08 received financial aid of some type including need-based grants and loans, work-study, and non need-based scholarships.
Annual FY 2009 tuition and fees (sticker price) for in-state, undergraduate students before financial aid was $3,810. The cost to attend Stark State College of Technology varies based on the individual circumstances of students and may be reduced through grants and scholarships.
•
43% of first-time, full-time, degree-seeking students in 2007-08 received a federal grant. The average grant for the year was $1,574.
•
5% of first-time, full-time, degree-seeking students in 2007-08 received an institutional grant. The average grant for the year was $1,332.
•
Overall Financial Aid
Federal Financial Aid
Institutional Aid
51% of first-time, full-time, degree-seeking students in 2007-08 received a federal loan. The average loan amount for the year was $1,867.
•Federal Loans
Percent of First-Time Students in FY 2007 Receiving Each Type of Financial Aid.
Degrees Awarded at Stark State College of Technology in FY 2007-08
Total 934
408 62
40 11
448 73
All
Students
First-Generation
College
Minority
Areas of Study with the Largest Number of Associate Degrees Awarded in 2007-08
Health 31%
Engineering 29%
Business 20%
Natural Science & Mathematics 6%
Education 4%
All Other Degree Areas 9%
100%
NOTE: Students may receive aid from more than one source.
34% of first-time, full-time, degree-seeking students in 2007-08 received a federal grant. The average grant for the year was $879.
•State Financial Aid
Study at Stark State College of Technology
Classroom Environment
% of Classes with Fewer than 30 Students 96%
100%% of Classes with Fewer than 50 Students
Full-Time Instructional Faculty
Total Faculty
% Women
% from Minority Groups
% with Master's Degree or Higher
175
47%
6%
62%
Students Engaged in Internships/Co-Op/Field Experience 298
College Enrollment in Ohio in 2007-08•Employment in Ohio in 4th Quarter 2007•
December, 2009
44

52%
0% 10% 20% 30% 40% 50% 60% 70%
2,582TOTAL ENROLLMENT
Gender
Student Characteristics - Fall 2007
1,362Women
1,220Men
85%
Race/Ethnicity
White, non-Hispanic
3%Black, non-Hispanic
6%Hispanic
<1%Asian or Pacific Islander
<1%American Indian / Alaskan Native
5%Non-Resident Alien / Race Unknown
Ohio
53%
100%
Geographic Distribution
47%
2,188
86
147
10
10
141
Other US States and Territorities <1%
Other Countries 0%
Student Level
2,023Undergraduate
477High School (Dual Enrolled)
78%
18%
Age
Average Age
Percent of Students Age 25 or Older
27
43%
Terra State Community College
Undergraduate Success and Progress Rate
306
Percent that Graduated from an Ohio Public Institution
3 Years Later
•Percent Still Enrolled at Same Institution•
20%
20%
Percent that Transferred to another Ohio Institution• 11%
Percent that Graduated from an Ohio Public Institution
6 Years Later
•Percent Still Enrolled at Same Institution•
33%
3%
Percent that Transferred to another Ohio Institution• 10%
153
Percent that Graduated from an Ohio Public Institution
3 Years Later
•Percent Still Enrolled at Same Institution•
10%
24%
Percent that Transferred to another Ohio Institution• 10%
Percent that Graduated from an Ohio Public Institution
6 Years Later
•Percent Still Enrolled at Same Institution•
20%
7%
Percent that Transferred to another Ohio Institution• 5%
51%
46%
44%
32%
Full‐Time Part‐Time
930
1,652
Enrollment Status
STUDENT PROFILE
Fremont, OH (419) 334-8400
Retention of Fall 2006 First-Time, Full-Time, Degree-Seeking Students
Percent Retained in Fall 2007
First-Time, Full-Time, Degree-Seeking Students Starting in Fall 2002
First-Time, Part-Time, Degree-Seeking Students Starting in Fall 2002
December, 2009
45
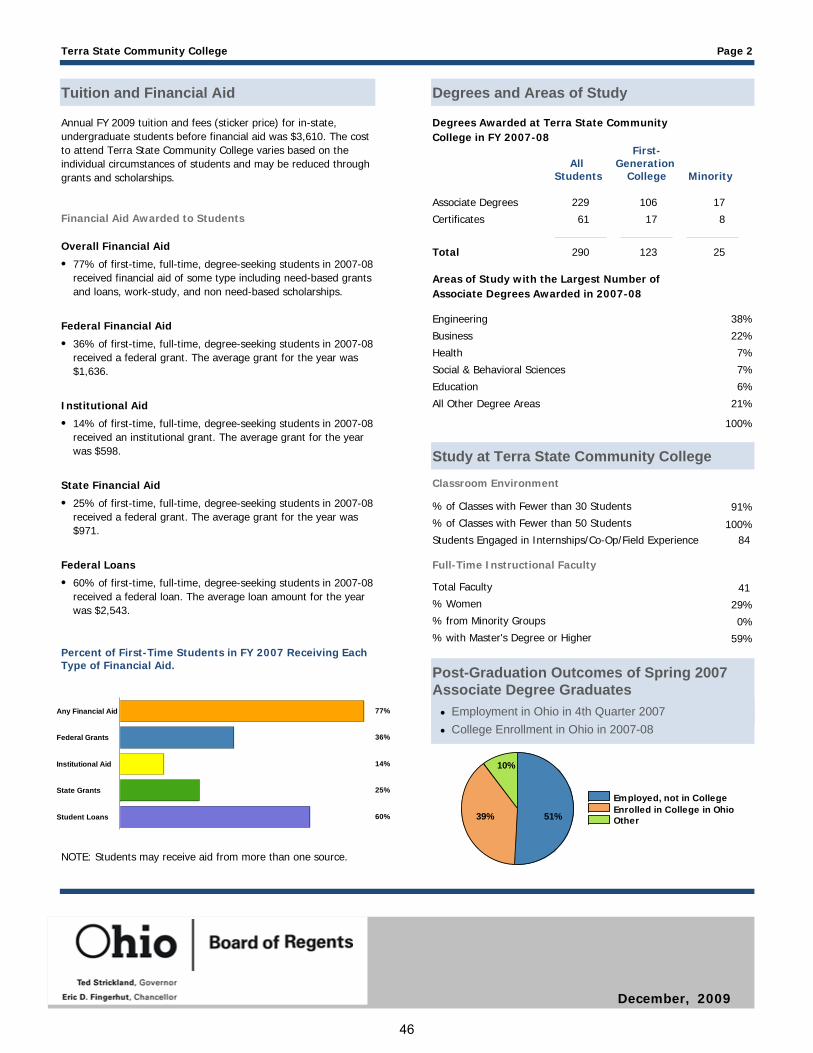
Employed, not in CollegeEnrolled in College in OhioOther51%39%
10%
Post-Graduation Outcomes of Spring 2007 Associate Degree Graduates
77%
36%
14%
25%
60%Student Loans
State Grants
Institutional Aid
Federal Grants
Any Financial Aid
229
Degrees and Areas of Study
Associate Degrees
61Certificates
Terra State Community College Page 2
Tuition and Financial Aid
Financial Aid Awarded to Students
77% of first-time, full-time, degree-seeking students in 2007-08 received financial aid of some type including need-based grants and loans, work-study, and non need-based scholarships.
Annual FY 2009 tuition and fees (sticker price) for in-state, undergraduate students before financial aid was $3,610. The cost to attend Terra State Community College varies based on the individual circumstances of students and may be reduced through grants and scholarships.
•
36% of first-time, full-time, degree-seeking students in 2007-08 received a federal grant. The average grant for the year was $1,636.
•
14% of first-time, full-time, degree-seeking students in 2007-08 received an institutional grant. The average grant for the year was $598.
•
Overall Financial Aid
Federal Financial Aid
Institutional Aid
60% of first-time, full-time, degree-seeking students in 2007-08 received a federal loan. The average loan amount for the year was $2,543.
•Federal Loans
Percent of First-Time Students in FY 2007 Receiving Each Type of Financial Aid.
Degrees Awarded at Terra State Community College in FY 2007-08
Total 290
106 17
17 8
123 25
All
Students
First-Generation
College
Minority
Areas of Study with the Largest Number of Associate Degrees Awarded in 2007-08
Engineering 38%
Business 22%
Health 7%
Social & Behavioral Sciences 7%
Education 6%
All Other Degree Areas 21%
100%
NOTE: Students may receive aid from more than one source.
25% of first-time, full-time, degree-seeking students in 2007-08 received a federal grant. The average grant for the year was $971.
•State Financial Aid
Study at Terra State Community College
Classroom Environment
% of Classes with Fewer than 30 Students 91%
100%% of Classes with Fewer than 50 Students
Full-Time Instructional Faculty
Total Faculty
% Women
% from Minority Groups
% with Master's Degree or Higher
41
29%
0%
59%
Students Engaged in Internships/Co-Op/Field Experience 84
College Enrollment in Ohio in 2007-08•Employment in Ohio in 4th Quarter 2007•
December, 2009
46
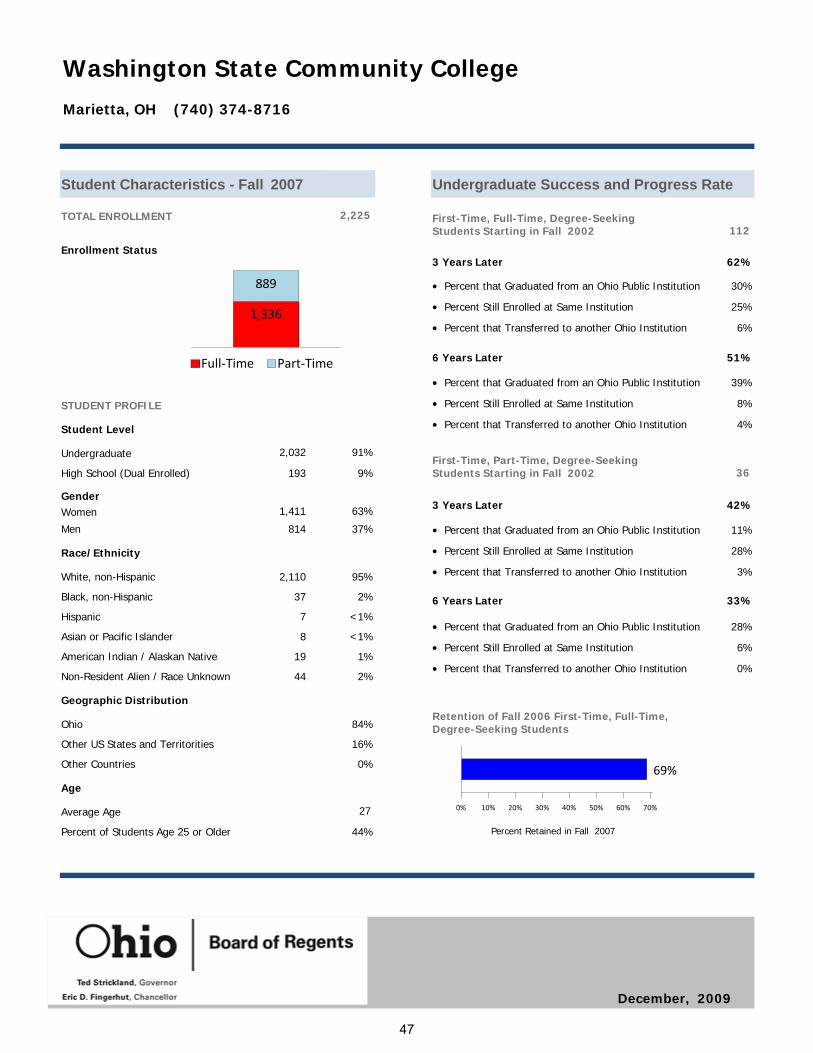
69%
0% 10% 20% 30% 40% 50% 60% 70%
2,225TOTAL ENROLLMENT
Gender
Student Characteristics - Fall 2007
1,411Women
814Men
95%
Race/Ethnicity
White, non-Hispanic
2%Black, non-Hispanic
<1%Hispanic
<1%Asian or Pacific Islander
1%American Indian / Alaskan Native
2%Non-Resident Alien / Race Unknown
Ohio
63%
84%
Geographic Distribution
37%
2,110
37
7
8
19
44
Other US States and Territorities 16%
Other Countries 0%
Student Level
2,032Undergraduate
193High School (Dual Enrolled)
91%
9%
Age
Average Age
Percent of Students Age 25 or Older
27
44%
Washington State Community College
Undergraduate Success and Progress Rate
112
Percent that Graduated from an Ohio Public Institution
3 Years Later
•Percent Still Enrolled at Same Institution•
30%
25%
Percent that Transferred to another Ohio Institution• 6%
Percent that Graduated from an Ohio Public Institution
6 Years Later
•Percent Still Enrolled at Same Institution•
39%
8%
Percent that Transferred to another Ohio Institution• 4%
36
Percent that Graduated from an Ohio Public Institution
3 Years Later
•Percent Still Enrolled at Same Institution•
11%
28%
Percent that Transferred to another Ohio Institution• 3%
Percent that Graduated from an Ohio Public Institution
6 Years Later
•Percent Still Enrolled at Same Institution•
28%
6%
Percent that Transferred to another Ohio Institution• 0%
62%
51%
42%
33%
Full‐Time Part‐Time
1,336
889
Enrollment Status
STUDENT PROFILE
Marietta, OH (740) 374-8716
Retention of Fall 2006 First-Time, Full-Time, Degree-Seeking Students
Percent Retained in Fall 2007
First-Time, Full-Time, Degree-Seeking Students Starting in Fall 2002
First-Time, Part-Time, Degree-Seeking Students Starting in Fall 2002
December, 2009
47
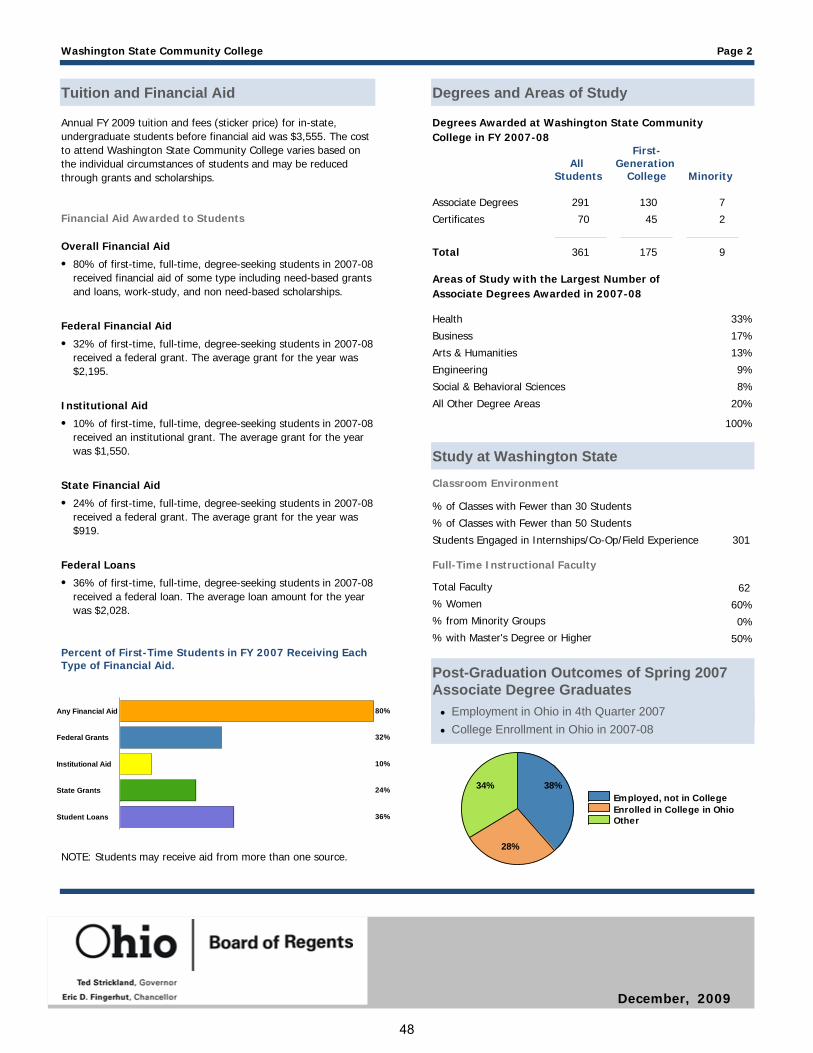
Employed, not in CollegeEnrolled in College in OhioOther
38%
28%
34%
Post-Graduation Outcomes of Spring 2007 Associate Degree Graduates
80%
32%
10%
24%
36%Student Loans
State Grants
Institutional Aid
Federal Grants
Any Financial Aid
291
Degrees and Areas of Study
Associate Degrees
70Certificates
Washington State Community College Page 2
Tuition and Financial Aid
Financial Aid Awarded to Students
80% of first-time, full-time, degree-seeking students in 2007-08 received financial aid of some type including need-based grants and loans, work-study, and non need-based scholarships.
Annual FY 2009 tuition and fees (sticker price) for in-state, undergraduate students before financial aid was $3,555. The cost to attend Washington State Community College varies based on the individual circumstances of students and may be reduced through grants and scholarships.
•
32% of first-time, full-time, degree-seeking students in 2007-08 received a federal grant. The average grant for the year was $2,195.
•
10% of first-time, full-time, degree-seeking students in 2007-08 received an institutional grant. The average grant for the year was $1,550.
•
Overall Financial Aid
Federal Financial Aid
Institutional Aid
36% of first-time, full-time, degree-seeking students in 2007-08 received a federal loan. The average loan amount for the year was $2,028.
•Federal Loans
Percent of First-Time Students in FY 2007 Receiving Each Type of Financial Aid.
Degrees Awarded at Washington State Community College in FY 2007-08
Total 361
130 7
45 2
175 9
All
Students
First-Generation
College
Minority
Areas of Study with the Largest Number of Associate Degrees Awarded in 2007-08
Health 33%
Business 17%
Arts & Humanities 13%
Engineering 9%
Social & Behavioral Sciences 8%
All Other Degree Areas 20%
100%
NOTE: Students may receive aid from more than one source.
24% of first-time, full-time, degree-seeking students in 2007-08 received a federal grant. The average grant for the year was $919.
•State Financial Aid
Study at Washington State
Classroom Environment
% of Classes with Fewer than 30 Students
% of Classes with Fewer than 50 Students
Full-Time Instructional Faculty
Total Faculty
% Women
% from Minority Groups
% with Master's Degree or Higher
62
60%
0%
50%
Students Engaged in Internships/Co-Op/Field Experience 301
College Enrollment in Ohio in 2007-08•Employment in Ohio in 4th Quarter 2007•
December, 2009
48