Embed Size (px)
Citation preview
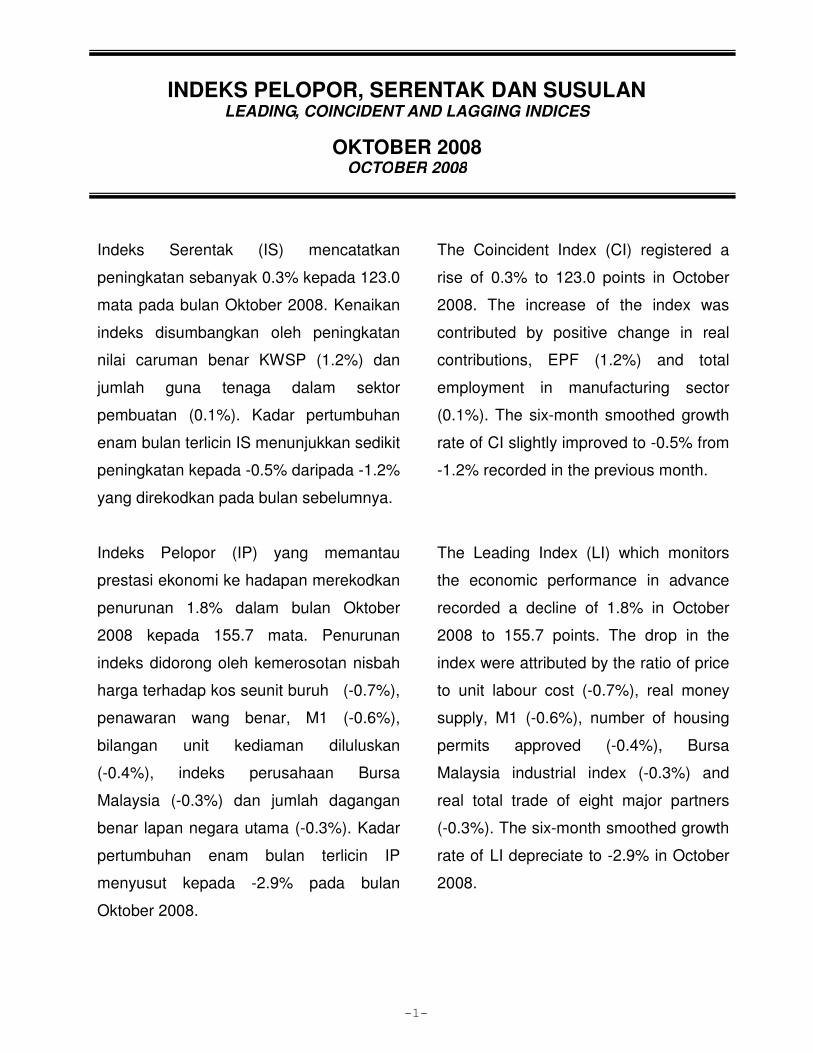
OKTOBEROCTOBER
-1-
Indeks Serentak (IS) mencatatkan
peningkatan sebanyak 0.3% kepada 123.0
mata pada bulan Oktober 2008. Kenaikan
indeks disumbangkan oleh peningkatan
nilai caruman benar KWSP (1.2%) dan
jumlah guna tenaga dalam sektor
pembuatan (0.1%). Kadar pertumbuhan
enam bulan terlicin IS menunjukkan sedikit
peningkatan kepada -0.5% daripada -1.2%
yang direkodkan pada bulan sebelumnya.
Indeks Pelopor (IP) yang memantau
prestasi ekonomi ke hadapan merekodkan
penurunan 1.8% dalam bulan Oktober
2008 kepada 155.7 mata. Penurunan
indeks didorong oleh kemerosotan nisbah
harga terhadap kos seunit buruh (-0.7%),
penawaran wang benar, M1 (-0.6%),
bilangan unit kediaman diluluskan
(-0.4%), indeks perusahaan Bursa
Malaysia (-0.3%) dan jumlah dagangan
benar lapan negara utama (-0.3%). Kadar
pertumbuhan enam bulan terlicin IP
menyusut kepada -2.9% pada bulan
Oktober 2008.
The Coincident Index (CI) registered a
rise of 0.3% to 123.0 points in October
2008. The increase of the index was
contributed by positive change in real
contributions, EPF (1.2%) and total
employment in manufacturing sector
(0.1%). The six-month smoothed growth
rate of CI slightly improved to -0.5% from
-1.2% recorded in the previous month.
The Leading Index (LI) which monitors
the economic performance in advance
recorded a decline of 1.8% in October
2008 to 155.7 points. The drop in the
index were attributed by the ratio of price
to unit labour cost (-0.7%), real money
supply, M1 (-0.6%), number of housing
permits approved (-0.4%), Bursa
Malaysia industrial index (-0.3%) and
real total trade of eight major partners
(-0.3%). The six-month smoothed growth
rate of LI depreciate to -2.9% in October
2008.
INDEKS PELOPOR, SERENTAK DAN SUSULAN LEADING, COINCIDENT AND LAGGING INDICES
OKTOBER 2008 OCTOBER 2008
-2-
Penyusutan berterusan kadar
pertumbuhan enam bulan terlicin Indeks
Pelopor dan Serentak menunjukkan
bahawa pertumbuhan ekonomi negara
akan lebih perlahan dalam bulan-bulan
akan datang.
The continuing weakness in the
six-month smoothed growth rates of the
Leading and Coincident Indices suggests
that the country’s economic growth will
be slower in the coming months.
-5
0
5
10
15
20
25
30
35
40
45
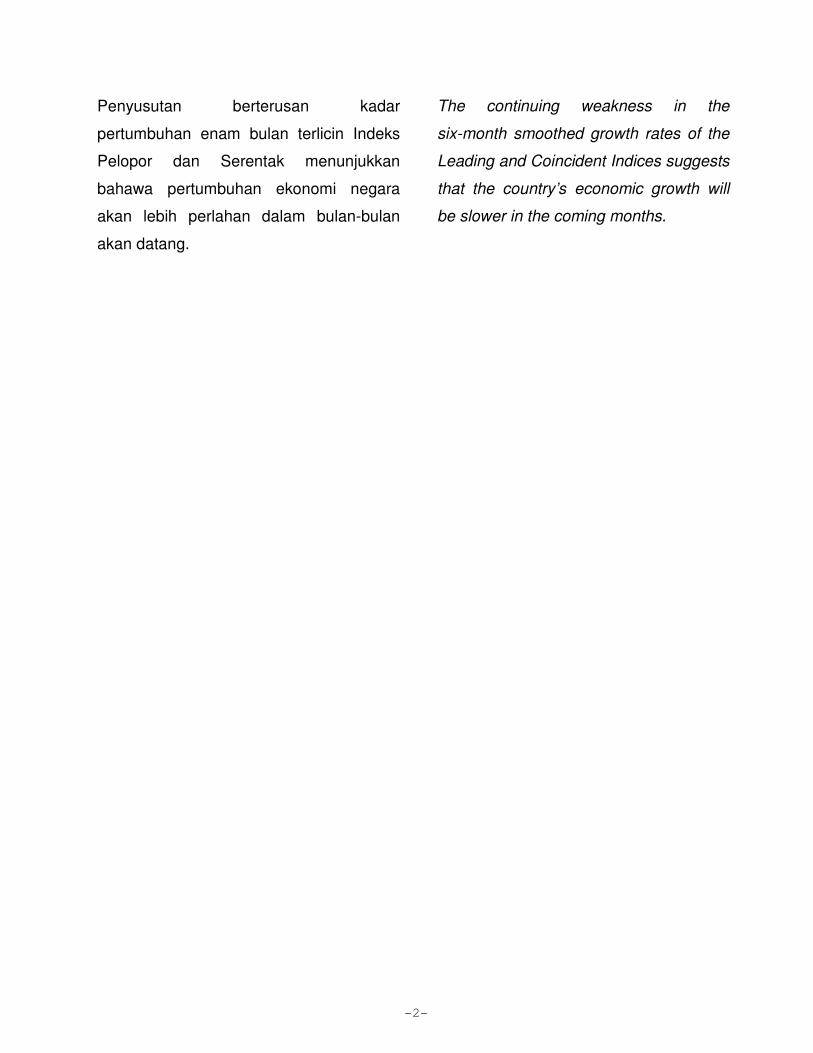
Carta 1 : Kadar Pertumbuhan EnamCarta 1 : Kadar Pertumbuhan EnamCarta 1 : Kadar Pertumbuhan EnamCarta 1 : Kadar Pertumbuhan Enam----Bulan Terlicin bagi Indeks Pelopor, Serentak dan Susulan, 1990Bulan Terlicin bagi Indeks Pelopor, Serentak dan Susulan, 1990Bulan Terlicin bagi Indeks Pelopor, Serentak dan Susulan, 1990Bulan Terlicin bagi Indeks Pelopor, Serentak dan Susulan, 1990----2008200820082008Chart 1 :Chart 1 :Chart 1 :Chart 1 : SixSixSixSix----Month Smoothed Growth Rates of the Leading, Coincident and Lagging Indices, 1990Month Smoothed Growth Rates of the Leading, Coincident and Lagging Indices, 1990Month Smoothed Growth Rates of the Leading, Coincident and Lagging Indices, 1990Month Smoothed Growth Rates of the Leading, Coincident and Lagging Indices, 1990----2008200820082008Indeks PeloporLeading Index
Indeks SerentakCoincident Index
T
1/93
T
1/99
P
1/97
P
9/00
T
2/02
P
4/04
T
12/04
5
0
-5
5
0
-5
Peratus
Percent
P
1/92
-45
-40
-35
-30
-25
-20
-15
-10
90 91 92 93 94 95 96 97 98 99 00 01 02 03 04 05 06 07 08
Kawasan berlorek ialah kemelesetan kitaran pertumbuhan. Kadar pertumbuhan dinyatakan sebagai kadar
tahunan terkompaun berasaskan nisbah indeks bulan semasa kepada purata dua belas bulan terdahulu.
Shaded areas are growth cycle recessions. The growth rates are expressed as compound annual rates
based on the ratio of the current month’s index to its average level during the preceding twelve months.
Tahun
Year
Indeks SusulanLagging Index
-3-
5
0
-5
0
20
40
60
80
100
120
140
90 91 92 93 94 95 96 97 98 99 00 01 02 03 04 05 06 07 08
Carta 3 : Kadar Pertumbuhan Indeks Serentak, Indeks Pelopor dan Keluaran Dalam Negeri Kasar, 1992Carta 3 : Kadar Pertumbuhan Indeks Serentak, Indeks Pelopor dan Keluaran Dalam Negeri Kasar, 1992Carta 3 : Kadar Pertumbuhan Indeks Serentak, Indeks Pelopor dan Keluaran Dalam Negeri Kasar, 1992Carta 3 : Kadar Pertumbuhan Indeks Serentak, Indeks Pelopor dan Keluaran Dalam Negeri Kasar, 1992----2008200820082008
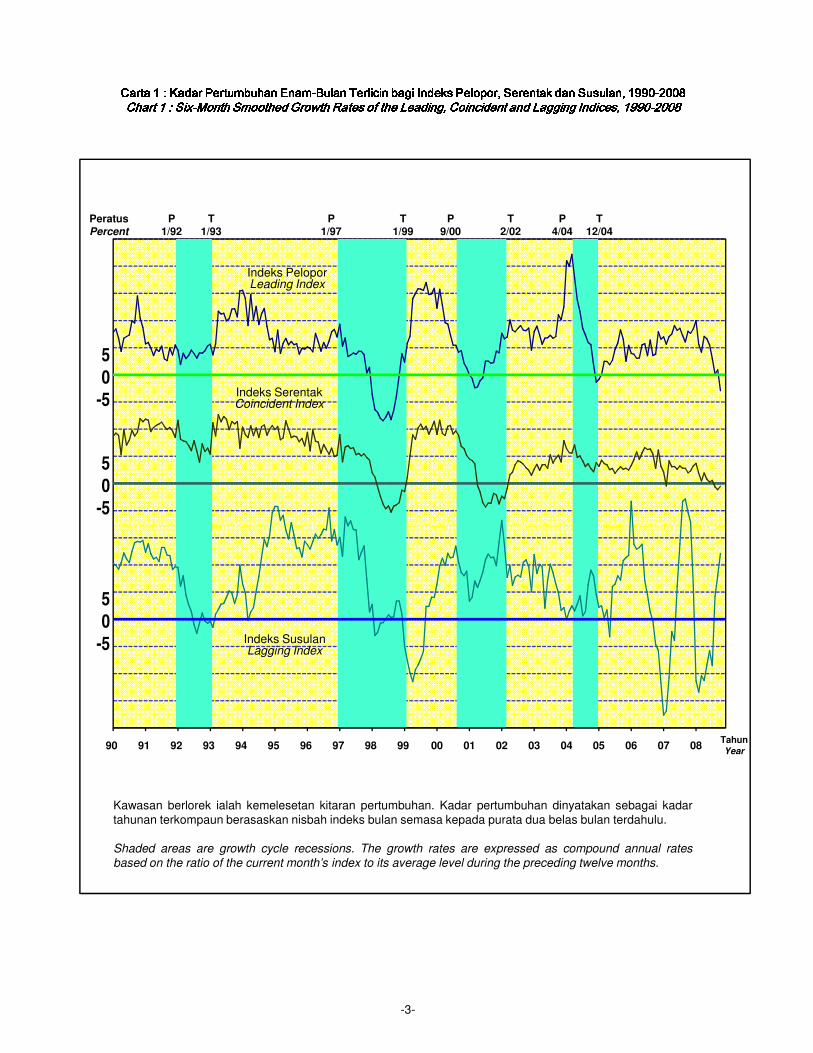
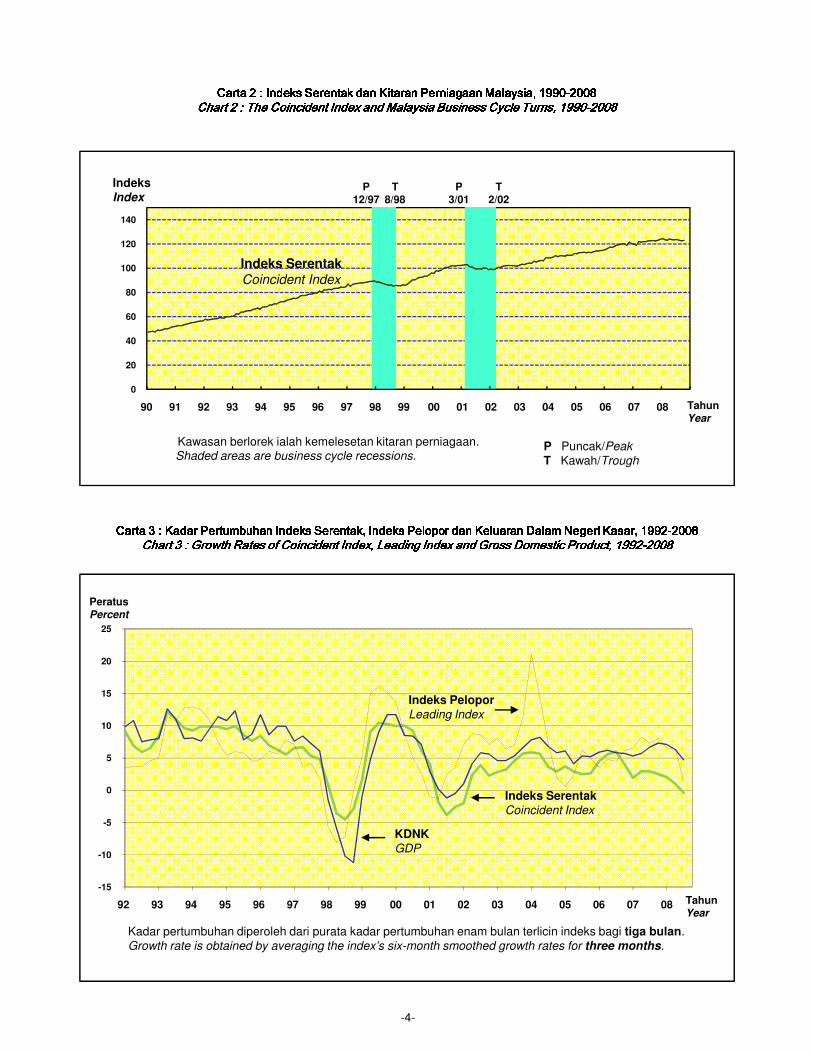
Carta 2 : Indeks Serentak dan Kitaran Perniagaan Malaysia, 1990Carta 2 : Indeks Serentak dan Kitaran Perniagaan Malaysia, 1990Carta 2 : Indeks Serentak dan Kitaran Perniagaan Malaysia, 1990Carta 2 : Indeks Serentak dan Kitaran Perniagaan Malaysia, 1990----2008200820082008Chart 2 :Chart 2 :Chart 2 :Chart 2 : The Coincident Index and Malaysia Business Cycle Turns, 1990The Coincident Index and Malaysia Business Cycle Turns, 1990The Coincident Index and Malaysia Business Cycle Turns, 1990The Coincident Index and Malaysia Business Cycle Turns, 1990----2008200820082008P
12/97
T
8/98
T
2/02
P
3/01
Indeks Serentak
Coincident Index
Kawasan berlorek ialah kemelesetan kitaran perniagaan.Shaded areas are business cycle recessions.
P Puncak/Peak
T Kawah/Trough
Tahun
Year
Indeks
Index
-15
-10
-5
0
5
10
15
20
25
92 93 94 95 96 97 98 99 00 01 02 03 04 05 06 07 08
Carta 3 : Kadar Pertumbuhan Indeks Serentak, Indeks Pelopor dan Keluaran Dalam Negeri Kasar, 1992Carta 3 : Kadar Pertumbuhan Indeks Serentak, Indeks Pelopor dan Keluaran Dalam Negeri Kasar, 1992Carta 3 : Kadar Pertumbuhan Indeks Serentak, Indeks Pelopor dan Keluaran Dalam Negeri Kasar, 1992Carta 3 : Kadar Pertumbuhan Indeks Serentak, Indeks Pelopor dan Keluaran Dalam Negeri Kasar, 1992----2008200820082008Chart 3 : Growth Rates of Coincident Index, Leading Index and Gross Domestic Product, 1992Chart 3 : Growth Rates of Coincident Index, Leading Index and Gross Domestic Product, 1992Chart 3 : Growth Rates of Coincident Index, Leading Index and Gross Domestic Product, 1992Chart 3 : Growth Rates of Coincident Index, Leading Index and Gross Domestic Product, 1992----2008200820082008
Tahun
Year
Peratus
Percent
Indeks Pelopor
Leading Index
KDNK
GDP
Indeks Serentak
Coincident Index
Kadar pertumbuhan diperoleh dari purata kadar pertumbuhan enam bulan terlicin indeks bagi tiga bulan.
Growth rate is obtained by averaging the index’s six-month smoothed growth rates for three months.
-4-
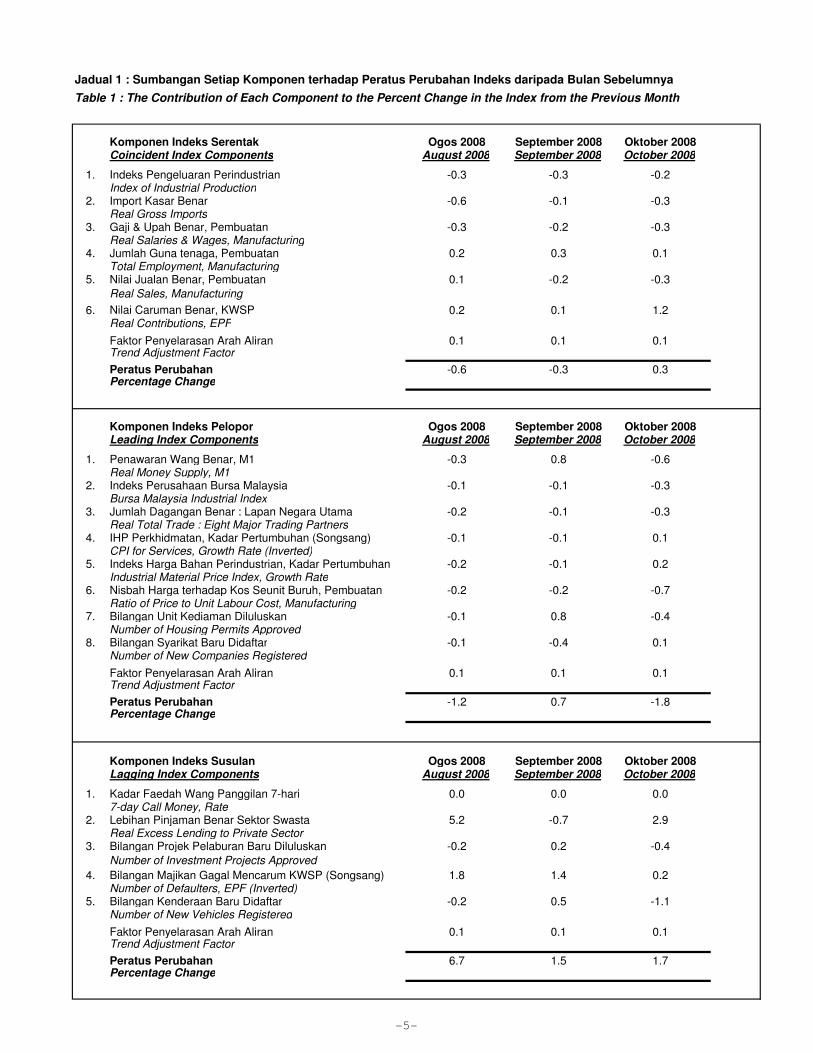
Jadual 1 : Sumbangan Setiap Komponen terhadap Peratus Perubahan Indeks daripada Bulan Sebelumnya
Table 1 : The Contribution of Each Component to the Percent Change in the Index from the Previous Month
Komponen Indeks Serentak Ogos 2008 September 2008 Oktober 2008
Coincident Index Components August 2008 September 2008 October 2008
1. Indeks Pengeluaran Perindustrian -0.3 -0.3 -0.2Index of Industrial Production
2. Import Kasar Benar -0.6 -0.1 -0.3Real Gross Imports
3. Gaji & Upah Benar, Pembuatan -0.3 -0.2 -0.3Real Salaries & Wages, Manufacturing
4. Jumlah Guna tenaga, Pembuatan 0.2 0.3 0.1Total Employment, Manufacturing
5. Nilai Jualan Benar, Pembuatan 0.1 -0.2 -0.3
Real Sales, Manufacturing
6. Nilai Caruman Benar, KWSP 0.2 0.1 1.2Real Contributions, EPF
Faktor Penyelarasan Arah Aliran 0.1 0.1 0.1Trend Adjustment Factor
Peratus Perubahan -0.6 -0.3 0.3Percentage Change
Komponen Indeks Pelopor Ogos 2008 September 2008 Oktober 2008
Leading Index Components August 2008 September 2008 October 2008
1. Penawaran Wang Benar, M1 -0.3 0.8 -0.6Real Money Supply, M1
2. Indeks Perusahaan Bursa Malaysia -0.1 -0.1 -0.3Bursa Malaysia Industrial Index
3. Jumlah Dagangan Benar : Lapan Negara Utama -0.2 -0.1 -0.3Real Total Trade : Eight Major Trading Partners
4. IHP Perkhidmatan, Kadar Pertumbuhan (Songsang) -0.1 -0.1 0.1CPI for Services, Growth Rate (Inverted)
5. Indeks Harga Bahan Perindustrian, Kadar Pertumbuhan -0.2 -0.1 0.2Industrial Material Price Index, Growth Rate
6. Nisbah Harga terhadap Kos Seunit Buruh, Pembuatan -0.2 -0.2 -0.7Ratio of Price to Unit Labour Cost, Manufacturing
7. Bilangan Unit Kediaman Diluluskan -0.1 0.8 -0.4Number of Housing Permits Approved
8. Bilangan Syarikat Baru Didaftar -0.1 -0.4 0.1Number of New Companies Registered
Faktor Penyelarasan Arah Aliran 0.1 0.1 0.1Trend Adjustment Factor
Peratus Perubahan -1.2 0.7 -1.8Percentage Change
Komponen Indeks Susulan Ogos 2008 September 2008 Oktober 2008
Lagging Index Components August 2008 September 2008 October 2008
1. Kadar Faedah Wang Panggilan 7-hari 0.0 0.0 0.07-day Call Money, Rate
2. Lebihan Pinjaman Benar Sektor Swasta 5.2 -0.7 2.9Real Excess Lending to Private Sector
3. Bilangan Projek Pelaburan Baru Diluluskan -0.2 0.2 -0.4
Number of Investment Projects Approved
4. Bilangan Majikan Gagal Mencarum KWSP (Songsang) 1.8 1.4 0.2Number of Defaulters, EPF (Inverted)
5. Bilangan Kenderaan Baru Didaftar -0.2 0.5 -1.1Number of New Vehicles Registered
Faktor Penyelarasan Arah Aliran 0.1 0.1 0.1Trend Adjustment Factor
Peratus Perubahan 6.7 1.5 1.7Percentage Change
-5-
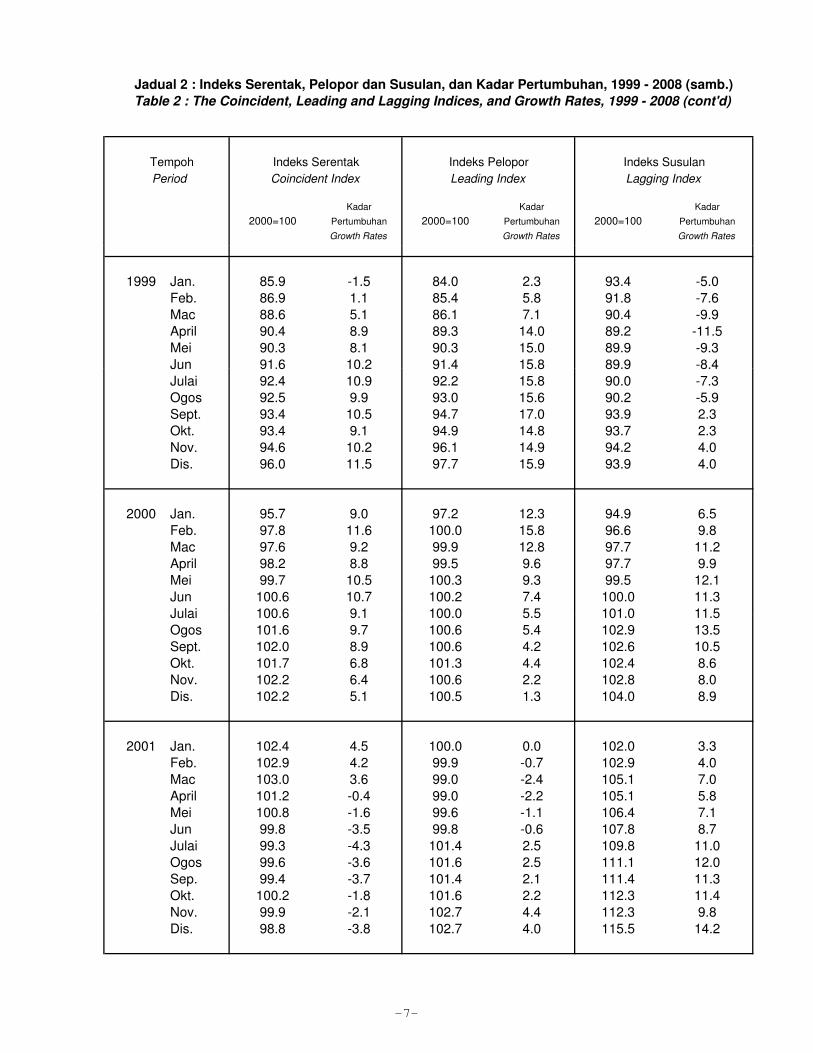
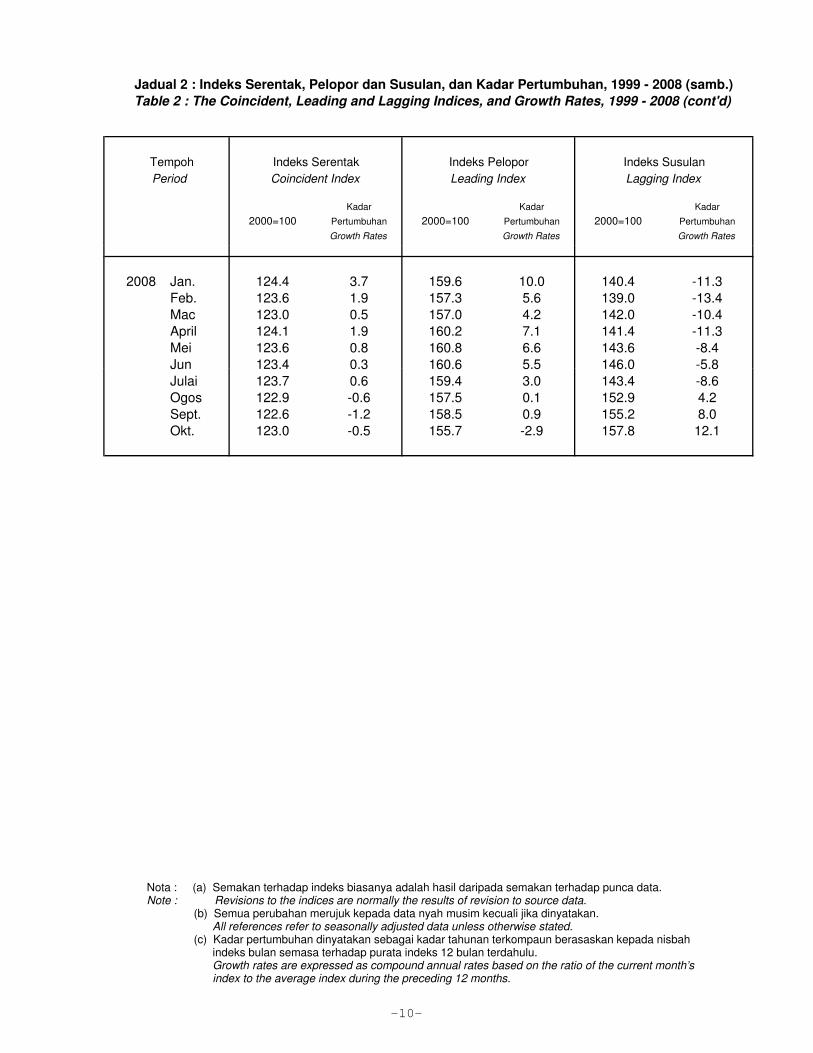
Jadual 2 : Indeks Serentak, Pelopor dan Susulan, dan Kadar Pertumbuhan, 1999 - 2008 (samb.)
Table 2 : The Coincident, Leading and Lagging Indices, and Growth Rates, 1999 - 2008 (cont'd)
Kadar Kadar Kadar
2000=100 Pertumbuhan 2000=100 Pertumbuhan 2000=100 Pertumbuhan
Growth Rates Growth Rates Growth Rates
Period Coincident Index Leading Index Lagging Index
Tempoh Indeks Serentak Indeks Pelopor Indeks Susulan
1999 Jan. 85.9 -1.5 84.0 2.3 93.4 -5.0
Feb. 86.9 1.1 85.4 5.8 91.8 -7.6
Mac 88.6 5.1 86.1 7.1 90.4 -9.9
April 90.4 8.9 89.3 14.0 89.2 -11.5
Mei 90.3 8.1 90.3 15.0 89.9 -9.3
Jun 91.6 10.2 91.4 15.8 89.9 -8.4Jun 91.6 10.2 91.4 15.8 89.9 -8.4
Julai 92.4 10.9 92.2 15.8 90.0 -7.3
Ogos 92.5 9.9 93.0 15.6 90.2 -5.9
Sept. 93.4 10.5 94.7 17.0 93.9 2.3
Okt. 93.4 9.1 94.9 14.8 93.7 2.3
Nov. 94.6 10.2 96.1 14.9 94.2 4.0
Dis. 96.0 11.5 97.7 15.9 93.9 4.0
2000 Jan. 95.7 9.0 97.2 12.3 94.9 6.5
Feb. 97.8 11.6 100.0 15.8 96.6 9.8
Mac 97.6 9.2 99.9 12.8 97.7 11.2
April 98.2 8.8 99.5 9.6 97.7 9.9
Mei 99.7 10.5 100.3 9.3 99.5 12.1
Jun 100.6 10.7 100.2 7.4 100.0 11.3
Julai 100.6 9.1 100.0 5.5 101.0 11.5Julai 100.6 9.1 100.0 5.5 101.0 11.5
Ogos 101.6 9.7 100.6 5.4 102.9 13.5
Sept. 102.0 8.9 100.6 4.2 102.6 10.5
Okt. 101.7 6.8 101.3 4.4 102.4 8.6
Nov. 102.2 6.4 100.6 2.2 102.8 8.0
Dis. 102.2 5.1 100.5 1.3 104.0 8.9
2001 Jan. 102.4 4.5 100.0 0.0 102.0 3.3
Feb. 102.9 4.2 99.9 -0.7 102.9 4.0
Mac 103.0 3.6 99.0 -2.4 105.1 7.0
April 101.2 -0.4 99.0 -2.2 105.1 5.8
Mei 100.8 -1.6 99.6 -1.1 106.4 7.1
Jun 99.8 -3.5 99.8 -0.6 107.8 8.7
Julai 99.3 -4.3 101.4 2.5 109.8 11.0
Ogos 99.6 -3.6 101.6 2.5 111.1 12.0Ogos 99.6 -3.6 101.6 2.5 111.1 12.0
Sep. 99.4 -3.7 101.4 2.1 111.4 11.3
Okt. 100.2 -1.8 101.6 2.2 112.3 11.4
Nov. 99.9 -2.1 102.7 4.4 112.3 9.8
Dis. 98.8 -3.8 102.7 4.0 115.5 14.2
-7-
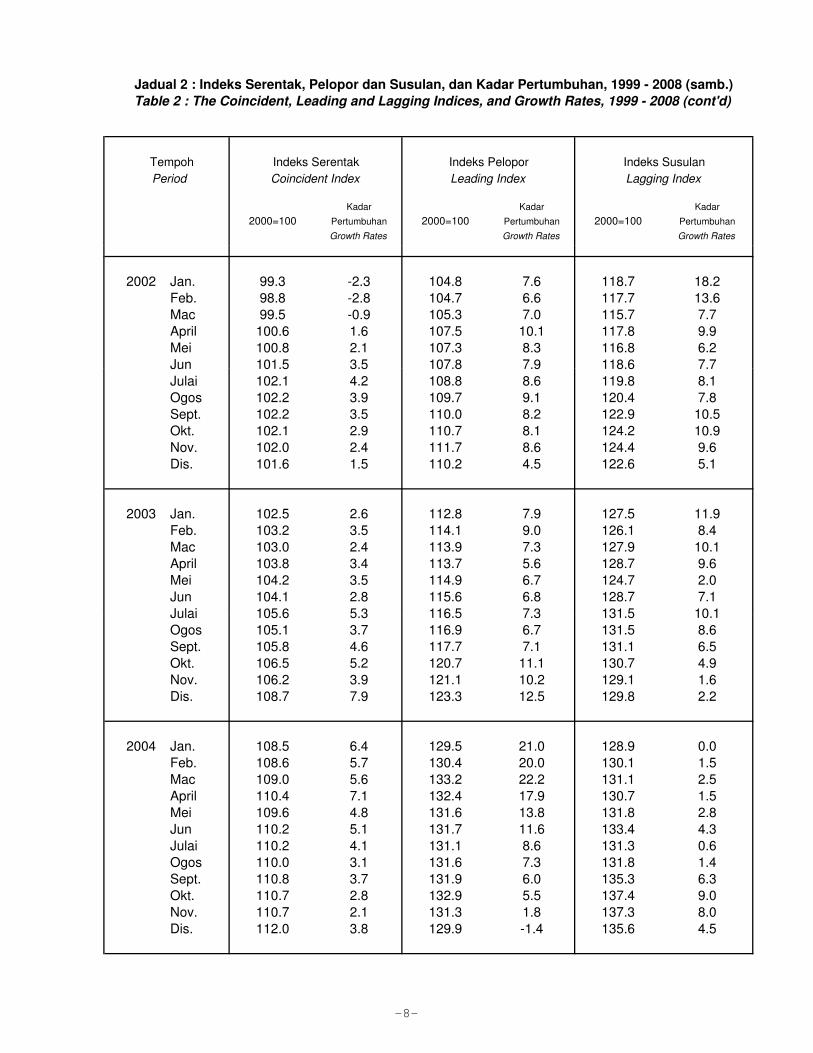
Jadual 2 : Indeks Serentak, Pelopor dan Susulan, dan Kadar Pertumbuhan, 1999 - 2008 (samb.)
Table 2 : The Coincident, Leading and Lagging Indices, and Growth Rates, 1999 - 2008 (cont'd)
Kadar Kadar Kadar
2000=100 Pertumbuhan 2000=100 Pertumbuhan 2000=100 Pertumbuhan
Growth Rates Growth Rates Growth Rates
Period Coincident Index Leading Index Lagging Index
Tempoh Indeks Serentak Indeks Pelopor Indeks Susulan
2002 Jan. 99.3 -2.3 104.8 7.6 118.7 18.2
Feb. 98.8 -2.8 104.7 6.6 117.7 13.6
Mac 99.5 -0.9 105.3 7.0 115.7 7.7
April 100.6 1.6 107.5 10.1 117.8 9.9
Mei 100.8 2.1 107.3 8.3 116.8 6.2
Jun 101.5 3.5 107.8 7.9 118.6 7.7Jun 101.5 3.5 107.8 7.9 118.6 7.7
Julai 102.1 4.2 108.8 8.6 119.8 8.1
Ogos 102.2 3.9 109.7 9.1 120.4 7.8
Sept. 102.2 3.5 110.0 8.2 122.9 10.5
Okt. 102.1 2.9 110.7 8.1 124.2 10.9
Nov. 102.0 2.4 111.7 8.6 124.4 9.6
Dis. 101.6 1.5 110.2 4.5 122.6 5.1
2003 Jan. 102.5 2.6 112.8 7.9 127.5 11.9
Feb. 103.2 3.5 114.1 9.0 126.1 8.4
Mac 103.0 2.4 113.9 7.3 127.9 10.1
April 103.8 3.4 113.7 5.6 128.7 9.6
Mei 104.2 3.5 114.9 6.7 124.7 2.0
Jun 104.1 2.8 115.6 6.8 128.7 7.1
Julai 105.6 5.3 116.5 7.3 131.5 10.1Julai 105.6 5.3 116.5 7.3 131.5 10.1
Ogos 105.1 3.7 116.9 6.7 131.5 8.6
Sept. 105.8 4.6 117.7 7.1 131.1 6.5
Okt. 106.5 5.2 120.7 11.1 130.7 4.9
Nov. 106.2 3.9 121.1 10.2 129.1 1.6
Dis. 108.7 7.9 123.3 12.5 129.8 2.2
2004 Jan. 108.5 6.4 129.5 21.0 128.9 0.0
Feb. 108.6 5.7 130.4 20.0 130.1 1.5
Mac 109.0 5.6 133.2 22.2 131.1 2.5
April 110.4 7.1 132.4 17.9 130.7 1.5
Mei 109.6 4.8 131.6 13.8 131.8 2.8
Jun 110.2 5.1 131.7 11.6 133.4 4.3
Julai 110.2 4.1 131.1 8.6 131.3 0.6
Ogos 110.0 3.1 131.6 7.3 131.8 1.4Ogos 110.0 3.1 131.6 7.3 131.8 1.4
Sept. 110.8 3.7 131.9 6.0 135.3 6.3
Okt. 110.7 2.8 132.9 5.5 137.4 9.0
Nov. 110.7 2.1 131.3 1.8 137.3 8.0
Dis. 112.0 3.8 129.9 -1.4 135.6 4.5
-8-
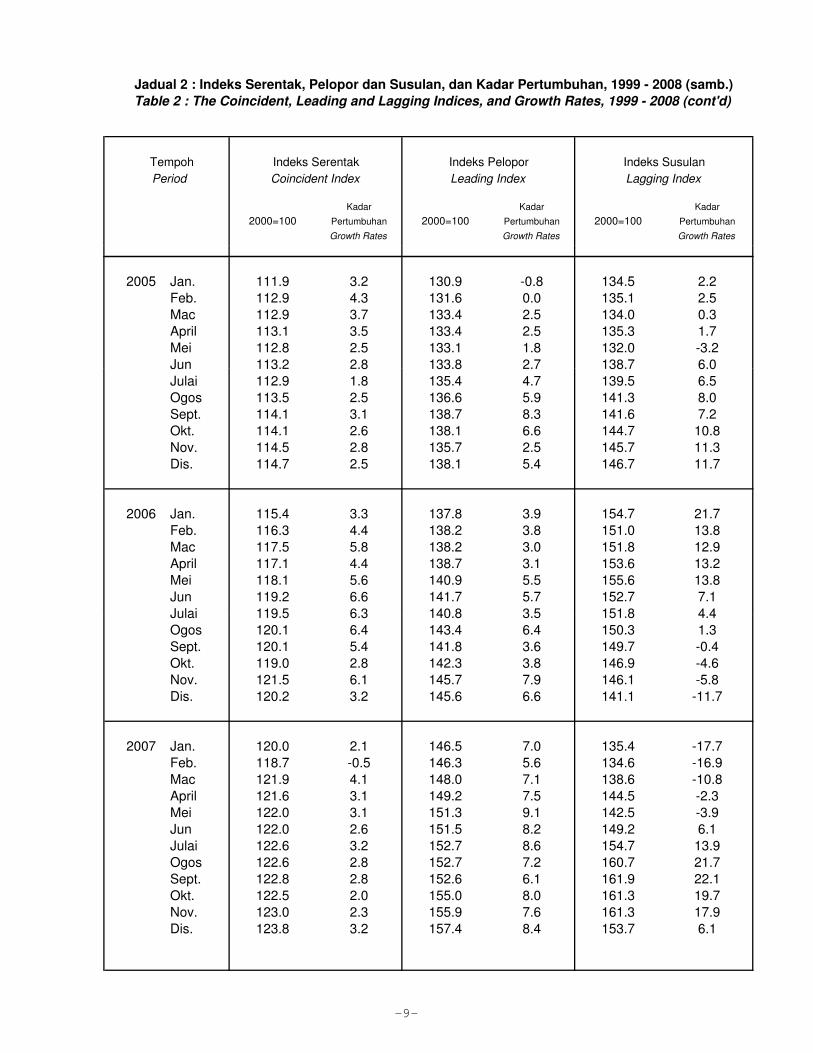
Jadual 2 : Indeks Serentak, Pelopor dan Susulan, dan Kadar Pertumbuhan, 1999 - 2008 (samb.)
Table 2 : The Coincident, Leading and Lagging Indices, and Growth Rates, 1999 - 2008 (cont'd)
Kadar Kadar Kadar
2000=100 Pertumbuhan 2000=100 Pertumbuhan 2000=100 Pertumbuhan
Growth Rates Growth Rates Growth Rates
Period Coincident Index Leading Index Lagging Index
Tempoh Indeks Serentak Indeks Pelopor Indeks Susulan
2005 Jan. 111.9 3.2 130.9 -0.8 134.5 2.2
Feb. 112.9 4.3 131.6 0.0 135.1 2.5
Mac 112.9 3.7 133.4 2.5 134.0 0.3
April 113.1 3.5 133.4 2.5 135.3 1.7
Mei 112.8 2.5 133.1 1.8 132.0 -3.2
Jun 113.2 2.8 133.8 2.7 138.7 6.0Jun 113.2 2.8 133.8 2.7 138.7 6.0
Julai 112.9 1.8 135.4 4.7 139.5 6.5
Ogos 113.5 2.5 136.6 5.9 141.3 8.0
Sept. 114.1 3.1 138.7 8.3 141.6 7.2
Okt. 114.1 2.6 138.1 6.6 144.7 10.8
Nov. 114.5 2.8 135.7 2.5 145.7 11.3
Dis. 114.7 2.5 138.1 5.4 146.7 11.7
2006 Jan. 115.4 3.3 137.8 3.9 154.7 21.7
Feb. 116.3 4.4 138.2 3.8 151.0 13.8
Mac 117.5 5.8 138.2 3.0 151.8 12.9
April 117.1 4.4 138.7 3.1 153.6 13.2
Mei 118.1 5.6 140.9 5.5 155.6 13.8
Jun 119.2 6.6 141.7 5.7 152.7 7.1
Julai 119.5 6.3 140.8 3.5 151.8 4.4Julai 119.5 6.3 140.8 3.5 151.8 4.4
Ogos 120.1 6.4 143.4 6.4 150.3 1.3
Sept. 120.1 5.4 141.8 3.6 149.7 -0.4
Okt. 119.0 2.8 142.3 3.8 146.9 -4.6
Nov. 121.5 6.1 145.7 7.9 146.1 -5.8
Dis. 120.2 3.2 145.6 6.6 141.1 -11.7
2007 Jan. 120.0 2.1 146.5 7.0 135.4 -17.7
Feb. 118.7 -0.5 146.3 5.6 134.6 -16.9
Mac 121.9 4.1 148.0 7.1 138.6 -10.8
April 121.6 3.1 149.2 7.5 144.5 -2.3
Mei 122.0 3.1 151.3 9.1 142.5 -3.9
Jun 122.0 2.6 151.5 8.2 149.2 6.1
Julai 122.6 3.2 152.7 8.6 154.7 13.9
Ogos 122.6 2.8 152.7 7.2 160.7 21.7Ogos 122.6 2.8 152.7 7.2 160.7 21.7
Sept. 122.8 2.8 152.6 6.1 161.9 22.1
Okt. 122.5 2.0 155.0 8.0 161.3 19.7
Nov. 123.0 2.3 155.9 7.6 161.3 17.9
Dis. 123.8 3.2 157.4 8.4 153.7 6.1
-9-
Jadual 2 : Indeks Serentak, Pelopor dan Susulan, dan Kadar Pertumbuhan, 1999 - 2008 (samb.)
Table 2 : The Coincident, Leading and Lagging Indices, and Growth Rates, 1999 - 2008 (cont'd)
Kadar Kadar Kadar
2000=100 Pertumbuhan 2000=100 Pertumbuhan 2000=100 Pertumbuhan
Growth Rates Growth Rates Growth Rates
Period Coincident Index Leading Index Lagging Index
Tempoh Indeks Serentak Indeks Pelopor Indeks Susulan
2008 Jan. 124.4 3.7 159.6 10.0 140.4 -11.3
Feb. 123.6 1.9 157.3 5.6 139.0 -13.4
Mac 123.0 0.5 157.0 4.2 142.0 -10.4
April 124.1 1.9 160.2 7.1 141.4 -11.3
Mei 123.6 0.8 160.8 6.6 143.6 -8.4
Jun 123.4 0.3 160.6 5.5 146.0 -5.8Jun 123.4 0.3 160.6 5.5 146.0 -5.8
Julai 123.7 0.6 159.4 3.0 143.4 -8.6
Ogos 122.9 -0.6 157.5 0.1 152.9 4.2
Sept. 122.6 -1.2 158.5 0.9 155.2 8.0
Okt. 123.0 -0.5 155.7 -2.9 157.8 12.1
Nota : (a) Semakan terhadap indeks biasanya adalah hasil daripada semakan terhadap punca data.Note : Revisions to the indices are normally the results of revision to source data.
(b) Semua perubahan merujuk kepada data nyah musim kecuali jika dinyatakan.All references refer to seasonally adjusted data unless otherwise stated.
(c) Kadar pertumbuhan dinyatakan sebagai kadar tahunan terkompaun berasaskan kepada nisbah indeks bulan semasa terhadap purata indeks 12 bulan terdahulu.Growth rates are expressed as compound annual rates based on the ratio of the current month’s index to the average index during the preceding 12 months.
-10-
-11-
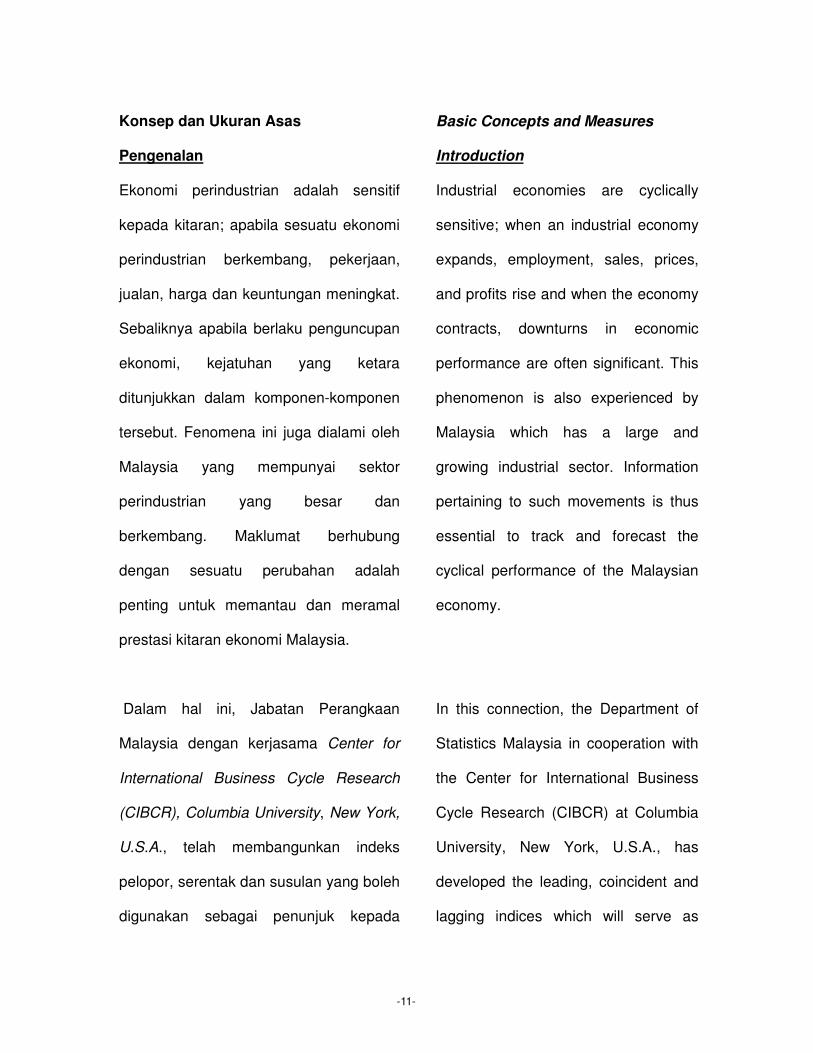
Konsep dan Ukuran Asas
Pengenalan
Ekonomi perindustrian adalah sensitif
kepada kitaran; apabila sesuatu ekonomi
perindustrian berkembang, pekerjaan,
jualan, harga dan keuntungan meningkat.
Sebaliknya apabila berlaku penguncupan
ekonomi, kejatuhan yang ketara
ditunjukkan dalam komponen-komponen
tersebut. Fenomena ini juga dialami oleh
Malaysia yang mempunyai sektor
perindustrian yang besar dan
berkembang. Maklumat berhubung
dengan sesuatu perubahan adalah
penting untuk memantau dan meramal
prestasi kitaran ekonomi Malaysia.
Dalam hal ini, Jabatan Perangkaan
Malaysia dengan kerjasama Center for
International Business Cycle Research
(CIBCR), Columbia University, New York,
U.S.A., telah membangunkan indeks
pelopor, serentak dan susulan yang boleh
digunakan sebagai penunjuk kepada
Basic Concepts and Measures
Introduction
Industrial economies are cyclically
sensitive; when an industrial economy
expands, employment, sales, prices,
and profits rise and when the economy
contracts, downturns in economic
performance are often significant. This
phenomenon is also experienced by
Malaysia which has a large and
growing industrial sector. Information
pertaining to such movements is thus
essential to track and forecast the
cyclical performance of the Malaysian
economy.
In this connection, the Department of
Statistics Malaysia in cooperation with
the Center for International Business
Cycle Research (CIBCR) at Columbia
University, New York, U.S.A., has
developed the leading, coincident and
lagging indices which will serve as
-12-
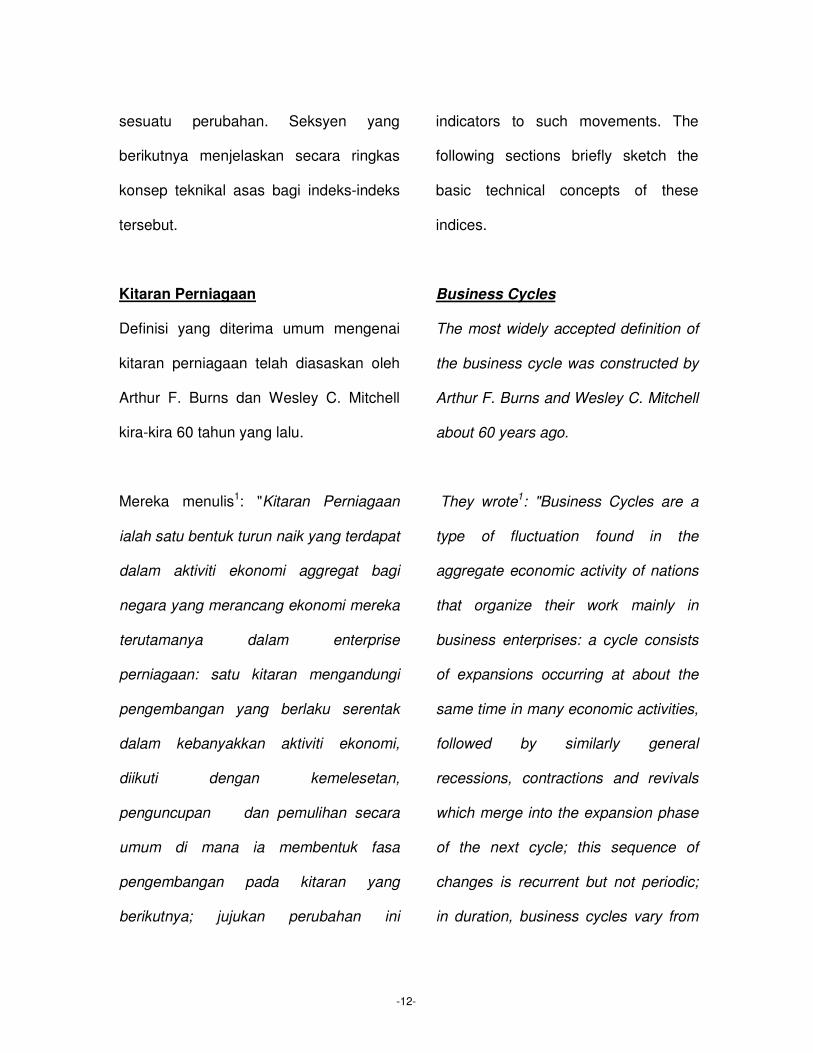
sesuatu perubahan. Seksyen yang
berikutnya menjelaskan secara ringkas
konsep teknikal asas bagi indeks-indeks
tersebut.
Kitaran Perniagaan
Definisi yang diterima umum mengenai
kitaran perniagaan telah diasaskan oleh
Arthur F. Burns dan Wesley C. Mitchell
kira-kira 60 tahun yang lalu.
Mereka menulis1: "Kitaran Perniagaan
ialah satu bentuk turun naik yang terdapat
dalam aktiviti ekonomi aggregat bagi
negara yang merancang ekonomi mereka
terutamanya dalam enterprise
perniagaan: satu kitaran mengandungi
pengembangan yang berlaku serentak
dalam kebanyakkan aktiviti ekonomi,
diikuti dengan kemelesetan,
penguncupan dan pemulihan secara
umum di mana ia membentuk fasa
pengembangan pada kitaran yang
berikutnya; jujukan perubahan ini
indicators to such movements. The
following sections briefly sketch the
basic technical concepts of these
indices.
Business Cycles
The most widely accepted definition of
the business cycle was constructed by
Arthur F. Burns and Wesley C. Mitchell
about 60 years ago.
They wrote1: "Business Cycles are a
type of fluctuation found in the
aggregate economic activity of nations
that organize their work mainly in
business enterprises: a cycle consists
of expansions occurring at about the
same time in many economic activities,
followed by similarly general
recessions, contractions and revivals
which merge into the expansion phase
of the next cycle; this sequence of
changes is recurrent but not periodic;
in duration, business cycles vary from
-13-
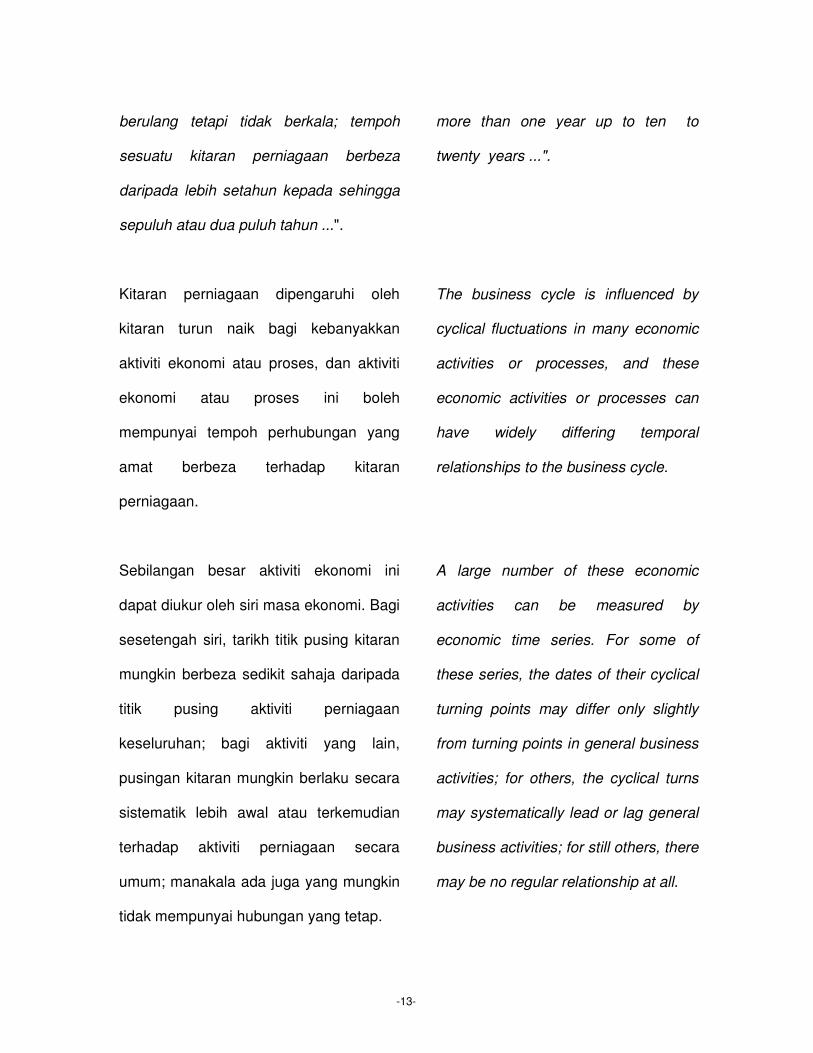
berulang tetapi tidak berkala; tempoh
sesuatu kitaran perniagaan berbeza
daripada lebih setahun kepada sehingga
sepuluh atau dua puluh tahun ...".
Kitaran perniagaan dipengaruhi oleh
kitaran turun naik bagi kebanyakkan
aktiviti ekonomi atau proses, dan aktiviti
ekonomi atau proses ini boleh
mempunyai tempoh perhubungan yang
amat berbeza terhadap kitaran
perniagaan.
Sebilangan besar aktiviti ekonomi ini
dapat diukur oleh siri masa ekonomi. Bagi
sesetengah siri, tarikh titik pusing kitaran
mungkin berbeza sedikit sahaja daripada
titik pusing aktiviti perniagaan
keseluruhan; bagi aktiviti yang lain,
pusingan kitaran mungkin berlaku secara
sistematik lebih awal atau terkemudian
terhadap aktiviti perniagaan secara
umum; manakala ada juga yang mungkin
tidak mempunyai hubungan yang tetap.
more than one year up to ten to
twenty years ...".
The business cycle is influenced by
cyclical fluctuations in many economic
activities or processes, and these
economic activities or processes can
have widely differing temporal
relationships to the business cycle.
A large number of these economic
activities can be measured by
economic time series. For some of
these series, the dates of their cyclical
turning points may differ only slightly
from turning points in general business
activities; for others, the cyclical turns
may systematically lead or lag general
business activities; for still others, there
may be no regular relationship at all.
-14-
Kitaran Pertumbuhan
Kitaran pertumbuhan ialah gelagat turun
naik yang berulang dalam siri
penyimpangan daripada arah aliran
kitaran perniagaan: ia tiba ke puncak
apabila gelagat aktiviti perniagaan secara
umum lebih tinggi daripada paras arah
alirannya dan mencecah kawah apabila
jauh di bawah paras arah aliran.
Pendekatan penunjuk kitaran ialah teknik
yang diterima umum digunakan untuk
menganalisa situasi ekonomi semasa dan
keadaan prospek ekonomi. Pendekatan
ini mengenalpasti penunjuk ekonomi
secara khusus yang mana kitaran
perubahannya atau pergerakannya
bersifat mendahului (lead), serentak
(coincide) atau menyusul (lag) dalam
aktiviti perniagaan.
Setiap penunjuk yang terpilih untuk
dimasukkan ke dalam sistem penunjuk
pelopor seharusnya mempunyai rasional
Growth Cycles
Growth cycles are recurrent
fluctuations in series of deviations from
trend of business cycle: they reach
peaks when general business activity
is farthest above its trend level and
troughs when it is farthest below its
trend level.
The cyclical indicators approach is a
widely accepted technique used to
analyze current and prospective
economic conditions. This approach
identifies specific economic indicators
that typically systematic lead, coincide
or lag the cyclical movements in
business activity.
Each of the indicators selected for
inclusion in a system of leading
indicators must have a theoretical
-15-
dari sudut teori bagi kecenderungannya
untuk mendahului aktiviti ekonomi secara
sistematik. Prinsip yang sama digunakan
bagi penunjuk yang terpilih sebagai
sebahagian daripada siri penunjuk
susulan, iaitu perlu mempunyai rasional
dari segi teori bagi sifatnya sebagai
penyusul. Tambahan pula, penunjuk yang
dipilih adalah untuk menyatakan dan
digunakan dalam hubungan sistematik
komponen antara tempoh masa yang
panjang dan perubahan keadaan
ekonomi yang berlaku dalam tempoh
tersebut.
Penunjuk Pelopor, Serentak dan
Susulan
Penunjuk ekonomi Malaysia terdiri
daripada indeks komposit bagi penunjuk
pelopor, serentak dan susulan.2 Indeks-
indeks ini adalah ringkasan ukuran yang
dibentuk untuk menghasilkan isyarat
perubahan tentang haluan aktiviti
ekonomi Malaysia. Setiap indeks
rationale for its systematic tendency to
lead economic activity. The same
holds true for those selected as part of
a series of lagging indicators, i.e. there
must be a theoretical rationale for their
behaviour as laggers. In addition, the
indicators are selected to display and
put to use systematic relationships
which were obtained over long periods
of time and changes in economic
situation.
Leading, Coincident and Lagging
Indicators
The Malaysian economic indicators
consist of composite indices of leading,
coincident and lagging indicators.2
These indices are summary measures
designed to signal changes in the
direction of the Malaysian economic
activity. Each index measures the
-16-
mengukur gelagat agregat bagi kumpulan
aktiviti ekonomi yang menunjukkan
tempoh yang selari dengan pusingan
kitaran perniagaan tetapi mewakili aktiviti
yang berbeza. Penunjuk serentak
merupakan ukuran komprehensif untuk
prestasi ekonomi keseluruhan. Ia
memberitahu kedudukan ekonomi
semasa. Penunjuk pelopor ialah sejenis
ukuran jangkaan atau komitmen baru
terhadap aktiviti yang akan memberi
kesan kepada ekonomi keseluruhan
untuk masa hadapan. Ia memberitahu ke
mana arah tuju ekonomi. Antara tanda
awal bahawa pengembangan mungkin
mula menurun ialah penurunan yang
berterusan oleh kadar pertumbuhan
indeks pelopor. Penunjuk susulan
memberitahu apa yang sebenarnya telah
berlaku. Ia mengukur prestasi pergerakan
kitaran bagi penunjuk pelopor dan
penunjuk serentak.
aggregate behaviour of a group of
economic activities that show similar
timing at business cycle turns but
represent different activities. The
coincident indicators are
comprehensive measures of the overall
economic performance of the
economy. They tell us where we are.
The leading indicators are typically
measures of anticipations or new
commitments to economic activity
which will affect the overall economy in
the months ahead. They tell us where
we are going. Among the earlier signs
that an ongoing expansion may start to
decelerate is a sustained decline in the
leading index growth rate. Lagging
indicators tell us what had happened to
the economy. It measures the
performance of cyclical movements of
the leading and coincident indicators.
-17-
Oleh kerana jarang terdapat penunjuk
yang boleh dipercayai sepenuhnya dalam
menjangka pusingan kitaran jika
digunakan secara individu, penunjuk-
penunjuk tersebut harus disatukan
kepada komposit indeks. Oleh itu,
penunjuk pelopor disatukan kepada
komposit indeks pelopor, penunjuk-
penunjuk serentak disatukan kepada
komposit indeks serentak dan juga
penunjuk susulan disatukan kepada
komposit indeks susulan. Pada umumnya
komposit lebih berupaya menghasilkan
isyarat titik pusing berbanding penunjuk
secara individu.
Kadar Pertumbuhan
Kadar pertumbuhan pelopor, serentak
dan susulan Malaysia adalah perubahan
terlicin enam bulan pada kadar tahunan.
Kadar tahunan 6-bulan terlicin adalah
berasaskan kepada nisbah indeks
bulanan semasa terhadap purata indeks
ke atas dua belas bulan sebelumnya.3
Since few indicators are completely
reliable in anticipating cyclical turns
when used alone, it is desirable to
combine them into a composite index.
Therefore, leading indicators are
combined into a composite leading
index, coincident indicators into a
composite coincident index and also
combined the lagging indicators into a
composite lagging index. The
composites are generally more reliable
in warning of turning points than
individual indicators.
Growth Rates
The Malaysian leading, coincident and
lagging growth rates are 6-month
smoothed changes at annual rates.
The 6-month smoothed annual rate is
based on the ratio of the current month
index to the average index over the
preceding 12 months.3
-18-
1 Arthur F. Burns and Wesley C. Mitchell, Measuring Business Cycles, National Bureau of Economic
Research, N.Y., 1945, page 3.
2 Indeks komposit dikira berasaskan kaedah Moore-Shiskin di mana mengandungi kadar
pertumbuhan komponen indeks bulan ke bulan dipuratakan selepas penyelarasan komponen
tersebut kepada unit yang sama, dan kemudiannya mengumpulkan kadar pertumbuhan purata ini
kepada indeks. Indeks ini diselaras supaya (1) peratus perubahan purata mutlak sebagai
komponen kitaran bagi indeks pengeluaran perindustrian; dan (2) kadar pertumbuhan purata yang
sama dengan arah aliran sebagai KDNK benar.
The composite indices are calculated using the Moore-Shiskin method which consists of averaging
the month-to-month growth rates of the index components, after standardizing them to the same
units, and then cumulating this average growth rate into an index. This index is then adjusted to have
(1) the same average absolute percent changes as the cyclical component of industrial production;
and (2) the same average trend rate of growth as real GDP.
3 Disebabkan sela antara titik tengah bulan semasa dan bulan-bulan terdahulu ialah 6.5 bulan, nisbah
tersebut diselaras kepada kuasa 12/6.5 bagi mencapai maksud kadar tahunan terkompaun.
Because the interval between the mid-points of the current month and the preceding months is 6.5
months, the ratio is raised to the 12/6.5 power to derive a compound annual rate.