Embed Size (px)
Citation preview

3/10/2010
1
Old Dominion University Hampton Roads Real Estate Market Review and Forecast
20102010
Presented by: E.V. Williams
Center for Real Estate and Economic Development John R. Broderick, President
Nancy Bagranoff, DBA; Dean, College of Business & Public Administration, Old Dominion University
Industry Professional Advisors to the Center (IPAC)
Honorary Member
Robert M. Stanton, CSM and CPM, Stanton Partners, Inc.
Jeff Ainslie, Ainslie Group
G. Robert Aston, Jr., TowneBank
Ramon W. Breeden, Jr., The Breeden Company
Sanford (Sandy) M. Cohen, Divaris Real Estate, Inc.
Michael Newsome, Clark Whitehill Enterprises, Inc.
Harrison J. Perrine, Perrine Investments
Don Perry, Continental Development
Victor L. Pickett, Grandbridge Real Estate Capital, LLC
Thomas E. Robinson, Robinson Development Group
Jim V. Rose, Rose & Womble Realty Co., LLC
Bradley R. Sanford, MAI, Dominion Realty AdvisorsCraig Cope, Liberty Property Trust
Cecil V. Cutchins, Olympia Development Corporation
Robert L. Dewey, Willcox & Savage, PC
Thomas M. Dillon, Fulton Bank
N. Joseph Dreps, BB&T
Pamela J. Faber, LeClair Ryan
Joel T. Flax, CPA, Goodman & Company
David M. Gianascoli, Gee's Group Real Estate Development
John L. Gibson, III, Ellis-Gibson Development Group
Warren Harris, City of Virginia Beach Economic Development
Aubrey L. Layne, Jr., Great Atlantic Management, LLC
Miles B. Leon, S. L. Nusbaum Realty Company
Michael W. McCabe, Harvey Lindsay Commercial Real Estate
y , , y
Burrell F. Saunders, CMSS Architects, PC
Reese Smith, Reese Smith & Associates
Tony Smith, Robinson Development Group
Deborah K. Stearns, CPM, SIOR, Harvey Lindsay Commercial Real Estate
Richard Thurmond, William E. Wood
Jon S. Wheeler, Wheeler Interests
Robert T. Williams, Tri City Developers, LLC
Rod Woolard, City of Norfolk Economic Development
Steven Wright, City of Chesapeake Economic Development
CREED CouncilJ. Scott Adams, CB Richard Ellis of Virginia, Inc.
Tom Atherton, MEB General Contractors
Jim Bradshaw, Woolpert LLP
Stewart Buckle, II, The Morgan Real Estate Group
M. Albert Carmichael, Harvey Lindsay Commercial Real Estate
W. Page Cockrell, Hurt & Proffitt
David Collier, First Atlantic Restoration
Lawrence J. Colorito, Jr., MAI, Axial Advisory Group, LLC
Hahns L. Copeland, DARVA Group LLC
Ann K. Crenshaw, Kaufman & Canoles, PC
Don Crigger, CCIM, CB Richard Ellis
Jon R. Crunkleton, Old Dominion University
Rennie Richardson, Richardson Real Estate Corporation
Maureen G. Rooks, Thalhimer/Cushman & Wakefield
Jim V. Rose, Rose & Womble Realty Company, LLC
J. Randy Royal, Kimley-Horn and Associates
Robert J. Ruhl, City of Virginia Beach Economic Development
Stephanie Sanker, S. L. Nusbaum Realty Co.
Paula J. Shendow, Wireless Capital Partners
Robert M. Sherman, III, CPM, Harrison & Lear Inc. Realtors
Kenneth Sisk, P.E., Bowman Consulting Group
Anthony W. Smith, Robinson Development Group
Dorcas T. Helfant-Browning, DTH Properties, LLC
Virginia P. Henderson, MAI, Commercial First Appraisers, LLC
Charles Hutchison, Vanasse Hangen Brustlin, Inc.
Michael A. Inman, Inman & Strickler, P.L.C.
Cherie James, Wall, Einhorn & Chernitzer, P.C.
Terry Johnson, Abbitt Realty
Mallory Kahler, City of Portsmouth Economic Development
E. Andrew Keeney, Kaufman & Canoles, P.C.
R.I. King, II, Thalhimer/Cushman & Wakefield
William E. King, SIOR, Harvey Lindsay Commerical Real Estate
Kim Curtis, Tidewater Home Funding
William G. Darden, Hearndon Construction Company
George C. Davis, West Neck Community Association
Laura B. de Graaf, Bank of America
Michael Divaris, Divaris Real Estate, Inc.
Helen Dragas, The Dragas Companies
Brian Dundon, Dundon & Associates
Frederick D. Facka, Tuckahoe Asset Management
Sandra Ferebee, GSH Residential Sales
Brian E. Gordineer, A.A.S., City of Hampton, Office of the Assessor
Howard E. Gordon, Williams Mullen
Dennis W. Gruelle, Appraisal Consultation Group
Jonathan S. Guion, SIOR, Jonathan Commercial Properties
Elizabeth O. Hancock, Office of Real Estate Assessor, City of Norfolk
Russell G. Hanson, Jr., Hanson Capital, LLC
Carl Hardee, Lawson Realty Corporation
John Harry, John C. Harry, Inc.
Anthony W. Smith, Robinson Development Group
Jeremy R. Starkey, Monarch Capital, LLC
Daniel R. Stegall, Daniel Richard Stegall, PC
Terrie L. Suit, Williams Mullen
Leo Sutton, Historic Ventures, LLC
Michael Sykes, Bank of America
Robert M. Thornton, CRE, CCIM, SIOR, Thalhimer/Cushman & Wakefield
William C. Throne, SIOR, CCIM, ALC, Thalhimer/Cushman & Wakefield
Jamie Tollenaere, Clancy & Theys Construction
Stewart Tyler, ASA, Righy of Way Acquisitions & Appraisals
George D. Vick, III, Harvey Lindsay Commercial Real Estate
Edward W. Ware, Norfolk Redevelopment & Housing
H. Mac Weaver, II, Wells Fargo Real Estate Group
Edward M. Williams, William E. Wood & Associates
F. Blair Wimbush, Norfolk Southern Corporation
Peter E. Winters, Jr., Axial Advisory Group, LLC
Chris Wood, JD & W
John Wright, Waverton Associates
Estate
April Koleszar, Koleszar Properties, Inc.
Barry M. Kornblau, Summit Realty Group, Inc.
Tyler Leinbach, Meredith Construction Company, Inc.
John R. (Jack) Lewis, II, ECS Mid-Atlantic, LLC
Harvey Lindsay, Jr., Harvey Lindsay Commercial Real Estate
Susan Long-Molnar, Managing Communications Consulting
Jeffrey R. Mack, The CIM Group
Lauren Marsh, Frye Properties
Mike Mausteller
G. Cliff Moore, Virtexco Corporation
Michael Nice, George Nice and Sons, Inc.
Thomas O'Grady, KBS, Inc.
James N. Owens, CCIM, Harvey Lindsay Commercial Real Estate
Robert L. Philips, Jr., Thalhimer/Cushman & Wakefield
Victor L. Pickett, Grandbridge Real Estate
Sandra Prestridge, City of Norfolk Economic Development
Chris Read, CB Richard Ellis
F. Craig Read, Read Commercial Properties
John C. Richards, Jr., CB Richard Ellis/Melody & Co.
Executive CommitteeExecutive Committee
Chair Brad Sanford
Director John Lombard
Program Chair Stephanie Sanker
Publications Chair Brian Dundon
Membership Chair Craig Cope
Curriculum Co‐Chairs Jon Crunkleton, Brad Sanford
Sponsorship Chair Fred Facka
By‐Laws Chair Andrew Keeney
Past Chair Tom Dillon
At‐Large Jonathan Guion
Billy King
Aubrey Layne

3/10/2010
2
Market Review CommitteeMarket Review Committee
Industrial Bill Throne and Stephanie Sanker
Office Scott Adams
Retail David Machupa and David ChapmanRetail David Machupa and David Chapman
Multi‐family Charles Dalton/Real Data
Residential Blair Hardesty and Van Rose
Investment Scott Adams
Publications Committee
Brian Dundon
Nancy Gossett
Elizabeth Hancock
Sandi Prestridge
Maureen Rooks
Brad SanfordElizabeth Hancock
Janice Hurley
Joy Learn
Brad Sanford
Lane Shea
Kristi Sutphin
Special thank you to
Inside Business
for their sponsorship
over the past seven years.
Program Moderator
Michael J. Seiler, Ph.D.Professor and
Robert M. Stanton Chair of Real Estate and Economic Development
Investment Market Review
Presented By:
J. Scott Adams, CCIMJ. Scott Adams, CCIMPresident, Mid-South Region
March 10, 2010
Investment Market Review
Trends in Property Sales (DOWN!)• Nationally• Hampton Roads
Trends in Distressed Assets (UP!)
TOPICS TO COVER
CB Richard Ellis | Page 12
The Lending Market Today (IT DEPENDS)
Commercial Real Estate as an Investment Class(A WINNER OVER THE LONG TERM)

3/10/2010
3
Trends in Property Sales Nationally
National Sales Transactions of $5 Million or Greater
$250,000,000
$300,000,000
$350,000,000
$400,000,000
$450,000,000
$500,000,000
$443.4 Billion
CB Richard Ellis | Page 13
$0
$50,000,000
$100,000,000
$150,000,000
$200,000,000
$250,000,000
2007 2008 2009
$135.4 Billion
$51.1 Billion
Source: Real Capital Analytics
$600 000 000
$800,000,000
$1,000,000,000
$1,200,000,000
Local Sales Transactions of $5 Million or Greater
$602.3 Million
$1.083 Billion
Trends in Property Sales Hampton Roads
CB Richard Ellis | Page 14
$0
$200,000,000
$400,000,000
$600,000,000
2007 2008 2009
$139.5 Million
Source: CB Richard Ellis Market Research
2009 Top Local Sales Transactions: Multi-Family
Springhouse @ Newport The Townes @ Jones Run
CB Richard Ellis | Page 15
Woodshire Apartments
Harbour View East
2009 Top Local SalesTransactions: Retail
CB Richard Ellis | Page 16
London Bridge Shopping Center
2009 Top Local Sales Transactions: Retail
CB Richard Ellis | Page 17
2009 Top Local Sales Transaction: OfficeLynnwood Plaza
CB Richard Ellis | Page 18

3/10/2010
4
Trends in Distressed Assets
WHAT IS A “DISTRESSED ASSET”?
A loan default has occurred or is imminent
CB Richard Ellis | Page 19
and/or
The owner/sponsor of the asset is bankrupt or faces financial trouble
Trends in Distressed Assets
CB Richard Ellis | Page 20
The Lending Market TodayHOW IS THE LENDING MARKET TODAY?
It Depends!
1) By Property Type
Multi-Family vs. all other Property Types
2) By Asset StabilityStable Positive Cash Flow
CB Richard Ellis | Page 21
Stable Positive Cash Flow
vs.
Unstable Positive or Negative Cash Flow
3) By Investor Type (For Office and Industrial Assets)
Owner-Occupants vs. Traditional Investors
Commercial Real Estate vs. Stocks and BondsHigher Returns for real estate over a 5 and 10 year hold period
Commercial Real Estate as an Investment
CB Richard Ellis | Page 22
Source: NCREIF, Delta Associates; January 2010: for 12 month periods ending September 2009.
Commercial Real Estate as an Investment
CB Richard Ellis | Page 23
GAME PLAN FOR SUCCESSFOR SERVICE PROVIDERS
Be sensitive to the stress on real estate owners
Educate our clients with fresh, thorough information
Investment Market Review
CB Richard Ellis | Page 24
Seize every opportunity for our clients
Make a difference in our clients’ lives

3/10/2010
5
2009 ODU / CREED INDUSTRIAL REVIEW
Presented by:
William C. Throne, CCIM, SIOR, ALC
2009 ODU / CREED INDUSTRIAL REVIEW
3
NUMBERS
2009 ODU / CREED INDUSTRIAL REVIEW
12 9412 94
First Number:
12.9412.94
2009 ODU / CREED INDUSTRIAL REVIEW
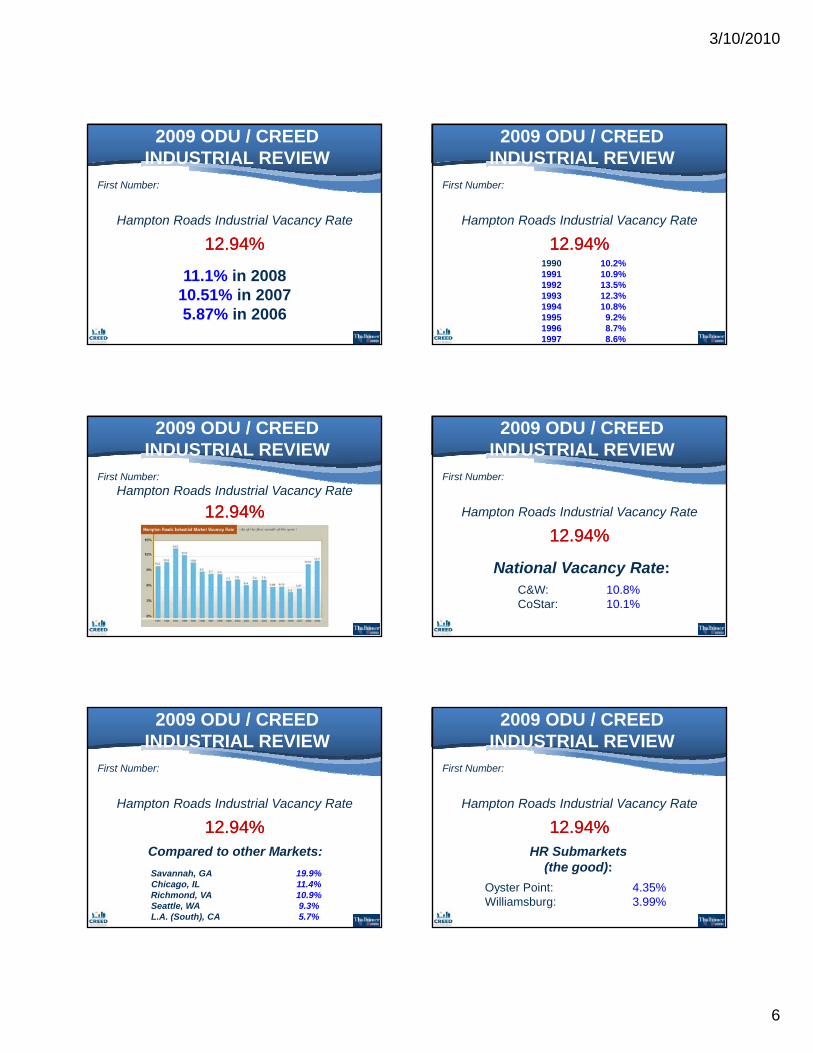
Hampton Roads Industrial Vacancy Rate
First Number:
12.94%12.94%
2009 ODU / CREED INDUSTRIAL REVIEW
Hampton Roads Industrial Vacancy Rate
First Number:
87.06% occupied!
12.94%12.94%
2009 ODU / CREED INDUSTRIAL REVIEW
Hampton Roads Industrial Vacancy Rate
First Number:
11.1% in 2008
12.94%12.94%
3/10/2010
6
2009 ODU / CREED INDUSTRIAL REVIEW
Hampton Roads Industrial Vacancy Rate
First Number:
12.94%12.94%
11.1% in 200810.51% in 20075.87% in 2006
2009 ODU / CREED INDUSTRIAL REVIEW
Hampton Roads Industrial Vacancy Rate
First Number:
1990 10.2%1991 10.9%1992 13.5%1993 12.3%1994 10.8%1995 9.2%1996 8.7%1997 8.6%
12.94%12.94%
2009 ODU / CREED INDUSTRIAL REVIEW
12.94%12.94%Hampton Roads Industrial Vacancy Rate
First Number:
2009 ODU / CREED INDUSTRIAL REVIEW
Hampton Roads Industrial Vacancy Rate
First Number:
National Vacancy Rate:C&W: 10.8%CoStar: 10.1%
12.94%12.94%
2009 ODU / CREED INDUSTRIAL REVIEW
Hampton Roads Industrial Vacancy Rate
First Number:
Compared to other Markets:
Savannah, GA 19.9%Chicago, IL 11.4%Richmond, VA 10.9%Seattle, WA 9.3%L.A. (South), CA 5.7%
12.94%12.94%
2009 ODU / CREED INDUSTRIAL REVIEW
Hampton Roads Industrial Vacancy Rate
First Number:
HR Submarkets (the good):
Oyster Point: 4.35%Williamsburg: 3.99%
12.94%12.94%

3/10/2010
7
2009 ODU / CREED INDUSTRIAL REVIEW
Hampton Roads Industrial Vacancy Rate
First Number:
HR Submarkets (the good):
Peninsula: 9.49%
12.94%12.94%
2009 ODU / CREED INDUSTRIAL REVIEW
Hampton Roads Industrial Vacancy Rate
First Number:
HR Submarkets (the good):
Lowered Vacancy in 2009:
*Bainbridge *Lynnhaven *Portsmouth*Copeland *Oakland *Williamsburg
12.94%12.94%
2009 ODU / CREED INDUSTRIAL REVIEW
Hampton Roads Industrial Vacancy Rate
First Number:
HR Submarkets (the not-so-good):
Norfolk Commerce Park: 38.41%Isle of Wight: 28.45%Suffolk: 19.13%
12.94%12.94%
2009 ODU / CREED INDUSTRIAL REVIEW
44
Second Number:
44
2009 ODU / CREED INDUSTRIAL REVIEW
Rental Rate a Landlord would love to get fordistribution space
Second Number:
$4.00 NNN $4.00 NNN psfpsf/yr/yr
distribution space
2009 ODU / CREED INDUSTRIAL REVIEW
Rental Rate a Landlord would love to get fordistribution space
Second Number:
*This will remain something of a benchmark for warehouse space.
*Market rents for other subgroups will cluster around:
$4.75-$5.75 NNN for general industrial$5.50-$6.50 NNN for higher rent submarkets
$4.00 NNN $4.00 NNN psfpsf/yr/yr
distribution space
3/10/2010
8
2009 ODU / CREED INDUSTRIAL REVIEW
44
Second Number:
44
2009 ODU / CREED INDUSTRIAL REVIEW
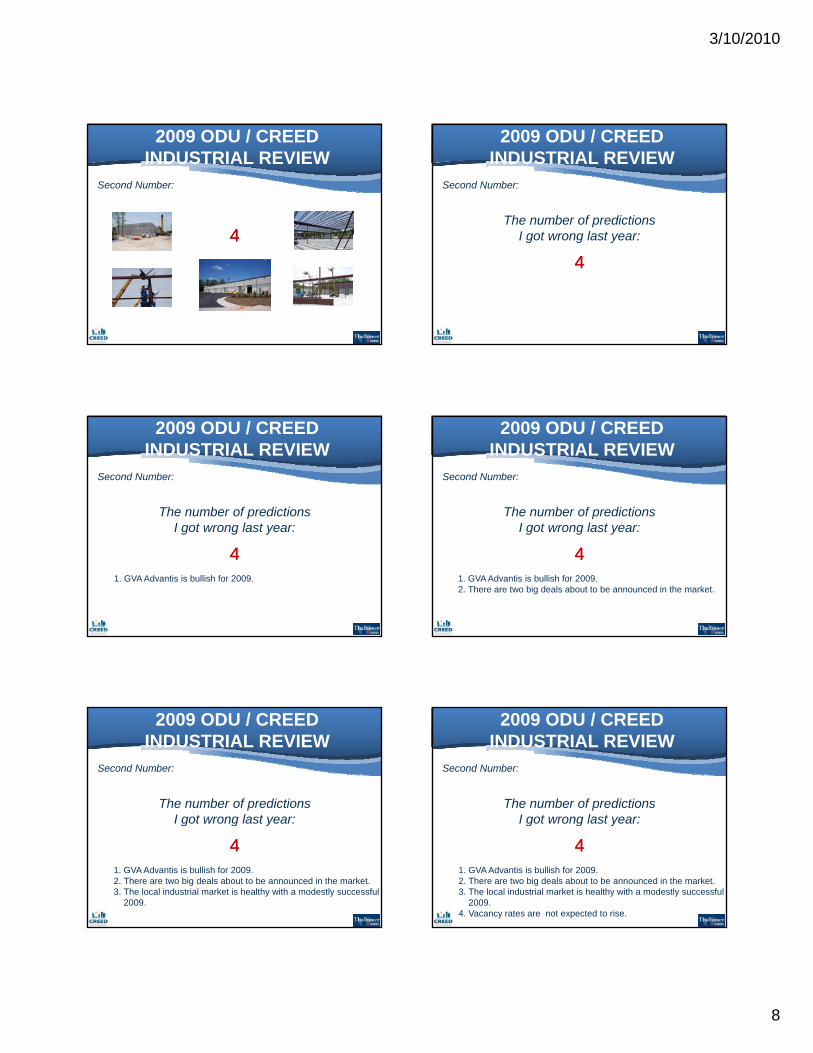
The number of predictionsI got wrong last year:
Second Number:
44
I got wrong last year:
2009 ODU / CREED INDUSTRIAL REVIEW
The number of predictionsI got wrong last year:
Second Number:
44
I got wrong last year:
1. GVA Advantis is bullish for 2009.
2009 ODU / CREED INDUSTRIAL REVIEW
The number of predictionsI got wrong last year:
Second Number:
44
I got wrong last year:
1. GVA Advantis is bullish for 2009.2. There are two big deals about to be announced in the market.
2009 ODU / CREED INDUSTRIAL REVIEW
The number of predictionsI got wrong last year:
Second Number:
44
I got wrong last year:
1. GVA Advantis is bullish for 2009.2. There are two big deals about to be announced in the market.3. The local industrial market is healthy with a modestly successful
2009.
2009 ODU / CREED INDUSTRIAL REVIEW
The number of predictionsI got wrong last year:
Second Number:
44
I got wrong last year:
1. GVA Advantis is bullish for 2009.2. There are two big deals about to be announced in the market.3. The local industrial market is healthy with a modestly successful
2009.4. Vacancy rates are not expected to rise.
3/10/2010
9
2009 ODU / CREED INDUSTRIAL REVIEW
The number of ‘big’ deals in the market this year:
Second Number:
44
this year:
1. Virginia Beach2. Chesapeake3. Norfolk4. Suffolk
2009 ODU / CREED INDUSTRIAL REVIEW
1010
Third Number:
1010
2009 ODU / CREED INDUSTRIAL REVIEW
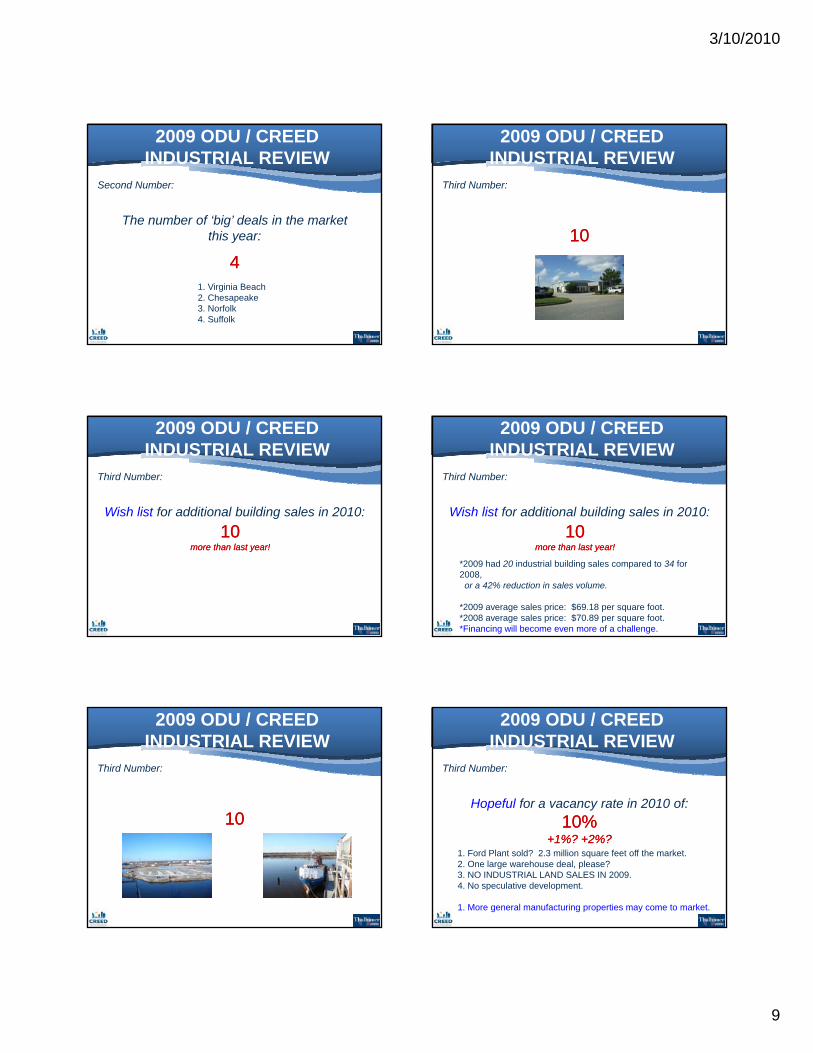
Wish list for additional building sales in 2010:
Third Number:
101010 10 more than last year!more than last year!
2009 ODU / CREED INDUSTRIAL REVIEW
1010Wish list for additional building sales in 2010:
Third Number:
10 10 more than last year!more than last year!
*2009 had 20 industrial building sales compared to 34 for 2008,or a 42% reduction in sales volume.
*2009 average sales price: $69.18 per square foot.*2008 average sales price: $70.89 per square foot.*Financing will become even more of a challenge.
2009 ODU / CREED INDUSTRIAL REVIEW
1010
Third Number:
1010
2009 ODU / CREED INDUSTRIAL REVIEW
10%10%Hopeful for a vacancy rate in 2010 of:
Third Number:
10% 10% +1%? +2%?+1%? +2%?
1. Ford Plant sold? 2.3 million square feet off the market.2. One large warehouse deal, please?3. NO INDUSTRIAL LAND SALES IN 2009.4. No speculative development.
1. More general manufacturing properties may come to market.
3/10/2010
10
2009 ODU / CREED INDUSTRIAL REVIEW
1010
Third Number:
1010
2009 ODU / CREED INDUSTRIAL REVIEW
How can I be successful in:
Third Number:
202010?10?1. You have to search for the hard-to-find eggs…
2009 ODU / CREED INDUSTRIAL REVIEW
How can I be successful in:
Third Number:
202010?10?1. You have to search for the hard-to-find eggs…2. Get your equity piece secure.
2009 ODU / CREED INDUSTRIAL REVIEW
How can I be successful in:
Third Number:
202010?10?1. You have to search for the hard-to-find eggs…2. Get your equity piece secure.3. Treat good tenants like the partners they are.
2009 ODU / CREED INDUSTRIAL REVIEW
How can I be successful in:
Third Number:
202010?10?1. You have to search for the hard-to-find eggs…2. Get your equity piece secure.3. Treat good tenants like the partners they are.4. Stay in touch with your lenders.
2009 ODU / CREED INDUSTRIAL REVIEW
How can I be successful in:
Third Number:
202010?10?1. You have to search for the hard-to-find eggs…2. Get your equity piece secure.3. Treat good tenants like the partners they are.4. Stay in touch with your lenders.5. Keep your sense of humor.
3/10/2010
11
2009 ODU / CREED INDUSTRIAL REVIEW
How can I be successful in:
Third Number:
202010?10?1. You have to search for the hard-to-find eggs…2. Get your equity piece secure.3. Treat good tenants like the partners they are.4. Stay in touch with your lenders.5. Keep your sense of humor.6. You want your friends to stay friends…
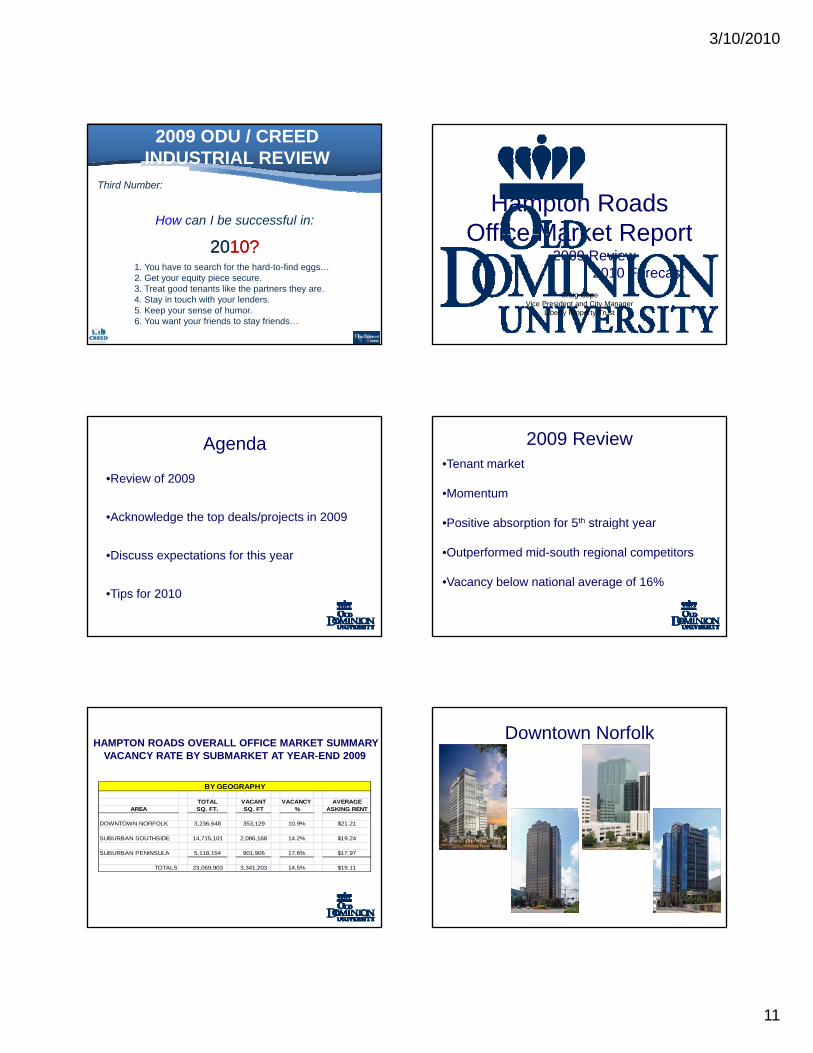
Hampton Roads Office Market ReportOffice Market Report
2009 Review2010 Forecast
Craig CopeVice President and City Manager
Liberty Property Trust
•Review of 2009
•Acknowledge the top deals/projects in 2009
Agenda
•Discuss expectations for this year
•Tips for 2010
•Tenant market
•Momentum
•Positive absorption for 5th straight year
2009 Review
Positive absorption for 5 straight year
•Outperformed mid-south regional competitors
•Vacancy below national average of 16%
TOTAL VACANT VACANCY AVERAGEAREA SQ. FT. SQ. FT % ASKING RENT
BY GEOGRAPHY
HAMPTON ROADS OVERALL OFFICE MARKET SUMMARY VACANCY RATE BY SUBMARKET AT YEAR-END 2009
DOWNTOWN NORFOLK 3,236,648 353,129 10.9% $21.21
SUBURBAN SOUTHSIDE 14,715,101 2,086,168 14.2% $19.24
SUBURBAN PENINSULA 5,118,154 901,906 17.6% $17.97
TOTALS 23,069,903 3,341,203 14.5% $19.11
Downtown Norfolk
3/10/2010
12
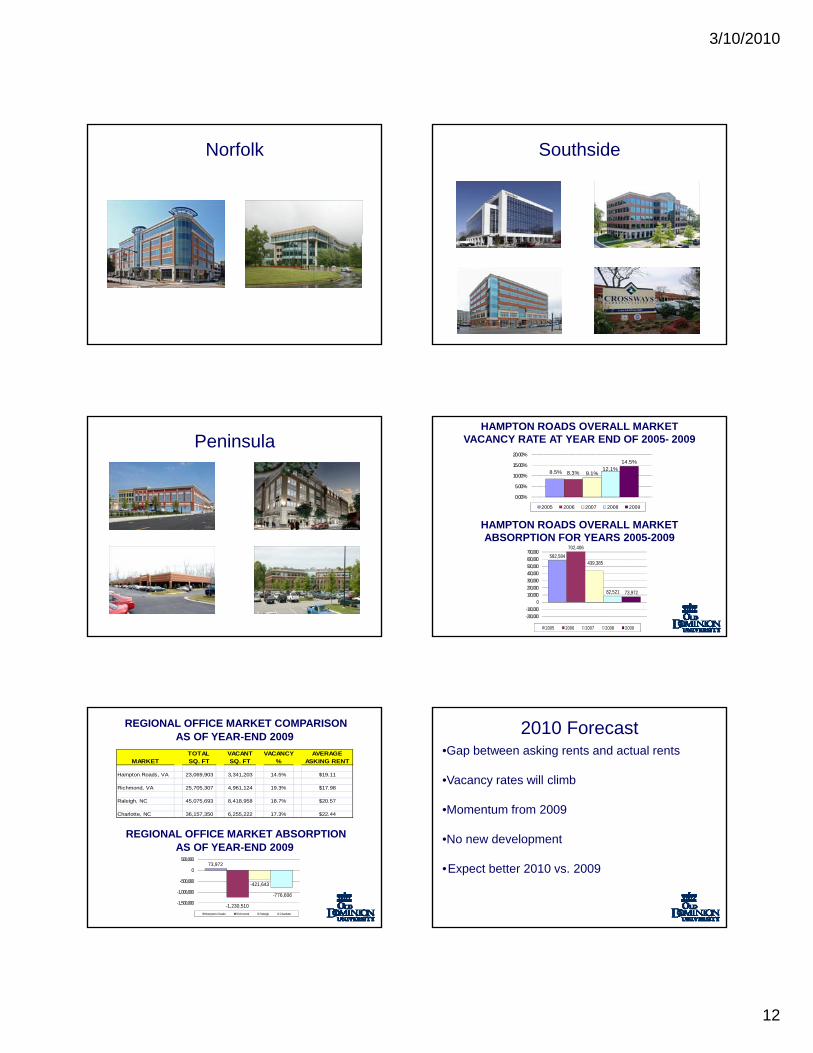
Norfolk Southside
Peninsula
8.5% 8.3% 9.1%12.1%
14.5%
0.00%
5.00%
10.00%
15.00%
20.00%
2005 2006 2007 2008 2009
HAMPTON ROADS OVERALL MARKET VACANCY RATE AT YEAR END OF 2005- 2009
HAMPTON ROADS OVERALL MARKET
582,584
702,406
439,385
82,521 73,972
-200,000-100,000
0100,000200,000300,000400,000500,000600,000700,000
2005 2006 2007 2008 2009
HAMPTON ROADS OVERALL MARKET ABSORPTION FOR YEARS 2005-2009
TOTAL VACANT VACANCY AVERAGEMARKET SQ. FT SQ. FT % ASKING RENT
Hampton Roads, VA 23,069,903 3,341,203 14.5% $19.11
Richmond, VA 25,705,307 4,961,124 19.3% $17.98
Raleigh, NC 45,075,693 8,418,958 18.7% $20.57
Charlotte, NC 36,157,350 6,255,222 17.3% $22.44
REGIONAL OFFICE MARKET COMPARISONAS OF YEAR-END 2009
REGIONAL OFFICE MARKET ABSORPTIONAS OF YEAR-END 2009
73,972
-1,230,510
-421,643
-776,606
-1,500,000
-1,000,000
-500,000
0
500,000
Hampton Roads Richmond Raleigh Charlotte
2010 Forecast•Gap between asking rents and actual rents
•Vacancy rates will climb
•Momentum from 2009
•No new development
•Expect better 2010 vs. 2009
3/10/2010
13
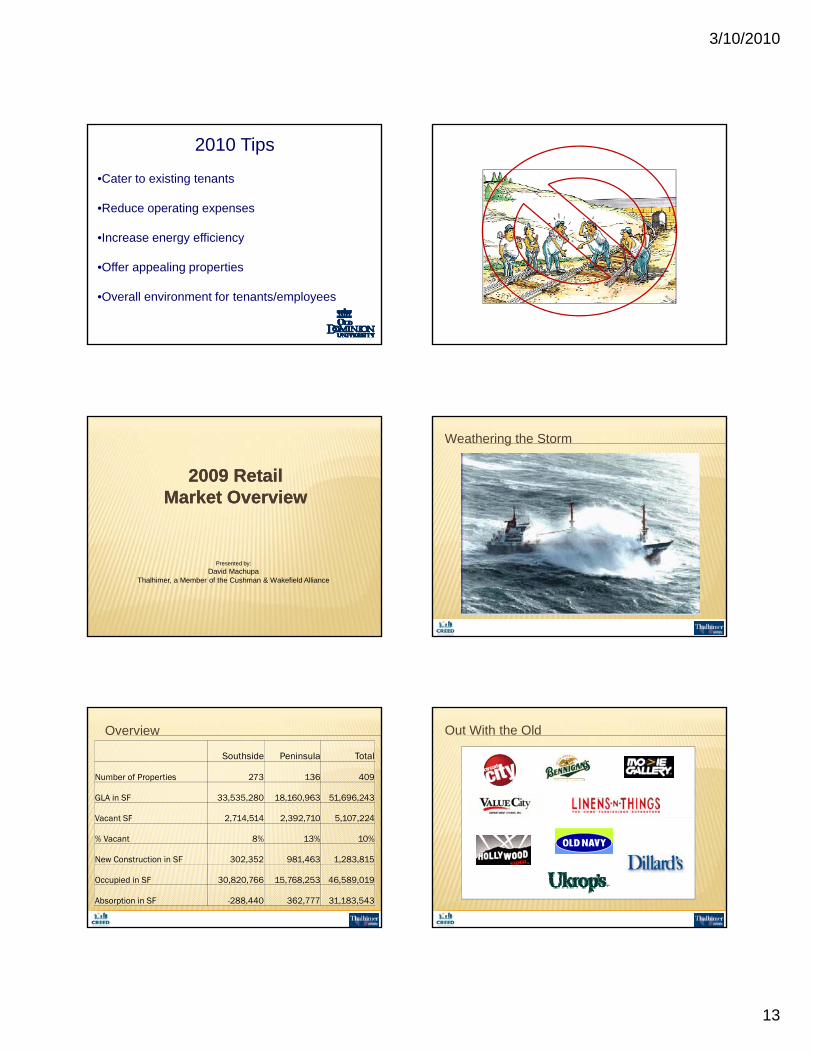
2010 Tips
•Cater to existing tenants
•Reduce operating expenses
I ffi i•Increase energy efficiency
•Offer appealing properties
•Overall environment for tenants/employees
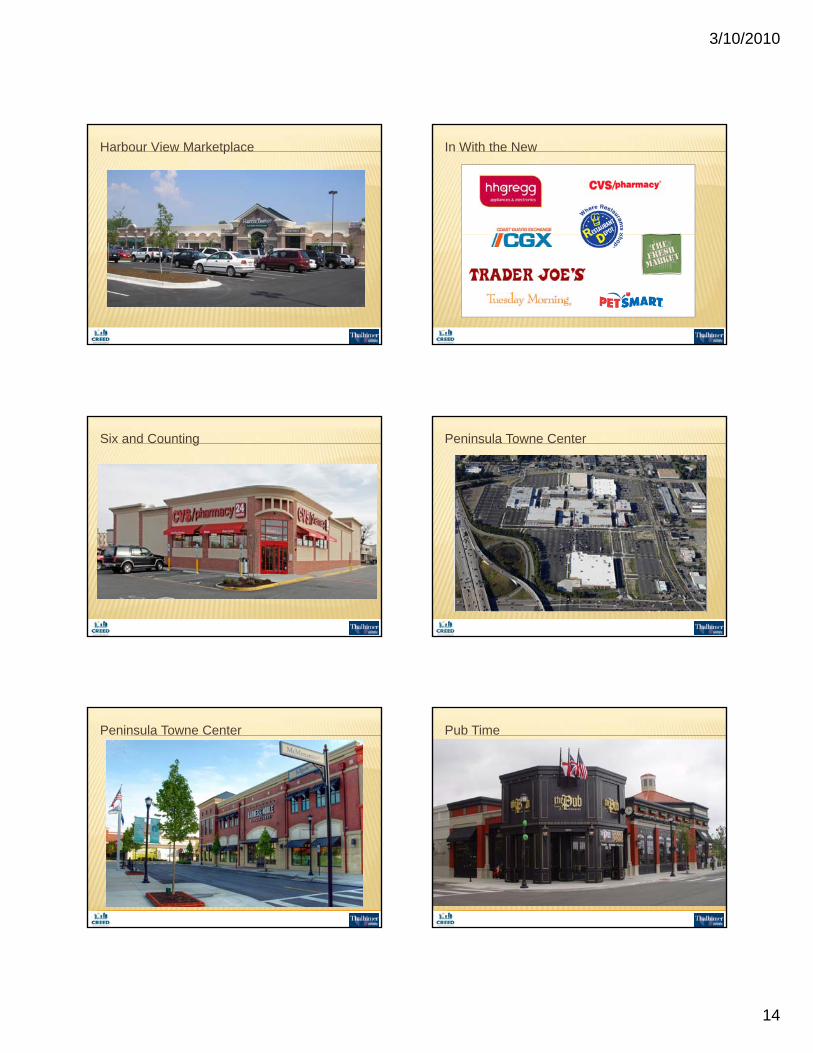
2009 Retail 2009 Retail Market OverviewMarket Overview
Presented by:
David MachupaThalhimer, a Member of the Cushman & Wakefield Alliance
Weathering the Storm
Overview
Southside Peninsula Total
Number of Properties 273 136 409
GLA in SF 33,535,280 18,160,963 51,696,243
Vacant SF 2 714 514 2 392 710 5 107 224Vacant SF 2,714,514 2,392,710 5,107,224
% Vacant 8% 13% 10%
New Construction in SF 302,352 981,463 1,283,815
Occupied in SF 30,820,766 15,768,253 46,589,019
Absorption in SF -288,440 362,777 31,183,543
Out With the Old
3/10/2010
14
Harbour View Marketplace In With the New
Six and Counting Peninsula Towne Center
Peninsula Towne Center Pub Time

3/10/2010
15
Presented By:
William H. HalprinSenior Vice President
Director of Operations, Multifamily Property ManagementS.L. Nusbaum Realty Co.
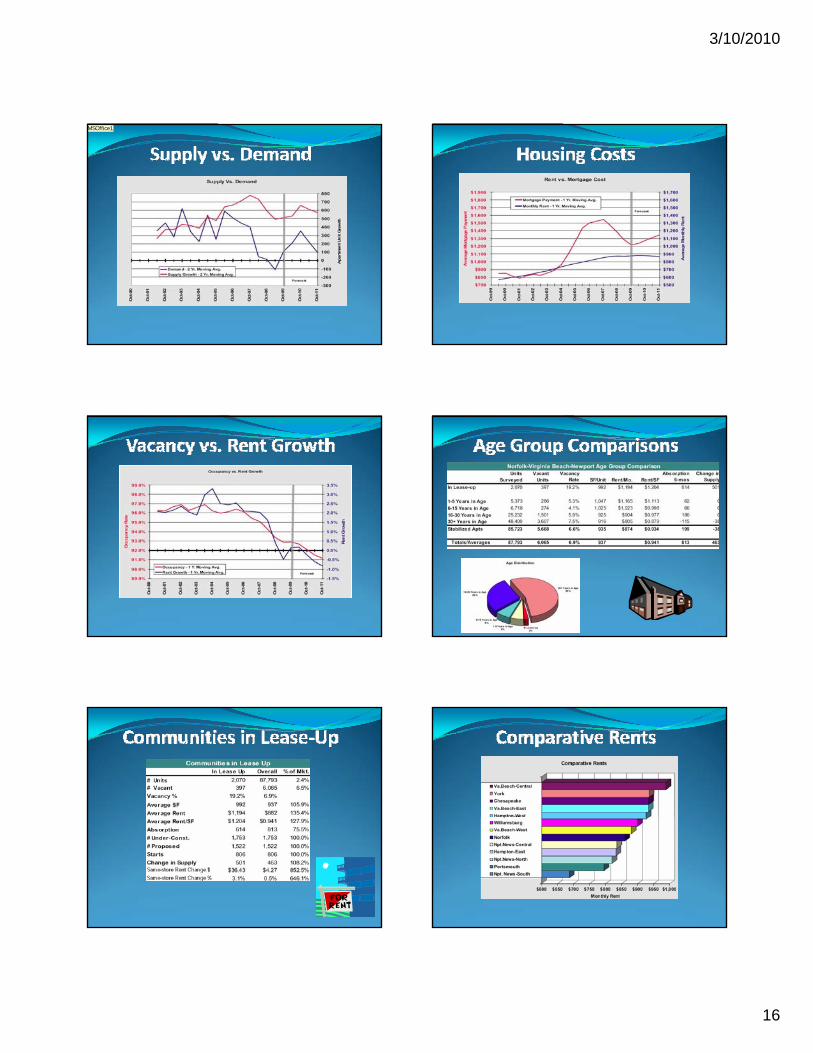
Stronger demand and a slower pace of construction improvedthe region’s average vacancy rate to 6.9%
During the 4th quarter of 2009, just 463 new units werecompleted and 813 units absorbed in the Hampton Roadsmarket.
There were 1,753 units under construction and an additional1,522 units proposed.
Based on the development pipeline, vacancy rates will movecloser to 8% in 2010.
Average rents are expected to remain flat.
3/10/2010
16
MSOffice1

Slide 91
MSOffice1 Susan Childress, 2/17/2010

3/10/2010
17
RESIDENTIALRESIDENTIALMARKET UPDATEMARKET UPDATE
20102010Van Rose, MIRMVan Rose, MIRM
President, Rose and President, Rose and WombleWomble New HomesNew Homes
2005 2007
200915 Year Closing15 Year Closing
New Construction & Resale HistoryNew Construction & Resale History
20,000
25,000
30,000
4,000
5,000
6,000
Source:
0
5,000
10,000
15,000
95 96 97 98 99 00 01 02 03 04 05 06 07 08 09
0
1,000
2,000
3,000
Existing Homes New Construction
3/10/2010
18
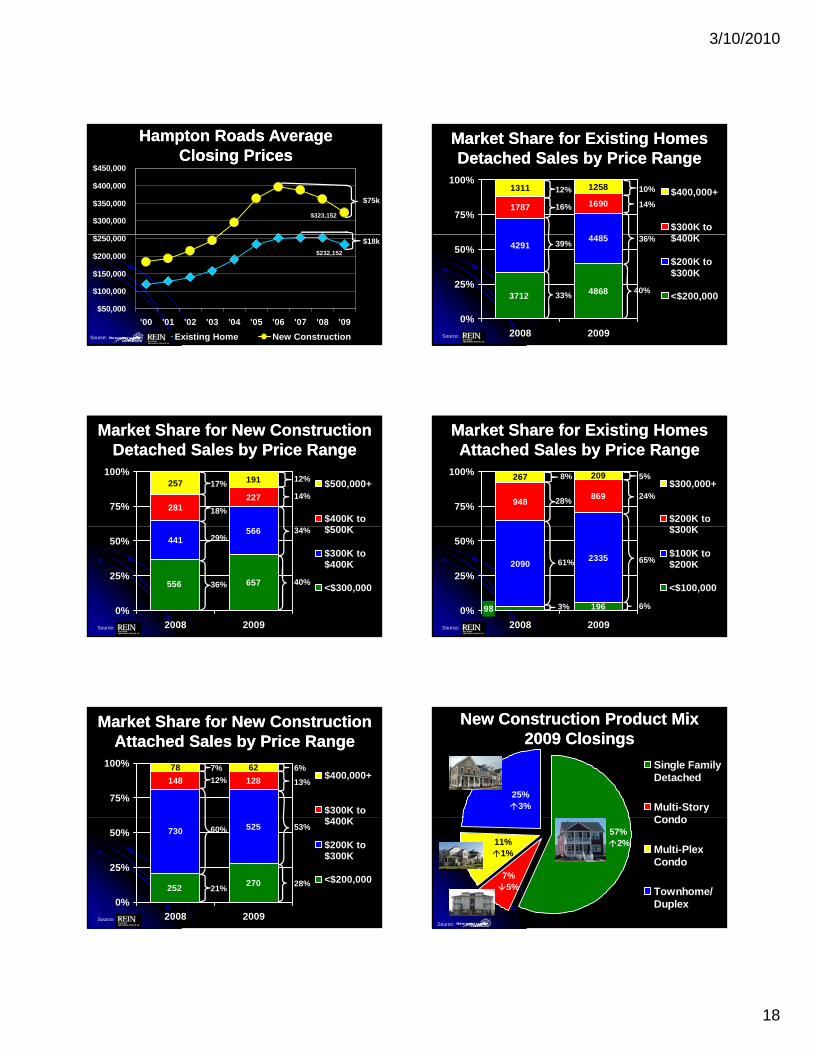
$323,152 $300,000
$350,000
$400,000
$450,000
Hampton Roads Average Hampton Roads Average Closing PricesClosing Prices
$75k
$232,152
$50,000
$100,000
$150,000
$200,000
$250,000
'00 '01 '02 '03 '04 '05 '06 '07 '08 '09
Existing Home New ConstructionSource:
$18k
Market Share for Existing Homes Market Share for Existing Homes Detached Sales by Price RangeDetached Sales by Price Range
1787 1690
1311 1258
75%
100%$400,000+
$300K to$400K
16%
12% 10%
14%
Source:
4868
42914485
3712
0%
25%
50%
2008 2009
$400K
$200K to$300K
<$200,00033%
39%36%
40%
Market Share for New Construction Market Share for New Construction Detached Sales by Price RangeDetached Sales by Price Range
281227
257 191
75%
100%$500,000+
$400K to$500K
18%
17%12%
14%
Source:
657
441566
556
0%
25%
50%
2008 2009
$500K
$300K to$400K
<$300,00036%
29%34%
40%
Market Share for Existing Homes Market Share for Existing Homes Attached Sales by Price RangeAttached Sales by Price Range
948869
267 209
75%
100%$300,000+
$200K to$300K
28%
8% 5%
24%
Source:
196
20902335
980%
25%
50%
2008 2009
$300K
$100K to$200K
<$100,000
3%
61% 65%
6%
Market Share for New Construction Market Share for New Construction Attached Sales by Price RangeAttached Sales by Price Range
148 128
78 62
75%
100%$400,000+
$300K to$400K
12%
7% 6%
13%
Source:
270
730 525
252
0%
25%
50%
2008 2009
$400K
$200K to$300K
<$200,00021%
60% 53%
28%
New Construction Product MixNew Construction Product Mix2009 Closings2009 Closings
25%3%
Single FamilyDetached
Multi-StoryCondo
Source:
57% 2%
7%5%
11% 1%
Condo
Multi-PlexCondo
Townhome/Duplex
3/10/2010
19
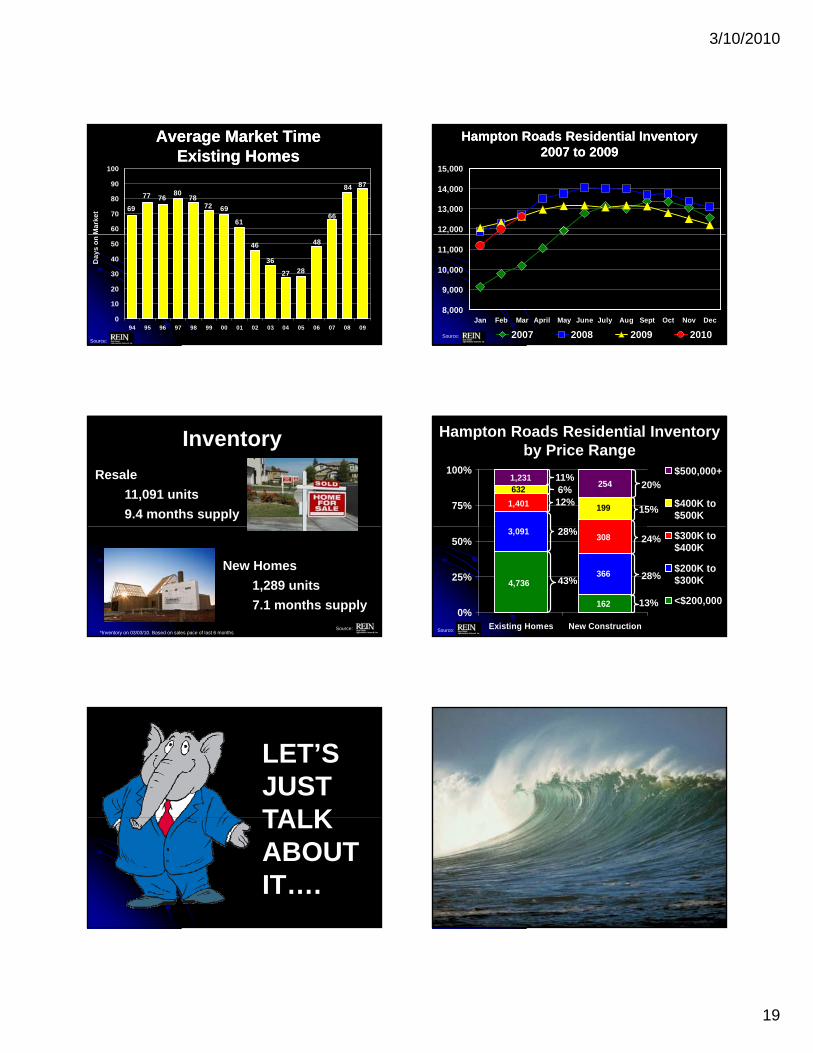
Average Market Time Average Market Time Existing HomesExisting Homes
87
69
77 7680
7872 69
6166
84
60
70
80
90
100
Ma
rke
t
Source:
46
36
27 28
48
0
10
20
30
40
50
94 95 96 97 98 99 00 01 02 03 04 05 06 07 08 09
Da
ys
on
12,000
13,000
14,000
15,000
Hampton Roads Residential InventoryHampton Roads Residential Inventory2007 to 20092007 to 2009
Source:
8,000
9,000
10,000
11,000
Jan Feb Mar April May June July Aug Sept Oct Nov Dec
2007 2008 2009 2010
Resale
11,091 units
9.4 months supply
Inventory
New Homes
1,289 units
7.1 months supply
Source: *Inventory on 03/03/10. Based on sales pace of last 6 months
Hampton Roads Residential Inventory by Price Range
1,231254
1,401
632
19975%
100% $500,000+
$400K to$500K
12%
11%20%
15%
6%
Source:
4,736
162
3,091
366
308
0%
25%
50%
Existing Homes New Construction
$300K to$400K
$200K to$300K
<$200,000
43%
28%24%
13%
28%
LET’S JUST TALKTALK ABOUT IT….
3/10/2010
20
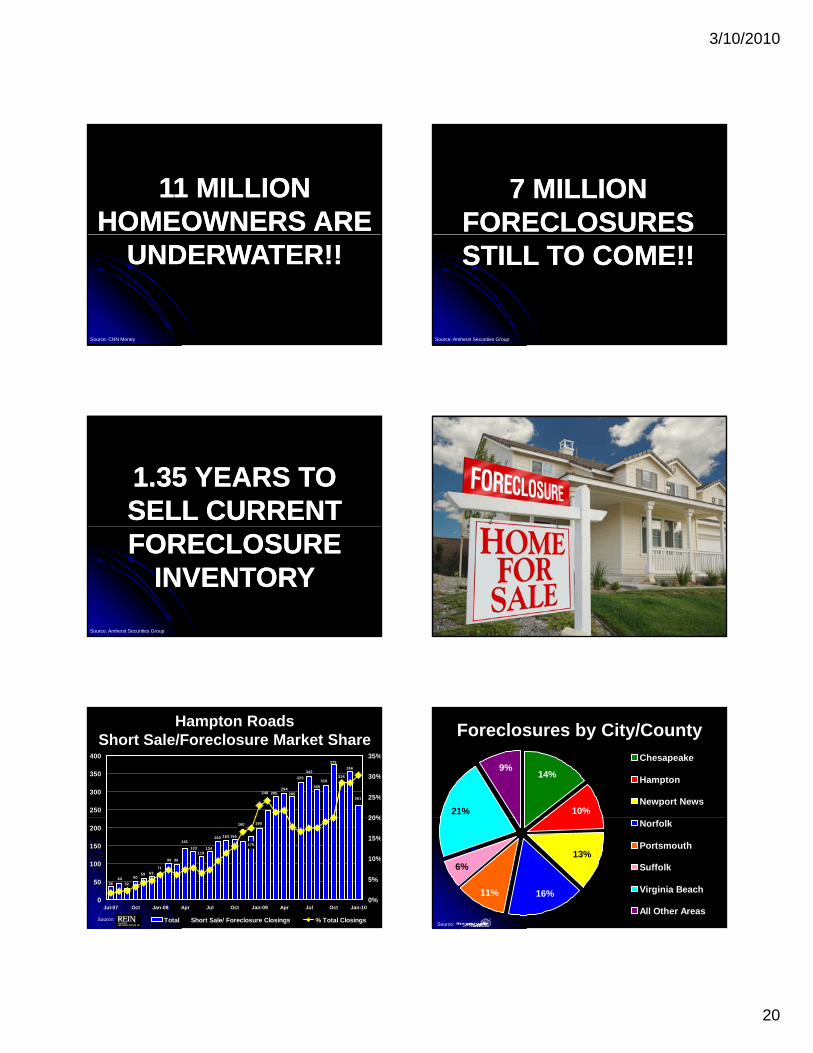
11 MILLION 11 MILLION HOMEOWNERS ARE HOMEOWNERS ARE
UNDERWATER!!UNDERWATER!!
Source: CNN Money
7 MILLION 7 MILLION FORECLOSURES FORECLOSURES STILL TO COME!!STILL TO COME!!
Source: Amherst Securities Group
1.35 YEARS TO 1.35 YEARS TO SELL CURRENT SELL CURRENT FORECLOSURE FORECLOSURE
INVENTORYINVENTORY
Source: Amherst Securities Group
294
342
261
356
326
375
318
305
325
285285248
250
300
350
400
20%
25%
30%
35%
Hampton Roads Short Sale/Foreclosure Market Share
Source:
3644
32
5059 63
71
99 96
141
133119
134
160 163 166
160
176
198
0
50
100
150
200
Jul-07 Oct Jan-08 Apr Jul Oct Jan-09 Apr Jul Oct Jan-100%
5%
10%
15%
20%
Total Short Sale/ Foreclosure Closings % Total Closings
Foreclosures by City/County
21%
9%14%
10%
Chesapeake
Hampton
Newport News
Source:
16%11%
6%13%
Norfolk
Portsmouth
Suffolk
Virginia Beach
All Other Areas
3/10/2010
21
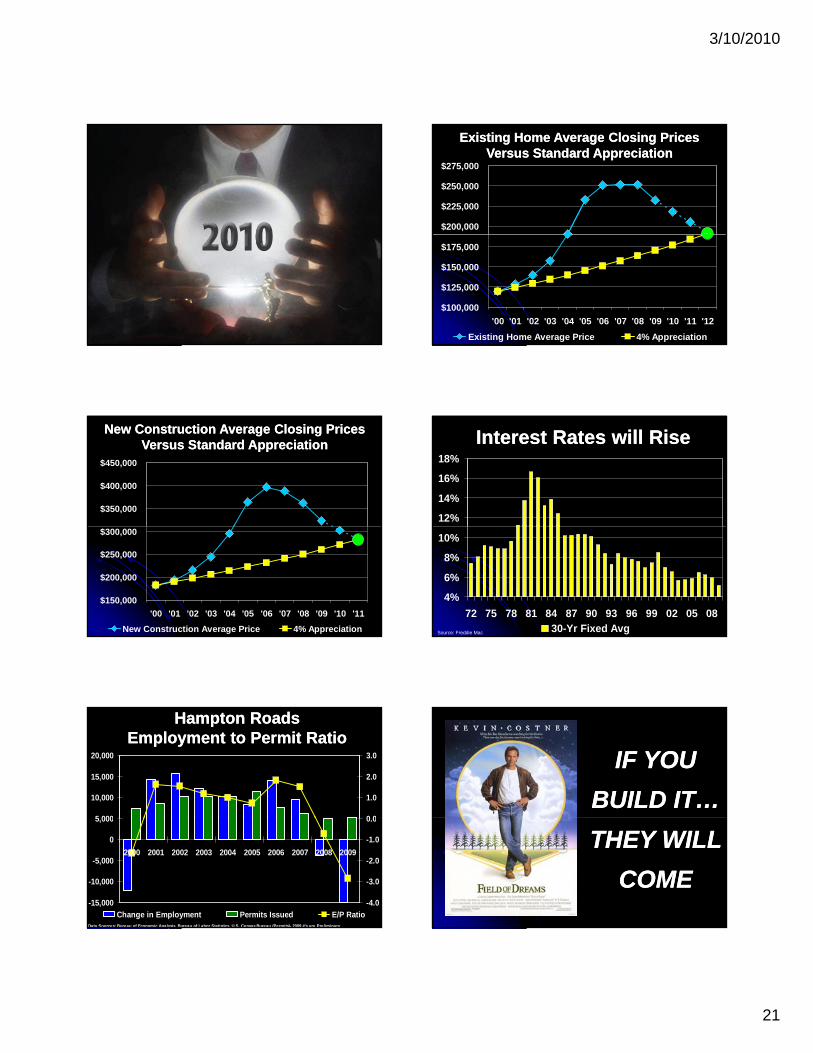
$200,000
$225,000
$250,000
$275,000
Existing Home Average Closing PricesExisting Home Average Closing PricesVersus Standard AppreciationVersus Standard Appreciation
$100,000
$125,000
$150,000
$175,000
'00 '01 '02 '03 '04 '05 '06 '07 '08 '09 '10 '11 '12
Existing Home Average Price 4% Appreciation
$350,000
$400,000
$450,000
New Construction Average Closing PricesNew Construction Average Closing PricesVersus Standard AppreciationVersus Standard Appreciation
$150,000
$200,000
$250,000
$300,000
'00 '01 '02 '03 '04 '05 '06 '07 '08 '09 '10 '11
New Construction Average Price 4% Appreciation
12%
14%
16%
18%
Interest Rates will RiseInterest Rates will Rise
4%
6%
8%
10%
72 75 78 81 84 87 90 93 96 99 02 05 0830-Yr Fixed AvgSource: Freddie Mac
Hampton Roads Hampton Roads Employment to Permit RatioEmployment to Permit Ratio
5 000
10,000
15,000
20,000
0 0
1.0
2.0
3.0
-15,000
-10,000
-5,000
0
5,000
2000 2001 2002 2003 2004 2005 2006 2007 2008 2009
-4.0
-3.0
-2.0
-1.0
0.0
Change in Employment Permits Issued E/P RatioData Sources: Bureau of Economic Analysis, Bureau of Labor Statistics U.S. Census Bureau (Permits)- 2009 #'s are Preliminary
IF YOU IF YOU
BUILD IT…BUILD IT…
THEY WILL THEY WILL
COMECOME
3/10/2010
22
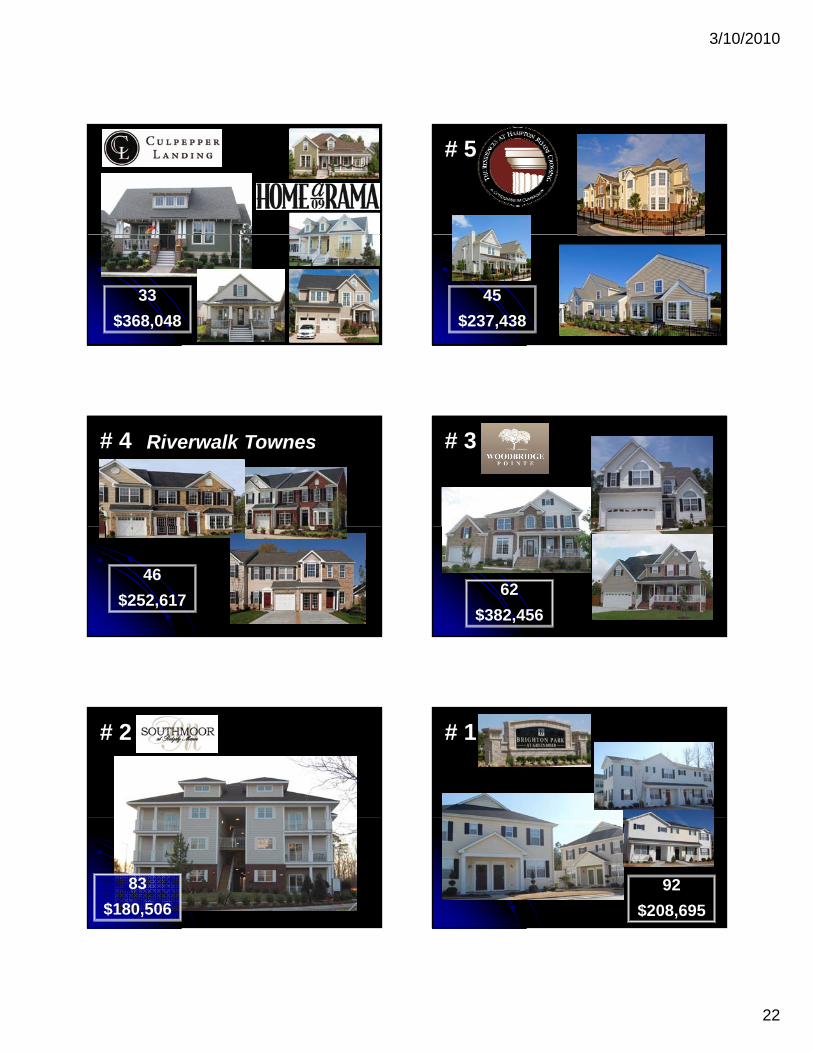
33
$368,048
# 5
45
$237,438
# 4 Riverwalk Townes
46
$252,617
# 3
62
$382,456
# 2
83
$180,506
# 1
92
$208,695
3/10/2010
23
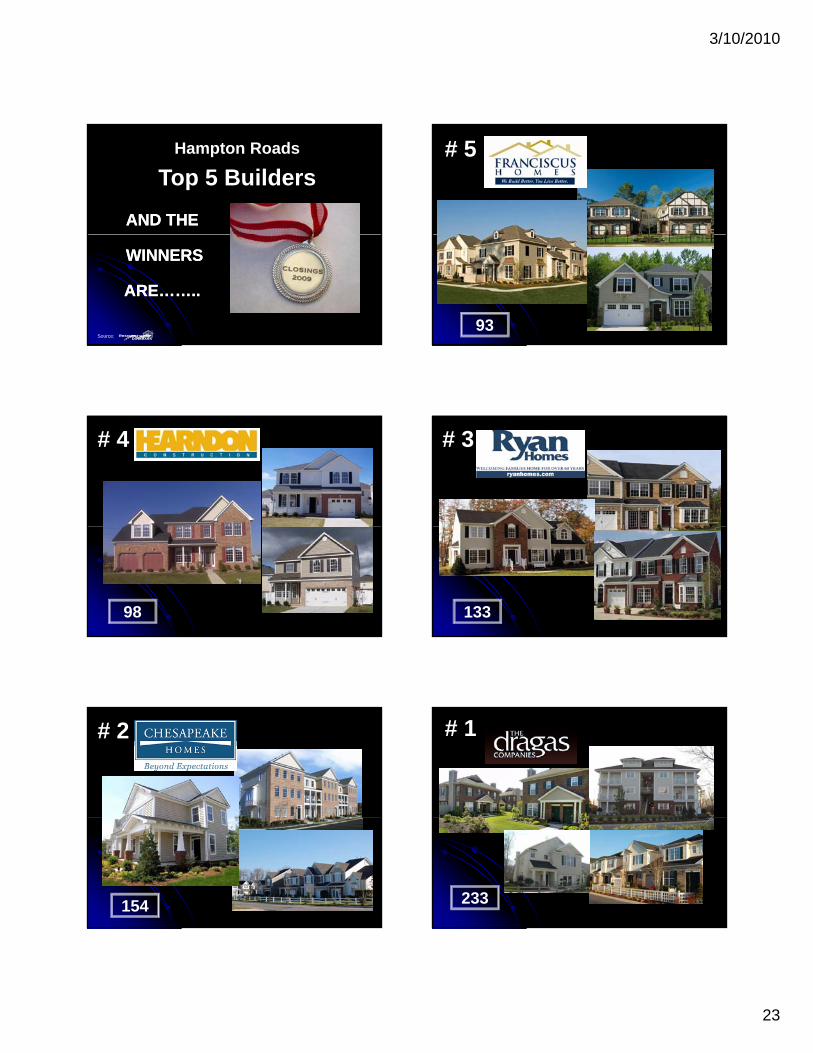
AND THEAND THE
Hampton Roads
Top 5 Builders
WINNERS WINNERS
ARE……..ARE……..
Source:
# 5
93
# 4
98
# 3
133
# 2
154
# 1
233
3/10/2010
24
Closing
Bradley R. Sanford, MAI
Ch i E ti C ittChair, Executive Committee
E. V. Williams Center for
Real Estate and Economic Development
CREED Membership
Interested???
Please send a note of interest to thePlease send a note of interest to the Membership Chair, Craig Cope ([email protected])
Old Dominion University Hampton Roads Real Estate
Thank you for attending!Thank you for attending!
Please Join Us for the ReceptionPlease Join Us for the Reception
pMarket Review and Forecast
Presented by: E.V. Williams
Center for Real Estate and Economic Development


![Shehabi - OPTIMAL AEROELASTIC VEHICLE SENSOR PLACEMENT FOR ROOT MIGRATION FLIGHT CONTROL APPLICATIONS [Old dominion univ. 2001] Arabic V](https://img.pdfslide.tips/doc/110x75/58ceeaa11a28ab333d8b5ceb/shehabi-optimal-aeroelastic-vehicle-sensor-placement-for-root-migration-flight.jpg)