Embed Size (px)
Citation preview
Press Release 3Q 2017 October 25, 2017
Page 1
2017 THIRD QUARTER AND FIRST NINE MONTHS RESULTS Mexico City, October 25, 2017, Coca-Cola FEMSA, S.A.B. de C.V. (BMV: KOFL, NYSE: KOF) (“Coca-Cola FEMSA” or the
“Company”), the largest franchise bottler in the world by sales volume, announces results for the third quarter of 2017.
Operational and Financial Highlights
Revenues grew 16.6%, while comparable revenues grew 3.9% for the third quarter of 2017.
Operating income decreased 2.8%, while comparable operating income grew 3.3% during the third quarter of 2017.
Operating cash flow increased 13.7%, while comparable operating cash flow grew 5.2% for the third quarter of 2017.
Majority net income increased 39.2% in the third quarter of 2017.
Results Summary
Message from the Chief Executive Officer
“As we strengthen our focus on improving our operational efficiency, rolling out our portfolio initiatives, and effectively executing at the
point of sale across our markets, our revenues and operating cash flow for the third quarter grew 16.6% and 13.7%, respectively,
resulting in majority net income growth of 39.2%.
Underscoring our company’s ability to adapt to diverse conditions, our Mexico and Central America division continues implementing our
transformational initiatives, which helped mitigate margin pressures and the effects that hurricanes and earthquakes had on the
consumer. Importantly, our operations’ effort to maintain our levels of excellence—while supporting our affected communities—merits
our recognition. In South America, our affordability initiatives are showing encouraging results in Argentina and Brazil’s recovering
consumer environments. In addition, our Brazilian operation continues to improve margins, driven by favorable raw material costs and
efficiencies generated by our transformational initiatives. Finally, our operation in the Philippines continues to build on the growth
achieved last year, delivering comparable volume and operating cash flow growth.
As we approach the final stretch of the year, we remain focused on our strategic framework to continue strengthening our portfolio,
digitizing our operational capabilities, and creating a strong unified corporate culture to continue delivering value for all our
stakeholders,” said John Santa Maria Otazua, Chief Executive Officer of the Company.
.
Comparable (1)
2017 D% D% 2017 D% D%
Total revenues 49,363 16.6% 3.9% 151,459 25.6% 2.8%
Gross profit 22,016 16.6% 6.6% 67,193 22.9% 5.0%
Operating income 5,487 -2.8% 3.3% 17,744 7.0% 3.5%
Operating cash flow (2) 9,303 13.7% 5.2% 28,638 22.0% 3.5%
Net income attributable to equity holders of the company 3,152 39.2% 10,233 55.5%
Earnings per share (3) 1.50 4.90
Expressed in millions of Mexican pesos.
(2) Operating cash flow = operating income + depreciation + amortization & other operative non-cash charges.
(3) 3Q EPS calculated with 2,100.8 million shares outstanding as of September 30 2017. YTD EPS calculated with 2,088.2 million shares, the weighted average of the Company’s
outstanding shares over the period.
(1) Comparable means, with respect to a year-over-year comparison, the change in a given measure excluding the effects of (i) mergers, acquisitions and divestitures, (ii) translation
effects resulting from exchange rate movements (iii) the results of hyperinflationary economies in both periods, and (iv) includes the results of Coca-Cola FEMSA Philippines Inc., as if the
consolidation had taken place at the beginning of first quarter 2016. From our operations, only Venezuela qualifies as a hyperinflationary economy.
Third Quarter Year to Date
as Reported Comparable (1) as Reported
Press Release 3Q 2017 October 25, 2017
Page 2
Consolidated results for the third quarter Comparable means, with respect to a year-over-year comparison, the change in a given measure excluding the effects of: (i) mergers, acquisitions and divestitures, (ii)
translation effects resulting from exchange rate movements, (iii) the results of hyperinflationary economies in both periods; and (iv) includes the results of Coca-Cola FEMSA
Philippines, Inc., as if the consolidation had taken place at the beginning of first quarter 2016. From our operations, only Venezuela qualifies as a hyperinflationary economy. In
our “as reported” figures, our Venezuelan operation’s results were translated into Mexican pesos using the DICOM exchange rate published on September 30, 2017, of
3,345.00 bolivars per US dollar.
Comparable figures:
Revenues: Comparable total revenues grew 3.9% in the third quarter of 2017 as compared to the same period of 2016, driven by
average price per unit case growth across most of our operations and volume growth in the Philippines and Argentina, partially
offset by volume declines in the rest of our operations.
Transactions: Comparable number of transactions declined 0.7%. Our water category grew 5.0% mainly driven by the positive
performance of the Philippines, Argentina and Central America. Our sparkling category had a slight contraction of 0.8% driven by
growth in Argentina and the Philippines offset by declines in the rest of our operations. Finally, our still beverage category declined
4.2% where growth in Brazil, Argentina and the Philippines was mainly offset by a decline in Colombia.
Volume: Comparable sales volume declined 1.6% in the third quarter of 2017 as compared to the same period in 2016. Our
personal water portfolio’s volume grew 2.7% due to a positive performance in most of our operations. Our bulk water portfolio’s
volume remained flat, driven by growth in most of our operations which was offset by a decline in Mexico. Our sparkling beverage
portfolio’s volume contracted 1.7% despite growth obtained in the Philippines and Argentina. Finally, our still beverage category’s
volume decreased 5.9% where growth in Brazil and Argentina was mainly offset by a decline in Colombia.
Gross profit: Comparable gross profit grew 6.6%. Our pricing initiatives, coupled with lower PET and sweetener prices in most of
our operations, offset higher sweetener and concentrate prices in Mexico and the depreciation in the average exchange rate of the
Argentine Peso, the Philippine Peso, and the Colombian Peso as applied to our U.S. dollar-denominated raw material costs.
Operating Income: Comparable operating income grew 3.3% for the third quarter of 2017 as compared to the same period of
2016.
Operating cash flow: Comparable operating cash flow increased 5.2% in the third quarter of 2017.
As reported figures:
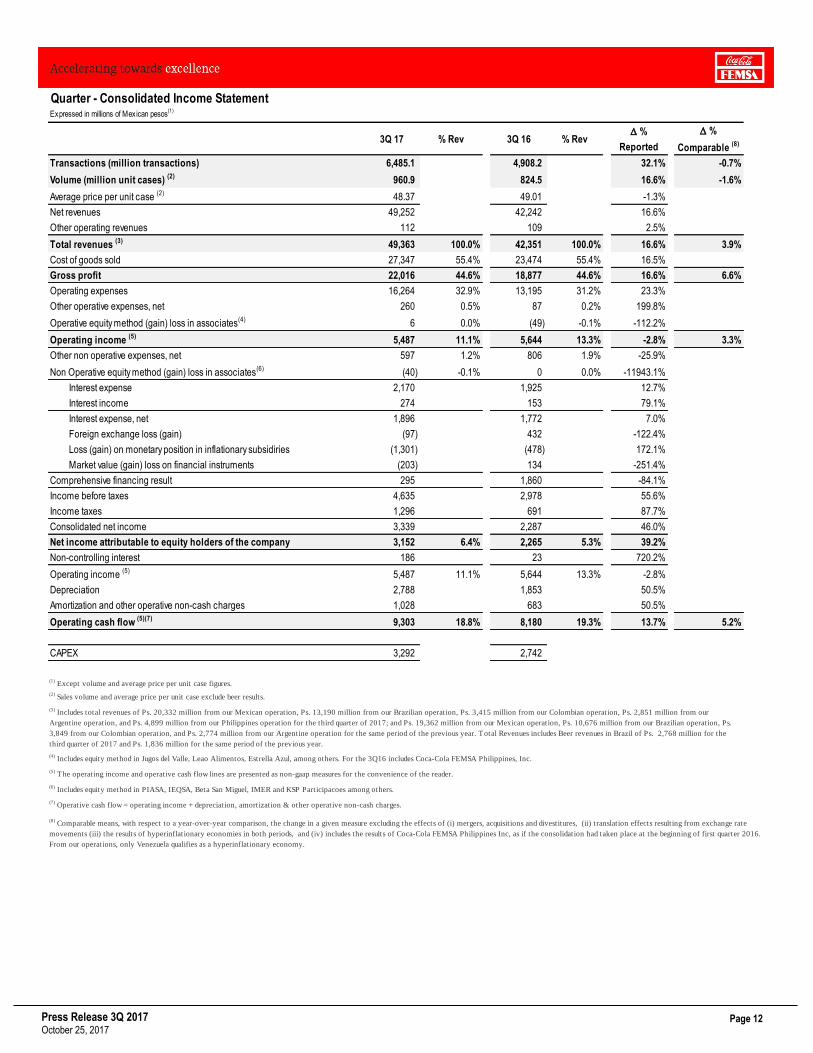
Revenues: Total revenues increased 16.6% to Ps. 49,363 million in the third quarter of 2017, including the acquisition of Vonpar in
Brazil and the consolidation of our operation in the Philippines, combined with price increases aligned with or above inflation in key
territories such as Mexico, Brazil and Colombia, supported by volume growth in Argentina, the Philippines, and improvements in
Brazil; all despite the negative translation effect resulting from the depreciation of all our operating currencies as compared to the
Mexican Peso.
Transactions: Reported total number of transactions increased 32.1% to 6,485.1 million in the third quarter of 2017 as compared
to the same period in 2016.
Volume: Reported total sales volume increased 16.6% to 960.9 million unit cases in the third quarter of 2017 as compared to the
same period in 2016.
Gross profit: Gross profit grew 16.6% to Ps. 22,016 million, and gross margin remained flat at 44.6%.
(Continued on next page)
Press Release 3Q 2017 October 25, 2017
Page 3
Equity method: The reported share of the profits of associates and joint ventures recorded a loss of Ps. 6 million in the third
quarter of 2017, compared to a gain of Ps. 49 million recorded in the third quarter of 2016. This is mainly due to (i) the consolidation
of Coca-Cola FEMSA Philippines, Inc., which is not included in the equity method as of February 2017 (ii) gains in Jugos Del Valle
and our joint ventures in Brazil; and (iii) a loss in our dairy joint venture in Panama.
Operating Income: Operating income declined 2.8% to Ps. 5,487 million, and operating margin contracted 220 basis points to
11.1%, mainly driven by higher labor costs, higher freight costs, and higher diesel and gasoline prices. Due to the consolidation of
Coca-Cola FEMSA Philippines in February 2017, the results of this operation are not included in our share of the profit of
associates for 2017, as compared to 2016. These effects were partially offset by an operative foreign exchange gain.
Other non-operative expenses, net: Other non-operative expenses, net, recorded an expense of Ps. 597 million, compared to Ps.
806 million during the third quarter of 2016, due mainly to negative currency fluctuation effects in our Venezuela operation.
Comprehensive financing result: Comprehensive financing result in the third quarter of 2017 recorded an expense of Ps. 295
million, compared to an expense of Ps. 1,860 million in the same period of 2016.
During the third quarter of 2017, we recorded an interest expense of Ps. 2,170 million, compared to Ps. 1,925 million in the third
quarter of 2016. This increase was driven by: (i) the interest rate increase from swapping U.S. dollar-denominated debt to Brazilian
Real and Mexican Peso-denominated debt, as part of our strategy to eliminate our U.S. dollar net debt exposure; (ii) additional
interest expense related to our refinancing strategy, as we issued new debt in Mexican Pesos at the end of June and made a partial
early redemption of U.S. dollar-denominated notes in August; (iii) additional debt related to the acquisition of Vonpar; and (iv) the
interest rate increase in Mexico.
These effects were partially offset by the decrease of interest rates in Brazil, the average exchange rate depreciation of the
Brazilian Real compared to the Mexican Peso as applied to the existing Brazilian Real-denominated interest expense, and the
reduction of debt in Argentina.
In addition, for the third quarter, we recorded a foreign exchange gain of Ps. 97 million as compared to a loss of Ps. 432 million in
2016, which was generated as a result of the quarterly depreciation of the Mexican peso as applied to our U.S. dollar-denominated
net debt position in 2016.
During the third quarter of 2017, we recorded a gain on monetary position in inflationary subsidiaries of Ps. 1,301 million as
compared to Ps. 478 million during the same period of 2016, related to higher inflation during the period in our operation in
Venezuela.
Market value on financial instruments recorded a gain of Ps. 203 million as compared to a loss of Ps. 134 million in the third quarter
of 2016 due to the recent decrease of interest rates in Brazil as applied to our floating rate cross-currency swaps.
Income tax: During the third quarter of 2017, reported income tax as a percentage of income before taxes was 28.0%, compared to
23.2% in the same period of 2016. The increase of the tax rate in 2017 resulted from (i) a higher effective tax rate in Colombia; and
(ii) a higher effective tax rate in the Philippines. These effects were not fully offset by tax efficiencies and ongoing efforts to reduce
non-deductibles across our operations.
Net income: Reported consolidated net controlling interest income increased 39.2% to Ps. 3,152 million in the third quarter of
2017, resulting in reported earnings per share (EPS) of Ps. 1.50 (Ps. 15.01 per ADS).
Operating cash flow: Operating cash flow grew 13.7% to Ps. 9,303 million, and operating cash flow margin contracted 50 basis
points to 18.8%.
Press Release 3Q 2017 October 25, 2017
Page 4
Balance Sheet (1)
As of September 30, 2017, we had a cash balance of Ps. 20,206 million, including US$209 million denominated in U.S. dollars, an
increase of Ps. 9,730 million as compared to December 31, 2016. This difference was mainly driven by the cash obtained from the
issuance of shares to former Vonpar’s shareholders, the consolidation of the Philippines, and the cash flow generation across our
territories.
As of September 30, 2017, total short-term debt was Ps. 2,155 million, and long-term debt was Ps. 76,510 million. Total debt
decreased by Ps. 10,244 million, compared to year-end 2016, mainly due to the positive translation effect resulting from the
appreciation of the end-of-period exchange rate of the Mexican Peso as applied to our U.S. dollar-denominated debt position. Net
debt decreased by Ps. 19,974 million compared to year-end 2016.
The weighted average cost of debt for the quarter, including the effect of debt swapped to Brazilian Reals and Mexican Pesos at a
floating and fixed rates, was 8.72%, a reduction as compared to the second quarter 2017 due mainly to the reduction of interest
rates in Brazil. The following charts set forth the Company’s debt profile by currency and interest rate type and by maturity date as
of September 30, 2017.
Currency % Total Debt(2) % Interest Rate Floating(2)(3)
Mexican Pesos 44.8% 3.2% U.S. Dollars 0.8% 0.0% Colombian Pesos 2.9% 72.8% Brazilian Reals 51.3% 84.7% Argentine Pesos 0.1% 0.0%
Debt Maturity Profile
Maturity Date 2017 2018 2019 2020 2021 2022+
% of Total Debt 0.2% 14.3% 8.5% 12.0% 8.1% 57.0%
(1) See page 18 for detailed information. (2) After giving effect to cross-currency swaps. (3) Calculated by weighting each year’s outstanding debt balance mix.
Selected Financial Ratios
LTM 2017 FY 2016 D %
Net debt including effect of hedges (1)(3) 65,742 80,043 -17.9% Net debt including effect of hedges / Operating cash flow (1)(3) 1.76 2.26 Operating cash flow/ Interest expense, net (1) 4.63 5.25 Capitalization (2) 37.1% 41.3%
(1) Net debt = total debt - cash (2) Total debt / (long-term debt + shareholders' equity)
(3) After giving effect to cross-currency swaps.
Press Release 3Q 2017 October 25, 2017
Page 5
Mexico & Central America Division
(Mexico, Guatemala, Nicaragua, Costa Rica and Panama) Comparable means, with respect to a year-over-year comparison, the change in a given measure excluding the effects of: (i) mergers, acquisitions and divestitures, (ii)
translation effects resulting from exchange rate movements, (iii) the results of hyperinflationary economies in both periods; and (iv) includes the results of Coca-Cola FEMSA
Philippines, Inc., as if the consolidation had taken place at the beginning of first quarter 2016. From our operations, only Venezuela qualifies as a hyperinflationary economy. In
our “as reported” figures, our Venezuelan operation’s results were translated into Mexican pesos using the DICOM exchange rate published on September 30, 2017, of
3,345.00 bolivars per US dollar.
Comparable figures:
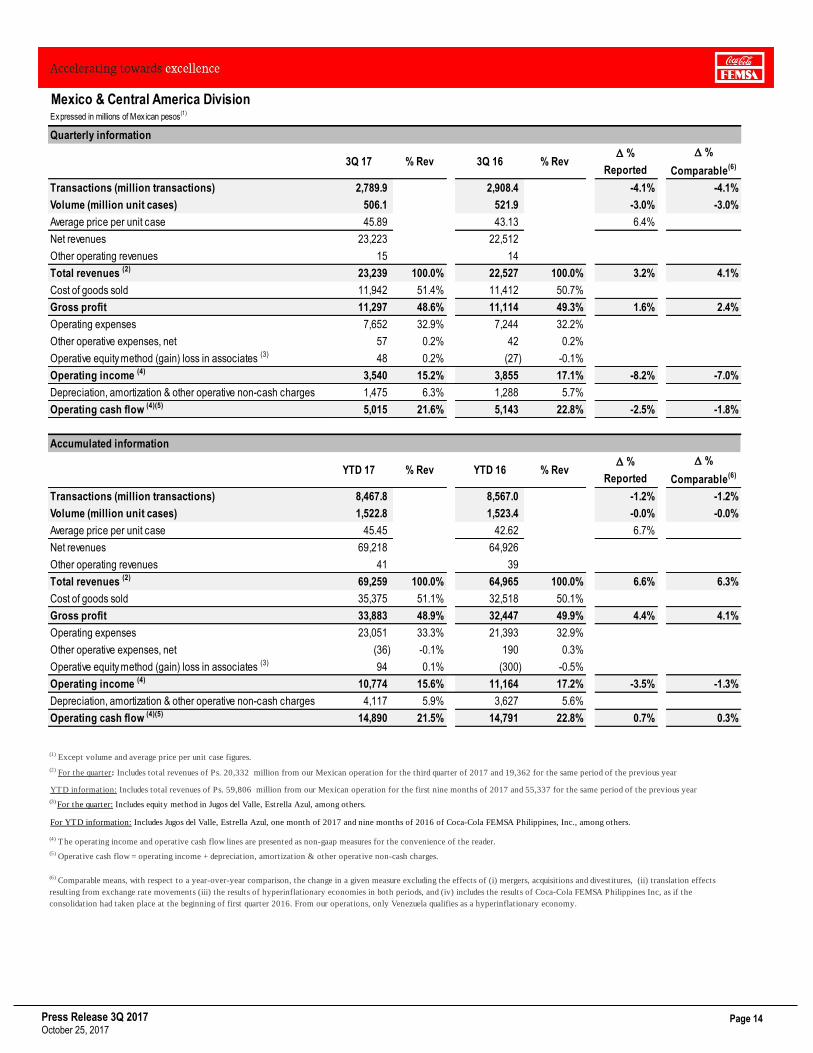
Revenues: Comparable total revenues from our Mexico and Central America division increased 4.1% in the third quarter of 2017,
compared to the same period in 2016, driven by an increase in average price per unit case in Mexico, partially offset by volume
declines in the division.
Transactions: Total transactions in our Mexico and Central America division declined 4.1% in the third quarter of 2017. Our
sparkling beverage portfolio’s transactions contracted 4.3%. Our still beverage category’s transactions decreased by 4.7%. Our
water transactions, including bulk water, remained flat driven mainly by flat performance in Mexico, not fully offset by growth in
Central America.
Volume: Total sales volume for the division decreased 3.0% in the third quarter of 2017, compared to the same period of 2016.
Volume decline during the quarter was mostly generated by natural disasters impacting the region. Our sparkling beverage
category’s volume declined 3.6% in the division, driven by colas and partially offset by a flat performance in our flavored sparkling
portfolio. Our still beverage category’s volume declined 1.6% while our personal water portfolio’s volume grew 2.0% driven by
positive performance in both Mexico and Central America. Our bulk water portfolio’s volume declined 2.5% in the division due to a
contraction in Mexico, which was not fully offset by growth in Central America.
Gross profit: Comparable gross profit grew 2.4% in the third quarter of 2017 as compared to the same period in 2016. In Mexico
our pricing initiatives, lower PET prices, and the appreciation of the average exchange rate of the Mexican Peso as applied to U.S.
dollar-denominated raw material costs were offset by the increase of concentrate cost, higher prices of sweeteners. and an
unfavorable currency hedging position. In Central America, lower sweetener, PET, and aluminum prices were partially offset by the
depreciation of the average exchange rates of local currencies as applied to U.S. dollar-denominated raw material costs.
Operating income: Comparable operating income in the division decreased 7.0% in the third quarter of 2017 as compared to the
same period in 2016.
Operating cash flow: Comparable operating cash flow decreased 1.8% in the third quarter of 2017 as compared to the same
period in 2016.
As reported figures:
Revenues: Reported total revenues increased 3.2% in the third quarter of 2017, driven by an average price per unit case increase
in Mexico, offset by volume declines in the division.
Gross profit: Reported gross profit increased 1.6% in the third quarter of 2017, and gross profit margin reached 48.6%, a gross
margin contraction of 70 basis points.
Operating income: Reported operating income decreased 8.2% in the third quarter of 2017, and operating income margin reached
15.2%, contracting 190 basis points during the period, due mainly to extraordinary one-time expenses related to earthquake relief,
an increase in freight expenses, higher diesel and gasoline prices in Mexico, and higher labor costs in Central America. In addition,
due to the consolidation of Coca-Cola FEMSA Philippines, the results of this operation are not included in the share of the profit of
associates for 2017, as compared to 2016.
Operating cash flow: Reported operating cash flow decreased 2.5% in the third quarter of 2017, resulting in a margin contraction
of 120 basis points, reaching 21.6%.
Press Release 3Q 2017 October 25, 2017
Page 6
South America Division
(Colombia, Venezuela, Brazil and Argentina) Comparable means, with respect to a year-over-year comparison, the change in a given measure excluding the effects of: (i) mergers, acquisitions and divestitures, (ii)
translation effects resulting from exchange rate movements, (iii) the results of hyperinflationary economies in both periods; and (iv) includes the results of Coca-Cola FEMSA
Philippines, Inc., as if the consolidation had taken place at the beginning of first quarter 2016. From our operations, only Venezuela qualifies as a hyperinflationary economy. In
our “as reported” figures, our Venezuelan operation’s results were translated into Mexican pesos using the DICOM exchange rate published on September 30, 2017, of
3,345.00 bolivars per US dollar.
Comparable figures:
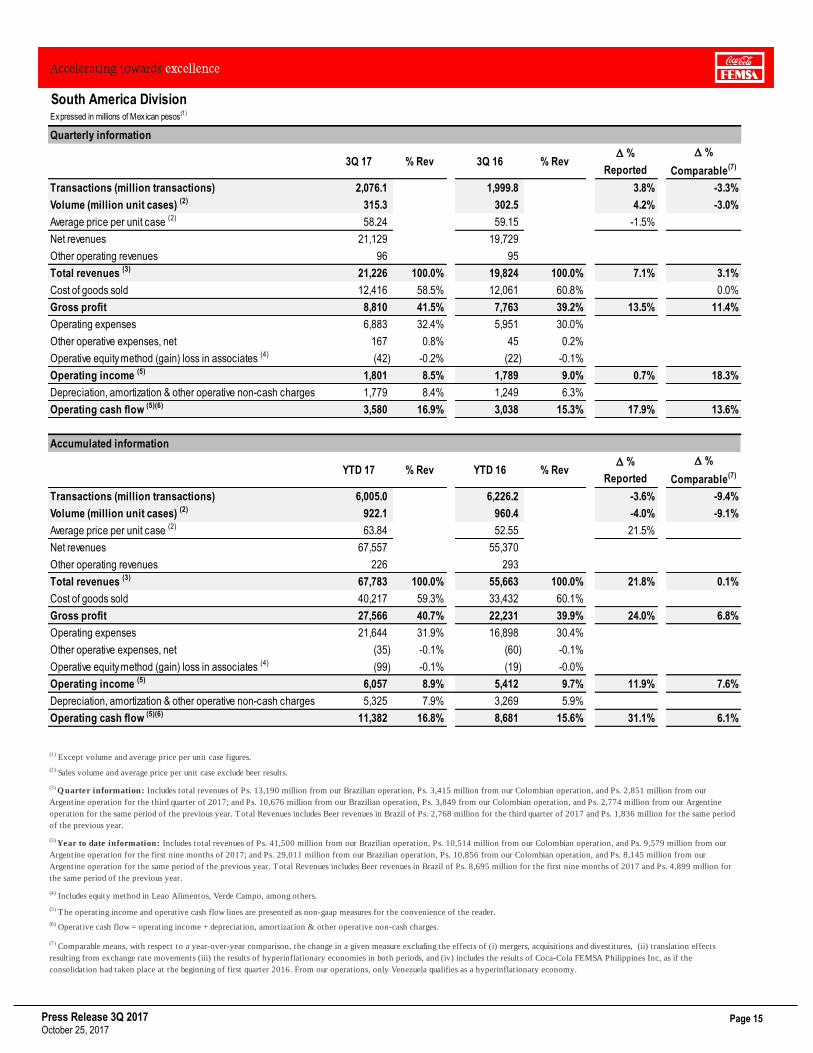
Revenues: Comparable total revenues increased 3.1%, driven mainly by an average price per unit case increase in most of our
operations and volume growth in Argentina, which were not fully offset by volume declines in Colombia and Brazil.
Transactions: Comparable transactions in the division declined 3.3% during the third quarter of 2017. Our sparkling beverage
portfolio’s transactions decreased 2.5% driven by growth in Argentina offset by a decline in Colombia and Brazil. Our still beverage
category’s transactions decreased 10.9% where growth in Brazil and Argentina was offset by Colombia. Our water transactions,
including bulk water, decreased 1.8% driven by growth in Argentina and a flat performance in Brazil.
Volume: Comparable total sales volume in South America contracted 3.0% during the third quarter of 2017 as compared to the
same period of 2016. Our sparkling beverage category’s volume decreased 3.3%, driven by growth in Argentina, offset by Brazil
and Colombia. Our still beverage category’s volume decreased 3.8% driven by growth in Brazil and Argentina, offset by Colombia.
Our personal water category’s volume declined 3.8%, where growth in Argentina and Brazil was offset by Colombia. Our bulk water
business’s volume grew 13.5%, driven by growth in all territories.
Gross profit: Comparable gross profit increased 11.4% as a result of our pricing initiatives, the benefit of lower PET and sweetener
prices, and the appreciation of the Brazilian Real as applied to U.S. dollar-denominated raw material costs, which offset the
depreciation of the average exchange rate of the Argentine Peso and the Colombian Peso as applied to U.S. dollar-denominated
raw material costs.
Operating income: Comparable operating income in the division increased 18.3% as compared to the same period in 2016.
Operating cash flow: Comparable operating cash flow increased 13.6% as compared to the same period of 2016.
As reported figures:
Revenues: Reported total revenues grew 7.1% to Ps. 21,226 million in the third quarter of 2017, driven by the integration of Vonpar
in Brazil, coupled with price increases aligned with inflation in Brazil and Colombia, volume growth in Argentina, and an improving
performance in Brazil. These effects were partially offset by volume declines in Colombia and Venezuela and the negative
translation effect resulting from the depreciation of all operating currencies of the division as compared to the Mexican Peso.
Transactions: Reported total number of transactions increased 3.8% to 2,076.1 million in the third quarter of 2017 as compared to
the same period in 2016.
Volume: Reported total sales volume increased 4.2% to 315.3 million unit cases in the third quarter of 2017 as compared to the
same period in 2016.
Gross profit: Reported gross profit increased 13.5% to Ps. 8,810 million in the third quarter of 2017, and gross profit margin
expanded 230 basis points to 41.5%.
Operating income: Reported operating income grew 0.7% to Ps. 1,801 million in the third quarter of 2017, resulting in a margin of
8.5%, a contraction of 50 basis points.
Operating cash flow: Reported operating cash flow grew 17.9% to reach Ps. 3,580 million in the third quarter of 2017, resulting in
a margin of 16.9%, an expansion of 160 basis points.
Press Release 3Q 2017 October 25, 2017
Page 7
Asia Division
(The Philippines) Comparable means, with respect to a year-over-year comparison, the change in a given measure excluding the effects of: (i) mergers, acquisitions and divestitures, (ii)
translation effects resulting from exchange rate movements, (iii) the results of hyperinflationary economies in both periods; and (iv) includes the results of Coca-Cola FEMSA
Philippines, Inc., as if the consolidation had taken place at the beginning of first quarter 2016. From our operations, only Venezuela qualifies as a hyperinflationary economy. In
our “as reported” figures, our Venezuelan operation’s results were translated into Mexican pesos using the DICOM exchange rate published on September 30, 2017, of
3,345.00 bolivars per US dollar.
Comparable figures:
Revenues: Comparable total revenues increased 6.1% during the third quarter of 2017, driven by volume growth.
Transactions: Comparable transactions increased 9.0% in the third quarter of 2017. Our sparkling beverage portfolio’s
transactions increased 7.5%. Our still beverage category’s transactions increased by 7.9%. Our water transactions, including bulk
water, increased 49.1%.
Volume: Comparable total sales volume increased 7.0% in the third quarter of 2017. Our sparkling beverage category’s volume
grew 9.1%, driven by 9.9% growth in colas and 7.7% growth in flavors. Our still beverage category’s volume, excluding powders,
increased 28.7%. Our personal water category’s volume increased 32.4%. Our bulk water business volume grew 12.6%.
Gross profit: Comparable gross profit increased 15.8% as compared to the same period of 2016, mainly driven by lower prices of
sweeteners and PET resin, partially offset by the devaluation of the Philippine Peso as applied to our U.S. dollar-denominated raw
material costs.
Operating income: Comparable operating income increased to Ps. 145 million during the third quarter of 2017.
Operating cash flow: Comparable operating cash flow increased 35.0% as compared to the same period of 2016.
Press Release 3Q 2017 October 25, 2017
Page 8
YTD Consolidated Results Comparable means, with respect to a year-over-year comparison, the change in a given measure excluding the effects of: (i) mergers, acquisitions and divestitures, (ii)
translation effects resulting from exchange rate movements, (iii) the results of hyperinflationary economies in both periods; and (iv) includes the results of Coca-Cola FEMSA
Philippines, Inc., as if the consolidation had taken place at the beginning of first quarter 2016. From our operations, only Venezuela qualifies as a hyperinflationary economy. In
our “as reported” figures, our Venezuelan operation’s results were translated into Mexican pesos using the DICOM exchange rate published on September 30, 2017, of
3,345.00 bolivars per US dollar.
Comparable figures:
Revenues: Comparable total revenues grew 2.8%, driven by average price per unit case growth across most of our operations and
volume growth in Mexico and the Philippines, which was partially offset by volume declines in the rest of our operations.
Transactions: Comparable number of transactions declined 3.2%. Our sparkling beverage portfolio’s transactions declined 3.4%,
driven by growth in Argentina, offset by the rest of our operations. Our still beverage category’s transactions decreased 3.9%,
driven by growth in Mexico, Argentina, and the Philippines offset by declines in Colombia and Brazil. Our water transactions,
including bulk water, remained flat, driven by growth in Mexico and the Philippines, offset by the rest of our operations.
Volume: Comparable sales volume contracted 2.6% in the first nine months of 2017 as compared to the same period in 2016. Our
sparkling beverage portfolio’s volume declined 2.9%, driven by growth in the Philippines and a flat performance in Mexico, offset by
a contraction in South America. Our still beverage category’s volume declined 4.2%, driven by growth in Mexico and Argentina that
was offset by declines in other operations. Our personal water portfolio’s volume decreased 1.0%, driven mainly by growth in
Mexico, Central America and the Philippines offset by contractions in South America. Our bulk water portfolio’s volume declined
0.3%, driven by growth in the Philippines and a flat performance in Mexico, which were offset by declines in South America and
Central America.
Gross profit: Comparable gross profit grew 5.0%. Our pricing initiatives, coupled with our currency and raw material hedging
strategies, offset higher sweetener prices and the depreciation in the average exchange rate of the Mexican Peso, the Argentine
Peso, and the Philippine Peso as applied to U.S dollar-denominated raw material costs.
Operating Income: Comparable operating income grew 3.5% in the first nine months of 2017.
Operating cash flow: Comparable operating cash flow increased 3.5% in the first nine months of 2017.
As reported figures:
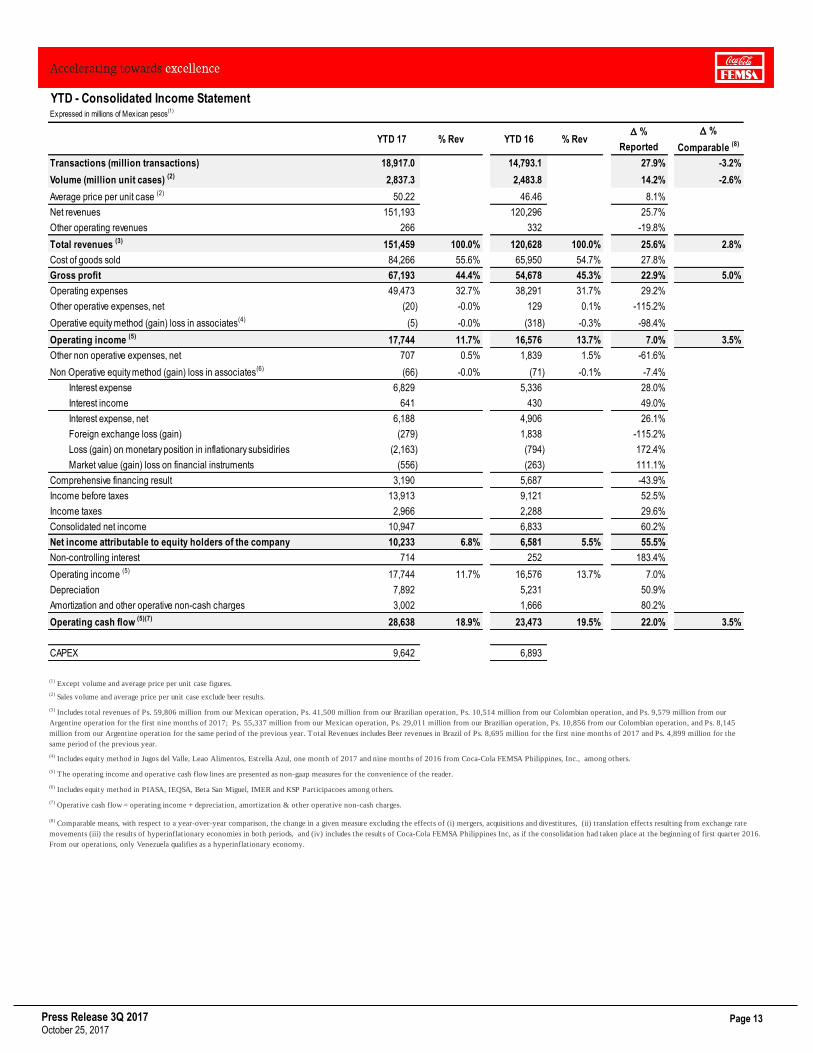
Revenues: Total revenues increased 25.6% to Ps. 151,459 million in the first nine months of 2017, including the results of the
Vonpar acquisition in Brazil and the consolidation of our operation in the Philippines beginning in February. Total revenues were
also driven by price increases aligned with or above inflation in key territories, supported by the positive translation effect resulting
from the appreciation of the Brazilian Real and the Colombian Peso, despite the depreciation of the Argentine Peso, the Philippine
Peso, and the Venezuelan Bolivar; all as compared to the Mexican Peso.
Transactions: Reported total number of transactions increased 27.9% to 18,917.0 million in the first nine months of 2017 as
compared to the same period in 2016.
Volume: Reported total sales volume increased 14.2% to 2,837.3 million unit cases in the first nine months of 2017 as compared to
the same period in 2016.
Gross profit: Gross profit grew 22.9% to Ps. 67,193 million, and gross margin declined 90 basis points to 44.4%.
Equity method: The reported share of the profits of associates and joint ventures recorded a gain of Ps. 5 million in the first nine
months of 2017, compared to a gain of Ps. 318 million recorded in the first nine months of 2016. This is due to (i) the consolidation
of Coca-Cola FEMSA Philippines, Inc., which is no longer included in the equity method as of February 2017, (ii) gains from our
Jugos Del Valle joint venture and our joint ventures in Brazil; and (iii) a loss in our dairy joint venture in Panama.
(Continued on next page)
Press Release 3Q 2017 October 25, 2017
Page 9
Operating Income: Operating income increased 7.0% to Ps. 17,744 million, and operating margin contracted 200 basis points to
11.7%, due mainly to an increase in operating expenses, partially offset by an operative foreign exchange gain.
Other non-operative expenses, net: Other non-operative expenses, net, recorded an expense of Ps. 707 million, compared to
expenses of Ps. 1,839 million during the first nine months of 2016, due mainly to the negative currency fluctuation effects in our
operation in Venezuela, partially offset by income related to the consolidation of Coca-Cola FEMSA Philippines.
Comprehensive financing result: Our comprehensive financing result in the first nine months of 2017 recorded an expense of Ps.
3,190 million, compared to an expense of Ps. 5,687 million in the same period of 2016.
During the first nine months of 2017, we recorded an interest expense of Ps. 6,829 million, compared to Ps. 5,336 million in the first
nine months of 2016. This increase was driven by: (i) the interest rate increase from swapping U.S. dollar-denominated debt to
Brazilian Real and Mexican Peso-denominated debt, as part of our strategy to eliminate our U.S, dollar net debt exposure; (ii)
additional debt related to the acquisition of Vonpar; (iii) the average exchange rate appreciation of the Brazilian Real compared to
the Mexican Peso as applied to our existing Brazilian Real-denominated interest expense; and (iv) the interest rate increase in
Mexico. These effects were partially offset by the decrease of interest rates in Brazil and the reduction of debt in Argentina.
In addition, for the first nine months, we recorded a foreign exchange gain of Ps. 279 million as compared to a loss of Ps. 1,838
million in 2016, which resulted from the depreciation of the Mexican peso as applied to our U.S. dollar-denominated net debt
position in 2016.
During the first nine months of 2017, we recorded a gain on monetary position in inflationary subsidiaries of Ps. 2,163 million as
compared to Ps. 794 million during the same period of 2016 related to our operation in Venezuela.
Market value on financial instruments recorded a gain of Ps. 556 million due to the recent decrease of interest rates in Brazil as
applied to our floating rate cross-currency swaps.
Income tax: During the first nine months of 2017, reported income tax as a percentage of income before taxes was 21.3%,
compared to 25.1% in the same period of 2016. This reduction was driven mainly by the one-time non-operative income recorded in
connection with the consolidation of Coca-Cola FEMSA Philippines, Inc. in February.
Net income: Reported consolidated net controlling interest income increased 55.5% to Ps. 10,233 million in the first nine months of
2017, resulting in reported earnings per share (EPS) of Ps. 4.90 (Ps. 49.00 per ADS).
Operating cash flow: Operating cash flow grew 22.0% to Ps. 28,638 million, and operating cash flow margin contracted 60 basis
points to 18.9%.
Press Release 3Q 2017 October 25, 2017
Page 10
Recent Developments
During September 2017, Coca-Cola FEMSA was selected as a member of the Dow Jones Sustainability Emerging Markets
Index for the fifth consecutive year.
As of November 1, 2017, we will pay the second installment of the 2016 dividend in the amount of Ps. 1.67 per share.
Conference Call Information
Our third quarter 2017 conference call will be held on October 25, 2017, at 12:00 P.M. Eastern Time (11:00 A.M. Mexico City Time). To
participate in the conference call, please dial: Domestic U.S.: 800-839-7875 or International: 719-457-2628. Participant code: 6110147.
We invite investors to listen to the live audio cast of the conference call on the Company’s website, www.coca-colafemsa.com. If you
are unable to participate live, the conference call audio will be available at www.coca-colafemsa.com.
Mexican Stock Exchange Quarterly Filing
Coca-Cola FEMSA encourages the reader to refer to our quarterly filing to the Mexican Stock Exchange (Bolsa Mexicana de Valores or
BMV) for more detailed information. This filing contains a detailed cash flow statement and selected notes to the financial statements,
including segment information. This filing is available at www.bmv.com.mx in the Información Financiera section for Coca-Cola FEMSA
(KOF) and on our corporate website at www.coca-colafemsa.com/inversionistas/registros-bmv.
Press Release 3Q 2017 October 25, 2017
Page 11
Additional Information
This news release may contain forward-looking statements concerning Coca-Cola FEMSA’s future performance, which should be
considered as good faith estimates by Coca-Cola FEMSA. These forward-looking statements reflect management’s expectations and
are based upon currently available data. Actual results are subject to future events and uncertainties, many of which are outside Coca-
Cola FEMSA’s control, which could materially impact the Company’s actual performance. References herein to “US$” are to United
States dollars. This news release contains translations of certain Mexican peso amounts into U.S. dollars for the convenience of the
reader. These translations should not be construed as representations that Mexican peso amounts actually represent such U.S. dollar
amounts or could be converted into U.S. dollars at the rate indicated.
All the financial information presented in this report was prepared under International Financial Reporting Standards (IFRS).
In an effort to provide our readers with a more useful representation of our company's underlying financial and operating performance
we are including the term “Comparable.” This means, with respect to a year-over-year comparison, the change in a given measure
excluding the effects of: (i) mergers, acquisitions and divestitures, (ii) translation effects resulting from exchange rate movements, (iii)
the results of hyperinflationary economies in both periods, and (iv) includes the results of Coca-Cola FEMSA Philippines, Inc., as if the
consolidation had taken place at the beginning of the first quarter of 2016. Currently, the only operation that qualifies as a
hyperinflationary economy is Venezuela. In preparing this measure, management has used its best judgment, estimates, and
assumptions in order to maintain comparability.
As a result of newly issued KOF L shares, year-to-date earnings per share were computed based on 2,088.2 million shares, the
weighted average outstanding shares over the period. At the end of September 2017, total outstanding shares were 2,100.8 million
shares (each ADS represents 10 local shares).
For reporting purposes, all corporate expenses, including the equity method recorded from our stake of the results of Coca-Cola
FEMSA Philippines, Inc., were included in the results of the Mexico and Central America division. Starting on February 2013 and
ending on January 2017, we incorporated our stake of the results of Coca-Cola FEMSA Philippines, Inc. through the equity method.
About the Company
Stock listing information: Mexican Stock Exchange, Ticker: KOFL | NYSE (ADR), Ticker: KOF | Ratio of KOF L to KOF = 10:1
Coca-Cola FEMSA, S.A.B. de C.V. is the largest franchise bottler in the world by sales volume. The company produces and distributes
trademark beverages of The Coca-Cola Company, offering a wide portfolio of 154 brands to more than 375 million consumers daily.
With over 100 thousand employees, the company markets and sells approximately 4 billion unit cases through 2.8 million points of sale
a year. Operating 66 manufacturing plants and 328 distribution centers, Coca-Cola FEMSA is committed to generating economic,
social, and environmental value for all of its stakeholders across the value chain. The company is a member of the Dow Jones
Sustainability Emerging Markets Index, FTSE4Good Emerging Index, and the Mexican Stock Exchange’s IPC and Social
Responsibility and Sustainability Indices, among other indexes. Its operations encompass franchise territories in Mexico, Brazil,
Colombia, Argentina, and Guatemala and, nationwide, in the Philippines, Venezuela, Nicaragua, Costa Rica, and Panama. For more
information, please visit www.coca-colafemsa.com.
For additional information or inquiries contact the Investor Relations team:
Maria Dyla Castro | [email protected] | (5255) 1519-5186
Jorge Collazo | [email protected] | (5255) 1519-5218
Tania Ramírez | [email protected] | (5255) 1519-5013
(7 pages of tables to follow)
Press Release 3Q 2017 October 25, 2017
Page 12
Quarter - Consolidated Income StatementExpressed in millions of Mexican pesos
(1)
3Q 17 % Rev 3Q 16 % RevD %
Reported
D %
Comparable (8)
Transactions (million transactions) 6,485.1 4,908.2 32.1% -0.7%
Volume (million unit cases) (2) 960.9 824.5 16.6% -1.6%
Average price per unit case (2) 48.37 49.01 -1.3%
Net revenues 49,252 42,242 16.6%
Other operating revenues 112 109 2.5%
Total revenues (3) 49,363 100.0% 42,351 100.0% 16.6% 3.9%
Cost of goods sold 27,347 55.4% 23,474 55.4% 16.5%
Gross profit 22,016 44.6% 18,877 44.6% 16.6% 6.6%
Operating expenses 16,264 32.9% 13,195 31.2% 23.3%
Other operative expenses, net 260 0.5% 87 0.2% 199.8%
Operative equity method (gain) loss in associates(4) 6 0.0% (49) -0.1% -112.2%
Operating income (5) 5,487 11.1% 5,644 13.3% -2.8% 3.3%
Other non operative expenses, net 597 1.2% 806 1.9% -25.9%
Non Operative equity method (gain) loss in associates(6) (40) -0.1% 0 0.0% -11943.1%
Interest expense 2,170 1,925 12.7%
Interest income 274 153 79.1%
Interest expense, net 1,896 1,772 7.0%
Foreign exchange loss (gain) (97) 432 -122.4%
Loss (gain) on monetary position in inflationary subsidiries (1,301) (478) 172.1%
Market value (gain) loss on financial instruments (203) 134 -251.4%
Comprehensive financing result 295 1,860 -84.1%
Income before taxes 4,635 2,978 55.6%
Income taxes 1,296 691 87.7%
Consolidated net income 3,339 2,287 46.0%
Net income attributable to equity holders of the company 3,152 6.4% 2,265 5.3% 39.2%
Non-controlling interest 186 23 720.2%
Operating income (5)
5,487 11.1% 5,644 13.3% -2.8%
Depreciation 2,788 1,853 50.5%
Amortization and other operative non-cash charges 1,028 683 50.5%
Operating cash flow (5)(7)
9,303 18.8% 8,180 19.3% 13.7% 5.2%
CAPEX 3,292 2,742
(1) Except volume and average price per unit case figures.
(2) Sales volume and average price per unit case exclude beer results.
(4) Includes equity method in Jugos del Valle, Leao Alimentos, Estrella Azul, among others. For the 3Q16 includes Coca-Cola FEMSA Philippines, Inc.
(5) The operating income and operative cash flow lines are presented as non-gaap measures for the convenience of the reader.
(6) Includes equity method in PIASA, IEQSA, Beta San Miguel, IMER and KSP Participacoes among others.
(7) Operative cash flow = operating income + depreciation, amortization & other operative non-cash charges.
(8) Comparable means, with respect to a year-over-year comparison, the change in a given measure excluding the effects of (i) mergers, acquisitions and divestitures, (ii) translation effects resulting from exchange rate
movements (iii) the results of hyperinflationary economies in both periods, and (iv) includes the results of Coca-Cola FEMSA Philippines Inc, as if the consolidation had taken place at the beginning of first quarter 2016.
From our operations, only Venezuela qualifies as a hyperinflationary economy.
(3) Includes total revenues of Ps. 20,332 million from our Mexican operation, Ps. 13,190 million from our Brazilian operation, Ps. 3,415 million from our Colombian operation, Ps. 2,851 million from our
Argentine operation, and Ps. 4,899 million from our Philippines operation for the third quarter of 2017; and Ps. 19,362 million from our Mexican operation, Ps. 10,676 million from our Brazilian operation, Ps.
3,849 from our Colombian operation, and Ps. 2,774 million from our Argentine operation for the same period of the previous year. Total Revenues includes Beer revenues in Brazil of Ps. 2,768 million for the
third quarter of 2017 and Ps. 1,836 million for the same period of the previous year.
Press Release 3Q 2017 October 25, 2017
Page 13
YTD - Consolidated Income StatementExpressed in millions of Mexican pesos
(1)
YTD 17 % Rev YTD 16 % RevD %
Reported
D %
Comparable (8)
Transactions (million transactions) 18,917.0 14,793.1 27.9% -3.2%
Volume (million unit cases) (2) 2,837.3 2,483.8 14.2% -2.6%
Average price per unit case (2) 50.22 46.46 8.1%
Net revenues 151,193 120,296 25.7%
Other operating revenues 266 332 -19.8%
Total revenues (3) 151,459 100.0% 120,628 100.0% 25.6% 2.8%
Cost of goods sold 84,266 55.6% 65,950 54.7% 27.8%
Gross profit 67,193 44.4% 54,678 45.3% 22.9% 5.0%
Operating expenses 49,473 32.7% 38,291 31.7% 29.2%
Other operative expenses, net (20) -0.0% 129 0.1% -115.2%
Operative equity method (gain) loss in associates(4) (5) -0.0% (318) -0.3% -98.4%
Operating income (5) 17,744 11.7% 16,576 13.7% 7.0% 3.5%
Other non operative expenses, net 707 0.5% 1,839 1.5% -61.6%
Non Operative equity method (gain) loss in associates(6) (66) -0.0% (71) -0.1% -7.4%
Interest expense 6,829 5,336 28.0%
Interest income 641 430 49.0%
Interest expense, net 6,188 4,906 26.1%
Foreign exchange loss (gain) (279) 1,838 -115.2%
Loss (gain) on monetary position in inflationary subsidiries (2,163) (794) 172.4%
Market value (gain) loss on financial instruments (556) (263) 111.1%
Comprehensive financing result 3,190 5,687 -43.9%
Income before taxes 13,913 9,121 52.5%
Income taxes 2,966 2,288 29.6%
Consolidated net income 10,947 6,833 60.2%
Net income attributable to equity holders of the company 10,233 6.8% 6,581 5.5% 55.5%
Non-controlling interest 714 252 183.4%
Operating income (5)
17,744 11.7% 16,576 13.7% 7.0%
Depreciation 7,892 5,231 50.9%
Amortization and other operative non-cash charges 3,002 1,666 80.2%
Operating cash flow (5)(7)
28,638 18.9% 23,473 19.5% 22.0% 3.5%
CAPEX 9,642 6,893
(1) Except volume and average price per unit case figures.
(2) Sales volume and average price per unit case exclude beer results.
(4) Includes equity method in Jugos del Valle, Leao Alimentos, Estrella Azul, one month of 2017 and nine months of 2016 from Coca-Cola FEMSA Philippines, Inc., among others.
(5) The operating income and operative cash flow lines are presented as non-gaap measures for the convenience of the reader.
(6) Includes equity method in PIASA, IEQSA, Beta San Miguel, IMER and KSP Participacoes among others.
(7) Operative cash flow = operating income + depreciation, amortization & other operative non-cash charges.
(3) Includes total revenues of Ps. 59,806 million from our Mexican operation, Ps. 41,500 million from our Brazilian operation, Ps. 10,514 million from our Colombian operation, and Ps. 9,579 million from our
Argentine operation for the first nine months of 2017; Ps. 55,337 million from our Mexican operation, Ps. 29,011 million from our Brazilian operation, Ps. 10,856 from our Colombian operation, and Ps. 8,145
million from our Argentine operation for the same period of the previous year. Total Revenues includes Beer revenues in Brazil of Ps. 8,695 million for the first nine months of 2017 and Ps. 4,899 million for the
same period of the previous year.
(8) Comparable means, with respect to a year-over-year comparison, the change in a given measure excluding the effects of (i) mergers, acquisitions and divestitures, (ii) translation effects resulting from exchange rate
movements (iii) the results of hyperinflationary economies in both periods, and (iv) includes the results of Coca-Cola FEMSA Philippines Inc, as if the consolidation had taken place at the beginning of first quarter 2016.
From our operations, only Venezuela qualifies as a hyperinflationary economy.
Press Release 3Q 2017 October 25, 2017
Page 14
Mexico & Central America DivisionExpressed in millions of Mexican pesos
(1)
Quarterly information
3Q 17 % Rev 3Q 16 % RevD %
Reported
D %
Comparable(6)
Transactions (million transactions) 2,789.9 2,908.4 -4.1% -4.1%
Volume (million unit cases) 506.1 521.9 -3.0% -3.0%
Average price per unit case 45.89 43.13 6.4%
Net revenues 23,223 22,512
Other operating revenues 15 14
Total revenues (2) 23,239 100.0% 22,527 100.0% 3.2% 4.1%
Cost of goods sold 11,942 51.4% 11,412 50.7%
Gross profit 11,297 48.6% 11,114 49.3% 1.6% 2.4%
Operating expenses 7,652 32.9% 7,244 32.2%
Other operative expenses, net 57 0.2% 42 0.2%
Operative equity method (gain) loss in associates (3) 48 0.2% (27) -0.1%
Operating income (4)
3,540 15.2% 3,855 17.1% -8.2% -7.0%
Depreciation, amortization & other operative non-cash charges 1,475 6.3% 1,288 5.7%
Operating cash flow (4)(5) 5,015 21.6% 5,143 22.8% -2.5% -1.8%
Accumulated information
YTD 17 % Rev YTD 16 % RevD %
Reported
D %
Comparable(6)
Transactions (million transactions) 8,467.8 8,567.0 -1.2% -1.2%
Volume (million unit cases) 1,522.8 1,523.4 -0.0% -0.0%
Average price per unit case 45.45 42.62 6.7%
Net revenues 69,218 64,926
Other operating revenues 41 39
Total revenues (2) 69,259 100.0% 64,965 100.0% 6.6% 6.3%
Cost of goods sold 35,375 51.1% 32,518 50.1%
Gross profit 33,883 48.9% 32,447 49.9% 4.4% 4.1%
Operating expenses 23,051 33.3% 21,393 32.9%
Other operative expenses, net (36) -0.1% 190 0.3%
Operative equity method (gain) loss in associates (3) 94 0.1% (300) -0.5%
Operating income (4) 10,774 15.6% 11,164 17.2% -3.5% -1.3%
Depreciation, amortization & other operative non-cash charges 4,117 5.9% 3,627 5.6%
Operating cash flow (4)(5) 14,890 21.5% 14,791 22.8% 0.7% 0.3%
(1) Except volume and average price per unit case figures.
(2) For the quarter: Includes total revenues of Ps. 20,332 million from our Mexican operation for the third quarter of 2017 and 19,362 for the same period of the previous year
YTD information: Includes total revenues of Ps. 59,806 million from our Mexican operation for the first nine months of 2017 and 55,337 for the same period of the previous year
(4) The operating income and operative cash flow lines are presented as non-gaap measures for the convenience of the reader.
(5) Operative cash flow = operating income + depreciation, amortization & other operative non-cash charges.
(6) Comparable means, with respect to a year-over-year comparison, the change in a given measure excluding the effects of (i) mergers, acquisitions and divestitures, (ii) translation effects
resulting from exchange rate movements (iii) the results of hyperinflationary economies in both periods, and (iv) includes the results of Coca-Cola FEMSA Philippines Inc, as if the
consolidation had taken place at the beginning of first quarter 2016. From our operations, only Venezuela qualifies as a hyperinflationary economy.
(3) For the quarter: Includes equity method in Jugos del Valle, Estrella Azul, among others.
For YTD information: Includes Jugos del Valle, Estrella Azul, one month of 2017 and nine months of 2016 of Coca-Cola FEMSA Philippines, Inc., among others.
Press Release 3Q 2017 October 25, 2017
Page 15
South America DivisionExpressed in millions of Mexican pesos
(1)
Quarterly information
3Q 17 % Rev 3Q 16 % RevD %
Reported
D %
Comparable(7)
Transactions (million transactions) 2,076.1 1,999.8 3.8% -3.3%
Volume (million unit cases) (2) 315.3 302.5 4.2% -3.0%
Average price per unit case (2) 58.24 59.15 -1.5%
Net revenues 21,129 19,729
Other operating revenues 96 95
Total revenues (3) 21,226 100.0% 19,824 100.0% 7.1% 3.1%
Cost of goods sold 12,416 58.5% 12,061 60.8% 0.0%
Gross profit 8,810 41.5% 7,763 39.2% 13.5% 11.4%
Operating expenses 6,883 32.4% 5,951 30.0%
Other operative expenses, net 167 0.8% 45 0.2%
Operative equity method (gain) loss in associates (4) (42) -0.2% (22) -0.1%
Operating income (5) 1,801 8.5% 1,789 9.0% 0.7% 18.3%
Depreciation, amortization & other operative non-cash charges 1,779 8.4% 1,249 6.3%
Operating cash flow (5)(6) 3,580 16.9% 3,038 15.3% 17.9% 13.6%
Accumulated information
YTD 17 % Rev YTD 16 % RevD %
Reported
D %
Comparable(7)
Transactions (million transactions) 6,005.0 6,226.2 -3.6% -9.4%
Volume (million unit cases) (2) 922.1 960.4 -4.0% -9.1%
Average price per unit case (2) 63.84 52.55 21.5%
Net revenues 67,557 55,370
Other operating revenues 226 293
Total revenues (3) 67,783 100.0% 55,663 100.0% 21.8% 0.1%
Cost of goods sold 40,217 59.3% 33,432 60.1%
Gross profit 27,566 40.7% 22,231 39.9% 24.0% 6.8%
Operating expenses 21,644 31.9% 16,898 30.4%
Other operative expenses, net (35) -0.1% (60) -0.1%
Operative equity method (gain) loss in associates (4) (99) -0.1% (19) -0.0%
Operating income (5) 6,057 8.9% 5,412 9.7% 11.9% 7.6%
Depreciation, amortization & other operative non-cash charges 5,325 7.9% 3,269 5.9%
Operating cash flow (5)(6) 11,382 16.8% 8,681 15.6% 31.1% 6.1%
(1) Except volume and average price per unit case figures.
(2) Sales volume and average price per unit case exclude beer results.
(4) Includes equity method in Leao Alimentos, Verde Campo, among others.
(5) The operating income and operative cash flow lines are presented as non-gaap measures for the convenience of the reader.
(6) Operative cash flow = operating income + depreciation, amortization & other operative non-cash charges.
(7) Comparable means, with respect to a year-over-year comparison, the change in a given measure excluding the effects of (i) mergers, acquisitions and divestitures, (ii) translation effects
resulting from exchange rate movements (iii) the results of hyperinflationary economies in both periods, and (iv) includes the results of Coca-Cola FEMSA Philippines Inc, as if the
consolidation had taken place at the beginning of first quarter 2016. From our operations, only Venezuela qualifies as a hyperinflationary economy.
(3) Q uarter information: Includes total revenues of Ps. 13,190 million from our Brazilian operation, Ps. 3,415 million from our Colombian operation, and Ps. 2,851 million from our
Argentine operation for the third quarter of 2017; and Ps. 10,676 million from our Brazilian operation, Ps. 3,849 from our Colombian operation, and Ps. 2,774 million from our Argentine
operation for the same period of the previous year. Total Revenues includes Beer revenues in Brazil of Ps. 2,768 million for the third quarter of 2017 and Ps. 1,836 million for the same period
of the previous year.
(3) Year to date information: Includes total revenues of Ps. 41,500 million from our Brazilian operation, Ps. 10,514 million from our Colombian operation, and Ps. 9,579 million from our
Argentine operation for the first nine months of 2017; and Ps. 29,011 million from our Brazilian operation, Ps. 10,856 from our Colombian operation, and Ps. 8,145 million from our
Argentine operation for the same period of the previous year. Total Revenues includes Beer revenues in Brazil of Ps. 8,695 million for the first nine months of 2017 and Ps. 4,899 million for
the same period of the previous year.
Press Release 3Q 2017 October 25, 2017
Page 16
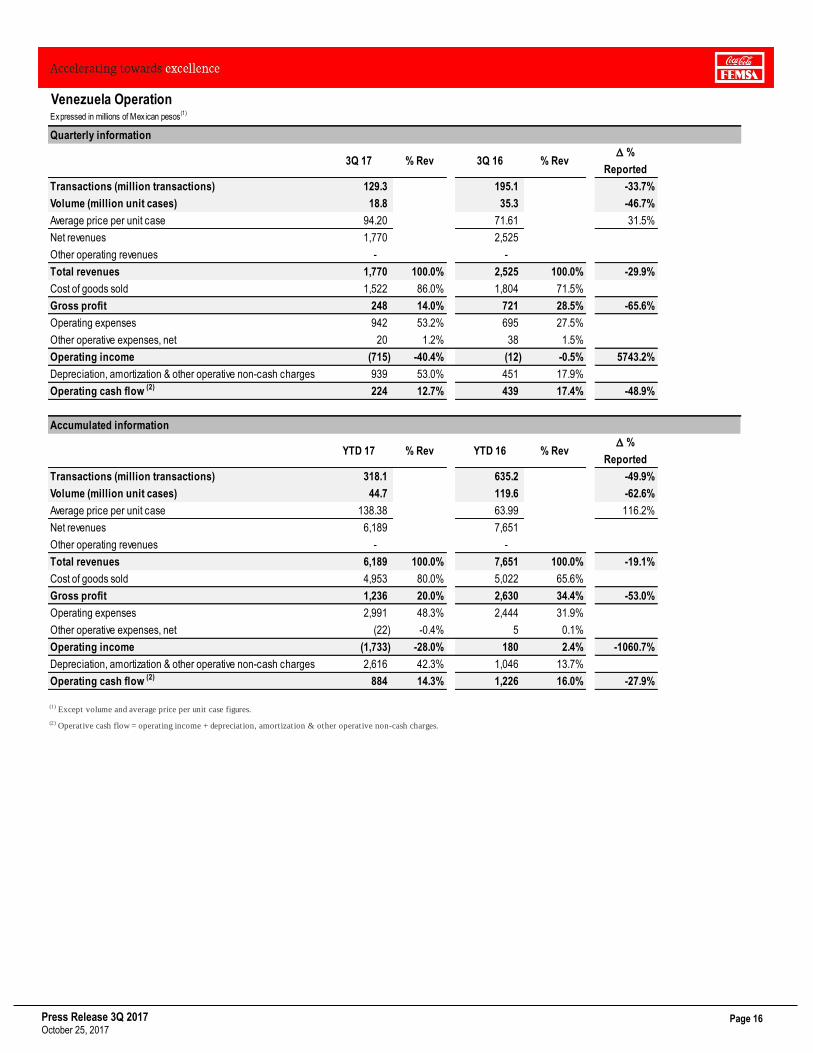
Venezuela OperationExpressed in millions of Mexican pesos
(1)
Quarterly information
3Q 17 % Rev 3Q 16 % RevD %
Reported
Transactions (million transactions) 129.3 195.1 -33.7%
Volume (million unit cases) 18.8 35.3 -46.7%
Average price per unit case 94.20 71.61 31.5%
Net revenues 1,770 2,525
Other operating revenues - -
Total revenues 1,770 100.0% 2,525 100.0% -29.9%
Cost of goods sold 1,522 86.0% 1,804 71.5%
Gross profit 248 14.0% 721 28.5% -65.6%
Operating expenses 942 53.2% 695 27.5%
Other operative expenses, net 20 1.2% 38 1.5%
Operating income (715) -40.4% (12) -0.5% 5743.2%
Depreciation, amortization & other operative non-cash charges 939 53.0% 451 17.9%
Operating cash flow (2) 224 12.7% 439 17.4% -48.9%
Accumulated information
YTD 17 % Rev YTD 16 % RevD %
Reported
Transactions (million transactions) 318.1 635.2 -49.9%
Volume (million unit cases) 44.7 119.6 -62.6%
Average price per unit case 138.38 63.99 116.2%
Net revenues 6,189 7,651
Other operating revenues - -
Total revenues 6,189 100.0% 7,651 100.0% -19.1%
Cost of goods sold 4,953 80.0% 5,022 65.6%
Gross profit 1,236 20.0% 2,630 34.4% -53.0%
Operating expenses 2,991 48.3% 2,444 31.9%
Other operative expenses, net (22) -0.4% 5 0.1%
Operating income (1,733) -28.0% 180 2.4% -1060.7%
Depreciation, amortization & other operative non-cash charges 2,616 42.3% 1,046 13.7%
Operating cash flow (2) 884 14.3% 1,226 16.0% -27.9%
(1) Except volume and average price per unit case figures.
(2) Operative cash flow = operating income + depreciation, amortization & other operative non-cash charges.
Press Release 3Q 2017 October 25, 2017
Page 17
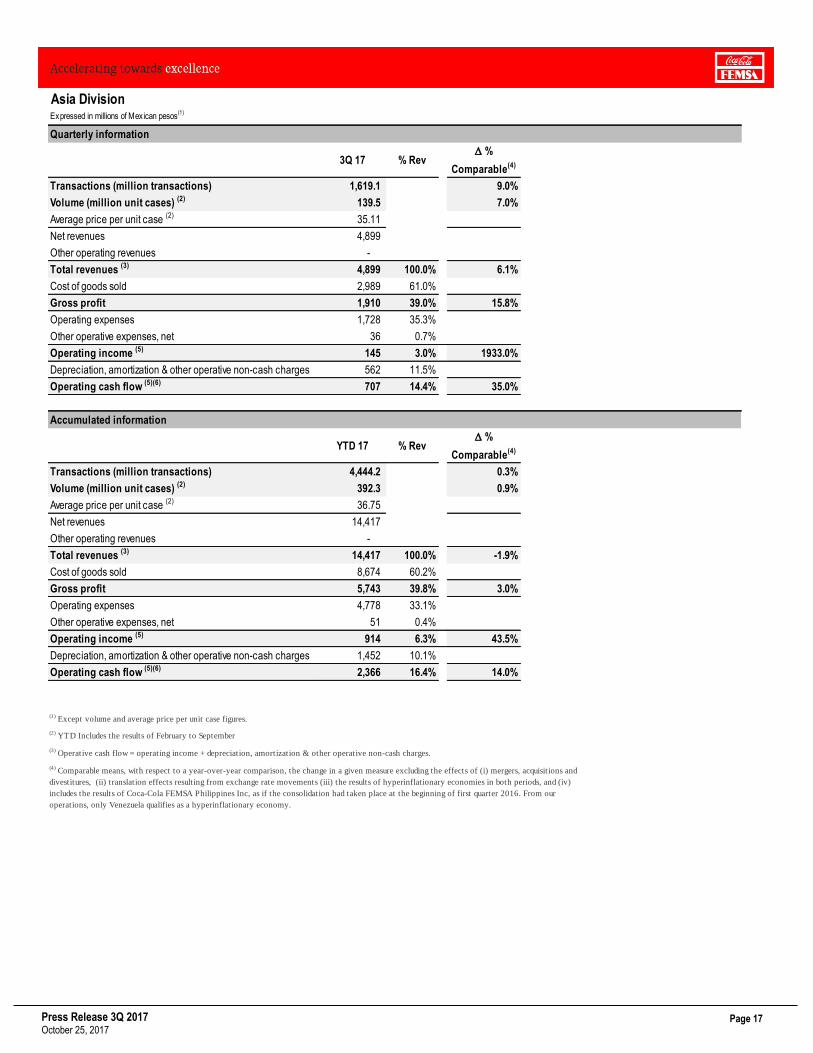
Asia DivisionExpressed in millions of Mexican pesos
(1)
Quarterly information
3Q 17 % RevD %
Comparable(4)
Transactions (million transactions) 1,619.1 9.0%
Volume (million unit cases) (2) 139.5 7.0%
Average price per unit case (2) 35.11
Net revenues 4,899
Other operating revenues -
Total revenues (3) 4,899 100.0% 6.1%
Cost of goods sold 2,989 61.0%
Gross profit 1,910 39.0% 15.8%
Operating expenses 1,728 35.3%
Other operative expenses, net 36 0.7%
Operating income (5) 145 3.0% 1933.0%
Depreciation, amortization & other operative non-cash charges 562 11.5%
Operating cash flow (5)(6) 707 14.4% 35.0%
Accumulated information
YTD 17 % RevD %
Comparable(4)
Transactions (million transactions) 4,444.2 0.3%
Volume (million unit cases) (2) 392.3 0.9%
Average price per unit case (2) 36.75
Net revenues 14,417
Other operating revenues -
Total revenues (3) 14,417 100.0% -1.9%
Cost of goods sold 8,674 60.2%
Gross profit 5,743 39.8% 3.0%
Operating expenses 4,778 33.1%
Other operative expenses, net 51 0.4%
Operating income (5) 914 6.3% 43.5%
Depreciation, amortization & other operative non-cash charges 1,452 10.1%
Operating cash flow (5)(6) 2,366 16.4% 14.0%
(1) Except volume and average price per unit case figures.
(2) YTD Includes the results of February to September
(3) Operative cash flow = operating income + depreciation, amortization & other operative non-cash charges.
(4) Comparable means, with respect to a year-over-year comparison, the change in a given measure excluding the effects of (i) mergers, acquisitions and
divestitures, (ii) translation effects resulting from exchange rate movements (iii) the results of hyperinflationary economies in both periods, and (iv)
includes the results of Coca-Cola FEMSA Philippines Inc, as if the consolidation had taken place at the beginning of first quarter 2016. From our
operations, only Venezuela qualifies as a hyperinflationary economy.
Press Release 3Q 2017 October 25, 2017
Page 18
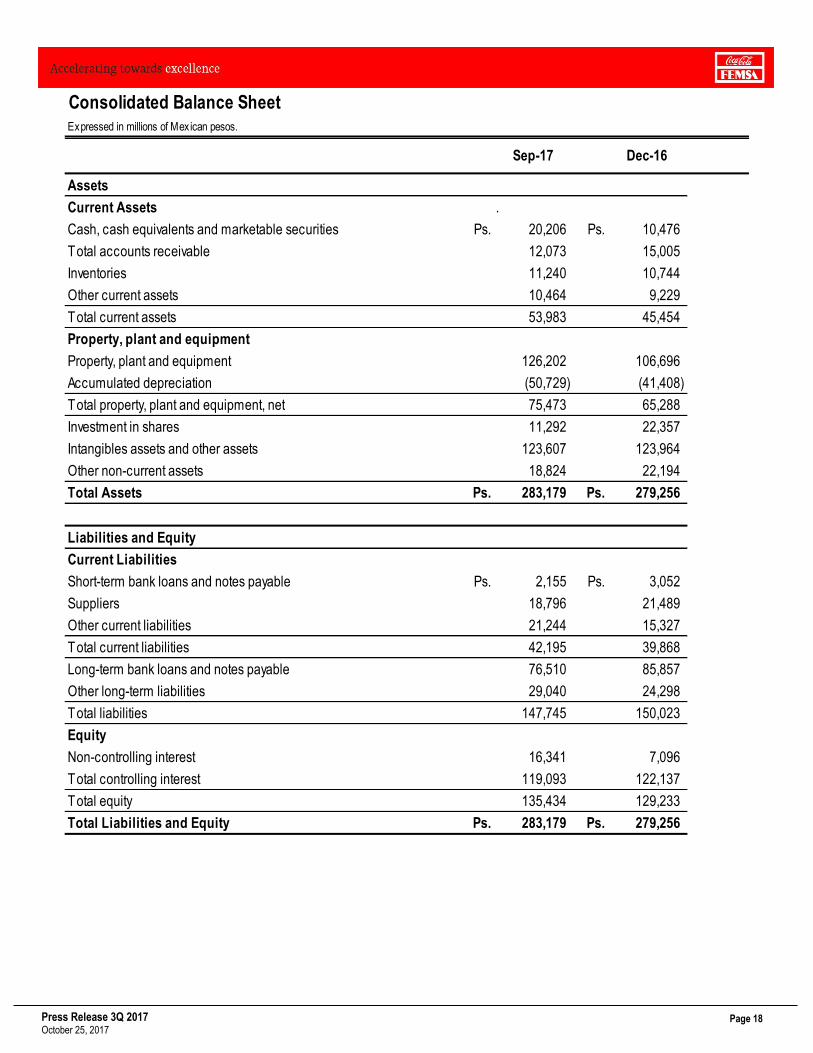
Consolidated Balance SheetExpressed in millions of Mexican pesos.
Sep-17 Dec-16
Assets
Current Assets .
Cash, cash equivalents and marketable securities Ps. 20,206 Ps. 10,476
Total accounts receivable 12,073 15,005
Inventories 11,240 10,744
Other current assets 10,464 9,229
Total current assets 53,983 45,454
Property, plant and equipment
Property, plant and equipment 126,202 106,696
Accumulated depreciation (50,729) (41,408)
Total property, plant and equipment, net 75,473 65,288
Investment in shares 11,292 22,357
Intangibles assets and other assets 123,607 123,964
Other non-current assets 18,824 22,194
Total Assets Ps. 283,179 Ps. 279,256
Liabilities and Equity
Current Liabilities
Short-term bank loans and notes payable Ps. 2,155 Ps. 3,052
Suppliers 18,796 21,489
Other current liabilities 21,244 15,327
Total current liabilities 42,195 39,868
Long-term bank loans and notes payable 76,510 85,857
Other long-term liabilities 29,040 24,298
Total liabilities 147,745 150,023
Equity
Non-controlling interest 16,341 7,096
Total controlling interest 119,093 122,137
Total equity 135,434 129,233
Total Liabilities and Equity Ps. 283,179 Ps. 279,256
Press Release 3Q 2017 October 25, 2017
Page 19
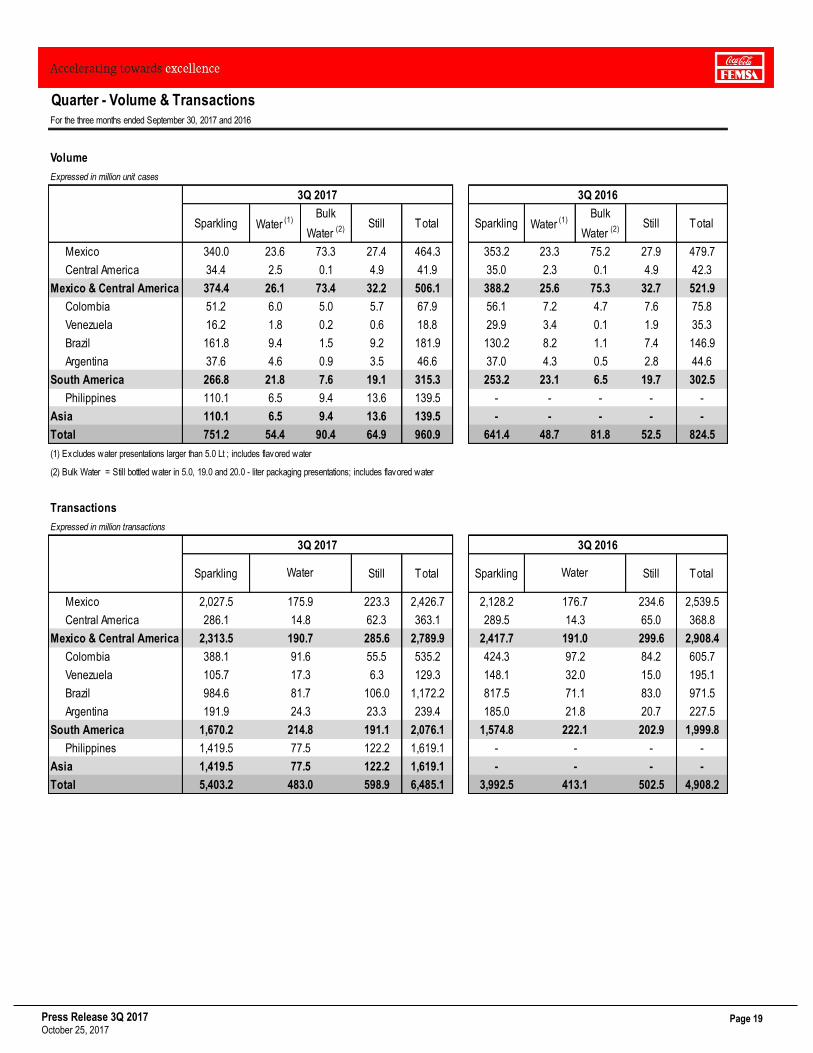
Quarter - Volume & TransactionsFor the three months ended September 30, 2017 and 2016
Volume
Expressed in million unit cases
Sparkling Water (1)Bulk
Water (2)Still Total Sparkling Water (1)
Bulk
Water (2)Still Total
Mexico 340.0 23.6 73.3 27.4 464.3 353.2 23.3 75.2 27.9 479.7
Central America 34.4 2.5 0.1 4.9 41.9 35.0 2.3 0.1 4.9 42.3
Mexico & Central America 374.4 26.1 73.4 32.2 506.1 388.2 25.6 75.3 32.7 521.9
Colombia 51.2 6.0 5.0 5.7 67.9 56.1 7.2 4.7 7.6 75.8
Venezuela 16.2 1.8 0.2 0.6 18.8 29.9 3.4 0.1 1.9 35.3
Brazil 161.8 9.4 1.5 9.2 181.9 130.2 8.2 1.1 7.4 146.9
Argentina 37.6 4.6 0.9 3.5 46.6 37.0 4.3 0.5 2.8 44.6
South America 266.8 21.8 7.6 19.1 315.3 253.2 23.1 6.5 19.7 302.5
Philippines 110.1 6.5 9.4 13.6 139.5 - - - - -
Asia 110.1 6.5 9.4 13.6 139.5 - - - - -
Total 751.2 54.4 90.4 64.9 960.9 641.4 48.7 81.8 52.5 824.5
(1) Excludes water presentations larger than 5.0 Lt ; includes flavored water
(2) Bulk Water = Still bottled water in 5.0, 19.0 and 20.0 - liter packaging presentations; includes flavored water
Transactions
Expressed in million transactions
Sparkling Still Total Sparkling Still Total
Mexico 2,027.5 223.3 2,426.7 2,128.2 234.6 2,539.5
Central America 286.1 62.3 363.1 289.5 65.0 368.8
Mexico & Central America 2,313.5 285.6 2,789.9 2,417.7 299.6 2,908.4
Colombia 388.1 55.5 535.2 424.3 84.2 605.7
Venezuela 105.7 6.3 129.3 148.1 15.0 195.1
Brazil 984.6 106.0 1,172.2 817.5 83.0 971.5
Argentina 191.9 23.3 239.4 185.0 20.7 227.5
South America 1,670.2 191.1 2,076.1 1,574.8 202.9 1,999.8
Philippines 1,419.5 122.2 1,619.1 - - -
Asia 1,419.5 122.2 1,619.1 - - -
Total 5,403.2 598.9 6,485.1 3,992.5 502.5 4,908.2
77.5 -
483.0 413.1
24.3 21.8
214.8 222.1
77.5 -
91.6 97.2
17.3 32.0
81.7 71.1
175.9 176.7
14.8 14.3
190.7 191.0
3Q 2017 3Q 2016
3Q 2017 3Q 2016
Water Water
Press Release 3Q 2017 October 25, 2017
Page 20
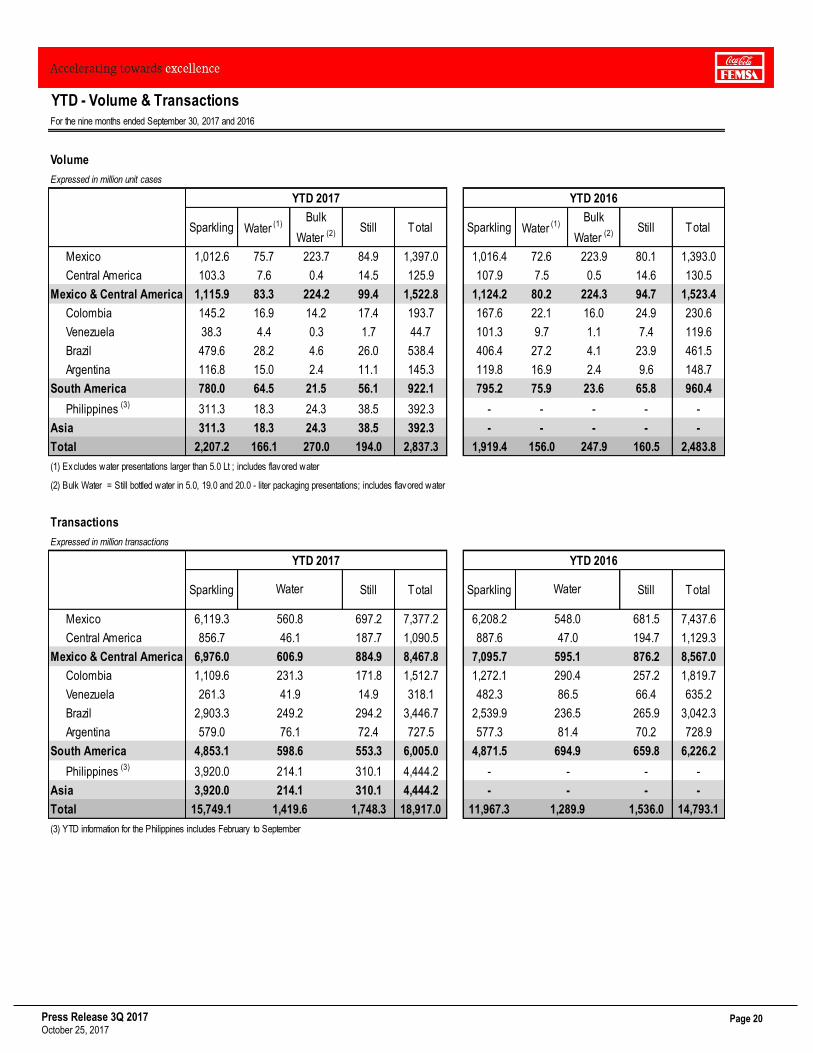
YTD - Volume & TransactionsFor the nine months ended September 30, 2017 and 2016
Volume
Expressed in million unit cases
Sparkling Water (1)Bulk
Water (2)Still Total Sparkling Water (1)
Bulk
Water (2)Still Total
Mexico 1,012.6 75.7 223.7 84.9 1,397.0 1,016.4 72.6 223.9 80.1 1,393.0
Central America 103.3 7.6 0.4 14.5 125.9 107.9 7.5 0.5 14.6 130.5
Mexico & Central America 1,115.9 83.3 224.2 99.4 1,522.8 1,124.2 80.2 224.3 94.7 1,523.4
Colombia 145.2 16.9 14.2 17.4 193.7 167.6 22.1 16.0 24.9 230.6
Venezuela 38.3 4.4 0.3 1.7 44.7 101.3 9.7 1.1 7.4 119.6
Brazil 479.6 28.2 4.6 26.0 538.4 406.4 27.2 4.1 23.9 461.5
Argentina 116.8 15.0 2.4 11.1 145.3 119.8 16.9 2.4 9.6 148.7
South America 780.0 64.5 21.5 56.1 922.1 795.2 75.9 23.6 65.8 960.4
Philippines (3) 311.3 18.3 24.3 38.5 392.3 - - - - -
Asia 311.3 18.3 24.3 38.5 392.3 - - - - -
Total 2,207.2 166.1 270.0 194.0 2,837.3 1,919.4 156.0 247.9 160.5 2,483.8
(1) Excludes water presentations larger than 5.0 Lt ; includes flavored water
(2) Bulk Water = Still bottled water in 5.0, 19.0 and 20.0 - liter packaging presentations; includes flavored water
Transactions
Expressed in million transactions
Sparkling Still Total Sparkling Still Total
Mexico 6,119.3 697.2 7,377.2 6,208.2 681.5 7,437.6
Central America 856.7 187.7 1,090.5 887.6 194.7 1,129.3
Mexico & Central America 6,976.0 884.9 8,467.8 7,095.7 876.2 8,567.0
Colombia 1,109.6 171.8 1,512.7 1,272.1 257.2 1,819.7
Venezuela 261.3 14.9 318.1 482.3 66.4 635.2
Brazil 2,903.3 294.2 3,446.7 2,539.9 265.9 3,042.3
Argentina 579.0 72.4 727.5 577.3 70.2 728.9
South America 4,853.1 553.3 6,005.0 4,871.5 659.8 6,226.2
Philippines (3) 3,920.0 310.1 4,444.2 - - -
Asia 3,920.0 310.1 4,444.2 - - -
Total 15,749.1 1,748.3 18,917.0 11,967.3 1,536.0 14,793.1
YTD 2017 YTD 2016
YTD 2017 YTD 2016
Water Water
560.8 548.0
46.1 47.0
606.9 595.1
231.3 290.4
41.9 86.5
249.2 236.5
76.1 81.4
598.6 694.9
214.1 -
(3) YTD information for the Philippines includes February to September
214.1 -
1,419.6 1,289.9
Press Release 3Q 2017 October 25, 2017
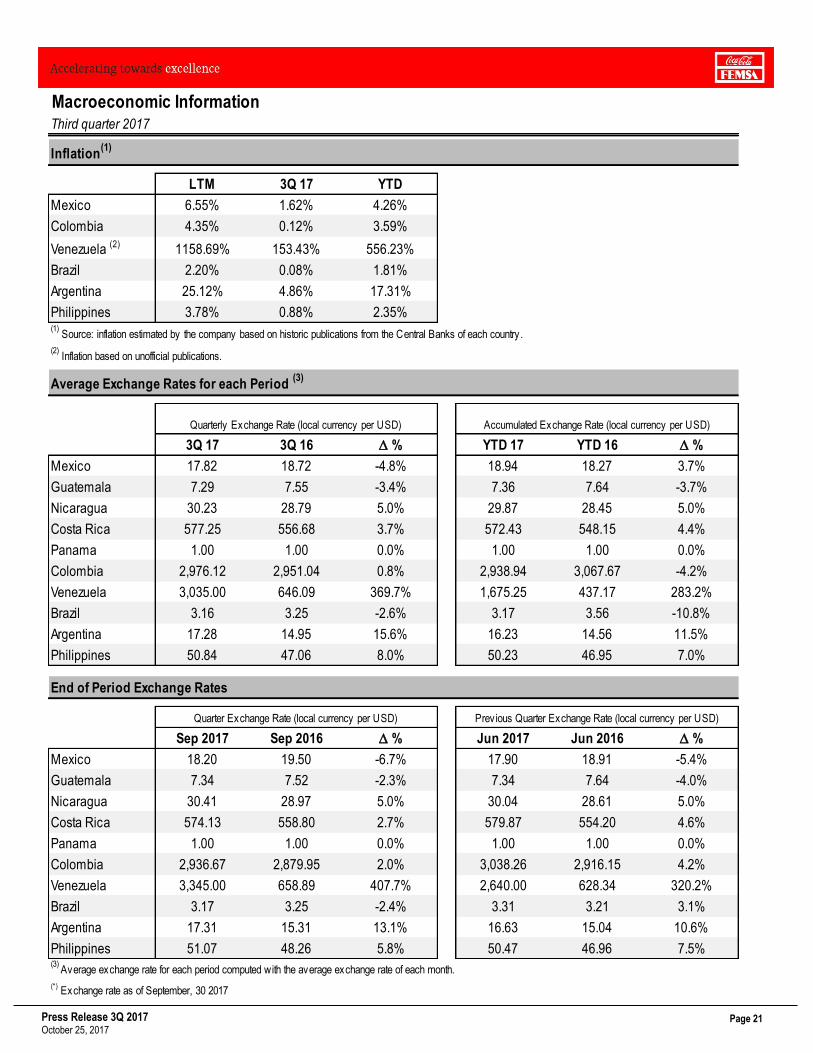
Page 21
Macroeconomic Information Third quarter 2017
Inflation(1)
LTM 3Q 17 YTD
Mexico 6.55% 1.62% 4.26%
Colombia 4.35% 0.12% 3.59%
Venezuela (2) 1158.69% 153.43% 556.23%
Brazil 2.20% 0.08% 1.81%
Argentina 25.12% 4.86% 17.31%
Philippines 3.78% 0.88% 2.35%(1)
Source: inflation estimated by the company based on historic publications from the Central Banks of each country .
(2) Inflation based on unofficial publications.
Average Exchange Rates for each Period (3)
3Q 17 3Q 16 D % YTD 17 YTD 16 D %
Mexico 17.82 18.72 -4.8% 18.94 18.27 3.7%
Guatemala 7.29 7.55 -3.4% 7.36 7.64 -3.7%
Nicaragua 30.23 28.79 5.0% 29.87 28.45 5.0%
Costa Rica 577.25 556.68 3.7% 572.43 548.15 4.4%
Panama 1.00 1.00 0.0% 1.00 1.00 0.0%
Colombia 2,976.12 2,951.04 0.8% 2,938.94 3,067.67 -4.2%
Venezuela 3,035.00 646.09 369.7% 1,675.25 437.17 283.2%
Brazil 3.16 3.25 -2.6% 3.17 3.56 -10.8%
Argentina 17.28 14.95 15.6% 16.23 14.56 11.5%
Philippines 50.84 47.06 8.0% 50.23 46.95 7.0%
End of Period Exchange Rates
Sep 2017 Sep 2016 D % Jun 2017 Jun 2016 D %
Mexico 18.20 19.50 -6.7% 17.90 18.91 -5.4%
Guatemala 7.34 7.52 -2.3% 7.34 7.64 -4.0%
Nicaragua 30.41 28.97 5.0% 30.04 28.61 5.0%
Costa Rica 574.13 558.80 2.7% 579.87 554.20 4.6%
Panama 1.00 1.00 0.0% 1.00 1.00 0.0%
Colombia 2,936.67 2,879.95 2.0% 3,038.26 2,916.15 4.2%
Venezuela 3,345.00 658.89 407.7% 2,640.00 628.34 320.2%
Brazil 3.17 3.25 -2.4% 3.31 3.21 3.1%
Argentina 17.31 15.31 13.1% 16.63 15.04 10.6%
Philippines 51.07 48.26 5.8% 50.47 46.96 7.5%(3)
Average exchange rate for each period computed with the average exchange rate of each month.
(*) Exchange rate as of September, 30 2017
Quarterly Exchange Rate (local currency per USD) Accumulated Exchange Rate (local currency per USD)
Quarter Exchange Rate (local currency per USD) Previous Quarter Exchange Rate (local currency per USD)


![Ghid Cash Flow[1]](https://img.pdfslide.tips/doc/110x75/557213ca497959fc0b930708/ghid-cash-flow1.jpg)