Embed Size (px)
Citation preview
SANTOS, I. G. dos; AUER, T.; SOUZA, R. V. G. de. Optimized indoor daylight for tropical dense urban environments. Ambiente Construído, Porto Alegre, v. 17, n. 3, p. 87-102, jul./set. 2017. ISSN 1678-8621 Associação Nacional de Tecnologia do Ambiente Construído.
http://dx.doi.org/10.1590/s1678-86212017000300164
87
Optimized indoor daylight for tropical dense urban environments
Iluminação natural interna otimizada em ambientes urbanos tropicais adensados
Iara Gonçalves dos Santos Thomas Auer Roberta Vieira Gonçalves de Souza
Abstract tudies using metrics related to dynamic sky conditions for indoor
daylight performance assessment in urban environment are rare in
tropical latitudes. This study applied one of these metrics, the spatial
Daylight Autonomy (sDA 300,50% ≥75%, IES LM 83-12) for Cuiabá
(15ºS, 56ºW, Brazil), a savanna climate city with a high frequency of partly cloudy
skies. Parametric simulations were used to investigate the availability of daylight
in dense urban areas. So daylight conditions inside a reference room with varied
depths located within a continuous urban canyon were simulated with
Radiance/Daysim in Grasshopper/Honeybee. Dimensions of the street and heights
of front buildings (obstructions) are also varied in order to observe the relation
between the sky angle and the sDA, for the four main cardinal directions. The
results of regression analysis for this case study showed that among all evaluated
parameters, room depth tended to be the most relevant for the optimization of
indoor daylight. Finally, limitations of this approach and opportunities for further
investigations were discussed.
Keywords: Daylight. Illuminance. Computer simulation. Spatial Daylight Autonomy.
Resumo
Estudos que utilizam métricas baseadas em céu dinâmico para abordagem de desempenho de iluminação natural em recintos são raros em cidades de latitudes tropicais. Este estudo aplicou a métrica Autonomia Espacial de Luz Natural (sDA
300,50% ≥75%, IES LM 83-12) para Cuiabá (15ºS, 56ºW, Brasil), uma cidade de savana com predominância de céus parcialmente nublados. Simulações paramétricas foram utilizadas para investigar a disponibilidade de iluminação natural em contexto urbano adensado. As condições de iluminação natural dentro de um recinto de profundidade variada localizado em um cânion urbano foram simuladas com Radiance/Daysim no Grasshopper/Honeybee. Dimensões da via e de altura dos edifícios frontais foram variadas com o objetivo de observar a relação entre o ângulo de céu e o sDA para as quarto orientações solares principais. Os resultados deste estudo de caso mostraram que a profundidade do recinto tende a ser o parâmetro mais relevante entre os analisados para a otimização de iluminação natural interna. Finalmente, as limitações dessa abordagem e oportunidades de futuras pesquisas foram discutidas.
Palavras-chave: Iluminação natural. Iluminância. Simulação computacional. Autonomia Espacial de Luz Natural.
S
Iara Gonçalves dos Santos Technical University of Munich
Munich – Germany
Thomas Auer Technical University of Munich
Munich – Germany
Roberta Vieira Gonçalves de Souza
Universidade Federal de Minas Gerais Belo Horizonte - MG - Brasil
Recebido em 28/11/16
Aceito em 28/03/17
Ambiente Construído, Porto Alegre, v. 17, n. 3, p. 87-102, jul./set. 2017.
Santos, I. G. dos; Auer, T.; Souza, R. V. G. de 88
Introduction
Artificial lighting accounts for about 20% of
building electricity consumption worldwide, and
the forecasted total electricity savings potential in
building lighting by 2030 could be equivalent to all
the electricity consumed in Africa in 2013
(INTERNATIONAL..., 2016).
Concurrently, in tropical locations the daylight is
capable to ensure freedom from artificial light
during a significant part of the day (DIAS et al.,
2009). Brazil being mainly one of them, is the focus
of this paper.
Daylighting has potential in saving energy and
decreasing maintenance costs. Apart from that, it
promotes health, productivity, and well-being.
Despite of its importance, researches dedicated to
daylight assessment in dense urban spaces, are
relatively recent. Internationally, examples of this
kind of study can be found in the publications by
Tsangrassoulis et al. (1999) for estimating
illuminances in urban canyons, by Ng (2001) for
daylight design in high-density urban residential
buildings using a metric for overcast sky, and by
Reinhart and LoVerso (2010) about a design
sequence for diffuse daylight based on design “rules
of thumb”.
A larger review on urban daylighting was
conducted by Nasrollahi and Shokri (2016), who
addressed scientific publications between the years
of 1993 and 2015. The authors addressed concepts
of daylighting, sky types, solar movement, and
effective architectural parameters in an urban
context. They shortlisted fifty papers that were
considered to bring relevant knowledge to the field
within this period. Among other conclusions, they
recorded that:
(a) increasing the street width increases the
incident quantity of radiation inside an urban
canyon, while the energy consumption in a
building decreases;
(b) increasing solar reflectance of exterior
surfaces increases the incident daylight indoor,
while the demand of energy for artificial light
reduces;
(c) exterior shading devices provide visual
comfort, while decrease the energy consumption of
a building; and
(d) the surfaces of an urban canyon can receive
uneven radiation due to solar orientation.
However, part of those conclusions are generic, and
need to be analyzed in detail according to local and
climate conditions, in addition to other determined
aspects that make the urban analysis quite complex.
These complexities are due to the fact that daylight
availability indoor is affected by the interaction of
the following:
(a) the source (sky and sun);
(b) the receptor (indoor characteristics); and
(c) the mediator (characteristics of external items
such as surrounding buildings, vegetation,
architectural components).
The potential use of the available daylight indoor is
also determined by the agent (occupant) itself.
In studies of daylight optimization, it is considered
that the first three aspects must be investigated
considering pre-defined demands under a metric,
which allows the comparison of daylight
performance between different spaces. There are
several indexes [metrics] for daylight assessment
indoor, as presented by Carlucci et al. (2015) – and
most of them are based on illuminance levels,
commonly addressed as the range of quantity of
light required for the execution of an activity.
The definition of appropriate illuminance levels for
human needs, as well as the most suitable metric for
daylight assessment, evolves as result of novelties
in the research.
Regarding illuminance levels, for instance, the
Brazilian standard NBR 5413 (ABNT, 1992)
provided a basic guideline for selecting illuminance
levels according to the visual task executed indoor:
i.e., 150lux as the average for deposits and areas
not-used for continuous work, 300lux for tasks with
a limited visual requirement, and 750lux for offices
(ABNT, 1992). Later, the Brazilian standard NBR
ISO/CIE 8995-1 (ABNT, 2013) proposed different
values for indoor illuminances. According to it
schools, offices, and rooms for medical regular
attendance must provide values between 300-
750lux, departmental stores from between 300-
500lux and multi-use rooms for entertainment
activities, a minimum of 300lux. Mardaljevic et al.
(2011) highlighted that levels above 300lux are
frequently perceived by occupants in offices as
desirable up to a certain limit, and it is less probable
that the light will be switched-on beyond 300lux.
Recent development combines the use of computer
simulation for analyzing dynamic skies considering
variations of sun positions and sky conditions
within a period of time (usually one year). Spatial
Daylight Autonomy (sDA), endorsed by the
Illuminating Engineering Society of North
America, IESNA (ILLUMINATING..., 2012) is
one of the recent metrics proposed. The sDA reports
the floor area indoor (%) that exceeds two
Ambiente Construído, Porto Alegre, v. 17, n. 3, p. 87-102, jul./set. 2017.
Optimized indoor daylight for tropical dense urban environments 89
thresholds (Lighting Measurement IES LM 83-12
(ILLUMINATING..., 2012)):
(a) the minimum daylight illuminance level (lux)
to be achieved; and
(b) a fraction of the occupied hours per year (%).
The sDA threshold is 300lux and 50% of the
occupancy time from 8am-6pm considering
adjustment for longitude and daylight savings time.
The performance result of an analysis area can then
be classified as “nominally acceptable” (sDA≥55%)
or “preferred” (sDA≥75%). These limits of
sDA(300,50%) were established based on the
investigation of occupant preferences in open plan
offices, meeting rooms, classrooms, public lobbies
and public spaces in libraries between latitudes
37ºN-48ºN in U.S.A.; and it is considered that they
could be extended for areas with similar visual tasks
(ILLUMINATING…, 2012). The IES LM 83-12 is
adopted since October/2016 by the building rating
system Leadership in Energy and Environmental
Design (LEEDv4), one of the Green Building
certifications that is applied in Brazil (GREEN…,
2014).
In this context, the sDA metric was chosen for this
study to conduct a quantitative assessment of
daylight availability in a dense urban location under
predominantly partly cloudy skies.
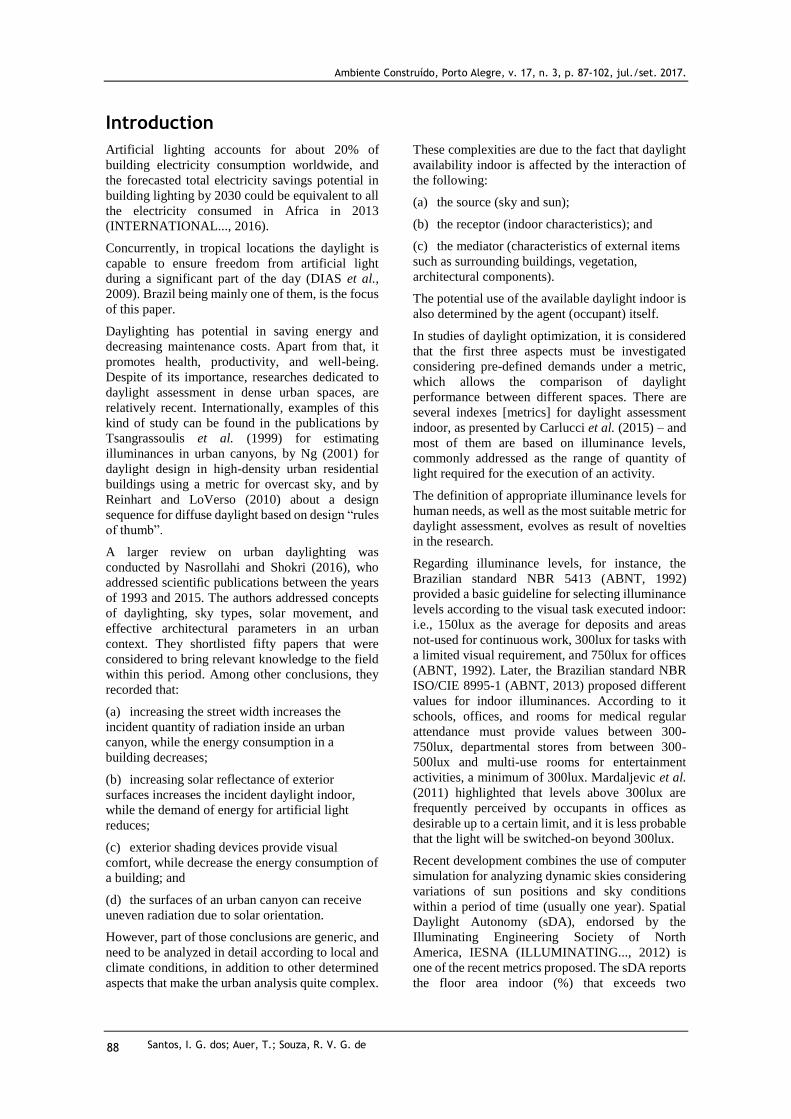
This predominantly partly cloudy sky is typical in
Savanna climate, in its duality between dry (sunny)
season and a wet (rainy) season. Several cities
above 500.000 inhabitants will tend to appear by
2030 in Savannas within the tropics (Figure 1). It is
expected that due to higher solar altitudes in lower
latitudes there might be different outcomes in the
spatial distribution of indoor daylighting, affecting
sDA when compared to other luminous sky
conditions.
Therefore, such assessment is decisive to avoid
unsatisfactory daylight conditions and hence,
excessive energy consumption of indoor lighting,
for these forecasted dense urban areas.
Background: data and software for daylight assessment
Climatic-based metrics for daylight assessment in
an enclosed system (a room or open space) rely on
atmospheric data which may be measured or
calculated based on models.
The International Building Performance Simulation
Association- IBPSA (INTERNATIONAL…, 2016)
reports that daylight data for building simulation
purposes is a field for improvements. Illuminance
data is usually calculated from irradiance values.
Additionally, the Association points out that
information of cloud cover, which are used for
daylighting and sky temperature calculations,
should be used carefully, since these reports are not
standards worldwide.
Figure 1 - World map with cities> 500.000 inhabitants, forecast for 2030; Savanna climate in blue colour (Köppen-Geiger “Aw” classification)
Source: adapted from Kottek et al. (2006) and United Nations (2014).
Ambiente Construído, Porto Alegre, v. 17, n. 3, p. 87-102, jul./set. 2017.
Santos, I. G. dos; Auer, T.; Souza, R. V. G. de 90
To fulfil the lack of daylighting measurement
stations with long-term data, models such as the one
proposed by Perez et al. (1990) are used. These
authors proposed models to predict direct, global
and diffuse illuminance; diffuse irradiance or
illuminance received by a tilted surface; sky zenith
luminance and sky luminance angular distribution,
representing different sky conditions, from clear to
overcast sky. The models were developed
considering data from high latitudes collected in 10
cities in U.S.A. and 3 in Europe, under conditions
which ranged from “high altitude desert to
temperate maritime, including humid continental,
subtropical and highly polluted environments”.
One of the most common weather data sets for
characterizing a local climate is the Typical
Meteorological Year (TMY). A TMY for computer
simulation is composed of 12 months of hourly data
(8,760 hours); each month is selected from different
years, considering it closest proximity to a
statistical weighted long-term distribution of solar
radiation, dry-bulb temperature, dew point, and
wind velocity: a more complete methodology than
that used in the Test Reference Year (TRY)
(CRAWLEY, 1998). TMY is available for more
than 5000 locations worldwide under different
formats such as the Solar and Wind Energy
Resource Assessment (SWERA), the Indian
Society of Heating, Refrigerating and Air
Conditioning Engineers (ISHRAE), ASHRAE's
International Weather for Energy Calculations 2.0
(IWEC2), the Chinese Standard Year Weather Data
(CSWD), and the Typical Meteorological Year 3
(TMY3) (INTERNATIONAL..., 2016). Weather
files built over the Brazilian Instituto Nacional de
Meteorologia (INMET) data also use the TMY
methodology (RORIZ, 2012). The TMY files may
be converted to different formats which are readable
by building/urban simulation packages, i.e. “epw”.
Recent versions of weather files for computer
simulation based in the TMY adopt the model by
Perez et al. (1990) (U.S…., 1995).
Concerning software for daylight simulations.
Bhavani and Khan (2011) described the features of
some of them: Radiance, Relux, ADELINE,
DIALux, Light scope, Inspirer, Rayfront, 3D studio
MAX, Superlite, Lumen Micro, Specter, ESP
vision, Light works and DAYSIM. In Brazil,
Troplux and Apolux are avaible varieties.
Daysim/Radiance is one of the most used software
for indoor analysis. Radiance was developed in the
Lawrence Berkeley National Laboratory in the
1980`s. It calculates luminance required for
visualization using backward ray-tracing, a
1<http://www.food4rhino.com/app/ladybug-analysis-tools>. Accessed: 16/Feb/2017.
technique in which the light is traced from the
observer to the source(s), and it calculates
illuminances for a selected type of sky. Daysim uses
the algorithms of Radiance as a foundation to
calculate illuminance and luminance profiles from
a weather file (REINHART, 2006), becoming
known as Daysim/Radiance. Daysim/Radiance
incorporates a model based in Perez et al. (1990) for
internal calculations of dynamic skies.
Recent parametric studies use Rhinoceros to
conduct the simulations: i.e., Wagdy et al. (2015).
Rhinoceros is a software for three-dimensional
computer graphics and computer-aided design
(CAD) which can incorporate a graphical algorithm
editor called Grasshopper. The Ladybug Analysis
Tools in turn connects Grasshopper to various
simulation engines such as EnergyPlus, Radiance,
and Daysim for building energy, comfort,
daylighting and lighting simulations1.
Urban daylight in the tropics
In the tropics, Assis and Valadares (1995) proposed
a mathematic model to be incorporated by urban
legislation of the city of Belo Horizonte (19°55'S,
Brazil, partially Savanna climate), in order to favor
daylight and insolation. More than 20 years ago,
they defined thresholds similar to the concept of
sDA, except for the spatial percentage of indoor
floor area. The research adopted 150lux in the work
plane of residences; 80% time of the year from 8am
to 4pm; under different values of external horizontal
illuminances found in literature (the higher value
being of 26.4klux), as the premise. Subsequently,
the authors demarcated the minimum sky angle for
the area. The sky angle was determined between the
vertical plane containing the window and the top of
the opposite building, with a vertex located on the
top of the window sill of a defined space on the
ground floor. Thus, a minimum sky angle of 27°30`
was defined for preserving daylight in the
residential urban areas. The authors recommended
that 150lux should not be adopted in mixed land use
designating at least 300lux for offices and
commercial activities and therefore new sky angles
should be determined in those cases.
Indeed, urban planning in rapidly growing cities
face the challenge to promote the concept of
buildings prepared for flexibility over time, and to
shelter mixed activities simultaneously.
Henceforth, minimum illuminance levels based on
the demands of a unique typology with lower
requirement levels, such as the residential one,
Ambiente Construído, Porto Alegre, v. 17, n. 3, p. 87-102, jul./set. 2017.
Optimized indoor daylight for tropical dense urban environments 91
could not be adopted as a reference for the entire
urban design.
More recently, Laranja et al. (2012) evaluated the
effect of solar orientation on the indoor daylight
availability of a room located in the coastal city of
Vitoria (20°17'S, Brazil, Savanna climate). They
used the software Troplux for an annual simulation
of three CIE skies (with a daily schedule of 13 hours
from 6am-6pm). The output was the average global
illuminance based on a dynamic metric assessment
that computed indoor values between 100-2000 lux.
The room was modelled with dimensions of
2.60x3.85x2.60m (width x depth x height, m), and
internal reflectances of 20/50/85 % (floor, walls,
ceiling, %). One window on the façade, was defined
with clear glass, sill height of 1.10m, and dimension
of 1/8th of the area of the room floor according to
local laws, resulting in a total area of 1.25 m². The
room was located in the 4th floor of a building on a
20m wide street. Three front buildings were
modelled with different heights (37.6 m; 37.6 m and
29m), different distances from the sidewalk, and
different spaces between them. The window was
simulated facing to four different solar orientations
(N, S, E, W). The results for this case study showed
small differences of indoor daylight under the
expected homogeneous output from CIE sky type 3
(overcast). Under the CIE sky type 7 (partially
cloudy) and type 12 (clear), the window oriented to
North resulted in the highest illuminance
percentage, to South the lowest, while to East and
West presented similar percentages. The reasons for
the choice of the obstructions configured in the
study were not described in the paper, neither
references of external reflectances.
Scalco and Pereira (2016) proposed a method to
analyze the impact of buildings in static daylight
performance of a neighborhood in Brazil. Different
urban configurations with the same built area were
compared. The software Apolux was used,
assuming partially cloudy sky. The results indicated
that a higher percentage of adverse impacts
occurred in regular, homogeneous building
configurations with 5 floors and building footprint
of 75% of the gross area of the plot. Comparatively,
better results were observed in taller buildings with
low building footprint. Considering the outdoor
reflection by obstructions, evaluation of different
type of skies, and use of dynamic simulation, were
some of the suggestions for future studies.
Furthermore, Paule and Kaempf (2016) assessed the
daylight performance of rooms in the urban context
of Bogotá (4°37’N, Colombia). They compared the
results provided by two software: one specialized
for the room scale (DIAL), and the other for urban
scale (CitySIM). They established a threshold, as
per the number of annual hours during which the
indoor illuminance exceeds 300lux for two points
located inside each room. This study demonstrated
that there were discrepancies in the results of the
points located far from the façade, probably due to
indoor reflectances. Indirectly, the study evidenced
that the tool used for urban assessment needed
improvements for quantifying indoor reflectances.
The authors suggested to create a link between the
two software for complementing the capabilities of
both.
CitySIM was used before by Martins et al. (2013)
in a study on the impact of urban form on the energy
demand of buildings in the city of Maceió (9° 39′
S), computing the demand for indoor artificial
lighting and climatization. In this case, the authors
identified that total built density, verticality,
compactness, and the mean prospectus (ratio of the
canyon height to canyon width, H/W) had a major
impact on quantitative daylight.
Outside the tropical region, Reinhart (2014)
exposed the relation of daylight and the depth of a
space according to design guides from the USA, UK
and Germany. As a rule of thumb, the depth of a
daylit area of a sidelit space in these documents lies
between 1 to 2.5 times the dimension of the window
head height. The author used computer simulation
to examine this rule of thumb. One of the models
was a reference office room (3.6 x 8.2 x 2.8m,
WWR of 45%), positioned inside an urban canyon
of uniform height. This model was rotated in four
cardinal directions and simulated using annual
weather files of three cities (latitudes>33°N). A
linear decrease of the daylit area as a consequence
of the increase of the front obstruction was
observed.
Later, Saratsis (2015) proposed a simulation-based
framework for urban zoning rules from daylight.
The method was applied for different urban
typologies considering the city of New York
(40°43'N, U.S.A.). Focusing on the maximum
daylight performance potential of a neighborhood,
buildings were modelled with a window-to-wall
ratio of 100%, glazing with a visible transmittance
of 50%, and blinds with 50% cut-off value in case
of illuminances crossing 20.000lux. Blocks were
simulated using a tool named Urban Daylight,
pursuing the sDA(300/55%).
Likewise, Wagdy et al. (2015) investigated the
optimum window-to-wall-ratio (WWR) for
dwellings of informal settlements in Cairo (30°3'N,
Egypt, hot desert climate). They assessed
sDA(300/55%) of a south-oriented room of
dimensions 4.0x6.0x3.0 (wxdxh, m) and
reflectances 20/50/80 (floor, walls, ceiling, %),
under different H/W ratio (streets varying from 4-
8m wide, front buildings heighted up to nine floors)
Ambiente Construído, Porto Alegre, v. 17, n. 3, p. 87-102, jul./set. 2017.
Santos, I. G. dos; Auer, T.; Souza, R. V. G. de 92
using Rhinoceros/Daysim. Among other results,
they concluded that daylight reflected from the
ground had a lower impact in overall indoor
daylight.
It is important to point out that the typology of a
continuous urban canyon is being intensively used
in researches of daylight in the urban environment
(NASROLLAHI; SHOKRI, 2016), probably
because it can represent complex repeated urban
patterns in a simplified way (STRØMANN-
ANDERSEN; SATTRUP, 2011).
It is also remarkable that different researches
adopted a 3m wide room for daylight analysis
(CABÚS, 2005; REINHART, 2014;
ALBUQUERQUE; AMORIM, 2012). For instance,
the dimension of a test room of 3.0x9.0x2.7m
(wxdxh) was implemented for software validation
(AIZLEWOOD et al., 19962 apud CABÚS, 2005).
Studies of Radiance were developed using the
“typical [dimension] of a deep-plan office module”
of 3.0x9.0x2.7m (wxdxh) with a single window of
2.6m width and 1.5m height (MARDALJEVIC,
1999).
The dimension of 3m wide represents somehow a
worst case in the urban scene, where wider rooms
might be commonly found. In fact, in narrow rooms
the view of the sky at points distanced farther from
the façade is decreased in comparison to wider
rooms of same WWR. Thus, the sDA results would
be even better in other typologies with potentially
wider rooms, like residences.
After this brief review of researches in urban
daylight assessment, the following session presents
the main purpose of this study.
Objective
The main goal of this paper was to quantify and
understand the influence of parameters related to
urban planning strategies on indoor daylight in
predominant partly cloudy sky in the tropical
region, using a dynamic metric named sDA.
Furthermore, the study aimed to identify the
conditions within an urban context that are
sufficient for providing a minimum daylight
illuminance level to a reference room to allow the
execution of indoor daily multi-purpose activities
with less dependence on artificial lighting under
these sky conditions. Additionally, the relevance of
outdoor reflectance in obstructed sites were
discussed.
2AIZLEWOOD, M. et al. The Development of a Reference Data Set for Lighting Computer Programs. CIBSE - National Lighting Conference. Bath - UK: CIBSE, 1996.
Method
A parametric computer simulation of a reference
room in the city of Cuiabá was executed using
Grasshopper for Rhinoceros, with
Radiance/Daysim interfaced by Honeybee
(v.0.0.59) and Ladybug (v.0.0.62, jan-28-2016).
The room intended to represent a “worst case”
scenario: located in the ground floor of a building,
in a dense urban context. The parametric parameters
were building depth (related to the depth of the
reference room), solar orientation of facades, height
of front obstructions, and street width. The pursued
outputs were sDA(300,50%) ≥ 75%.
Selected case-study: Cuiabá and its weather files
Cuiabá (15°35'S, 56°05'O, Brazil) is an
intercontinental tropical city with a Savanna climate
with ca. 863.509 inhabitants, located at an altitude
of 151.34m. The reasons for selecting Cuiabá as a
case study were its considerable sky variations
throughout the year; its low latitude; the availability
of a reliable weather file; and the intention of the
municipality in increasing its density.
As stated by Alves et al. (2013), the sky cover
condition in the urban area of Cuiabá is influenced
by diverse factors, such as cloudiness and
atmospheric combustion products. Another
phenomenon is a typical characteristic of the
central-western Brazilian territory: outbreaks of fire
in the surrounding native vegetation. Therefore,
during the dry season, when sky should ideally be
clear, the particles diffused by this burning biomass,
reduce the incident solar radiation. The authors
observed the effect of this type of incident in Cuiabá
and reported that in 2005 the project Solar and Wind
Energy Resource Assessment (SWERA), which
mapped solar energy resources in the country using
a model of radiative transfer.
Lamberts et al. (2015) statistically compared
weather files for Cuiabá. The authors analysed two
available files, INMET and SWERA, in terms of
temperature and solar radiation, both prepared in
the TMY (Typical Meteorological Year) format.
SWERA project initiated in 2001 with the focus on
making reliable data of solar radiation and wind
available. The INMET file results of data measured
in official meteorological stations between 2000
and 2010. One of the most remarkable results of this
study by Lamberts et al. (2015) is that the
differences of horizontal diffuse radiation between
both the files are considerable. The report did not
Ambiente Construído, Porto Alegre, v. 17, n. 3, p. 87-102, jul./set. 2017.
Optimized indoor daylight for tropical dense urban environments 93
present any imprecision of both files, neither
suggested that one file should be preferred rather
than the other. However, they informed that before
the analysis it was necessary to fulfil many existing
data gaps in the INMET file, without detailing the
extension of this problem. In light of this
information, for the purposes of this study, the
SWERA weather file was chosen for the
simulations (named BRA_Cuiaba-
Marechal.Ron.833620_SWERA). It is important to
point out that in the TMY category the files ideally
result of long term measurement data: a minimum
of 30 years is recommended (U.S…., 1995). None
of these files seem in compliance with this
recommendation.
For a better understanding of the overall data and
annual sky conditions in this selected SWERA file,
it was analysed using the software
ClimateConsultant v6. The generated outputs
presented an annual average mean of sky cover
around 57%, varying between 29% and 80%. The
monthly lowest sky cover average is 30% in the dry
season, and the maximum of 81% in the wet season.
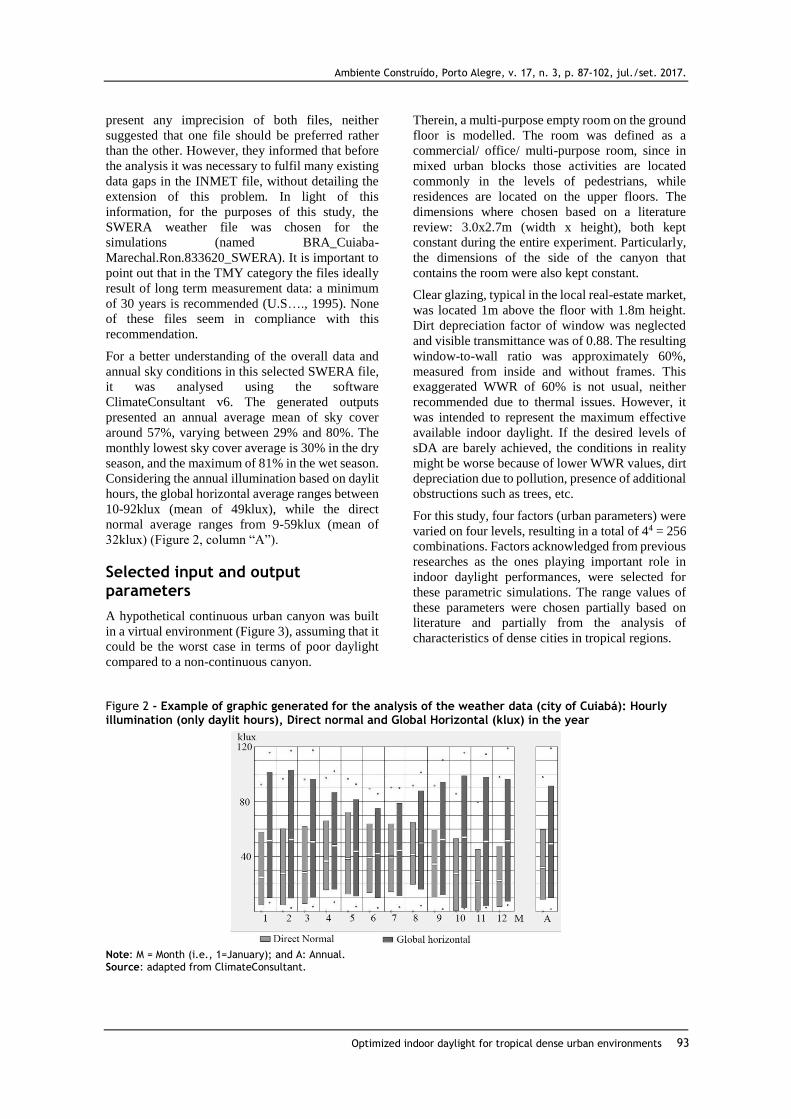
Considering the annual illumination based on daylit
hours, the global horizontal average ranges between
10-92klux (mean of 49klux), while the direct
normal average ranges from 9-59klux (mean of
32klux) (Figure 2, column “A”).
Selected input and output parameters
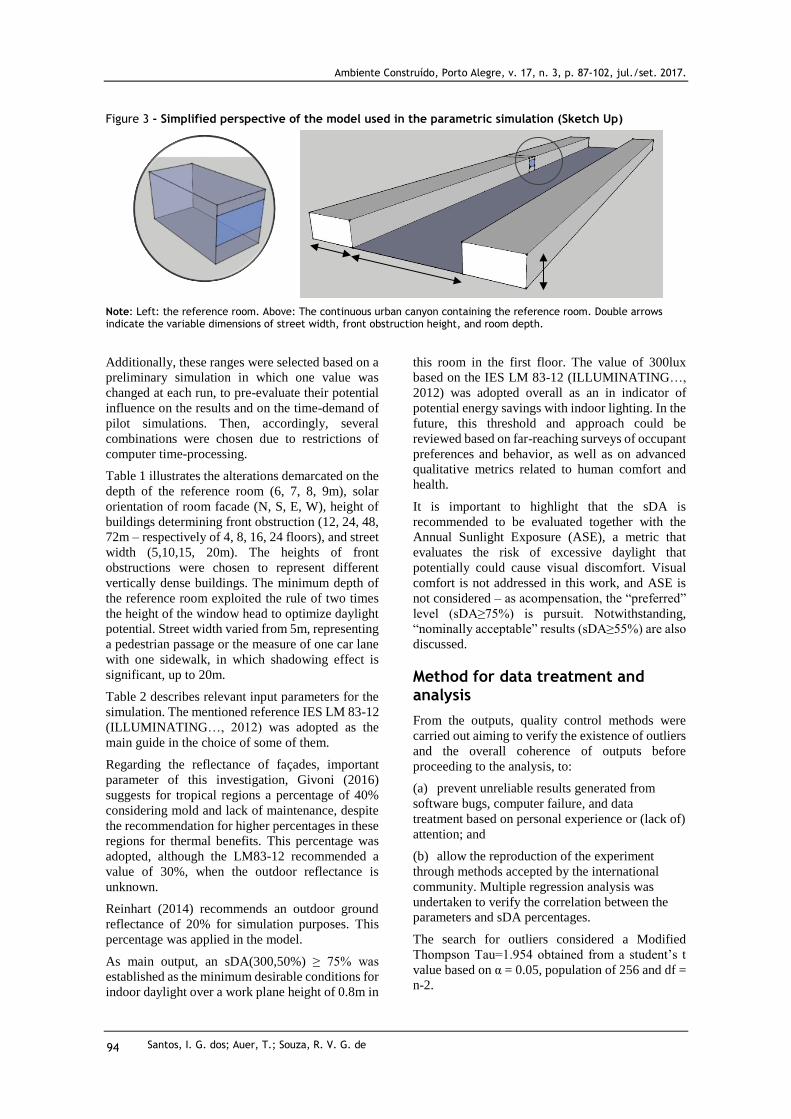
A hypothetical continuous urban canyon was built
in a virtual environment (Figure 3), assuming that it
could be the worst case in terms of poor daylight
compared to a non-continuous canyon.
Therein, a multi-purpose empty room on the ground
floor is modelled. The room was defined as a
commercial/ office/ multi-purpose room, since in
mixed urban blocks those activities are located
commonly in the levels of pedestrians, while
residences are located on the upper floors. The
dimensions where chosen based on a literature
review: 3.0x2.7m (width x height), both kept
constant during the entire experiment. Particularly,
the dimensions of the side of the canyon that
contains the room were also kept constant.
Clear glazing, typical in the local real-estate market,
was located 1m above the floor with 1.8m height.
Dirt depreciation factor of window was neglected
and visible transmittance was of 0.88. The resulting
window-to-wall ratio was approximately 60%,
measured from inside and without frames. This
exaggerated WWR of 60% is not usual, neither
recommended due to thermal issues. However, it
was intended to represent the maximum effective
available indoor daylight. If the desired levels of
sDA are barely achieved, the conditions in reality
might be worse because of lower WWR values, dirt
depreciation due to pollution, presence of additional
obstructions such as trees, etc.
For this study, four factors (urban parameters) were
varied on four levels, resulting in a total of 44 = 256
combinations. Factors acknowledged from previous
researches as the ones playing important role in
indoor daylight performances, were selected for
these parametric simulations. The range values of
these parameters were chosen partially based on
literature and partially from the analysis of
characteristics of dense cities in tropical regions.
Figure 2 - Example of graphic generated for the analysis of the weather data (city of Cuiabá): Hourly illumination (only daylit hours), Direct normal and Global Horizontal (klux) in the year
Note: M = Month (i.e., 1=January); and A: Annual. Source: adapted from ClimateConsultant.
Ambiente Construído, Porto Alegre, v. 17, n. 3, p. 87-102, jul./set. 2017.
Santos, I. G. dos; Auer, T.; Souza, R. V. G. de 94
Figure 3 - Simplified perspective of the model used in the parametric simulation (Sketch Up)
Note: Left: the reference room. Above: The continuous urban canyon containing the reference room. Double arrows indicate the variable dimensions of street width, front obstruction height, and room depth.
Additionally, these ranges were selected based on a
preliminary simulation in which one value was
changed at each run, to pre-evaluate their potential
influence on the results and on the time-demand of
pilot simulations. Then, accordingly, several
combinations were chosen due to restrictions of
computer time-processing.
Table 1 illustrates the alterations demarcated on the
depth of the reference room (6, 7, 8, 9m), solar
orientation of room facade (N, S, E, W), height of
buildings determining front obstruction (12, 24, 48,
72m – respectively of 4, 8, 16, 24 floors), and street
width (5,10,15, 20m). The heights of front
obstructions were chosen to represent different
vertically dense buildings. The minimum depth of
the reference room exploited the rule of two times
the height of the window head to optimize daylight
potential. Street width varied from 5m, representing
a pedestrian passage or the measure of one car lane
with one sidewalk, in which shadowing effect is
significant, up to 20m.
Table 2 describes relevant input parameters for the
simulation. The mentioned reference IES LM 83-12
(ILLUMINATING…, 2012) was adopted as the
main guide in the choice of some of them.
Regarding the reflectance of façades, important
parameter of this investigation, Givoni (2016)
suggests for tropical regions a percentage of 40%
considering mold and lack of maintenance, despite
the recommendation for higher percentages in these
regions for thermal benefits. This percentage was
adopted, although the LM83-12 recommended a
value of 30%, when the outdoor reflectance is
unknown.
Reinhart (2014) recommends an outdoor ground
reflectance of 20% for simulation purposes. This
percentage was applied in the model.
As main output, an sDA(300,50%) ≥ 75% was
established as the minimum desirable conditions for
indoor daylight over a work plane height of 0.8m in
this room in the first floor. The value of 300lux
based on the IES LM 83-12 (ILLUMINATING…,
2012) was adopted overall as an in indicator of
potential energy savings with indoor lighting. In the
future, this threshold and approach could be
reviewed based on far-reaching surveys of occupant
preferences and behavior, as well as on advanced
qualitative metrics related to human comfort and
health.
It is important to highlight that the sDA is
recommended to be evaluated together with the
Annual Sunlight Exposure (ASE), a metric that
evaluates the risk of excessive daylight that
potentially could cause visual discomfort. Visual
comfort is not addressed in this work, and ASE is
not considered – as acompensation, the “preferred”
level (sDA≥75%) is pursuit. Notwithstanding,
“nominally acceptable” results (sDA≥55%) are also
discussed.
Method for data treatment and analysis
From the outputs, quality control methods were
carried out aiming to verify the existence of outliers
and the overall coherence of outputs before
proceeding to the analysis, to:
(a) prevent unreliable results generated from
software bugs, computer failure, and data
treatment based on personal experience or (lack of)
attention; and
(b) allow the reproduction of the experiment
through methods accepted by the international
community. Multiple regression analysis was
undertaken to verify the correlation between the
parameters and sDA percentages.
The search for outliers considered a Modified
Thompson Tau=1.954 obtained from a student’s t
value based on α = 0.05, population of 256 and df =
n-2.
Ambiente Construído, Porto Alegre, v. 17, n. 3, p. 87-102, jul./set. 2017.
Optimized indoor daylight for tropical dense urban environments 95
Table 1 - Variation in input parameters of the 3-D model for the simulation
Parameter Variation (1st) (2nd) (3rd) (4th)
Depth of the reference room (m) (1st) 6 7 8 9
Height of front obstruction (m) (2nd) 12 24 48 72
Street width (m) (3rd) 5 10 15 20
Orientation of façade (o) (4th) 0 90 180 270
Total number of combinations= 44 = 256
Table 2 - Input parameters for the simulation
Parameter Value Parameter Value
Ambient bounces 6 Occupancy (local time) 8am to 6pm
Ambient division 4096 Illuminance Threshold (lux) ≥ 300
Quality 2 (High) Period of occupancy (%) ≥ 50
Ambient sampling 4096 Indoor floor area – pursued sDA (%) ≥ 75
Ambient accuracy 0.1 Reflectance of indoor floor (%) 20
Ambient resolution 128 Reflectance of indoor walls (%) 50
Specularity of materials 0 Reflectance of indoor ceiling (%) 70
Roughness of materials 0 Outdoor ground reflectance (%) 20
Then, a regression analysis was carried out in an
attempt to create a model to predict the value of
sDA from the known values of the variables which
were defined within the selected urban design
parameters, considering the studied conditions. The
hypotheses were established as follows:
H0: M1 = 0 (Null hypothesis: slope is zero,
meaning no correlation); and
H1: M1 ≠ 0 (Alternative hypothesis: slope is
different from zero in the population).
A multiple regression analysis was conducted in
Excel, considering a significance level of 5%, and it
generated one equation representing the behavior of
the model. The regression of each parameter
separately was performed to support the analysis;
nonetheless, they were not detailed here. Overall
results were analysed and discussed in the following
session.
Results and discussion
The sDA results obtained from variations in the
urban model using Grasshopper Daysim/Radiance
are presented below. No outliers were found among
the outputs; therefore, no datum resulting from the
simulation was excluded from the analysis.
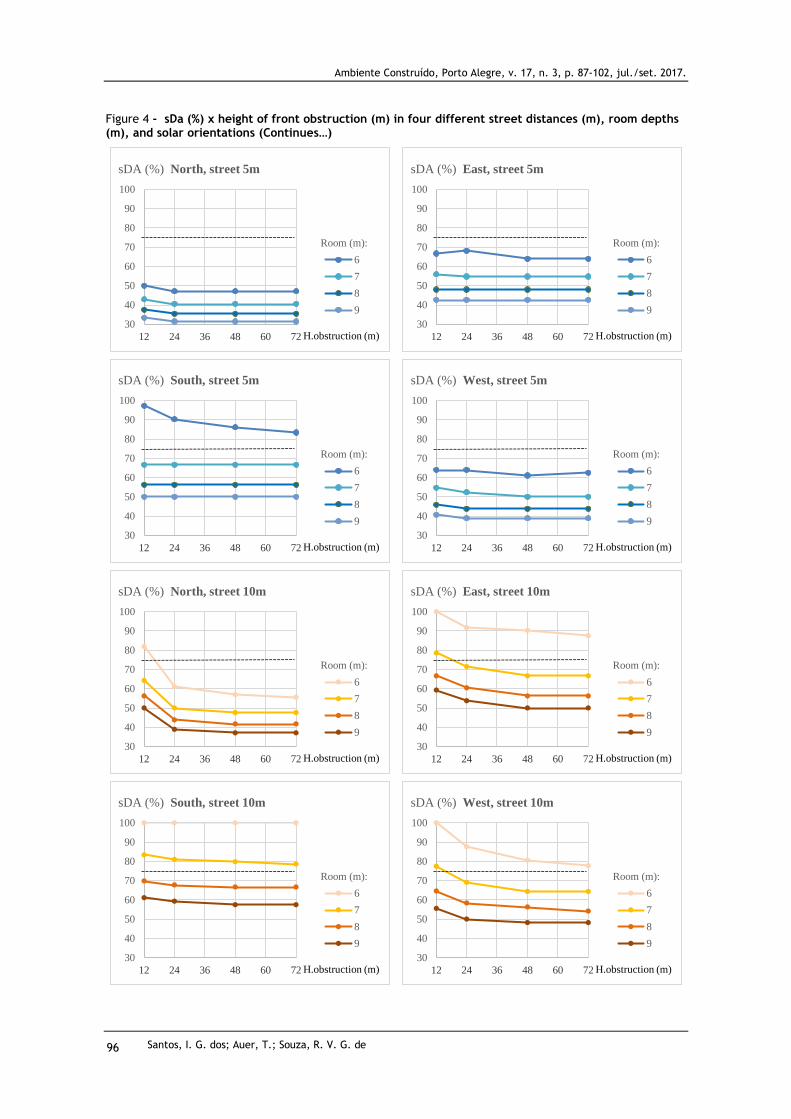
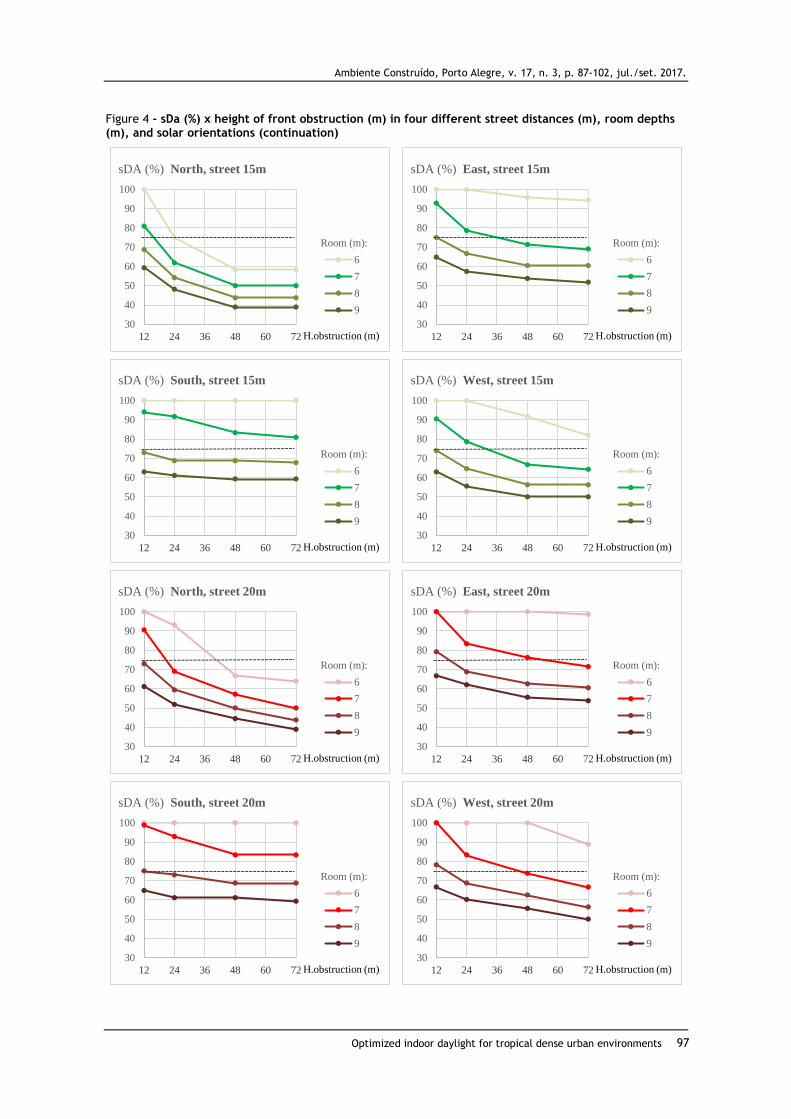
Figure 4 presents graphics of sDa values resulting
from variations in three factors: height of front
obstruction (m), street distance (m), and room depth
(m), for the North orientation. The “y” axis
(dependent variable) presents the results of sDA(%)
for each variation, meaning the percentage of floor
area of the room which exceeded 300lux during
50% of the occupied hours of the year (8am-18pm).
The dashed lines highlight the minimum values of
sDA required by LM 83-12 as “preferred” (75%,
which is the desired condition defined for this
research). The “x” axis (independent variable)
presents the heights of the buildings that compound
the front obstruction: from 12m (buildings with 4
floors) to 72m (24 floors). The results in this graphic
are grouped by color: tones of blue represent street
width of 5m, orange 10m, green 15m, and red 20m.
Each tone represents a depth of the room.
The main results of the statistical analysis for each
parameter are summarized in the Table 3.
The multiple regression analysis generated the
Equation 1:
sDA = 130.2 - 11.17*r + 1.45*s - 0.19*h + 0.038*o
Eq. 1
Where “r”, “s”, “h” and “o” represent respectively
the room depth, street width, height of obstruction
and facade orientation of the room.
Considering the general Equation 1 it is possible to
infer that an increase in street width influenced
positively in the sDA. Additionally, an increase in
the height of front obstruction and in the room depth
depreciates the sDA levels. Based on the p-
values<5%, there is a strong evidence that the slope
was not zero in the population; therefore, the null
hypothesis was rejected and it is possible to affirm
that there was a correlation between the four
parameters and the variation in sDA (95%
confident). These results match the ones by
previous studies conducted in other cities, and
therefore they indicate consistency in the
simulation.
Ambiente Construído, Porto Alegre, v. 17, n. 3, p. 87-102, jul./set. 2017.
Santos, I. G. dos; Auer, T.; Souza, R. V. G. de 96
Figure 4 - sDa (%) x height of front obstruction (m) in four different street distances (m), room depths (m), and solar orientations (Continues…)
30
40
50
60
70
80
90
100
12 24 36 48 60 72
sDA (%) North, street 5m
6
7
8
9
Room (m):
H.obstruction (m)30
40
50
60
70
80
90
100
12 24 36 48 60 72
sDA (%) East, street 5m
6
7
8
9
Room (m):
H.obstruction (m)
30
40
50
60
70
80
90
100
12 24 36 48 60 72
sDA (%) South, street 5m
6
7
8
9
Room (m):
H.obstruction (m)30
40
50
60
70
80
90
100
12 24 36 48 60 72
sDA (%) West, street 5m
6
7
8
9
Room (m):
H.obstruction (m)
30
40
50
60
70
80
90
100
12 24 36 48 60 72
sDA (%) North, street 10m
6
7
8
9
Room (m):
H.obstruction (m)30
40
50
60
70
80
90
100
12 24 36 48 60 72
sDA (%) East, street 10m
6
7
8
9
Room (m):
H.obstruction (m)
30
40
50
60
70
80
90
100
12 24 36 48 60 72
sDA (%) South, street 10m
6
7
8
9
Room (m):
H.obstruction (m)30
40
50
60
70
80
90
100
12 24 36 48 60 72
sDA (%) West, street 10m
6
7
8
9
Room (m):
H.obstruction (m)
Ambiente Construído, Porto Alegre, v. 17, n. 3, p. 87-102, jul./set. 2017.
Optimized indoor daylight for tropical dense urban environments 97
Figure 4 - sDa (%) x height of front obstruction (m) in four different street distances (m), room depths (m), and solar orientations (continuation)
30
40
50
60
70
80
90
100
12 24 36 48 60 72
sDA (%) North, street 15m
6
7
8
9
Room (m):
H.obstruction (m)30
40
50
60
70
80
90
100
12 24 36 48 60 72
sDA (%) East, street 15m
6
7
8
9
Room (m):
H.obstruction (m)
30
40
50
60
70
80
90
100
12 24 36 48 60 72
sDA (%) South, street 15m
6
7
8
9
Room (m):
H.obstruction (m)30
40
50
60
70
80
90
100
12 24 36 48 60 72
sDA (%) West, street 15m
6
7
8
9
Room (m):
H.obstruction (m)
30
40
50
60
70
80
90
100
12 24 36 48 60 72
sDA (%) North, street 20m
6
7
8
9
Room (m):
H.obstruction (m)30
40
50
60
70
80
90
100
12 24 36 48 60 72
sDA (%) East, street 20m
6
7
8
9
Room (m):
H.obstruction (m)
30
40
50
60
70
80
90
100
12 24 36 48 60 72
sDA (%) South, street 20m
6
7
8
9
Room (m):
H.obstruction (m)30
40
50
60
70
80
90
100
12 24 36 48 60 72
sDA (%) West, street 20m
6
7
8
9
Room (m):
H.obstruction (m)
Ambiente Construído, Porto Alegre, v. 17, n. 3, p. 87-102, jul./set. 2017.
Santos, I. G. dos; Auer, T.; Souza, R. V. G. de 98
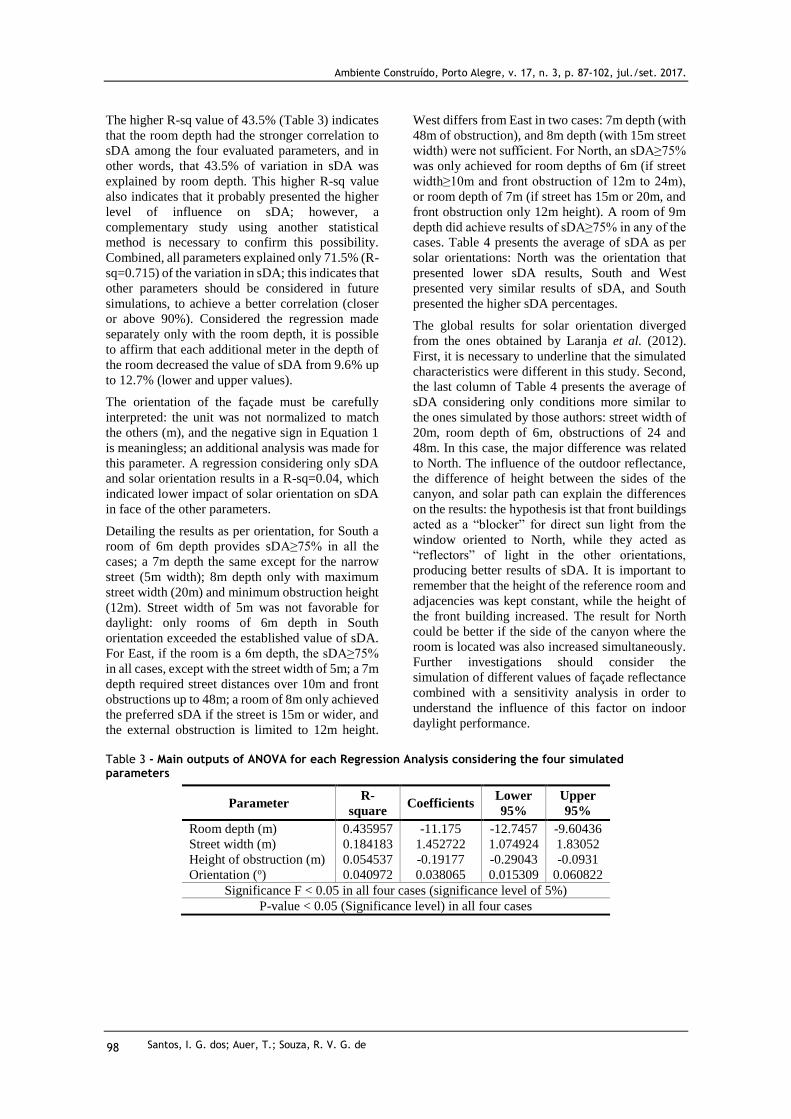
The higher R-sq value of 43.5% (Table 3) indicates
that the room depth had the stronger correlation to
sDA among the four evaluated parameters, and in
other words, that 43.5% of variation in sDA was
explained by room depth. This higher R-sq value
also indicates that it probably presented the higher
level of influence on sDA; however, a
complementary study using another statistical
method is necessary to confirm this possibility.
Combined, all parameters explained only 71.5% (R-
sq=0.715) of the variation in sDA; this indicates that
other parameters should be considered in future
simulations, to achieve a better correlation (closer
or above 90%). Considered the regression made
separately only with the room depth, it is possible
to affirm that each additional meter in the depth of
the room decreased the value of sDA from 9.6% up
to 12.7% (lower and upper values).
The orientation of the façade must be carefully
interpreted: the unit was not normalized to match
the others (m), and the negative sign in Equation 1
is meaningless; an additional analysis was made for
this parameter. A regression considering only sDA
and solar orientation results in a R-sq=0.04, which
indicated lower impact of solar orientation on sDA
in face of the other parameters.
Detailing the results as per orientation, for South a
room of 6m depth provides sDA≥75% in all the
cases; a 7m depth the same except for the narrow
street (5m width); 8m depth only with maximum
street width (20m) and minimum obstruction height
(12m). Street width of 5m was not favorable for
daylight: only rooms of 6m depth in South
orientation exceeded the established value of sDA.
For East, if the room is a 6m depth, the sDA≥75%
in all cases, except with the street width of 5m; a 7m
depth required street distances over 10m and front
obstructions up to 48m; a room of 8m only achieved
the preferred sDA if the street is 15m or wider, and
the external obstruction is limited to 12m height.
West differs from East in two cases: 7m depth (with
48m of obstruction), and 8m depth (with 15m street
width) were not sufficient. For North, an sDA≥75%
was only achieved for room depths of 6m (if street
width≥10m and front obstruction of 12m to 24m),
or room depth of 7m (if street has 15m or 20m, and
front obstruction only 12m height). A room of 9m
depth did achieve results of sDA≥75% in any of the
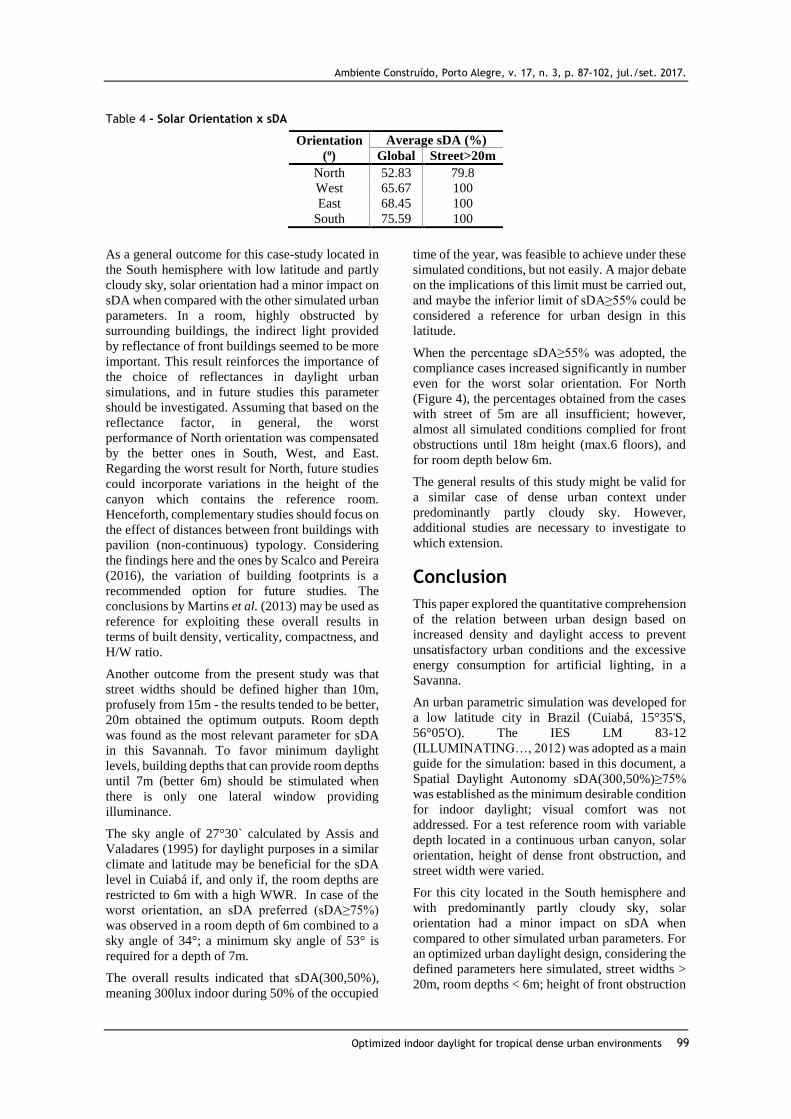
cases. Table 4 presents the average of sDA as per
solar orientations: North was the orientation that
presented lower sDA results, South and West
presented very similar results of sDA, and South
presented the higher sDA percentages.
The global results for solar orientation diverged
from the ones obtained by Laranja et al. (2012).
First, it is necessary to underline that the simulated
characteristics were different in this study. Second,
the last column of Table 4 presents the average of
sDA considering only conditions more similar to
the ones simulated by those authors: street width of
20m, room depth of 6m, obstructions of 24 and
48m. In this case, the major difference was related
to North. The influence of the outdoor reflectance,
the difference of height between the sides of the
canyon, and solar path can explain the differences
on the results: the hypothesis ist that front buildings
acted as a “blocker” for direct sun light from the
window oriented to North, while they acted as
“reflectors” of light in the other orientations,
producing better results of sDA. It is important to
remember that the height of the reference room and
adjacencies was kept constant, while the height of
the front building increased. The result for North
could be better if the side of the canyon where the
room is located was also increased simultaneously.
Further investigations should consider the
simulation of different values of façade reflectance
combined with a sensitivity analysis in order to
understand the influence of this factor on indoor
daylight performance.
Table 3 - Main outputs of ANOVA for each Regression Analysis considering the four simulated parameters
Parameter R-
square Coefficients
Lower
95%
Upper
95%
Room depth (m) 0.435957 -11.175 -12.7457 -9.60436
Street width (m) 0.184183 1.452722 1.074924 1.83052
Height of obstruction (m) 0.054537 -0.19177 -0.29043 -0.0931
Orientation (o) 0.040972 0.038065 0.015309 0.060822
Significance F < 0.05 in all four cases (significance level of 5%)
P-value < 0.05 (Significance level) in all four cases
Ambiente Construído, Porto Alegre, v. 17, n. 3, p. 87-102, jul./set. 2017.
Optimized indoor daylight for tropical dense urban environments 99
Table 4 - Solar Orientation x sDA
Orientation
(o)
Average sDA (%)
Global Street>20m
North 52.83 79.8
West 65.67 100
East 68.45 100
South 75.59 100
As a general outcome for this case-study located in
the South hemisphere with low latitude and partly
cloudy sky, solar orientation had a minor impact on
sDA when compared with the other simulated urban
parameters. In a room, highly obstructed by
surrounding buildings, the indirect light provided
by reflectance of front buildings seemed to be more
important. This result reinforces the importance of
the choice of reflectances in daylight urban
simulations, and in future studies this parameter
should be investigated. Assuming that based on the
reflectance factor, in general, the worst
performance of North orientation was compensated
by the better ones in South, West, and East.
Regarding the worst result for North, future studies
could incorporate variations in the height of the
canyon which contains the reference room.
Henceforth, complementary studies should focus on
the effect of distances between front buildings with
pavilion (non-continuous) typology. Considering
the findings here and the ones by Scalco and Pereira
(2016), the variation of building footprints is a
recommended option for future studies. The
conclusions by Martins et al. (2013) may be used as
reference for exploiting these overall results in
terms of built density, verticality, compactness, and
H/W ratio.
Another outcome from the present study was that
street widths should be defined higher than 10m,
profusely from 15m - the results tended to be better,
20m obtained the optimum outputs. Room depth
was found as the most relevant parameter for sDA
in this Savannah. To favor minimum daylight
levels, building depths that can provide room depths
until 7m (better 6m) should be stimulated when
there is only one lateral window providing
illuminance.
The sky angle of 27°30` calculated by Assis and
Valadares (1995) for daylight purposes in a similar
climate and latitude may be beneficial for the sDA
level in Cuiabá if, and only if, the room depths are
restricted to 6m with a high WWR. In case of the
worst orientation, an sDA preferred (sDA≥75%)
was observed in a room depth of 6m combined to a
sky angle of 34°; a minimum sky angle of 53° is
required for a depth of 7m.
The overall results indicated that sDA(300,50%),
meaning 300lux indoor during 50% of the occupied
time of the year, was feasible to achieve under these
simulated conditions, but not easily. A major debate
on the implications of this limit must be carried out,
and maybe the inferior limit of sDA≥55% could be
considered a reference for urban design in this
latitude.
When the percentage sDA≥55% was adopted, the
compliance cases increased significantly in number
even for the worst solar orientation. For North
(Figure 4), the percentages obtained from the cases
with street of 5m are all insufficient; however,
almost all simulated conditions complied for front
obstructions until 18m height (max.6 floors), and
for room depth below 6m.
The general results of this study might be valid for
a similar case of dense urban context under
predominantly partly cloudy sky. However,
additional studies are necessary to investigate to
which extension.
Conclusion
This paper explored the quantitative comprehension
of the relation between urban design based on
increased density and daylight access to prevent
unsatisfactory urban conditions and the excessive
energy consumption for artificial lighting, in a
Savanna.
An urban parametric simulation was developed for
a low latitude city in Brazil (Cuiabá, 15°35'S,
56°05'O). The IES LM 83-12
(ILLUMINATING…, 2012) was adopted as a main
guide for the simulation: based in this document, a
Spatial Daylight Autonomy sDA(300,50%)≥75%
was established as the minimum desirable condition
for indoor daylight; visual comfort was not
addressed. For a test reference room with variable
depth located in a continuous urban canyon, solar
orientation, height of dense front obstruction, and
street width were varied.
For this city located in the South hemisphere and
with predominantly partly cloudy sky, solar
orientation had a minor impact on sDA when
compared to other simulated urban parameters. For
an optimized urban daylight design, considering the
defined parameters here simulated, street widths >
20m, room depths < 6m; height of front obstruction
Ambiente Construído, Porto Alegre, v. 17, n. 3, p. 87-102, jul./set. 2017.
Santos, I. G. dos; Auer, T.; Souza, R. V. G. de 100
< 41m (13 floors) offers the optimum scenario. In
case of a room depth of 6m, a sky angle>34° already
provides the minimum conditions. Room depth was
found as the most relevant parameter for sDA in this
case. Taking into account the results as per
orientations, it is estimated that the differences of
height between the sides of the canyon combined to
outdoor reflectance were very significant aspects to
sDA levels. The general results of this study are
probably valid for similar cases; however,
additional investigations are needed to confirm this
and to which extension.
As an overall comment regarding the results,
regression analysis was useful for determining the
behavior and potential correlation between
parameters; however, a complementary statistical
method could add information regarding the most
important aspects. Further simulations of window to
wall ratio (WWR) should cover percentages lower
than the 60% adopted here, which are more
appropriate for the tropics and more representative
of the residential sector. The definition of the
threshold of 300lux and 75% was based on the
researches which supported the IES LM 83-12
(ILLUMINATING…, 2012) for latitudes above 37o
and developed for determined occupant activities,
since similar investigations on the preferences of
occupants regarding daylight in the tropics where
not found. The pertinent percentage defined as a
threshold for sDA must be supplementary discussed
and investigated, considering that it is the element
from which results would support to shape the local
urban design. Future research should also focus on
variable reflectance, as well as other urban
typologies. The comparison of results of sDA in
different sky conditions, latitudes, indoor and
outdoor configuration is also an opportunity for
investigations.
Finally, even though daylight is fundamental for
health, productivity, energy savings and livability
of cities, there are still several gaps in studies
dedicated to the effect of density. This paper aimed
to fill a part of the gap regarding urban daylight
design, but there still are several points missing that
call for a collective effort in further investigations,
especially within the tropics.
References
ALBUQUERQUE, M. S. C.; AMORIM, C. N. D.
Iluminação Natural: indicações de profundidade-
limite de ambientes para iluminação natural no
Regulamento Técnico da Qualidade do Nível de
Eficiência Energética de Edifícios Residenciais -
RTQ-R. Ambiente Construído, Porto Alegre, v.
12, n. 2, p. 37-57, abr./jun. 2012.
ALVES, M. C. et al. Effects of Sky Conditions
Measured by the Clearness Index on the
Estimation of Solar Radiation Using a Digital
Elevation Mode. Atmospheric and Climate
Sciences, v. 3, p. 618-626, 2013.
ASSIS, E. S.; VALADARES, V. M. Bases Para a
Determinação dos Recuos e Volumetria dos
Edifícios, Considerando a Insolação e Iluminação
Natural, na Revisão da Lei de Uso e Ocupação do
Solo de Belo Horizonte, MG. In: ENCONTRO
NACIONAL DE CONFORTO NO AMBIENTE
CONSTRUÍDO, 3., ENCONTRO LATINO-
AMERICANO DE CONFORTO NO AMBIENTE
CONSTRUÍDO, 1995, Gramado. Anais…
Gramado: ANTAC, 1995.
ASSOCIAÇÃO BRASILEIRA DE NORMAS
TÉCNICAS. NBR 5413: Iluminância de interiores.
Rio de Janeiro, 1992.
ASSOCIAÇÃO BRASILEIRA DE NORMAS
TÉCNICAS. ABNT ISO/CI E 89 95 -1:
iluminação de ambientes de trabalho: parte 1:
interior. Rio de Janeiro, 2013.
BHAVANI, R.; KHAN, M. Advanced Lighting
Simulation Tools for Daylighting Purpose:
powerful features and related issues. Trends in
Applied Sciences Research, v. 6, n. 4, p. 345–63,
2011.
CABÚS, R. C. Validação do Programa TropLux.
In: ENCONTRO NACIONAL DE CONFORTO
NO AMBIENTE CONSTRUÍDO, 8., Maceió,
2005. Anais... Maceió, 2005.
CARLUCCI, S. et al. A Review of Indices for
Assessing Visual Comfort With a View to Their
Use in Optimization Processes to Support Building
Integrated Design. Renewable and sustainable
energy reviews, v. 47, p. 1016-1033, 2015.
CRAWLEY, D. B. Which Weather Data Should
You Use for Energy Simulations of Commercial
Buildings? ASHRAE Transactions, Atlanta, v.
104, p. 498-515, 1998.
DIAS, A. F. et al. Componentes de Controle de
Luz Natural em Salas de Aula e seu Desempenho
Conforme a Orientação Solar do Edifício. In:
ENCONTRO LATINO-AMERICANO, 6.;
ENCONTRO NACIONAL SOBRE CONFORTO
NO AMBIENTE CONSTRUÍDO, 10., Natal,
2009. Anais... Natal, 2009.
GIVONI, B. Climate Considerations in Building
and Urban Design. New York: John Wiley &
Sons, 2016.
GREEN BUILDING COUNCIL. LEED V4 for
Building Design and Construction. Washington,
DC: US Green Building Council, 2014.
Ambiente Construído, Porto Alegre, v. 17, n. 3, p. 87-102, jul./set. 2017.
Optimized indoor daylight for tropical dense urban environments 101
ILLUMINATING ENGINEERING SOCIETY OF
NORTH AMERICA. IES LM 83-12: IES Spatial
Daylight Autonomy (sDA) and Annual Sunlight
Exposure (ASE). New York, 2012.
INTERNATIONAL BUILDING
PERFORMANCE SIMULATION
ASSOCIATION. Weather Data for Building
Performance Simulation. Session 3. Organizer:
Rajan Rawal, presenters: Charles Barnaby, Drury
Crawley. Online workshop: 06 Oct. 2016.
INTERNATIONAL ENERGY AGENCY. Energy
Efficiency: Lighting, 2016
KOTTEK, M. et al. World Map of the Köppen-
Geiger Climate Classification Updated.
Meteorologische Zeitschrift, v. 15, n. 3, p. 259-
263, 2006.
LAMBERTS, R. et al. Análise de Arquivos
Climáticos Para a Simulação do Desempenho
Energético de Edificações. Florianópolis:
Laboratório de Eficiência Energética em
Edificações, 2015.
LARANJA, A. et al. Interferência da Orientação
das Vias na Disponibilidade de Iluminação Natural
do Ambiente Interno. In: ENCONTRO
NACIONAL DE TECNOLOGIA NO
AMBIENTE CONSTRUÍDO, 14., Juiz de Fora,
2012. Anais... Juiz de Fora, 2012.
MARDALJEVIC, J. et al. Daylighting Metrics for
Residential Buildings. In: COMMISSION
INTERNATIONALE DE L’ÉCLAIRAGE, 27.,
Sun City, 2011. Proceedings… Sun City, 2011.
MARDALJEVIC, J. Daylight Simulation:
validation, sky models and daylight coefficients.
Montfort, 1999. Thesis (PhD) - Institute of Energy
and Sustainable Development, De Montfort
University, Montfort, 1999.
MARTINS, T. et al. Evaluation of the Impact of
Urban Morphology on the Estimated Energy
Demand of Buildings: a case study in Maceió,
Brazil. Ambiente Construído, v.13, n. 4, p. 213-
233, out./dez. 2013.
NASROLLAHI, N.; SHOKRI, E. Daylight
Illuminance in Urban Environments for Visual
Comfort and Energy Performance. Renewable
and Sustainable Energy Reviews, v. 66, p. 861-
874, 2016.
NG, E. A Simplified Daylighting Design Tool for
High-Density Urban Residential Buildings.
Transactions of the Illuminating Engineering
Society, v. 33, n. 4, p. 259-269, dec. 2001.
PAULE, B.; KAEMPF, Jérôme H. Daylighting: an
approach from urban to room scale. In:
BECKERS, B.; PICO, T.; JIMENEZ, S. (Eds.).
INTERNATIONAL CONFERENCE ON URBAN
PHYSICS, Quito, 2016. Proceedings… Quito,
2016.
PEREZ, R. et al. Modeling Daylight Availability
and Irradiance Components from Direct and
Global Irradiance. Solar Energy, v.44, n. 5, p.
271-289, 1990.
REINHART, C. F. Tutorial on the Use of
Daysim Simulations For Sustainable Design.
Ottawa: National Research Council Canada, 2006.
REINHART, C.; LOVERSO, V. A Rules of
Thumb-Based Design Sequence for Diffuse
Daylight. Lighting Research & Technology, v.
42, n. 1, p. 7-31, Jan. 2010.
REINHART, C. Daylighting Handbook I:
fundamentals, designing with the sun. 2014.
RORIZ, M. Arquivos Climáticos de Municípios
Brasileiros. São Carlos, 2012. Relatório de
Pesquisa.
SARATSIS, E. Daylit Density: a simulation-based
framework towards performance-aware zoning and
real estate development. Thesis - Massachusetts
Institute of Technology, Department of
Architecture, 2015.
SCALCO, V. A.; PEREIRA, F. O. R. Método Para
a Avaliação do Impacto de Edificações no Acesso
à Iluminação Natural em Vizinhanças Urbanas
Aplicado em Cenários Virtuais. Ambiente
Cosntruído, Porto Alegre, v. 16, n. 2, p. 169-187,
abr./jun. 2016.
STRØMANN-ANDERSEN, J. B.; SATTRUP, P.
A. The Urban Canyon and Building Energy Use:
urban density versus daylight and passive solar
gains. Energy and Buildings, v. 43, n. 8, p. 2011-
2020, 2011.
TSANGRASSOULIS, A. et al. A Method For The
Estimation Of Illuminances On Surfaces Of Urban
Canyons With Balconies In Sunlit Areas.
International Journal of Lighting Research and
Technology, v. 31, n. 1, p. 5-12, mar. 1999.
UNITED NATIONS. Department of Economic
and Social Affairs, Population Division. World
Urbanization Prospects: The 2014 Revision.
Highlights (ST/ESA/SER.A/352). 2014.
U.S. NATIONAL RENEWABLE ENERGY
LABORATORY. Renewable Resource Data
Center. User's Manual for TMY2s- Typical
Meteorological Years. APPENDIX A: Procedures
for Developing TMY2s, 1995.
Ambiente Construído, Porto Alegre, v. 17, n. 3, p. 87-102, jul./set. 2017.
Santos, I. G. dos; Auer, T.; Souza, R. V. G. de 102
WAGDY, A. et al. Daylighting Optimization for
Informal Settlements in Cairo, Egypt. In:
INTERNATIONAL BUILDING
PERFORMANCE SIMULATION
ASSOCIATION, 2015. Proceedings… 2015.
Aknowledgements
The authors acknowledge the Brazilian National
Council for Scientific and Technological
Development - CNPq for the financial support for
one of the authors under the “Science without
Borders” programme; Technische Universität
München for the infrastructure; Transsolar
Energietechnik GmbH in the person of Dietmar
Geiselmann for the evaluation of preliminary
results of the simulation; Ata Chokhachian, Mark
Sen Dong, Boris Plotnikov for support in the use of
the software Grasshopper; Prof. Dr. Rodrigo
Cardoso from CEFET-MG for the support in
Multivariate Analysis and Statistics. Bashar Dwaik
for image treatment. Gaurie Lakhanpal for the
inicial proofreading in English language.
Iara Gonçalves dos Santos Chair of Building Technology and Climate Responsive Design, Department of Architecture | Technical University of Munich | Arcisstrasse 21 | Munich – Germany | 80333 | Tel.: +(49) 89 289-22475 | E-mail: [email protected]
Thomas Auer Chair of Building Technology and Climate Responsive Design, Department of Architecture | Technical University of Munich | E-mail: [email protected]
Roberta Vieira Gonçalves de Souza Departamento de Tecnologia da Arquitetura e do Urbanismo, Escola de Arquitetura | Universidade Federal de Minas Gerais | Rua Paraíba, 697, Sala 124, Funcionários | Belo Horizonte - MG – Brasil | CEP 30130-140 | Tel.: (31) 3409-8872 | E-mail: [email protected]
Revista Ambiente Construído Associação Nacional de Tecnologia do Ambiente Construído
Av. Osvaldo Aranha, 99 - 3º andar, Centro
Porto Alegre – RS - Brasil
CEP 90035-190
Telefone: +55 (51) 3308-4084
Fax: +55 (51) 3308-4054 www.seer.ufrgs.br/ambienteconstruido
E-mail: [email protected]