Embed Size (px)
Citation preview
Oral Health in Oregon’s CCOs
A metrics report March 2017
Table of contentsExecutive summary ………………………………………………………………………………………… 3
About this report …………………………………………………………………………………………….. 4
Provider distribution ……………………………………………………………………………………….. 5
All dentists: FTE dentists per 1,000 people ……………………………………………………… 6
Percentage of OHP members receiving any dental service ……………………………..…. 6
Utilization: Quality of services …………………………………………………………………………. 7
Any preventive service (adults) ………………………………………………………………………. 8
Any preventive service (children) ……………………………………………………………………. 9
Any dental service (adults) ……………………………………………………………………………. 10
Any dental service by service type (adults) …………………………………………………. 11
Any dental service (children) …………………………………………………………………………. 12
Any dental service by service type (children) ………………………………………………. 13
Topical fluoride varnish ………………………………………………………………………………… 14
Patient experience ………………………………………………………………………………………….. 15
Had a regular dentist (CAHPS)............................................................................................. 16
Access to emergency dental care (CAHPS) …………………………………….……….…… 17
Care coordination …………………………………………………………………………………………… 18
Follow-up after emergency department visits for non-traumatic dental reasons …… 19
Oral health evaluation for patients with periodontitis ……………………………………….. 20
Oral health integration ……………………………………………………………………………………. 21
Dental care for adults with diabetes ………………………………………………………………. 22
Oral health assessments in primary care ………………………………………………………… 23
Appendix A: Stakeholder groups……. ………………………………………………………………………….. 25
Appendix B: Technical specifications ………………………………………………………………………….. 26
Appendix C: MAC Oral Health Workgroup measure dashboard ………….…………….………….. 31
March 2017 Oregon Health Authority Health Policy & Analytics
2
Executive summary A growing body of evidence shows that oral health is critical to overall health. Research suggests that gum
disease and other oral health conditions are associated with heart disease, diabetes, low birth weight and
certain types of cancers. Poor oral health also contributes to missed school and work days, and can have a
negative impact on overall well-being. In short, the mouth is connected to the body.
In spite of this connection, historically oral health care has been delivered separately from medical care,
and too often the two systems don’t communicate well. One of the key goals of Oregon’s coordinated
care model is to integrate physical, oral and behavioral health care to treat the whole person.*
This report provides the first in-depth look at oral health care data in the context of Oregon’s health
system transformation, including the launch of the coordinated care organizations (CCOs) and expansion
of its Medicaid program, Oregon Health Plan (OHP), through the Affordable Care Act. Individuals with low
income are disproportionally likely to experience poor oral health, and people of color can face even
worse health outcomes. Recognizing the importance of oral health across the lifespan, Oregon is one of
only 13 states that offers comprehensive dental benefits to all adults with Medicaid, as well as children.†
In addition to being the first report of oral health services in OHP CCOs, much of the data in this report
are being produced for the first time. Some data used preliminary specifications, courtesy of the national
Dental Quality Alliance (DQA).‡ Key trends in this report include:
• Certain counties in Oregon have fewer dentists compared with the number of residents they serve, and only about 2 of every 5 dentists report seeing Medicaid patients (41.5%). This could pose a challenge for members trying to access services.
• Adult CCO members receive oral health services at lower rates than children. Only about 1 in 3 adults receive dental services in a given year, compared with a little more than half of children. Adults are also less likely to report having a regular dentist (57% of adults compared to 79% of children).
• Many members do not receive preventive dental services, like regular cleanings, fluoride treatments, and dental sealants. Only 1 in 5 adults and just over half of children (50.1%) had a preventive service between July 2015 and June 2016. This is important, because dental diseases are largely preventable.
• When stratified by race/ethnicity, the data show variation between groups. Members who identify as Hawaiian/Pacific Islander consistently receive services at lower rates than other members. Members identifying as Asian American generally have higher rates of utilization and follow-up.
This report will be shared with key stakeholder groups to inform interpretation and use of the data. These include the Medicaid Advisory Committee, the CCO Quality and Health Outcomes Committee, and the Metrics and Scoring Committee. We hope these preliminary data will help CCOs and other stakeholders continue to integrate oral health and improve care for members.
* In 2014, CCOs began managing dental benefits for their members, mainly by contracting with existing dental plans called dentalcare organizations (DCOs). CCOs are working on improving oral health at the local level, and about half of CCOs have included oralhealth in their Transformation Plans.
† States are required to offer dental benefits to children on Medicaid, but adult dental benefits are optional.
‡ The Dental Quality Alliance is an organization of major stakeholders in oral health care delivery, which develops performance measures for oral health care.
March 2017 Oregon Health Authority Health Policy & Analytics
3
About this report There are 13 measures in this report, including quality measures (e.g., percentage of children receiving topical fluoride varnish), provider distribution and patient experience with OHP. The measures in this report were included based on recommendations from three stakeholder groups: the Oral Health Workgroup of the Medicaid Advisory Committee, the Dental Metrics Workgroup of the Metrics & Scoring Committee, and the CCO Oregon Dental Workgroup (see Appendix A).
Data in this report are specific to members enrolled in CCOs, consistent with other CCO reporting such as the semiannual performance metrics reports. OHA is exploring options to report similar oral health data for the fee-for-service (FFS) population. OHA is also considering capacity to report additional oral health data, including more measures recommended by the Medicaid Advisory Committee, as new data become available. As recommended by stakeholders, measures are stratified, where possible, to assess potential disparities, including by race/ethnicity and age. OHA is exploring additional stratification by disability in future reports.
How to read this report
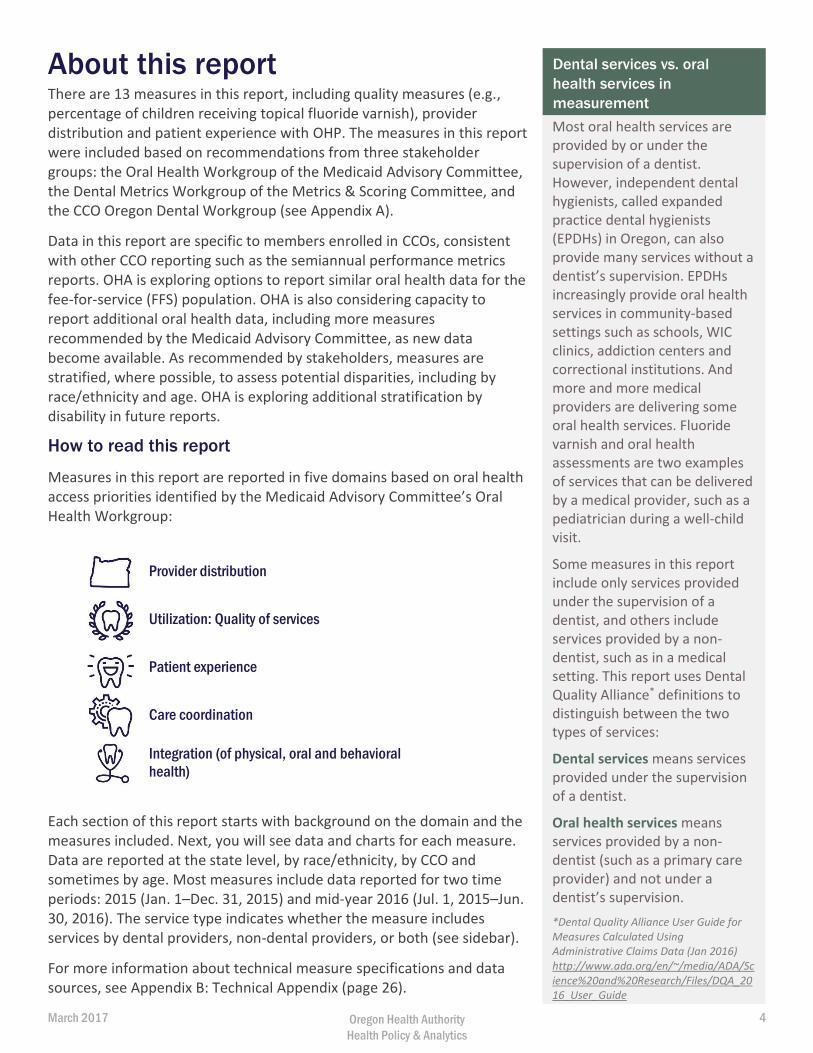
Measures in this report are reported in five domains based on oral health access priorities identified by the Medicaid Advisory Committee’s Oral Health Workgroup:
Provider distribution
Utilization: Quality of services
Patient experience
Care coordination
Integration (of physical, oral and behavioral
health)
Each section of this report starts with background on the domain and the measures included. Next, you will see data and charts for each measure. Data are reported at the state level, by race/ethnicity, by CCO and sometimes by age. Most measures include data reported for two time periods: 2015 (Jan. 1–Dec. 31, 2015) and mid-year 2016 (Jul. 1, 2015–Jun. 30, 2016). The service type indicates whether the measure includes services by dental providers, non-dental providers, or both (see sidebar).
For more information about technical measure specifications and data sources, see Appendix B: Technical Appendix (page 26).
Most oral health services are provided by or under the supervision of a dentist. However, independent dental hygienists, called expanded practice dental hygienists (EPDHs) in Oregon, can also provide many services without a dentist’s supervision. EPDHs increasingly provide oral health services in community-based settings such as schools, WIC clinics, addiction centers and correctional institutions. And more and more medical providers are delivering some oral health services. Fluoride varnish and oral health assessments are two examples of services that can be delivered by a medical provider, such as a pediatrician during a well-child visit.
Some measures in this report include only services provided under the supervision of a dentist, and others include services provided by a non-dentist, such as in a medical setting. This report uses Dental Quality Alliance* definitions to distinguish between the two types of services:
Dental services means services provided under the supervision of a dentist.
Oral health services means services provided by a non-dentist (such as a primary care provider) and not under a dentist’s supervision.
*Dental Quality Alliance User Guide forMeasures Calculated UsingAdministrative Claims Data (Jan 2016)http://www.ada.org/en/~/media/ADA/Science%20and%20Research/Files/DQA_2016_User_Guide
Dental services vs. oral
health services in
measurement
March 2017 Oregon Health Authority Health Policy & Analytics
4
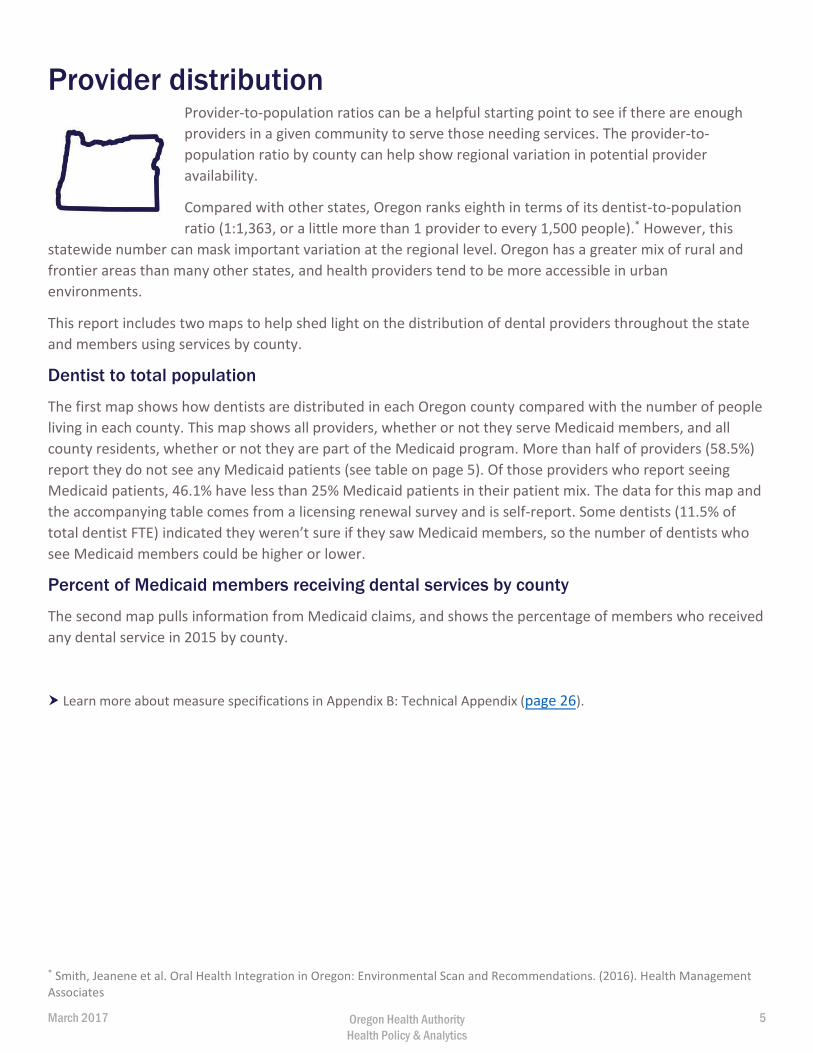
Provider distribution Provider-to-population ratios can be a helpful starting point to see if there are enough
providers in a given community to serve those needing services. The provider-to-
population ratio by county can help show regional variation in potential provider
availability.
Compared with other states, Oregon ranks eighth in terms of its dentist-to-population
ratio (1:1,363, or a little more than 1 provider to every 1,500 people).* However, this
statewide number can mask important variation at the regional level. Oregon has a greater mix of rural and
frontier areas than many other states, and health providers tend to be more accessible in urban
environments.
This report includes two maps to help shed light on the distribution of dental providers throughout the state
and members using services by county.
Dentist to total population
The first map shows how dentists are distributed in each Oregon county compared with the number of people
living in each county. This map shows all providers, whether or not they serve Medicaid members, and all
county residents, whether or not they are part of the Medicaid program. More than half of providers (58.5%)
report they do not see any Medicaid patients (see table on page 5). Of those providers who report seeing
Medicaid patients, 46.1% have less than 25% Medicaid patients in their patient mix. The data for this map and
the accompanying table comes from a licensing renewal survey and is self-report. Some dentists (11.5% of
total dentist FTE) indicated they weren’t sure if they saw Medicaid members, so the number of dentists who
see Medicaid members could be higher or lower.
Percent of Medicaid members receiving dental services by county
The second map pulls information from Medicaid claims, and shows the percentage of members who received
any dental service in 2015 by county.
Learn more about measure specifications in Appendix B: Technical Appendix (page 26).
* Smith, Jeanene et al. Oral Health Integration in Oregon: Environmental Scan and Recommendations. (2016). Health ManagementAssociates
March 2017 Oregon Health Authority Health Policy & Analytics
5
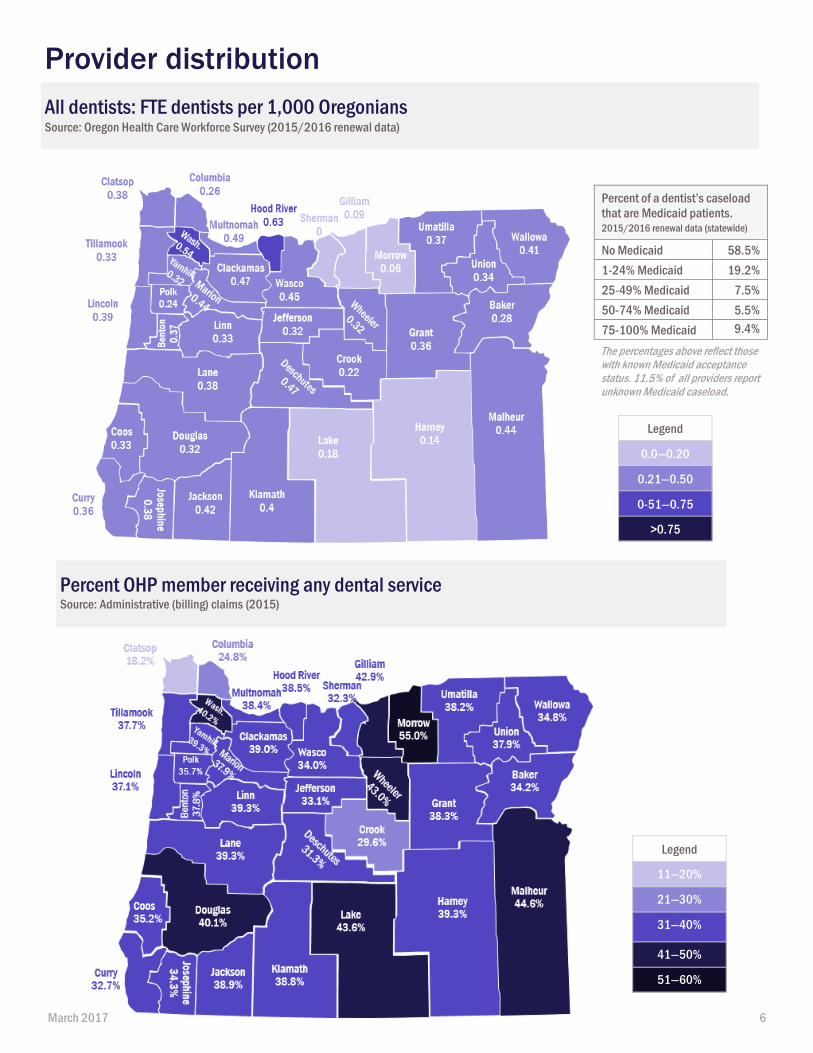
All dentists: FTE dentists per 1,000 Oregonians Source: Oregon Health Care Workforce Survey (2015/2016 renewal data)
Provider distribution
Percent OHP member receiving any dental service Source: Administrative (billing) claims (2015)
Legend
11—20%
21—30%
31—40%
41—50%
51—60%
Legend
0.0—0.20
0.21—0.50
0-51—0.75
>0.75
Percent of a dentist’s caseload
that are Medicaid patients. 2015/2016 renewal data (statewide)
No Medicaid 58.5%
1-24% Medicaid 19.2%
25-49% Medicaid 7.5%
50-74% Medicaid 5.5%
75-100% Medicaid 9.4%
The percentages above reflect those with known Medicaid acceptance status. 11.5% of all providers report unknown Medicaid caseload.
March 2017 6
Utilization: Quality of services A commonly used indicator of whether members have access to services is the proportion of members receiving services, also called utilization. Medicaid members typically receive services at lower rates than those with private or employer-based insurance. Just over half of Oregon’s adult Medicaid population (51.7%) reported having a dental visit in 2014,* compared with 67% of the general adult population in Oregon.†
This report includes two measures of broad types of services received, preventive and dental services received during the year (both reported by adults and children). It also includes one measure of specific services received, topical fluoride applications for children. For recent data on dental sealants on permanent molars for children 6-14, see the CCO Metrics Performance Report: https://www.oregon.gov/oha/Metrics/Pages/HST-Reports.aspx.
CCO members receiving preventive dental services
Preventive dental services include checkups, cleanings, fluoride and other services that help keep people healthy and catch early signs of disease. Regular preventive dental visits are important for both children and adults, as oral diseases are common and largely preventable. In fact, dental caries (tooth decay) is the most common chronic disease for children aged 6 through 11 years and 12 through 19 years in the United States.‡
CCO members receiving any dental services
The any dental service measure shows the proportion of members who saw a dentist during the year for any reason, whether a preventive service (such as cleanings), diagnostic service or treatment service (such as fillings, surgeries and other treatment).
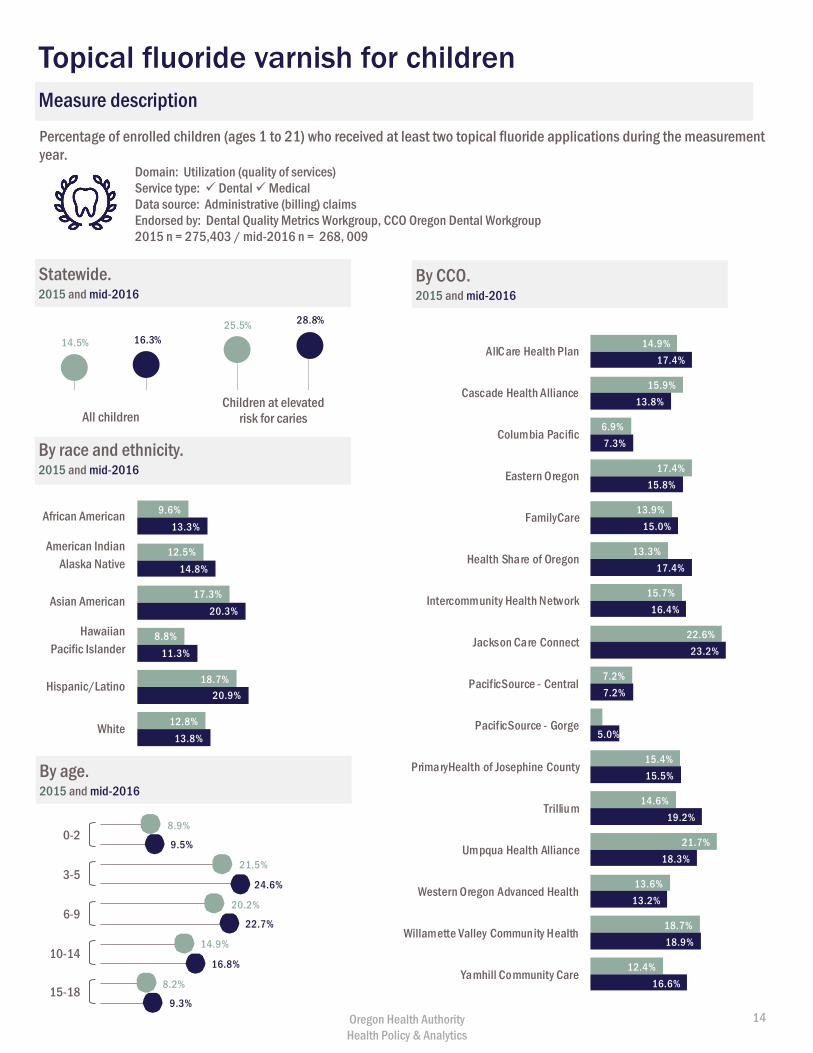
Topical fluoride varnish for children
Professional topical fluoride treatments help prevent dental caries (tooth decay). The American Academy of Pediatric Dentistry recommends children at risk of tooth decay receive topical fluoride every three to six months,§ and the U.S. Preventive Services Task Force recommends primary care clinicians apply fluoride varnish on children from primary tooth eruption to five years.** OHP reimburses topical fluoride varnish applications in dental and medical settings, up to age 19.
Learn more about measure specifications in Appendix B: Technical Appendix (page 26).
* 2014 Medicaid Behavioral Risk Factor Surveillance System (MBRFF) Survey: Report of Results. Available athttps://www.oregon.gov/oha/analytics/MBRFFS%20Docs/2014%20MBRFSS%20Report.pdf† Oregon Oral Health Surveillance System 2002-2015. Available at:https://public.health.oregon.gov/PreventionWellness/oralhealth/Documents/OralHealthSurveillanceReport2016.pdf‡ https://www.cdc.gov/healthywater/hygiene/disease/dental_caries.html§ http://www.aapd.org/media/policies_guidelines/g_periodicity.pdf** https://www.uspreventiveservicestaskforce.org/Page/Document/UpdateSummaryFinal/dental-caries-in-children-from-birth-through-age-5-years-screening
March 2017 Oregon Health Authority Health Policy & Analytics
7
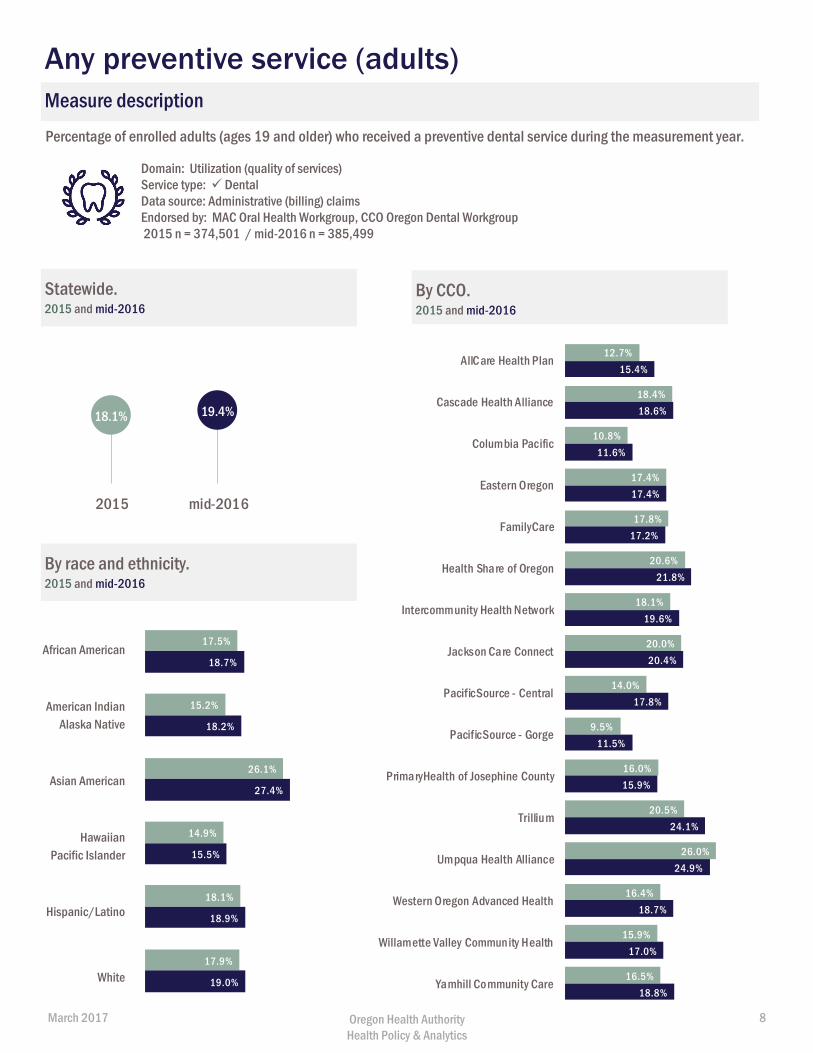
Percentage of enrolled adults (ages 19 and older) who received a preventive dental service during the measurement year.
Domain: Utilization (quality of services) Service type: DentalData source: Administrative (billing) claims Endorsed by: MAC Oral Health Workgroup, CCO Oregon Dental Workgroup 2015 n = 374,501 / mid-2016 n = 385,499
Statewide. 2015 and mid-2016
By CCO. 2015 and mid-2016
By race and ethnicity. 2015 and mid-2016
Measure description
African American
American Indian Alaska Native
Asian American
Hawaiian Pacific Islander
Hispanic/Latino
White
Any preventive service (adults)
12.7%
18.4%
10.8%
17.4%
17.8%
20.6%
18.1%
20.0%
14.0%
9.5%
16.0%
20.5%
26.0%
16.4%
15.9%
16.5%
15.4%
18.6%
11.6%
17.4%
17.2%
21.8%
19.6%
20.4%
17.8%
11.5%
15.9%
24.1%
24.9%
18.7%
17.0%
18.8%
AllCare Health Plan
Cascade Health Alliance
Columbia Pacific
Eastern Oregon
FamilyCare
Health Share of Oregon
Intercommunity Health Network
Jackson Care Connect
PacificSource - Central
PacificSource - Gorge
PrimaryHealth of Josephine County
Trillium
Umpqua Health Alliance
Western Oregon Advanced Health
Willamette Valley Community Health
Yamhill Community Care
18.1% 19.4%
2015 mid-2016
17.5%
15.2%
26.1%
14.9%
18.1%
17.9%
18.7%
18.2%
27.4%
15.5%
18.9%
19.0%
March 2017 Oregon Health Authority Health Policy & Analytics
8
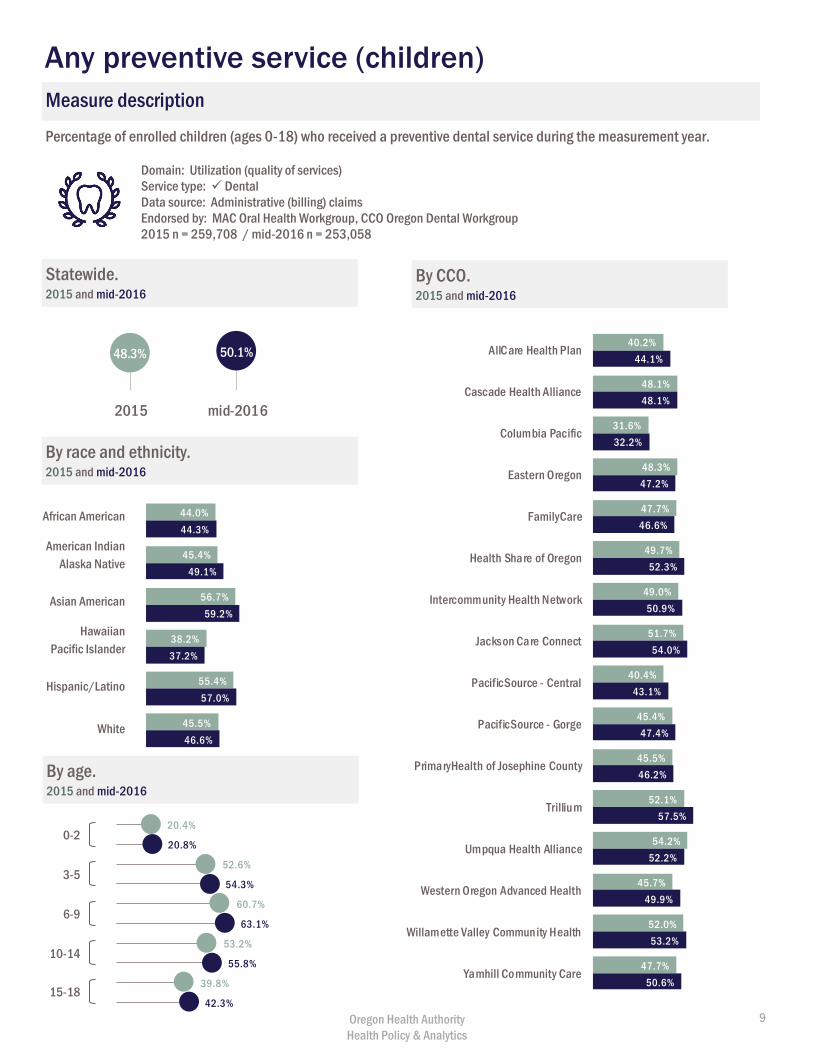
Percentage of enrolled children (ages 0-18) who received a preventive dental service during the measurement year.
Domain: Utilization (quality of services)Service type: DentalData source: Administrative (billing) claimsEndorsed by: MAC Oral Health Workgroup, CCO Oregon Dental Workgroup2015 n = 259,708 / mid-2016 n = 253,058
Statewide.2015 and mid-2016
By CCO.2015 and mid-2016
By race and ethnicity.2015 and mid-2016
44.0%
45.4%
56.7%
38.2%
55.4%
45.5%
44.3%
49.1%
59.2%
37.2%
57.0%
46.6%
By age.2015 and mid-2016
African American
American Indian Alaska Native
Asian American
Hawaiian Pacific Islander
Hispanic/Latino
White
0-2
3-5
6-9
10-14
15-18
Any preventive service (children)
Measure description
48.3% 50.1%
2015 mid-2016
40.2%
48.1%
31.6%
48.3%
47.7%
49.7%
49.0%
51.7%
40.4%
45.4%
45.5%
52.1%
54.2%
45.7%
52.0%
47.7%
44.1%
48.1%
32.2%
47.2%
46.6%
52.3%
50.9%
54.0%
43.1%
47.4%
46.2%
57.5%
52.2%
49.9%
53.2%
50.6%
AllCare Health Plan
Cascade Health Alliance
Columbia Pacific
Eastern Oregon
FamilyCare
Health Share of Oregon
Intercommunity Health Network
Jackson Care Connect
PacificSource - Central
PacificSource - Gorge
PrimaryHealth of Josephine County
Trillium
Umpqua Health Alliance
Western Oregon Advanced Health
Willamette Valley Community Health
Yamhill Community Care
20.4%
20.8%
52.6%
54.3%
60.7%
63.1%
53.2%
55.8%
39.8%
42.3%Oregon Health Authority Health Policy & Analytics
9
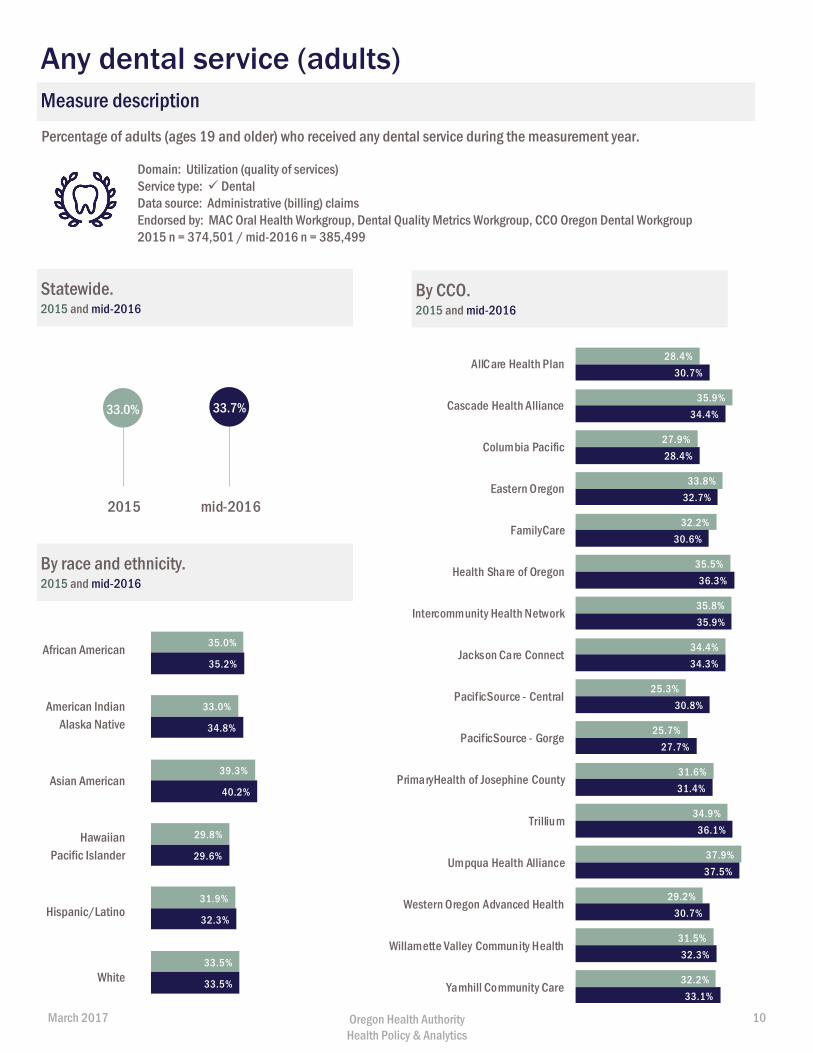
Percentage of adults (ages 19 and older) who received any dental service during the measurement year.
Domain: Utilization (quality of services)Service type: Dental Data source: Administrative (billing) claimsEndorsed by: MAC Oral Health Workgroup, Dental Quality Metrics Workgroup, CCO Oregon Dental Workgroup 2015 n = 374,501 / mid-2016 n = 385,499
Statewide. 2015 and mid-2016
By CCO. 2015 and mid-2016
By race and ethnicity. 2015 and mid-2016
Measure description
African American
American Indian Alaska Native
Asian American
Hawaiian Pacific Islander
Hispanic/Latino
White
Any dental service (adults)
33.0% 33.7%
2015 mid-2016
28.4%
35.9%
27.9%
33.8%
32.2%
35.5%
35.8%
34.4%
25.3%
25.7%
31.6%
34.9%
37.9%
29.2%
31.5%
32.2%
30.7%
34.4%
28.4%
32.7%
30.6%
36.3%
35.9%
34.3%
30.8%
27.7%
31.4%
36.1%
37.5%
30.7%
32.3%
33.1%
AllCare Health Plan
Cascade Health Alliance
Columbia Pacific
Eastern Oregon
FamilyCare
Health Share of Oregon
Intercommunity Health Network
Jackson Care Connect
PacificSource - Central
PacificSource - Gorge
PrimaryHealth of Josephine County
Trillium
Umpqua Health Alliance
Western Oregon Advanced Health
Willamette Valley Community Health
Yamhill Community Care
35.0%
33.0%
39.3%
29.8%
31.9%
33.5%
35.2%
34.8%
40.2%
29.6%
32.3%
33.5%
March 2017 Oregon Health Authority Health Policy & Analytics
10
89.6%
86.8%
90.1%
87.3%
87.5%
87.0%
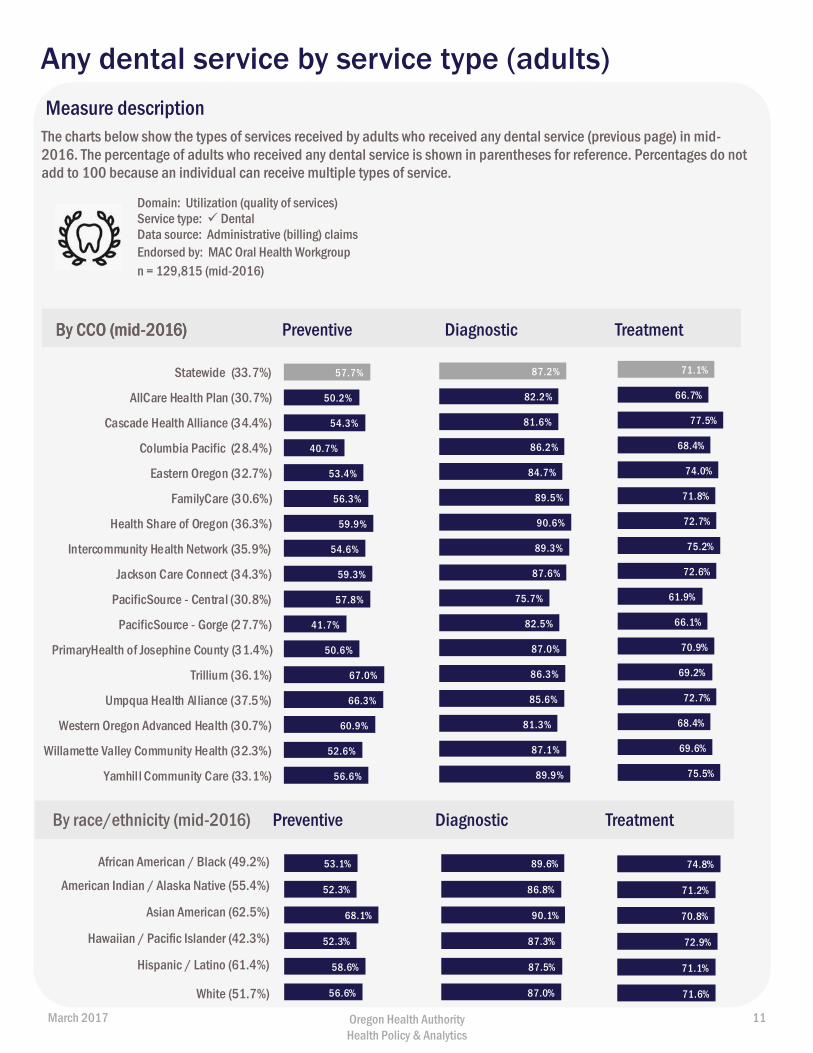
The charts below show the types of services received by adults who received any dental service (previous page) in mid-2016. The percentage of adults who received any dental service is shown in parentheses for reference. Percentages do not add to 100 because an individual can receive multiple types of service.
Domain: Utilization (quality of services)Service type: Dental Data source: Administrative (billing) claimsEndorsed by: MAC Oral Health Workgroup n = 129,815 (mid-2016)
71.1%
66.7%
77.5%
68.4%
74.0%
71.8%
72.7%
75.2%
72.6%
61.9%
66.1%
70.9%
69.2%
72.7%
68.4%
69.6%
75.5%
57.7%
50.2%
54.3%
40.7%
53.4%
56.3%
59.9%
54.6%
59.3%
57.8%
41.7%
50.6%
67.0%
66.3%
60.9%
52.6%
56.6%
Statewide (33.7%)
AllCare Health Plan (30.7%)
Cascade Health Alliance (34.4%)
Columbia Pacific (28.4%)
Eastern Oregon (32.7%)
FamilyCare (30.6%)
Health Share of Oregon (36.3%)
Intercommunity Health Network (35.9%)
Jackson Care Connect (34.3%)
PacificSource - Central (30.8%)
PacificSource - Gorge (27.7%)
PrimaryHealth of Josephine County (31.4%)
Trillium (36.1%)
Umpqua Health Alliance (37.5%)
Western Oregon Advanced Health (30.7%)
Willamette Valley Community Health (32.3%)
Yamhill Community Care (33.1%)
Measure description
87.2%
82.2%
81.6%
86.2%
84.7%
89.5%
90.6%
89.3%
87.6%
75.7%
82.5%
87.0%
86.3%
85.6%
81.3%
87.1%
89.9%
Any dental service by service type (adults)
Preventive Diagnostic Treatment By CCO (mid-2016) By CCO (mid-2016)
By race/ethnicity (mid-2016) Preventive Diagnostic Treatment
53.1%
52.3%
68.1%
52.3%
58.6%
56.6%
Hispanic / Latino (61.4%)
Hawaiian / Pacific Islander (42.3%)
Asian American (62.5%)
American Indian / Alaska Native (55.4%)
African American / Black (49.2%) 74.8%
71.2%
70.8%
72.9%
71.1%
71.6%White (51.7%)
March 2017 Oregon Health Authority Health Policy & Analytics
11
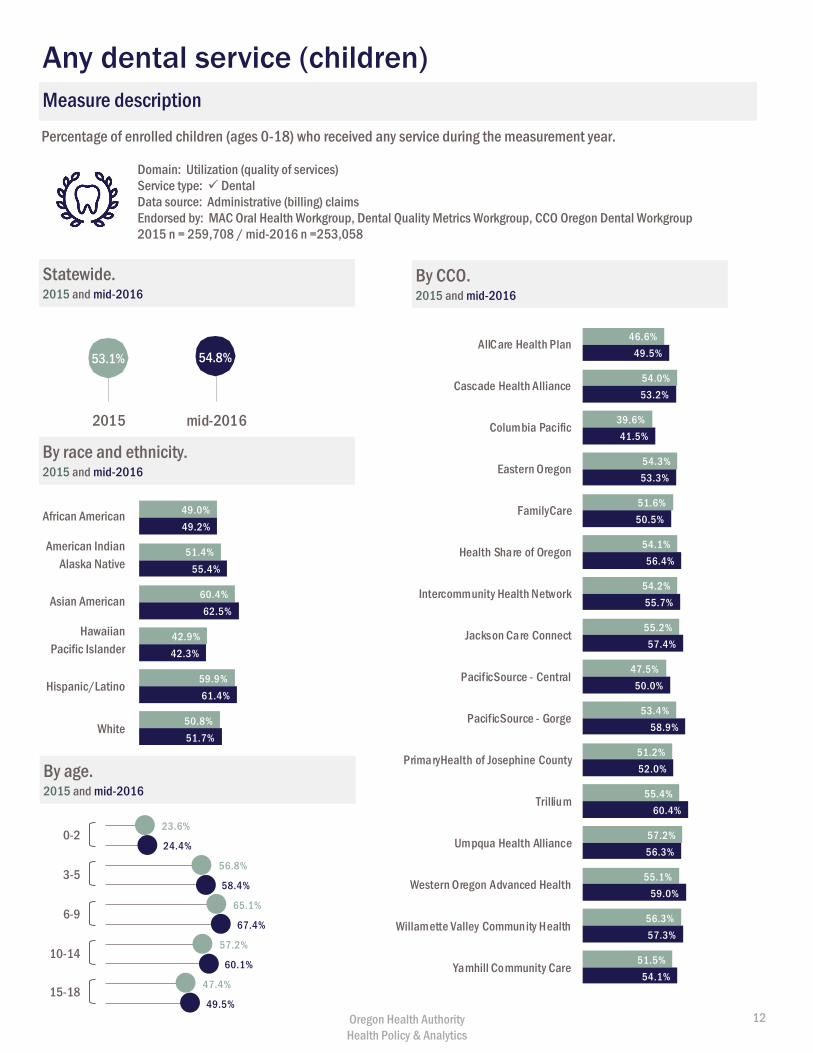
Percentage of enrolled children (ages 0-18) who received any service during the measurement year.
Domain: Utilization (quality of services)Service type: DentalData source: Administrative (billing) claimsEndorsed by: MAC Oral Health Workgroup, Dental Quality Metrics Workgroup, CCO Oregon Dental Workgroup2015 n = 259,708 / mid-2016 n =253,058
Statewide.2015 and mid-2016
46.6%
54.0%
39.6%
54.3%
51.6%
54.1%
54.2%
55.2%
47.5%
53.4%
51.2%
55.4%
57.2%
55.1%
56.3%
51.5%
49.5%
53.2%
41.5%
53.3%
50.5%
56.4%
55.7%
57.4%
50.0%
58.9%
52.0%
60.4%
56.3%
59.0%
57.3%
54.1%
AllCare Health Plan
Cascade Health Alliance
Columbia Pacific
Eastern Oregon
FamilyCare
Health Share of Oregon
Intercommunity Health Network
Jackson Care Connect
PacificSource - Central
PacificSource - Gorge
PrimaryHealth of Josephine County
Trillium
Umpqua Health Alliance
Western Oregon Advanced Health
Willamette Valley Community Health
Yamhill Community Care
By CCO.2015 and mid-2016
49.0%
51.4%
60.4%
42.9%
59.9%
50.8%
49.2%
55.4%
62.5%
42.3%
61.4%
51.7%
By race and ethnicity.2015 and mid-2016
By age.2015 and mid-2016
African American
American Indian Alaska Native
Asian American
Hawaiian Pacific Islander
Hispanic/Latino
White
23.6%
24.4%
56.8%
58.4%
65.1%
67.4%
57.2%
60.1%
47.4%
49.5%
0-2
3-5
6-9
10-14
15-18
Any dental service (children)
Measure description
53.1% 54.8%
2015 mid-2016
Oregon Health Authority Health Policy & Analytics
12
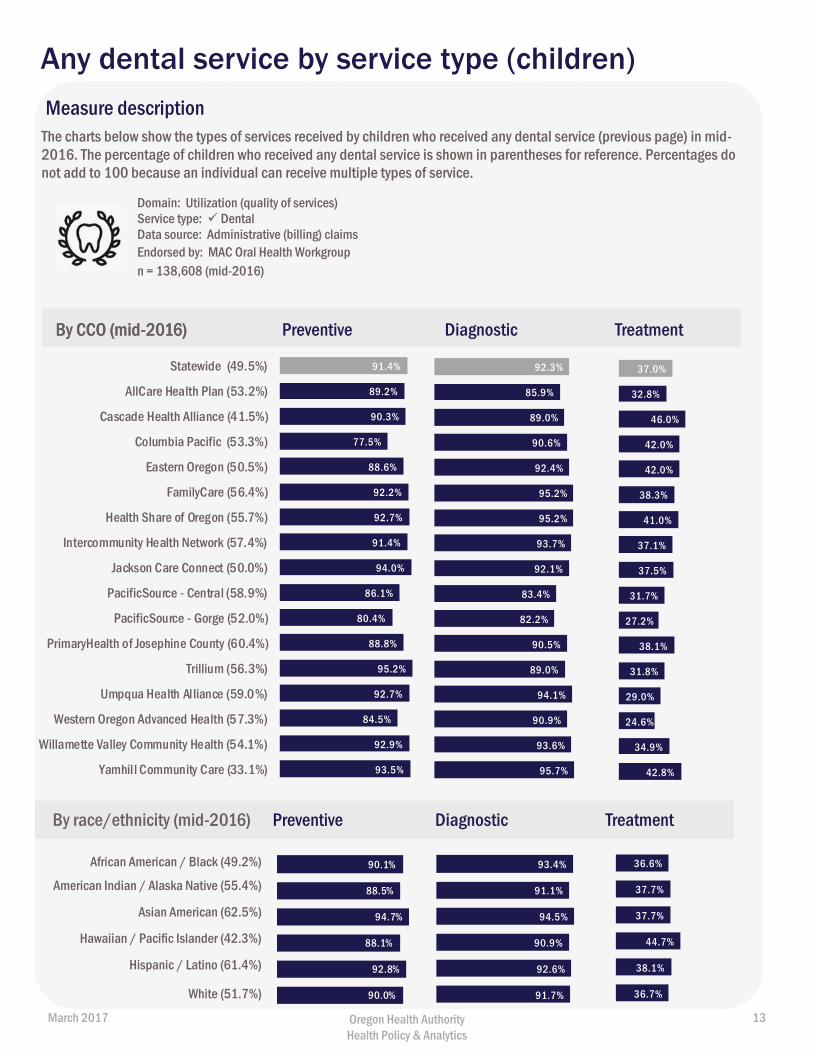
The charts below show the types of services received by children who received any dental service (previous page) in mid-2016. The percentage of children who received any dental service is shown in parentheses for reference. Percentages do not add to 100 because an individual can receive multiple types of service.
Domain: Utilization (quality of services)Service type: Dental Data source: Administrative (billing) claimsEndorsed by: MAC Oral Health Workgroup n = 138,608 (mid-2016)
Measure description
Any dental service by service type (children)
Preventive Diagnostic Treatment By CCO (mid-2016) By CCO (mid-2016)
By race/ethnicity (mid-2016) Preventive Diagnostic Treatment
90.1%
88.5%
94.7%
88.1%
92.8%
90.0%
Hispanic / Latino (61.4%)
Hawaiian / Pacific Islander (42.3%)
Asian American (62.5%)
American Indian / Alaska Native (55.4%)
African American / Black (49.2%)
White (51.7%)
91.4%
89.2%
90.3%
77.5%
88.6%
92.2%
92.7%
91.4%
94.0%
86.1%
80.4%
88.8%
95.2%
92.7%
84.5%
92.9%
93.5%
Statewide (49.5%)
AllCare Health Plan (53.2%)
Cascade Health Alliance (41.5%)
Columbia Pacific (53.3%)
Eastern Oregon (50.5%)
FamilyCare (56.4%)
Health Share of Oregon (55.7%)
Intercommunity Health Network (57.4%)
Jackson Care Connect (50.0%)
PacificSource - Central (58.9%)
PacificSource - Gorge (52.0%)
PrimaryHealth of Josephine County (60.4%)
Trillium (56.3%)
Umpqua Health Alliance (59.0%)
Western Oregon Advanced Health (57.3%)
Willamette Valley Community Health (54.1%)
Yamhill Community Care (33.1%)
92.3%
85.9%
89.0%
90.6%
92.4%
95.2%
95.2%
93.7%
92.1%
83.4%
82.2%
90.5%
89.0%
94.1%
90.9%
93.6%
95.7%
37.0%
32.8%
46.0%
42.0%
42.0%
38.3%
41.0%
37.1%
37.5%
31.7%
27.2%
38.1%
31.8%
29.0%
24.6%
34.9%
42.8%
93.4%
91.1%
94.5%
90.9%
92.6%
91.7%
36.6%
37.7%
37.7%
44.7%
38.1%
36.7%
March 2017 Oregon Health Authority Health Policy & Analytics
13
8.9%
9.5%
21.5%
24.6%
20.2%
22.7%
14.9%
16.8%
8.2%
9.3%
Percentage of enrolled children (ages 1 to 21) who received at least two topical fluoride applications during the measurement year.
Domain: Utilization (quality of services)Service type: Dental MedicalData source: Administrative (billing) claimsEndorsed by: Dental Quality Metrics Workgroup, CCO Oregon Dental Workgroup 2015 n = 275,403 / mid-2016 n = 268, 009
Statewide.2015 and mid-2016
By CCO.2015 and mid-2016
9.6%
12.5%
17.3%
8.8%
18.7%
12.8%
13.3%
14.8%
20.3%
11.3%
20.9%
13.8%
By race and ethnicity.2015 and mid-2016
By age.2015 and mid-2016
African American
American Indian Alaska Native
Asian American
Hawaiian Pacific Islander
Hispanic/Latino
White
0-2
3-5
6-9
10-14
15-18
14.5% 16.3%
All children Children at elevated
risk for caries
Topical fluoride varnish for children
Measure description
14.9%
15.9%
6.9%
17.4%
13.9%
13.3%
15.7%
22.6%
7.2%
2.0%
15.4%
14.6%
21.7%
13.6%
18.7%
12.4%
17.4%
13.8%
7.3%
15.8%
15.0%
17.4%
16.4%
23.2%
7.2%
5.0%
15.5%
19.2%
18.3%
13.2%
18.9%
16.6%
AllCare Health Plan
Cascade Health Alliance
Columbia Pacific
Eastern Oregon
FamilyCare
Health Share of Oregon
Intercommunity Health Network
Jackson Care Connect
PacificSource - Central
PacificSource - Gorge
PrimaryHealth of Josephine County
Trillium
Umpqua Health Alliance
Western Oregon Advanced Health
Willamette Valley Community Health
Yamhill Community Care
25.5% 28.8%
Oregon Health Authority Health Policy & Analytics
14
Patient experience Patient experience measures, such as surveys, are an important way to understand
barriers and challenges that may prevent members from receiving services. Oregon fields
the Consumer Assessment of Healthcare Providers and Systems (CAHPS) survey to ask
members to report on and evaluate their experiences with health care.
In 2014, two oral health questions were added to the OHP CAHPS survey to assess: 1)
percentage of CCO members who report having a regular dentist; and 2) percentage of
CCO members who were able to see a dentist as soon as they wanted in the case of a dental emergency.
Regular dentist
Having a regular dentist may make members more likely to receive regular oral health services, particularly
preventive care. The American Academy of Pediatric Dentistry, the American Dental Association, and the
Academy of General Dentistry all recommend establishing a dental home for children by age 1. A dental home
is the “ongoing relationship between the dentist and the patient, inclusive of all aspects of oral health
delivered in a comprehensive, continuously accessible, coordinated and family-centered way.”*
Access to emergency dental care
Having access to a dental office for emergency dental care can help ensure appropriate treatment and follow-
up care. Access to emergency dentistry also helps prevent unnecessary ED visits (see page 18). While the
CAHPS survey does not provide a measure of how quickly patients are able to access emergency dental
appointments, it gives important insight into whether patients feel their critical health needs are being
addressed.
Learn more about measure specifications in Appendix B: Technical Appendix (page 26).
* http://www.aapd.org/media/policies_guidelines/d_dentalhome.pdf
March 2017 Oregon Health Authority Health Policy & Analytics
15
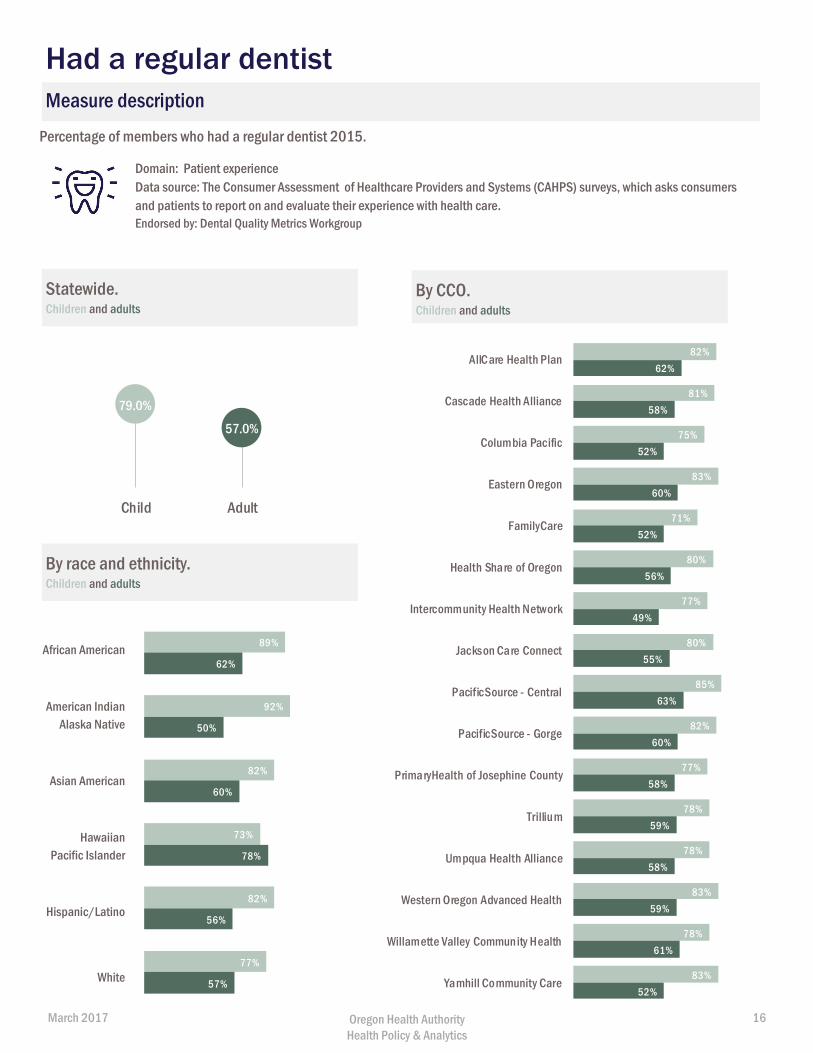
Percentage of members who had a regular dentist 2015.
Domain: Patient experienceData source: The Consumer Assessment of Healthcare Providers and Systems (CAHPS) surveys, which asks consumers and patients to report on and evaluate their experience with health care. Endorsed by: Dental Quality Metrics Workgroup
Statewide.Children and adults
By CCO. Children and adults
By race and ethnicity. Children and adults
Measure description
African American
American Indian Alaska Native
Asian American
Hawaiian Pacific Islander
Hispanic/Latino
White
Had a regular dentist
79.0%
57.0%
Child Adult
89%
92%
82%
73%
82%
77%
62%
50%
60%
78%
56%
57%
82%
81%
75%
83%
71%
80%
77%
80%
85%
82%
77%
78%
78%
83%
78%
83%
62%
58%
52%
60%
52%
56%
49%
55%
63%
60%
58%
59%
58%
59%
61%
52%
AllCare Health Plan
Cascade Health Alliance
Columbia Pacific
Eastern Oregon
FamilyCare
Health Share of Oregon
Intercommunity Health Network
Jackson Care Connect
PacificSource - Central
PacificSource - Gorge
PrimaryHealth of Josephine County
Trillium
Umpqua Health Alliance
Western Oregon Advanced Health
Willamette Valley Community Health
Yamhill Community Care
March 2017 Oregon Health Authority Health Policy & Analytics
16
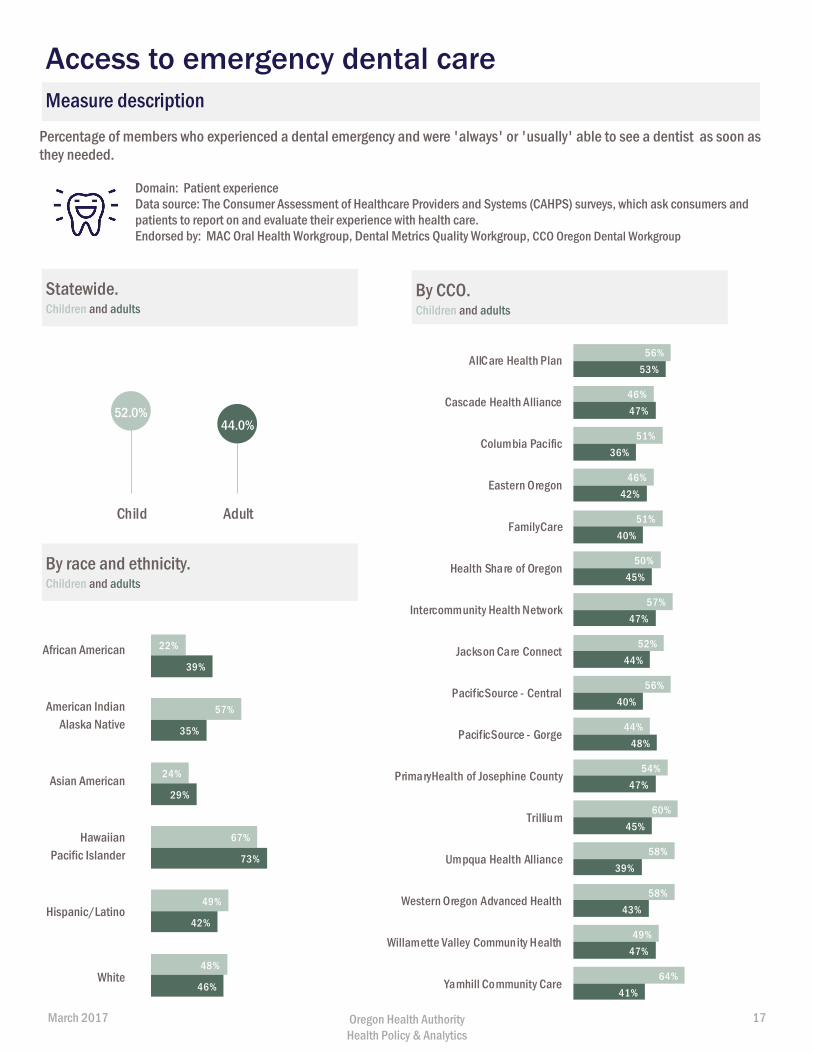
Percentage of members who experienced a dental emergency and were 'always' or 'usually' able to see a dentist as soon as they needed.
Domain: Patient experienceData source: The Consumer Assessment of Healthcare Providers and Systems (CAHPS) surveys, which ask consumers and patients to report on and evaluate their experience with health care.Endorsed by: MAC Oral Health Workgroup, Dental Metrics Quality Workgroup, CCO Oregon Dental Workgroup
Statewide.Children and adults
By CCO. Children and adults
By race and ethnicity. Children and adults
Measure description
African American
American Indian Alaska Native
Asian American
Hawaiian Pacific Islander
Hispanic/Latino
White
Access to emergency dental care
52.0%44.0%
Child Adult
56%
46%
51%
46%
51%
50%
57%
52%
56%
44%
54%
60%
58%
58%
49%
64%
53%
47%
36%
42%
40%
45%
47%
44%
40%
48%
47%
45%
39%
43%
47%
41%
AllCare Health Plan
Cascade Health Alliance
Columbia Pacific
Eastern Oregon
FamilyCare
Health Share of Oregon
Intercommunity Health Network
Jackson Care Connect
PacificSource - Central
PacificSource - Gorge
PrimaryHealth of Josephine County
Trillium
Umpqua Health Alliance
Western Oregon Advanced Health
Willamette Valley Community Health
Yamhill Community Care
22%
57%
24%
67%
49%
48%
39%
35%
29%
73%
42%
46%
March 2017 Oregon Health Authority Health Policy & Analytics
17
Care coordination
One aim of Oregon’s health system transformation efforts is improved care coordination,
with the goal of helping people better manage chronic conditions and prevent
unnecessary emergency department visits. This section highlights two measures of care
coordination recommended by the Medicaid Advisory Committee’s Oral Health
Workgroup.
Follow-up dental services for people
seen in the emergency department for non-traumatic
(caries-related) dental reasons
Non-traumatic dental reasons are conditions that could be treated
in a regular dental office rather than the emergency department
(ED) – in other words, avoidable ED use for dental care. A recent
study found higher ED visits for dental-related visits in Oregon than
nationally reported.* National research has shown that the
majority of dental-related ED visits are caries-related, which are
almost entirely preventable.† Connecting those seen in the ED with
appropriate follow-up care can help ensure appropriate dental
treatment and avoid future ED visits.
Follow-up care for patients with periodontal disease
Periodontal disease (gum disease) is one of the most common
chronic health conditions for adults, affecting an estimated 47% of
adults aged 30 years and older in the United States.‡ Gum disease
is also associated with a number of systemic health conditions,
from diabetes, cancer and heart disease, to low birth weight.§
Follow-up care can help reduce tooth loss and prevent recurrence
of disease.
* Sun, B., Chi, D., et. al. Emergency Department Visits for Non-Traumatic Dental Problems: A Mixed-Methods Study (May 2015). Am JPublic Health. 947-955. Available at: https://www.ncbi.nlm.nih.gov/pmc/articles/PMC4386544/pdf/AJPH.2014.302398.pdf† See e.g., Seu K, Hall KK, Moy E. Emergency Department Visits for Dental-Related Conditions, 2009. Healthcare Cost and UtilizationProject Statistical Brief #143. Rockville, MD: Agency for Healthcare Research and Quality; November 2012. Available at:http://www.hcup-us.ahrq.gov/reports/statbriefs/sb143.pdf; Allareddy V, Nalliah RP, Haque M, Johnson BS, Rampa SB, Lee MK.Hospital-based emergency department visits with dental conditions among children in the United States: nationwideepidemiological data. Pediatr Dent 2014;37(5):393-9.‡ Eke PI, Dye BA, Wei L, Thornton-Evans GO, Genco RJ. Prevalence of periodontitis in adults in the United States: 2009 and 2010. JDent Res. 2012:91(10):914-920.§ See e.g., Borgnakke WS, Ylöstalo PV, Taylor GW, Genco RJ. Effect of periodontal disease on diabetes: systematic review ofepidemiologic observational evidence. J Clin Periodontol 2013; 40 (suppl. 14): S135–S152.; Xiong, X., Buekens, P., Fraser, W., Beck, J.and Offenbacher, S. (2006), Periodontal disease and adverse pregnancy outcomes: a systematic review. BJOG: An InternationalJournal of Obstetrics & Gynaecology, 113: 135–143.; Chaffee BW and Weston SJ (2010), Association between chronic periodontaldisease and obesity: A systematic review. Journal of Periodontology, 81(12): 1708-1724; Humphrey, L.L., Fu, R., Buckley, D.I. et al. JGEN INTERN MED (2008) 23: 2079; Fitzpatrick SG and Katz J (2009), The association between periodontal disease and cancer: Areview of the literature. Journal of Dentistry, 38(2): 83-95.
In 2015, hospitals in Oregon adopted the
Emergency Department Information
Exchange (EDIE), which alerts hospitals in
real time when a patient visits the ED.
PreManage is a complementary software
that alerts care managers (CCOs, DCOs
and other providers) when members are
seen in the ED. The rollout of EDIE and
PreManage may increase capacity for
care coordination around ED use for non-
traumatic dental. For example,
CareOregon Dental is using PreManage
to connect members with an ED dental
visit with follow-up care, a dental home
and resources to address barriers to care.
As of February 2017, 13 out of 16 CCOs
have or are in process of setting up
subscriptions to use PreManage, which
cover their dental care managers, and
five DCOs have or are in process of
setting up stand-alone subscriptions.
Case study: Reducing avoidable ED
use for dental care
March 2017 Oregon Health Authority Health Policy & Analytics
18
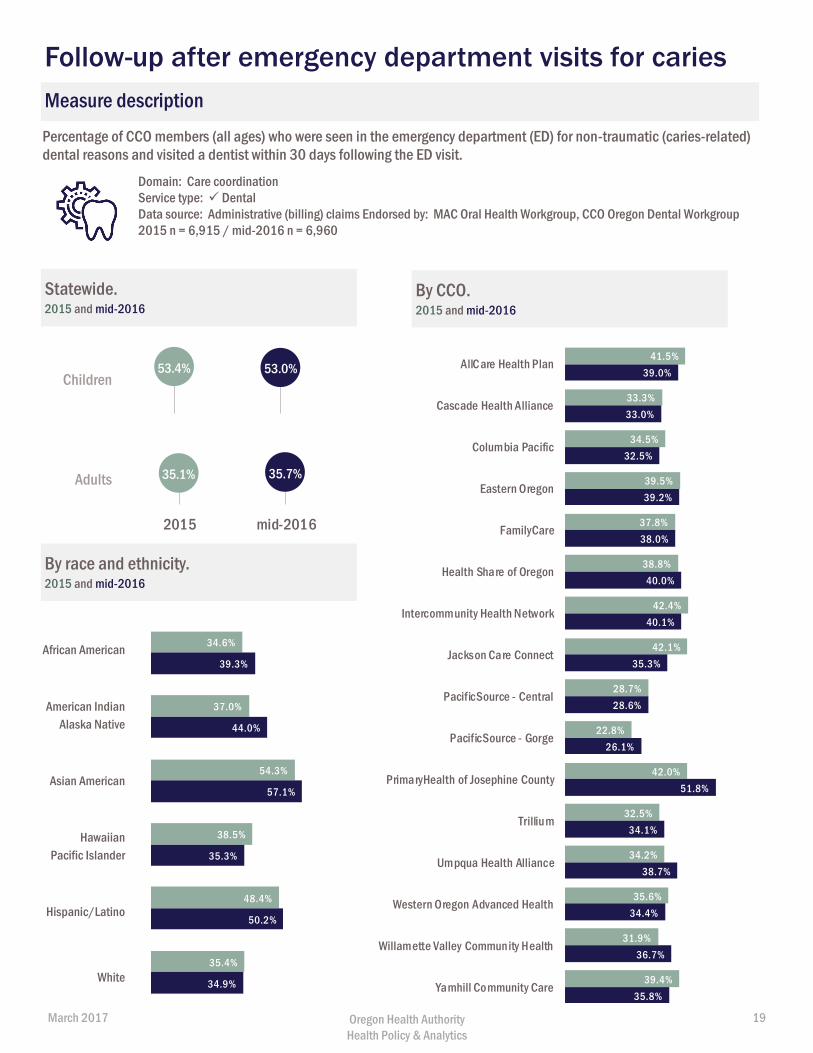
Percentage of CCO members (all ages) who were seen in the emergency department (ED) for non-traumatic (caries-related) dental reasons and visited a dentist within 30 days following the ED visit.
Domain: Care coordinationService type: DentalData source: Administrative (billing) claims Endorsed by: MAC Oral Health Workgroup, CCO Oregon Dental Workgroup 2015 n = 6,915 / mid-2016 n = 6,960
Statewide. 2015 and mid-2016
By CCO. 2015 and mid-2016
By race and ethnicity. 2015 and mid-2016
Measure description
African American
American Indian Alaska Native
Asian American
Hawaiian Pacific Islander
Hispanic/Latino
White
Follow-up after emergency department visits for caries
53.4% 53.0%
2015 mid-2016
34.6%
37.0%
54.3%
38.5%
48.4%
35.4%
39.3%
44.0%
57.1%
35.3%
50.2%
34.9%
41.5%
33.3%
34.5%
39.5%
37.8%
38.8%
42.4%
42.1%
28.7%
22.8%
42.0%
32.5%
34.2%
35.6%
31.9%
39.4%
39.0%
33.0%
32.5%
39.2%
38.0%
40.0%
40.1%
35.3%
28.6%
26.1%
51.8%
34.1%
38.7%
34.4%
36.7%
35.8%
AllCare Health Plan
Cascade Health Alliance
Columbia Pacific
Eastern Oregon
FamilyCare
Health Share of Oregon
Intercommunity Health Network
Jackson Care Connect
PacificSource - Central
PacificSource - Gorge
PrimaryHealth of Josephine County
Trillium
Umpqua Health Alliance
Western Oregon Advanced Health
Willamette Valley Community Health
Yamhill Community Care
Children
35.1% 35.7%
2015 mid-2016
Adults
March 2017 Oregon Health Authority Health Policy & Analytics
19
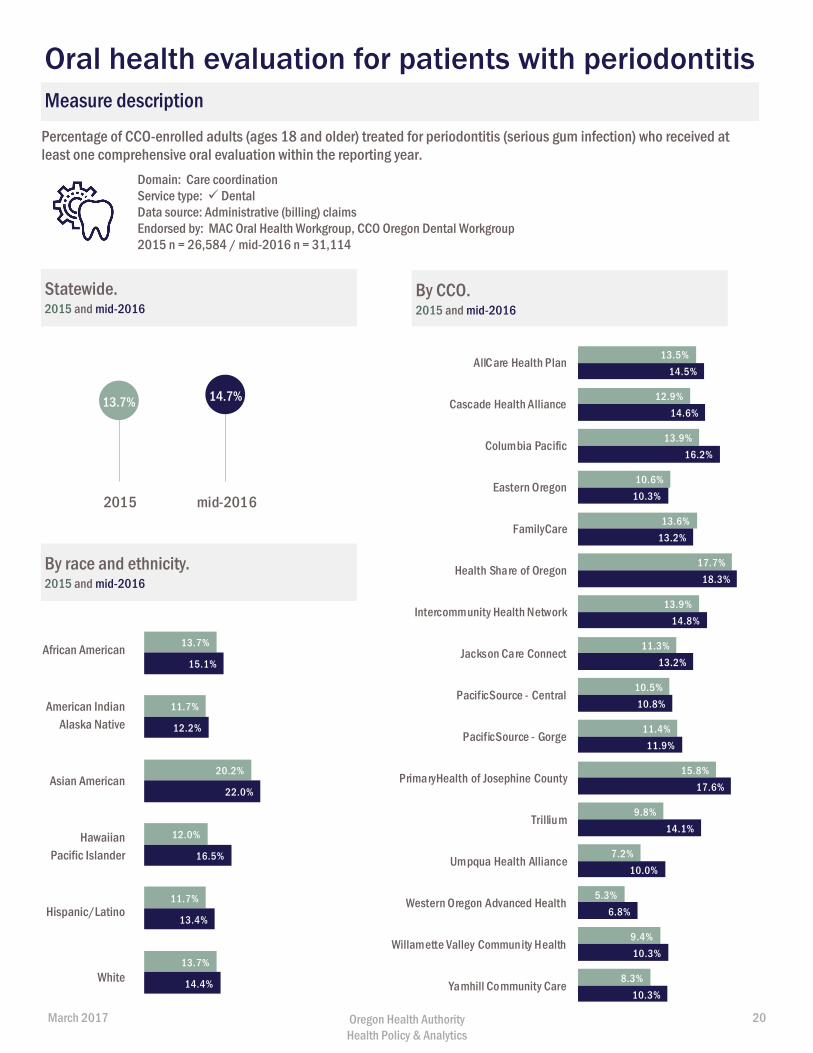
Percentage of CCO-enrolled adults (ages 18 and older) treated for periodontitis (serious gum infection) who received at least one comprehensive oral evaluation within the reporting year.
Domain: Care coordinationService type: DentalData source: Administrative (billing) claimsEndorsed by: MAC Oral Health Workgroup, CCO Oregon Dental Workgroup 2015 n = 26,584 / mid-2016 n = 31,114
Statewide. 2015 and mid-2016
By CCO. 2015 and mid-2016
By race and ethnicity. 2015 and mid-2016
Measure description
African American
American Indian Alaska Native
Asian American
Hawaiian Pacific Islander
Hispanic/Latino
White
Oral health evaluation for patients with periodontitis
13.7% 14.7%
2015 mid-2016
13.7%
11.7%
20.2%
12.0%
11.7%
13.7%
15.1%
12.2%
22.0%
16.5%
13.4%
14.4%
13.5%
12.9%
13.9%
10.6%
13.6%
17.7%
13.9%
11.3%
10.5%
11.4%
15.8%
9.8%
7.2%
5.3%
9.4%
8.3%
14.5%
14.6%
16.2%
10.3%
13.2%
18.3%
14.8%
13.2%
10.8%
11.9%
17.6%
14.1%
10.0%
6.8%
10.3%
10.3%
AllCare Health Plan
Cascade Health Alliance
Columbia Pacific
Eastern Oregon
FamilyCare
Health Share of Oregon
Intercommunity Health Network
Jackson Care Connect
PacificSource - Central
PacificSource - Gorge
PrimaryHealth of Josephine County
Trillium
Umpqua Health Alliance
Western Oregon Advanced Health
Willamette Valley Community Health
Yamhill Community Care
March 2017 Oregon Health Authority Health Policy & Analytics
20
Oral health integration One of the key goals of Oregon’s coordinated care model is to integrate physical, oral and
behavioral health care to treat the whole person. Poor oral health is linked to chronic
diseases, such as diabetes and heart disease, and associated with other health risks such
as stroke and low birth weight. More integrated health care delivery can improve health
and control costs. Additionally, a greater connection between the physical, behavioral
and oral health delivery systems can increase access to oral health services by enhancing
care coordination and creating new opportunities to address oral health needs (e.g., providing fluoride varnish
at well-child visits).
This section includes two measures of integration recommended by the Medicaid Advisory Committee’s Oral
Health Workgroup. For recent data on oral health assessments for children in DHS custody (foster care), see
the CCO Metrics Performance Report: https://www.oregon.gov/oha/Metrics/Pages/HST-Reports.aspx.
Dental care for adults with diabetes
Care coordination between the physical health and dental care delivery systems is particularly important for
people with diabetes. People with diabetes are at greater risk of gum disease, and having gum disease can also
make it difficult for people with diabetes to control their blood sugar.*
Oral health assessments for children younger than age 6
Oral health assessments are an important way for medical providers to integrate oral health into their work
and increase care coordination with dental providers. The American Academy of Pediatrics recommends all
children have an oral health assessment by a qualified pediatric health care professional starting at six months
and periodically throughout early childhood. Oral health assessments include risk assessment for caries (tooth
decay), anticipatory guidance and counseling on good oral hygiene practices and nutrition, and referral to a
dentist to establish a dental home.
OHP reimburses providers for oral health assessments in medical settings for children under younger than age
6. To receive reimbursement, providers must have received recent training through Smiles for Life† or First
Tooth‡ (offered through the Oregon Oral Health Coalition). Some CCOs have voluntarily extended this
coverage to all children aged 19 and younger.
Learn more about measure specifications in Appendix B: Technical Appendix (page 26).
* B. Mealey. "Periodontal Disease and Diabetes: A Two-Way Street." Journal of the American Dental Association 137, 2006: 26S-31S.
† http://www.smilesforlifeoralhealth.org/buildcontent.aspx?tut=555&pagekey=62948&cbreceipt=0
‡ http://www.orohc.org/first-tooth/
March 2017 Oregon Health Authority Health Policy & Analytics
21
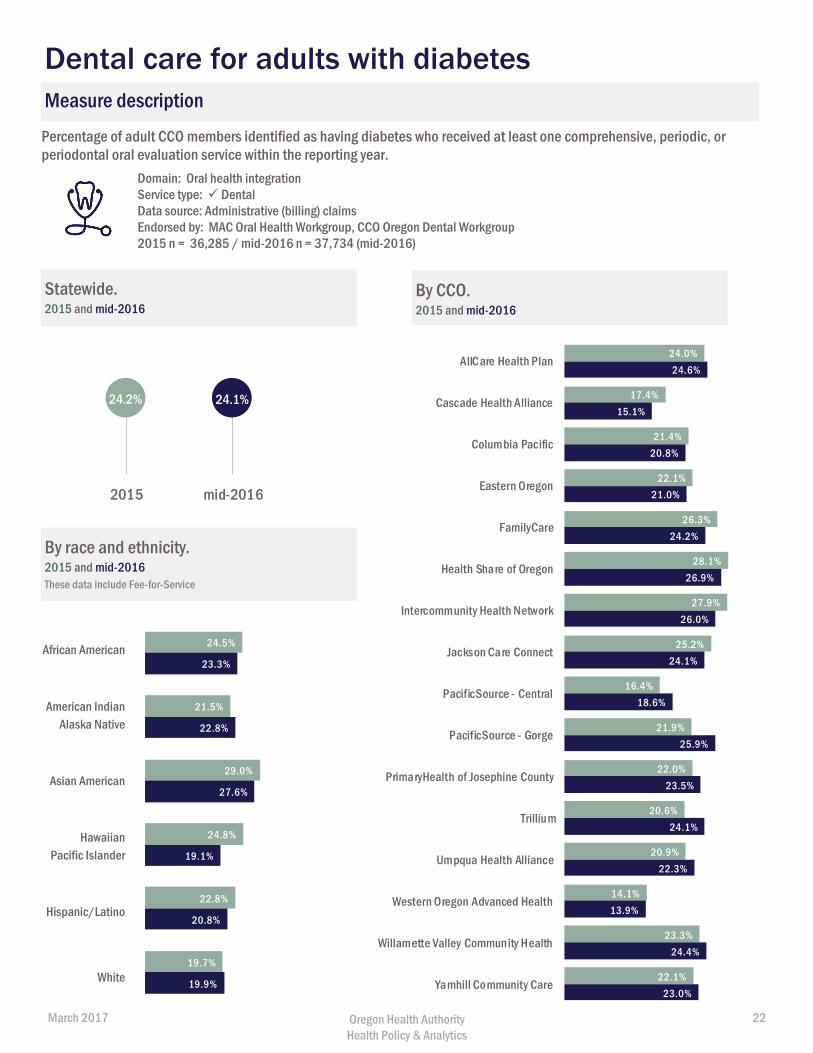
Percentage of adult CCO members identified as having diabetes who received at least one comprehensive, periodic, or periodontal oral evaluation service within the reporting year.
Domain: Oral health integrationService type: DentalData source: Administrative (billing) claimsEndorsed by: MAC Oral Health Workgroup, CCO Oregon Dental Workgroup 2015 n = 36,285 / mid-2016 n = 37,734 (mid-2016)
Statewide. 2015 and mid-2016
By CCO. 2015 and mid-2016
By race and ethnicity. 2015 and mid-2016 These data include Fee-for-Service
Measure description
African American
American Indian Alaska Native
Asian American
Hawaiian Pacific Islander
Hispanic/Latino
White
Dental care for adults with diabetes
24.5%
21.5%
29.0%
24.8%
22.8%
19.7%
23.3%
22.8%
27.6%
19.1%
20.8%
19.9%
24.0%
17.4%
21.4%
22.1%
26.3%
28.1%
27.9%
25.2%
16.4%
21.9%
22.0%
20.6%
20.9%
14.1%
23.3%
22.1%
24.6%
15.1%
20.8%
21.0%
24.2%
26.9%
26.0%
24.1%
18.6%
25.9%
23.5%
24.1%
22.3%
13.9%
24.4%
23.0%
AllCare Health Plan
Cascade Health Alliance
Columbia Pacific
Eastern Oregon
FamilyCare
Health Share of Oregon
Intercommunity Health Network
Jackson Care Connect
PacificSource - Central
PacificSource - Gorge
PrimaryHealth of Josephine County
Trillium
Umpqua Health Alliance
Western Oregon Advanced Health
Willamette Valley Community Health
Yamhill Community Care
24.2% 24.1%
2015 mid-2016
March 2017 Oregon Health Authority Health Policy & Analytics
22
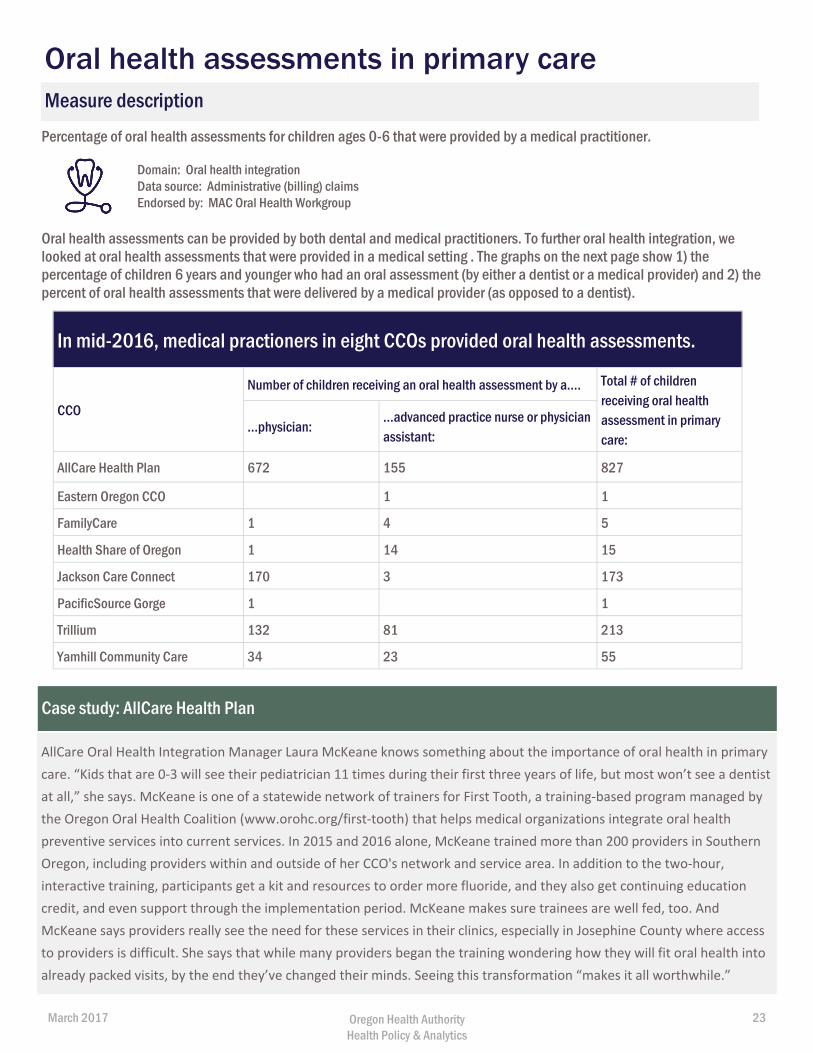
Percentage of oral health assessments for children ages 0-6 that were provided by a medical practitioner.
Domain: Oral health integrationData source: Administrative (billing) claimsEndorsed by: MAC Oral Health Workgroup
Oral health assessments can be provided by both dental and medical practitioners. To further oral health integration, we looked at oral health assessments that were provided in a medical setting . The graphs on the next page show 1) the percentage of children 6 years and younger who had an oral assessment (by either a dentist or a medical provider) and 2) the percent of oral health assessments that were delivered by a medical provider (as opposed to a dentist).
Measure description
Oral health assessments in primary care
Case study: AllCare Health Plan
AllCare Oral Health Integration Manager Laura McKeane knows something about the importance of oral health in primary
care. “Kids that are 0-3 will see their pediatrician 11 times during their first three years of life, but most won’t see a dentist
at all,” she says. McKeane is one of a statewide network of trainers for First Tooth, a training-based program managed by
the Oregon Oral Health Coalition (www.orohc.org/first-tooth) that helps medical organizations integrate oral health
preventive services into current services. In 2015 and 2016 alone, McKeane trained more than 200 providers in Southern
Oregon, including providers within and outside of her CCO's network and service area. In addition to the two-hour,
interactive training, participants get a kit and resources to order more fluoride, and they also get continuing education
credit, and even support through the implementation period. McKeane makes sure trainees are well fed, too. And
McKeane says providers really see the need for these services in their clinics, especially in Josephine County where access
to providers is difficult. She says that while many providers began the training wondering how they will fit oral health into
already packed visits, by the end they’ve changed their minds. Seeing this transformation “makes it all worthwhile.”
In mid-2016, medical practioners in eight CCOs provided oral health assessments.
CCO
Number of children receiving an oral health assessment by a…. Total # of children receiving oral health assessment in primary care:
...physician: ...advanced practice nurse or physician assistant:
AllCare Health Plan 672 155 827
Eastern Oregon CCO 1 1
FamilyCare 1 4 5
Health Share of Oregon 1 14 15
Jackson Care Connect 170 3 173
PacificSource Gorge 1 1
Trillium 132 81 213
Yamhill Community Care 34 23 55
March 2017 Oregon Health Authority Health Policy & Analytics
23
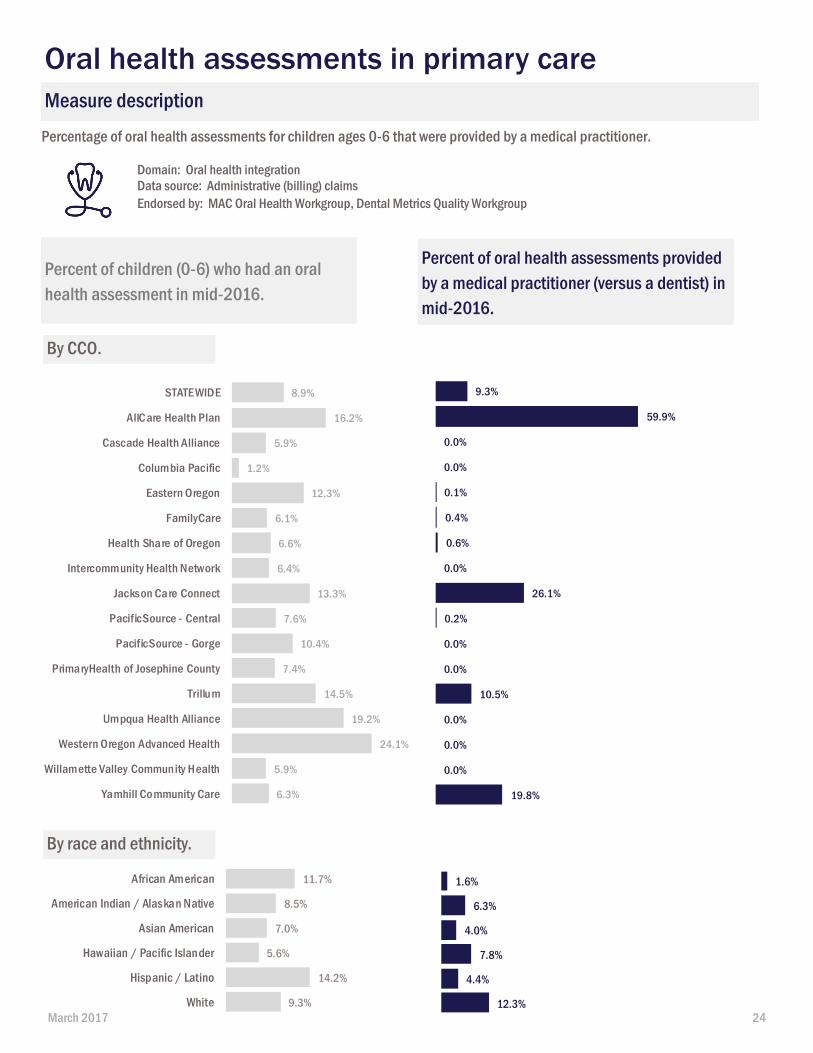
Percentage of oral health assessments for children ages 0-6 that were provided by a medical practitioner.
Domain: Oral health integrationData source: Administrative (billing) claimsEndorsed by: MAC Oral Health Workgroup, Dental Metrics Quality Workgroup
Percent of children (0-6) who had an oral health assessment in mid-2016.
Percent of oral health assessments provided by a medical practitioner (versus a dentist) in mid-2016.
By CCO.
Measure description
Oral health assessments in primary care
8.9%
16.2%
5.9%
1.2%
12.3%
6.1%
6.6%
6.4%
13.3%
7.6%
10.4%
7.4%
14.5%
19.2%
24.1%
5.9%
6.3%
STATEWIDE
AllCare Health Plan
Cascade Health Alliance
Columbia Pacific
Eastern Oregon
FamilyCare
Health Share of Oregon
Intercommunity Health Network
Jackson Care Connect
PacificSource - Central
PacificSource - Gorge
PrimaryHealth of Josephine County
Trillum
Umpqua Health Alliance
Western Oregon Advanced Health
Willamette Valley Community Health
Yamhill Community Care
9.3%
59.9%
0.0%
0.0%
0.1%
0.4%
0.6%
0.0%
26.1%
0.2%
0.0%
0.0%
10.5%
0.0%
0.0%
0.0%
19.8%
11.7%
8.5%
7.0%
5.6%
14.2%
9.3%
African American
American Indian / Alaskan Native
Asian American
Hawaiian / Pacific Islander
Hispanic / Latino
White
1.6%
6.3%
4.0%
7.8%
4.4%
12.3%
By race and ethnicity.
March 2017 24
Appendix A: Stakeholder groups
Oral Health Workgroup of the Medicaid Advisory Committee
The Medicaid Advisory Committee established the Oral Health Workgroup in 2016 to respond
to an OHA request for a framework for assessing access to oral health services in OHP. The
group included 16 community representatives from CCOs, dental care organizations (DCOs)
contracting with CCOs and OHA, dental providers, consumer advocates and other community
members from the oral health world. The final Framework for Oral Health Access in the
Oregon Health Plan1 included a recommended oral health monitoring dashboard with 15
measures (see Appendix B, MAC Oral Health Monitoring Measures Dashboard). Measures
were pulled primarily from an environmental scan of recommendations from local
workgroups, notably the Dental Quality Metrics Workgroup of the Metrics and Scoring
Committee and CCO Oregon’s Dental Workgroup, state oral health strategic plans, and
national sources. Ten of the 15 recommended measures with available data sources and
specifications were included in this report.
Dental Quality Metrics Workgroup
The Dental Quality Metrics Workgroup was convened as a working group of the Metrics and
Scoring Committee. The workgroup was charged with recommending objective outcome and
quality measures and benchmarks for oral health services provided by CCOs. The workgroup
recommended2 several incentive measures, and the Metrics and Scoring Committee
ultimately adopted one quality measure and one measure modification starting with the 2015
incentive pool:
1. Mental, physical and dental* health assessments within 60 days for children in
Department of Human Services (DHS) custody (e.g., foster care). (*measure amended
in 2015 to include dental along with mental/physical health assessment)
2. Dental sealants on permanent molars for children (ages 6–14)
In addition, the workgroup recommended several measures for future exploration and
monitoring, such as topical fluoride varnish applications, which are included in this report.
CCO Oregon Dental Workgroup
In 2015, CCO Oregon established a workgroup to develop a CCO-DCO quality metrics set3 for
recommended use by CCOs in subcontracts. The Medicaid Advisory Committee’s Oral Health
Workgroup included several CCO Oregon Dental Workgroup measures in its monitoring
recommendations (see Appendix C).
_________________________________________________________________________ 1http://www.oregon.gov/oha/OHPR/MAC/Documents/MAC-oralhealthframework-Oct2016.pdf
2http://www.oregon.gov/oha/analytics/DentalMetricsDocuments/Dental%20Metrics%20Recommendation.pdf
3http://www.ccooregon.org/media/uploads/CCODCOMetricSetFinal.pdf
Stakeholder groups that informed the report
March 2017 Oregon Health Authority Health Policy & Analytics
25
Data sources
Administrative data
Claims data consider the billing and diagnostic codes physicians, pharmacies, hospitals and other
health care providers submit to payers, in this case, Medicaid. Data follows a consistent format and
uses a standard set of established codes to describe specific procedures, drugs and diagnoses. Claims
data are primarily used for payment, while encounter data include all of the same information as a
claim, but are provided for information or monitoring purposes.
Medicaid claims data are submitted to Oregon’s Medicaid Management Information System (MMIS).
We allow a lag of six months of all claims to be submitted.
Consumer Assessment of Healthcare Providers and Systems (CAHPS) Survey
The CAHPS survey asks Oregon Health Plan members to report on and evaluate their experiences with
health care, focusing on aspects that members are best qualified to assess, such as ease of access to
services. The U.S. Agency for Healthcare Research and Quality (AHRQ), funds and oversees the CAHPS
program, which works closely with public and private research organizations to develop and maintain
the surveys. Oregon has been administering the CAHPS Health Plan Survey for Medicaid since 1998.
Survey data used in this report come from the 2016 CAHPS survey, which reports on member
experience in CY 2015. https://www.oregon.gov/oha/analytics/Pages/CAHPS.aspx
Health care workforce licensing
This data provides a snapshot of the state’s dental workforce using data collected by the Oregon
Health Authority in collaboration with Oregon Board of Dentistry. All data are self-reported at the time
of license renewal (dentists and volunteer dentists: Jan. 1 through Apr. 30, 2015 and Jan. 1 through
Apr. 30, 2016). The survey was completed by 89.7% of dentists with an active license as of October
2016. The majority of those that did not complete the survey are new licensees.
https://www.oregon.gov/oha/analytics/Pages/Health-Care-Workforce-Reporting.aspx
Appendix B: Technical Appendix
March 2017 Oregon Health Authority Health Policy & Analytics
26
Measure specifications
Ratio of dental providers available by region and percent of FTE reporting seeing Medicaid
The map looks at the ratio of licensed dentists to Oregon’s population. Results are presented by
county.
The map displays the total FTE for licensees who:
1) Identified their employment status as “employed in the field,” “self-employed in the field,”
“volunteer,” or “other.”
2) Reported a primary or secondary practice location in Oregon.
3) Reported practicing general dentistry (including pediatrics and public health, but excluding oral
surgeons, etc.). (For dentists only)
FTE is based on time spent in direct patient care (capped at 40 hours) and, for dentists only, was
weighted based on the number of auxiliaries (e.g., chairside assistants, hygienists, etc.) and age,
according to HRSA Procedures for Shortage Designation.
Whether a dentist sees Medicaid patients is self-reported and may be unknown (11.5% of total FTE
reported not knowing whether or not they saw Medicaid patients). Therefore the number of dentists
that see Medicaid patients could be higher or lower than what can be reported here.
Data source: Health Care Workforce Licensing Database
Members receiving dental services by county
This measure looks at the percentage of OHP members receiving any dental service by county during
2015.
Denominator: Average number of member months during measurement year (by county)
Numerator: Number of clients who received any dental service under the supervision of a dentist
(PT=17) or a dental hygienist (PT=18) as defined by CDT codes D0100–D9999 based on EPSDT
specifications.
Data source: Administrative (billing) claims
Any dental service
This measure looks at the percentage of adults (aged 19 years and older) and children (aged 0–18) who
received any dental service during the measurement year.
Denominator: Number of clients who have either 1. continuous enrollment for 12 months in a CCOA
based on standard metric continuous enrollment table, or 2. are enrolled in OHP Open Card.
Numerator: Number of clients who received any dental service under the supervision of a dentist
(PT=17) or a dental hygienist (PT=18) as defined by CDT codes D0100-D9999 based on EPSDT
specifications.
Preventive Service is a subset of Any Dental Service and identified by CDT codes D1000–D1999.
Treatment Service is a subset of Any Dental Service and identified by CDT codes D2000–D9999.
Diagnostic Service is a subset of Any Dental Service and identified by CDT codes D0100–D0999.
March 2017 Oregon Health Authority Health Policy & Analytics
27
Data source: Administrative (billing) claims
Measure source: Dental Quality Alliance, with modifications made to expand the age range to adults.
http://www.ada.org/~/media/ADA/Science%20and%20Research/Files/DQA_2016_Utlization_of_Servic
es.pdf?la=en
Preventive Dental Services
This measure looks at the percentage of adults (aged 19 years and older) and children (aged 0–18) who
received preventive dental services during the measurement year.
CDT codes D1000–D1999
Denominator: Number of clients who have continuous enrollment for 12 months in a CCOA based on
standard metric continuous enrollment table.
Numerator: Number of clients who received preventive dental services under the supervision of a
dentist (PT=17) or a dental hygienist (PT=18) as defined by CDT codes D1000–D1999.
Data source: Administrative (billing) claims
Measure source: EPSDT specifications (CMS-416), with modifications made to expand the age range to
adults and include full set of preventive dental services in ADA CDT codes, as well as to look at children
and adults without elevated risk. https://www.medicaid.gov/medicaid/benefits/downloads/cms-416-
instructions.pdf
Topical fluoride varnish for children
This measure looks at the percentage of children and adolescents (aged 1–21) who received at least
two topical fluoride applications during the measurement year for children without elevated risk and
children with elevated risk.
Numerator: Children and adolescents who received at least two fluoride applications on two separate
dates during the measurement period. Numerator includes services provided by a dentist (D1206 or
D1208) and by medical providers (CPT 99188).
Denominator 1: Children and adolescents aged 1–21 and continuously enrolled during the
measurement period without elevated caries risk
Denominator 2: Children and adolescents ages 1–21 and continuously enrolled during the
measurement period with elevated caries risk.
Continuous enrollment: 12 months with a gap of no more than 45 days
Data source: Administrative paid clean claims
Measure source: Dental Quality Alliance, with modifications made to look at fluoride varnish for
children with and without elevated risk.
http://www.ada.org/~/media/ADA/Science%20and%20Research/Files/DQA_2016_Topical_Fluoride.pd
f?la=en
Have a regular dentist
This survey-based measure looks at the percentage of child and adult members who report they had a
regular dentist. The question is, “A regular dentist is one you would go to for check-ups and cleanings
or when you have a cavity or tooth pain. Do you have a regular dentist?”
March 2017 Oregon Health Authority Health Policy & Analytics
28
Data source: CAHPS Health Plan Survey
Measure source: CAHPS Dental Survey – questions from the dental survey were added to Oregon’s
health plan survey. https://www.oregon.gov/oha/analytics/Pages/CAHPS.aspx
Access to emergency dental care
This survey-based measure looks at the percentage of child and adult members who report they have
experienced a dental emergency and were “always” or “usually” able to see a dentist as soon as they
needed. The question is, “In the last six months, if you needed to see a dentist right away because of a
dental emergency, did you get to see a dentist as soon as you wanted?”
Data source: CAHPS Health Plan survey
Measure source: CAHPS Dental Survey – questions from the dental survey were added to Oregon’s
health plan survey. https://www.oregon.gov/oha/analytics/Pages/CAHPS.aspx
Follow-up after emergency department visit for dental reasons
This measure looks at the percentage of children (aged 0–18) and adults (aged 19 years and older) seen
in the ED for a non-traumatic (caries-related) dental reason, and who visited a dentist within seven
days and 30 days following the ED visit.
Numerator1: Among the visits identified in Numerator 2, any visit with a dentist for any dental service
(D0100–D9999) within seven days of the ED visit.
Numerator 2: Any visit with a dentist for any dental service (D0100–D9999) within 30 days of the ED
visit.
Denominator: Identify all emergency department visits for caries-related reasons occurring during
eligible member months between January 1 and December 1 of the reporting year based on the
standard metric ED visits table and using ICD9/10 diagnosis codes in Table 1 and Table 2 of the DQA
specs. See link:
http://www.ada.org/~/media/ADA/Science%20and%20Research/Files/DQA_2016_Follow-
up_After_ED_Visit_by_Children_for_Dental_Caries.pdf?la=en. Includes only paid clean claims and
excludes inpatient claims.
Continuous enrollment: Member must be enrolled 12 months with a gap of no more than 45 days and
must be in a CCO on the date of the ED visit and for 30 days following the ED visit.
Data source: Administrative (billing) claims
Measure source: based on preliminary specifications from the Dental Quality Alliance
Oral health evaluation for adults with periodontitis
This measure looks at the percentage of adults aged 30 years and older who have been treated for
periodontitis (serious gum infection) who received a comprehensive oral evaluation at least once
within the measurement period.
Numerator: Adults who received at least one periodontal evaluation (D0120 or D0150 or D0180).
Denominator: Adults aged 30 and older who have a history of periodontitis, defined by any instances
of CDT code D4240, D4241, D4260, D4261, D4341, D4342 or D4910 in the measurement year or any of
the three years before the measurement year.
March 2017 Oregon Health Authority Health Policy & Analytics
29
Continuous enrollment: 12 months, with no more than one gap of up to 45 days
Data source: Administrative (billing) claims
Measure source: based on preliminary specifications from the Dental Quality Alliance
Oral evaluation for adults with diabetes
This measure looks at the percentage of adults aged 18–75 years who have diabetes, and received at
least one comprehensive, periodic or periodontal oral evaluation service during the measurement
period.
Numerator: Members who received a comprehensive, periodic or periodontal oral evaluation. CDT
codes D0120 or D0150 or D0180.
Denominator: Members aged 18–75 years who have diabetes, as identified in claim and pharmacy data
during the measurement year or the year before the measurement period, using any one of these
criteria:
At least two outpatient visits, observation visits or ED visits on different dates of service with a
diagnosis of diabetes.
At least one acute inpatient encounter with a diagnosis of diabetes.
Dispensed insulin or hypoglycemics/antihyperglycemics on an ambulatory basis.
Only patients with a diagnosis of Type 1 or Type 2 diabetes should be included in the denominator;
patients with a diagnosis of secondary diabetes due to another condition should not be included.
Continuous enrollment: 12 months, with no more than one gap of up to 45 days
Data source: Administrative data, paid and denied claims
Measure source: Numerator based on preliminary specifications from the Dental Quality Alliance.
Denominator based on HEDIS Comprehensive Diabetes Care Measure
http://www.oregon.gov/oha/analytics/Pages/CCO-Baseline-Data.aspx . Value set codes can be found at
https://vsac.nlm.nih.gov/
Oral health assessments in primary care for children aged 0–6 years
This indicator looks at the percentage of oral health assessments provided to children in medical
settings versus dental settings. The indicator is determined by looking at all claims for oral health
assessments, CDT code D0191, and then whether that claim was submitted as a dental claim (services
provided by dentists) or a medical claim (services provided in medical settings).
The indicator also looks at performing providers (physician, advance practice nurse or physician
assistants) that had a medical claim for CDT code D0191 within medical settings.
Data source: Administrative (billing) claims
Measure source: OHA-developed, based on recommendation from the MAC Oral Health Workgroup
March 2017 Oregon Health Authority Health Policy & Analytics
30
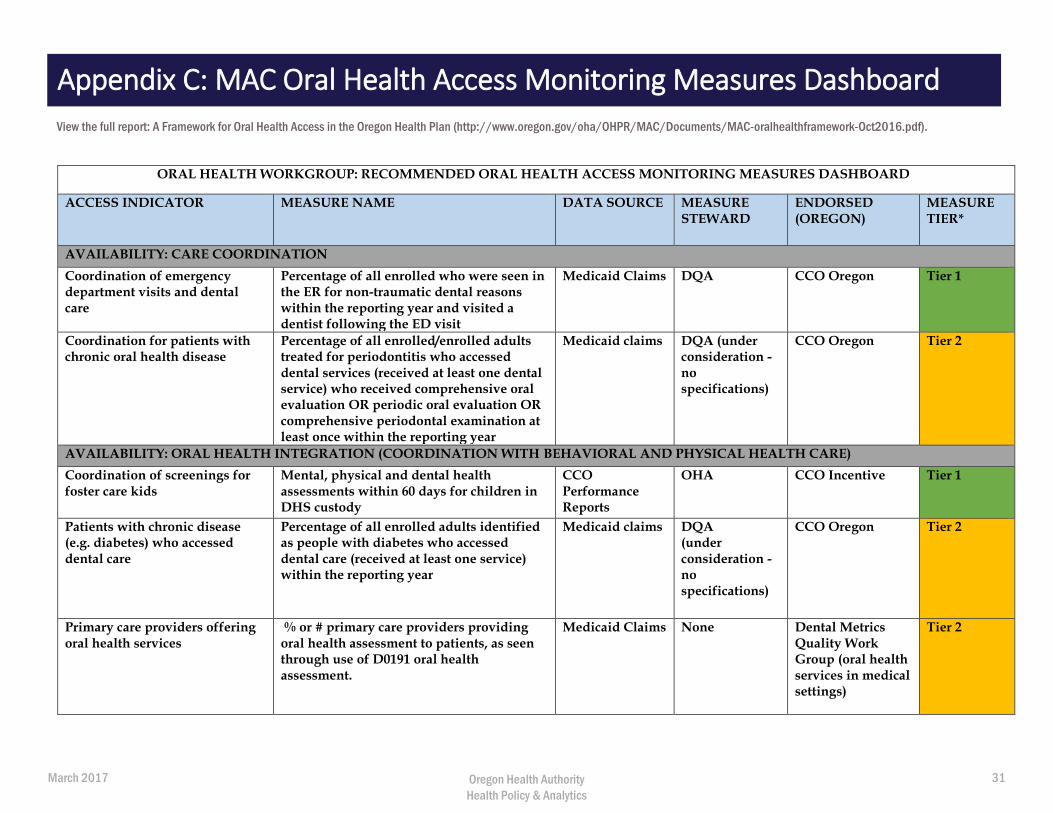
ORAL HEALTH WORKGROUP: RECOMMENDED ORAL HEALTH ACCESS MONITORING MEASURES DASHBOARD
ACCESS INDICATOR MEASURE NAME DATA SOURCE MEASURE STEWARD
ENDORSED (OREGON)
MEASURE TIER*
AVAILABILITY: CARE COORDINATION
Coordination of emergency department visits and dental care
Percentage of all enrolled who were seen in the ER for non-traumatic dental reasons within the reporting year and visited a dentist following the ED visit
Medicaid Claims DQA CCO Oregon Tier 1
Coordination for patients with chronic oral health disease
Percentage of all enrolled/enrolled adults treated for periodontitis who accessed dental services (received at least one dental service) who received comprehensive oral evaluation OR periodic oral evaluation OR comprehensive periodontal examination at least once within the reporting year
Medicaid claims DQA (under consideration - no specifications)
CCO Oregon Tier 2
AVAILABILITY: ORAL HEALTH INTEGRATION (COORDINATION WITH BEHAVIORAL AND PHYSICAL HEALTH CARE)
Coordination of screenings for foster care kids
Mental, physical and dental health assessments within 60 days for children in DHS custody
CCO Performance Reports
OHA CCO Incentive Tier 1
Patients with chronic disease (e.g. diabetes) who accessed dental care
Percentage of all enrolled adults identified as people with diabetes who accessed dental care (received at least one service) within the reporting year
Medicaid claims DQA (under consideration - no specifications)
CCO Oregon Tier 2
Primary care providers offering oral health services
% or # primary care providers providing oral health assessment to patients, as seen through use of D0191 oral health assessment.
Medicaid Claims None Dental Metrics Quality Work Group (oral health services in medical settings)
Tier 2
View the full report: A Framework for Oral Health Access in the Oregon Health Plan (http://www.oregon.gov/oha/OHPR/MAC/Documents/MAC-oralhealthframework-Oct2016.pdf).
Appendix C: MAC Oral Health Access Monitoring Measures Dashboard
March 2017 Oregon Health Authority Health Policy & Analytics
31
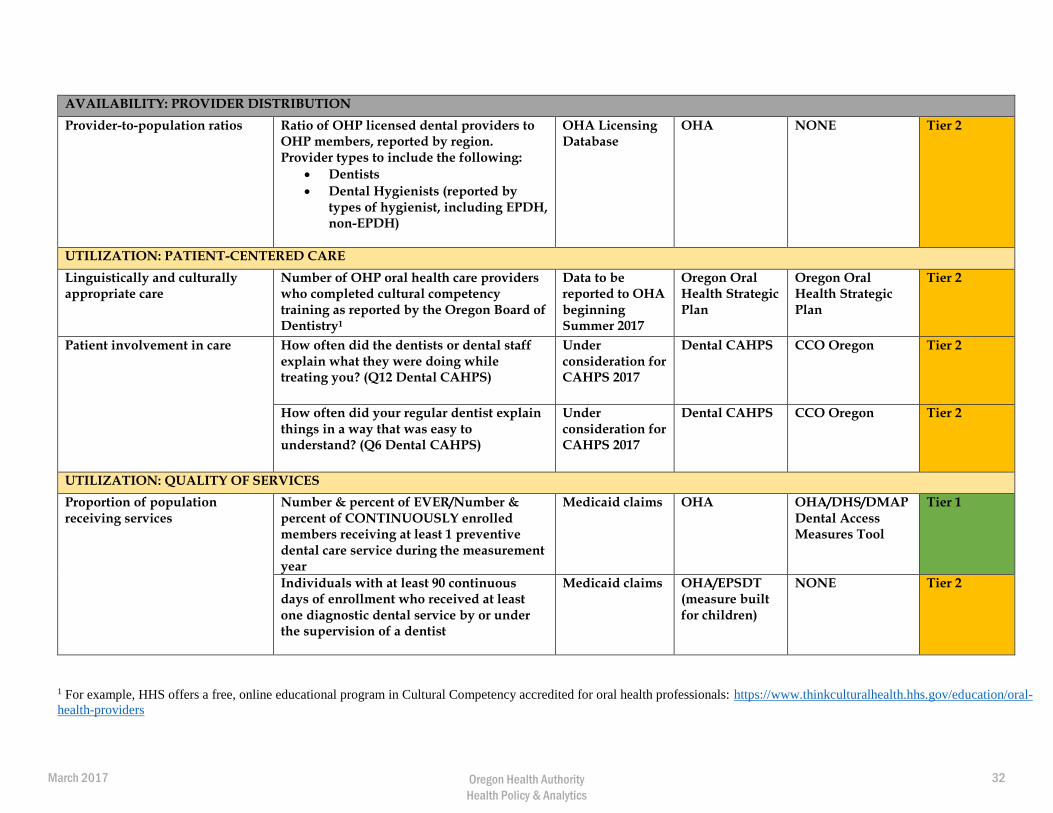
AVAILABILITY: PROVIDER DISTRIBUTION
Provider-to-population ratios Ratio of OHP licensed dental providers to OHP members, reported by region. Provider types to include the following:
Dentists
Dental Hygienists (reported bytypes of hygienist, including EPDH,non-EPDH)
OHA Licensing Database
OHA NONE Tier 2
UTILIZATION: PATIENT-CENTERED CARE
Linguistically and culturally appropriate care
Number of OHP oral health care providers who completed cultural competency training as reported by the Oregon Board of Dentistry1
Data to be reported to OHA beginning Summer 2017
Oregon Oral Health Strategic Plan
Oregon Oral Health Strategic Plan
Tier 2
Patient involvement in care How often did the dentists or dental staff explain what they were doing while treating you? (Q12 Dental CAHPS)
Under consideration for CAHPS 2017
Dental CAHPS CCO Oregon Tier 2
How often did your regular dentist explain things in a way that was easy to understand? (Q6 Dental CAHPS)
Under consideration for CAHPS 2017
Dental CAHPS CCO Oregon Tier 2
UTILIZATION: QUALITY OF SERVICES
Proportion of population receiving services
Number & percent of EVER/Number & percent of CONTINUOUSLY enrolled members receiving at least 1 preventive dental care service during the measurement year
Medicaid claims OHA OHA/DHS/DMAP Dental Access Measures Tool
Tier 1
Individuals with at least 90 continuous days of enrollment who received at least one diagnostic dental service by or under the supervision of a dentist
Medicaid claims OHA/EPSDT (measure built for children)
NONE Tier 2
1 For example, HHS offers a free, online educational program in Cultural Competency accredited for oral health professionals: https://www.thinkculturalhealth.hhs.gov/education/oral-
health-providers
March 2017 Oregon Health Authority Health Policy & Analytics
32
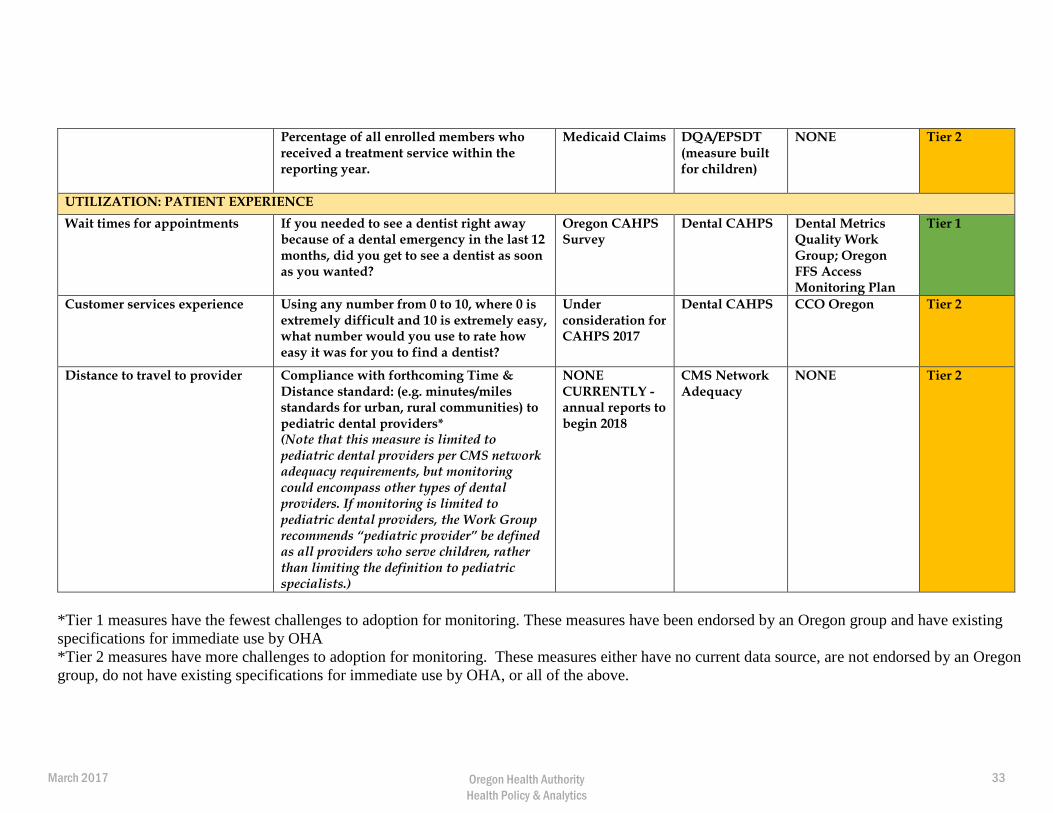
Percentage of all enrolled members who received a treatment service within the reporting year.
Medicaid Claims DQA/EPSDT (measure built for children)
NONE Tier 2
UTILIZATION: PATIENT EXPERIENCE
Wait times for appointments If you needed to see a dentist right away because of a dental emergency in the last 12 months, did you get to see a dentist as soon as you wanted?
Oregon CAHPS Survey
Dental CAHPS Dental Metrics Quality Work Group; Oregon FFS Access Monitoring Plan
Tier 1
Customer services experience Using any number from 0 to 10, where 0 is extremely difficult and 10 is extremely easy, what number would you use to rate how easy it was for you to find a dentist?
Under consideration for CAHPS 2017
Dental CAHPS CCO Oregon Tier 2
Distance to travel to provider Compliance with forthcoming Time & Distance standard: (e.g. minutes/miles standards for urban, rural communities) to pediatric dental providers* (Note that this measure is limited to pediatric dental providers per CMS network adequacy requirements, but monitoring could encompass other types of dental providers. If monitoring is limited to pediatric dental providers, the Work Group recommends “pediatric provider” be defined as all providers who serve children, rather than limiting the definition to pediatric specialists.)
NONE CURRENTLY - annual reports to begin 2018
CMS Network Adequacy
NONE Tier 2
*Tier 1 measures have the fewest challenges to adoption for monitoring. These measures have been endorsed by an Oregon group and have existing
specifications for immediate use by OHA
*Tier 2 measures have more challenges to adoption for monitoring. These measures either have no current data source, are not endorsed by an Oregon
group, do not have existing specifications for immediate use by OHA, or all of the above.
March 2017 Oregon Health Authority Health Policy & Analytics
33
This document can be provided upon request in an alternate format for individuals with disabilities or in a language other than English for people with limited English skills. To request this publication in another format or language, contact the Oregon Health Authority Director's Office at 503-947-2340 or [email protected].
March 2017 Oregon Health Authority Health Policy & Analytics
34