Embed Size (px)
Citation preview
Overconfidence is universal? Depends what you mean
Michael Muthukrishna1, Steven J. Heine
1, Wataru Toyakawa
2,3, Takeshi Hamamura
4,
Tatsuya Kameda5,6
, Joseph Henrich1,7,8
.
1 Department of Psychology, University of British Columbia, 2136 West Mall, Vancouver V6T
1N4 Canada 2 Department of Behavioral Science, Hokkaido University N10W7, Kita-ku, Sapporo, Hokkaido,
060-0810 Japan 3 Japan Society for the Promotion of Science, 8 banchi, 1 ban-cho, Chiyoda-ku, Tokyo, 102-8472
Japan 4 Department of Psychology, The Chinese University of Hong Kong, Shatin, NT, Hong Kong
5 Department of Social Psychology, The University of Tokyo, 7-3-1 Bunkyo-ku, Tokyo, 113-
0033 Japan 6 Center for Experimental Research in Social Sciences, Hokkaido University, N10W7, Kita-ku,
Sapporo, Hokkaido, 060-0810 Japan 7 Vancouver School of Economics, University of British Columbia, 2136 West Mall, Vancouver
V6T 1N4 Canada 8 Canadian Institute for Advanced Research
Word Count: 8900
Correspondence:
Michael Muthukrishna
Department of Psychology
University of British Columbia
2136 West Mall
Vancouver, BC, V6T 1Z4
Canada
OVERCONFIDENCE IS UNIVERSAL? DEPENDS WHAT YOU MEAN 2
Abstract
Overconfidence is often assumed to be a human universal, but there is little research
systematically measuring overconfidence across populations and contexts, and almost no
research measuring overconfidence at an individual rather than population level. We conducted
experiments manipulating domain, task knowledge, and incentives across four populations –
Japanese, Hong Kong Chinese, Euro Canadians, and East Asian Canadians. We measured two
dimensions of overconfidence – placement and precision – at an individual level based on
individual performance. Rather than universal, we find that overconfidence is highly context
dependent, and that previous measures of population-level overconfidence may have been
misleading. These findings have implications for our understanding of the adaptive value of
overconfidence and its role in explaining population-level and individual-level differences in
economic and psychological behavior.
Keywords: overconfidence; self-enhancement; cultural psychology; cognitive biases;
evolutionary psychology
OVERCONFIDENCE IS UNIVERSAL? DEPENDS WHAT YOU MEAN 3
Overconfidence is universal? Depends what you mean
Overconfidence has been described as “one of the most consistent, powerful and
widespread [psychological biases]” (Johnson & Fowler, 2011), with “no problem… more
prevalent and more potentially catastrophic” (Plous, 1993). Overconfident CEOs make poorer
investment and merger decisions (Malmendier & Tate, 2005, 2008), overconfident traders
increase trade volume and lead markets to underreact to relevant information and overreact to
anecdotal information (Odean, 1998), overconfident leaders are more likely to go to war even
when the odds are stacked against them (Johnson, 2009), and overconfident people are more
likely to start a business, even though most businesses fail (Camerer & Lovallo, 1999). On the
other hand, overconfident people take on more ambitious projects, persist in the face of adversity
(Bénabou & Tirole, 2002), and have better mental and physical health (Taylor & Brown, 1988;
Taylor, Kemeny, Reed, Bower, & Gruenewald, 2000). Regardless of whether overconfidence has
a net benefit or cost, the common assumption underlying all these claims is that overconfidence
is universal.
Illustrating this assumption, Johnson and Fowler (2011) published a model of the
evolution of overconfidence. Despite the fact that two equilibria emerged under most conditions
in the model – for either underconfidence or overconfidence, depending on the ratio of benefits
to costs – Johnson and Fowler speculated that humans may have faced a sufficiently high benefit
to cost ratio over the course of human history, such that overconfidence has become a genetic
predisposition.
Researchers in the psychological and the economic sciences have been studying
overconfidence somewhat independently, often not citing work in the others’ discipline. In
psychology, research on the cognitive biases underlying overconfidence goes back to at least the
OVERCONFIDENCE IS UNIVERSAL? DEPENDS WHAT YOU MEAN 4
early 1960s (Adams & Adams, 1961), continuing through the work of researchers such as Frank
Yates and George Wright (Wright et al., 1978; Yates, Lee, & Bush, 1997; Yates, Lee,
Shinotsuka, Patalano, & Sieck, 1998; Yates et al., 1989). A separate but overlapping body of
psychological research focused on the motivational aspects of overconfidence. This motivational
bias, referred to as self-enhancement – the bias toward viewing the self positively – has its roots
in early research on the self and self-esteem (Greenwald, 1980; Heine, Lehman, Markus, &
Kitayama, 1999; Taylor & Brown, 1988). More recently, economists have been drawing on and
extending the early psychological work on the cognitive biases underlying overconfidence, but
have largely ignored this parallel research on self-enhancement and motivational biases
underlying overconfidence. Rather than universal, the broad body of research on this topic
suggests that overconfidence is highly variable, varying by age (Ortoleva & Snowberg, 2012),
gender (Barber & Odean, 2001; Beyer & Bowden, 1997; Chuang & Wang, 2005; Lenney, 1977;
Lundeberg, Fox, & Punćcohaŕ, 1994; Ortoleva & Snowberg, 2012), population (Heine &
Hamamura, 2007; Heine et al., 1999; Svenson, 1981; Whitcomb, Önkal, Curley, & George
Benson, 1995; Wright et al., 1978; Yates et al., 1997; Yates et al., 1998; Yates et al., 1989),
domain content (Beyer & Bowden, 1997; Dunning, 1995; Lichtenstein & Fischhoff, 1977;
Lundeberg et al., 1994), and domain context (Lenney, 1977; Yamagishi et al., 2012), sometimes
disappearing altogether or being replaced by underconfidence (Gigerenzer, Hoffrage, &
Kleinbölting, 1991; Heine, 2005; Heine & Hamamura, 2007) and with interactions across several
of these predictors.
For population differences, much research has suggested that East Asian populations are
far less overconfident than Westerners, and sometimes even demonstrate striking
underconfidence or self-criticism as opposed to self-enhancement (Heine, Takata, & Lehman,
OVERCONFIDENCE IS UNIVERSAL? DEPENDS WHAT YOU MEAN 5
2000; Kitayama, Markus, Matsumoto, & Norasakkunkit, 1997). Moreover, these population
differences have also been identified using measures that have employed hidden behavioral
measures, or measure the overly positive assessments indirectly, indicating that the population
difference is not merely the product of self-presentation motives (Falk & Heine, 2014; Heine et
al., 2000). In sum, the universality of overconfidence is difficult to assess, given that its
magnitude appears so differently across studies.
Part of the difficulty in interpreting these results is that although researchers regularly use
the term “overconfidence”, they often mean very different things. Moore and Healy (2008)
provide a useful set of definitions for different overconfidence concepts:
1) Overestimation is the belief that you are better than you really are compared to an
objective standard (e.g. believing you can consistently perform a flawless parallel park,
when in reality you get it right 3 times out of 10).
2) Overplacement is the belief that you are better than more people than you really are (e.g.
most drivers believe they are better than average, so statistically at least some of these
drivers must have overplacement).
3) Finally, overprecision is having more confidence in your beliefs than is justified (e.g.
being 90% certain that you’re a better driver than average when you don’t have enough
data to ascribe that level of certainty).
Each of these forms of overconfidence may be driven by both motivational factors (such
as wanting to view yourself positively; e.g. Hamamura, Heine, & Takemoto, 2007; Taylor &
Brown, 1988) and cognitive factors (such as the availability bias or an inability to represent
distributions; e.g. Klar & Giladi, 1997; Miller & Ross, 1975). The term self-enhancement, which
generally refers to the motivation to view oneself positively rather than negatively, particularly
OVERCONFIDENCE IS UNIVERSAL? DEPENDS WHAT YOU MEAN 6
compared to other people (Heine et al., 1999), may underlie overestimation and overplacement
(but likely not overprecision, given that the self-enhancement literature has largely focused on
how positively people compare themselves to others and not on the confidence that they have in
the precision of their evaluations).
Although different definitions, and sometimes equivocation, may help explain some of
the diverse results found in the literature, a related and equally challenging issue is that the same
concepts may be operationalized in very different ways. Measuring overconfidence can be
difficult and many researchers choose to use aggregate comparisons to judge overconfidence.
For example, in the classic Better than Average effect, researchers claim high overconfidence
when “93% of drivers claim to be above average”. But of course, many of those who claim to be
better than average may actually be better than average, and conversely these results may hide
extreme overconfidence, where those who are truly better than average claim less confidence
than those who are worse than average (Kruger & Dunning, 1999). Further, people don’t really
seem to be able to conjure up what “average” means in the first place (Klar & Giladi, 1997).
Despite these difficulties, the broader literature presents the intriguing possibility that
overconfidence may vary across populations, perhaps due to the differential costs and benefits
created by the specific physical and social environments (Johnson & Fowler, 2011). Many
factors can create psychological differences between populations (Chudek, Muthukrishna, &
Henrich, in press; Henrich, Heine, & Norenzayan, 2010a, 2010b) and these factors may moderate
many of the predictors of overconfidence. For example, in competition, a fomenter of
overconfidence, gender differences in choosing to compete were opposite between patrilineal
and matrilineal social structures (Gneezy, Leonard, & List, 2009). If populations do
systematically vary in overconfidence, this may help explain differences in innovation rates
OVERCONFIDENCE IS UNIVERSAL? DEPENDS WHAT YOU MEAN 7
(Shane, Venkataraman, & MacMillan, 1995). From a different angle, even when overconfidence
is costly for the individual, whose business is likely to fail, it may be beneficial for the society,
since the businesses that do succeed give the society a competitive advantage against other
societies, allowing overconfidence (or underconfidence) to evolve via cultural evolution driven
by intergroup competition.
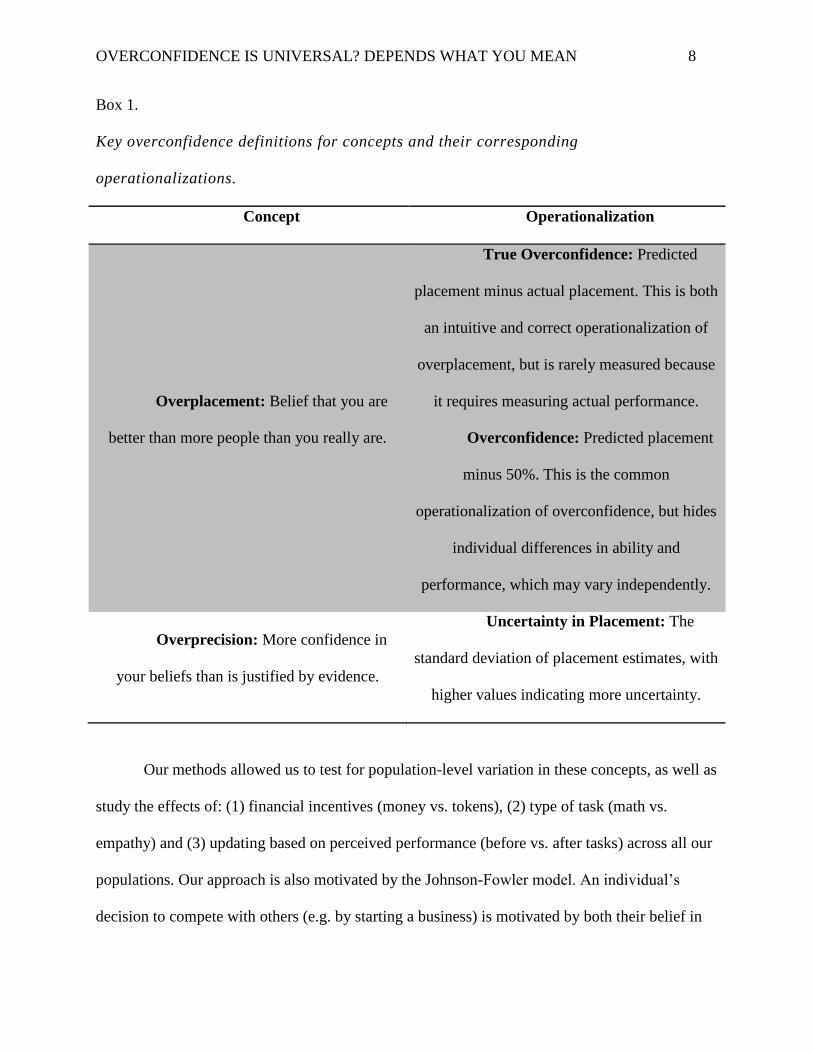
In the present set of studies, we attempted to test several theoretical and empirical claims
and bring some order to the literature using specific and precise operationalizations of
overconfidence. To do this, we ran a large, cross-population study in Japan, Hong Kong, and
Canada, focusing on the concepts of overplacement and overprecision and measured several
variables which have been previously found to predict overconfidence. Unique to our paper, we
compared people’s self-assessments to their actual performance, using a novel design, under
conditions where they were or were not incentivized for accuracy in performance judgments in
both concrete and ambiguous tasks, and we measured these judgments both before and after
participants completed the tasks. We will refer to the operationalization of overplacement as
overconfidence, from herein, and distinguish Overconfidence as traditionally measured –
predicted placement above the population mean – from True Overconfidence – predicted
placement above actual placement. We will use capital letters, as in the previous sentence, to
distinguish these specific operationalizations from the more general usage of the term
overconfidence. We will refer to the operationalization of overprecision as Uncertainty in
Placement. We focus on uncertainty rather than certainty, because we have no way of measuring
what accurate precision would be to know if someone is overprecise. Instead, we measure
relative uncertainty from completely certain to completely uncertain. These concepts and their
corresponding operationalizations are summarized in Box 1.
OVERCONFIDENCE IS UNIVERSAL? DEPENDS WHAT YOU MEAN 8
Box 1.
Key overconfidence definitions for concepts and their corresponding
operationalizations.
Concept Operationalization
Overplacement: Belief that you are
better than more people than you really are.
True Overconfidence: Predicted
placement minus actual placement. This is both
an intuitive and correct operationalization of
overplacement, but is rarely measured because
it requires measuring actual performance.
Overconfidence: Predicted placement
minus 50%. This is the common
operationalization of overconfidence, but hides
individual differences in ability and
performance, which may vary independently.
Overprecision: More confidence in
your beliefs than is justified by evidence.
Uncertainty in Placement: The
standard deviation of placement estimates, with
higher values indicating more uncertainty.
Our methods allowed us to test for population-level variation in these concepts, as well as
study the effects of: (1) financial incentives (money vs. tokens), (2) type of task (math vs.
empathy) and (3) updating based on perceived performance (before vs. after tasks) across all our
populations. Our approach is also motivated by the Johnson-Fowler model. An individual’s
decision to compete with others (e.g. by starting a business) is motivated by both their belief in
OVERCONFIDENCE IS UNIVERSAL? DEPENDS WHAT YOU MEAN 9
placement and uncertainty about this belief. For example, someone with high overconfidence and
low uncertainty is more likely to start a business (an entrepreneur) than someone high in both
overconfidence and uncertainty (a “wantrepreneur”), who may not risk as much. On the other
hand, someone low in overconfidence and low uncertainty would almost certainly not start a
business (salaried worker), but someone low in overconfidence, but high in uncertainty may seek
out more information to reduce their uncertainty before making the decision, or may not risk as
much.
Our operationalizations are novel and arguably closer to their underlying concepts than
previous work. However, we have included the more commonly used operationalizations so as to
compare our findings to this previous research. To the degree that our operationalizations
concord with the operationalizations used in earlier work, we can use previous findings to guide
our expectations. Earlier work suggests that European Canadians/Americans would show higher
overconfidence compared to our Japanese sample and Chinese sample (Heine & Hamamura,
2007), but higher uncertainty than the Chinese sample (Yates et al., 1998), which we expected to
replicate here. We expected that participants would show less overconfidence after taking the test
(Lenney, 1977) and more overconfidence for the more uncertain and ambiguous task (empathy)
compared to the more concrete task (math) (Dunning, Meyerowitz, & Holzberg, 1989). We
expected that incentives would increase the motivation for accuracy at the expense of
motivations to feel positive about the self, motivations for self-presentation, or motivations for
self-improvement. The few incentivized past results have suggested that Chinese were unaffected
by incentives and Americans became more overconfident (Yates et al., 1997) or were unaffected
(Williams & Gilovich, 2008) and that American men were unaffected, but Japanese men and
both Japanese and American women became overconfident (Yamagishi et al., 2012). However,
OVERCONFIDENCE IS UNIVERSAL? DEPENDS WHAT YOU MEAN 10
these were single studies with very different operationalizations and in the case of Yamagishi et
al. (2012), population-level aggregates were used in one study, and in the other study the
incentivized measurements were taken 8 months later, making it difficult to disentangle temporal
changes from the effect of incentives and compare it to the present study. Past research with
behavioral and indirect measures of overconfidence largely replicates the population differences
found in explicit self-report measures (for a review see Falk & Heine, 2014). Finally, based on
past work, we expected that males (Barber & Odean, 2001; Beyer & Bowden, 1997; Chuang &
Wang, 2005; Lenney, 1977; Lundeberg et al., 1994; Ortoleva & Snowberg, 2012) would show
more overconfidence , as would older people (Ortoleva & Snowberg, 2012). We had fewer
expectations about Uncertainty in Placement, since its measurement was quite different than in
past studies.
Our findings reveal that, rather than universal, levels of overconfidence and uncertainty
vary considerably by task, population, feedback from taking the test, incentives, and gender, with
interactions between these variables. In some cases, results differ depending on whether
Overconfidence or True Overconfidence is measured, highlighting the importance of not using
aggregate-level measures.
Method
Undergraduate students at the University of Hokkaido, Japan, the Chinese University of
Hong Kong, and the University of British Columbia in Canada predicted their performance
relative to other participants and we compared these to their actual performance (as well as to the
50th percentile, to compare with past research). Participants took two tests: a math test, for which
they should have high self-knowledge and where performance should be less ambiguous, and an
empathy test, for which they should have less self-knowledge and where performance should be
OVERCONFIDENCE IS UNIVERSAL? DEPENDS WHAT YOU MEAN 11
more ambiguous. Participants made predictions for their relative performance before and after
taking the tests. In addition, participants were also randomly assigned to either be incentivized
(using coins) or not incentivized (using tokens) for the accuracy of placement estimates.
Participants estimated their relative placement by distributing 10 coins or 10 tokens over 10
deciles, a novel and intuitive method of eliciting placement, which should be less susceptible to
response bias. Participants kept coins that were in the true performance decile. These methods
allowed us to measure Overconfidence (based on the coin/token central tendency or point
estimates), True Overconfidence (based on the coin/token central tendency or point estimates
combined with actual performance) and Uncertainty in Placement (based on the coin/token
spread measures).
Procedure
All instructions were provided using a standardized script to ensure that all participants
received the same information in the same way. We translated the Chinese and Japanese scripts
from the English scripts using a back-translation method (Brislin, 1970).
We began by collecting 20 pilot participants in the unincentivized (token) condition.
These participants were not used in our analyses, but were used as a baseline to calculate
percentiles and deciles in each population. We split our Canadian sample into those of European
and East Asian origin, however, these participants were told that they were competing against
other participants in the experiment, which included Canadians of both ethnic backgrounds.
Accordingly, we calculated performance relative to all Canadians rather than within their ethnic
group, although results did not differ when performance was measured relative to co-ethnics.
Our Canadian sample was prescreened for these two ethnic backgrounds.
OVERCONFIDENCE IS UNIVERSAL? DEPENDS WHAT YOU MEAN 12
All non-pilot participants were randomly assigned to either the incentivized (money) or
unincentivized (token) condition. The order in which the two tests were administered (math first
vs. empathy first) was also randomized, as were the questions within these computerized tests.
Participants in all conditions were informed that they would get an entry into a lottery for
every answer they got correct in both tests. The winner of the lottery was paid
CAD100/HKD1000/JPY10,000. Participants in the money condition were further incentivized
for accuracy in their relative performance on the tests. Participants in each country were given 10
coins of roughly comparable value (i.e. 10 CAD1/HKD10/JPY100 coins). To win this money,
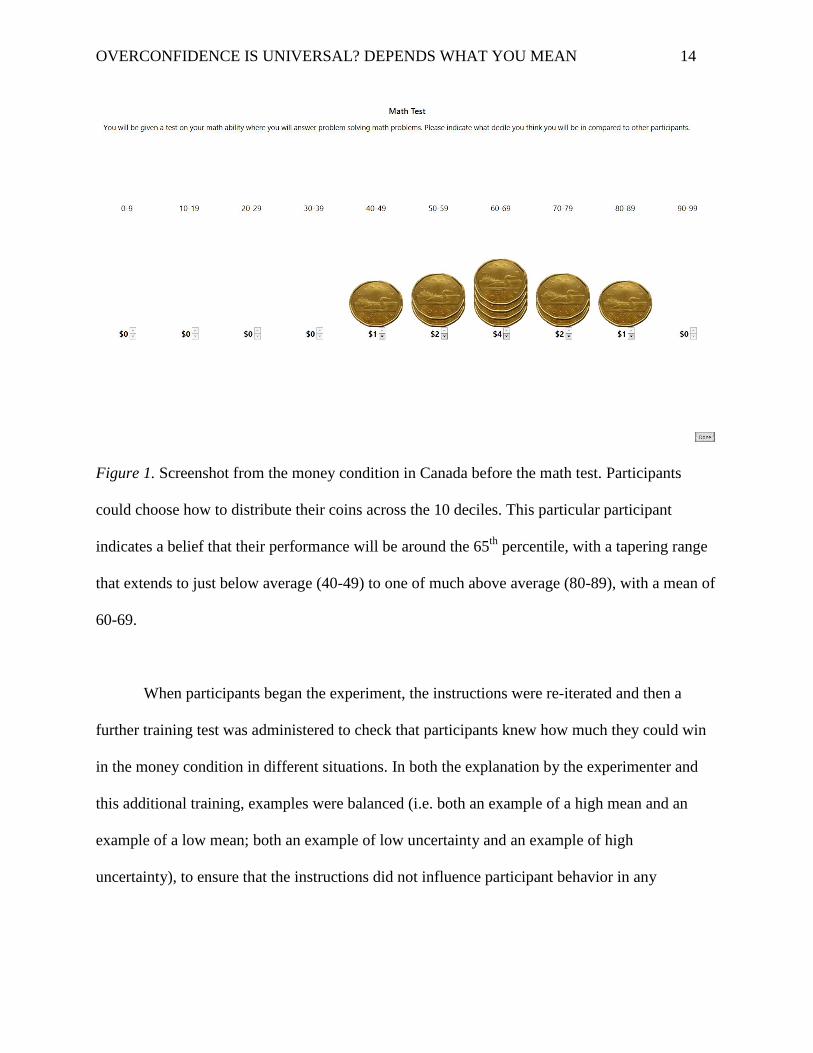
participants could place their 10 coins in any way they wanted across the 10 deciles (see Figure
1). They performed this task with 10 coins both before and after each test and were told that they
would be paid the money in the decile that matched their relative performance for 1 of these 4
occasions. By randomly paying for only 1 of these 4 occasions, participants were incentivized to
maximize payoffs on all occasions, without “wealth effects”, where participants behaved
differently later in the experiment based on their estimates of how much they had already won,
reducing incentives. At the end of the study, participants drew a number from a box, which
corresponded to 1 of these 4 times a placement estimate was made. So in the case of the example
in Figure 1, this participant would win $4 if their performance was actually in the 60-69 decile,
$2 if it was in either the 50-59 or 70-79 deciles, $1 if it was in either the 40-49 or 80-89 deciles,
and zero if their performance was less than the 40-49 decile or in the 90-99 decile. This incentive
for accuracy in placement was in addition to the incentive for performing well on the tests. For
the purposes of paying participants, relative performance was calculated using the data from all
prior participants, including the pilot group. For the purposes of analysis, relative performance
was calculated on the complete sample of non-pilot data after exclusions. Participants were thus
OVERCONFIDENCE IS UNIVERSAL? DEPENDS WHAT YOU MEAN 13
incentivized to perform as well as possible in the two tests in both the money and token
conditions, and were incentivized to give an accurate estimate of their relative performance in
the money condition. In the token condition, coins were replaced with 10 tokens and no mention
was made about winning money in this way. The decile measure allowed us to measure both (1)
how participants believed they compared to their peers (an index of overplacement) and (2) how
confident they were in this belief (an index of uncertainty), by looking at the mean and standard
deviation of the decile distribution, respectively.
Since the decile measure was novel, participants were trained using a cardboard decile
grid and 10 real coins or tokens. After training participants were asked questions, which they had
to get correct to continue. These included: (1) who are you competing with? (2) What is a decile?
And (3) How can you win money?. If the participant got any of these questions wrong, the
relevant part of the script was re-read and the questions were asked again.
OVERCONFIDENCE IS UNIVERSAL? DEPENDS WHAT YOU MEAN 14
Figure 1. Screenshot from the money condition in Canada before the math test. Participants
could choose how to distribute their coins across the 10 deciles. This particular participant
indicates a belief that their performance will be around the 65th
percentile, with a tapering range
that extends to just below average (40-49) to one of much above average (80-89), with a mean of
60-69.
When participants began the experiment, the instructions were re-iterated and then a
further training test was administered to check that participants knew how much they could win
in the money condition in different situations. In both the explanation by the experimenter and
this additional training, examples were balanced (i.e. both an example of a high mean and an
example of a low mean; both an example of low uncertainty and an example of high
uncertainty), to ensure that the instructions did not influence participant behavior in any
OVERCONFIDENCE IS UNIVERSAL? DEPENDS WHAT YOU MEAN 15
particular direction. Participants then indicated their placement using the decile grid method
before taking the first test.
The math test consisted of 30 multiple choice word problems taken from the quantitative
section of practice Graduate Record Examinations (GREs), presented in a random order.
Participants were given 20 minutes to complete this task. The empathy test consisted of the 72
questions comprised of the 36 question “Revised Reading the Mind in the Eyes” test (Baron‐
Cohen, Wheelwright, Hill, Raste, & Plumb, 2001), which only had European eyes, and the 36
Asian (Japanese) eyes version of this test (Adams Jr et al., 2010), with questions presented in
random order. Thus, all participants judged the eyes of both their own-race and the other race (at
least at the coarse level of European vs. Asian eyes). The empathy test was untimed.
After the first test and corresponding placement estimates, participants were given several
measures. They were given two measures that have reliably distinguished East Asian and
Western samples in past research in terms of their self-enhancement: the Rosenberg Self-Esteem
scale (Rosenberg, 1965), which assesses overall positivity of the self-concept, and the False
Uniqueness Task (Campbell, 1986), which assesses how people evaluate their placement
compared to their same-sex peers from their university, in terms of 10 abstract traits. These two
tasks will allow us to compare how the present samples compare with those used in previous
studies. Participants also completed the Big 5 Personality Inventory (John, Donahue, & Kentle,
1991; John, Naumann, & Soto, 2008) and the Prestige and Dominance scale (Cheng, Tracy, &
Henrich, 2010). Participants then took the second test with corresponding placement
measurements, after which they completed further measures: the Self-Construal scale (Singelis,
1994), and several demographic questions. In the Canadian sample, made up of two subsamples,
the demographic questions included measures of length of time in Canada and acculturation
OVERCONFIDENCE IS UNIVERSAL? DEPENDS WHAT YOU MEAN 16
(Identity Fusion Scale; Aron, Aron, & Smollan, 1992; Vancouver Index of Acculturation; Ryder,
Alden, & Paulhus, 2000).
Participants were then debriefed and those in the money condition were paid. The
winners of the CAD100, HKD1000, and JPY10,000 were paid after data collection was
completed.
Participants
The sample consists of undergraduate students at the University of Hokkaido, the
Chinese University of Hong Kong, and the University of British Columbia. The Canadian
sample was further divided into those who were of European or East Asian ancestry. All data
herein refers to non-pilot data (i.e. those collected after the first 20 from each university).
Participants were excluded for one of three reasons: (1) Technical errors, when data wasn’t saved
or the participant accidentally started the tests without receiving instructions; (2) Failed vigilance
checks, when participants failed to correctly answer a vigilance check question such as “Please
click ‘Not at all’”; and (3) Exploiting the system, defined as putting all their money in the lowest
decile and then performing at levels significantly below chance. We hoped that incentivizing
performance on the two tests, would prevent participants from exploiting the game in this way
and except for 4 cases, this seemed to be the case. Table 1 reports the total data collected, all
exclusions, and age and gender information. Canadian exclusions are reported together as
technical issues prevented us from knowing ethnicity in some cases.
OVERCONFIDENCE IS UNIVERSAL? DEPENDS WHAT YOU MEAN 17
Table 1.
Demographic details for all non-pilot participants.
European
Canadian
East Asian
Canadian
Hong Kong
Chinese
Japanese
Total Collected 145 128 100
Excluded Technical 6 5 6
Excluded Vigilance 10 13 10
Excluded Exploit 0 1 3
Total Analyzed 66 63 109 81
Age Mean 20.52 20.43 20.55 19.10
SD 2.69 4.13 1.83 0.93
Gender Female 34 33 59 28
Male 32 30 50 53
Results
Comparability of Present Samples to Past Samples of Self-Enhancement Measures
First, we note how our samples compared with those used in past research on self-
enhancement, to discern whether our samples are unusual on relevant variables. The Rosenberg
Self-Esteem scale and the False Uniqueness Task are routinely used in the self-enhancement
literature and so we included these to give us a basis to compare our samples (insofar as
exposure to our measures don’t change behavior). A meta-analysis of past research has found
that East Asian and Western samples differ on these two measures with effect sizes of d = .94
and d = 1.2 (whereas Westerners differ from East Asian Americans with effect sizes of d = .32
and d = .53), for the Rosenberg and False Uniqueness Tasks, respectively (Heine & Hamamura,
2007). For comparison, we regress these same measures on the dummy codes of each sample
with European Canadians set as the reference group. We report the beta coefficients in Table 2
below.
OVERCONFIDENCE IS UNIVERSAL? DEPENDS WHAT YOU MEAN 18
Table 2.
Standardized differences between Western population (European Canadians in our
experiment) and other populations based on a meta-analysis and in our sample. Self-
esteem results are largely in the same direction as the meta-analysis, although East
Asian Canadians are not significantly different to European Canadians. False
Uniqueness results are in the opposite direction to past results for East Asian
Canadians and Hong Kong Chinese, significantly so in the latter, but comparable to
past results for the Japanese.
Self-
enhancement
Measure
East Asian –
Western
(Meta-
analysis)
East Asian
Americans –
Western
(Meta-
analysis)
East Asian
Canadians –
Euro-
Canadians
Hong Kong
Chinese –
Euro-
Canadians
Japanese –
Euro-
Canadians
Rosenberg
Self-Esteem -0.94 -.32
-0.19
[-0.50, 0.12],
p=.231
-0.56
[-0.83, -0.27],
p<.001
-1.21
[-1.51, -0.92],
p<.001
False
Uniqueness
Task
-1.16 -.53
0.21
[-0.11, 0.52],
p=.194
0.50
[0.23, 0.78],
p<.001
-0.64
[-0.93, -0.34],
p<.001
Our East Asian Canadian population are more self-enhancing than is typically measured
and are mostly indistinguishable from the European Canadians. The Hong Kong Chinese are
somewhere in-between typical self-esteem measures for East Asian Americans and East Asians
compared to Westerners, but in the same direction, but are higher on False Uniqueness, a
reversal of past results. The Japanese have self-esteem and false uniqueness results in the same
direction, and of roughly the same magnitude. These results make it difficult to compare our East
Asian Canadian and Hong Kong Chinese sample to previous self-enhancement results, but our
Japanese sample is quite similar to past samples, increasing our confidence in the generalizability
OVERCONFIDENCE IS UNIVERSAL? DEPENDS WHAT YOU MEAN 19
of those findings. In the next section, we correlate all of our different measures of self-
enhancement overconfidence, and uncertainty in placement.
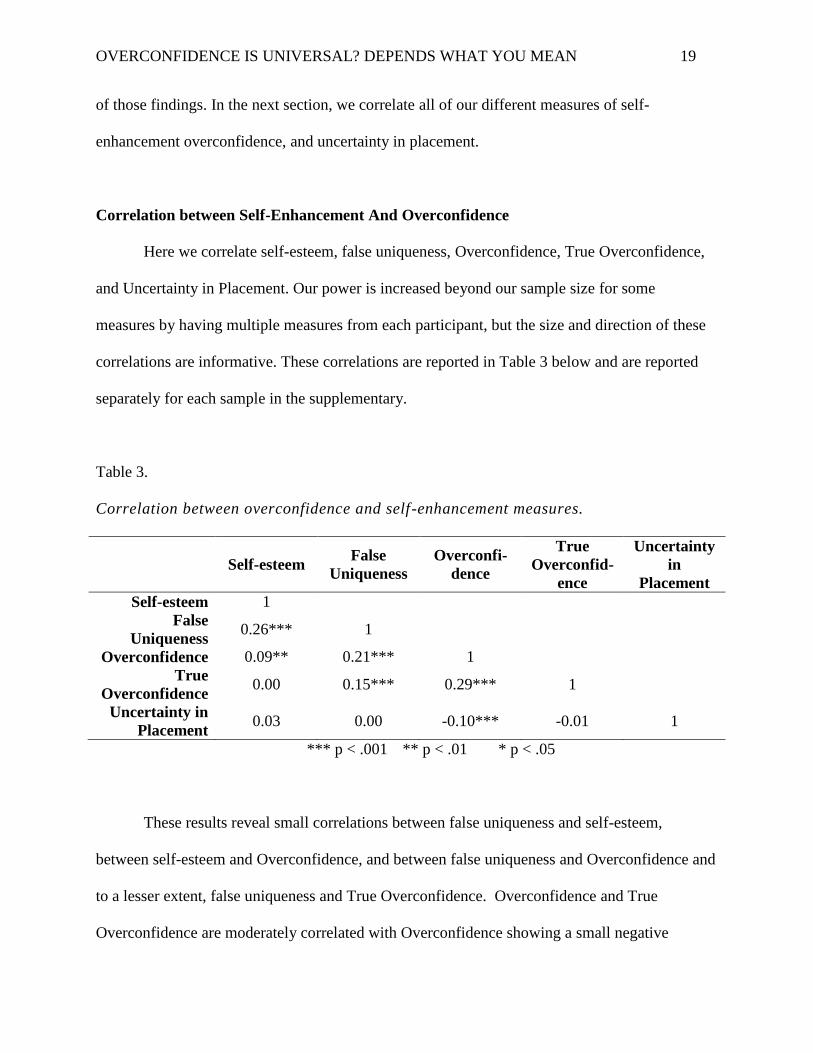
Correlation between Self-Enhancement And Overconfidence
Here we correlate self-esteem, false uniqueness, Overconfidence, True Overconfidence,
and Uncertainty in Placement. Our power is increased beyond our sample size for some
measures by having multiple measures from each participant, but the size and direction of these
correlations are informative. These correlations are reported in Table 3 below and are reported
separately for each sample in the supplementary.
Table 3.
Correlation between overconfidence and self-enhancement measures.
Self-esteem False
Uniqueness
Overconfi-
dence
True
Overconfid-
ence
Uncertainty
in
Placement
Self-esteem 1
False
Uniqueness 0.26*** 1
Overconfidence 0.09** 0.21*** 1
True
Overconfidence 0.00 0.15*** 0.29*** 1
Uncertainty in
Placement 0.03 0.00 -0.10*** -0.01 1
*** p < .001 ** p < .01 * p < .05
These results reveal small correlations between false uniqueness and self-esteem,
between self-esteem and Overconfidence, and between false uniqueness and Overconfidence and
to a lesser extent, false uniqueness and True Overconfidence. Overconfidence and True
Overconfidence are moderately correlated with Overconfidence showing a small negative
OVERCONFIDENCE IS UNIVERSAL? DEPENDS WHAT YOU MEAN 20
correlation with uncertainty in placement (i.e. lower uncertainty is associated with higher
confidence). This indicates two important things. First, our measures of overconfidence and
uncertainty in placement reveal only a weak relationship with standard measures used for self-
enhancement, and our measures of uncertainty in placement and overconfidence are largely
independent constructs. In the next section we discuss our main approach to analyzing these data.
Analysis of primary measures
Here we present our strategy for analyzing how our key predictors – task type (math vs.
empathy), incentives (money vs. tokens), feedback (before vs. after), and population (European
Canadian, East Asian Canadian, Hong Kong Chinese, and Japanese) – affect Overconfidence,
True Overconfidence, and Uncertainty in Placement. We also calculated a “reward for accuracy”
– which assesses how effective the combinations of True Overconfidence and Uncertainty in
Placement were in generating payoffs.
Predicted placement was defined as the mean of the distribution of coins or tokens in
deciles. Overconfidence, consistent with past operationalizations, is 50% subtracted from this
mean, whereas True Overconfidence, is the actual performance placement based on relative
performance, subtracted from this mean. By these measures 0 would indicate no bias, a negative
value indicates an underconfident bias, and a positive value an overconfident bias. We
operationalize Uncertainty in Placement as the standard deviation of the decile spread. Higher
values of the decile spread indicate more uncertainty.1
1 Immediately after participants made their decile estimates, we asked them what percentile they thought
they would score in, how certain they were that this was the percentile that they would score in, and, then for a
comparable decile measure, how certain they were that they would score 5% on either side of this percentile. We
used the percentile estimate (which was not incentivized) to calculate a True Percentile Overconfidence by
subtracting the participant’s percentile based on performance. The correlation between True Overconfidence and
True Percentile Overconfidence was large and significant (range from .94 to .97 within each sample). The
correlation between Uncertainty in Placement and the point estimate equivalent were in the right direction, but much
OVERCONFIDENCE IS UNIVERSAL? DEPENDS WHAT YOU MEAN 21
To analyze the effect of our manipulations, we regressed Overconfidence, True
Overconfidence and Uncertainty in Placement on our key predictors – task type (math vs.
empathy), incentives (money vs. tokens), and feedback (before vs. after) using an OLS
regression, looking at each population separately. We use clustered robust standard errors to
control for the common variance associated with each participant providing us with 4 data points
(before and after the two tasks).
The intercepts of these regressions tell us the overconfidence and uncertainty when our
predictors are 0. Based on our coding, this is the unincentivized empathy test before feedback.
The coefficient of each predictor then tells us how the predictor increases or decreases
overconfidence compared to this baseline condition.
We select unincentivized empathy before feedback as the baseline since this most closely
resembles the conditions in which overconfidence or self-enhancement has been measured in the
past – an ambiguous task, without incentives for accuracy, and without feedback. From this
starting point, we will then gradually add layers of complexity as we examine the effect of
feedback, task type, and incentives in four different populations. Finally, we discuss gender
effects. We repeat this process for uncertainty in placement.
After going through these main results, we calculate “reward for accuracy” – how the
strategies found in each population affected their payoffs.
smaller (range from -.03 to -.25; it was a significant correlation for all groups except the East Asian Canadians).
This suggests that people may find it difficult to assign a probability to their confidence in placement. For the East
Asian Canadians it was effectively uncorrelated. Since the point estimate and decile estimate of True
Overconfidence were so highly correlated, and because the percentile estimate was not incentivized and is thus
harder to interpret, we focus our analyses on the richer and less explicit measure of both overconfidence and
uncertainty given by the decile measures.
OVERCONFIDENCE IS UNIVERSAL? DEPENDS WHAT YOU MEAN 22
Overconfidence and True Overconfidence
We begin by looking at how Overconfidence and True Overconfidence differ by task and
incentives, before and after performing the task. We plot the raw means for each sample, for
each cell of our design with 95% confidence intervals to allow for comparisons between means.
Let’s start with our baseline condition – empathy with incentives for accurate predicted
placement.
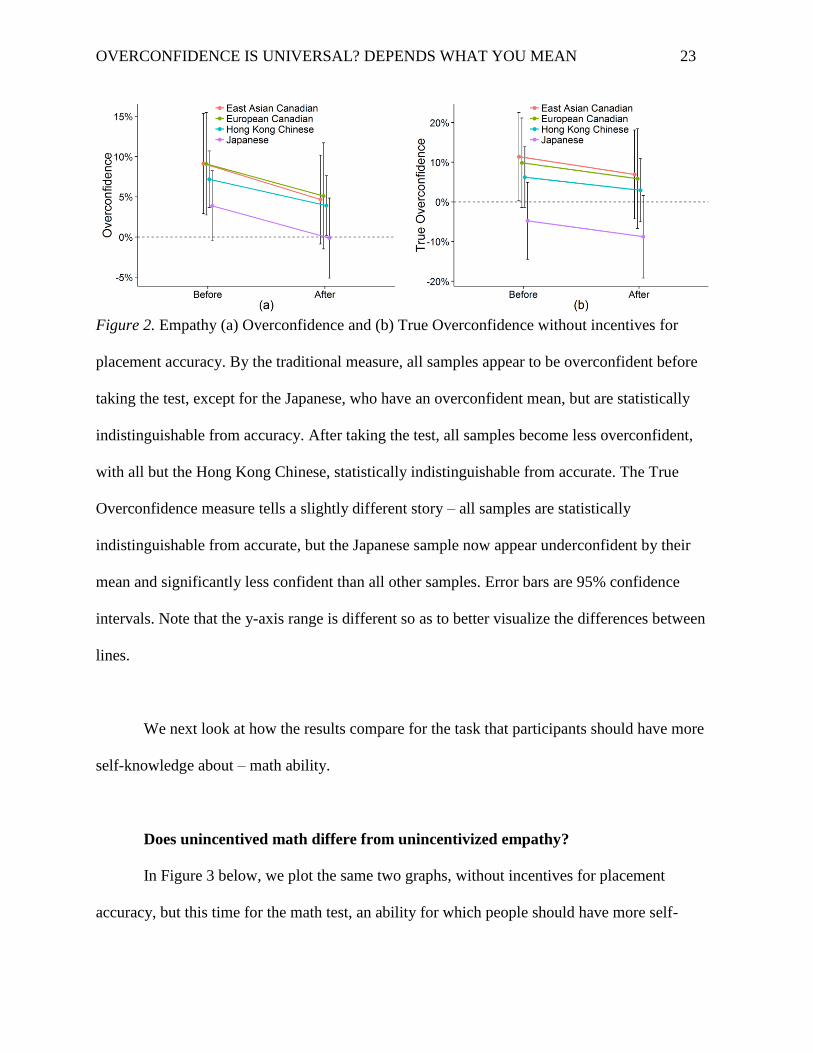
Unincentivized Empathy
In Figure 2 below, we plot Overconfidence – predicted performance minus 50% - and
True Overconfidence - predicted performance minus true performance - for each sample before
and after taking the empathy test with no incentives for accuracy in placement. By both measures
of overconfidence, we find that all samples update their predictions after taking the tests, with
almost identical slopes towards less confidence. By the traditional overconfidence measure
(Figure 2a), all but the Japanese are significantly overconfident. The Japanese also appear
overconfident, but are statistically indistinguishable from unbiased estimates (0%). After taking
the test, all groups update towards less confidence, such that all but the Hong Kong participants
are statistically indistinguishable from accurate. When we consider actual performance in the
True Overconfidence measure, the order of the samples is the same, but the measures are
different. Here, the Japanese are actually underconfident and significantly less confident than all
other groups, who have a mean above accurate.
OVERCONFIDENCE IS UNIVERSAL? DEPENDS WHAT YOU MEAN 23
Figure 2. Empathy (a) Overconfidence and (b) True Overconfidence without incentives for
placement accuracy. By the traditional measure, all samples appear to be overconfident before
taking the test, except for the Japanese, who have an overconfident mean, but are statistically
indistinguishable from accuracy. After taking the test, all samples become less overconfident,
with all but the Hong Kong Chinese, statistically indistinguishable from accurate. The True
Overconfidence measure tells a slightly different story – all samples are statistically
indistinguishable from accurate, but the Japanese sample now appear underconfident by their
mean and significantly less confident than all other samples. Error bars are 95% confidence
intervals. Note that the y-axis range is different so as to better visualize the differences between
lines.
We next look at how the results compare for the task that participants should have more
self-knowledge about – math ability.
Does unincentived math differe from unincentivized empathy?
In Figure 3 below, we plot the same two graphs, without incentives for placement
accuracy, but this time for the math test, an ability for which people should have more self-
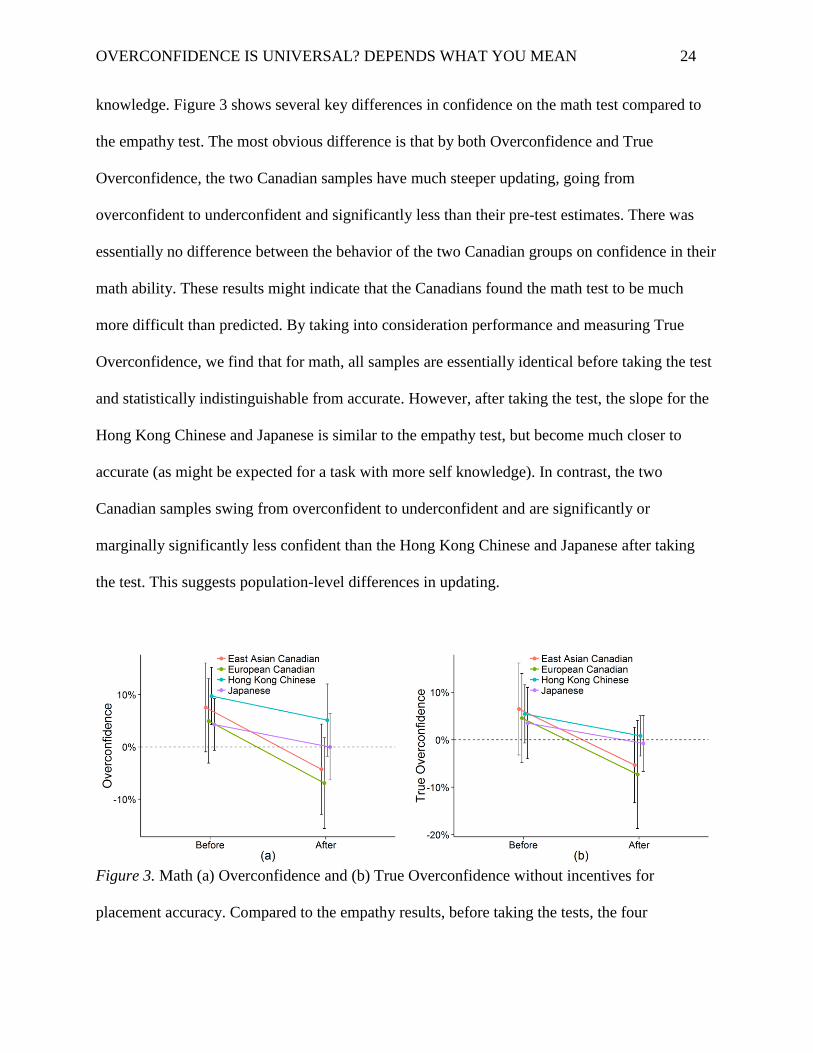
OVERCONFIDENCE IS UNIVERSAL? DEPENDS WHAT YOU MEAN 24
knowledge. Figure 3 shows several key differences in confidence on the math test compared to
the empathy test. The most obvious difference is that by both Overconfidence and True
Overconfidence, the two Canadian samples have much steeper updating, going from
overconfident to underconfident and significantly less than their pre-test estimates. There was
essentially no difference between the behavior of the two Canadian groups on confidence in their
math ability. These results might indicate that the Canadians found the math test to be much
more difficult than predicted. By taking into consideration performance and measuring True
Overconfidence, we find that for math, all samples are essentially identical before taking the test
and statistically indistinguishable from accurate. However, after taking the test, the slope for the
Hong Kong Chinese and Japanese is similar to the empathy test, but become much closer to
accurate (as might be expected for a task with more self knowledge). In contrast, the two
Canadian samples swing from overconfident to underconfident and are significantly or
marginally significantly less confident than the Hong Kong Chinese and Japanese after taking
the test. This suggests population-level differences in updating.
Figure 3. Math (a) Overconfidence and (b) True Overconfidence without incentives for
placement accuracy. Compared to the empathy results, before taking the tests, the four
OVERCONFIDENCE IS UNIVERSAL? DEPENDS WHAT YOU MEAN 25
populations are much closer to each other in the size of overconfidence. After taking the test, the
Japanese are accurate by both measures, but Hong Kong Chinese are accurate only by True
Overconfidence, where their behavior is almost identical to the Japanese. We see a substantial
drop in confidence by both measures among both Canadian groups to underconfidence and true
underconfidence. Error bars are 95% confidence intervals.
Under no incentives for accurate placement estimates, the pattern of results in the math
test compared to the empathy test are largely the same, except that people are more accurate in
the math test and Canadians go from slightly overconfident to slightly underconfident after
taking the test. We next look at whether incentives for accuracy affect these results in both tests.
Do incentives affect overconfidence?
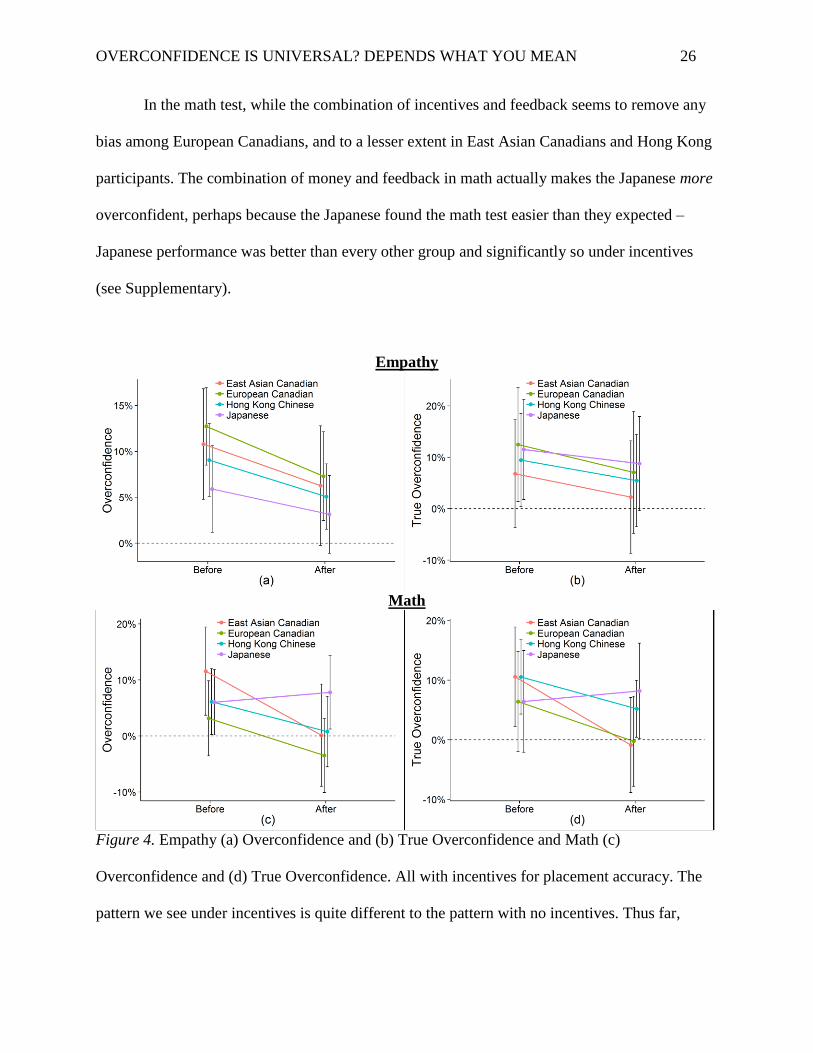
In Figure 4, we plot both the empathy and math test when participants were incentivized
for accurate placement estimates. For a side-by-side comparison with the unincentivized
condition, see Supplementary. Under incentives, Figure 4 reveals quite different patterns. To
begin with, all groups except East Asian Canadians are significantly more overconfident when
incentivized, not less as some expect. The effect of incentives ranged from 3% to 12% in these
more overconfident groups (see Table 4). We find that the Japanese appear to be the least
overconfident of the four groups by the Overconfidence measure in the empathy test, but the
most overconfident by the True Overconfidence measure. This reversal highlights the need to
consider performance and operationalize True Overconfidence and not just population-level
Overconfidence. These results occur because the Japanese perform worse under incentives (see
Supplemental for performance differences).
OVERCONFIDENCE IS UNIVERSAL? DEPENDS WHAT YOU MEAN 26
In the math test, while the combination of incentives and feedback seems to remove any
bias among European Canadians, and to a lesser extent in East Asian Canadians and Hong Kong
participants. The combination of money and feedback in math actually makes the Japanese more
overconfident, perhaps because the Japanese found the math test easier than they expected –
Japanese performance was better than every other group and significantly so under incentives
(see Supplementary).
Empathy
Math
Figure 4. Empathy (a) Overconfidence and (b) True Overconfidence and Math (c)
Overconfidence and (d) True Overconfidence. All with incentives for placement accuracy. The
pattern we see under incentives is quite different to the pattern with no incentives. Thus far,
OVERCONFIDENCE IS UNIVERSAL? DEPENDS WHAT YOU MEAN 27
updating toward less overconfidence after taking the test has seemed to be universal, but here we
find that when it comes to math, the Japanese sample go from overconfident to even more
overconfident. The importance of using True Overconfidence is underscored by the empathy
results where the Japanese go from the least overconfident group to the most overconfident
group. This reversal occurs due to poorer performance under incentives. For the math test, both
Overconfidence and True Overconfidence largely tell the same story, although Overconfidence
suggests that European Canadians are underconfident after taking the test, which is not true when
you consider actual performance. European Canadians are nonetheless the least overconfident in
math when incentivized for accuracy. Error bars are 95% confidence intervals. Note that the y-
axis range for empathy is different so as to better visualize the differences between lines.
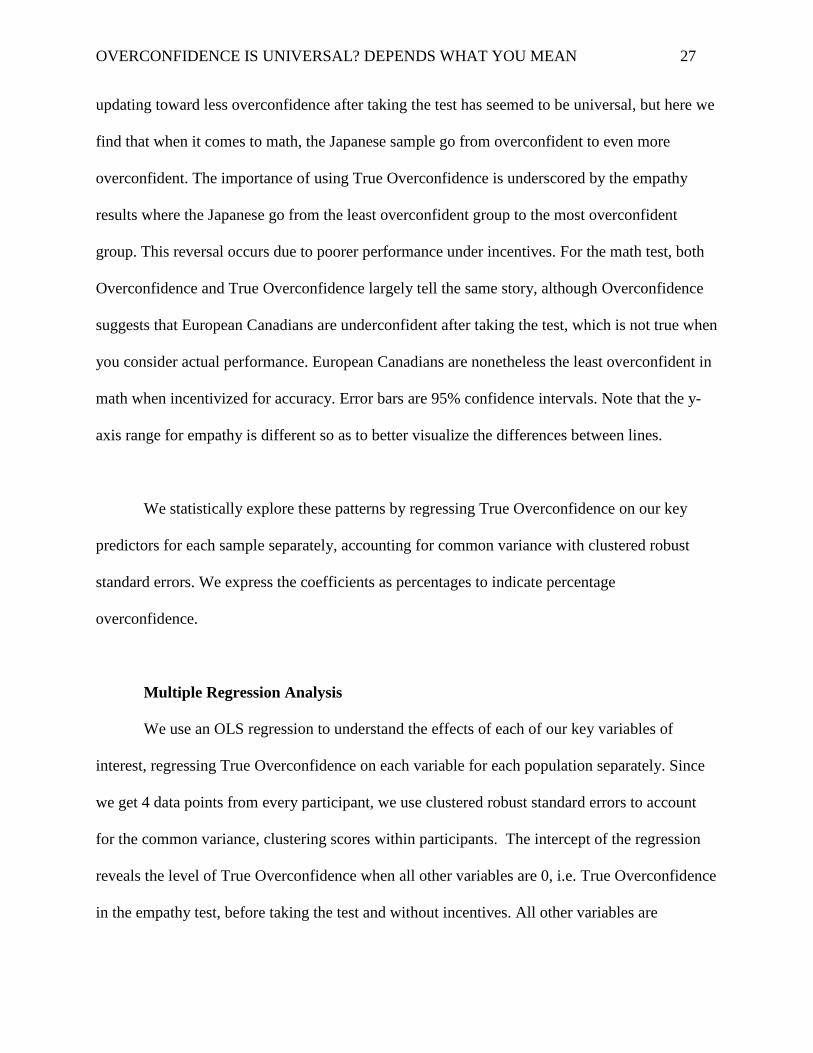
We statistically explore these patterns by regressing True Overconfidence on our key
predictors for each sample separately, accounting for common variance with clustered robust
standard errors. We express the coefficients as percentages to indicate percentage
overconfidence.
Multiple Regression Analysis
We use an OLS regression to understand the effects of each of our key variables of
interest, regressing True Overconfidence on each variable for each population separately. Since
we get 4 data points from every participant, we use clustered robust standard errors to account
for the common variance, clustering scores within participants. The intercept of the regression
reveals the level of True Overconfidence when all other variables are 0, i.e. True Overconfidence
in the empathy test, before taking the test and without incentives. All other variables are
OVERCONFIDENCE IS UNIVERSAL? DEPENDS WHAT YOU MEAN 28
compared to this base condition. To avoid difficult to interpret interactions between the samples
and our key predictors, we instead report regressions for each sample separately.
The regression reveals that in this base condition, all but the Japanese are overconfident,
with the two Canadian samples the most overconfident. The Japanese are slightly
underconfident. All groups become more accurate after taking the tests and become very similar
in overconfidence. The math test varies by population, with both Canadians becoming less
overconfident and Hong Kong Chinese and Japanese staying largely the same. Incentives seem
to increase overconfidence in all groups, but particularly so in the Japanese, who become
significantly more overconfident and reach levels of overconfidence comparable to all other
groups. True Overconfidence is maximized by being a Euro-Canadian under incentives before
the empathy test, whereas it’s minimized by being Japanese, not incentivized after the empathy
test.
OVERCONFIDENCE IS UNIVERSAL? DEPENDS WHAT YOU MEAN 29
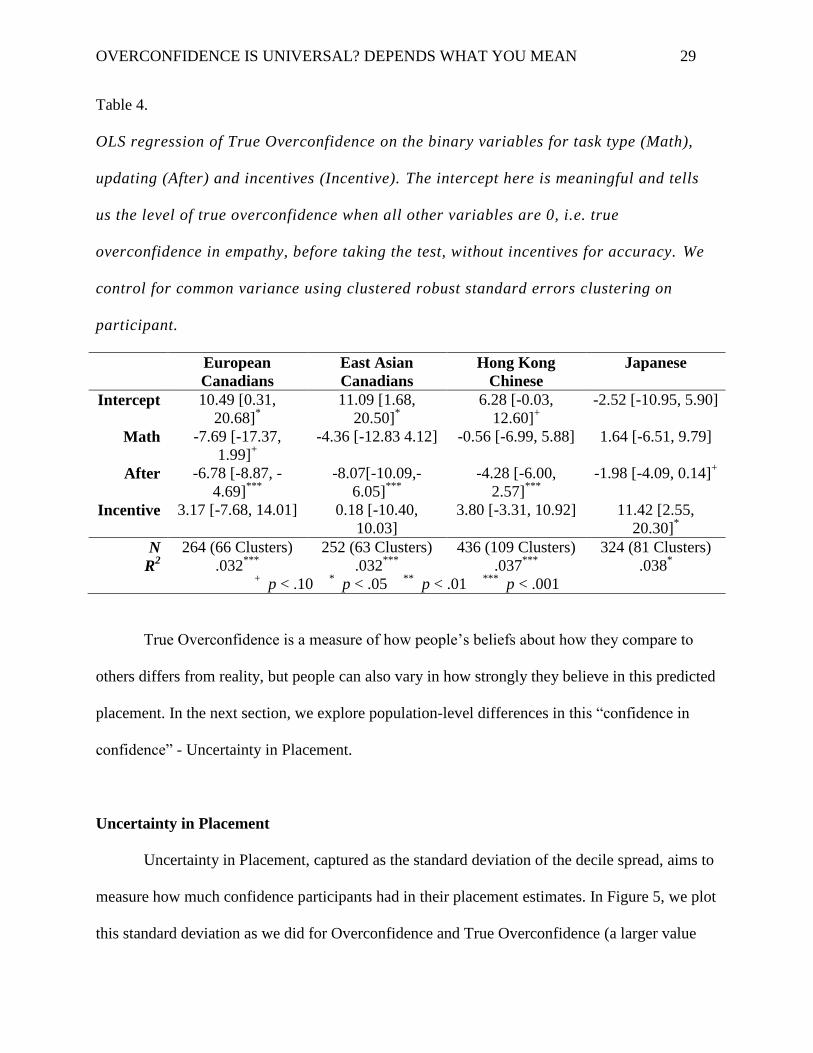
Table 4.
OLS regression of True Overconfidence on the binary variables for task type (Math),
updating (After) and incentives (Incentive). The intercept here is meaningful and tells
us the level of true overconfidence when all other variables are 0, i.e. true
overconfidence in empathy, before taking the test, without incentives for accuracy. We
control for common variance using clustered robust standard errors clustering on
participant.
European
Canadians
East Asian
Canadians
Hong Kong
Chinese
Japanese
Intercept 10.49 [0.31,
20.68]*
11.09 [1.68,
20.50]*
6.28 [-0.03,
12.60]+
-2.52 [-10.95, 5.90]
Math -7.69 [-17.37,
1.99]+
-4.36 [-12.83 4.12] -0.56 [-6.99, 5.88] 1.64 [-6.51, 9.79]
After -6.78 [-8.87, -
4.69]***
-8.07[-10.09,-
6.05]***
-4.28 [-6.00,
2.57]***
-1.98 [-4.09, 0.14]+
Incentive 3.17 [-7.68, 14.01] 0.18 [-10.40,
10.03]
3.80 [-3.31, 10.92] 11.42 [2.55,
20.30]*
N 264 (66 Clusters) 252 (63 Clusters) 436 (109 Clusters) 324 (81 Clusters)
R2 .032
*** .032
*** .037
*** .038
*
+ p < .10
* p < .05
** p < .01
*** p < .001
True Overconfidence is a measure of how people’s beliefs about how they compare to
others differs from reality, but people can also vary in how strongly they believe in this predicted
placement. In the next section, we explore population-level differences in this “confidence in
confidence” - Uncertainty in Placement.
Uncertainty in Placement
Uncertainty in Placement, captured as the standard deviation of the decile spread, aims to
measure how much confidence participants had in their placement estimates. In Figure 5, we plot
this standard deviation as we did for Overconfidence and True Overconfidence (a larger value

OVERCONFIDENCE IS UNIVERSAL? DEPENDS WHAT YOU MEAN 30
indicates more uncertainty). Figure 5 reveals that Hong Kong Chinese are more uncertain than
Japanese participants who are more uncertain than the European Canadians, who are in turn
more uncertain than the East Asian Canadians. When money is on the line, all groups become
more uncertain and this uncertainty is higher for the more ambiguous task (empathy).
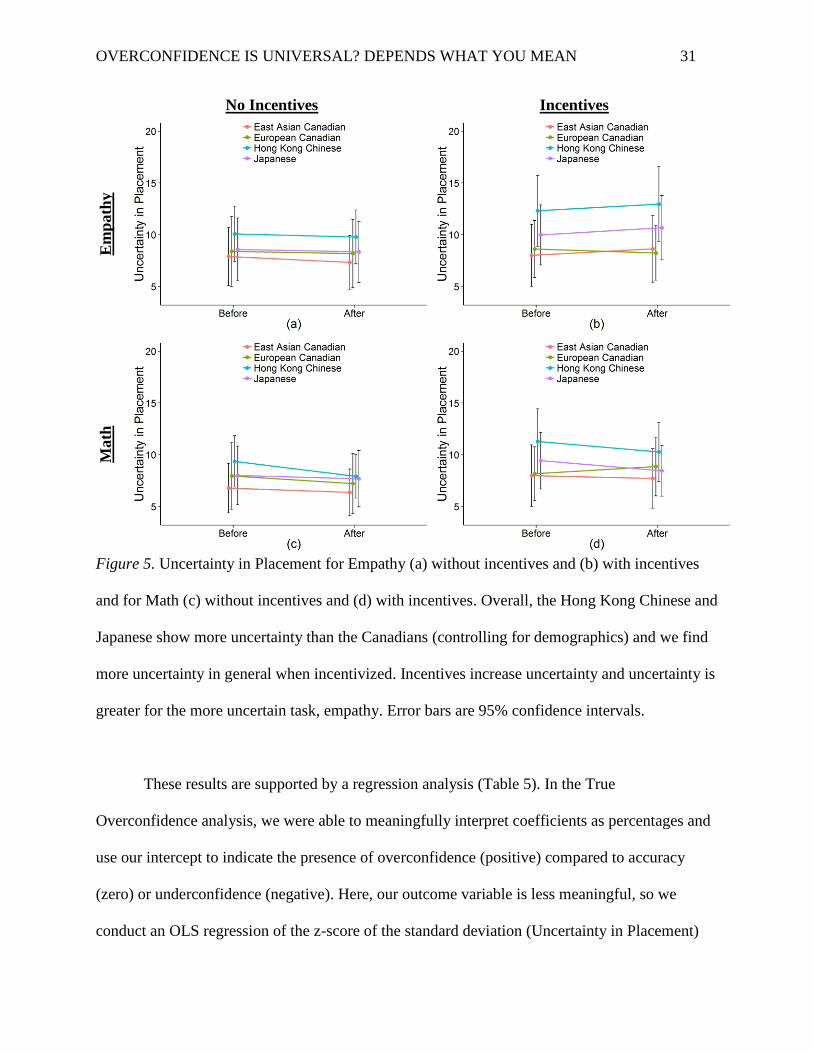
OVERCONFIDENCE IS UNIVERSAL? DEPENDS WHAT YOU MEAN 31
No Incentives Incentives E
mp
ath
y
Math
Figure 5. Uncertainty in Placement for Empathy (a) without incentives and (b) with incentives
and for Math (c) without incentives and (d) with incentives. Overall, the Hong Kong Chinese and
Japanese show more uncertainty than the Canadians (controlling for demographics) and we find
more uncertainty in general when incentivized. Incentives increase uncertainty and uncertainty is
greater for the more uncertain task, empathy. Error bars are 95% confidence intervals.
These results are supported by a regression analysis (Table 5). In the True
Overconfidence analysis, we were able to meaningfully interpret coefficients as percentages and
use our intercept to indicate the presence of overconfidence (positive) compared to accuracy
(zero) or underconfidence (negative). Here, our outcome variable is less meaningful, so we
conduct an OLS regression of the z-score of the standard deviation (Uncertainty in Placement)
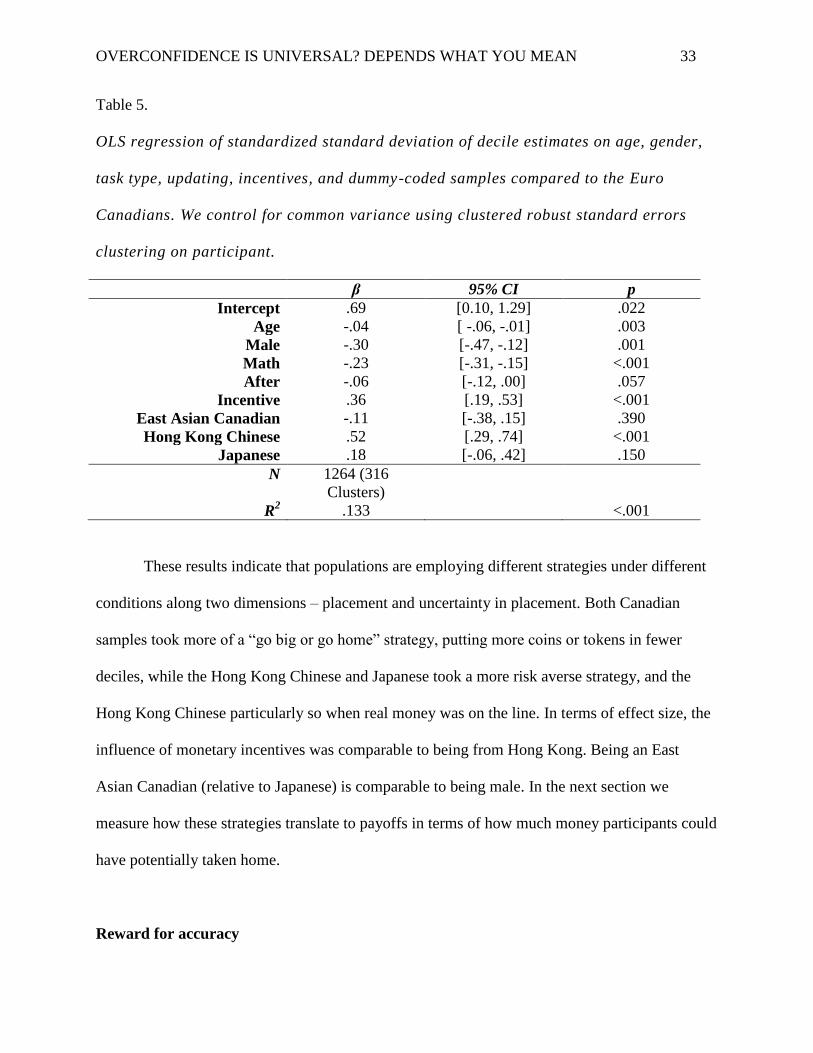
OVERCONFIDENCE IS UNIVERSAL? DEPENDS WHAT YOU MEAN 32
on standardized age, gender (Male = 1), task type (Math = 1), updating (After = 1), incentives
(Incentive = 1), each sample compared to our Japanese sample (the group in the middle of
Uncertainty in Placement). We found no significant interactions between samples and each
variable and so only report main effects. We control for common variance using clustered robust
standard errors, clustering on participant.
The regression reveals that older people and males are less uncertain. Participants are less
uncertain about the math test compared to the empathy test and slightly less uncertain after
taking the test. Participants spread their coins (incentives) more widely than their tokens. Finally,
the Hong Kong Chinese were the most uncertain, significantly more than all other populations.
The next most uncertain were the Japanese who were significantly more uncertain than the East
Asian Canadians. The East Asian Canadians were the most certain with Euro Canadian certainty
falling somewhere between the East Asian Canadians and Japanese.
OVERCONFIDENCE IS UNIVERSAL? DEPENDS WHAT YOU MEAN 33
Table 5.
OLS regression of standardized standard deviation of decile estimates on age, gender,
task type, updating, incentives, and dummy-coded samples compared to the Euro
Canadians. We control for common variance using clustered robust standard errors
clustering on participant.
β 95% CI p
Intercept .69 [0.10, 1.29] .022
Age -.04 [ -.06, -.01] .003
Male -.30 [-.47, -.12] .001
Math -.23 [-.31, -.15] <.001
After -.06 [-.12, .00] .057
Incentive .36 [.19, .53] <.001
East Asian Canadian -.11 [-.38, .15] .390
Hong Kong Chinese .52 [.29, .74] <.001
Japanese .18 [-.06, .42] .150
N 1264 (316
Clusters)
R2 .133 <.001
These results indicate that populations are employing different strategies under different
conditions along two dimensions – placement and uncertainty in placement. Both Canadian
samples took more of a “go big or go home” strategy, putting more coins or tokens in fewer
deciles, while the Hong Kong Chinese and Japanese took a more risk averse strategy, and the
Hong Kong Chinese particularly so when real money was on the line. In terms of effect size, the
influence of monetary incentives was comparable to being from Hong Kong. Being an East
Asian Canadian (relative to Japanese) is comparable to being male. In the next section we
measure how these strategies translate to payoffs in terms of how much money participants could
have potentially taken home.
Reward for accuracy
OVERCONFIDENCE IS UNIVERSAL? DEPENDS WHAT YOU MEAN 34
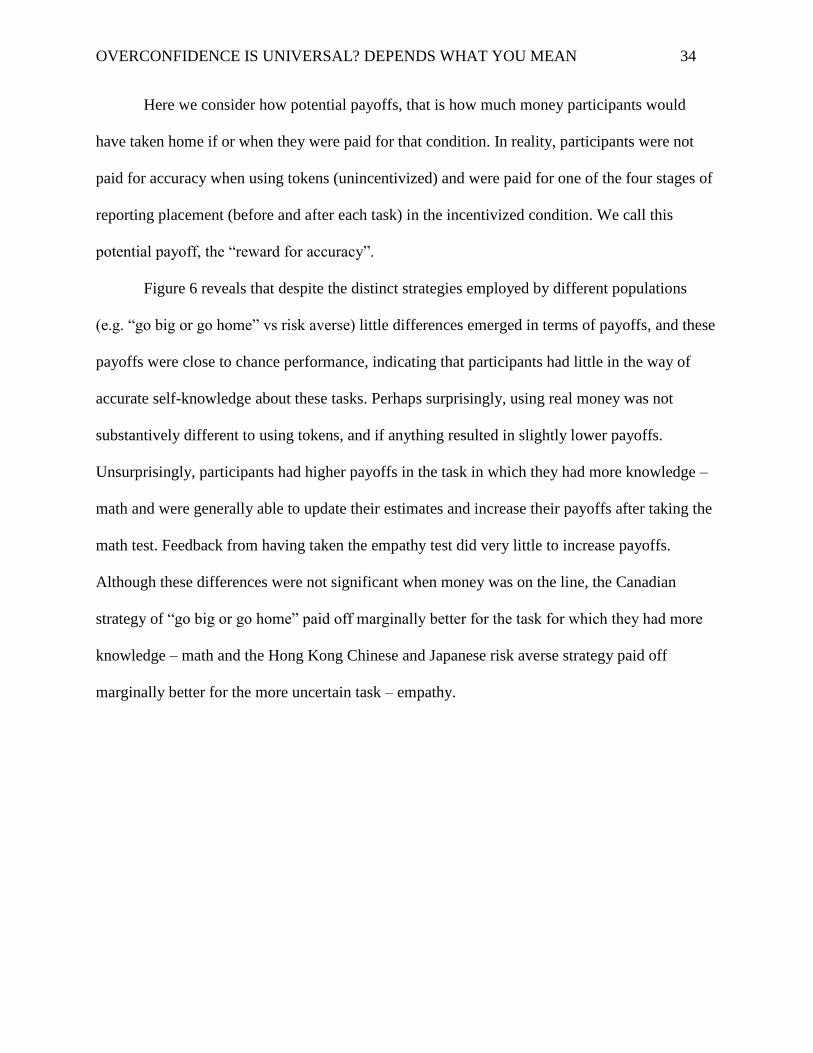
Here we consider how potential payoffs, that is how much money participants would
have taken home if or when they were paid for that condition. In reality, participants were not
paid for accuracy when using tokens (unincentivized) and were paid for one of the four stages of
reporting placement (before and after each task) in the incentivized condition. We call this
potential payoff, the “reward for accuracy”.
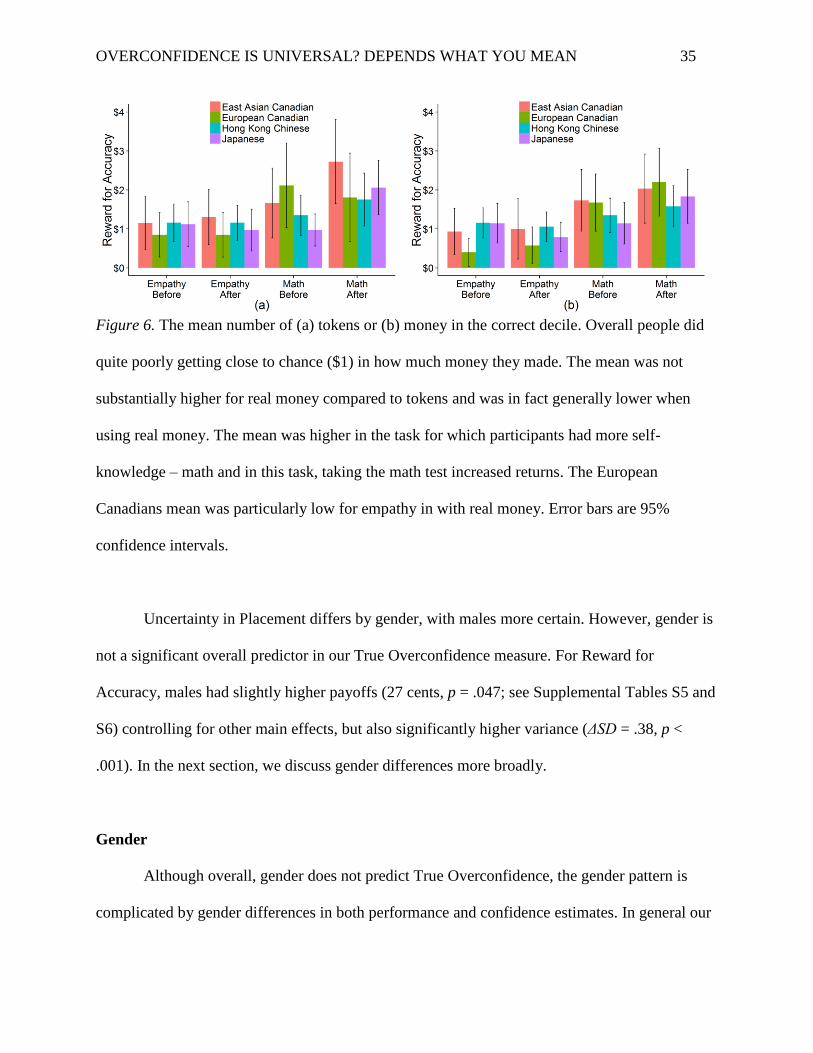
Figure 6 reveals that despite the distinct strategies employed by different populations
(e.g. “go big or go home” vs risk averse) little differences emerged in terms of payoffs, and these
payoffs were close to chance performance, indicating that participants had little in the way of
accurate self-knowledge about these tasks. Perhaps surprisingly, using real money was not
substantively different to using tokens, and if anything resulted in slightly lower payoffs.
Unsurprisingly, participants had higher payoffs in the task in which they had more knowledge –
math and were generally able to update their estimates and increase their payoffs after taking the
math test. Feedback from having taken the empathy test did very little to increase payoffs.
Although these differences were not significant when money was on the line, the Canadian
strategy of “go big or go home” paid off marginally better for the task for which they had more
knowledge – math and the Hong Kong Chinese and Japanese risk averse strategy paid off
marginally better for the more uncertain task – empathy.
OVERCONFIDENCE IS UNIVERSAL? DEPENDS WHAT YOU MEAN 35
Figure 6. The mean number of (a) tokens or (b) money in the correct decile. Overall people did
quite poorly getting close to chance ($1) in how much money they made. The mean was not
substantially higher for real money compared to tokens and was in fact generally lower when
using real money. The mean was higher in the task for which participants had more self-
knowledge – math and in this task, taking the math test increased returns. The European
Canadians mean was particularly low for empathy in with real money. Error bars are 95%
confidence intervals.
Uncertainty in Placement differs by gender, with males more certain. However, gender is
not a significant overall predictor in our True Overconfidence measure. For Reward for
Accuracy, males had slightly higher payoffs (27 cents, p = .047; see Supplemental Tables S5 and
S6) controlling for other main effects, but also significantly higher variance (ΔSD = .38, p <
.001). In the next section, we discuss gender differences more broadly.
Gender
Although overall, gender does not predict True Overconfidence, the gender pattern is
complicated by gender differences in both performance and confidence estimates. In general our
OVERCONFIDENCE IS UNIVERSAL? DEPENDS WHAT YOU MEAN 36
results suggest that in contexts when males are more overconfident, the difference is much larger
than in cases when females are more overconfident. However, females are often as confident or
slightly more confident than males. So rather than males being consistently more confident than
females, as is sometimes suggested by the literature, overconfidence and performance
differences between the genders varies by incentives, task, and population. These results do not
change the overall pattern of results so far reported.
Here we look at the difference between males and females in performance,
Overconfidence, True Overconfidence, and Uncertainty in Placement within each sample for
each test, with and without incentives, and for the estimates of performance, before and after
each test. These patterns are complex, so we regress each outcome on gender and plot the
coefficient of gender as a color ranging from red (females higher, shown by negative) to blue
(males higher, shown by positive), where white indicates neither is higher. Significant
differences are bolded and outlined in a darker black. Marginally significant are just bolded. We
begin by looking at performance.
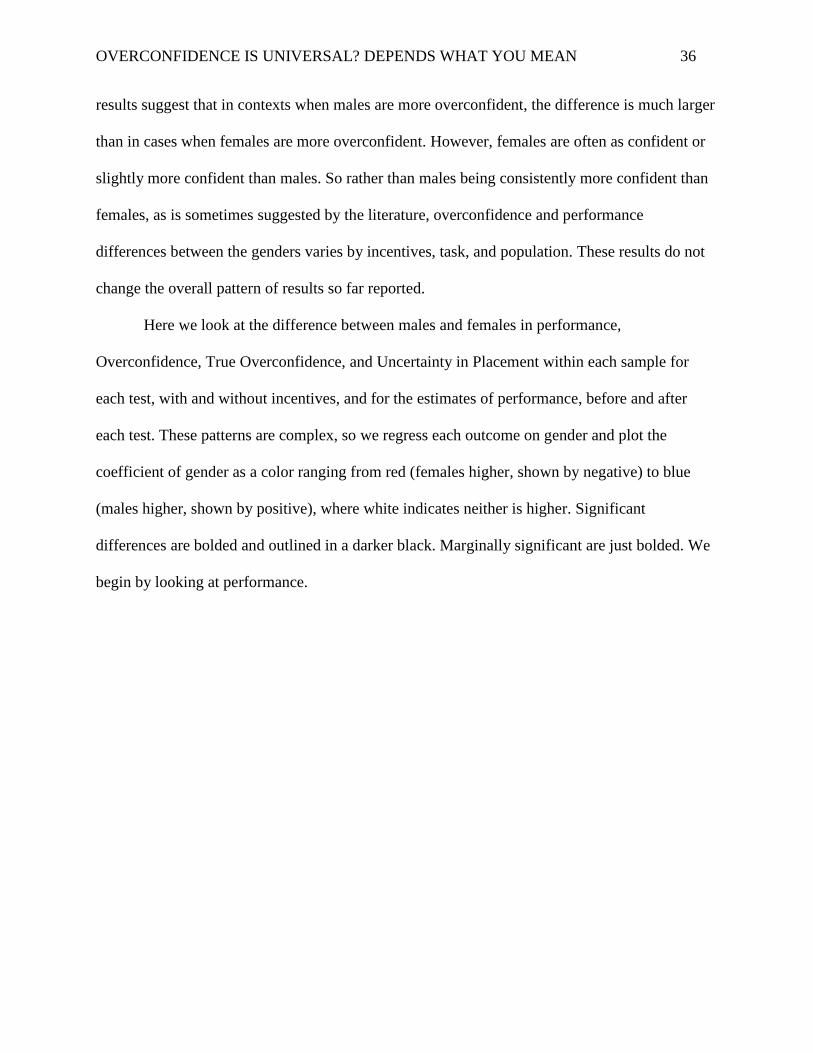
OVERCONFIDENCE IS UNIVERSAL? DEPENDS WHAT YOU MEAN 37
Performance
These results in Figure 7 indicate that men and women perform differently on the
different tests between populations and under incentives. On the empathy test without incentives,
European Canadian women and Hong Kong Chinese women did better, but under incentives
there was only a small difference with men performing a bit better. The pattern was the opposite,
but not significant among East Asian Canadians and Japanese.
Men in general performed better on the math test. European Canadian men performed
significantly better under incentives, but there was no difference without incentives. Japanese
men were consistently better at math, whereas East Asian Canadians were part way between
these groups – men performing better overall, but more so under incentives.
Figure 7. Performance as a percentage difference in raw score on test between males and
females. Positive values (blue) indicate that males performed better. Negative values (red)
indicate that females performed better. The color ranges from -20% to 20%. Statistically
significant values are bolded and surrounded by a darker border. Marginally significant values
are bold.
Let’s next look at what you would find if you didn’t take these performance differences
into account when comparing overconfidence.
Tokens
Money 8% 18%2% -5% 1% -3% 18% 15%
Hong Kong
ChineseJapanese
-7% 4% -4% 2% -1% 9% 10% 16%
European
Canadian
East Asian
Canadian
Hong Kong
ChineseJapanese
European
Canadian
East Asian
Canadian
Empathy Math
OVERCONFIDENCE IS UNIVERSAL? DEPENDS WHAT YOU MEAN 38
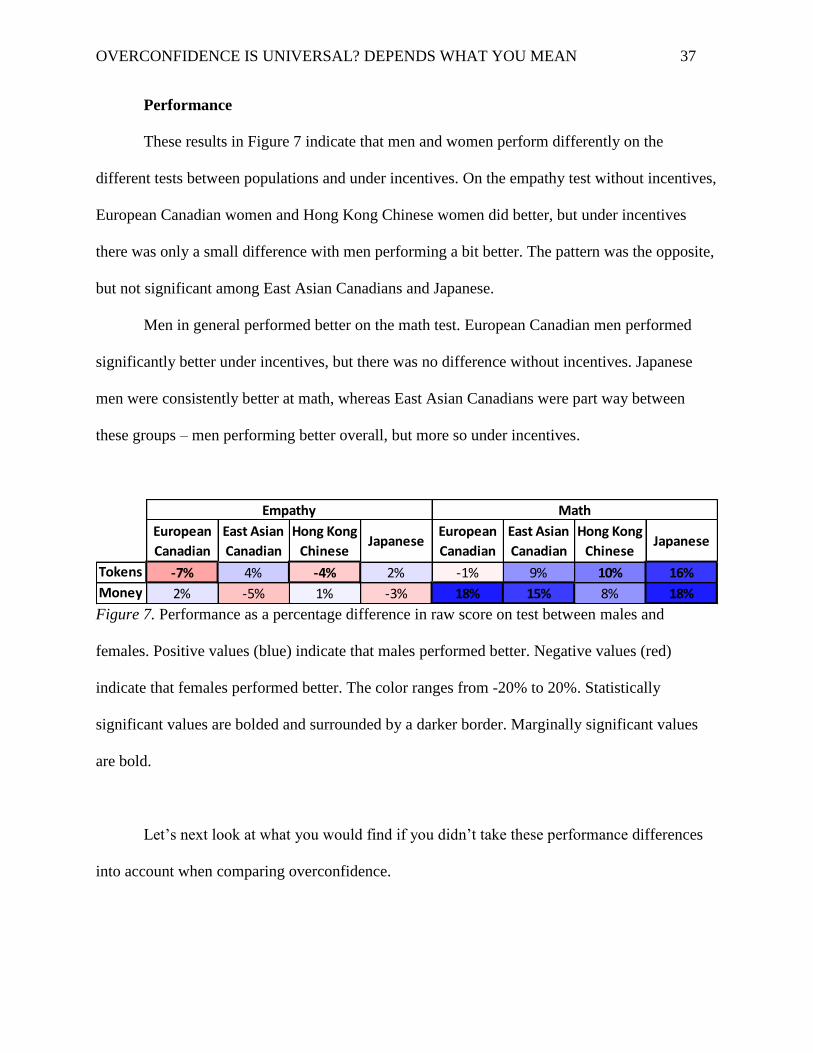
Overconfidence
The results in Figure 8 highlight that men and women behave differently, but this is
mostly based on test type. Men in all populations and conditions, except East Asian Canadians
before taking the math test, show more overconfidence (values above the mean) than women.
For empathy, the predictions are more balanced, with Japanese women under incentives showing
more overconfidence. However, since we know that performance differs, these results are only
meaningful in so far as they replicate past research.
Figure 8. Traditional overconfidence difference between males and females. Positive values and
blue indicate that males had higher overconfidence. Negative values and red indicate that
females had higher overconfidence. The color ranges from -30% to 30%. Statistically significant
values are bolded and surrounded by a darker border. Marginally significant values are bold.
At least for math, these results replicate past research, suggesting that men are more
overconfident than women. But these results don’t take into consideration the performance
difference previously discussed. Do the results change when we consider performance?
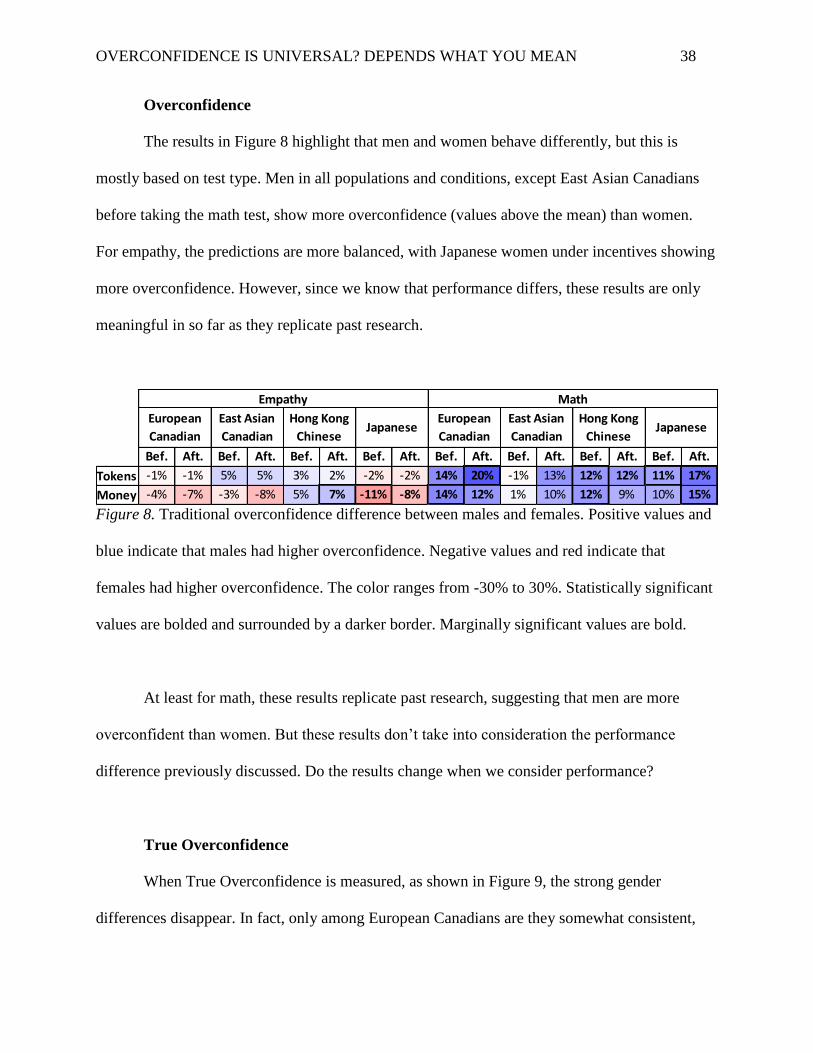
True Overconfidence
When True Overconfidence is measured, as shown in Figure 9, the strong gender
differences disappear. In fact, only among European Canadians are they somewhat consistent,
Bef. Aft. Bef. Aft. Bef. Aft. Bef. Aft. Bef. Aft. Bef. Aft. Bef. Aft. Bef. Aft.
Tokens -1% -1% 5% 5% 3% 2% -2% -2% 14% 20% -1% 13% 12% 12% 11% 17%
Money -4% -7% -3% -8% 5% 7% -11% -8% 14% 12% 1% 10% 12% 9% 10% 15%
Empathy Math
European
Canadian
East Asian
Canadian
Hong Kong
ChineseJapanese
European
Canadian
East Asian
Canadian
Hong Kong
ChineseJapanese
OVERCONFIDENCE IS UNIVERSAL? DEPENDS WHAT YOU MEAN 39
with unincentivized men showing more overconfidence for both empathy and math. When
incentivized, European Canadian women show more overconfidence. East Asian Canadian
women show more overconfidence in math than East Asian Canadian men, but this is driven by
them not predicting their poorer performance. On empathy, both genders are roughly the same,
but East Asian Canadian men seem to be a bit more overconfident compared to women when
incentivized. Results are mixed among the Hong Kong Chinese and Japanese with only
marginally or not significant results.
Figure 9. True Overconfidence difference between males and females. Positive values (blue)
indicate that males had higher true overconfidence. Negative values (red) indicate that females
had higher overconfidence. The color ranges from -30% to 30%. Statistically significant values
are bolded and surrounded by a darker border. Marginally significant values are bold.
Next, we consider gender differences in Uncertainty in Placement.
Uncertainty in Placement
The results in Figure 10, coded so that more blue suggests males have less uncertainty
suggests that the overall trend is that East Asian Canadian and Hong Kong Chinese men show
the most certainty. For the Japanese and European Canadians, the genders act more similarly,
Bef. Aft. Bef. Aft. Bef. Aft. Bef. Aft. Bef. Aft. Bef. Aft. Bef. Aft. Bef. Aft.
Tokens 25% 25% -3% -4% 15% 14% -9% -9% 20% 26% -20% -7% 1% 1% -9% -3%
Money -16% -19% 14% 9% -1% 1% 5% 9% -14% -16% -20% -12% 0% -2% -16% -11%
Empathy Math
European
Canadian
East Asian
Canadian
Hong Kong
ChineseJapanese
European
Canadian
East Asian
Canadian
Hong Kong
ChineseJapanese
OVERCONFIDENCE IS UNIVERSAL? DEPENDS WHAT YOU MEAN 40
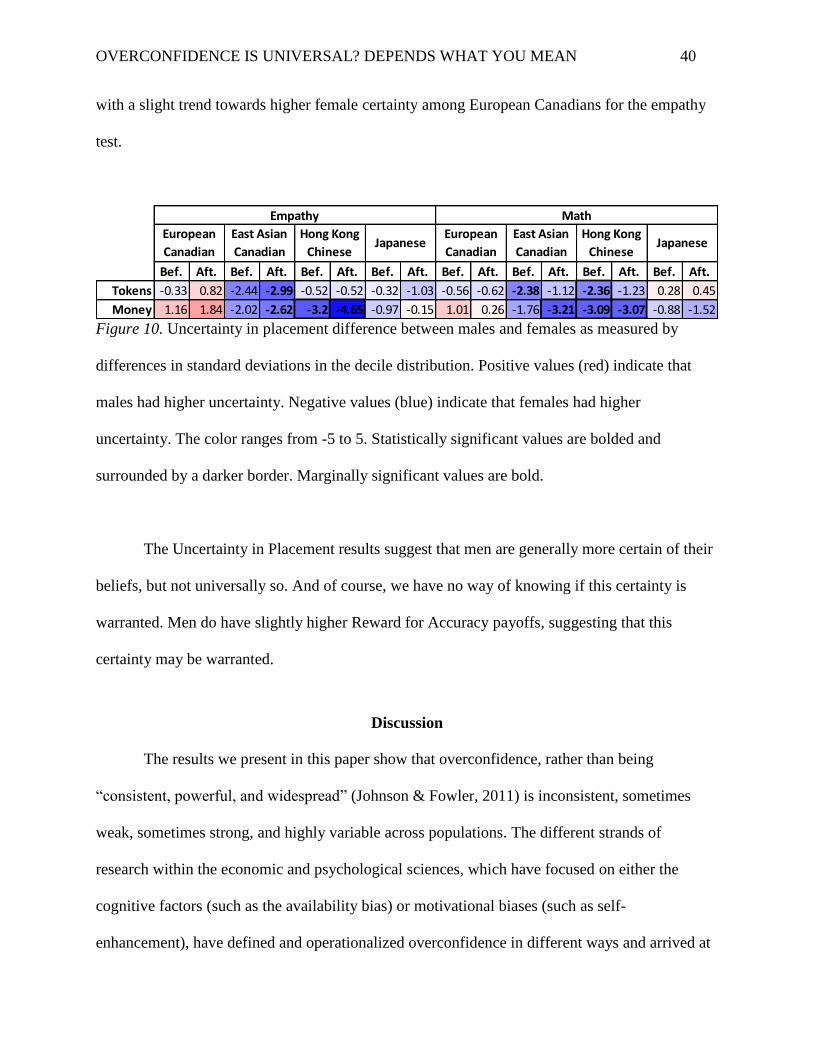
with a slight trend towards higher female certainty among European Canadians for the empathy
test.
Figure 10. Uncertainty in placement difference between males and females as measured by
differences in standard deviations in the decile distribution. Positive values (red) indicate that
males had higher uncertainty. Negative values (blue) indicate that females had higher
uncertainty. The color ranges from -5 to 5. Statistically significant values are bolded and
surrounded by a darker border. Marginally significant values are bold.
The Uncertainty in Placement results suggest that men are generally more certain of their
beliefs, but not universally so. And of course, we have no way of knowing if this certainty is
warranted. Men do have slightly higher Reward for Accuracy payoffs, suggesting that this
certainty may be warranted.
Discussion
The results we present in this paper show that overconfidence, rather than being
“consistent, powerful, and widespread” (Johnson & Fowler, 2011) is inconsistent, sometimes
weak, sometimes strong, and highly variable across populations. The different strands of
research within the economic and psychological sciences, which have focused on either the
cognitive factors (such as the availability bias) or motivational biases (such as self-
enhancement), have defined and operationalized overconfidence in different ways and arrived at
Bef. Aft. Bef. Aft. Bef. Aft. Bef. Aft. Bef. Aft. Bef. Aft. Bef. Aft. Bef. Aft.
Tokens -0.33 0.82 -2.44 -2.99 -0.52 -0.52 -0.32 -1.03 -0.56 -0.62 -2.38 -1.12 -2.36 -1.23 0.28 0.45
Money 1.16 1.84 -2.02 -2.62 -3.2 -4.65 -0.97 -0.15 1.01 0.26 -1.76 -3.21 -3.09 -3.07 -0.88 -1.52
Empathy Math
European
Canadian
East Asian
Canadian
Hong Kong
ChineseJapanese
European
Canadian
East Asian
Canadian
Hong Kong
ChineseJapanese
OVERCONFIDENCE IS UNIVERSAL? DEPENDS WHAT YOU MEAN 41
different and often contradictory conclusions. Using Moore and Healy’s (2008) ontology, we
argue that there are at least two measurable and mostly independent dimensions of
overconfidence, which jointly influence payoffs, and could affect behavior outside the
laboratory. The first, overplacement, is an indication of your beliefs about how you compare to
the rest of the population and the second, overprecision, is an indication of how strongly you
hold this belief. Both of these dimensions seem important in determining real decisions. For
example, to start a business in the face of high failure rates, you need to believe that you’re better
than other business owners (overplacement) and you have to be confident in this belief
(overprecision). Being low in either one of these dimensions will likely result in not starting a
business (high precision in low placement) or seeking out more information (low precision).
Because at least two dimensions underlie overconfidence, it may be difficult to make predictions
based on single dimensional models, such as the Johnson-Fowler model. Nonetheless, the
model’s identification of the role of costs and benefits is insightful. Our results suggest that
overconfidence is highly context dependent and therefore we might expect that increasing
potential payoffs or reducing costs should increase confidence and certainty. For example, we
might expect lower confidence and/or certainty in a population with higher costs (such as the
social cost of overconfidence in collectivist societies) or higher confidence and/or certainty in
populations with higher benefits (such as the opportunities afforded by a rich country with a
large market).
Methodologically, in studying these forms of overconfidence, we show that the particular
operationalization is key to defensible results. First, we argue that implicit and behavioral
operationalizations are less susceptible to bias and lack of explicit knowledge (e.g. it’s not easy
to answer how confident you are in your beliefs on a scale from 1 to 100). Second, the “over” in
OVERCONFIDENCE IS UNIVERSAL? DEPENDS WHAT YOU MEAN 42
overplacement and overprecision requires a researcher to have a measure of accurate placement
and accurate precision. For placement, this is simply a measure of true performance relative to
the population of interest. We show that assumptions and shortcuts, such as subtracting 50%
from all scores leads to different sized effects and sometimes different patterns altogether (by the
Overconfidence measure, the Japanese appear overconfident in empathy when unincentivized,
but are actually underconfident by True Overconfidence). For precision, we are less convinced
that “accurate” precision can be operationalized and so instead opted to measure relative
uncertainty as a spread (standard deviation) of our decile distribution. Using these two
operationalizations of overplacement and overprecision, we find that overconfidence in both
dimensions and their consequent effects on payoffs differs by knowledge of the specific task
(before vs after), type of task (math vs empathy), whether accuracy is incentivized or not
(incentivized vs unincentivized), and gender. We also find that these effects are sometimes
robust across populations (at least in our populations), but sometimes depend on the population.
Let’s go through each of our key findings and then also what we do not find. First,
although overconfidence may not be universal, we find that updating toward accurate placement
after having performed a task is pretty consistent across conditions and populations. Further, we
find that the size of the update is very similar between populations, with two exceptions in the
math test. Under no incentives, both Canadian samples went from overconfident to
underconfident after taking the test, perhaps because they found the test particularly difficult –
they performed more poorly than the East Asian populations. Conversely, under incentives, the
Japanese actually increased in overconfidence, perhaps because they found the test particularly
easy – they performed significantly better than all other populations. Although updating was
mostly universal, overall overconfidence did not generalize across domains. In fact, by the True
OVERCONFIDENCE IS UNIVERSAL? DEPENDS WHAT YOU MEAN 43
Overconfidence measure, of our 32 cells (task x incentives x feedback x population), 22% were
underconfident.
Second, we gave participants a task for which they should have more self-knowledge
(math) and less self-knowledge (empathy). Unsurprisingly, we found that participants were more
accurate in placement for math than empathy and less uncertain about this belief. This suggests
that people are more likely to resort to overconfident beliefs in domains where they have less
knowledge. However, incentives affected this accuracy, certainty, and also performance in
surprising ways.
Overall, we found that the effect of incentives differed by population. For True
Overconfidence, all but the Japanese were largely unaffected by incentives and in all cases,
rather than making people more accurate, incentives resulted in higher True Overconfidence.
These results are in agreement with what the Johnson-Fowler model would predict.
However, the opposite was true for Uncertainty in Placement, contradicting the Johnson-
Fowler model. Incentives increased uncertainty in all populations, but the Japanese and Hong
Kong Chinese were always less certain than both Canadian populations and more so under
incentives. These differences in uncertainty suggested that Canadians were using more of a “go
big or go home” strategy, compared to the risk averse strategy employed by the Japanese and
Chinese, particularly when money was involved (this finding appears to contradict the “cushion
hypothesis,” which claims that East Asians are financially risk-seeking because they perceive a
greater support network to rely on if they fail; Hsee & Weber, 1999). Surprisingly, incentives
had only a limited impact on payoffs.
That the East Asian samples showed overconfidence in the face of incentives similar to
that of the European Canadian samples may seem at odds with past research finding pronounced
OVERCONFIDENCE IS UNIVERSAL? DEPENDS WHAT YOU MEAN 44
population differences in self-enhancement using hidden behavioral and indirect measures
(although we remind readers that the self-esteem and false uniqueness measures indicated that
the East Asian-Canadian and Hong Kong Chinese samples were unusually self-enhancing; for
reviews see Falk & Heine, 2014; Hamamura et al., 2007). One reason for the different pattern of
results may be that the measures used in this study tapped into somewhat distinct processes
compared with those measures used in previous studies; this notion is supported by the modest
correlations between the different measures of overconfidence and self-enhancement presented
in Table 3. An alternative account is that perhaps these conflicting findings indicate that East
Asians adopt underconfident assessments of themselves as a strategy to motivate themselves for
self-improvement, even if they are able to recognize, when incentivized to scrutinize their
performance more closely, that they are being overly self-critical when doing so. People can
have different motivations for assessing themselves, either to feel good about themselves, to
attend to areas in need of improvement, or to accurately assess their standing (cf., Sedikides &
Strube, 1997). That the Japanese and Hong Kong Chinese samples had overall greater
uncertainty in placement suggests that they have weaker commitments to any single view of self.
This may indicate that their various self-views are more in conflict with each other, and more
dependent on circumstances, than they are for Westerners (see Kim, Cohen, & Au, 2010;
Sedikides & Strube, 1997).
Payoffs (or potential payoffs) were largely the same between tokens and real money, and
were remarkably small – rarely deviating from chance – indicating overall poor self-knowledge.
However, payoffs did vary by task – participants generally made more money for math – and
more so after taking the math test. Taking the empathy test had no effect on payoffs. The
different population strategies made almost no difference to payoffs, although when real money
OVERCONFIDENCE IS UNIVERSAL? DEPENDS WHAT YOU MEAN 45
was involved, the “go big or go home” strategy was marginally better for math, the higher self-
knowledge task, and the more risk averse strategy, marginally better for empathy, the lower self-
knowledge task. Of course, although they are roughly the same on-average, the “go big or go
home” strategy will generate more variation in winning across those populations.
It is commonly claimed that men are more overconfident than women, although this is
not reliably found in self-enhancement studies. We find this is true in stereotypically male
domains, like math, but only for Overconfidence and Uncertainty in Placement. When True
Overconfidence is calculated, male overconfidence evaporates, because males actually perform
better on-average in stereotypically male domains. Gender differences in True Overconfidence
not only vary across populations, but depend on incentives and the task. Both men and women
are overconfident in different contexts. Interestingly, East Asian Canadian men are often not
significantly more overconfident than East Asian Canadian women, perhaps because East Asian
Canadian women in a Canadian context have competing stereotypes for poorer math
performance as a woman, but better math performance as an East Asian. Although men appear
more certain than women, it’s difficult to say whether this is “over” accurate certainty. One
indication is how this certainty translates to payoffs. Men have slightly higher payoffs than
women suggesting that the certainty may not be “over” what is adaptive. However, males also
have greater variance in payoffs in every population, suggesting that although this certainty pays
off for males overall, the spread of winners and losers is larger than for females. The universal
tendency toward male overconfidence is one of many past results we do not find when factors
such as performance differences are considered.
Finally, we do not find that incentives reduce True Overconfidence or improve
performance – incentives sometimes reduce performance depending on population and gender,
OVERCONFIDENCE IS UNIVERSAL? DEPENDS WHAT YOU MEAN 46
but they never improve performance in our populations, contrary to what many might expect. We
also do not find that incentives erase the difference between Japanese and European Canadians,
as is sometimes claimed – the Japanese actually become more uncertain, which may explain their
behavior in the self-enhancement literature. For Overconfidence, incentives sometimes have little
effect and sometimes increase overconfidence.
In conclusion, we argue that the many results by other researchers that have used average
performance as an indication of overplacement may have produced misleading results – implicit
measures of precision and individual-level anchoring of performance is critical to interpretable
results. Finally, we argue that claims of universal overconfidence do not stand up to the
incredible variation in both placement and precision by domain, knowledge of the task,
incentives, population, and gender.
References
Adams, J. K., & Adams, P. A. (1961). Realism of confidence judgments. Psychological review,
68(1), 33.
Adams Jr, R. B., Rule, N. O., Franklin Jr, R. G., Wang, E., Stevenson, M. T., Yoshikawa, S., . . .
Ambady, N. (2010). Cross-cultural reading the mind in the eyes: An fMRI investigation.
Journal of Cognitive Neuroscience, 22(1), 97-108.
Aron, A., Aron, E. N., & Smollan, D. (1992). Inclusion of Other in the Self Scale and the
structure of interpersonal closeness. Journal of personality and social psychology, 63(4),
596.
Barber, B. M., & Odean, T. (2001). Boys will be boys: Gender, overconfidence, and common
stock investment. The Quarterly Journal of Economics, 116(1), 261-292.
OVERCONFIDENCE IS UNIVERSAL? DEPENDS WHAT YOU MEAN 47
Baron‐Cohen, S., Wheelwright, S., Hill, J., Raste, Y., & Plumb, I. (2001). The “Reading the
Mind in the Eyes” test revised version: A study with normal adults, and adults with
Asperger syndrome or high‐functioning autism. Journal of child psychology and
psychiatry, 42(2), 241-251.
Bénabou, R., & Tirole, J. (2002). Self-confidence and personal motivation. The Quarterly
Journal of Economics, 117(3), 871-915.
Beyer, S., & Bowden, E. M. (1997). Gender Differences in Self-Perceptions: Convergent
Evidence from Three Measures of Accuracy and Bias. Personality and Social Psychology
Bulletin, 23(2), 157-172.
Brislin, R. W. (1970). Back-translation for cross-cultural research. Journal of Cross-Cultural
Psychology, 1(3), 185-216.
Camerer, C., & Lovallo, D. (1999). Overconfidence and excess entry: An experimental
approach. American economic review, 306-318.
Campbell, J. D. (1986). Similarity and uniqueness: the effects of attribute type, relevance, and
individual differences in self-esteem and depression. Journal of personality and social
psychology, 50(2), 281.
Cheng, J. T., Tracy, J. L., & Henrich, J. (2010). Pride, personality, and the evolutionary
foundations of human social status. Evolution and Human Behavior, 31(5), 334-347.
Chuang, W.-I., & Wang, K.-L. (2005). Overconfident trading of asian investors. Tunghai
University, Taiwan.
Chudek, M., Muthukrishna, M., & Henrich, J. (in press). Cultural Evolution. In D. M. Buss
(Ed.), The Handbook of Evolutionary Psychology (2nd ed.).
OVERCONFIDENCE IS UNIVERSAL? DEPENDS WHAT YOU MEAN 48
Dunning, D. (1995). Trait importance and modifiability as factors influencing self-assessment
and self-enhancement motives. Personality and Social Psychology Bulletin, 21(12),
1297-1306.
Dunning, D., Meyerowitz, J. A., & Holzberg, A. D. (1989). Ambiguity and self-evaluation: The
role of idiosyncratic trait definitions in self-serving assessments of ability. Journal of
personality and social psychology, 57(6), 1082.
Falk, C. F., & Heine, S. J. (2014). What is implicit self-esteem, and does it vary across
populations? Manuscript submitted for publication.
Gigerenzer, G., Hoffrage, U., & Kleinbölting, H. (1991). Probabilistic mental models: a
Brunswikian theory of confidence. Psychological review, 98(4), 506.
Gneezy, U., Leonard, K. L., & List, J. A. (2009). Gender differences in competition: Evidence
from a matrilineal and a patriarchal society. Econometrica, 77(5), 1637-1664.
Greenwald, A. G. (1980). The totalitarian ego: Fabrication and revision of personal history.
American psychologist, 35(7), 603.
Hamamura, T., Heine, S. J., & Takemoto, T. R. (2007). Why the better-than-average effect is a
worse-than-average measure of self-enhancement: An investigation of conflicting
findings from studies of East Asian self-evaluations. Motivation and Emotion, 31(4), 247-
259.
Heine, S. J. (2005). Where is the evidence for pancultural self-enhancement? A reply to
Sedikides, Gaertner, and Toguchi (2003).
Heine, S. J., & Hamamura, T. (2007). In search of East Asian self-enhancement. Personality and
Social Psychology Review, 11(1), 4-27.
OVERCONFIDENCE IS UNIVERSAL? DEPENDS WHAT YOU MEAN 49
Heine, S. J., Lehman, D. R., Markus, H. R., & Kitayama, S. (1999). Is there a universal need for
positive self-regard? Psychological review, 106(4), 766.
Heine, S. J., Takata, T., & Lehman, D. R. (2000). Beyond self-presentation: Evidence for self-
criticism among Japanese. Personality and Social Psychology Bulletin, 26(1), 71-78.
Henrich, J., Heine, S. J., & Norenzayan, A. (2010a). Most people are not WEIRD. Nature,
466(7302), 29-29.
Henrich, J., Heine, S. J., & Norenzayan, A. (2010b). The weirdest people in the world?
Behavioral and Brain Sciences, 33(2-3), 61-83.
Hsee, C. K., & Weber, E. U. (1999). Cross-national differences in risk preference and lay
predictions. Journal of Behavioral Decision Making, 12(2), 165-179.
John, O. P., Donahue, E. M., & Kentle, R. L. (1991). The big five inventory—versions 4a and
54. Berkeley: University of California, Berkeley, Institute of Personality and Social
Research.
John, O. P., Naumann, L. P., & Soto, C. J. (2008). Paradigm shift to the integrative big five trait
taxonomy. In O. P. John, R. W. Robins & L. A. Pervin (Eds.), Handbook of personality:
Theory and research (Vol. 3, pp. 114-158).
Johnson, D. D. (2009). Overconfidence and war: Harvard University Press.
Johnson, D. D., & Fowler, J. H. (2011). The evolution of overconfidence. Nature, 477(7364),
317-320.
Kim, Y.-H., Cohen, D., & Au, W.-T. (2010). The jury and abjury of my peers: The self in face
and dignity cultures. Journal of personality and social psychology, 98(6), 904.
OVERCONFIDENCE IS UNIVERSAL? DEPENDS WHAT YOU MEAN 50
Kitayama, S., Markus, H. R., Matsumoto, H., & Norasakkunkit, V. (1997). Individual and
collective processes in the construction of the self: self-enhancement in the United States
and self-criticism in Japan. Journal of personality and social psychology, 72(6), 1245.
Klar, Y., & Giladi, E. E. (1997). No one in my group can be below the group's average: a robust
positivity bias in favor of anonymous peers. Journal of personality and social
psychology, 73(5), 885.
Kruger, J., & Dunning, D. (1999). Unskilled and unaware of it: how difficulties in recognizing
one's own incompetence lead to inflated self-assessments. Journal of personality and
social psychology, 77(6), 1121.
Lenney, E. (1977). Women's self-confidence in achievement settings. Psychological bulletin,
84(1), 1.
Lichtenstein, S., & Fischhoff, B. (1977). Do those who know more also know more about how
much they know? Organizational Behavior and Human Performance, 20(2), 159-183.
Lundeberg, M. A., Fox, P. W., & Punćcohaŕ, J. (1994). Highly confident but wrong: Gender
differences and similarities in confidence judgments. Journal of educational psychology,
86(1), 114.
Malmendier, U., & Tate, G. (2005). CEO overconfidence and corporate investment. The Journal
of Finance, 60(6), 2661-2700.
Malmendier, U., & Tate, G. (2008). Who makes acquisitions? CEO overconfidence and the
market's reaction. Journal of Financial Economics, 89(1), 20-43.
Miller, D. T., & Ross, M. (1975). Self-serving biases in the attribution of causality: Fact or
fiction? Psychological bulletin, 82(2), 213.
OVERCONFIDENCE IS UNIVERSAL? DEPENDS WHAT YOU MEAN 51
Moore, D. A., & Healy, P. J. (2008). The trouble with overconfidence. Psychological review,
115(2), 502.
Odean, T. (1998). Volume, volatility, price, and profit when all traders are above average. The
Journal of Finance, 53(6), 1887-1934.
Ortoleva, P., & Snowberg, E. (2012). Confidence and overconfidence in political economy:
mimeo.
Plous, S. (1993). The psychology of judgment and decision making: Mcgraw-Hill Book
Company.
Rosenberg, M. (1965). Society and the adolescent self-image.
Ryder, A. G., Alden, L. E., & Paulhus, D. L. (2000). Is acculturation unidimensional or
bidimensional? A head-to-head comparison in the prediction of personality, self-identity,
and adjustment. Journal of personality and social psychology, 79(1), 49.
Sedikides, C., & Strube, M. J. (1997). Self-evaluation: To thine own self be good, to thine own
self be sure, to thine own self be true, and to thine own self be better. In M. P. Zanna
(Ed.), Advances in experimental social psychology (Vol. 29, pp. 209-269). New York:
Academic Press.
Shane, S., Venkataraman, S., & MacMillan, I. (1995). Cultural differences in innovation
championing strategies. Journal of Management, 21(5), 931-952.
Singelis, T. M. (1994). The measurement of independent and interdependent self-construals.
Personality and Social Psychology Bulletin, 20(5), 580-591.
Svenson, O. (1981). Are we all less risky and more skillful than our fellow drivers? Acta
Psychologica, 47(2), 143-148.
OVERCONFIDENCE IS UNIVERSAL? DEPENDS WHAT YOU MEAN 52
Taylor, S. E., & Brown, J. D. (1988). Illusion and well-being: a social psychological perspective
on mental health. Psychological bulletin, 103(2), 193.
Taylor, S. E., Kemeny, M. E., Reed, G. M., Bower, J. E., & Gruenewald, T. L. (2000).
Psychological resources, positive illusions, and health. American psychologist, 55(1), 99.
Whitcomb, K. M., Önkal, D., Curley, S. P., & George Benson, P. (1995). Probability judgment
accuracy for general knowledge. Cross‐national differences and assessment methods.
Journal of Behavioral Decision Making, 8(1), 51-67.
Williams, E. F., & Gilovich, T. (2008). Do people really believe they are above average? Journal
of Experimental Social Psychology, 44(4), 1121-1128.
Wright, G. N., Phillips, L. D., Whalley, P. C., Choo, G. T., Ng, K.-O., Tan, I., & Wisudha, A.
(1978). Cultural differences in probabilistic thinking. Journal of Cross-Cultural
Psychology, 9(3), 285-299.
Yamagishi, T., Hashimoto, H., Cook, K. S., Kiyonari, T., Shinada, M., Mifune, N., . . . Li, Y.
(2012). Modesty in self‐presentation: A comparison between the USA and Japan. Asian
Journal of Social Psychology, 15(1), 60-68.
Yates, J. F., Lee, J.-W., & Bush, J. G. (1997). General knowledge overconfidence: cross-national
variations, response style, and “reality”. Organizational behavior and human decision
processes, 70(2), 87-94.
Yates, J. F., Lee, J. W., Shinotsuka, H., Patalano, A. L., & Sieck, W. (1998). Cross-cultural
variations in probability judgment accuracy: Beyond general knowledge overconfidence?
Organizational behavior and human decision processes, 74, 89-117.

OVERCONFIDENCE IS UNIVERSAL? DEPENDS WHAT YOU MEAN 53
Yates, J. F., Zhu, Y., Ronis, D. L., Wang, D.-F., Shinotsuka, H., & Toda, M. (1989). Probability
judgment accuracy: China, Japan, and the United States. Organizational behavior and
human decision processes, 43(2), 145-171.