Embed Size (px)
Citation preview
Overview of the Global Manganese Industry
12 June 2015
IMnI 12th Electrolytic Producs Division (EPD) Conference
Hainan Island, China
Aloys d’Harambure,
International Manganese Institute (IMnI)
Introduction
I – Stainless Steel
II – EMD & EMM
III – Manganese Ore
Conclusion
Outline
Introduction – Macro-Economic Outlook
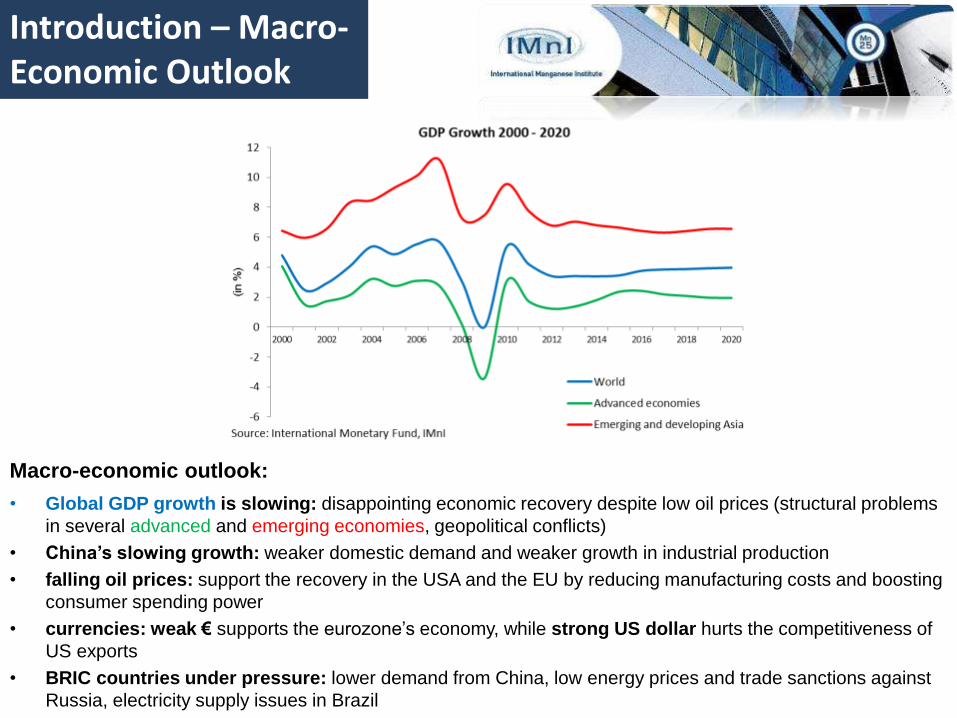
Macro-economic outlook:
• Global GDP growth is slowing: disappointing economic recovery despite low oil prices (structural problems
in several advanced and emerging economies, geopolitical conflicts)
• China’s slowing growth: weaker domestic demand and weaker growth in industrial production
• falling oil prices: support the recovery in the USA and the EU by reducing manufacturing costs and boosting
consumer spending power
• currencies: weak € supports the eurozone’s economy, while strong US dollar hurts the competitiveness of
US exports
• BRIC countries under pressure: lower demand from China, low energy prices and trade sanctions against
Russia, electricity supply issues in Brazil
Introduction
I – Stainless Steel
II – EMD & EMM
III – Manganese Ore
Conclusion
Outline
I – Stainless Steel Production
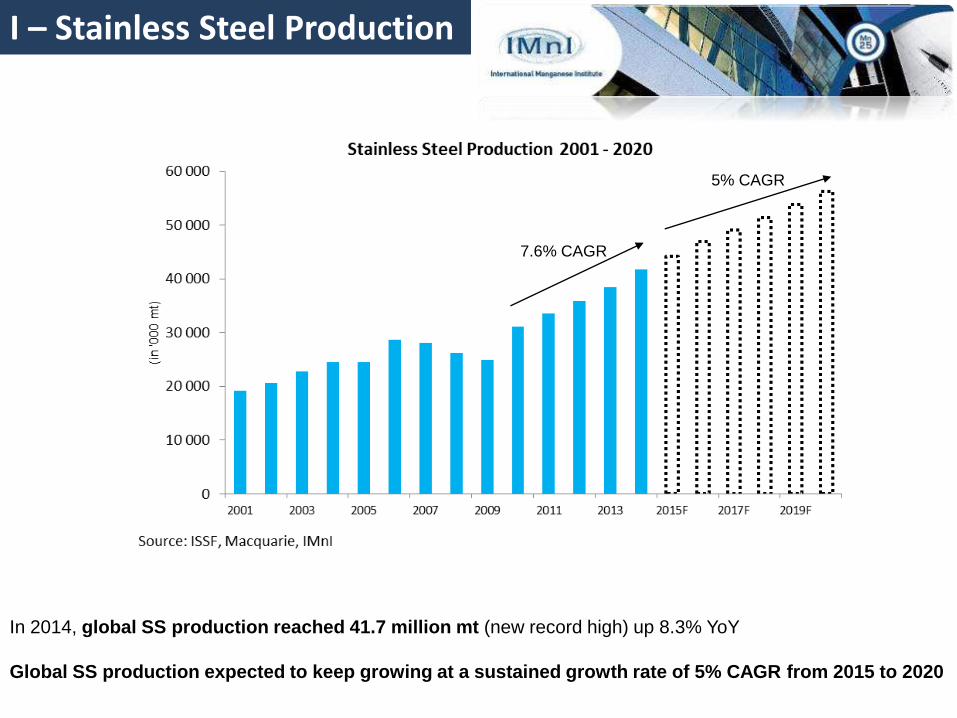
In 2014, global SS production reached 41.7 million mt (new record high) up 8.3% YoY
Global SS production expected to keep growing at a sustained growth rate of 5% CAGR from 2015 to 2020
7.6% CAGR
5% CAGR
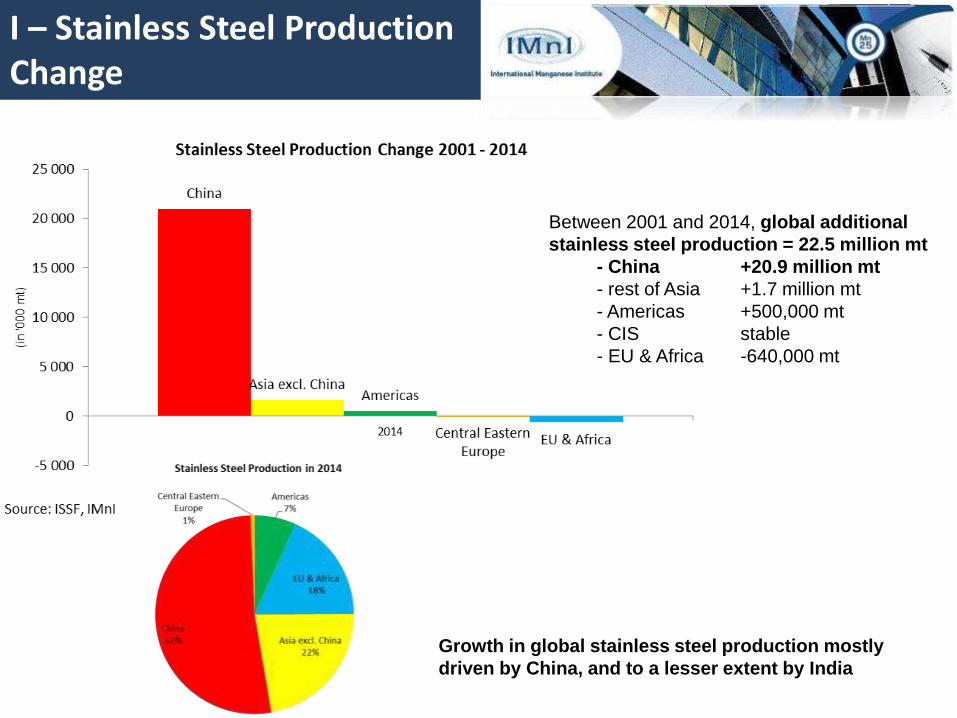
I – Stainless Steel Production Change
Growth in global stainless steel production mostly
driven by China, and to a lesser extent by India
Between 2001 and 2014, global additional
stainless steel production = 22.5 million mt
- China +20.9 million mt
- rest of Asia +1.7 million mt
- Americas +500,000 mt
- CIS stable
- EU & Africa -640,000 mt
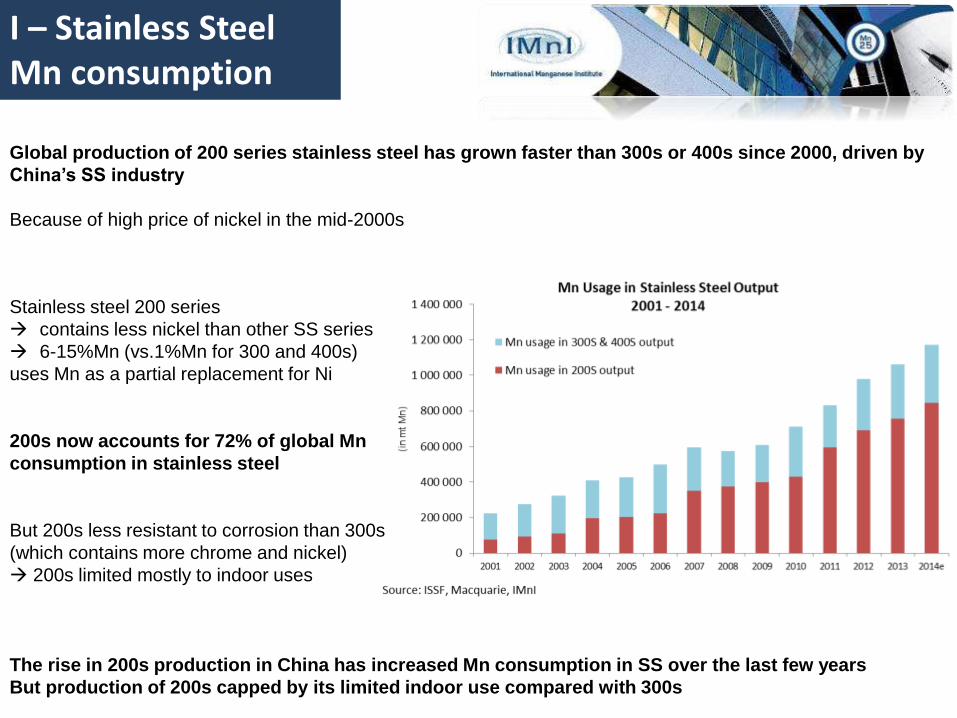
I – Stainless Steel Mn consumption
-0.8%
Stainless steel 200 series
contains less nickel than other SS series
6-15%Mn (vs.1%Mn for 300 and 400s)
uses Mn as a partial replacement for Ni
200s now accounts for 72% of global Mn
consumption in stainless steel
But 200s less resistant to corrosion than 300s
(which contains more chrome and nickel)
200s limited mostly to indoor uses
The rise in 200s production in China has increased Mn consumption in SS over the last few years
But production of 200s capped by its limited indoor use compared with 300s
Global production of 200 series stainless steel has grown faster than 300s or 400s since 2000, driven by
China’s SS industry
Because of high price of nickel in the mid-2000s
Introduction
I – Stainless Steel
II – EMD & EMM
III – Manganese Ore
Conclusion
Outline
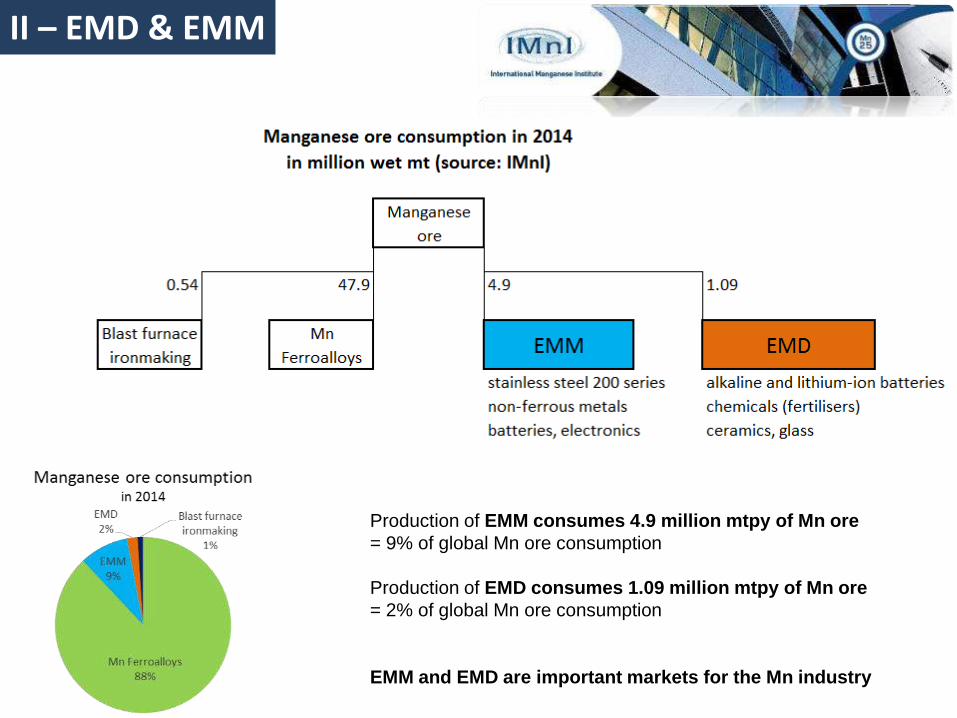
II – EMD & EMM
Production of EMM consumes 4.9 million mtpy of Mn ore
= 9% of global Mn ore consumption
Production of EMD consumes 1.09 million mtpy of Mn ore
= 2% of global Mn ore consumption
EMM and EMD are important markets for the Mn industry
II - EMD
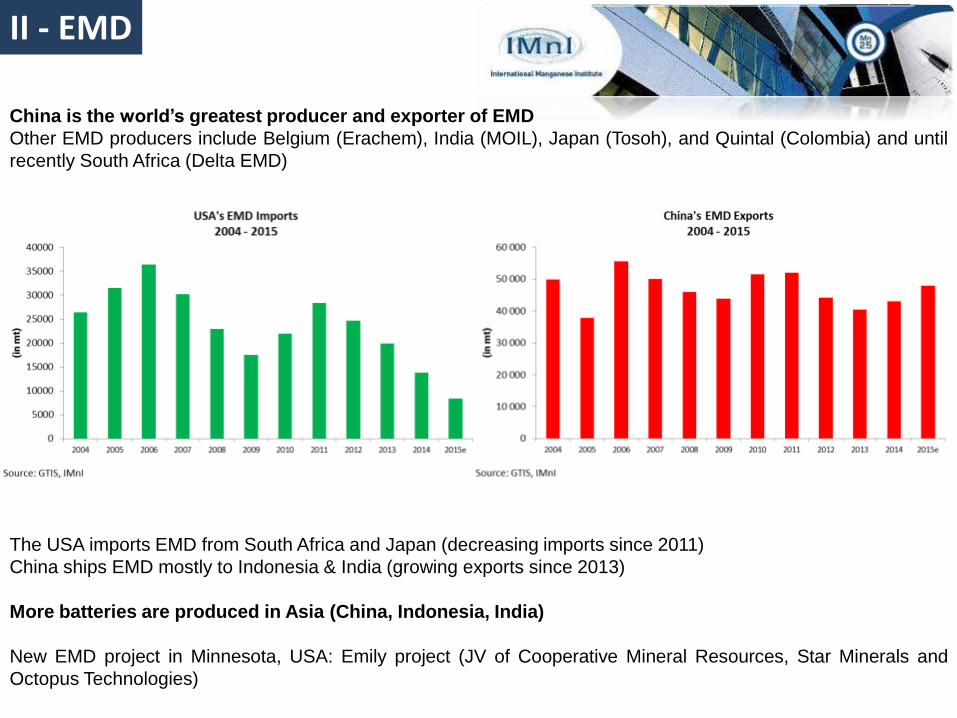
The USA imports EMD from South Africa and Japan (decreasing imports since 2011)
China ships EMD mostly to Indonesia & India (growing exports since 2013)
More batteries are produced in Asia (China, Indonesia, India)
New EMD project in Minnesota, USA: Emily project (JV of Cooperative Mineral Resources, Star Minerals and
Octopus Technologies)
China is the world’s greatest producer and exporter of EMD
Other EMD producers include Belgium (Erachem), India (MOIL), Japan (Tosoh), and Quintal (Colombia) and until
recently South Africa (Delta EMD)
II - EMD
Demand for EMD is growing because of:
- development of battery-powered products: transports, appliances, electronics, automotiveDemand for hybrid and electric vehicles in Europe +29% YoY to 144,421 new alternative fuel vehicles (AFV:including electric and hybrid cars and those powered by natural gas or LPG) registered in Q1 2015. Hybrid and
electric vehicles now account for 60% of the European AFV market, with cars fuelled by natural gasor LPG accounting for 40% - a year ago this ratio was 56% to 44%.
UK manufacturer Aston Martin Lagonda recently announced investment in a new all-electric luxury vehicleIn May 2015 Tesla entered the stationary battery storage sector with the offer of its first household lithium-ion
storage battery. It is targeting the stationary storage sector for 30% of sales from its upcoming giantGigawatt battery factory.
this trend will continue in the future due to heavy investments in research & development
Forecasts point to the battery sector growing by 370% by 2025 (Recharge industry association)
- Nickel-manganese-cobalt (NMC) batteries are progressively replacing lead acid batteries (which
use more cobalt) because of the higher cost of cobalt
II – EMM - China
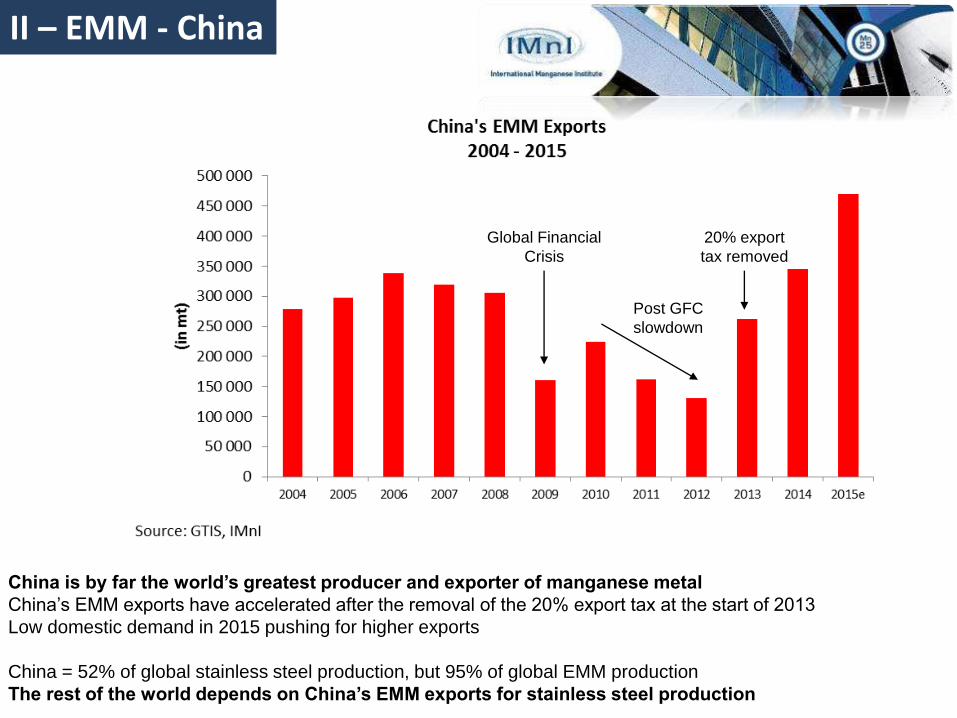
China is by far the world’s greatest producer and exporter of manganese metal
China’s EMM exports have accelerated after the removal of the 20% export tax at the start of 2013
Low domestic demand in 2015 pushing for higher exports
China = 52% of global stainless steel production, but 95% of global EMM production
The rest of the world depends on China’s EMM exports for stainless steel production
20% export
tax removed
Global Financial
Crisis
Post GFC
slowdown
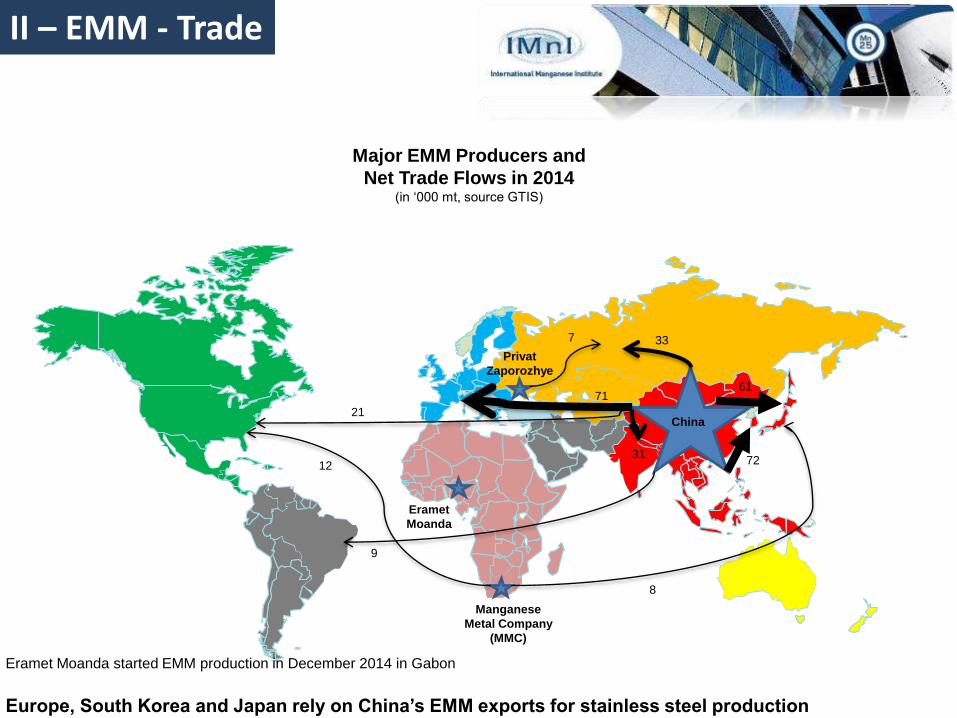
Major EMM Producers and
Net Trade Flows in 2014(in ‘000 mt, source GTIS)
II – EMM - Trade
Privat
Zaporozhye
Eramet
Moanda
Manganese
Metal Company
(MMC)
China
71
72
61
21
31
9
8
12
337
Eramet Moanda started EMM production in December 2014 in Gabon
Europe, South Korea and Japan rely on China’s EMM exports for stainless steel production
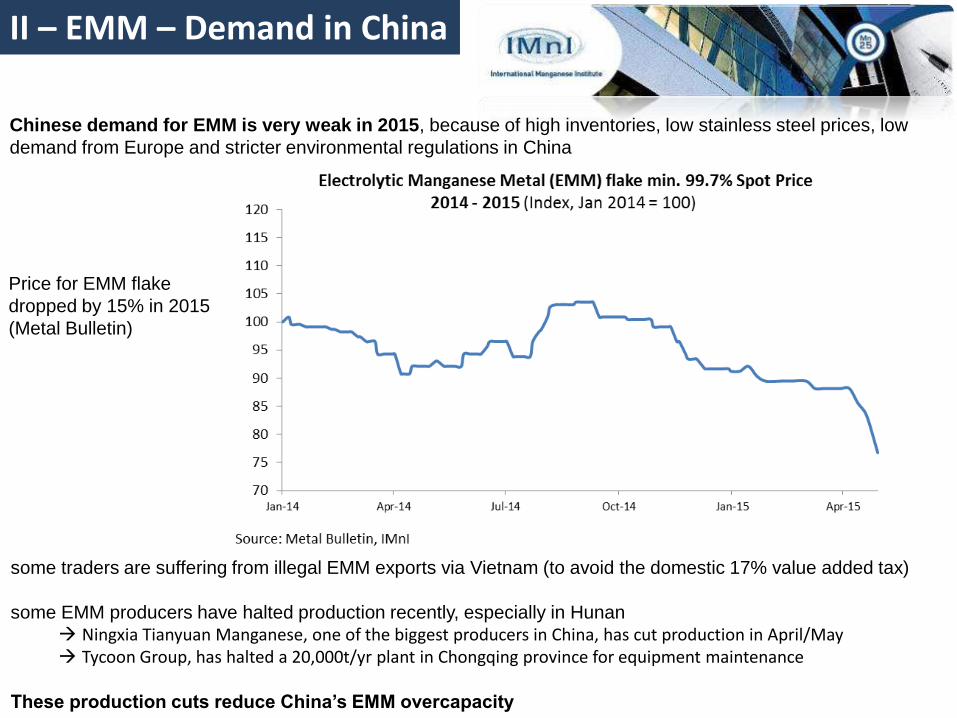
II – EMM – Demand in China
some traders are suffering from illegal EMM exports via Vietnam (to avoid the domestic 17% value added tax)
some EMM producers have halted production recently, especially in Hunan Ningxia Tianyuan Manganese, one of the biggest producers in China, has cut production in April/May Tycoon Group, has halted a 20,000t/yr plant in Chongqing province for equipment maintenance
These production cuts reduce China’s EMM overcapacity
Chinese demand for EMM is very weak in 2015, because of high inventories, low stainless steel prices, low
demand from Europe and stricter environmental regulations in China
Price for EMM flake
dropped by 15% in 2015
(Metal Bulletin)
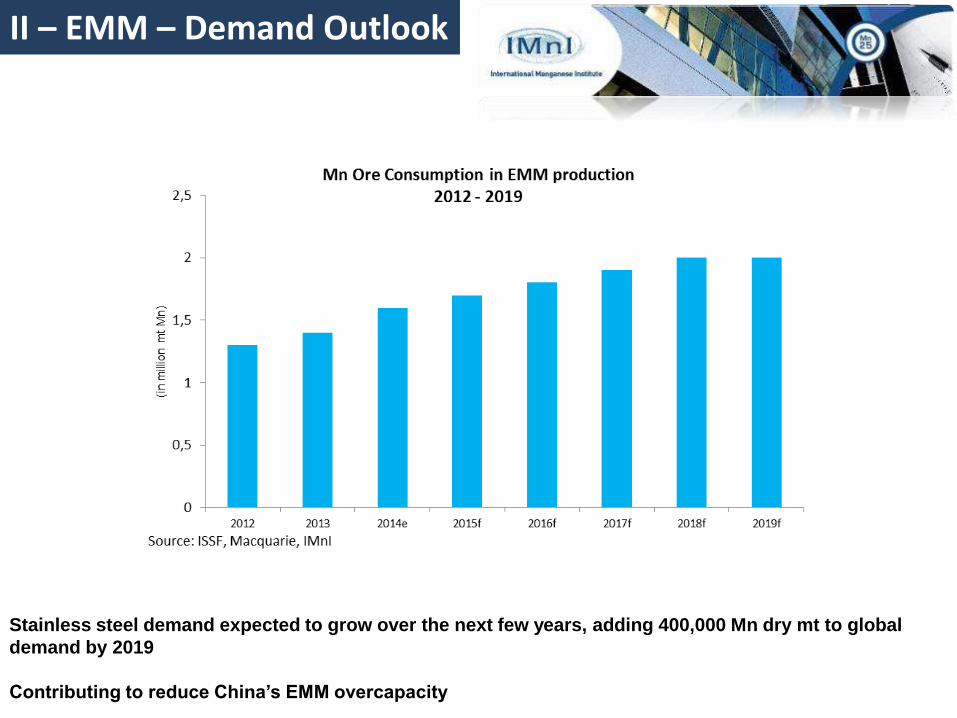
II – EMM – Demand Outlook
Stainless steel demand expected to grow over the next few years, adding 400,000 Mn dry mt to global
demand by 2019
Contributing to reduce China’s EMM overcapacity
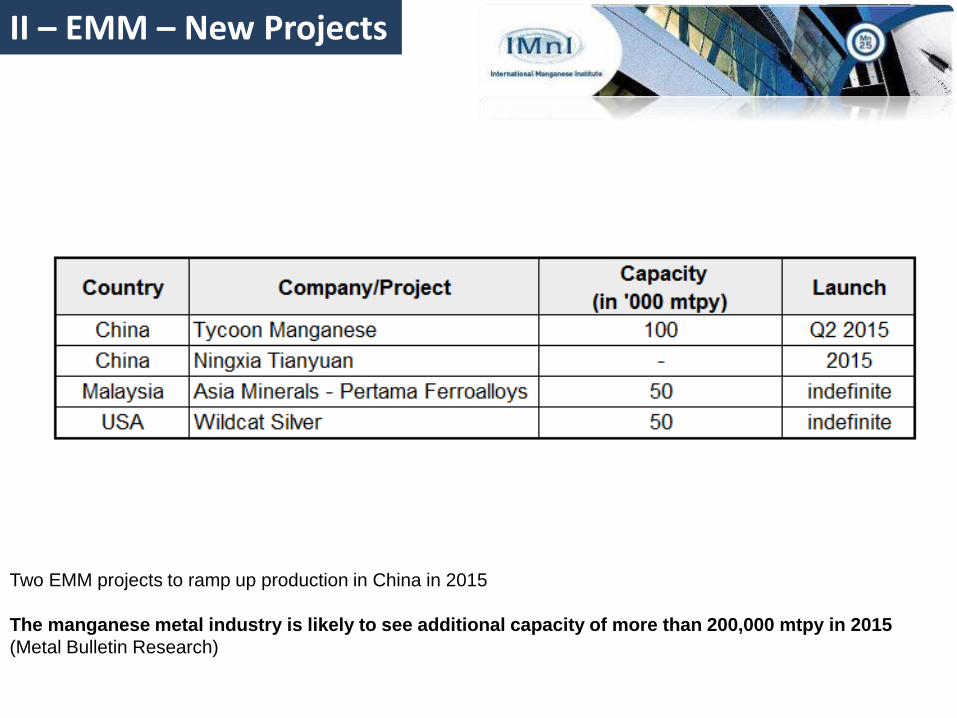
II – EMM – New Projects
Two EMM projects to ramp up production in China in 2015
The manganese metal industry is likely to see additional capacity of more than 200,000 mtpy in 2015
(Metal Bulletin Research)
Introduction
I – Stainless Steel
II – EMD & EMM
III – Manganese Ore
Conclusion
Outline
-0.8%
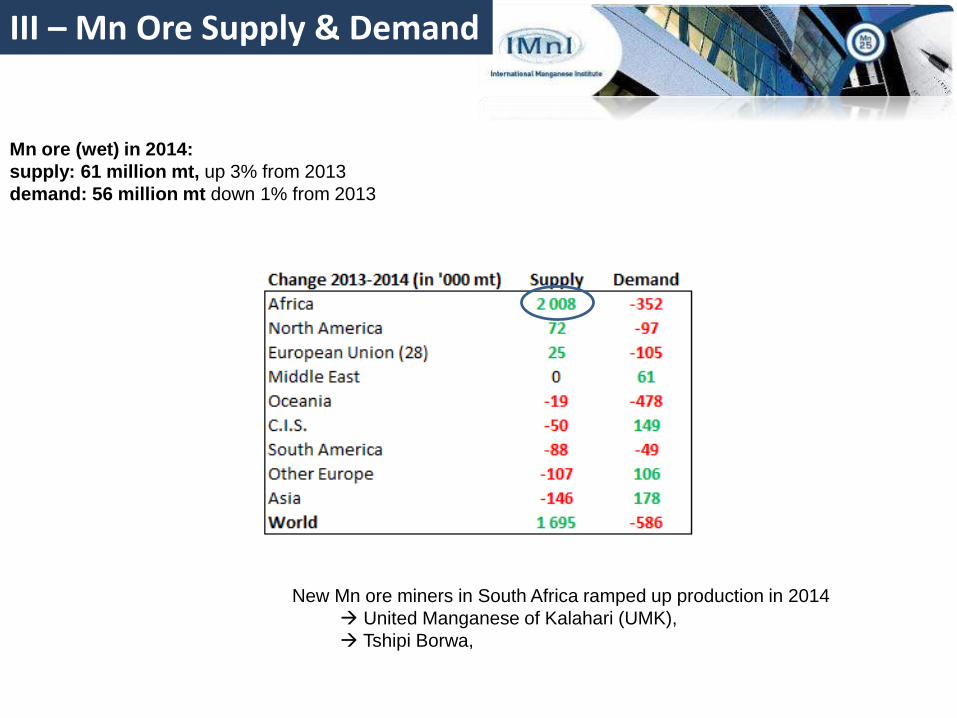
Mn ore (wet) in 2014:
supply: 61 million mt, up 3% from 2013
demand: 56 million mt down 1% from 2013
III – Mn Ore Supply & Demand
New Mn ore miners in South Africa ramped up production in 2014
United Manganese of Kalahari (UMK),
Tshipi Borwa,
III - Mn Ore S&D Balance
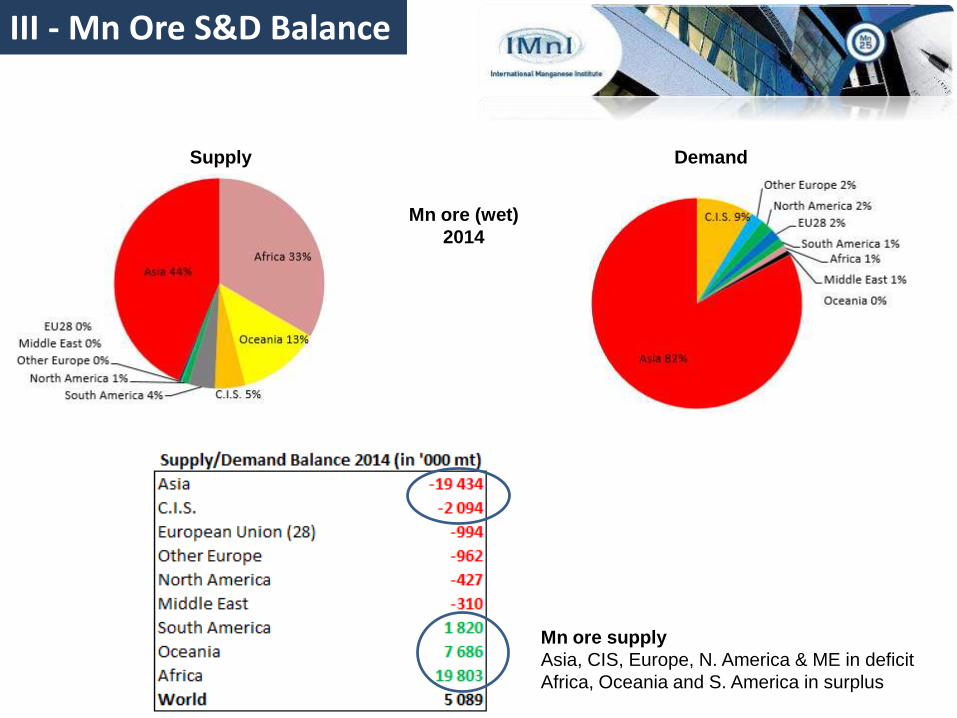
Mn ore (wet)
2014
Supply Demand
Mn ore supply
Asia, CIS, Europe, N. America & ME in deficit
Africa, Oceania and S. America in surplus
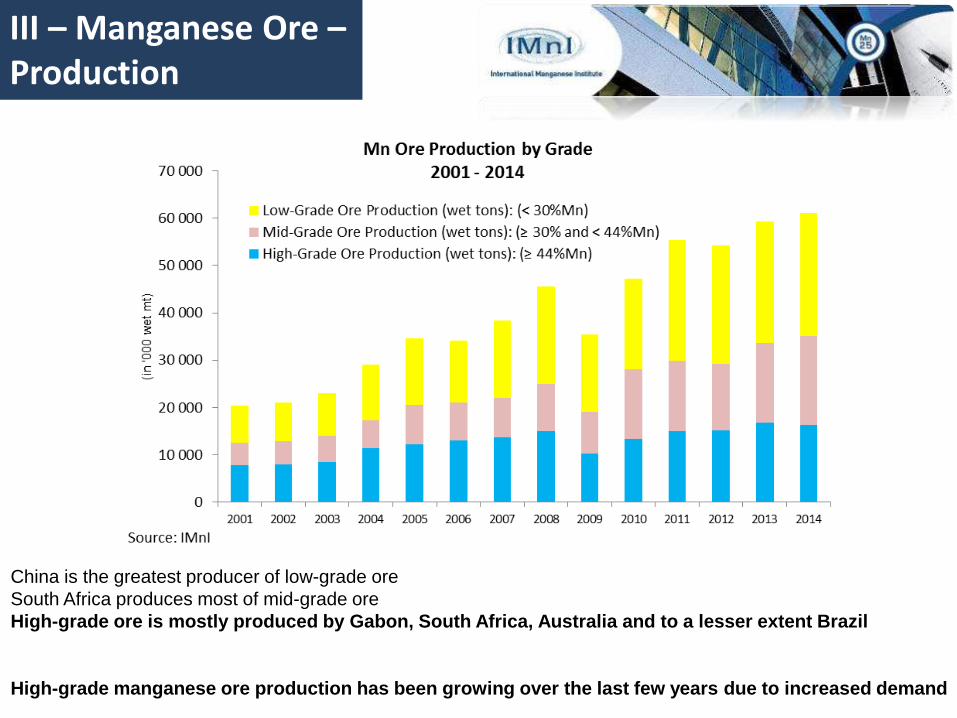
China is the greatest producer of low-grade ore
South Africa produces most of mid-grade ore
High-grade ore is mostly produced by Gabon, South Africa, Australia and to a lesser extent Brazil
High-grade manganese ore production has been growing over the last few years due to increased demand
III – Manganese Ore –Production
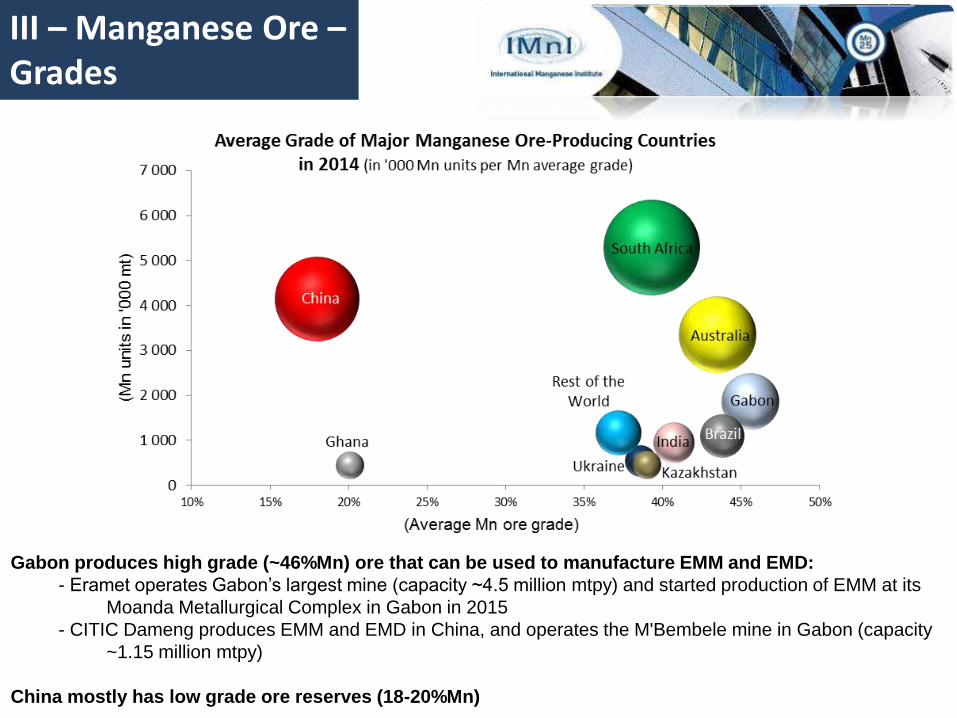
Gabon produces high grade (~46%Mn) ore that can be used to manufacture EMM and EMD:
- Eramet operates Gabon’s largest mine (capacity ~4.5 million mtpy) and started production of EMM at its
Moanda Metallurgical Complex in Gabon in 2015
- CITIC Dameng produces EMM and EMD in China, and operates the M'Bembele mine in Gabon (capacity
~1.15 million mtpy)
China mostly has low grade ore reserves (18-20%Mn)
III – Manganese Ore –Grades
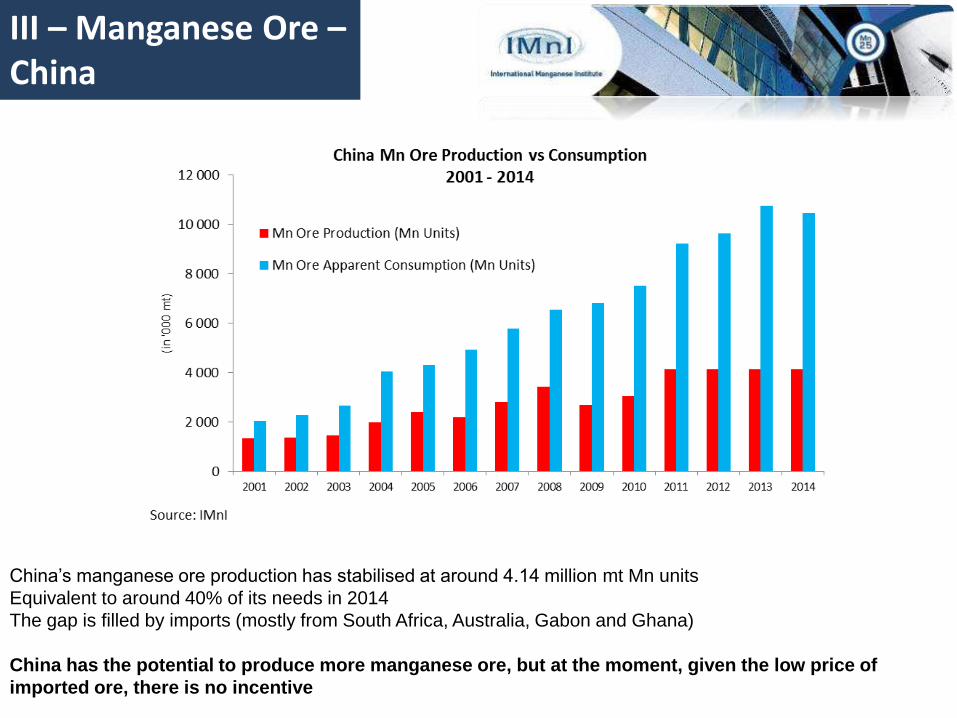
III – Manganese Ore –China
China’s manganese ore production has stabilised at around 4.14 million mt Mn units
Equivalent to around 40% of its needs in 2014
The gap is filled by imports (mostly from South Africa, Australia, Gabon and Ghana)
China has the potential to produce more manganese ore, but at the moment, given the low price of
imported ore, there is no incentive
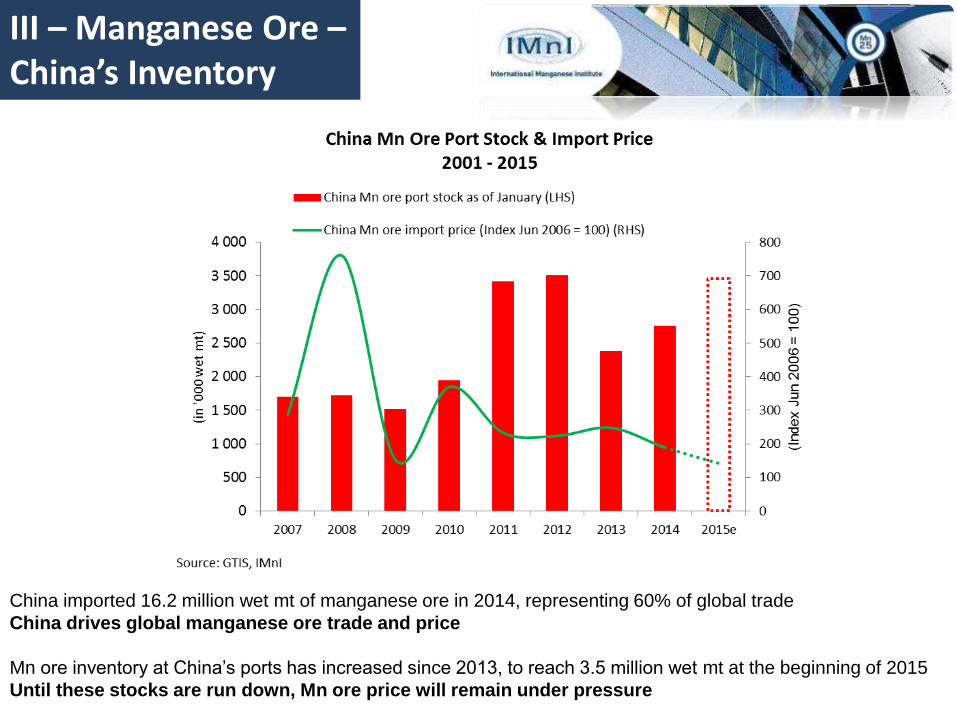
III – Manganese Ore –China’s Inventory
China imported 16.2 million wet mt of manganese ore in 2014, representing 60% of global trade
China drives global manganese ore trade and price
Mn ore inventory at China’s ports has increased since 2013, to reach 3.5 million wet mt at the beginning of 2015
Until these stocks are run down, Mn ore price will remain under pressure
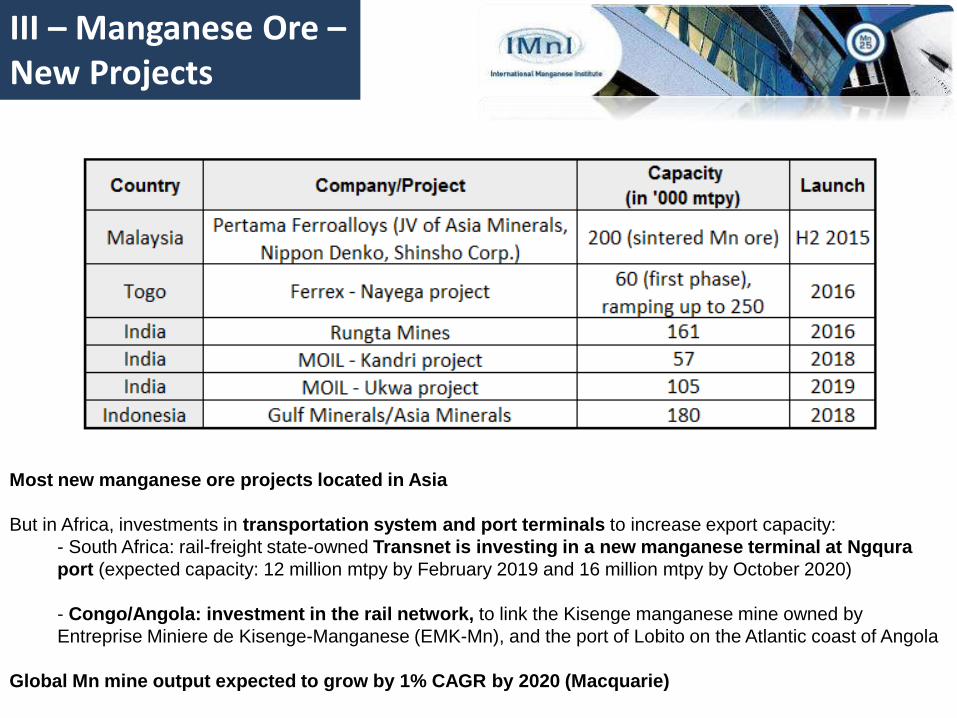
Most new manganese ore projects located in Asia
But in Africa, investments in transportation system and port terminals to increase export capacity:
- South Africa: rail-freight state-owned Transnet is investing in a new manganese terminal at Ngqura
port (expected capacity: 12 million mtpy by February 2019 and 16 million mtpy by October 2020)
- Congo/Angola: investment in the rail network, to link the Kisenge manganese mine owned by
Entreprise Miniere de Kisenge-Manganese (EMK-Mn), and the port of Lobito on the Atlantic coast of Angola
Global Mn mine output expected to grow by 1% CAGR by 2020 (Macquarie)
III – Manganese Ore –New Projects
Introduction
I – Stainless Steel
II – EMD & EMM
III – Manganese Ore
Conclusion
Outline
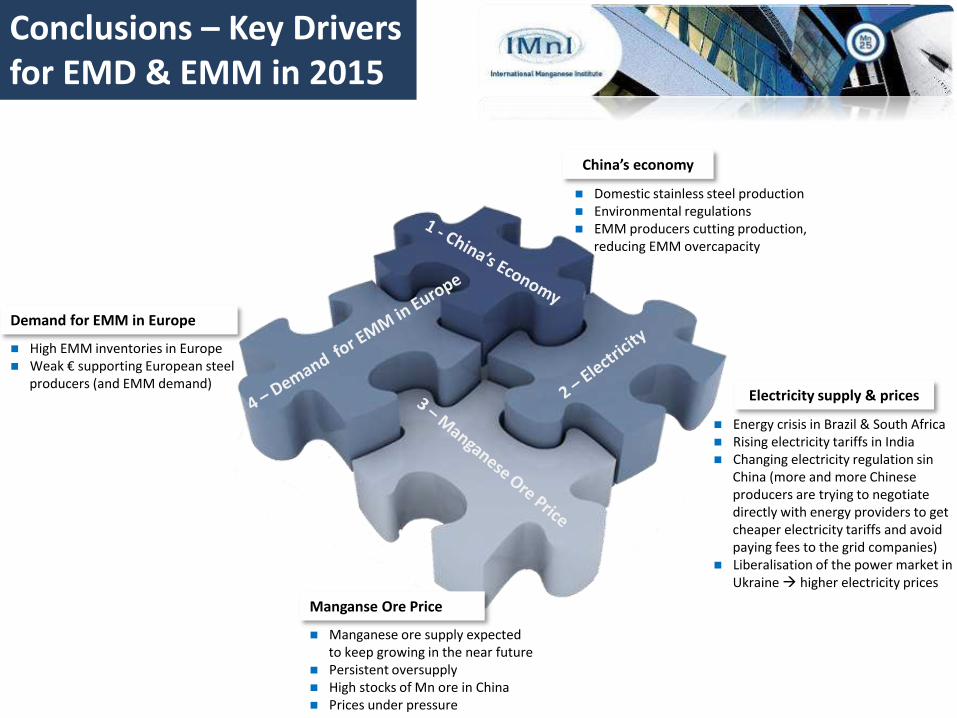
Conclusions – Key Drivers for EMD & EMM in 2015
-0.8%
Energy crisis in Brazil & South Africa Rising electricity tariffs in India Changing electricity regulation sin
China (more and more Chinese producers are trying to negotiate directly with energy providers to get cheaper electricity tariffs and avoid paying fees to the grid companies)
Liberalisation of the power market in Ukraine higher electricity prices
High EMM inventories in Europe Weak € supporting European steel
producers (and EMM demand)
Domestic stainless steel production Environmental regulations EMM producers cutting production,
reducing EMM overcapacity
Electricity supply & prices
China’s economy
Demand for EMM in Europe
Manganese ore supply expected to keep growing in the near future
Persistent oversupply High stocks of Mn ore in China Prices under pressure
Manganse Ore Price