Embed Size (px)
Citation preview
IST722 Data Warehousing Lab4Michael A. Fudge, Jr. OLAP Development with SSAS
Multi-Dimensional Online Analytical Processing (MOLAP) with SQL Server Analysis ServicesOverviewThis purpose of this lab is to introduce MOLAP development to you using an actual OLAP tool. The tool we will use is called SQL Server Analysis Services or SSAS. The goal is to help you get a feel for how the concepts you’ve learned in class apply in a real-world scenario. Once you create your OLAP database you will visualize it in Excel 2013.
Disclaimer!As such it should be noted, this lab does not demonstrate everything you need to know about the MOLAP process, nor does it serve as training tool for SSAS. Both of these activities are beyond the scope of this course. Yes, when you’re finished with the lab you’ll know your way around SSAS, but more importantly you’ll understand the purpose and various capabilities of a MOLAP database.
To complete this lab you will need the following:
Access to your ist722_yournetid_dw database on SQL Server. Access to the SQL Server 2012 Data tools (used to create SSAS database objects). Microsoft Excel 2013. You should connect to your computer running your SQL server database before starting this lab.
Part 1: Understanding Analysis ServicesMicrosoft SQL Server Analysis Services 2014 allows us to build Multi-dimensional OLAP solutions. We can deploy these solutions to a special database which users can connect to and perform ad-hoc, interactive reporting. The OLAP database differs from a traditional database in that it supports:
Rich metadata in our dimensions – for example we can sort by month number but display the month’s name so that the ordering of months are correct Jan, Feb, Mar, erc…
Fixed and Ragged hierarchies Detection of measures in our fact tables, and their configuration as additive or semi-additive. Perspectives for limiting views into the OLAP database. Row-level security over our dimensional model. Aggregations – pre-calculations for performance improvements. Calculations, KPI’s, Data mining and more!
Analysis services consists of two components:
1) SQL Server Data tools – we use this to build our analysis services databases.2) SQL Server Analysis Services– we deploy our analysis services databases to this server to test
and deploy our packages
1 | P a g e
IST722 Data Warehousing Lab4Michael A. Fudge, Jr. OLAP Development with SSAS
Terminology Data source – Connections to relational databases and other sources of data. Data Source View – The logical model of the schema used by Analysis services. Typically comes
from one source, but can be derived from several sources. You can create joins in your data sources which do not exists in your ROLAP model
Cubes – A set of measures and dimensions used to analyze data. This is the primary delivery mechanism for OLAP services.
Dimensions – At the name implies, these are dimensions. Typically there are additional rows in the dimension tables such as AuditColumns, and SCD columns we do not wish to include in the OLAP presentation. Also we can rename our columns in our MOLAP dimensions, provided different display and sort values as well as create hierarchies.
Mining Structures – Defines a domain for a data mining models. Roles – Allows you to secure dimensions, measures and/or values in the cubes. Your netid
requires admin access to your ist722_yournetid database. Without it you will not be able to deploy the database.
Assemblies – Code libraries which are required by the project. These typically include custom data sources or data mining models.
Quick Walk-ThruIn this section we’ll walk through creating and deploying an empty analysis services database. This will give you a general overview of how the process works and help setup your project for the rest of the lab.
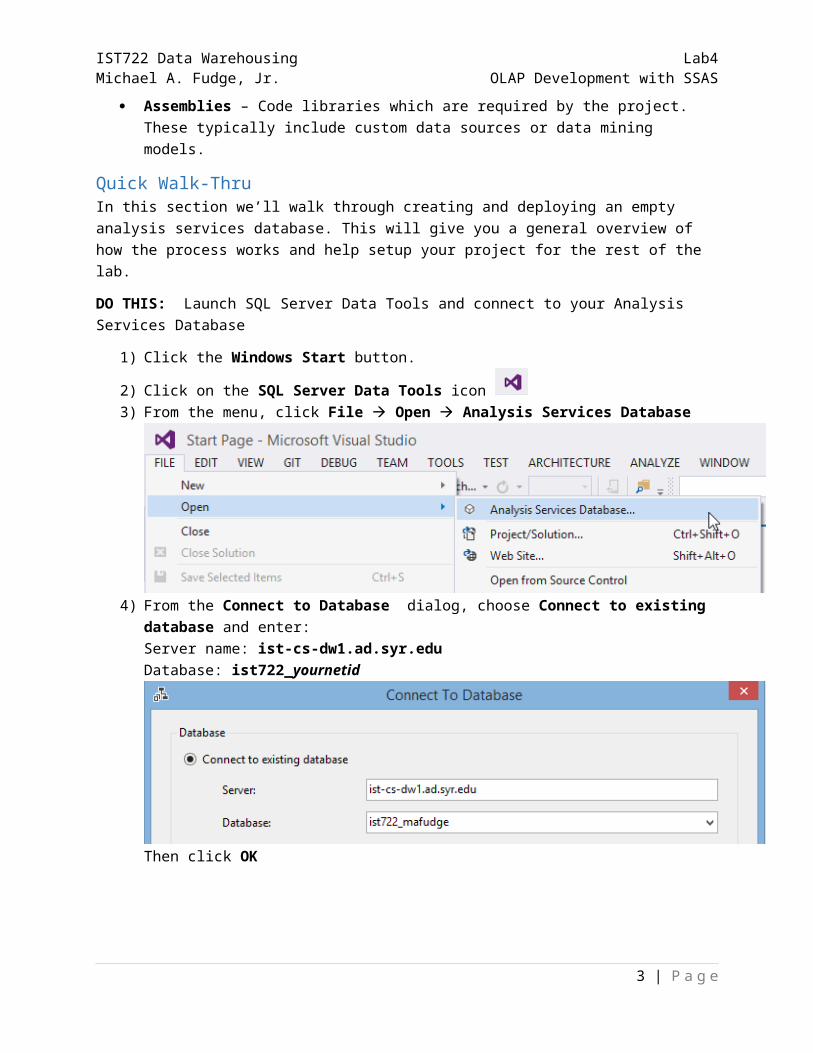
DO THIS: Launch SQL Server Data Tools and connect to your Analysis Services Database
1) Click the Windows Start button.
2) Click on the SQL Server Data Tools icon 3) From the menu, click File Open Analysis Services Database
4) From the Connect to Database dialog, choose Connect to existing database and enter:Server name: ist-cs-dw1.ad.syr.edu Database: ist722_yournetid
2 | P a g e
IST722 Data Warehousing Lab4Michael A. Fudge, Jr. OLAP Development with SSAS
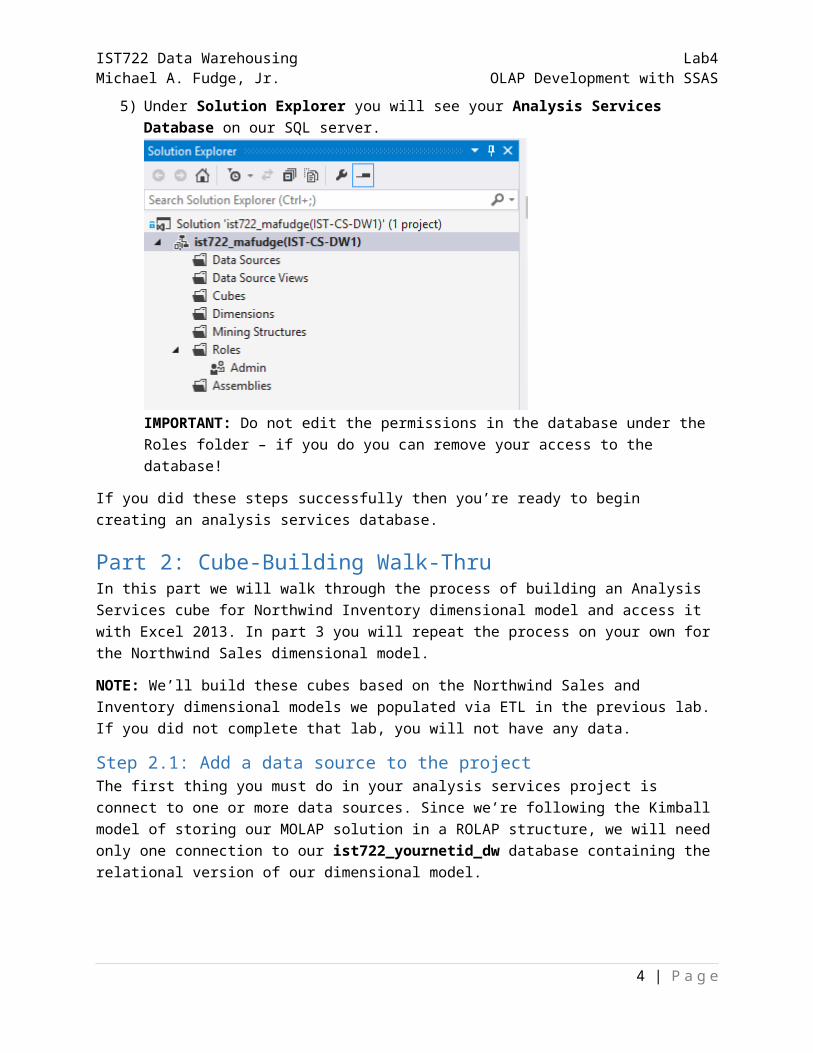
Then click OK 5) Under Solution Explorer you will see your Analysis Services Database on our SQL server.
IMPORTANT: Do not edit the permissions in the database under the Roles folder – if you do you can remove your access to the database!
If you did these steps successfully then you’re ready to begin creating an analysis services database.
Part 2: Cube-Building Walk-ThruIn this part we will walk through the process of building an Analysis Services cube for Northwind Inventory dimensional model and access it with Excel 2013. In part 3 you will repeat the process on your own for the Northwind Sales dimensional model.
NOTE: We’ll build these cubes based on the Northwind Sales and Inventory dimensional models we populated via ETL in the previous lab. If you did not complete that lab, you will not have any data.
Step 2.1: Add a data source to the projectThe first thing you must do in your analysis services project is connect to one or more data sources. Since we’re following the Kimball model of storing our MOLAP solution in a ROLAP structure, we will need only one connection to our ist722_yournetid_dw database containing the relational version of our dimensional model.
3 | P a g e
IST722 Data Warehousing Lab4Michael A. Fudge, Jr. OLAP Development with SSAS
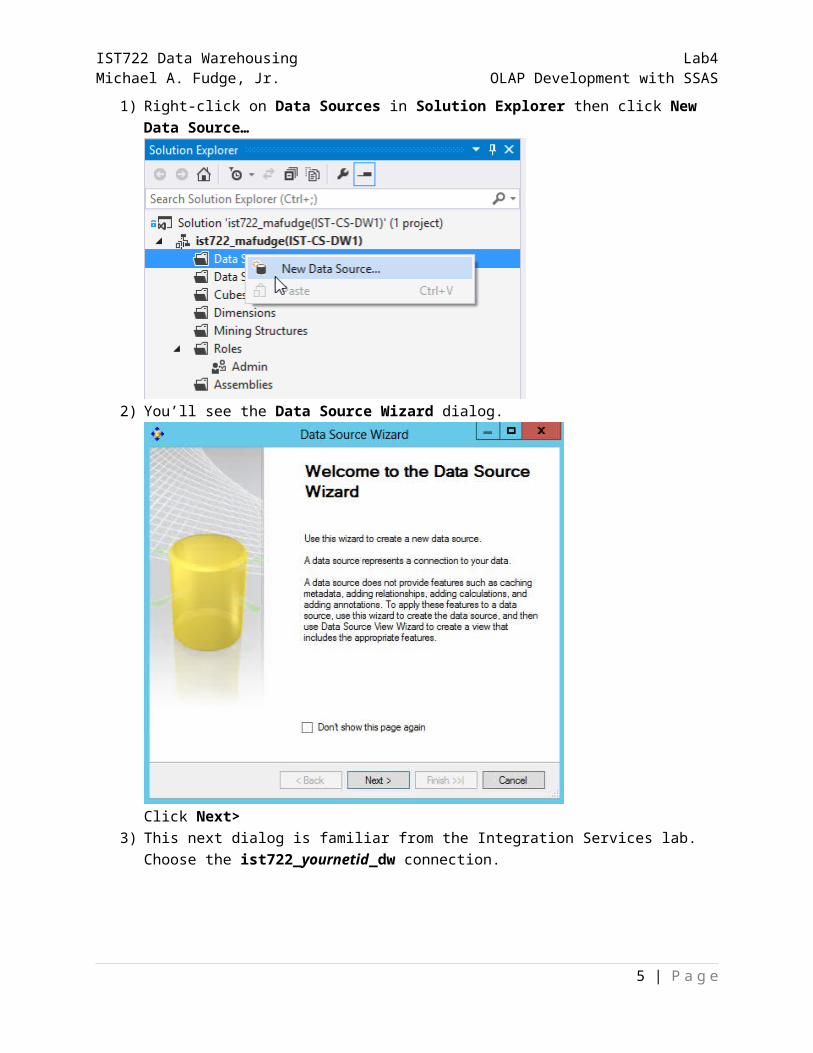
1) Right-click on Data Sources in Solution Explorer then click New Data Source…
2) You’ll see the Data Source Wizard dialog.
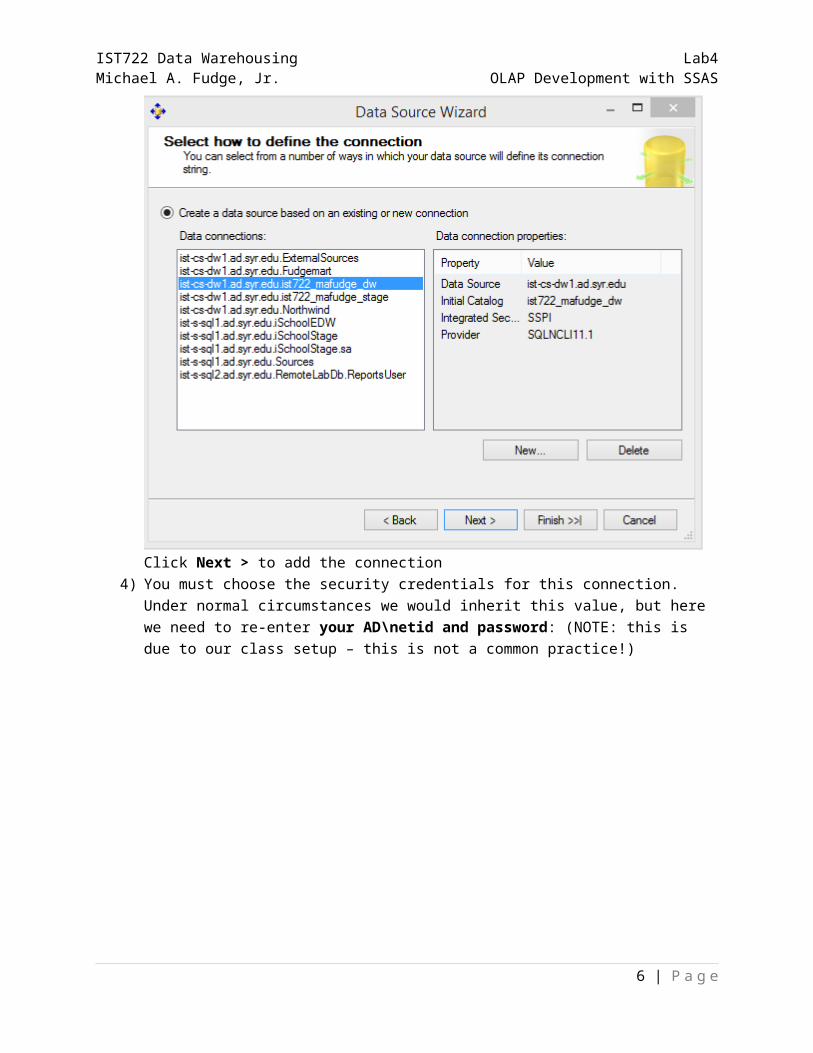
Click Next>3) This next dialog is familiar from the Integration Services lab. Choose the ist722_yournetid_dw
connection.
4 | P a g e
IST722 Data Warehousing Lab4Michael A. Fudge, Jr. OLAP Development with SSAS
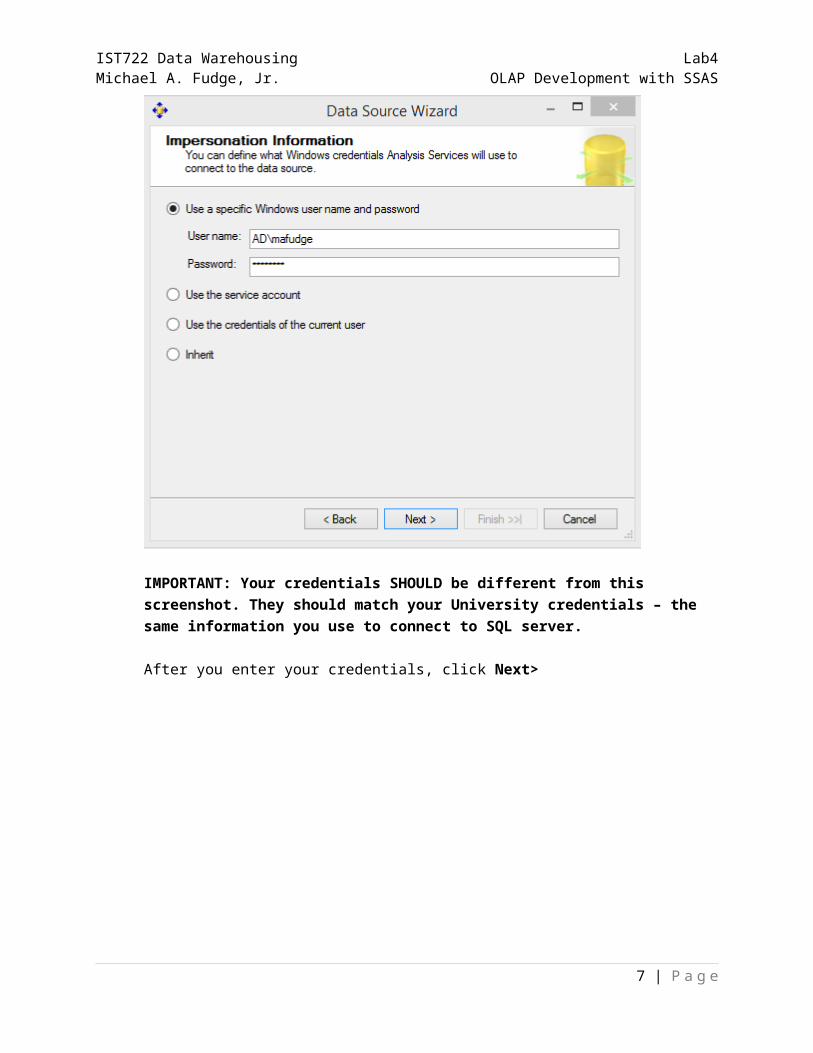
Click Next > to add the connection4) You must choose the security credentials for this connection. Under normal circumstances we
would inherit this value, but here we need to re-enter your AD\netid and password: (NOTE: this is due to our class setup – this is not a common practice!)
5 | P a g e
IST722 Data Warehousing Lab4Michael A. Fudge, Jr. OLAP Development with SSAS
IMPORTANT: Your credentials SHOULD be different from this screenshot. They should match your University credentials – the same information you use to connect to SQL server.
After you enter your credentials, click Next>
6 | P a g e
IST722 Data Warehousing Lab4Michael A. Fudge, Jr. OLAP Development with SSAS
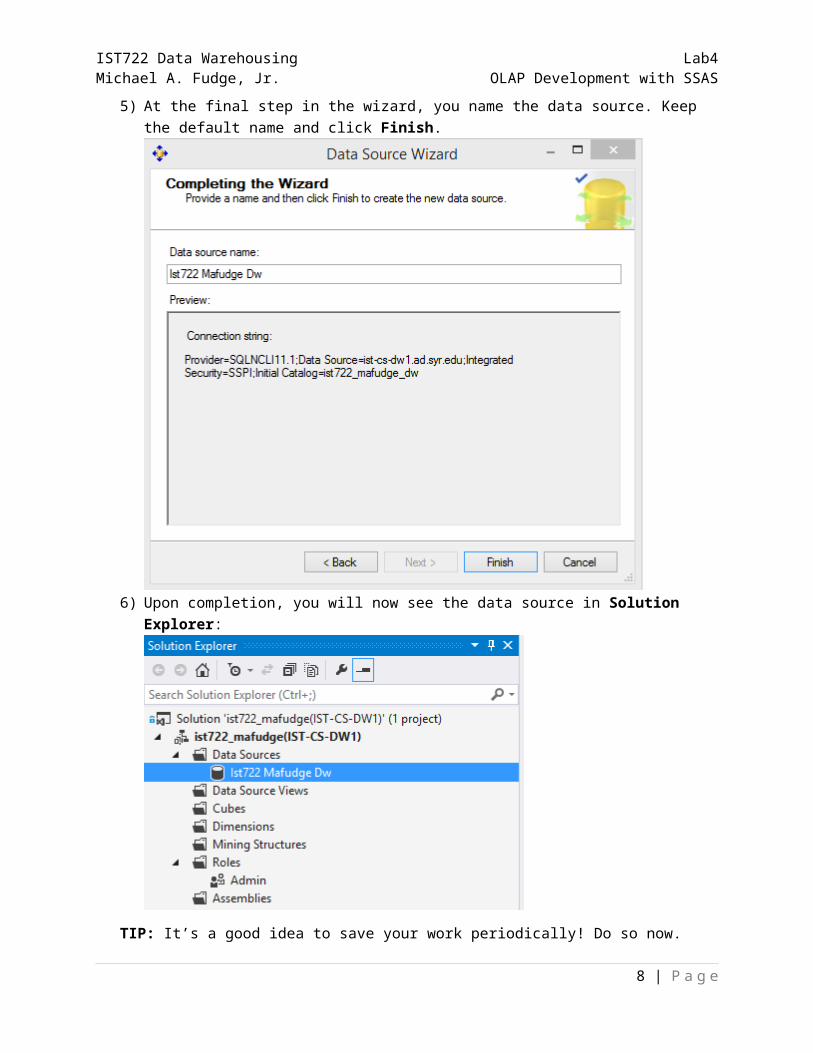
5) At the final step in the wizard, you name the data source. Keep the default name and click Finish.
6) Upon completion, you will now see the data source in Solution Explorer:
TIP: It’s a good idea to save your work periodically! Do so now.
7 | P a g e
IST722 Data Warehousing Lab4Michael A. Fudge, Jr. OLAP Development with SSAS
Step 2.2: Create the data source viewThe data source view contains the logical model of the relational objects (tables, keys, columns, and constraints) which will be used by your OLAP database to build out cubes. We will create the data source view for the Inventory Daily Snapshot dimensional model.
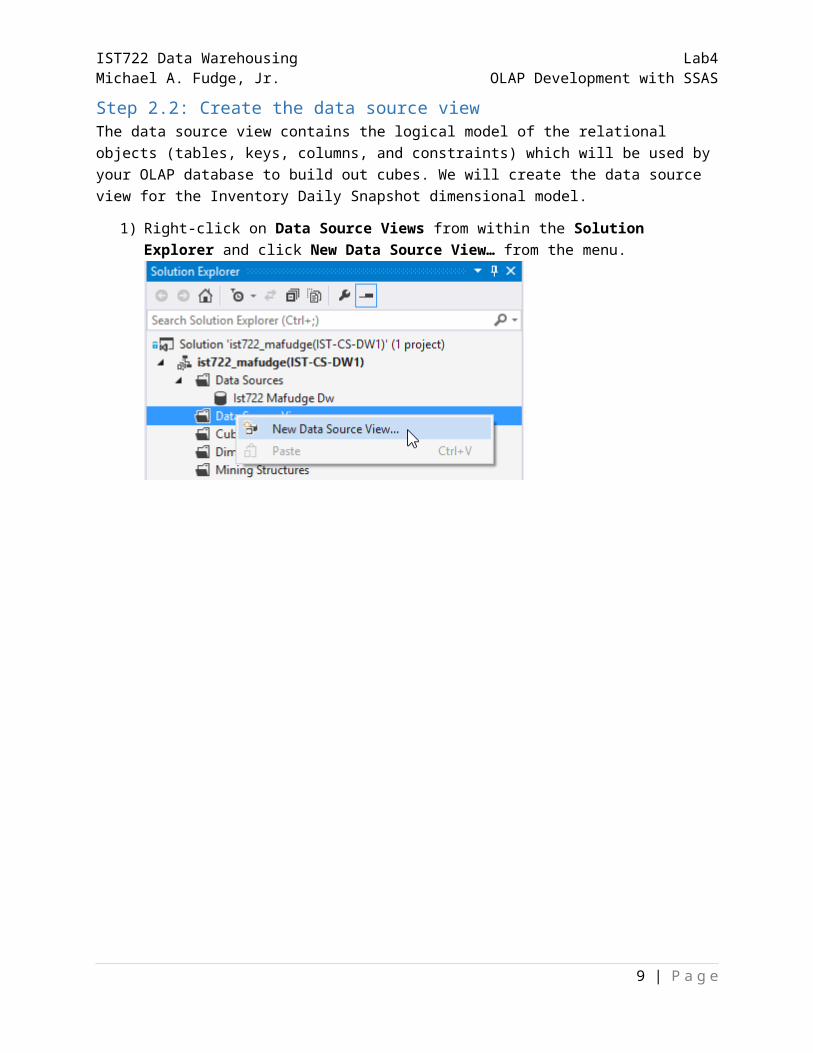
1) Right-click on Data Source Views from within the Solution Explorer and click New Data Source View… from the menu.
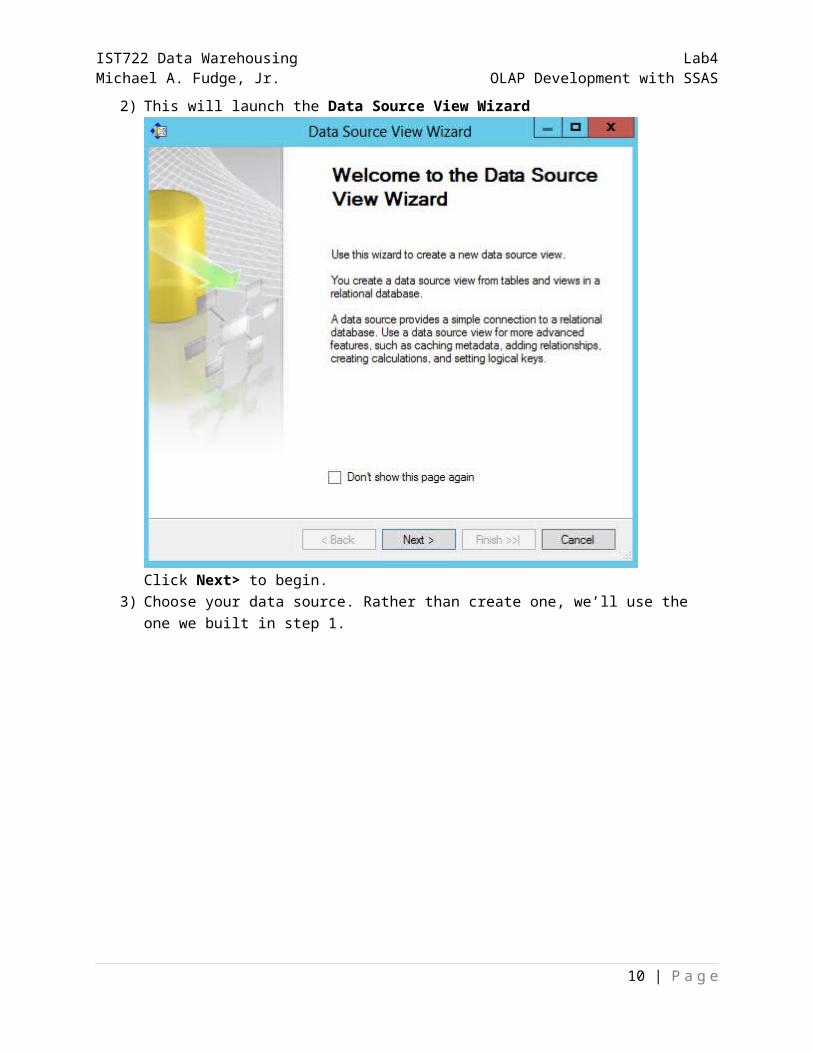
2) This will launch the Data Source View Wizard
Click Next> to begin.
8 | P a g e
IST722 Data Warehousing Lab4Michael A. Fudge, Jr. OLAP Development with SSAS
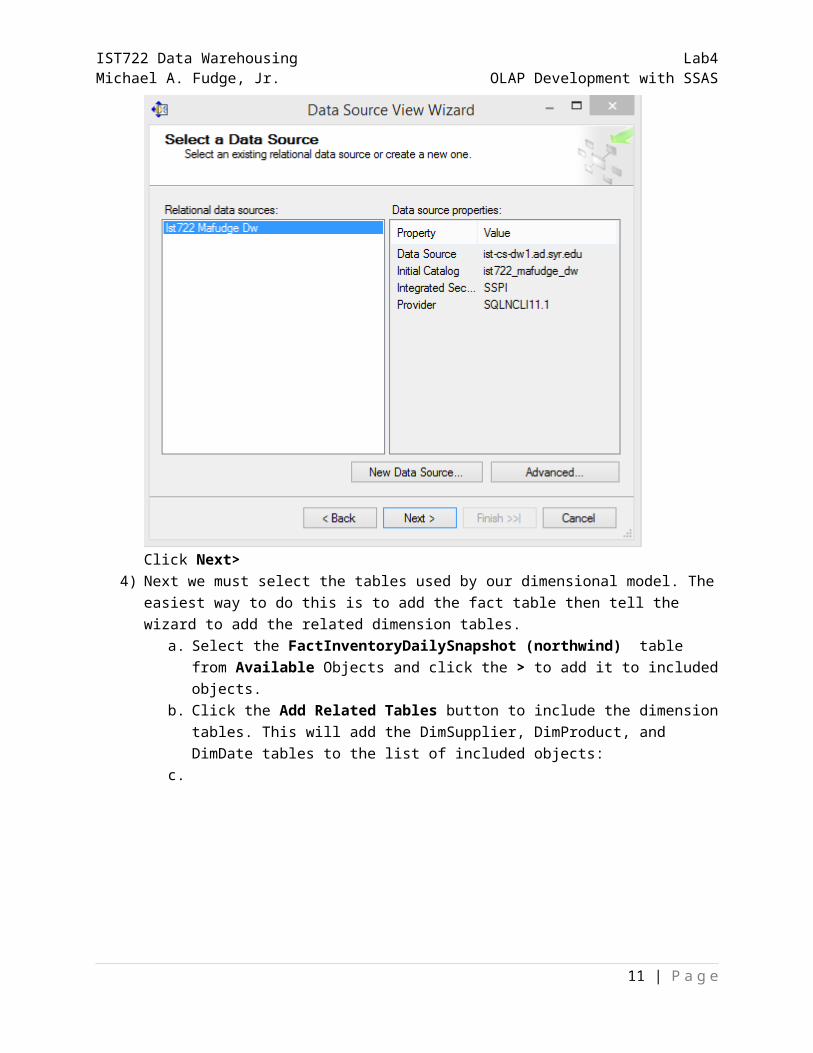
3) Choose your data source. Rather than create one, we’ll use the one we built in step 1.
Click Next>4) Next we must select the tables used by our dimensional model. The easiest way to do this is to
add the fact table then tell the wizard to add the related dimension tables. a. Select the FactInventoryDailySnapshot (northwind) table from Available Objects and
click the > to add it to included objects. b. Click the Add Related Tables button to include the dimension tables. This will add the
DimSupplier, DimProduct, and DimDate tables to the list of included objects:c.
9 | P a g e
IST722 Data Warehousing Lab4Michael A. Fudge, Jr. OLAP Development with SSAS
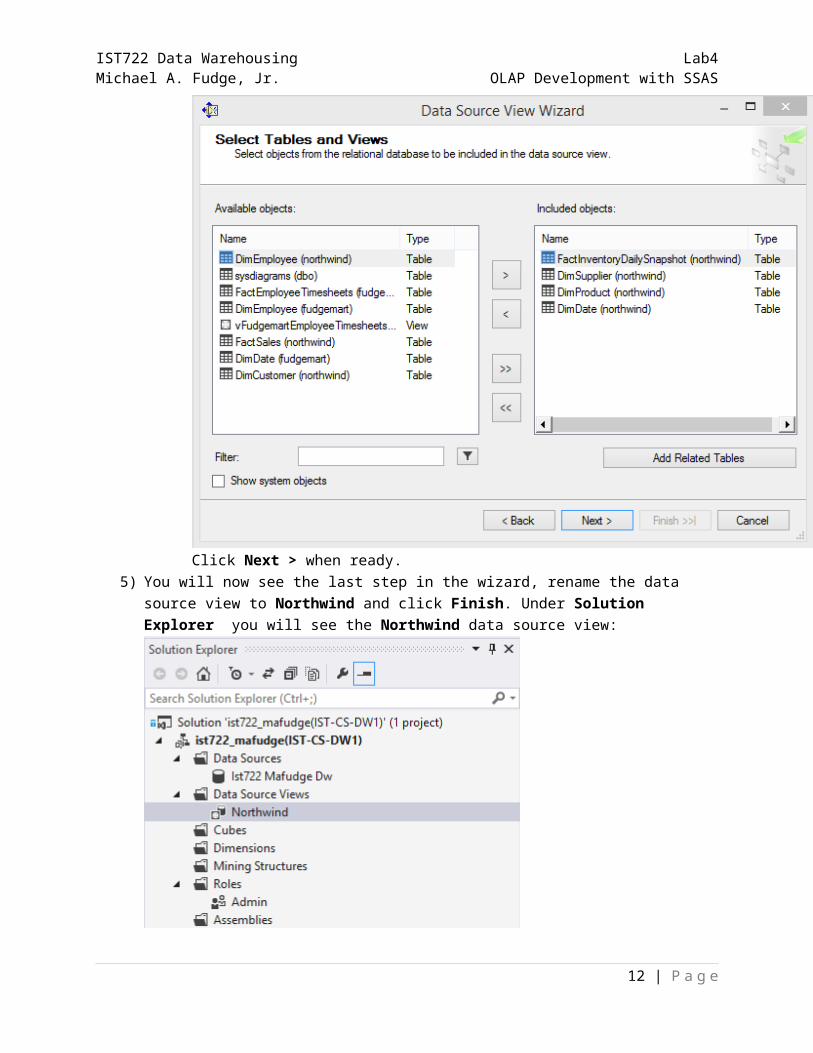
Click Next > when ready.5) You will now see the last step in the wizard, rename the data source view to Northwind and
click Finish. Under Solution Explorer you will see the Northwind data source view:
10 | P a g e
IST722 Data Warehousing Lab4Michael A. Fudge, Jr. OLAP Development with SSAS
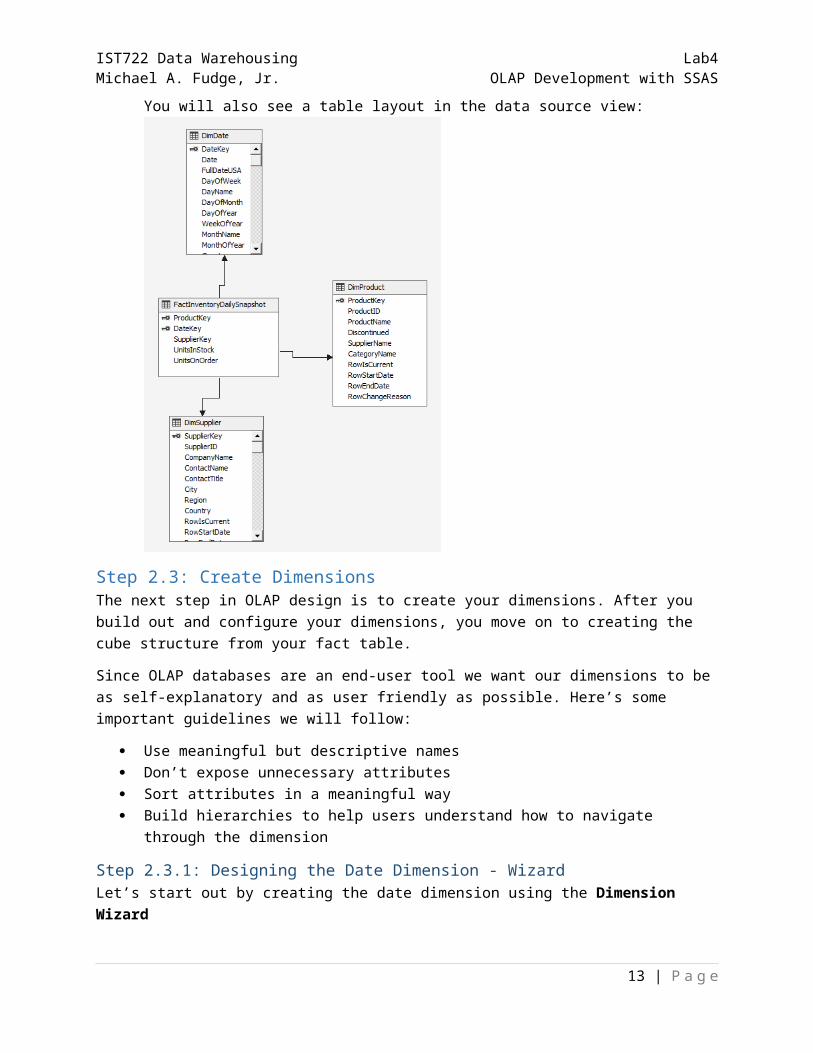
You will also see a table layout in the data source view:
Step 2.3: Create DimensionsThe next step in OLAP design is to create your dimensions. After you build out and configure your dimensions, you move on to creating the cube structure from your fact table.
Since OLAP databases are an end-user tool we want our dimensions to be as self-explanatory and as user friendly as possible. Here’s some important guidelines we will follow:
Use meaningful but descriptive names Don’t expose unnecessary attributes Sort attributes in a meaningful way Build hierarchies to help users understand how to navigate through the dimension
Step 2.3.1: Designing the Date Dimension - WizardLet’s start out by creating the date dimension using the Dimension Wizard
11 | P a g e
IST722 Data Warehousing Lab4Michael A. Fudge, Jr. OLAP Development with SSAS
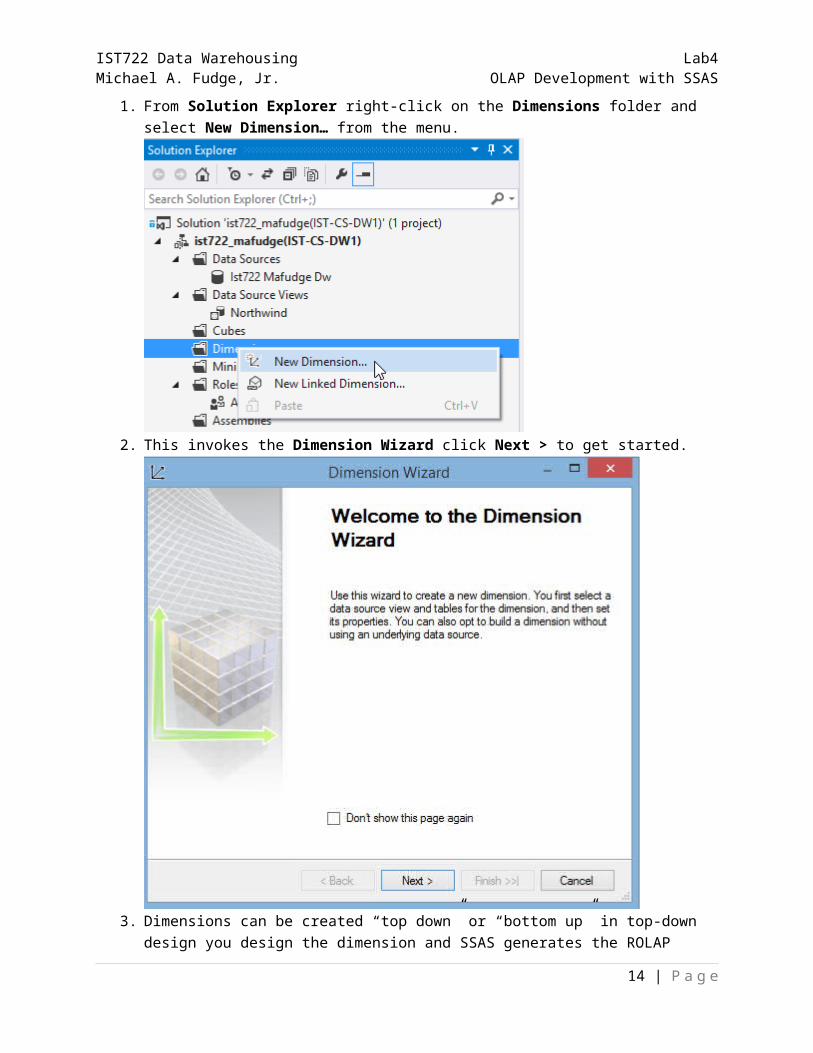
1. From Solution Explorer right-click on the Dimensions folder and select New Dimension… from the menu.
2. This invokes the Dimension Wizard click Next > to get started.
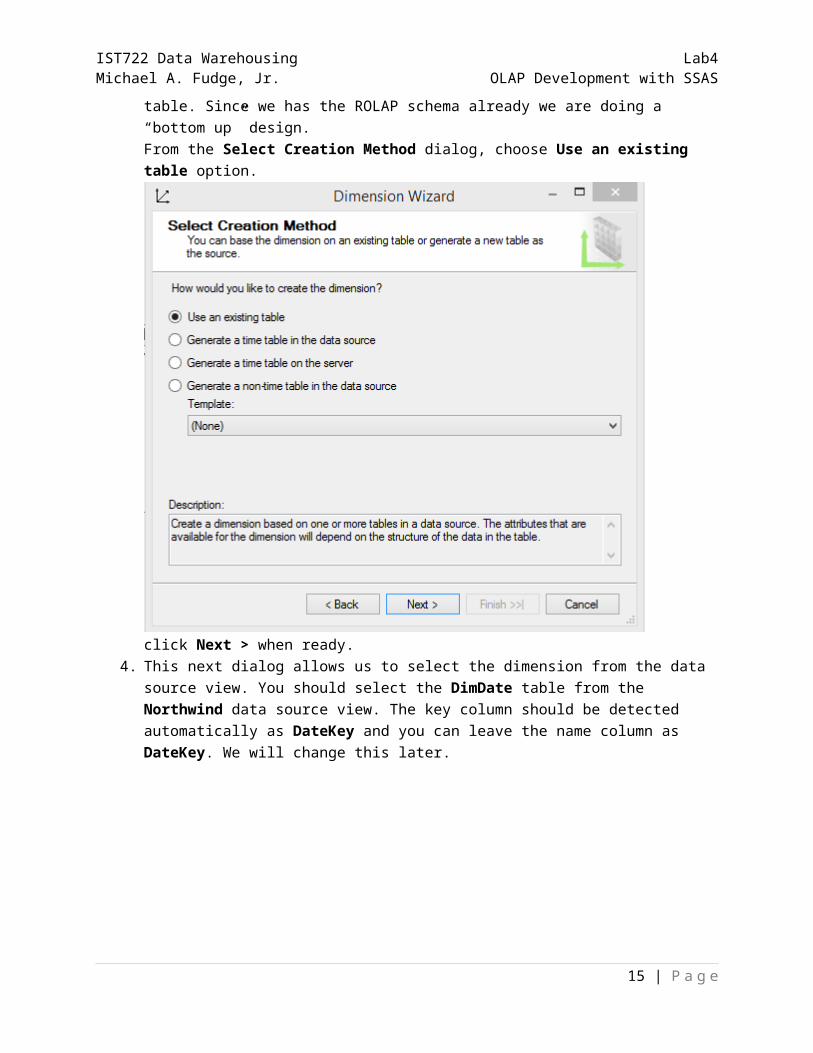
3. Dimensions can be created “top down” or “bottom up” in top-down design you design the dimension and SSAS generates the ROLAP table. Since we has the ROLAP schema already we are
12 | P a g e
IST722 Data Warehousing Lab4Michael A. Fudge, Jr. OLAP Development with SSAS
doing a “bottom up” design.From the Select Creation Method dialog, choose Use an existing table option.
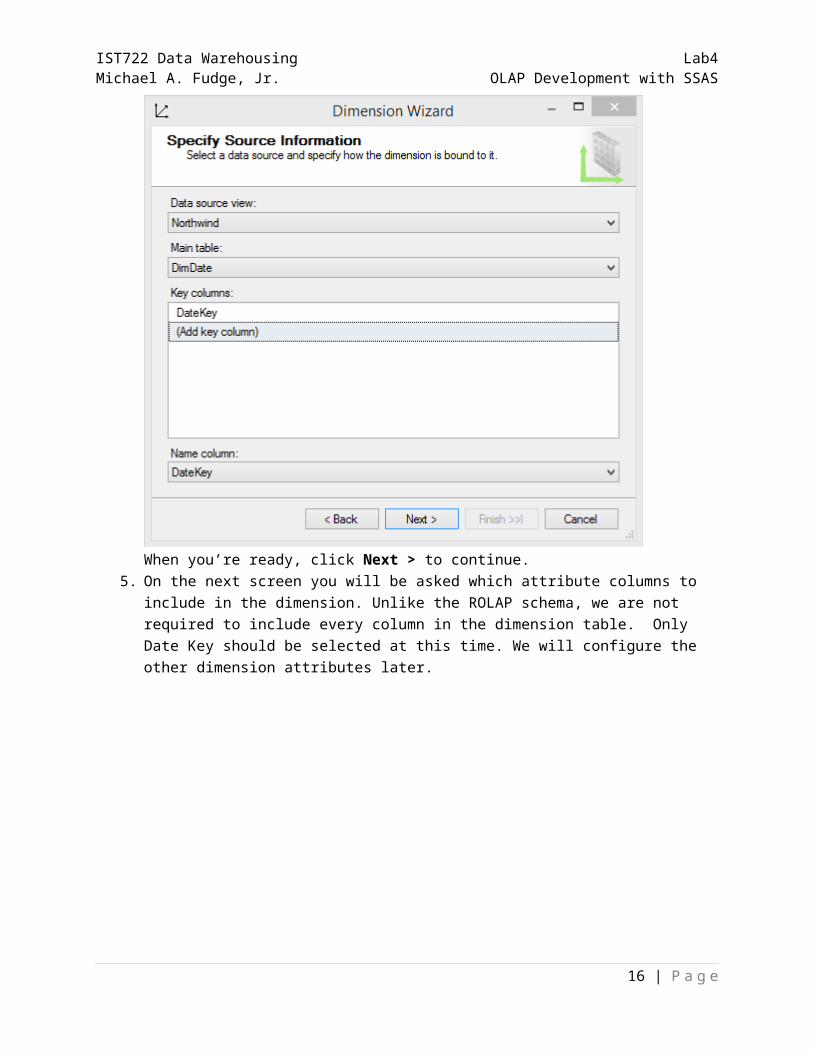
click Next > when ready.4. This next dialog allows us to select the dimension from the data source view. You should select
the DimDate table from the Northwind data source view. The key column should be detected automatically as DateKey and you can leave the name column as DateKey. We will change this later.
13 | P a g e
IST722 Data Warehousing Lab4Michael A. Fudge, Jr. OLAP Development with SSAS
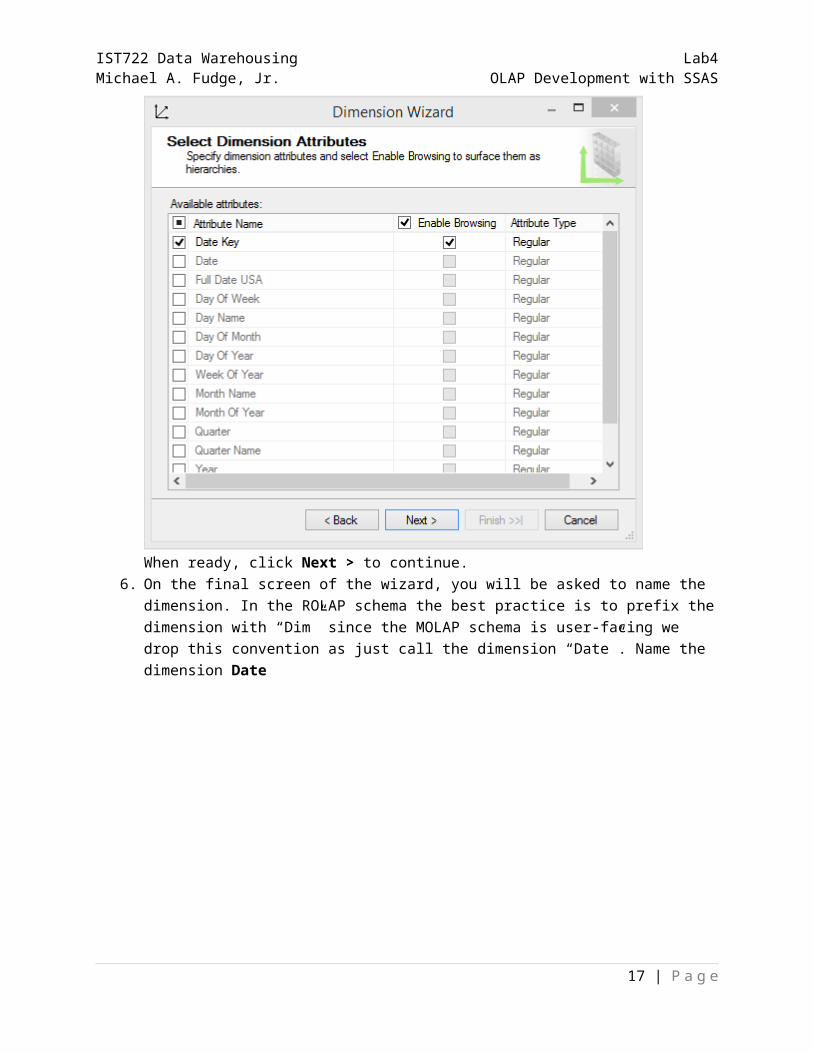
When you’re ready, click Next > to continue. 5. On the next screen you will be asked which attribute columns to include in the dimension.
Unlike the ROLAP schema, we are not required to include every column in the dimension table. Only Date Key should be selected at this time. We will configure the other dimension attributes later.
14 | P a g e
IST722 Data Warehousing Lab4Michael A. Fudge, Jr. OLAP Development with SSAS
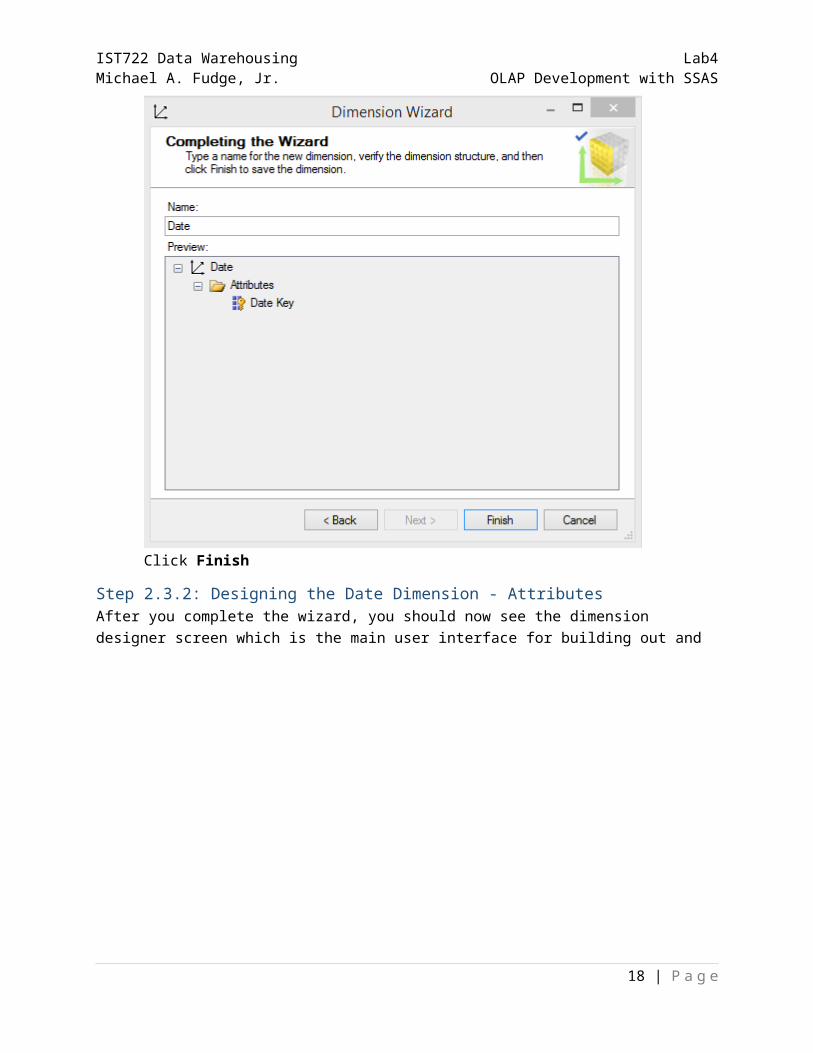
When ready, click Next > to continue.6. On the final screen of the wizard, you will be asked to name the dimension. In the ROLAP
schema the best practice is to prefix the dimension with “Dim” since the MOLAP schema is user-facing we drop this convention as just call the dimension “Date”. Name the dimension Date
15 | P a g e
IST722 Data Warehousing Lab4Michael A. Fudge, Jr. OLAP Development with SSAS
Click Finish
16 | P a g e
IST722 Data Warehousing Lab4Michael A. Fudge, Jr. OLAP Development with SSAS
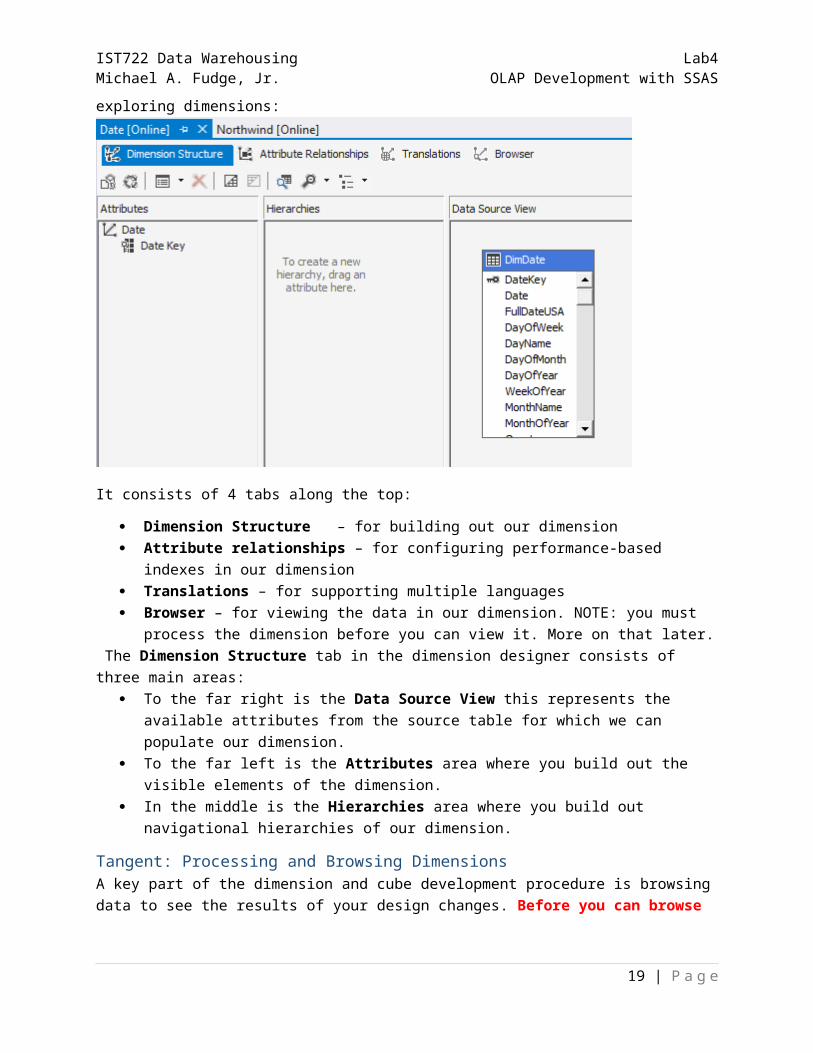
Step 2.3.2: Designing the Date Dimension - AttributesAfter you complete the wizard, you should now see the dimension designer screen which is the main user interface for building out and exploring dimensions:
It consists of 4 tabs along the top:
Dimension Structure – for building out our dimension Attribute relationships – for configuring performance-based indexes in our dimension Translations – for supporting multiple languages Browser – for viewing the data in our dimension. NOTE: you must process the dimension before
you can view it. More on that later. The Dimension Structure tab in the dimension designer consists of three main areas:
To the far right is the Data Source View this represents the available attributes from the source table for which we can populate our dimension.
To the far left is the Attributes area where you build out the visible elements of the dimension. In the middle is the Hierarchies area where you build out navigational hierarchies of our
dimension.
Tangent: Processing and Browsing DimensionsA key part of the dimension and cube development procedure is browsing data to see the results of your design changes. Before you can browse any change you make you must first process it. Processing simply loads the source ROLAP data into the MOLAP database.
As you are building out your MOLAP database you will iterate over the “Develop Process Browse Data” cycle several times. In large MOLAP databases processing can take a considerable amount of time which is why this procedure is not automated. It’s a good idea to become accustomed with the procedure. Try this now.
17 | P a g e
IST722 Data Warehousing Lab4Michael A. Fudge, Jr. OLAP Development with SSAS
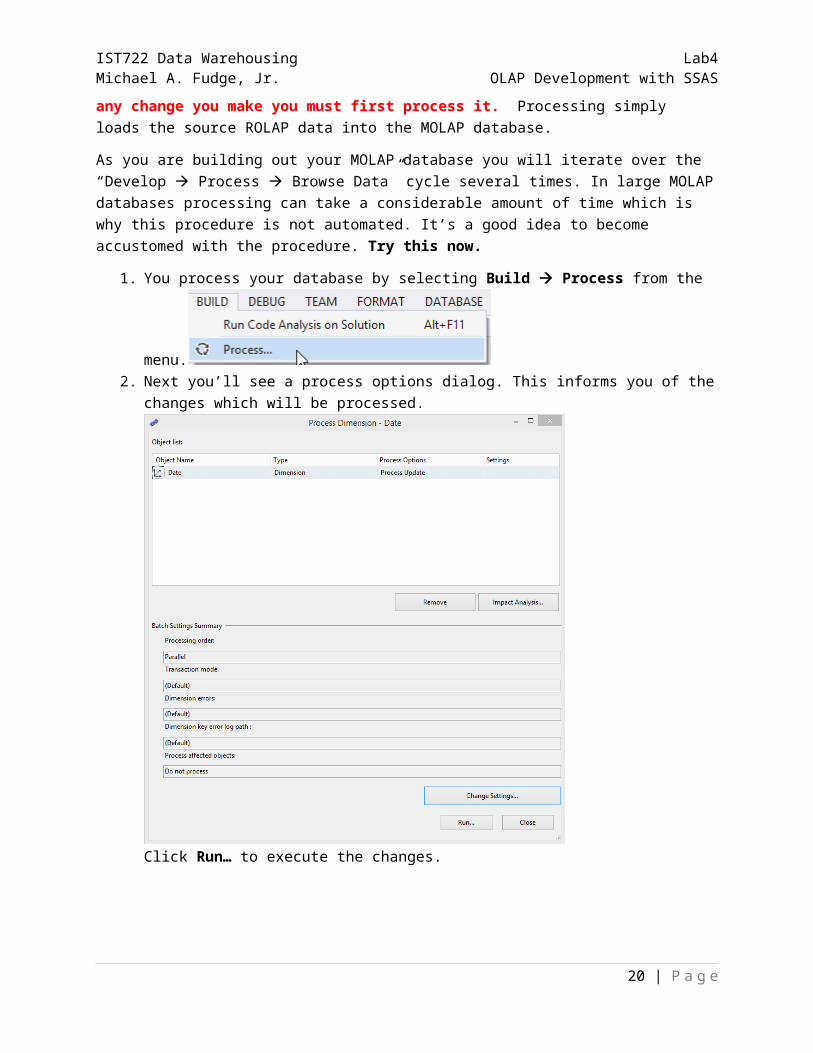
1. You process your database by selecting Build Process from the menu.
2. Next you’ll see a process options dialog. This informs you of the changes which will be processed.
Click Run… to execute the changes.
18 | P a g e
IST722 Data Warehousing Lab4Michael A. Fudge, Jr. OLAP Development with SSAS
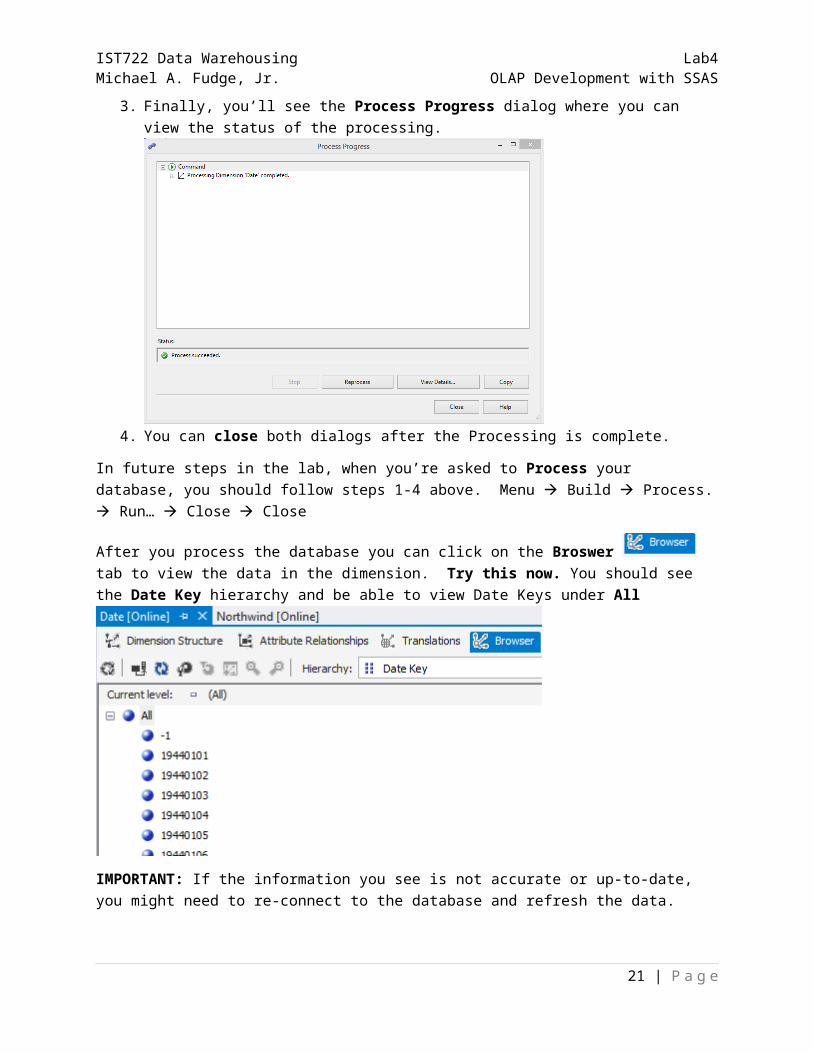
3. Finally, you’ll see the Process Progress dialog where you can view the status of the processing.
4. You can close both dialogs after the Processing is complete.
In future steps in the lab, when you’re asked to Process your database, you should follow steps 1-4 above. Menu Build Process. Run… Close Close
After you process the database you can click on the Broswer tab to view the data in the dimension. Try this now. You should see the Date Key hierarchy and be able to view Date Keys under All
19 | P a g e
IST722 Data Warehousing Lab4Michael A. Fudge, Jr. OLAP Development with SSAS
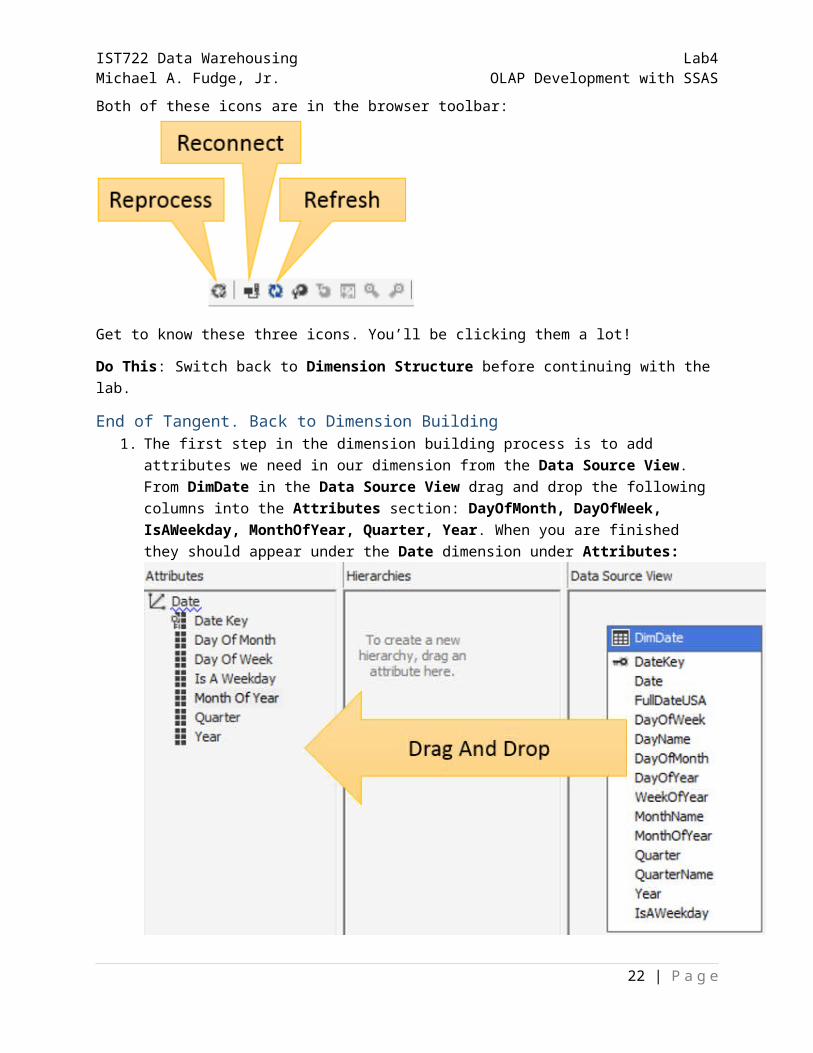
IMPORTANT: If the information you see is not accurate or up-to-date, you might need to re-connect to the database and refresh the data. Both of these icons are in the browser toolbar:
Get to know these three icons. You’ll be clicking them a lot!
Do This: Switch back to Dimension Structure before continuing with the lab.
End of Tangent. Back to Dimension Building1. The first step in the dimension building process is to add attributes we need in our dimension
from the Data Source View. From DimDate in the Data Source View drag and drop the following columns into the Attributes section: DayOfMonth, DayOfWeek, IsAWeekday, MonthOfYear, Quarter, Year. When you are finished they should appear under the Date dimension under Attributes:
2. Next, we need to configure each dimension attribute. For each attribute we should configure the following:
Set the Name
20 | P a g e
IST722 Data Warehousing Lab4Michael A. Fudge, Jr. OLAP Development with SSAS
Set the Key Column ( the source column which represents the internal values of the attribute)
Set the Name column (the source column which represents the visible values of the attribute)
Set the Order by for the attribute (should we sort by the key column or the visible column?)
You might be wondering what do each of these attributes mean and why are they important?
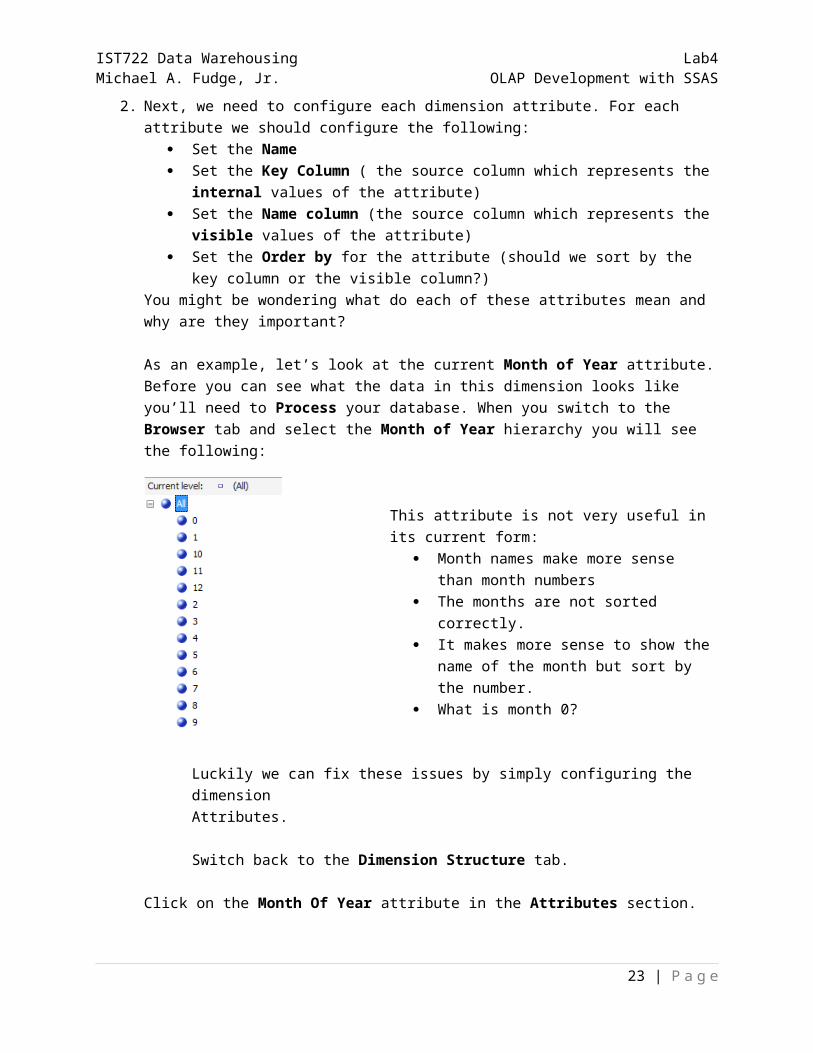
As an example, let’s look at the current Month of Year attribute. Before you can see what the data in this dimension looks like you’ll need to Process your database. When you switch to the Browser tab and select the Month of Year hierarchy you will see the following:
This attribute is not very useful in its current form: Month names make more sense than month
numbers The months are not sorted correctly. It makes more sense to show the name of the
month but sort by the number. What is month 0?
Luckily we can fix these issues by simply configuring the dimensionAttributes.
Switch back to the Dimension Structure tab.
Click on the Month Of Year attribute in the Attributes section.
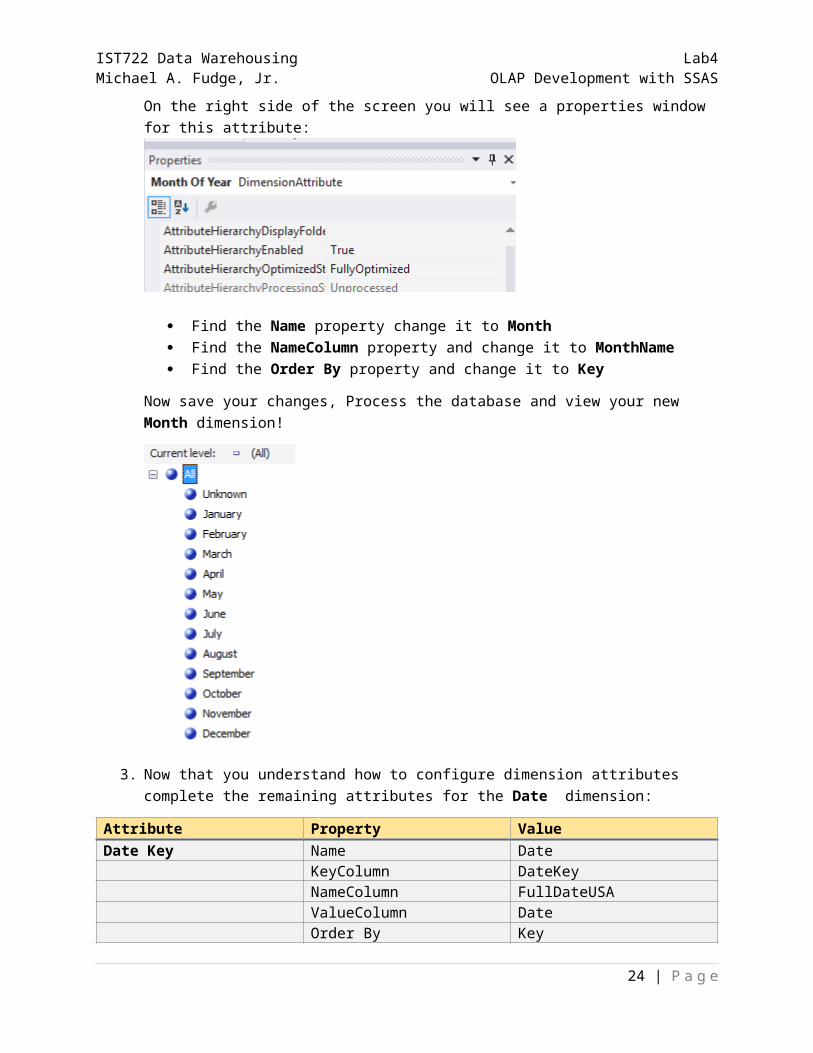
On the right side of the screen you will see a properties window for this attribute:
Find the Name property change it to Month Find the NameColumn property and change it to MonthName Find the Order By property and change it to Key
Now save your changes, Process the database and view your new Month dimension!
21 | P a g e
IST722 Data Warehousing Lab4Michael A. Fudge, Jr. OLAP Development with SSAS
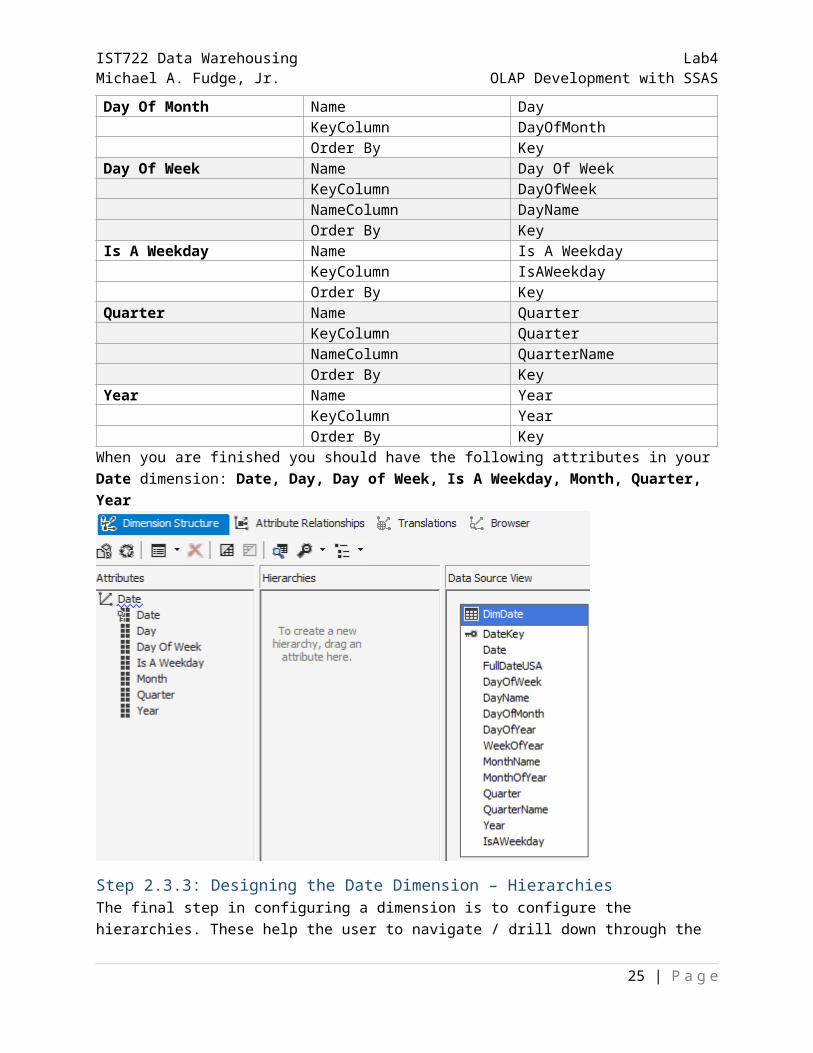
3. Now that you understand how to configure dimension attributes complete the remaining attributes for the Date dimension:
Attribute Property ValueDate Key Name Date
KeyColumn DateKeyNameColumn FullDateUSAValueColumn DateOrder By Key
Day Of Month Name DayKeyColumn DayOfMonthOrder By Key
Day Of Week Name Day Of WeekKeyColumn DayOfWeekNameColumn DayNameOrder By Key
Is A Weekday Name Is A WeekdayKeyColumn IsAWeekdayOrder By Key
Quarter Name QuarterKeyColumn QuarterNameColumn QuarterNameOrder By Key
Year Name YearKeyColumn YearOrder By Key
22 | P a g e
IST722 Data Warehousing Lab4Michael A. Fudge, Jr. OLAP Development with SSAS
When you are finished you should have the following attributes in your Date dimension: Date, Day, Day of Week, Is A Weekday, Month, Quarter, Year
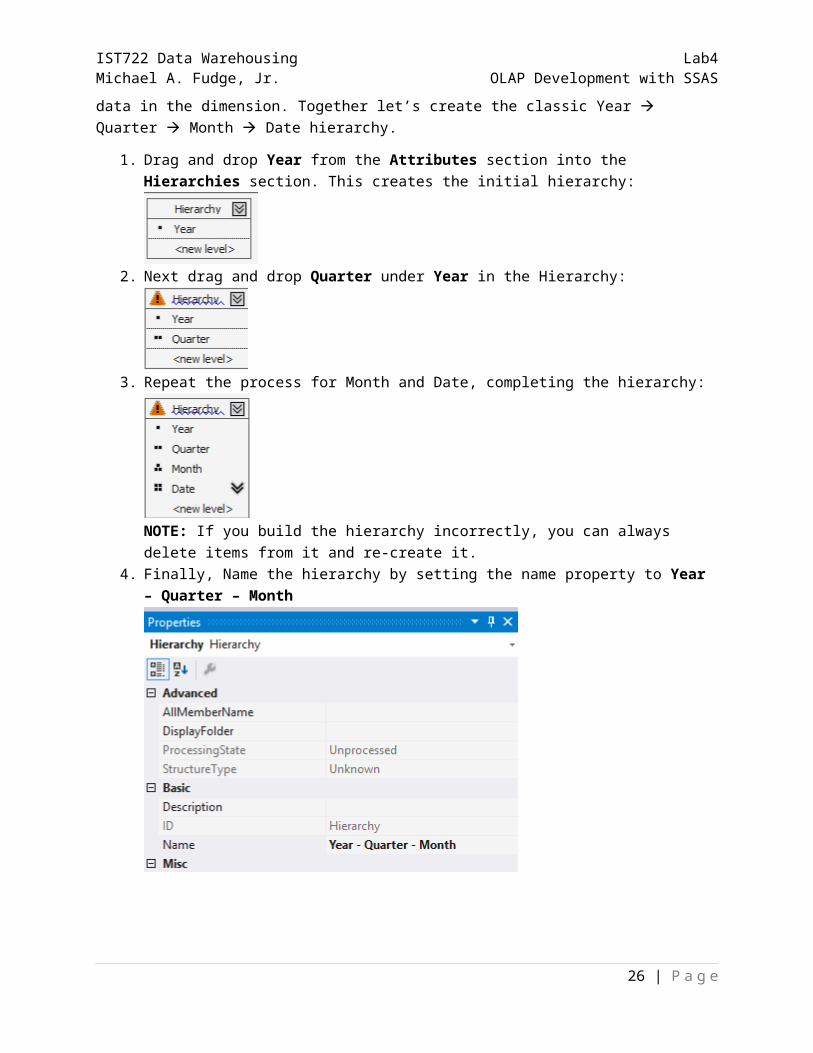
Step 2.3.3: Designing the Date Dimension – HierarchiesThe final step in configuring a dimension is to configure the hierarchies. These help the user to navigate / drill down through the data in the dimension. Together let’s create the classic Year Quarter Month Date hierarchy.
1. Drag and drop Year from the Attributes section into the Hierarchies section. This creates the initial hierarchy:
2. Next drag and drop Quarter under Year in the Hierarchy:
23 | P a g e
IST722 Data Warehousing Lab4Michael A. Fudge, Jr. OLAP Development with SSAS
3. Repeat the process for Month and Date, completing the hierarchy:
NOTE: If you build the hierarchy incorrectly, you can always delete items from it and re-create it.4. Finally, Name the hierarchy by setting the name property to Year – Quarter – Month
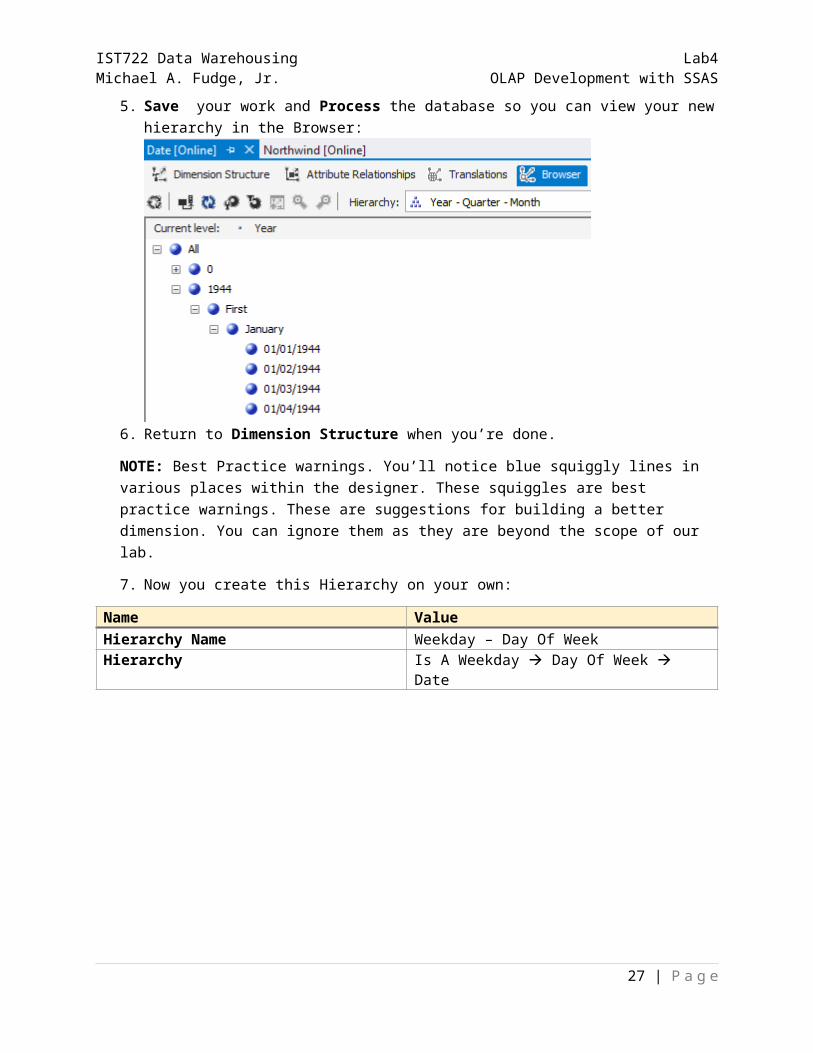
5. Save your work and Process the database so you can view your new hierarchy in the Browser:
6. Return to Dimension Structure when you’re done.
NOTE: Best Practice warnings. You’ll notice blue squiggly lines in various places within the designer. These squiggles are best practice warnings. These are suggestions for building a better dimension. You can ignore them as they are beyond the scope of our lab.
24 | P a g e
IST722 Data Warehousing Lab4Michael A. Fudge, Jr. OLAP Development with SSAS
7. Now you create this Hierarchy on your own:
Name ValueHierarchy Name Weekday – Day Of WeekHierarchy Is A Weekday Day Of Week Date
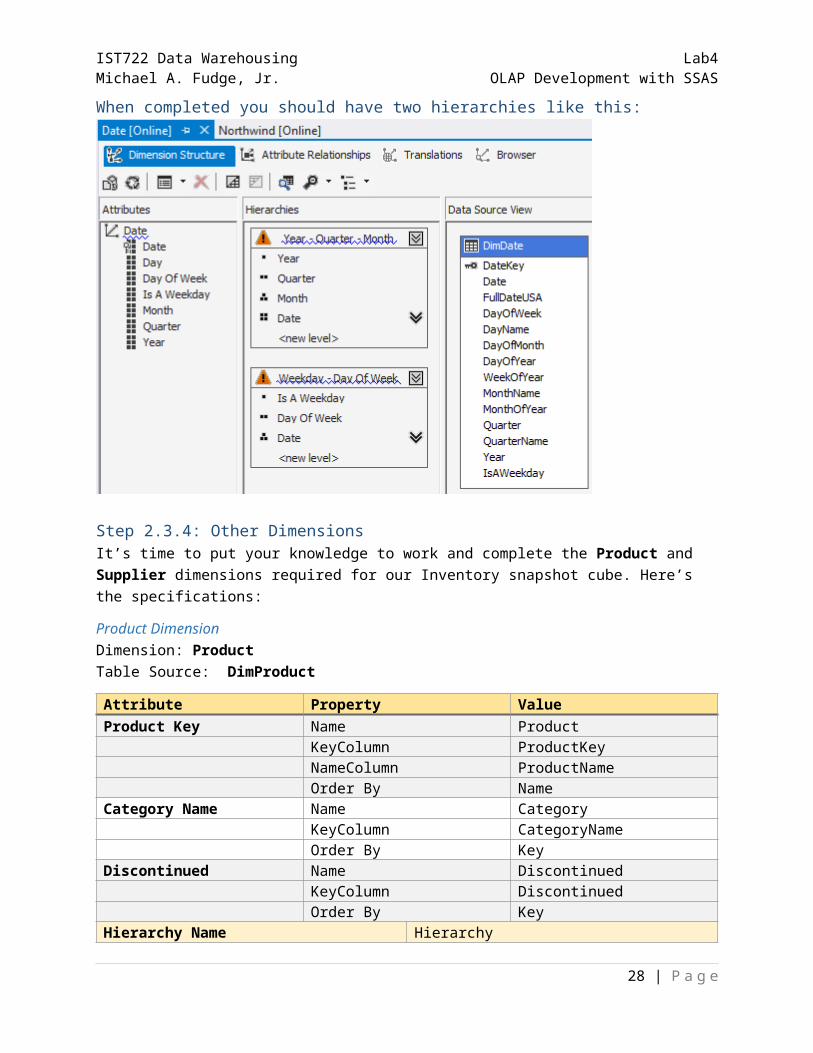
When completed you should have two hierarchies like this:
Step 2.3.4: Other DimensionsIt’s time to put your knowledge to work and complete the Product and Supplier dimensions required for our Inventory snapshot cube. Here’s the specifications:
Product DimensionDimension: ProductTable Source: DimProduct
Attribute Property ValueProduct Key Name Product
KeyColumn ProductKeyNameColumn ProductNameOrder By Name
Category Name Name CategoryKeyColumn CategoryNameOrder By Key
Discontinued Name DiscontinuedKeyColumn Discontinued
25 | P a g e
IST722 Data Warehousing Lab4Michael A. Fudge, Jr. OLAP Development with SSAS
Order By KeyHierarchy Name Hierarchy Category – Product Category Product
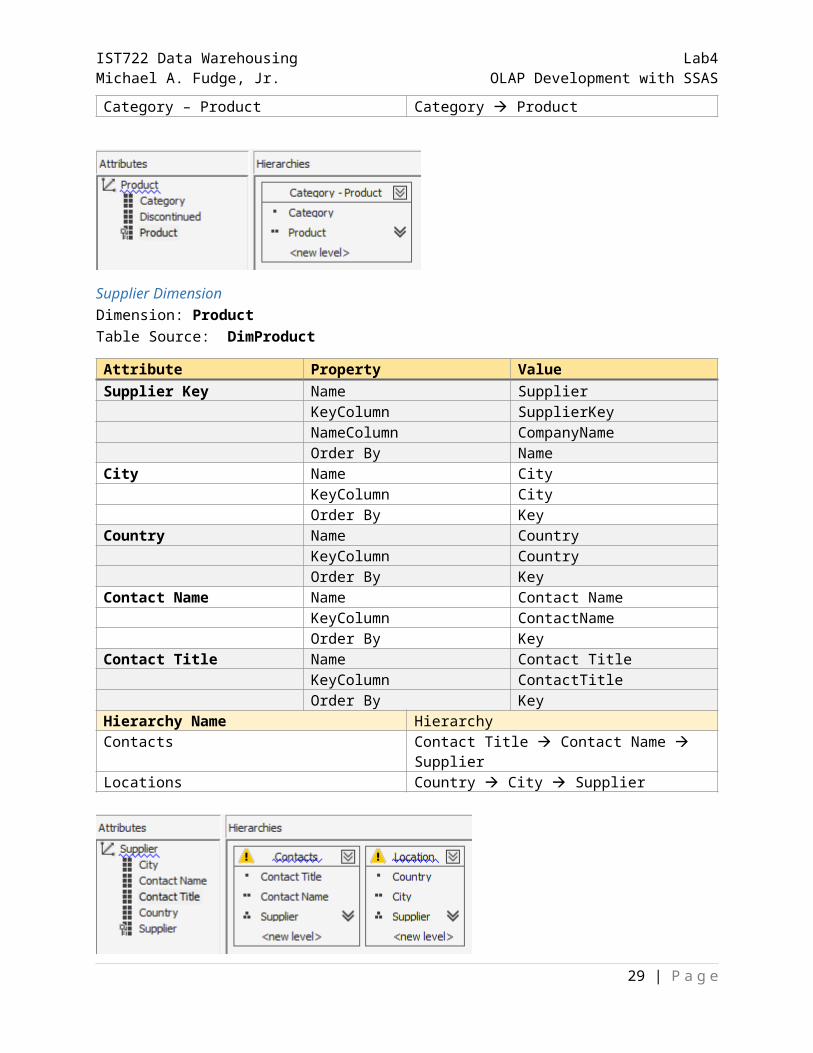
Supplier DimensionDimension: ProductTable Source: DimProduct
Attribute Property ValueSupplier Key Name Supplier
KeyColumn SupplierKeyNameColumn CompanyNameOrder By Name
City Name CityKeyColumn CityOrder By Key
Country Name CountryKeyColumn CountryOrder By Key
Contact Name Name Contact NameKeyColumn ContactNameOrder By Key
Contact Title Name Contact TitleKeyColumn ContactTitleOrder By Key
Hierarchy Name Hierarchy Contacts Contact Title Contact Name SupplierLocations Country City Supplier
26 | P a g e
IST722 Data Warehousing Lab4Michael A. Fudge, Jr. OLAP Development with SSAS
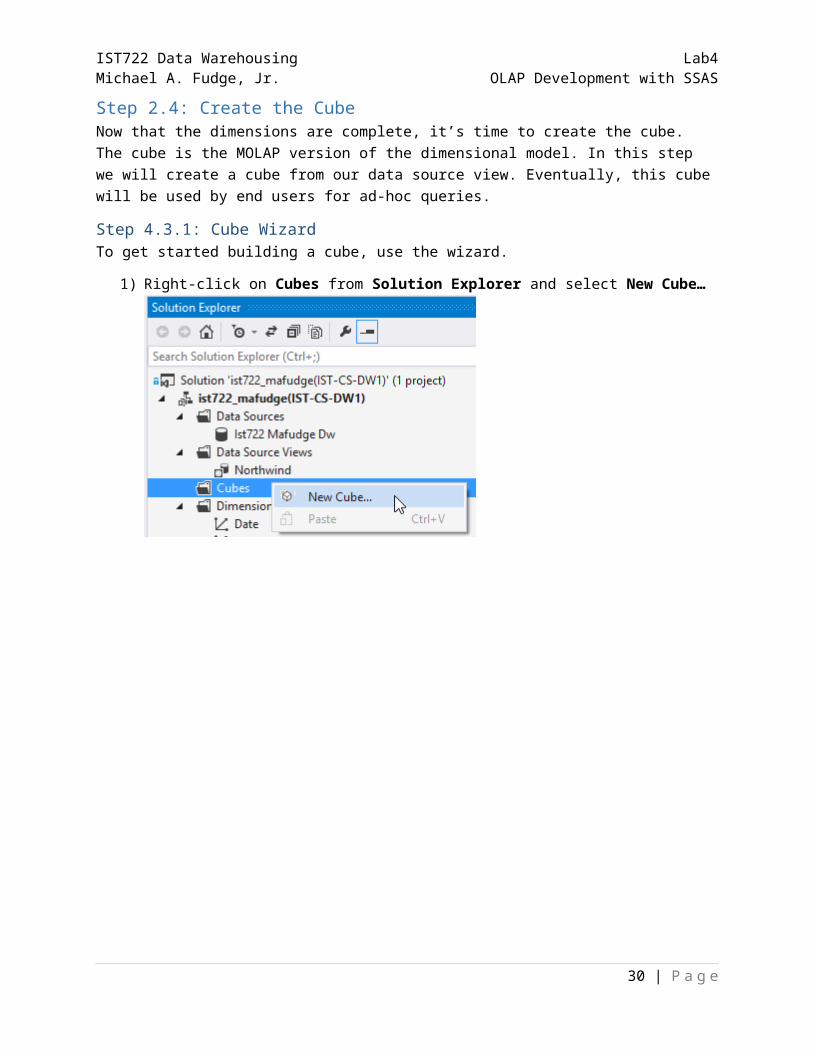
Step 2.4: Create the CubeNow that the dimensions are complete, it’s time to create the cube. The cube is the MOLAP version of the dimensional model. In this step we will create a cube from our data source view. Eventually, this cube will be used by end users for ad-hoc queries.
Step 4.3.1: Cube WizardTo get started building a cube, use the wizard.
1) Right-click on Cubes from Solution Explorer and select New Cube…
27 | P a g e
IST722 Data Warehousing Lab4Michael A. Fudge, Jr. OLAP Development with SSAS
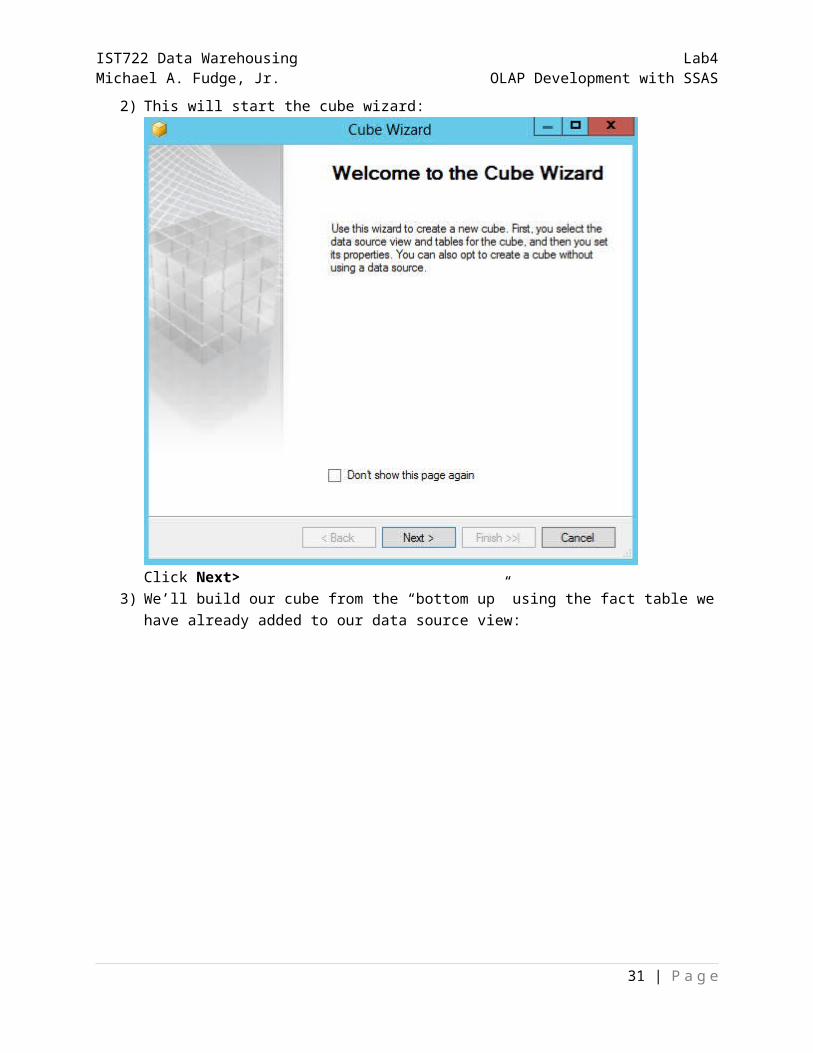
2) This will start the cube wizard:
Click Next> 3) We’ll build our cube from the “bottom up” using the fact table we have already added to our
data source view:
28 | P a g e
IST722 Data Warehousing Lab4Michael A. Fudge, Jr. OLAP Development with SSAS
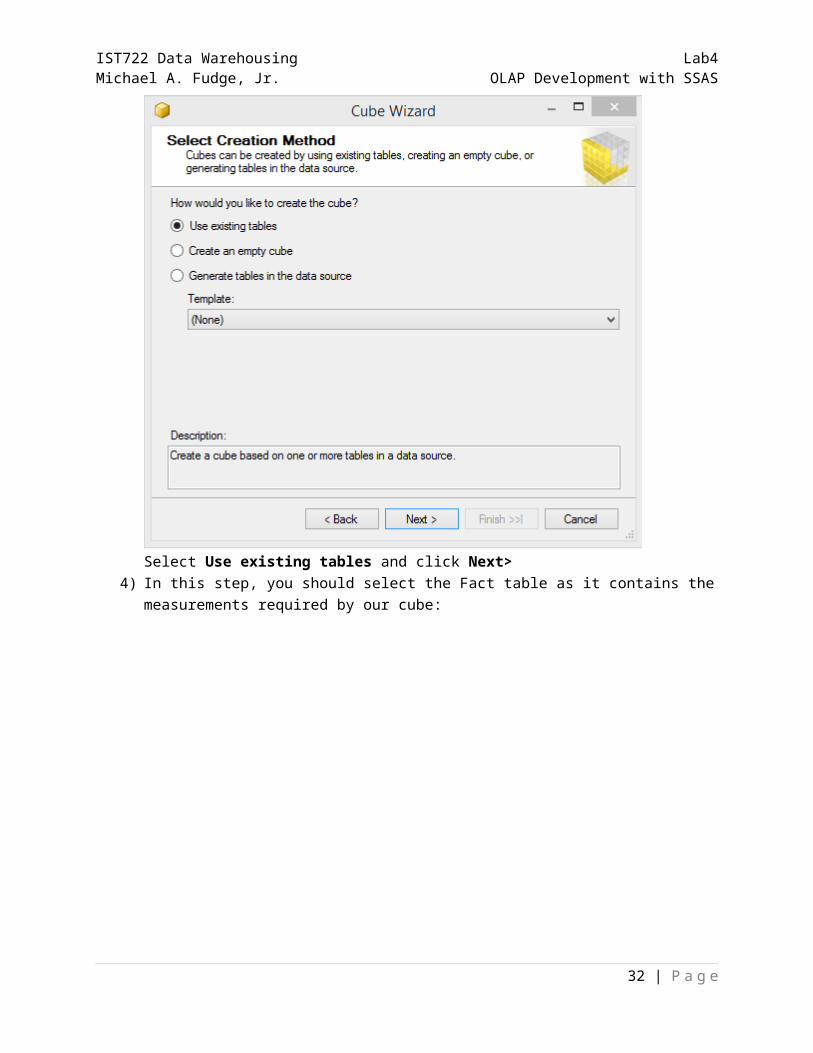
Select Use existing tables and click Next> 4) In this step, you should select the Fact table as it contains the measurements required by our
cube:
29 | P a g e
IST722 Data Warehousing Lab4Michael A. Fudge, Jr. OLAP Development with SSAS
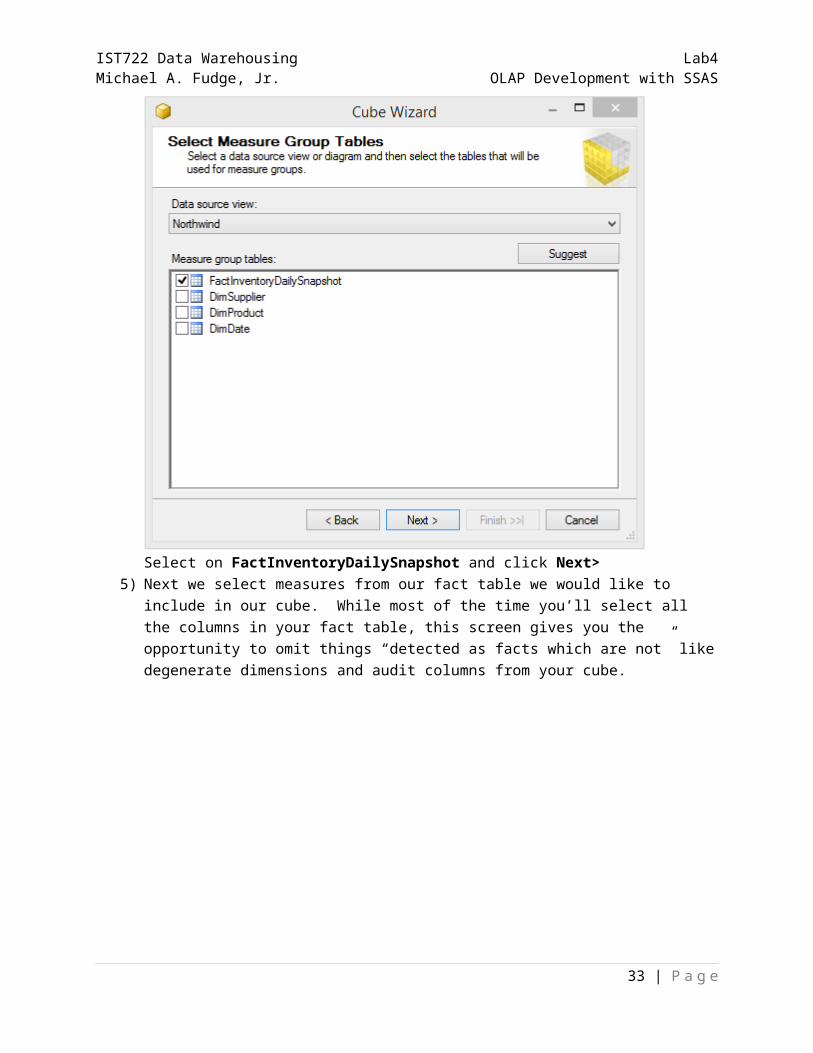
Select on FactInventoryDailySnapshot and click Next> 5) Next we select measures from our fact table we would like to include in our cube. While most
of the time you’ll select all the columns in your fact table, this screen gives you the opportunity to omit things “detected as facts which are not” like degenerate dimensions and audit columns from your cube.
30 | P a g e
IST722 Data Warehousing Lab4Michael A. Fudge, Jr. OLAP Development with SSAS
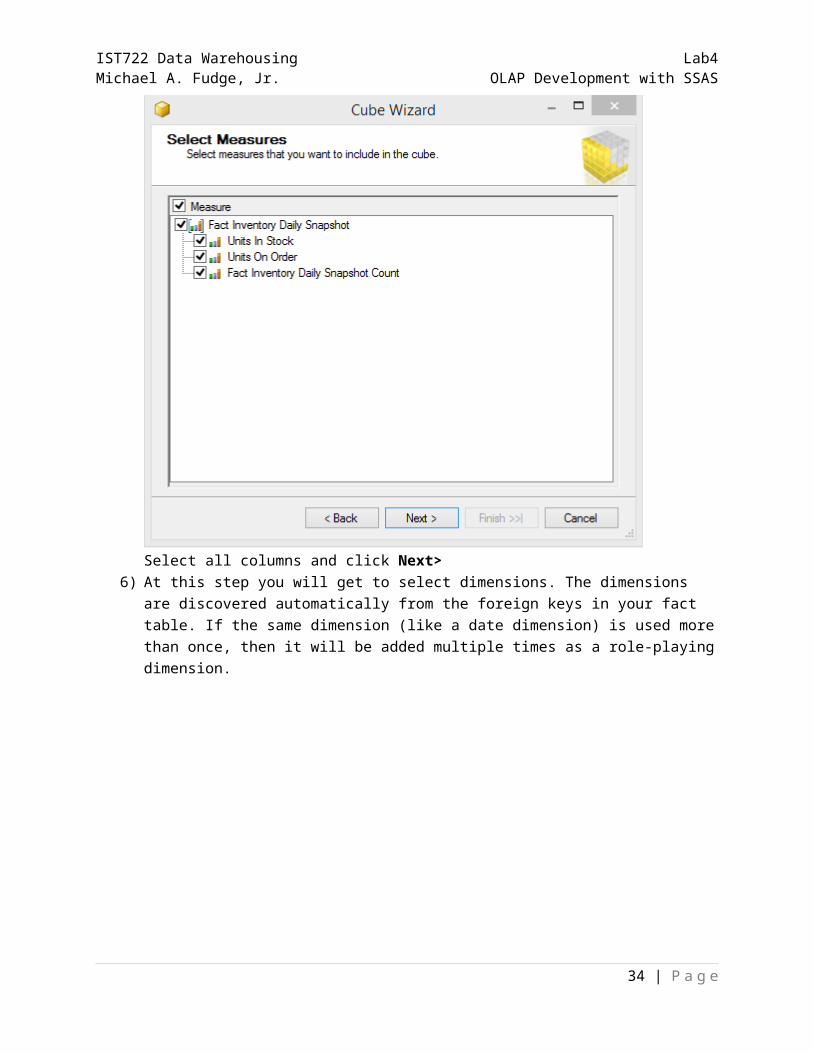
Select all columns and click Next> 6) At this step you will get to select dimensions. The dimensions are discovered automatically from
the foreign keys in your fact table. If the same dimension (like a date dimension) is used more than once, then it will be added multiple times as a role-playing dimension.
31 | P a g e
IST722 Data Warehousing Lab4Michael A. Fudge, Jr. OLAP Development with SSAS
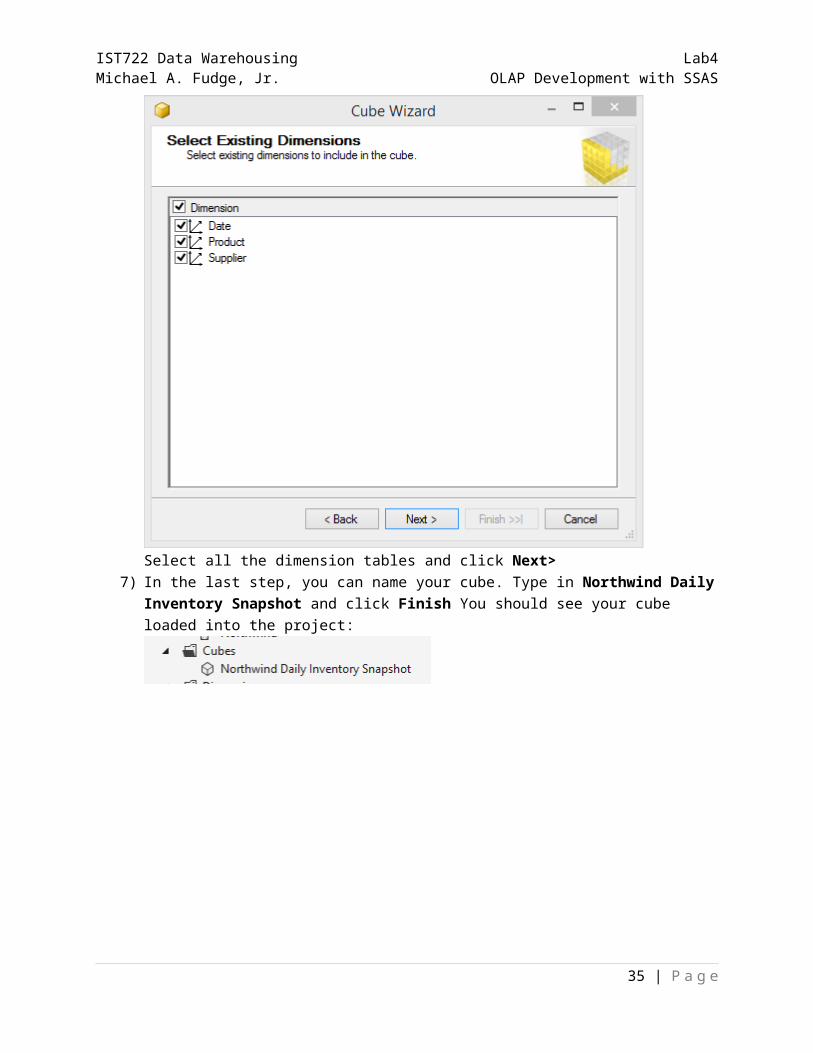
Select all the dimension tables and click Next> 7) In the last step, you can name your cube. Type in Northwind Daily Inventory Snapshot and click
Finish You should see your cube loaded into the project:
32 | P a g e
IST722 Data Warehousing Lab4Michael A. Fudge, Jr. OLAP Development with SSAS
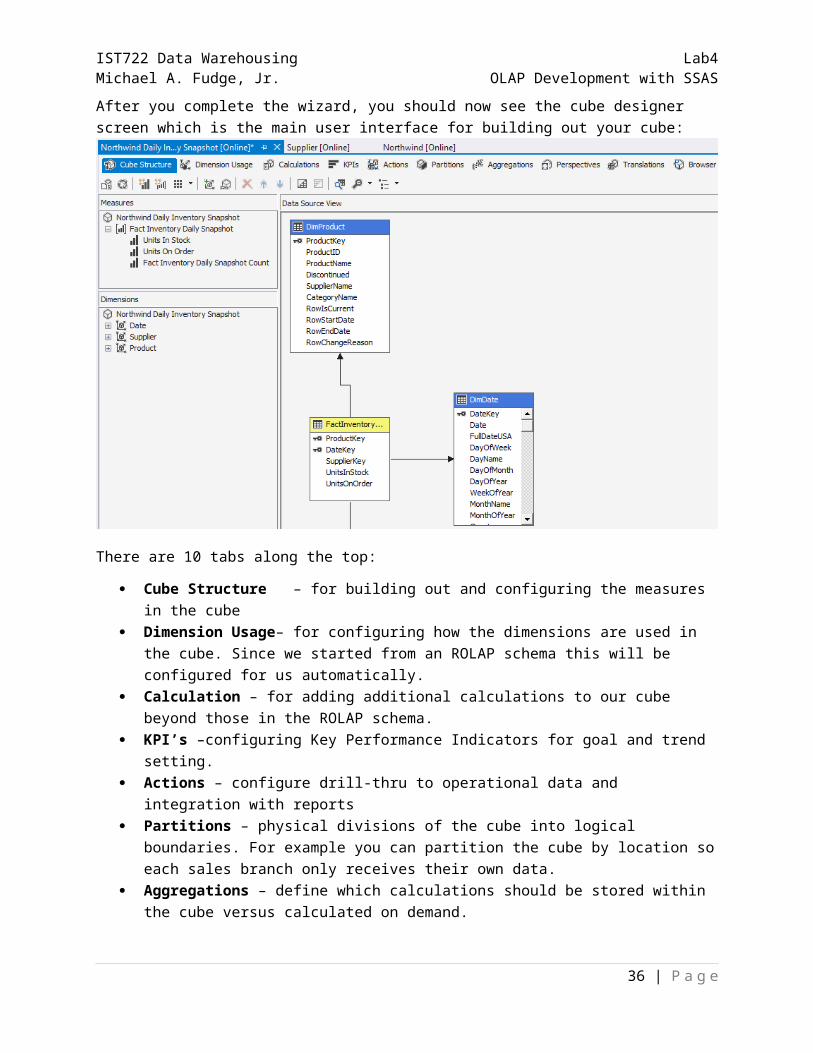
After you complete the wizard, you should now see the cube designer screen which is the main user interface for building out your cube:
There are 10 tabs along the top:
Cube Structure – for building out and configuring the measures in the cube Dimension Usage– for configuring how the dimensions are used in the cube. Since we started
from an ROLAP schema this will be configured for us automatically. Calculation – for adding additional calculations to our cube beyond those in the ROLAP schema. KPI’s –configuring Key Performance Indicators for goal and trend setting. Actions – configure drill-thru to operational data and integration with reports Partitions – physical divisions of the cube into logical boundaries. For example you can partition
the cube by location so each sales branch only receives their own data. Aggregations – define which calculations should be stored within the cube versus calculated on
demand. Perspectives – setup “views” within the cube to limit access to attributes or measures based on
user permissions. Translations – multi-language support Browser – view the cube data in a basic pivot-table like format.
Step 2.4.2: Configure Measure PropertiesAfter the cube wizard is finished, our next step is to configure our measures. From the Cube Structure tab you can configure each measure similar to how you configured dimension attributes.
33 | P a g e
IST722 Data Warehousing Lab4Michael A. Fudge, Jr. OLAP Development with SSAS
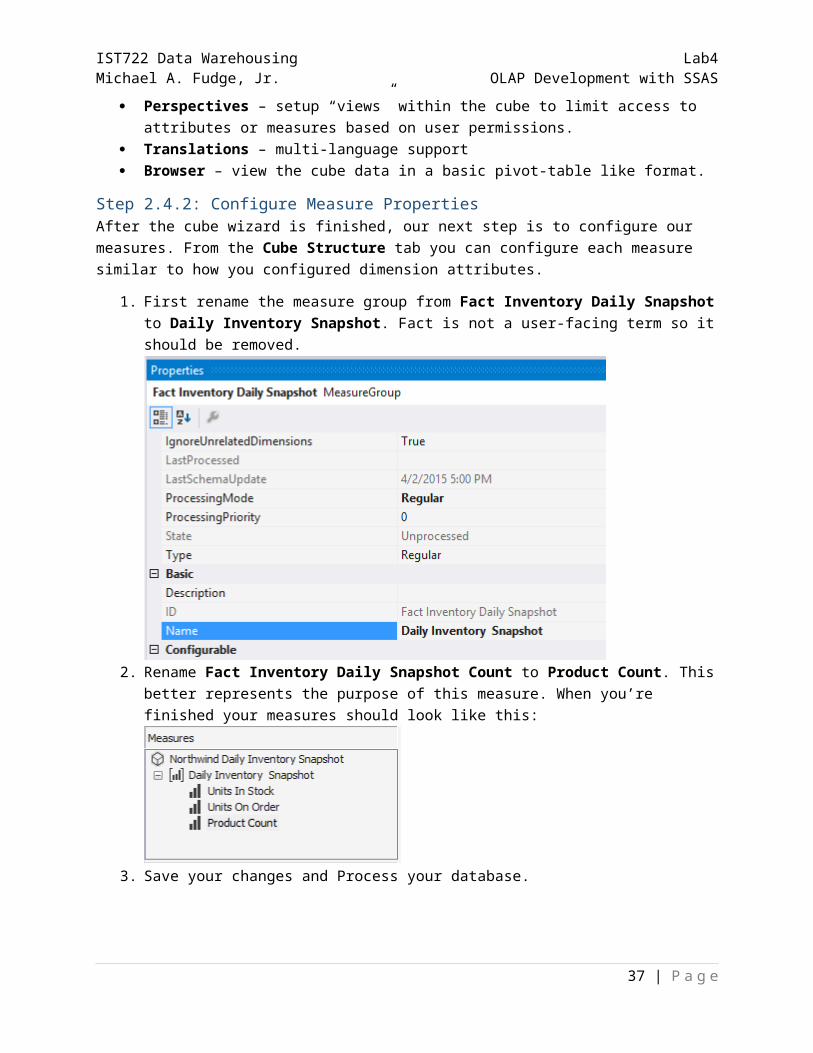
1. First rename the measure group from Fact Inventory Daily Snapshot to Daily Inventory Snapshot. Fact is not a user-facing term so it should be removed.
2. Rename Fact Inventory Daily Snapshot Count to Product Count. This better represents the purpose of this measure. When you’re finished your measures should look like this:
3. Save your changes and Process your database.
Step 2.4.3: Building Key Performance Indicators (KPI’s)In this next step, let’s build a really basic KPI so you can realize the benefits of this feature.
Let’s assume that the inventory manager adheres to the following heuristic for maintaining ideal stock levels of inventory:
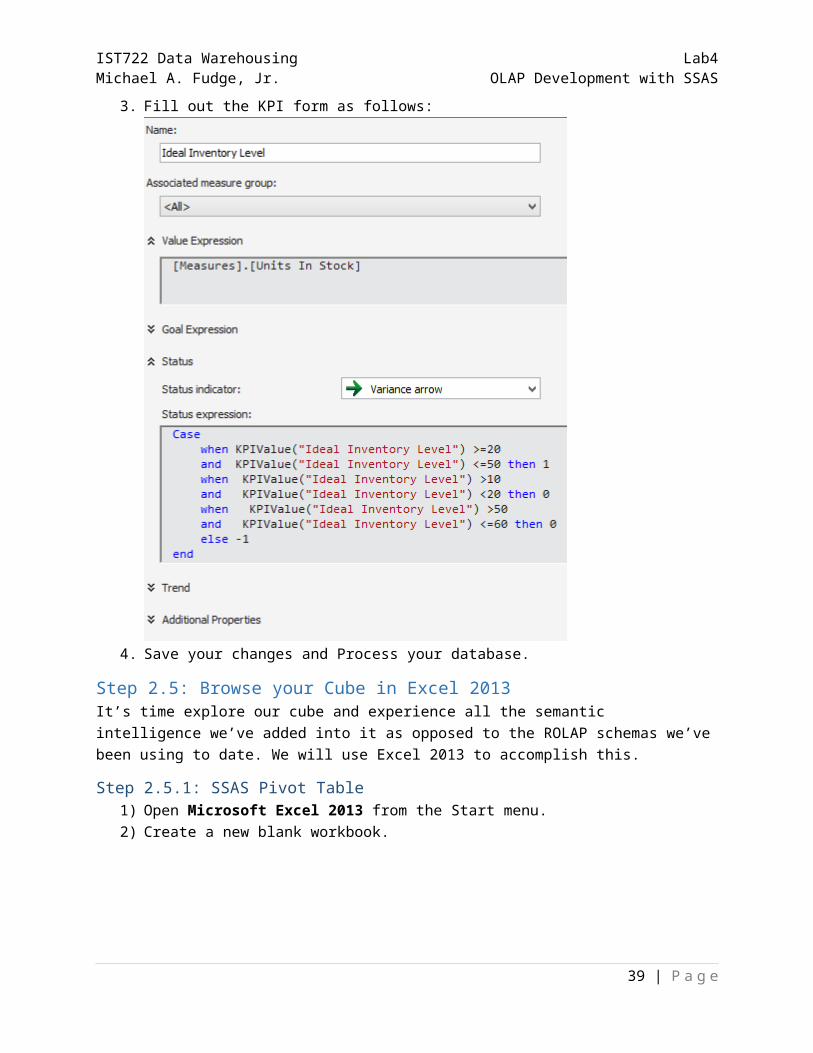
Units In Stock Status>=20 and <=50 Good (Ideal Stock Levels)>=10 and <20 or >50 and <=60 Ok ( not ideal but not horrible)Below 10 or more than 60 Bad (Too Much or too little inventory)
Let’s add this into our cube as a PKI.
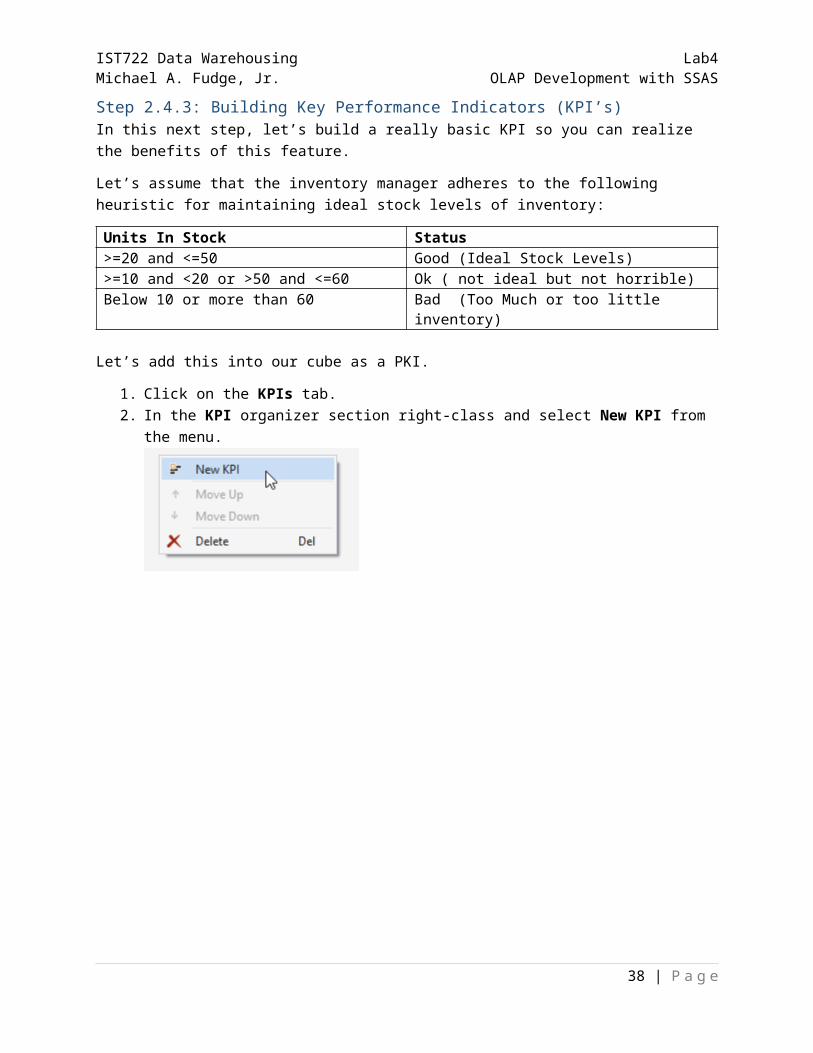
1. Click on the KPIs tab.
34 | P a g e
IST722 Data Warehousing Lab4Michael A. Fudge, Jr. OLAP Development with SSAS
2. In the KPI organizer section right-class and select New KPI from the menu.
3. Fill out the KPI form as follows:
4. Save your changes and Process your database.
Step 2.5: Browse your Cube in Excel 2013It’s time explore our cube and experience all the semantic intelligence we’ve added into it as opposed to the ROLAP schemas we’ve been using to date. We will use Excel 2013 to accomplish this.
Step 2.5.1: SSAS Pivot Table1) Open Microsoft Excel 2013 from the Start menu.2) Create a new blank workbook.
35 | P a g e
IST722 Data Warehousing Lab4Michael A. Fudge, Jr. OLAP Development with SSAS
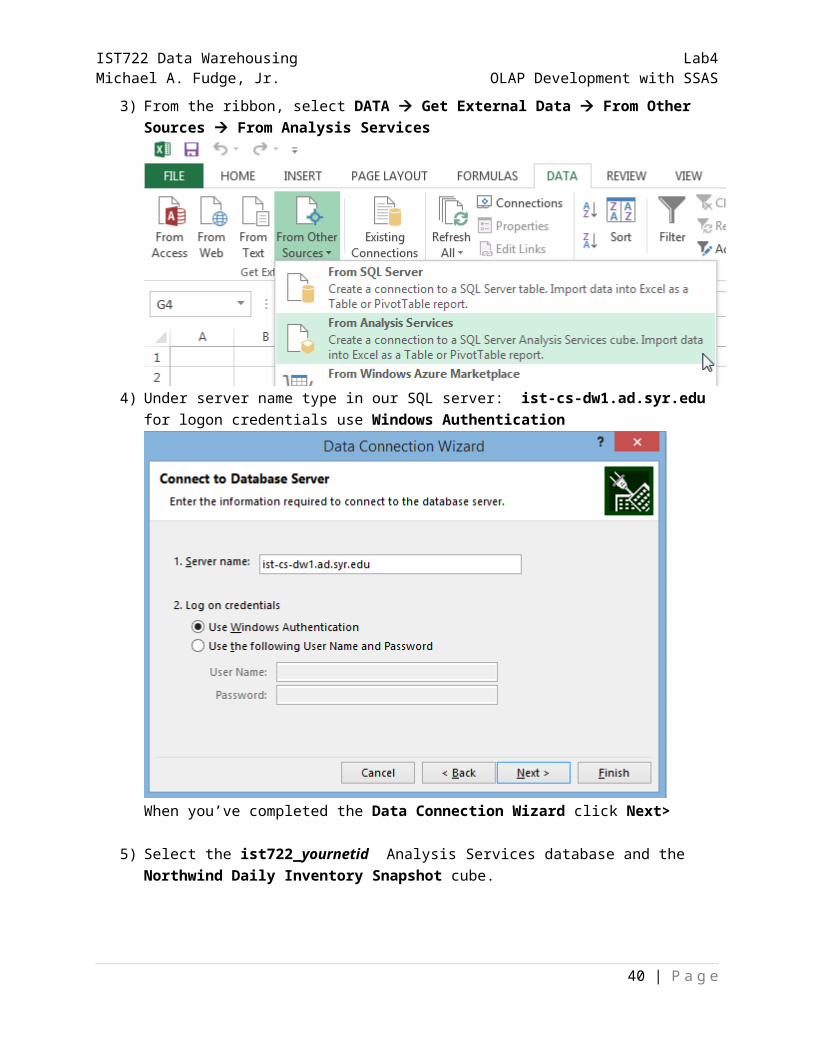
3) From the ribbon, select DATA Get External Data From Other Sources From Analysis Services
4) Under server name type in our SQL server: ist-cs-dw1.ad.syr.edu for logon credentials use Windows Authentication
When you’ve completed the Data Connection Wizard click Next>
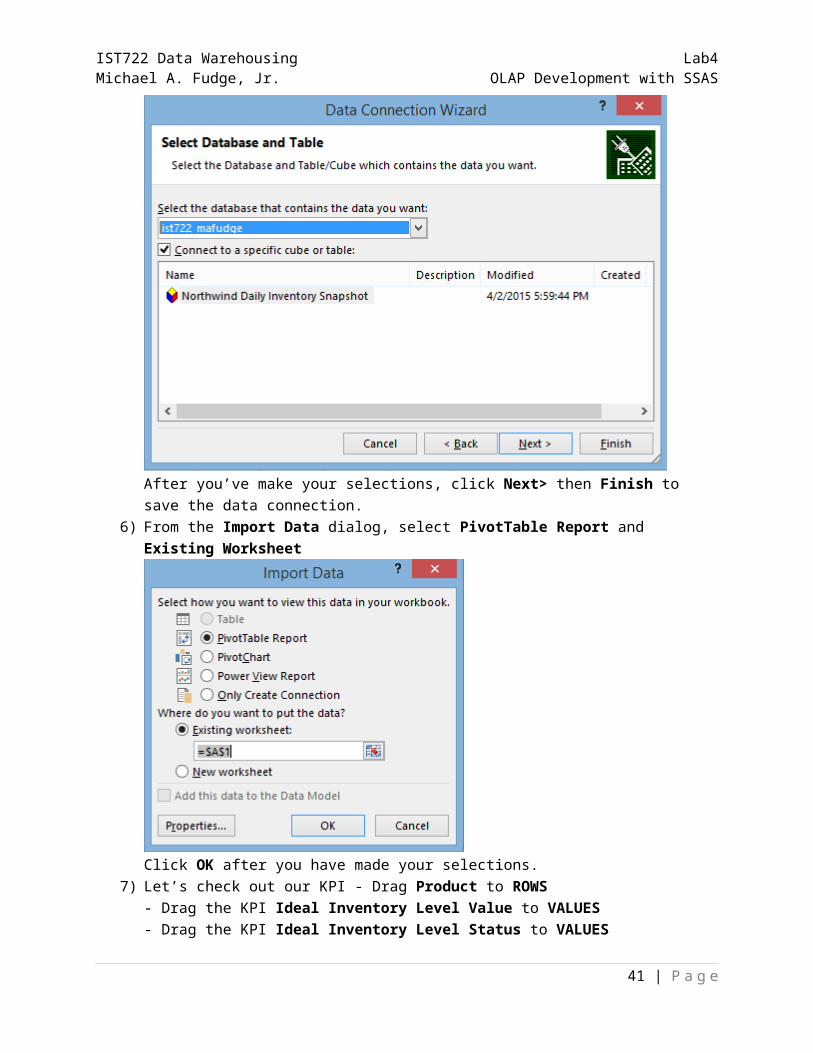
5) Select the ist722_yournetid Analysis Services database and the Northwind Daily Inventory Snapshot cube.
36 | P a g e
IST722 Data Warehousing Lab4Michael A. Fudge, Jr. OLAP Development with SSAS
After you’ve make your selections, click Next> then Finish to save the data connection.6) From the Import Data dialog, select PivotTable Report and Existing Worksheet
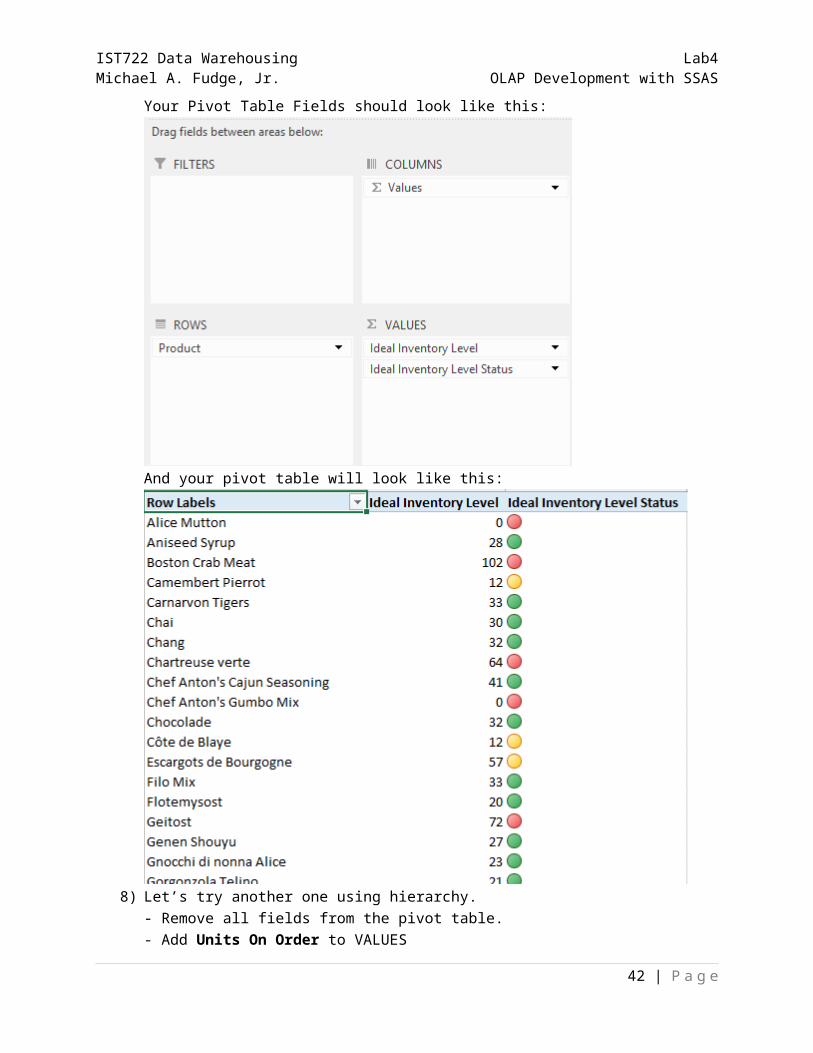
Click OK after you have made your selections.7) Let’s check out our KPI - Drag Product to ROWS
- Drag the KPI Ideal Inventory Level Value to VALUES- Drag the KPI Ideal Inventory Level Status to VALUES
37 | P a g e
IST722 Data Warehousing Lab4Michael A. Fudge, Jr. OLAP Development with SSAS
Your Pivot Table Fields should look like this:
And your pivot table will look like this:
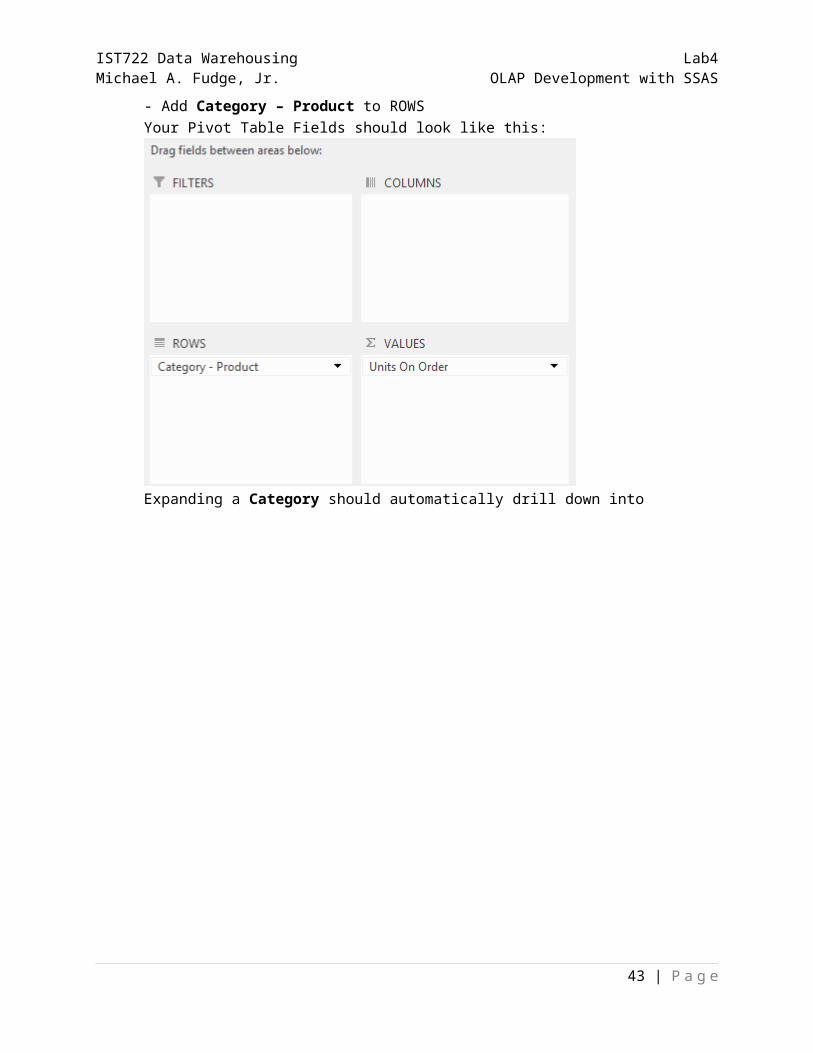
8) Let’s try another one using hierarchy.- Remove all fields from the pivot table.- Add Units On Order to VALUES- Add Category – Product to ROWS
38 | P a g e
IST722 Data Warehousing Lab4Michael A. Fudge, Jr. OLAP Development with SSAS
Your Pivot Table Fields should look like this:
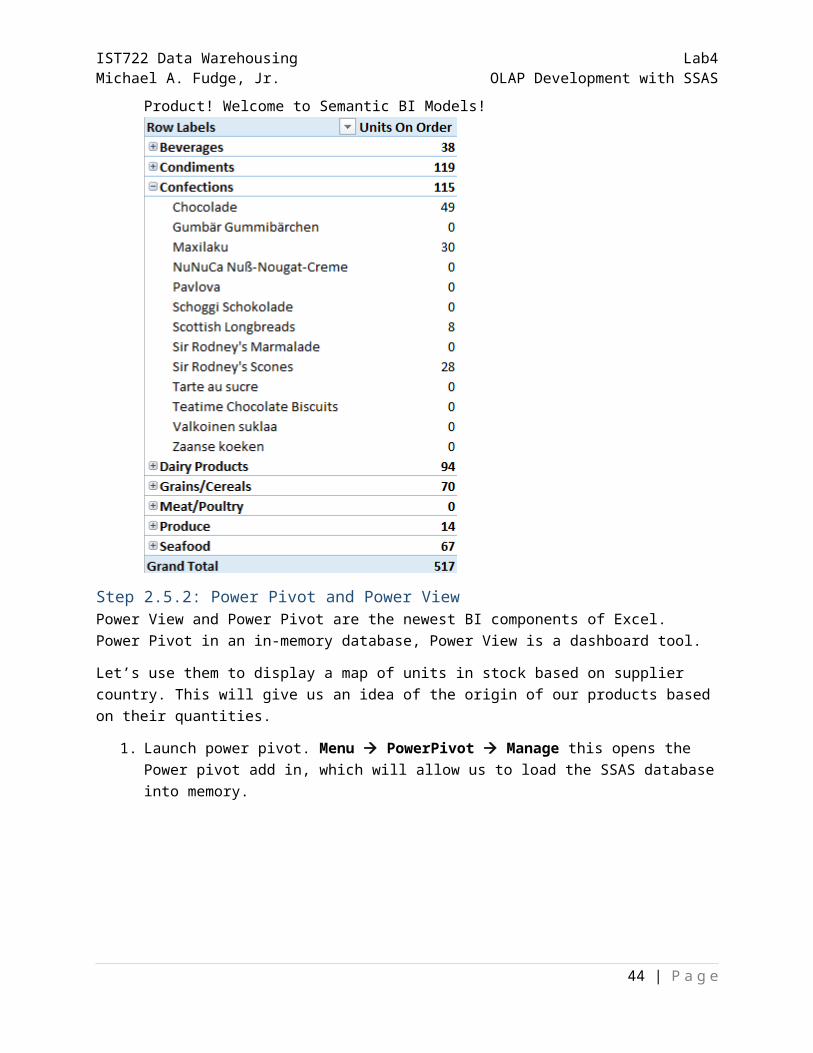
Expanding a Category should automatically drill down into Product! Welcome to Semantic BI
39 | P a g e
IST722 Data Warehousing Lab4Michael A. Fudge, Jr. OLAP Development with SSAS
Models!
Step 2.5.2: Power Pivot and Power ViewPower View and Power Pivot are the newest BI components of Excel. Power Pivot in an in-memory database, Power View is a dashboard tool.
Let’s use them to display a map of units in stock based on supplier country. This will give us an idea of the origin of our products based on their quantities.
1. Launch power pivot. Menu PowerPivot Manage this opens the Power pivot add in, which will allow us to load the SSAS database into memory.
2. From the Power Pivot ribbon, select Get External Data From Database SQL Server Analysis Services or PowerPivot
40 | P a g e
IST722 Data Warehousing Lab4Michael A. Fudge, Jr. OLAP Development with SSAS
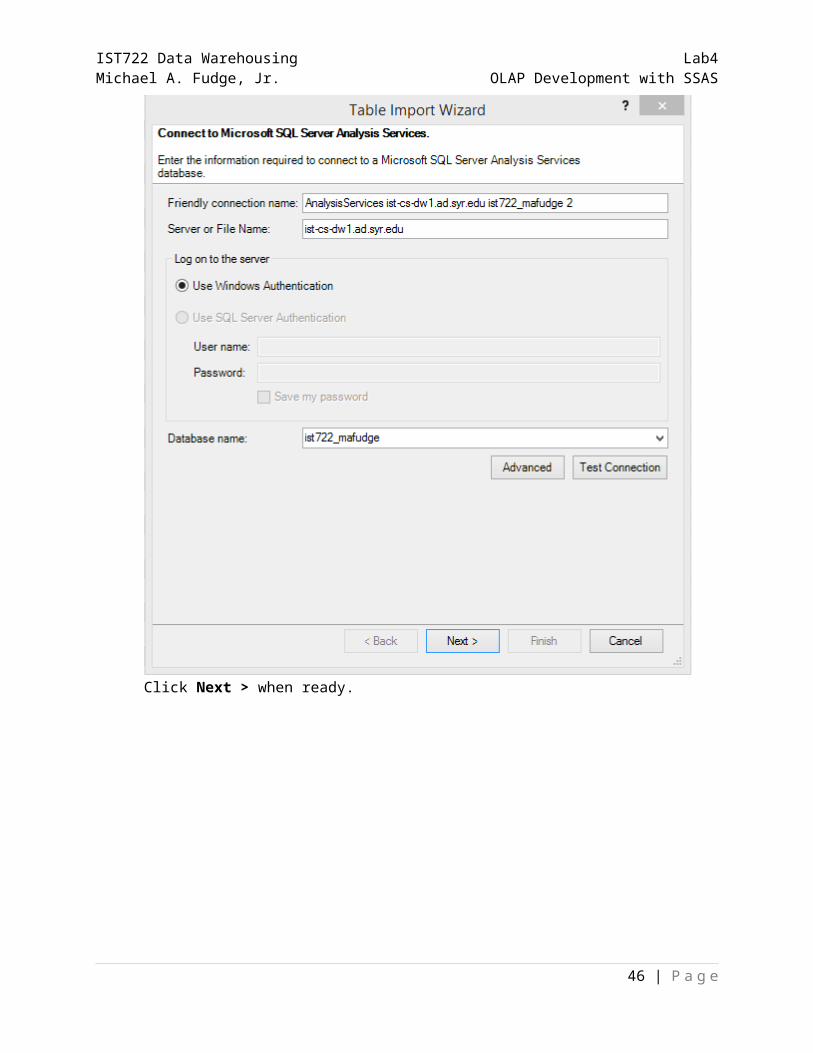
3. The Table Import Wizard will appear. For Server or File Name enter ist-cs-dw1.ad.syr.edu Use Windows Authentication For Database name enter ist722_yournetid
Click Next > when ready.
41 | P a g e
IST722 Data Warehousing Lab4Michael A. Fudge, Jr. OLAP Development with SSAS
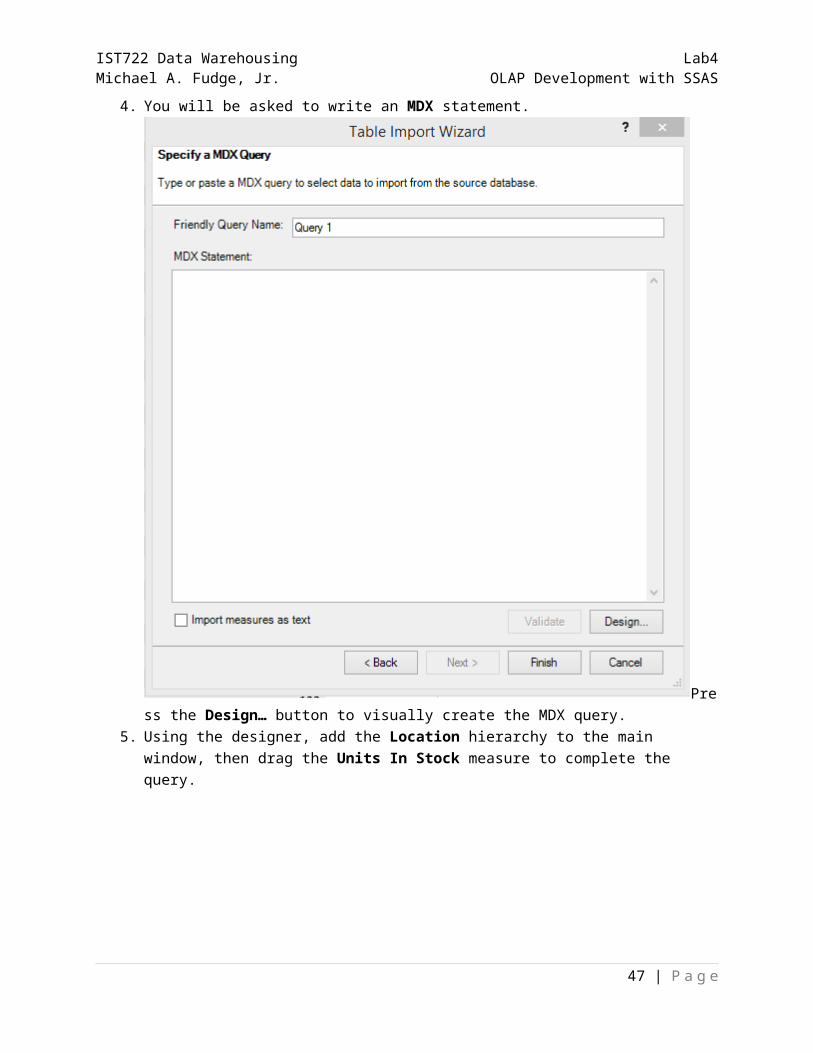
4. You will be asked to write an MDX statement.
Press the Design… button to visually create the MDX query. 5. Using the designer, add the Location hierarchy to the main window, then drag the Units In Stock
measure to complete the query.
42 | P a g e
IST722 Data Warehousing Lab4Michael A. Fudge, Jr. OLAP Development with SSAS
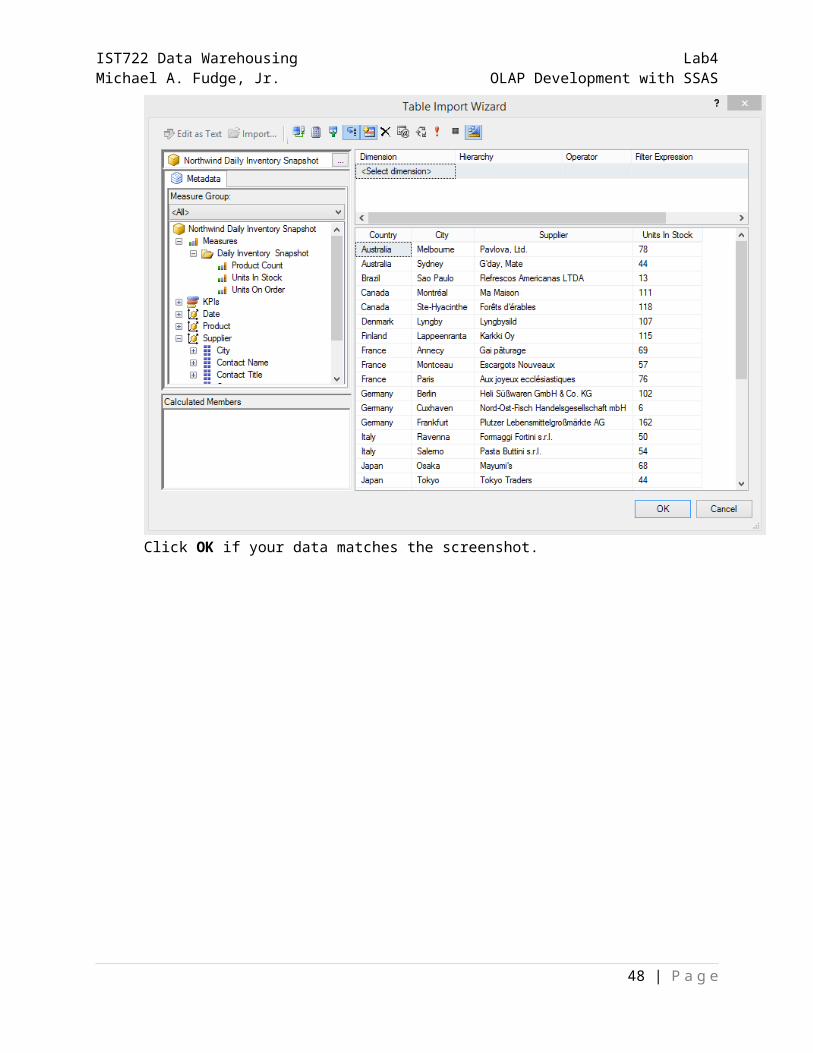
Click OK if your data matches the screenshot.
43 | P a g e
IST722 Data Warehousing Lab4Michael A. Fudge, Jr. OLAP Development with SSAS
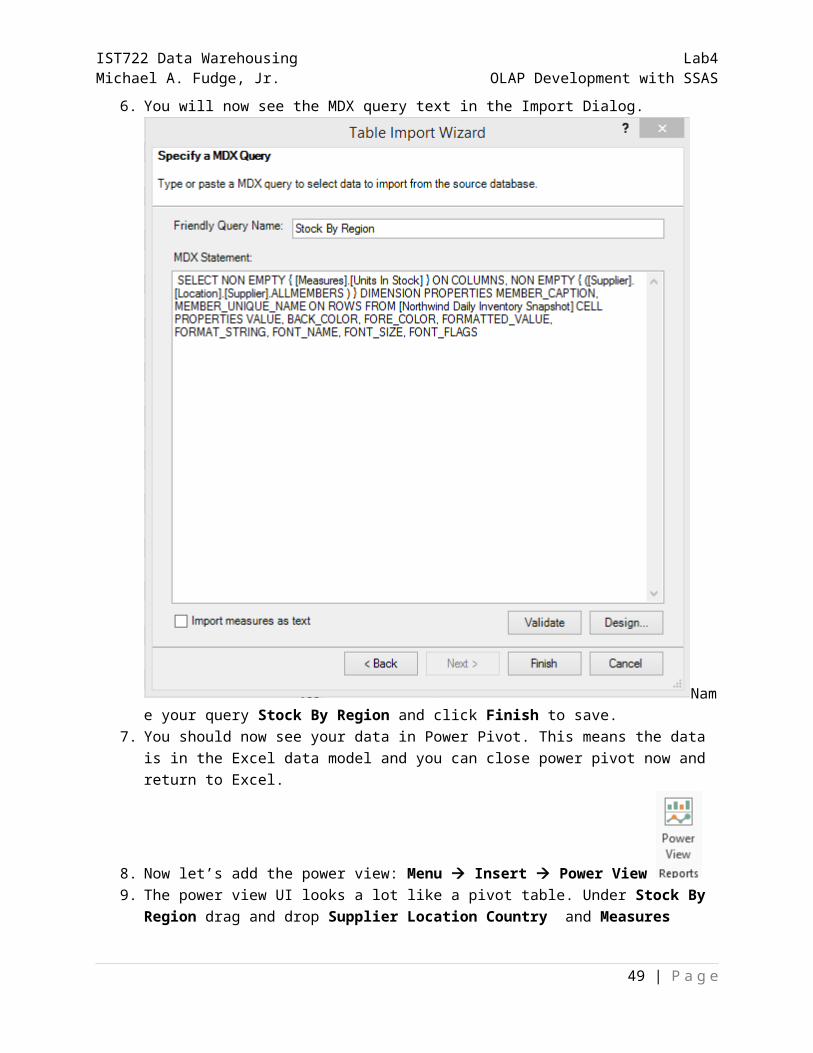
6. You will now see the MDX query text in the Import Dialog.
Name your query Stock By Region and click Finish to save.7. You should now see your data in Power Pivot. This means the data is in the Excel data model
and you can close power pivot now and return to Excel.
8. Now let’s add the power view: Menu Insert Power View
44 | P a g e

IST722 Data Warehousing Lab4Michael A. Fudge, Jr. OLAP Development with SSAS
9. The power view UI looks a lot like a pivot table. Under Stock By Region drag and drop Supplier Location Country and Measures Units In Stock to the Fields area:
45 | P a g e
IST722 Data Warehousing Lab4Michael A. Fudge, Jr. OLAP Development with SSAS
10. This will create a table in your power view:
11. Convert it to a map by clicking Menu Switch Visualization Map
46 | P a g e
IST722 Data Warehousing Lab4Michael A. Fudge, Jr. OLAP Development with SSAS
12. Your data is now displayed on a map! Each country has a bubble representing the supplier’s inventory level.
13. Save your Spreadsheet as Northwind-Daily-Inventory-Snapshot.xlsx1.
47 | P a g e
IST722 Data Warehousing Lab4Michael A. Fudge, Jr. OLAP Development with SSAS
Part 3: On Your Own: Build an SSAS Cube for Northwind Sales.In this part, build out an SQL Server Analysis Services cube for project for the Northwind Sales. As you’re accustomed to doing do in part 3’s of labs you must work out many of the details on your own
1. Add the FactSales, DimCustomer and DimEmployee tables to the current Northwind data source view:
48 | P a g e
IST722 Data Warehousing Lab4Michael A. Fudge, Jr. OLAP Development with SSAS
2. Build out the Customer and Employee dimensions as follows:
NOTE: Customer should display Company Name3. Create the Northwind Sales cube as follows:
4. Create an Excel worksheet Northwind-Sales.xlsx with a compelling Pivot table and Power View Chart of your choosing. Do not create a map.
Good Luck!
49 | P a g e


![[102-2] WNFA lab4 - A Tiny Wireless Sensor Network](https://img.pdfslide.tips/doc/110x75/56813669550346895d9df524/102-2-wnfa-lab4-a-tiny-wireless-sensor-network.jpg)