Embed Size (px)
Citation preview
99% Oxygen Production with Zeolites 99% Oxygen Production with Zeolites and Pressure Swing Adsorption: and Pressure Swing Adsorption: Designs and Economic AnalysisDesigns and Economic Analysis
Presentation by:
Blake Ashcraft
Jennifer Swenton
Project GoalsProject Goals
Develop a portable and hospital air Develop a portable and hospital air separation process/device with silver separation process/device with silver zeolites to produce a continuous flow of zeolites to produce a continuous flow of 99% oxygen99% oxygen
Recommend the application of the Recommend the application of the process/device in different marketsprocess/device in different markets
Determine if process/device will be Determine if process/device will be profitable in those marketsprofitable in those markets
OverviewOverview
Market for Purified OxygenMarket for Purified Oxygen Air Separation MethodsAir Separation Methods Adsorbent MaterialsAdsorbent Materials Proposed Use of TechnologyProposed Use of Technology Hospital DesignHospital Design Portable DesignPortable Design Consumer Utility and PreferenceConsumer Utility and Preference Business PlanBusiness Plan RiskRisk RecommendationsRecommendations
Market for 99% OxygenMarket for 99% Oxygen
Oxygen is the third most widely used Oxygen is the third most widely used chemical in the worldchemical in the world
Annual worldwide market of over Annual worldwide market of over $9 $9 billionbillion. .
Main applications:Main applications: Medical oxygen for hospitals and individual Medical oxygen for hospitals and individual
useuse Industrial applications for refineries and Industrial applications for refineries and
processing plantsprocessing plants
Oxygen in MedicineOxygen in Medicine
Inhalation therapy Inhalation therapy
During surgery to maintain tissue oxygenation under During surgery to maintain tissue oxygenation under anesthesia anesthesia
Resuscitation of patientsResuscitation of patients
The treatment of such diseases as chronic obstructive The treatment of such diseases as chronic obstructive pulmonary disease, pneumonia, and pulmonary embolismpulmonary disease, pneumonia, and pulmonary embolism
For the newborn experiencing respiratory distress syndromeFor the newborn experiencing respiratory distress syndrome
The treatment of respiratory burns or poisoning by carbon The treatment of respiratory burns or poisoning by carbon monoxide and other chemical substances monoxide and other chemical substances
Portable Oxygen Portable Oxygen ConcentratorsConcentrators Currently no portable device capable of Currently no portable device capable of
producing 99% oxygen continuouslyproducing 99% oxygen continuously
Portable oxygen cylinders with 99% oxygen Portable oxygen cylinders with 99% oxygen lasts up to 8 hourslasts up to 8 hours
Percentage of individuals suffering from Percentage of individuals suffering from lung diseases such as chronic obstructive lung diseases such as chronic obstructive pulmonary disease (COPD) is increasingpulmonary disease (COPD) is increasing
COPD is 4COPD is 4thth leading cause of death leading cause of death worldwideworldwide
Hospital UnitHospital Unit
Large hospitals spend an estimated Large hospitals spend an estimated $170,000 per a year on oxygen$170,000 per a year on oxygen
Approximately 350 large hospitals in Approximately 350 large hospitals in United StatesUnited States
OnOn--site unit allows for:site unit allows for:–– unlimited supply of Oxygenunlimited supply of Oxygen–– Annual savingsAnnual savings
Air SeparationAir Separation
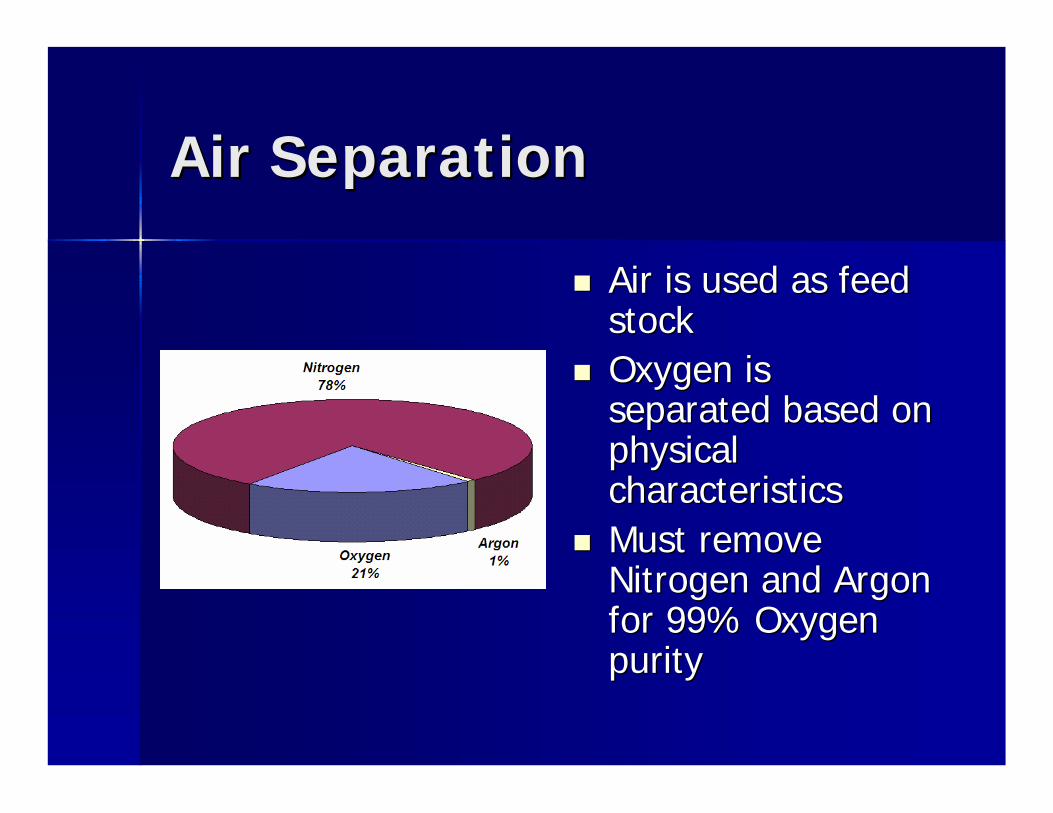
Air is used as feed Air is used as feed stockstock
Oxygen is Oxygen is separated based on separated based on physical physical characteristicscharacteristics
Must remove Must remove Nitrogen and Argon Nitrogen and Argon for 99% Oxygen for 99% Oxygen puritypurity
Air Separation MethodsAir Separation Methods
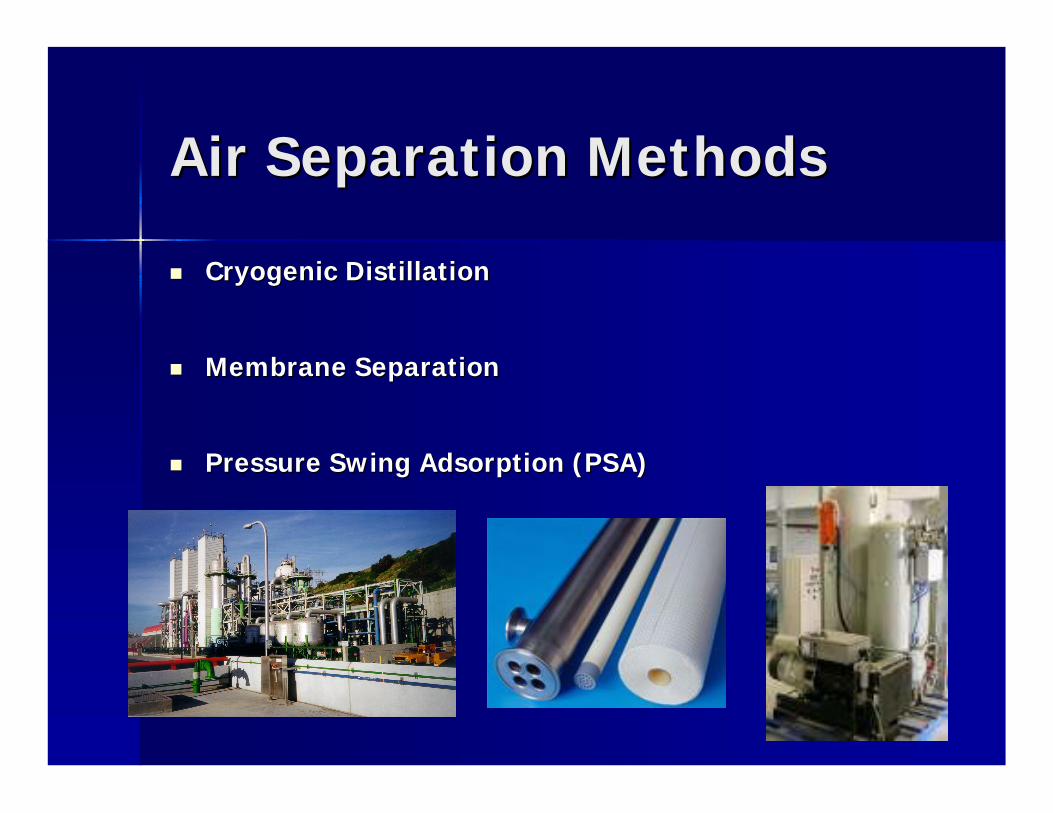
Cryogenic DistillationCryogenic Distillation
Membrane SeparationMembrane Separation
Pressure Swing Adsorption (PSA)Pressure Swing Adsorption (PSA)
Cryogenic SeparationCryogenic Separation
Cryogenic SeparationCryogenic Separation
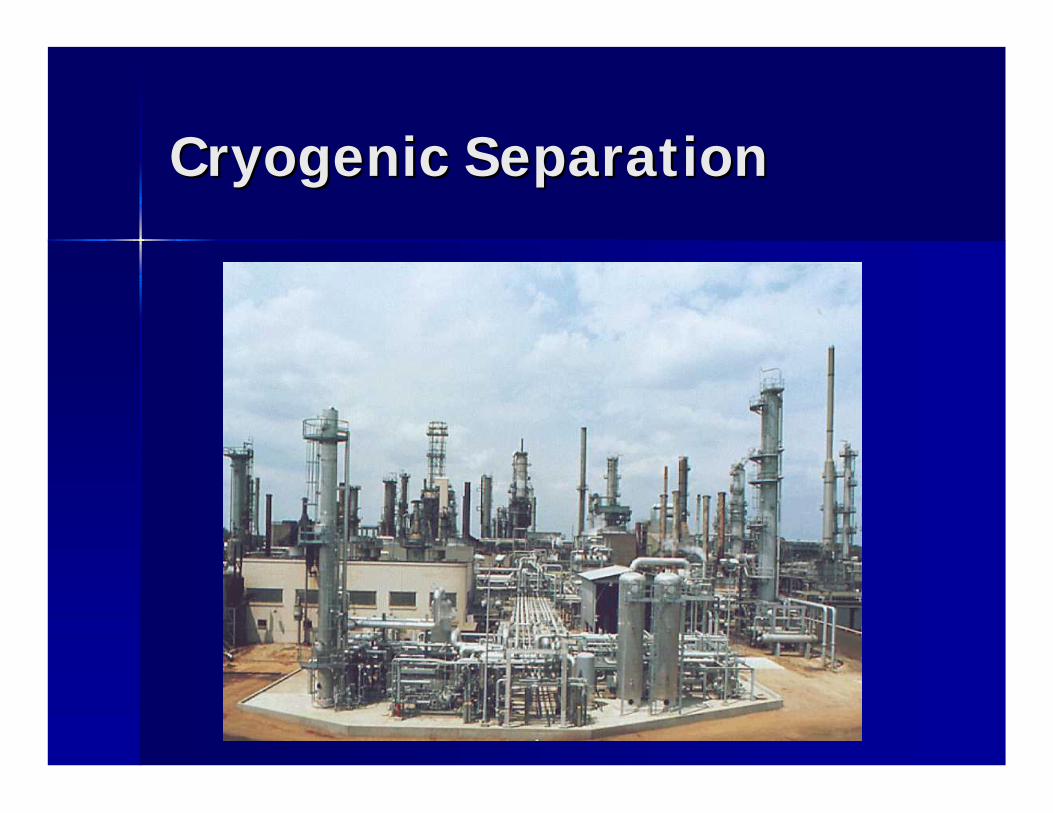
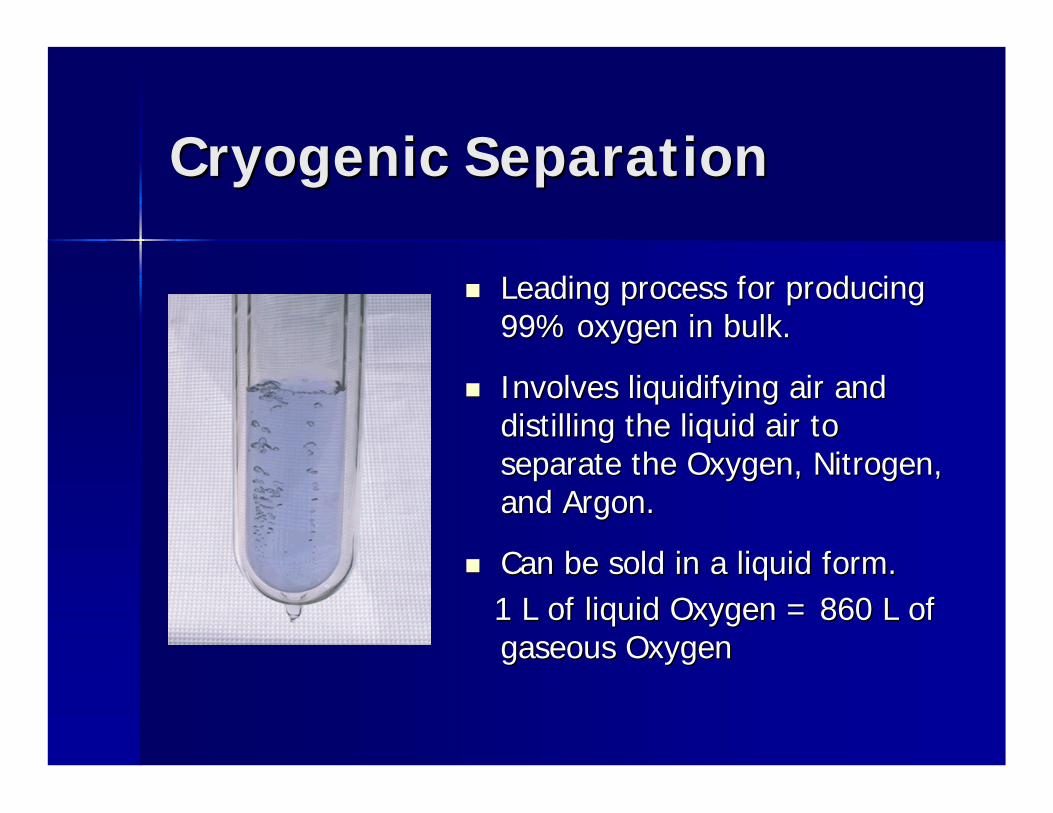
Leading process for producing Leading process for producing 99% oxygen in bulk.99% oxygen in bulk.
Involves liquidifying air and Involves liquidifying air and distilling the liquid air to distilling the liquid air to separate the Oxygen, Nitrogen, separate the Oxygen, Nitrogen, and Argon.and Argon.
Can be sold in a liquid form.Can be sold in a liquid form.1 L of liquid Oxygen = 860 L of 1 L of liquid Oxygen = 860 L of gaseous Oxygengaseous Oxygen
Cryogenic SeparationCryogenic Separation
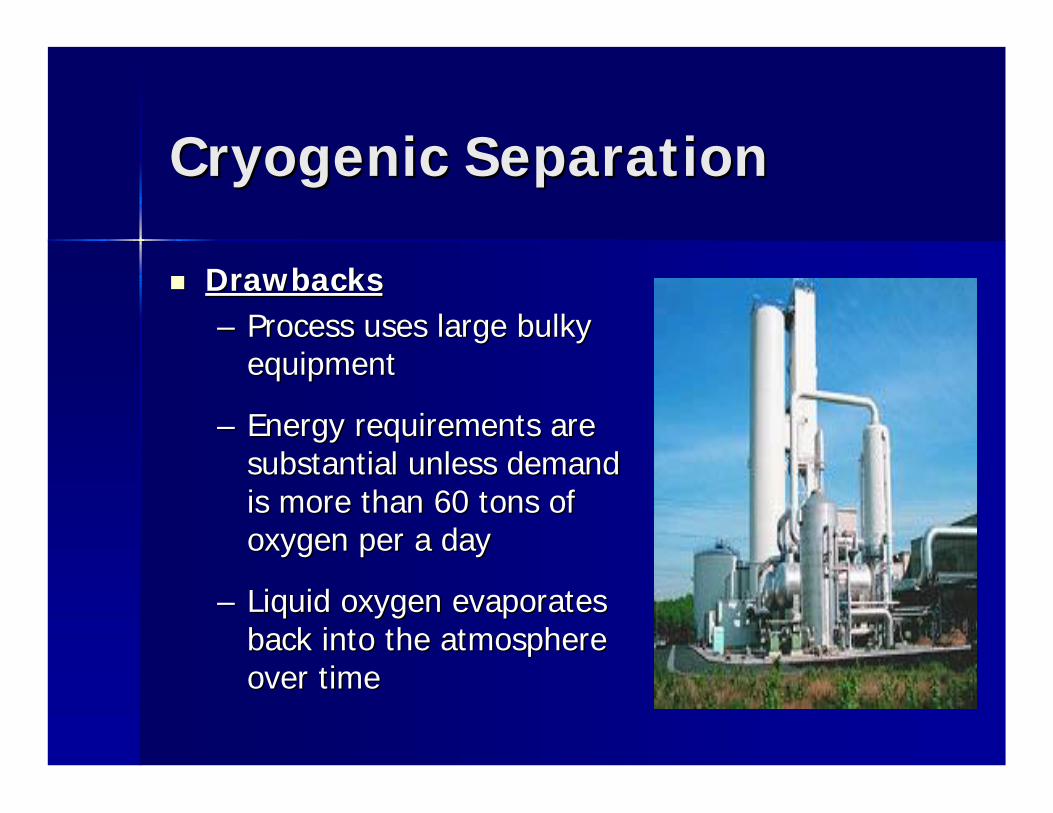
DrawbacksDrawbacks–– Process uses large bulky Process uses large bulky
equipmentequipment
–– Energy requirements are Energy requirements are substantial unless demand substantial unless demand is more than 60 tons of is more than 60 tons of oxygen per a day oxygen per a day
–– Liquid oxygen evaporates Liquid oxygen evaporates back into the atmosphere back into the atmosphere over timeover time
MembranesMembranes
MembranesMembranes
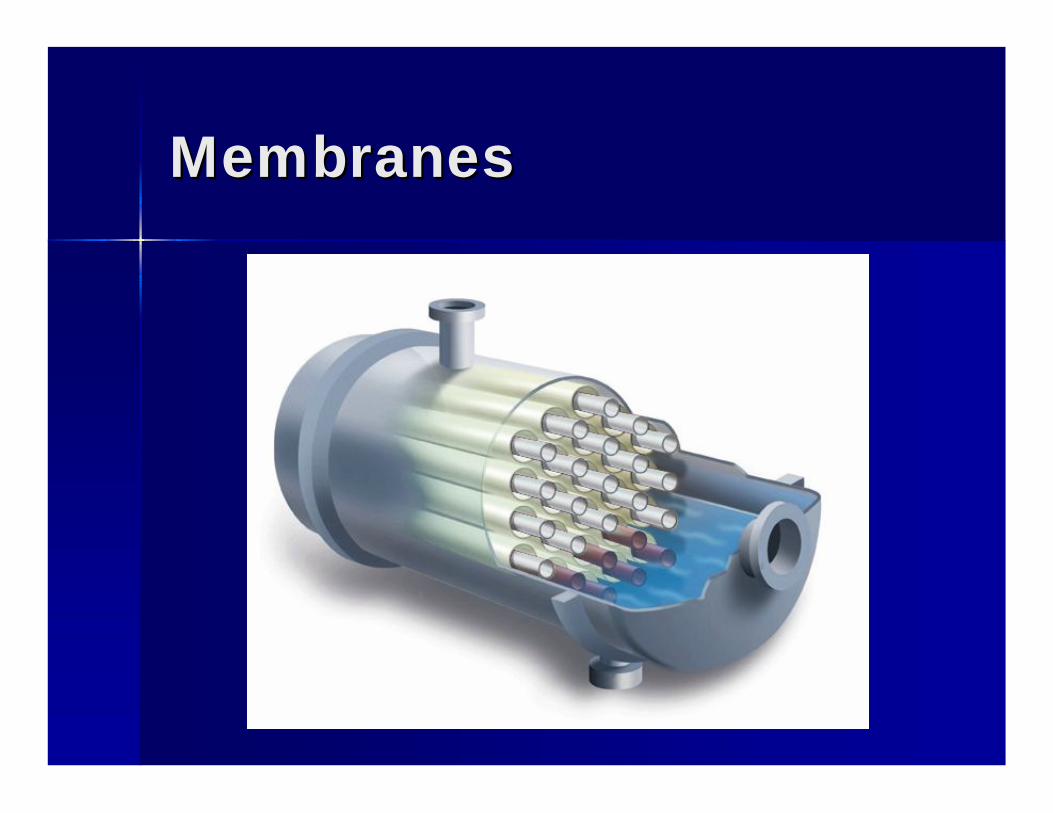
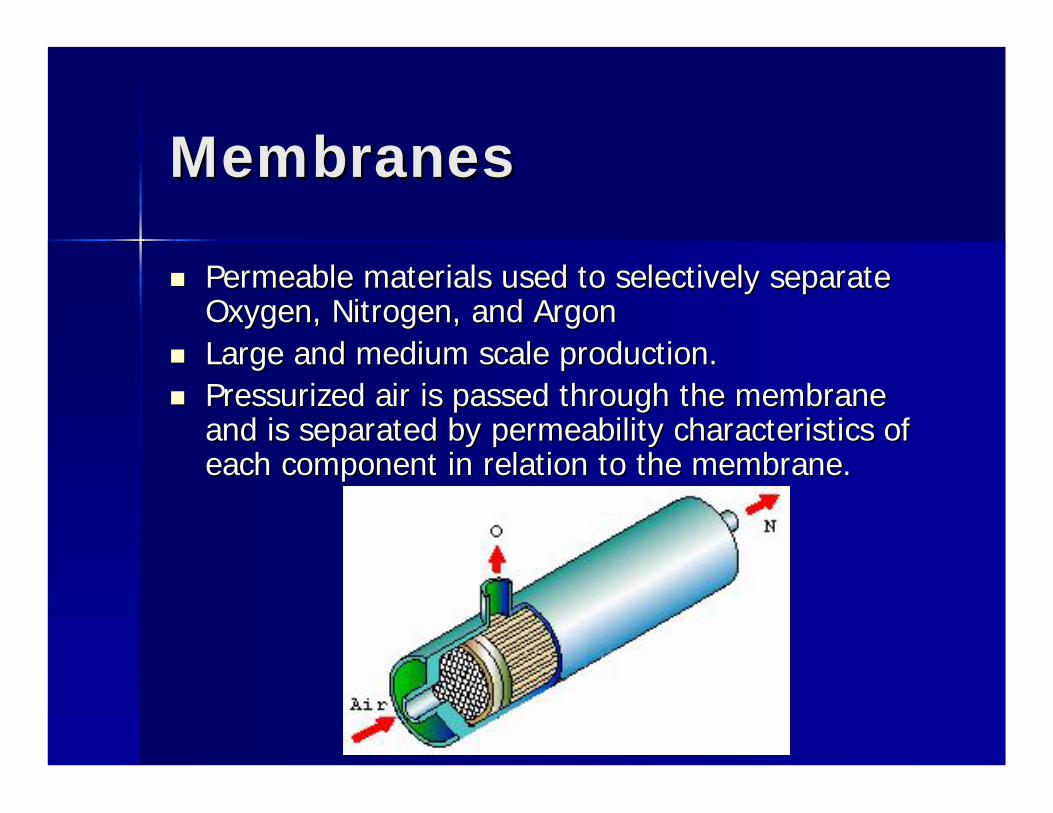
Permeable materials used to selectively separate Permeable materials used to selectively separate Oxygen, Nitrogen, and Argon Oxygen, Nitrogen, and Argon
Large and medium scale production.Large and medium scale production. Pressurized air is passed through the membrane Pressurized air is passed through the membrane
and is separated by permeability characteristics of and is separated by permeability characteristics of each component in relation to the membrane. each component in relation to the membrane.
MembranesMembranes
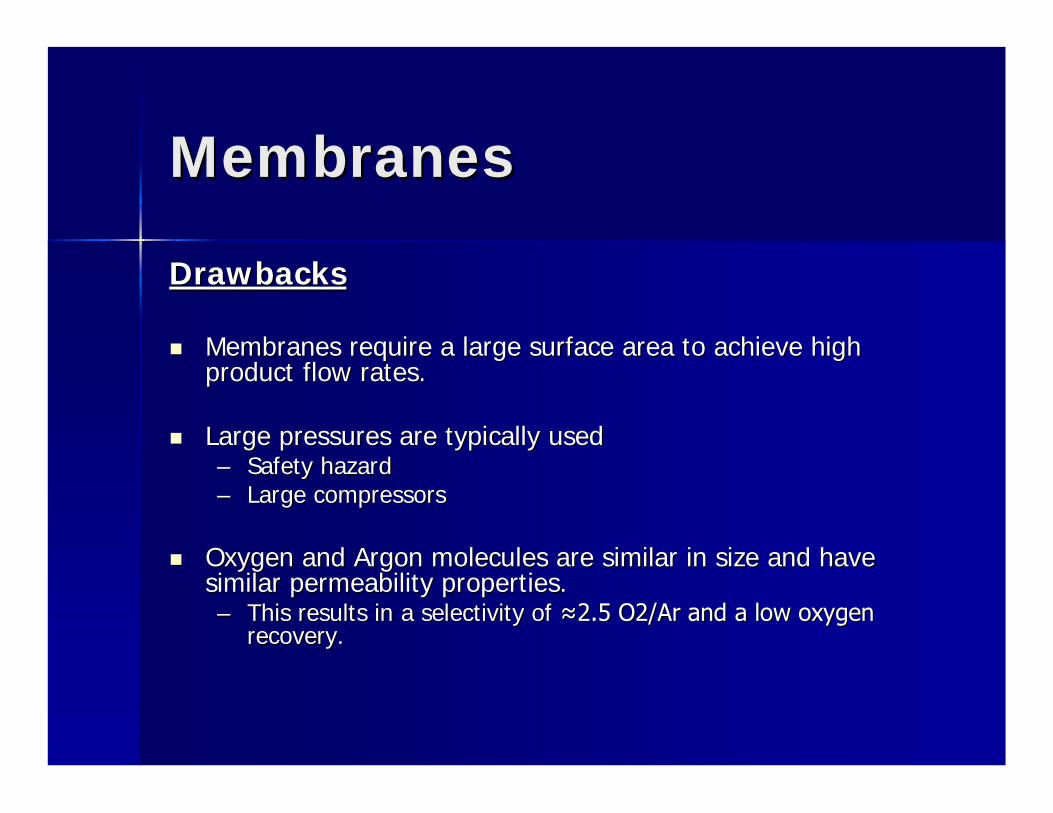
DrawbacksDrawbacks
Membranes require a large surface area to achieve high Membranes require a large surface area to achieve high product flow rates.product flow rates.
Large pressures are typically usedLarge pressures are typically used–– Safety hazardSafety hazard–– Large compressorsLarge compressors
Oxygen and Argon molecules are similar in size and have Oxygen and Argon molecules are similar in size and have similar permeability properties. similar permeability properties. –– This results in a selectivity of ≈2.5 O2/Ar and a low oxygen This results in a selectivity of ≈2.5 O2/Ar and a low oxygen
recovery.recovery.
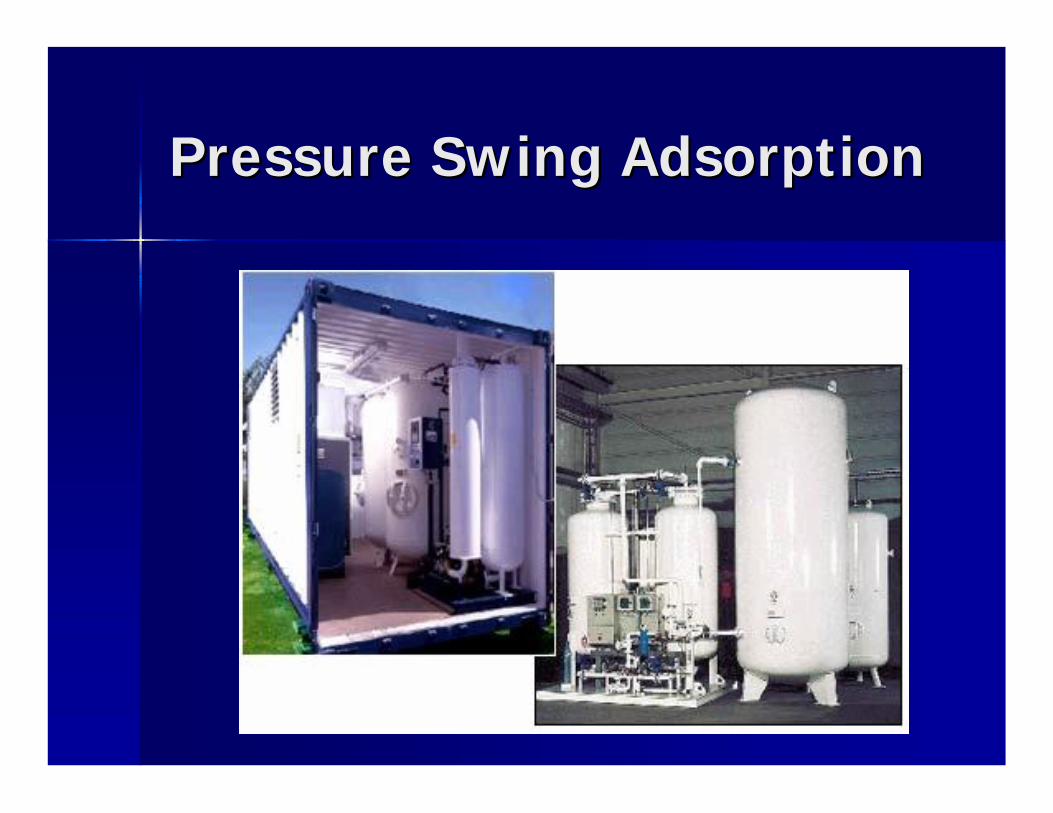
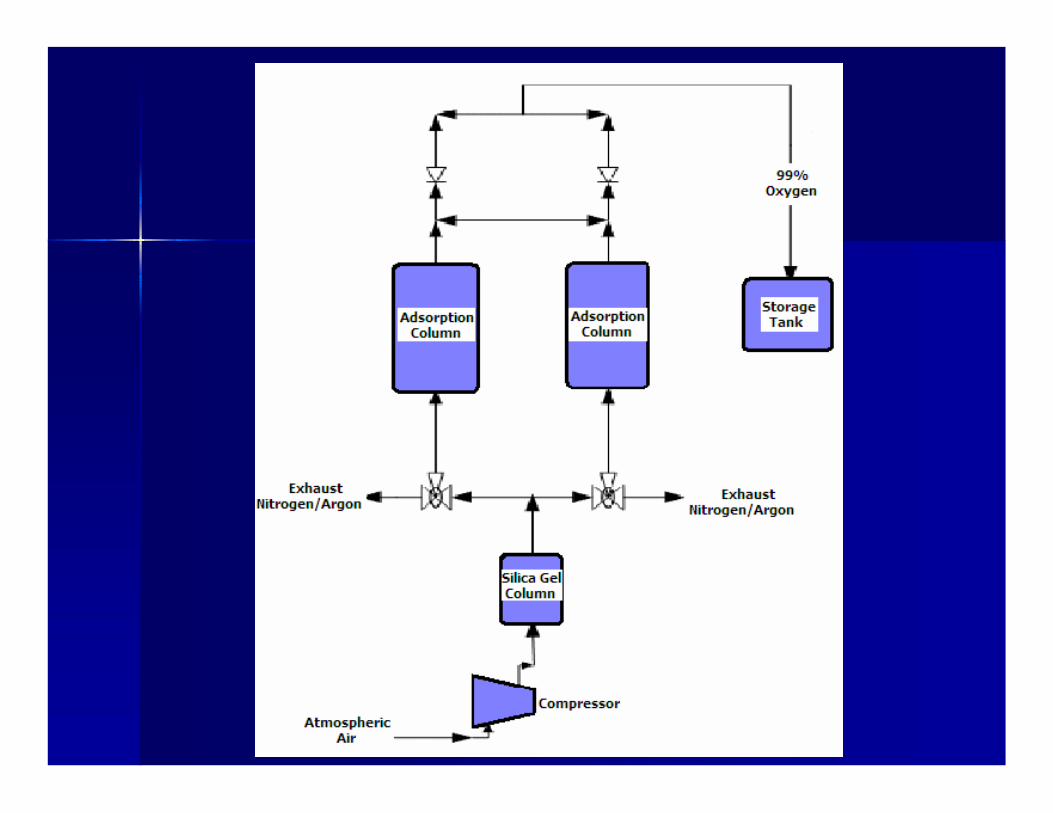
Pressure Swing AdsorptionPressure Swing Adsorption
Pressure Swing AdsorptionPressure Swing Adsorption
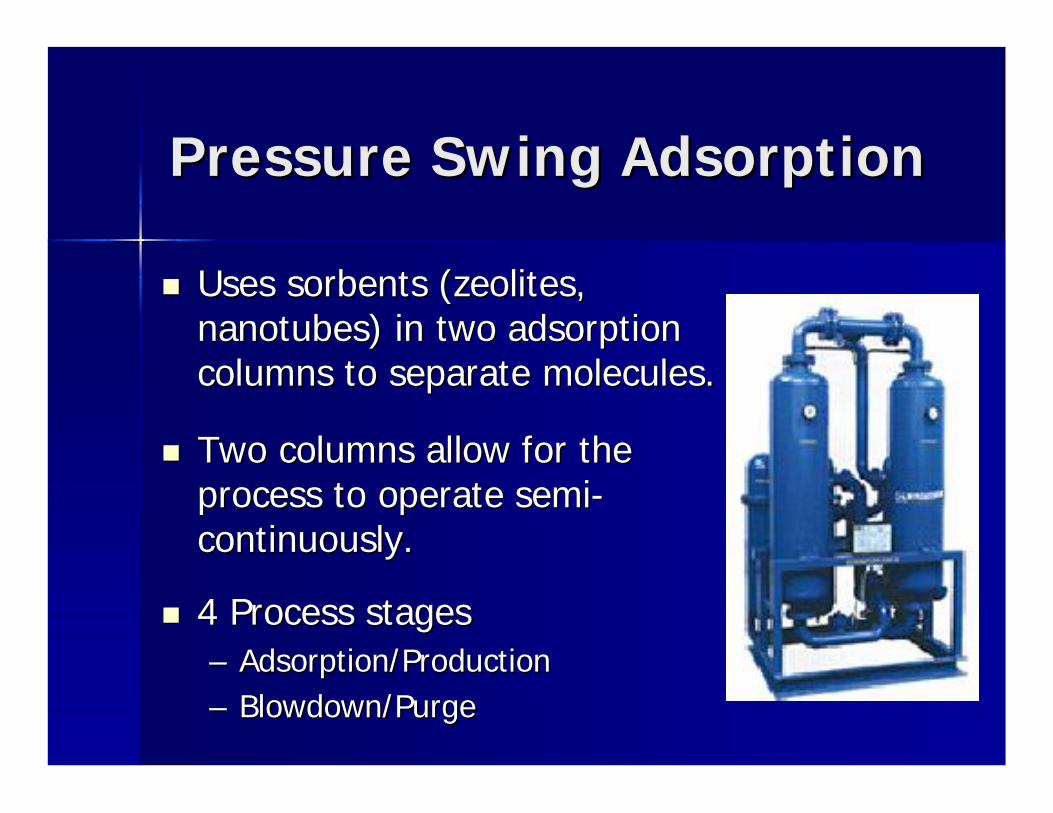
Uses sorbents (zeolites, Uses sorbents (zeolites, nanotubes) in two adsorption nanotubes) in two adsorption columns to separate molecules.columns to separate molecules.
Two columns allow for the Two columns allow for the process to operate semiprocess to operate semi--continuously. continuously.
4 Process stages4 Process stages–– Adsorption/ProductionAdsorption/Production–– BlowdownBlowdown/Purge/Purge
Pressure Swing AdsorptionPressure Swing Adsorption
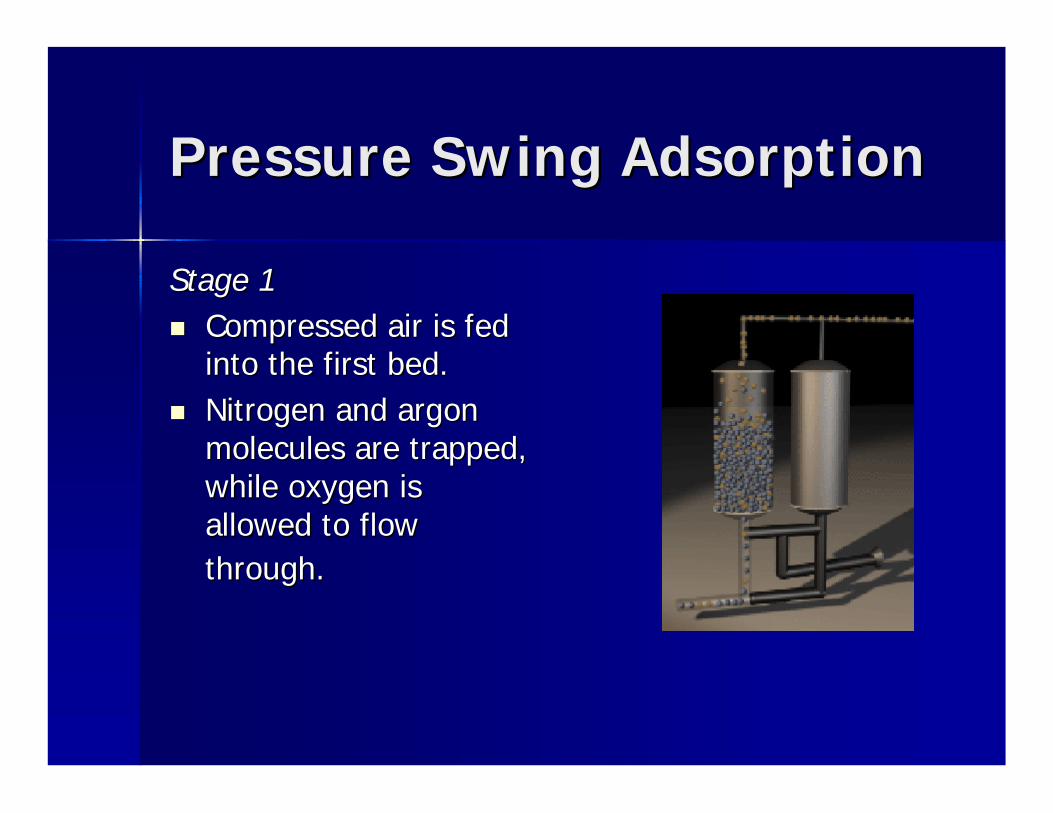
Stage 1Stage 1 Compressed air is fed Compressed air is fed
into the first bed. into the first bed. Nitrogen and argon Nitrogen and argon
molecules are trapped, molecules are trapped, while oxygen is while oxygen is allowed to flow allowed to flow through.through.
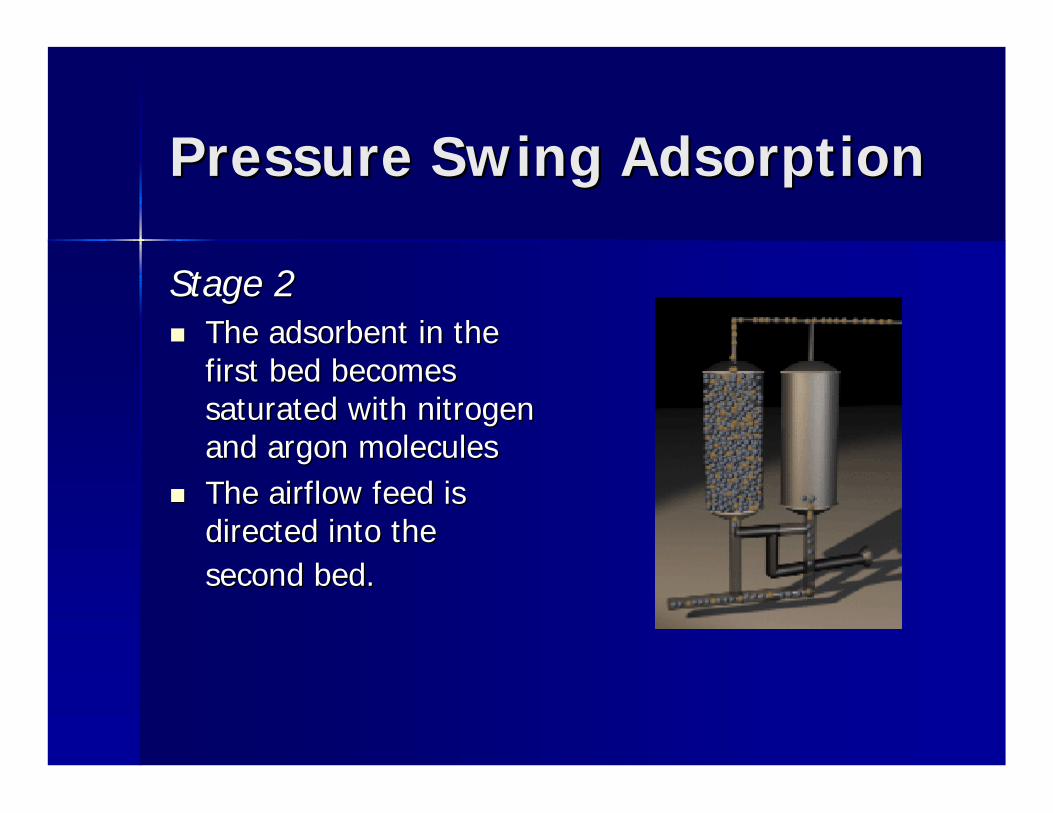
Pressure Swing AdsorptionPressure Swing Adsorption
Stage 2Stage 2 The adsorbent in the The adsorbent in the
first bed becomes first bed becomes saturated with nitrogen saturated with nitrogen and argon moleculesand argon molecules
The airflow feed is The airflow feed is directed into the directed into the second bed.second bed.
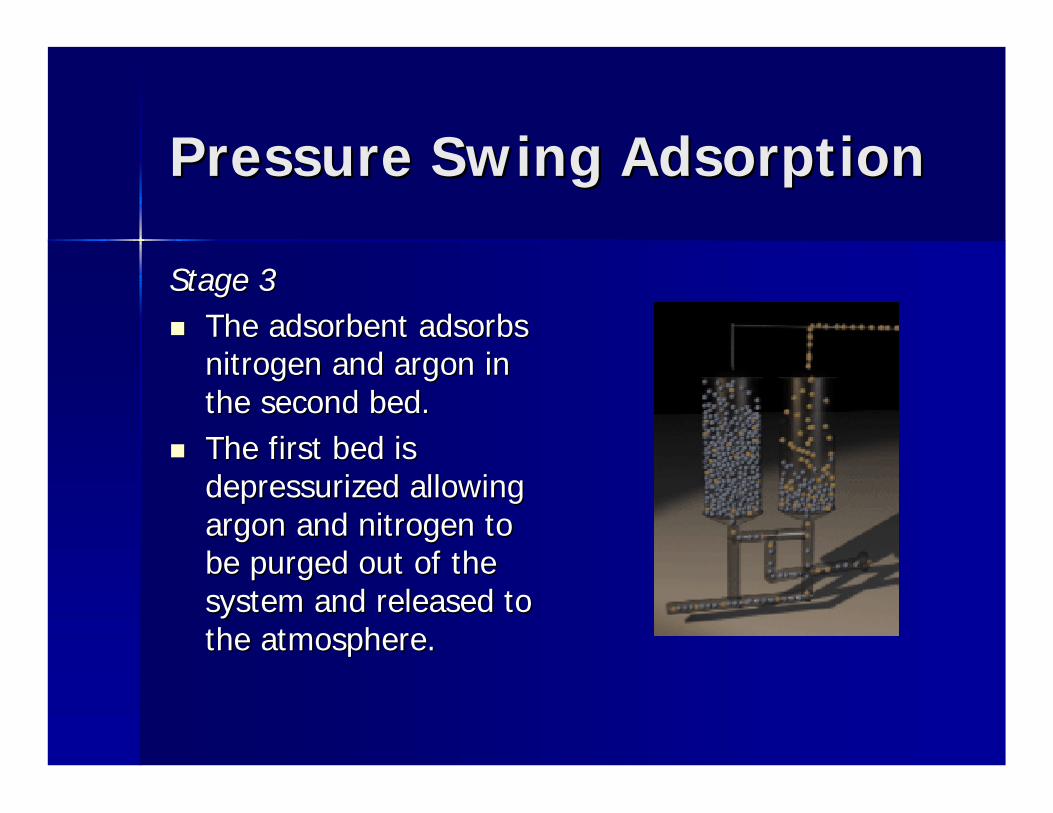
Pressure Swing AdsorptionPressure Swing Adsorption
Stage 3Stage 3 The adsorbent adsorbs The adsorbent adsorbs
nitrogen and argon in nitrogen and argon in the second bed. the second bed.
The first bed is The first bed is depressurized allowing depressurized allowing argon and nitrogen to argon and nitrogen to be purged out of the be purged out of the system and released to system and released to the atmosphere. the atmosphere.
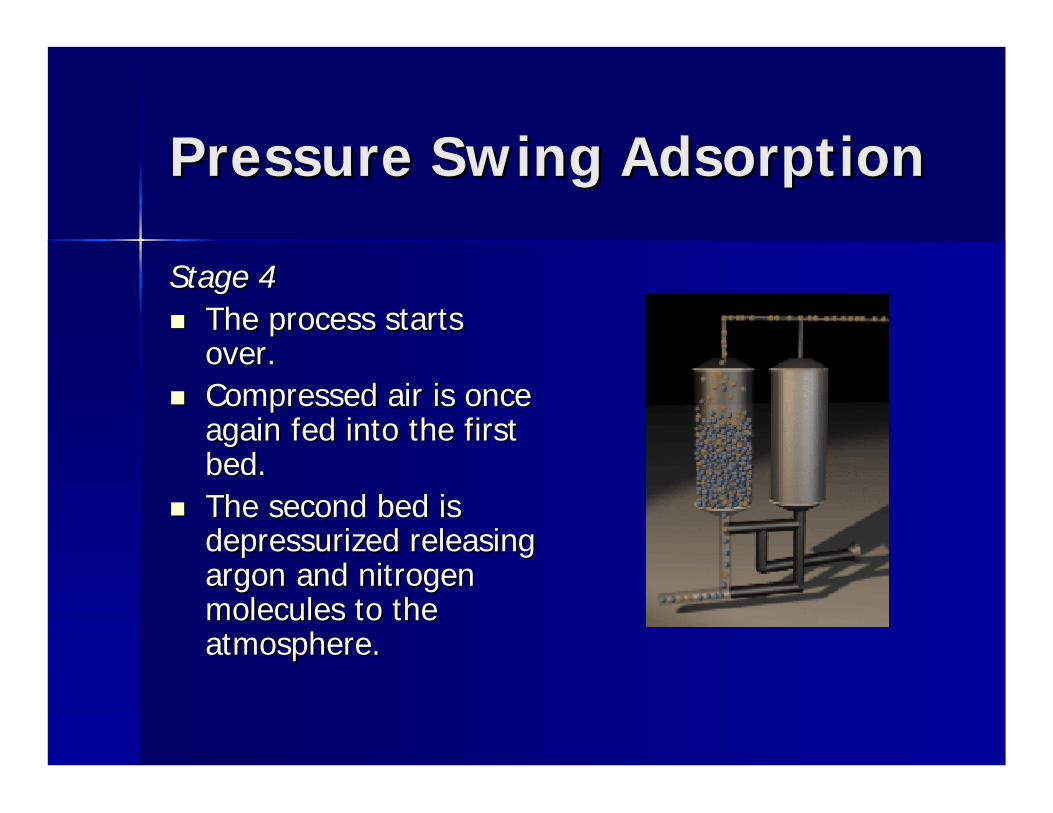
Pressure Swing AdsorptionPressure Swing Adsorption
Stage 4Stage 4 The process starts The process starts
over. over. Compressed air is once Compressed air is once
again fed into the first again fed into the first bed. bed.
The second bed is The second bed is depressurized releasing depressurized releasing argon and nitrogen argon and nitrogen molecules to the molecules to the atmosphere. atmosphere.
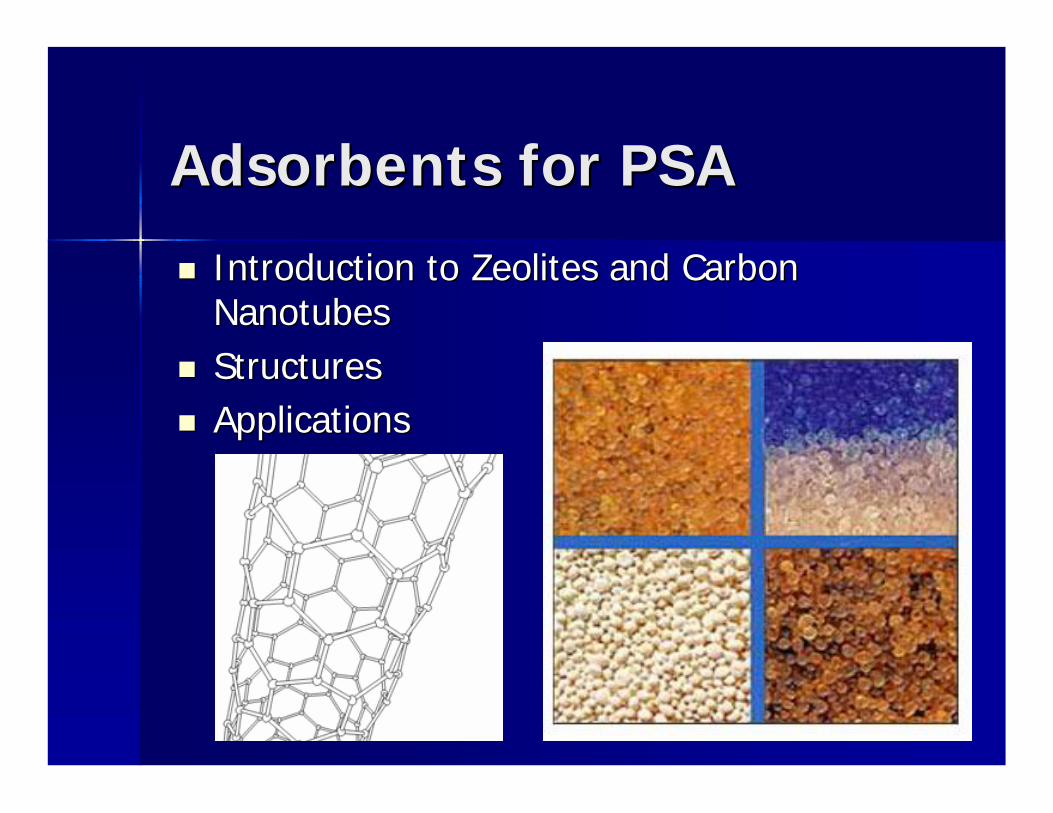
Adsorbents for PSAAdsorbents for PSA
Introduction to Zeolites and Carbon Introduction to Zeolites and Carbon NanotubesNanotubes
StructuresStructures ApplicationsApplications
Silica Gel PretreatmentSilica Gel Pretreatment
Pretreatment bed to remove water vapor and impurities Pretreatment bed to remove water vapor and impurities such as carbon dioxide such as carbon dioxide –– Air at 100% humidity is approximately 3% water vaporAir at 100% humidity is approximately 3% water vapor
Water can impair the performance of adsorbents in the Water can impair the performance of adsorbents in the PSA adsorption columns. PSA adsorption columns.
Silica gel beds are necessary to remove water vapor Silica gel beds are necessary to remove water vapor from the air. from the air. –– A heating coil used to evaporate the water from the silica A heating coil used to evaporate the water from the silica
gelgel
Kinetic Separation Kinetic Separation
Molecular Sieve Carbon (MSC) Molecular Sieve Carbon (MSC) adsorbents using PSA technologyadsorbents using PSA technology
Ideal for separation of Argon and Ideal for separation of Argon and OxygenOxygen–– MSCsMSCs in kinetic adsorption can adsorb in kinetic adsorption can adsorb
Oxygen 30 times faster than ArgonOxygen 30 times faster than Argon Creates a problem in design, requiring two Creates a problem in design, requiring two
PSA systems to collect the adsorbed OxygenPSA systems to collect the adsorbed Oxygen
Carbon NanotubesCarbon Nanotubes
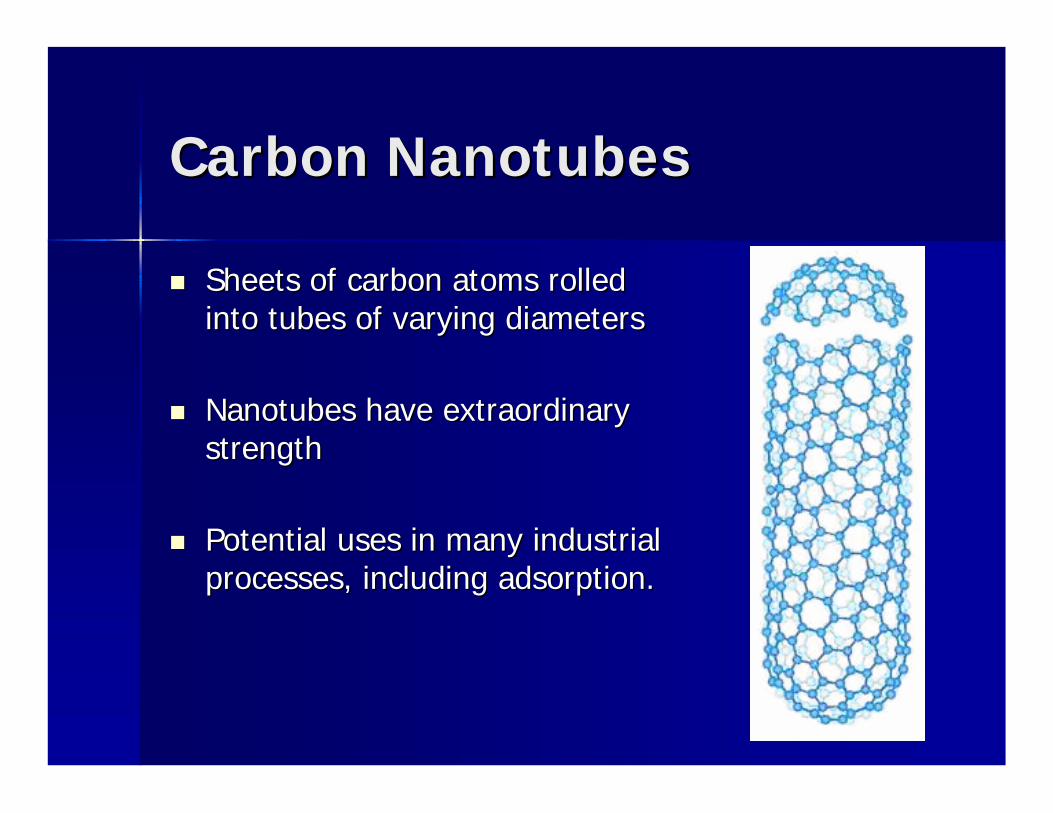
Sheets of carbon atoms rolled Sheets of carbon atoms rolled into tubes of varying diametersinto tubes of varying diameters
Nanotubes have extraordinary Nanotubes have extraordinary strength strength
Potential uses in many industrial Potential uses in many industrial processes, including adsorption.processes, including adsorption.
Carbon NanotubesCarbon Nanotubes
AdvantagesAdvantages Nanotubes have little interaction with nitrogen at Nanotubes have little interaction with nitrogen at
high temperatures due to oxygen’s higher packing high temperatures due to oxygen’s higher packing efficiency, smaller diameter, and entropic energiesefficiency, smaller diameter, and entropic energies
Research has shown that single walled carbon Research has shown that single walled carbon nanotubes (SWCN) of 12.53nanotubes (SWCN) of 12.53Å have a selectivity of Å have a selectivity of O2/N2 of 100:1 at 10 bar.O2/N2 of 100:1 at 10 bar.
It has been indicated that Argon will have very little It has been indicated that Argon will have very little interaction with nanotubesinteraction with nanotubes
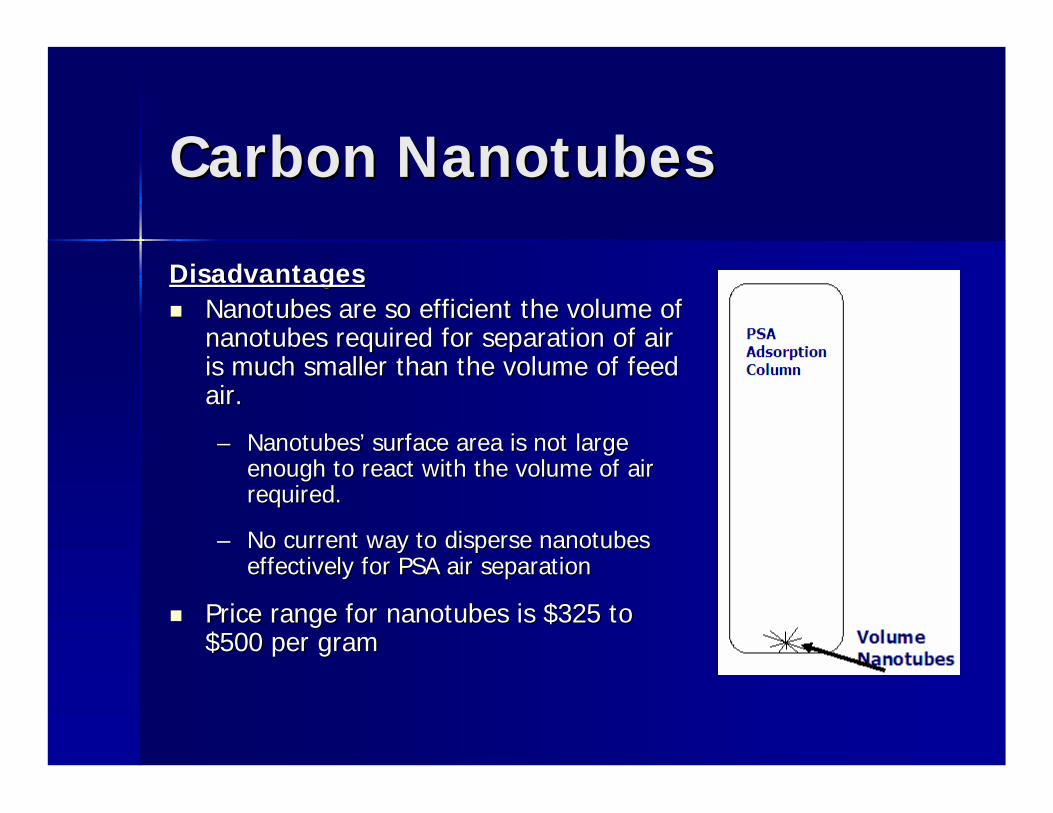
Carbon NanotubesCarbon Nanotubes
DisadvantagesDisadvantages Nanotubes are so efficient the volume of Nanotubes are so efficient the volume of
nanotubes required for separation of air nanotubes required for separation of air is much smaller than the volume of feed is much smaller than the volume of feed air.air.
–– Nanotubes’ surface area is not large Nanotubes’ surface area is not large enough to react with the volume of air enough to react with the volume of air required. required.
–– No current way to disperse nanotubes No current way to disperse nanotubes effectively for PSA air separationeffectively for PSA air separation
Price range for nanotubes is $325 to Price range for nanotubes is $325 to $500 per gram$500 per gram
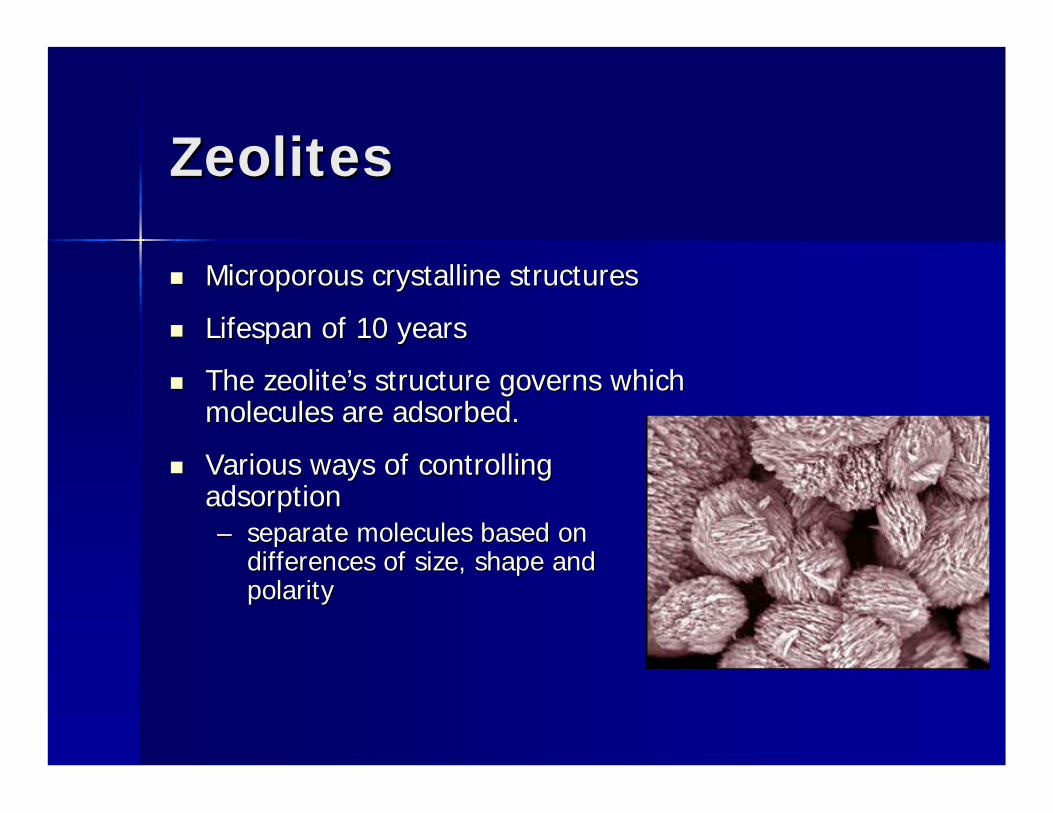
ZeolitesZeolites
MicroporousMicroporous crystalline structurescrystalline structures
Lifespan of 10 yearsLifespan of 10 years
The The zeolite’szeolite’s structure governs which structure governs which molecules are adsorbed.molecules are adsorbed.
Various ways of controlling Various ways of controlling adsorption adsorption –– separate molecules based on separate molecules based on
differences of size, shape and differences of size, shape and polaritypolarity
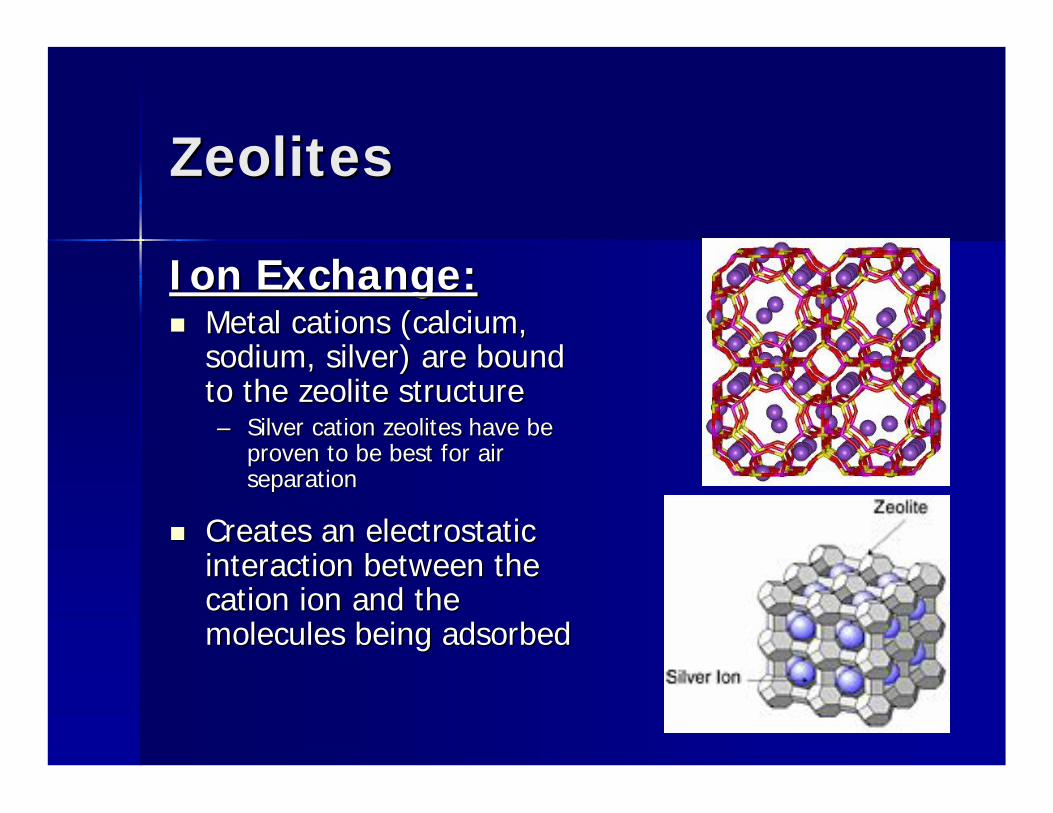
ZeolitesZeolites
Ion Exchange:Ion Exchange: Metal Metal cationscations (calcium, (calcium,
sodium, silver) are bound sodium, silver) are bound to the to the zeolitezeolite structurestructure–– Silver Silver cationcation zeoliteszeolites have be have be
proven to be best for air proven to be best for air separationseparation
Creates an electrostatic Creates an electrostatic interaction between the interaction between the cationcation ion and the ion and the molecules being adsorbedmolecules being adsorbed
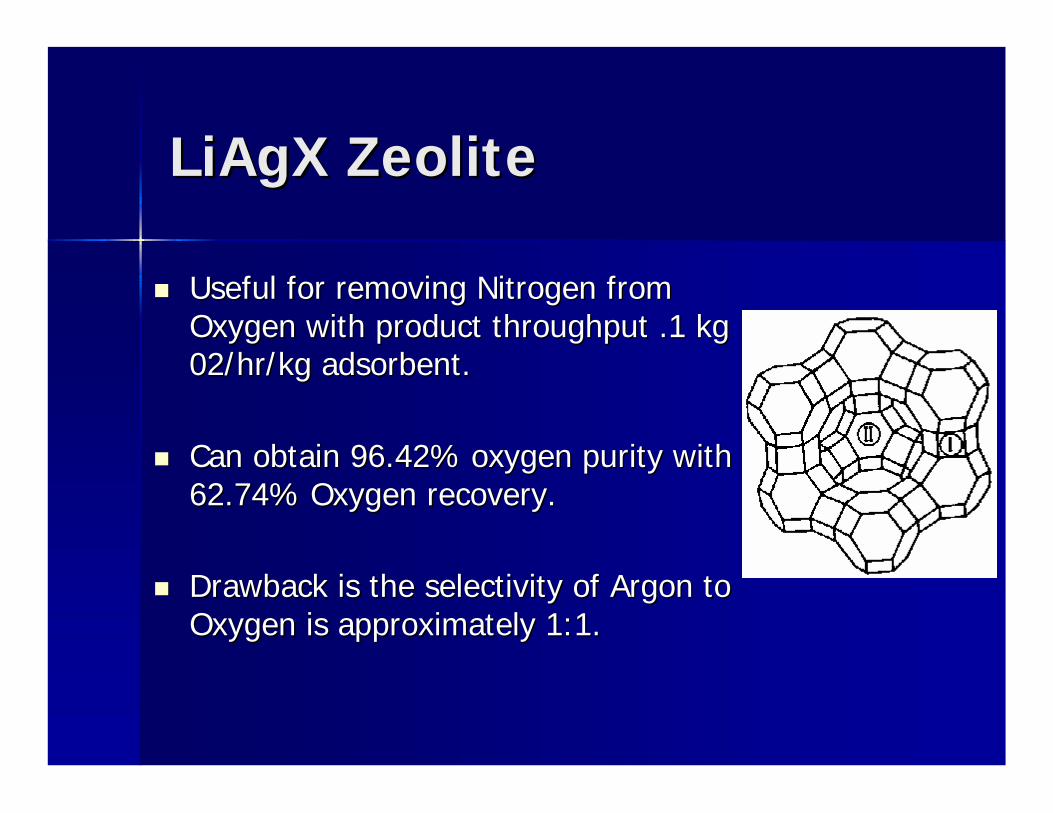
LiAgXLiAgX ZeoliteZeolite
Useful for removing Nitrogen from Useful for removing Nitrogen from Oxygen with product throughput .1 kg Oxygen with product throughput .1 kg 02/hr/kg adsorbent.02/hr/kg adsorbent.
Can obtain 96.42% oxygen purity with Can obtain 96.42% oxygen purity with 62.74% Oxygen recovery.62.74% Oxygen recovery.
Drawback is the selectivity of Argon to Drawback is the selectivity of Argon to Oxygen is approximately 1:1.Oxygen is approximately 1:1.
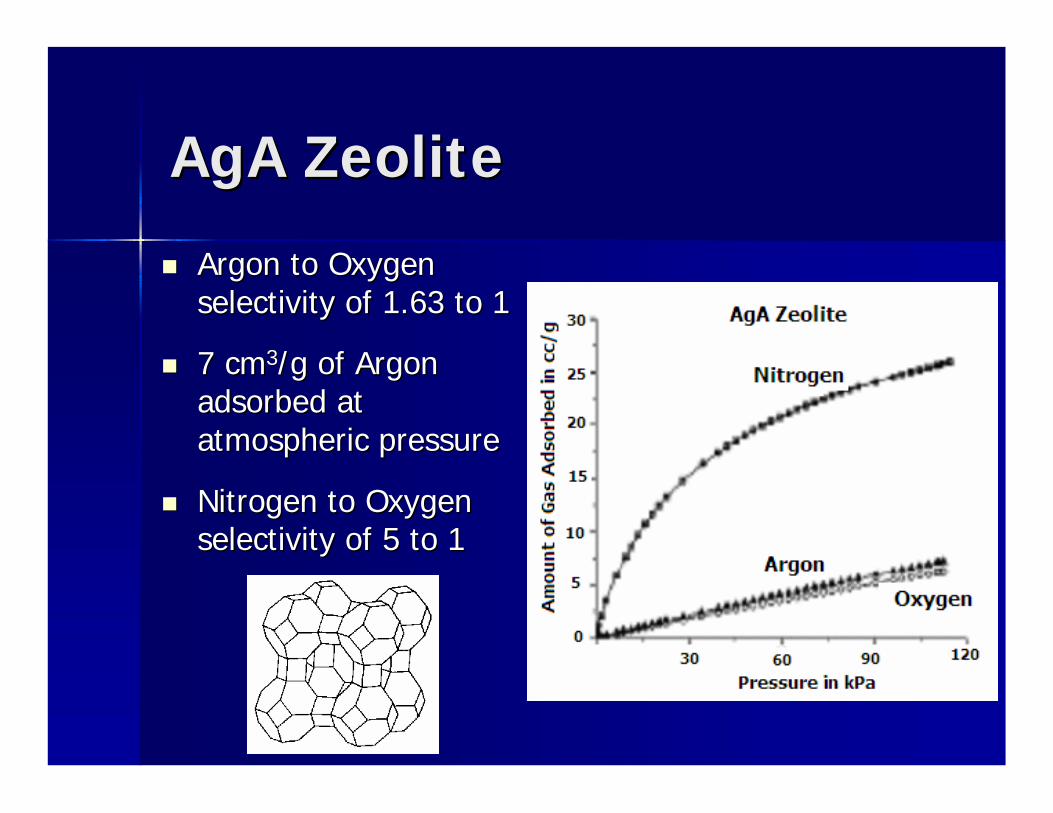
AgAAgA ZeoliteZeolite
Argon to Oxygen Argon to Oxygen selectivity of 1.63 to 1selectivity of 1.63 to 1
7 cm7 cm33/g of Argon /g of Argon adsorbed at adsorbed at atmospheric pressureatmospheric pressure
Nitrogen to Oxygen Nitrogen to Oxygen selectivity of 5 to 1selectivity of 5 to 1
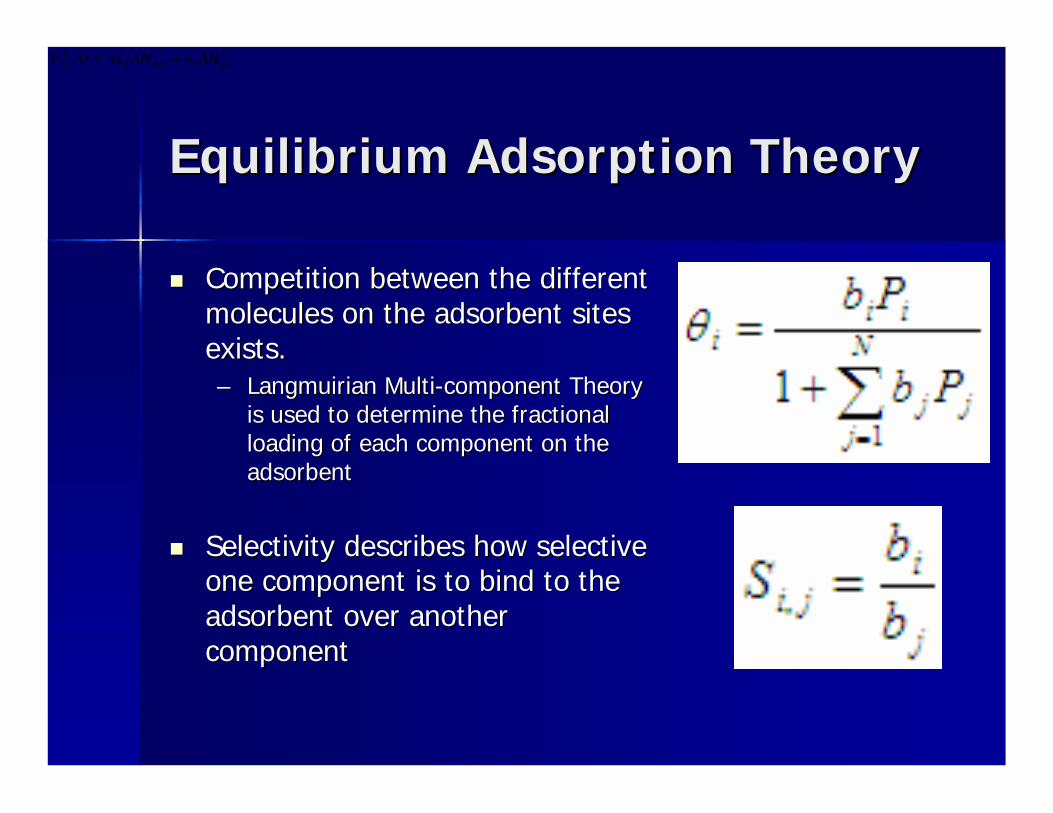
Equilibrium Adsorption TheoryEquilibrium Adsorption Theory
Competition between the different Competition between the different molecules on the adsorbent sites molecules on the adsorbent sites exists. exists. –– LangmuirianLangmuirian MultiMulti--component Theory component Theory
is used to determine the fractional is used to determine the fractional loading of each component on the loading of each component on the adsorbentadsorbent
Selectivity describes how selective Selectivity describes how selective one component is to bind to the one component is to bind to the adsorbent over another adsorbent over another componentcomponent
121
121
02 NNN ANANLtF
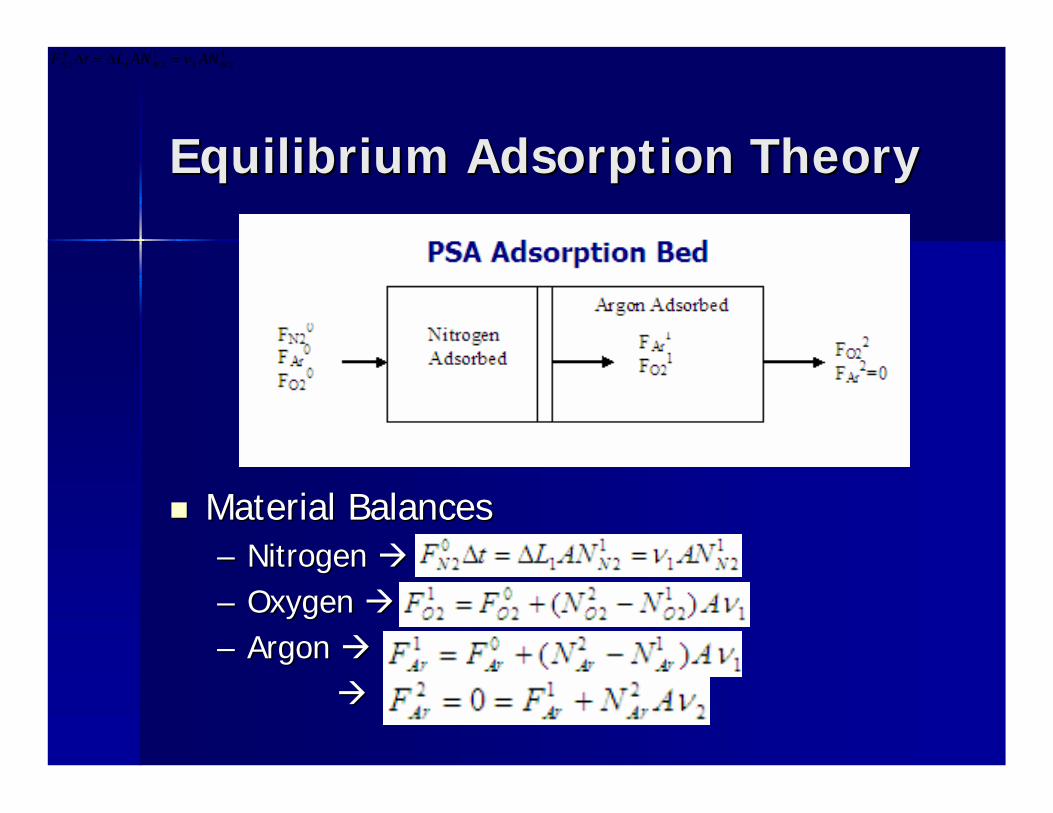
Equilibrium Adsorption TheoryEquilibrium Adsorption Theory
Material BalancesMaterial Balances–– Nitrogen Nitrogen –– Oxygen Oxygen –– Argon Argon
121
121
02 NNN ANANLtF
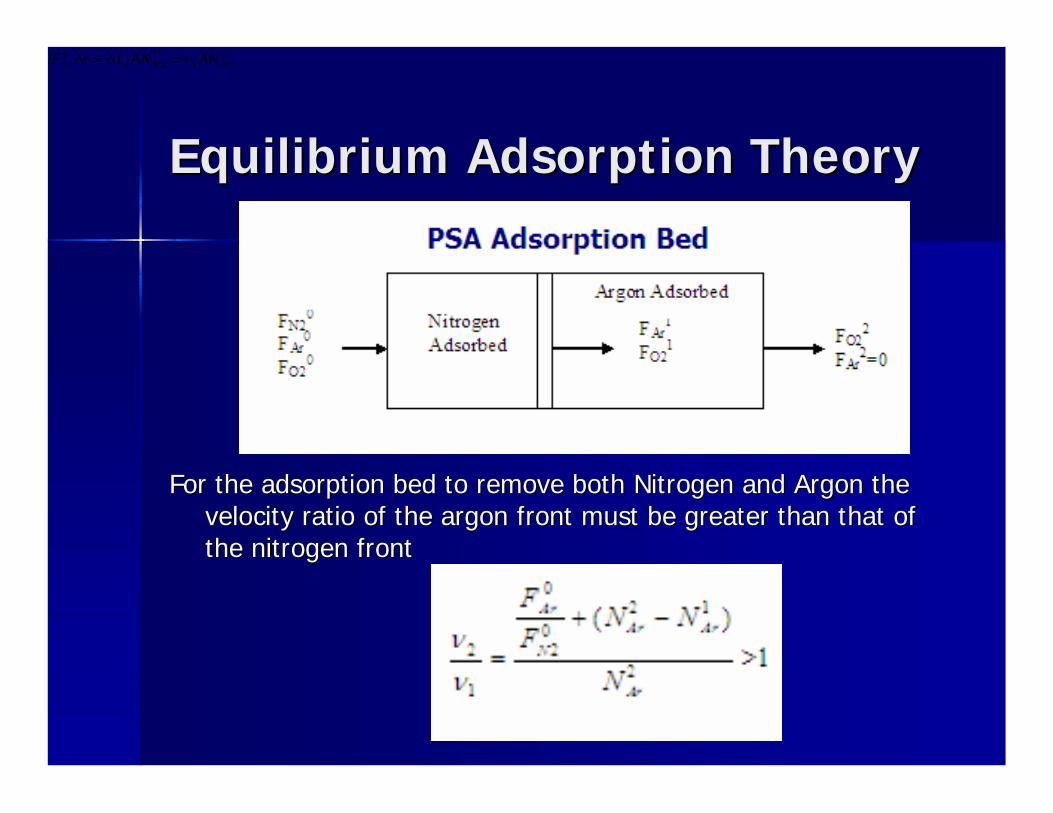
Equilibrium Adsorption TheoryEquilibrium Adsorption Theory
For the adsorption bed to remove both Nitrogen and Argon the For the adsorption bed to remove both Nitrogen and Argon the velocity ratio of the argon front must be greater than that of velocity ratio of the argon front must be greater than that of the nitrogen front the nitrogen front
121
121
02 NNN ANANLtF
Proposed Use of the Proposed Use of the Presented Presented
TechnologiesTechnologies
Proposed Use of TechnologyProposed Use of Technology
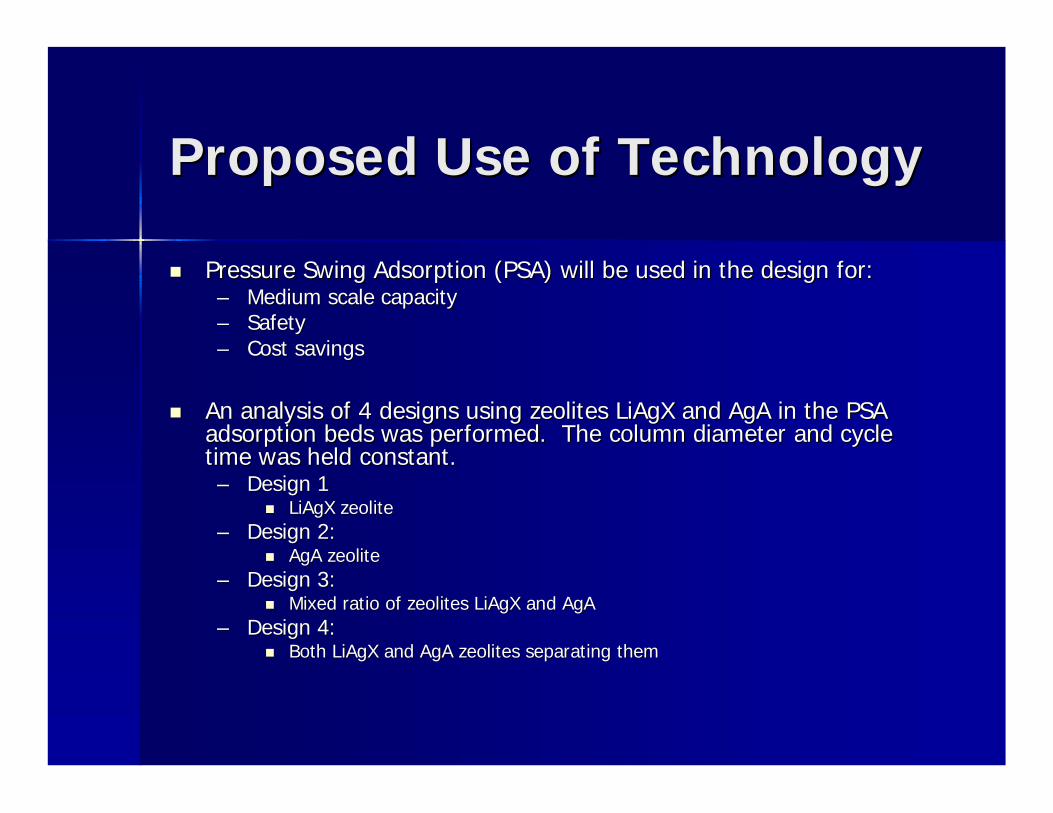
Pressure Swing Adsorption (PSA) will be used in the design for:Pressure Swing Adsorption (PSA) will be used in the design for:–– Medium scale capacityMedium scale capacity–– SafetySafety–– Cost savingsCost savings
An analysis of 4 designs using An analysis of 4 designs using zeoliteszeolites LiAgXLiAgX and and AgAAgA in the PSA in the PSA adsorption beds was performed. The column diameter and cycle adsorption beds was performed. The column diameter and cycle time was held constant.time was held constant.–– Design 1Design 1
LiAgXLiAgX zeolitezeolite–– Design 2:Design 2:
AgAAgA zeolitezeolite–– Design 3:Design 3:
Mixed ratio of Mixed ratio of zeoliteszeolites LiAgXLiAgX and and AgAAgA–– Design 4:Design 4:
Both Both LiAgXLiAgX and and AgAAgA zeoliteszeolites separating themseparating them
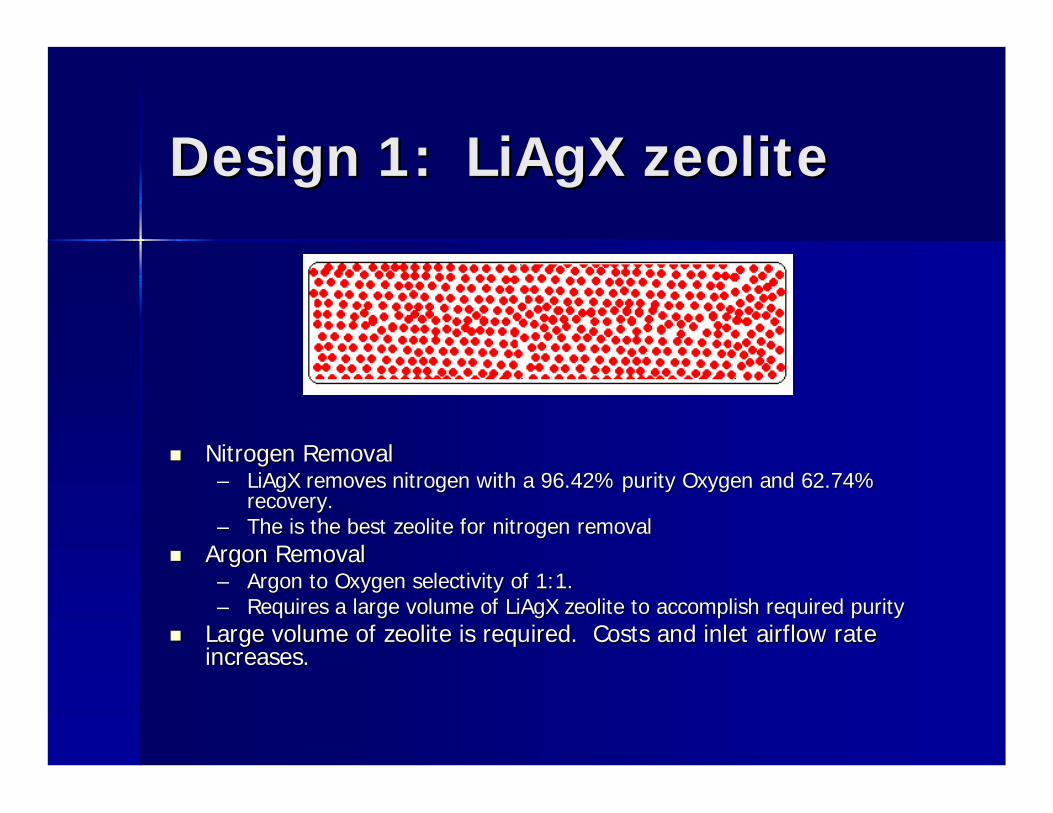
Design 1: Design 1: LiAgXLiAgX zeolitezeolite
Nitrogen RemovalNitrogen Removal–– LiAgXLiAgX removes nitrogen with a 96.42% purity Oxygen and 62.74% removes nitrogen with a 96.42% purity Oxygen and 62.74%
recovery. recovery. –– The is the best The is the best zeolitezeolite for nitrogen removalfor nitrogen removal
Argon RemovalArgon Removal–– Argon to Oxygen selectivity of 1:1. Argon to Oxygen selectivity of 1:1. –– Requires a large volume of Requires a large volume of LiAgXLiAgX zeolitezeolite to accomplish required purityto accomplish required purity
Large volume of Large volume of zeolitezeolite is required. Costs and inlet airflow rate is required. Costs and inlet airflow rate increases.increases.
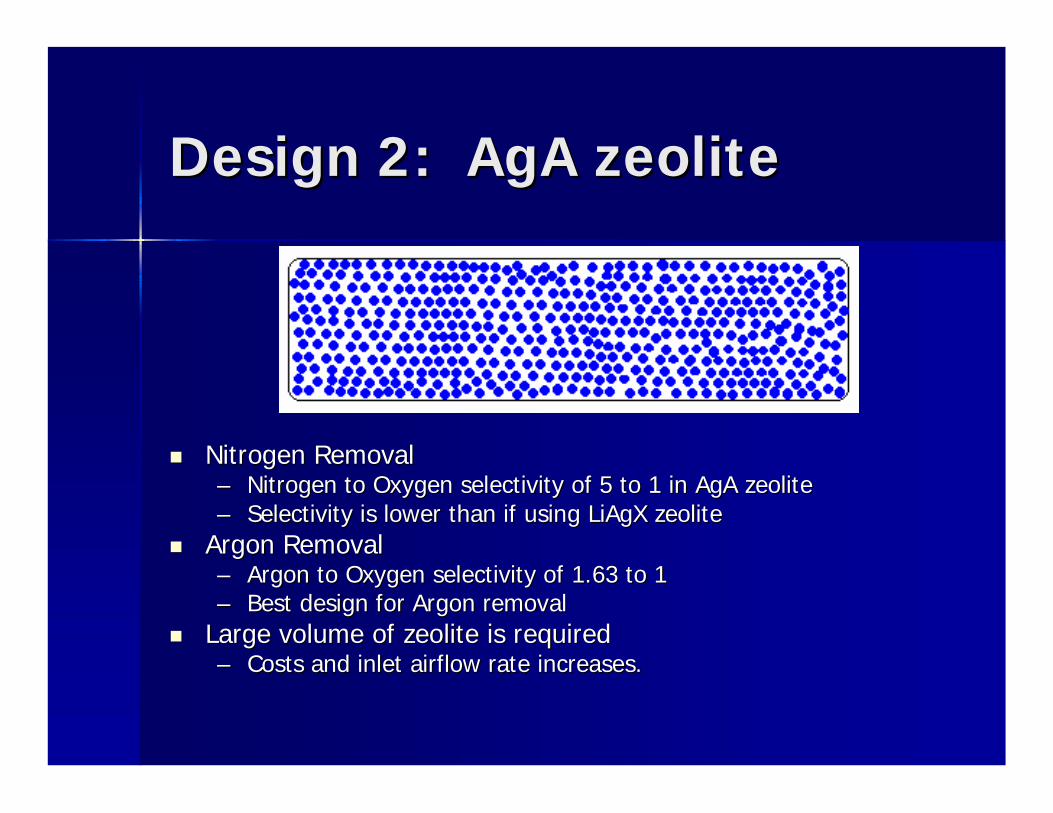
Design 2: Design 2: AgAAgA zeolitezeolite
Nitrogen RemovalNitrogen Removal–– Nitrogen to Oxygen selectivity of 5 to 1 in Nitrogen to Oxygen selectivity of 5 to 1 in AgAAgA zeolitezeolite–– Selectivity is lower than if using Selectivity is lower than if using LiAgXLiAgX zeolitezeolite
Argon RemovalArgon Removal–– Argon to Oxygen selectivity of 1.63 to 1 Argon to Oxygen selectivity of 1.63 to 1 –– Best design for Argon removalBest design for Argon removal
Large volume of Large volume of zeolitezeolite is requiredis required–– Costs and inlet airflow rate increases.Costs and inlet airflow rate increases.
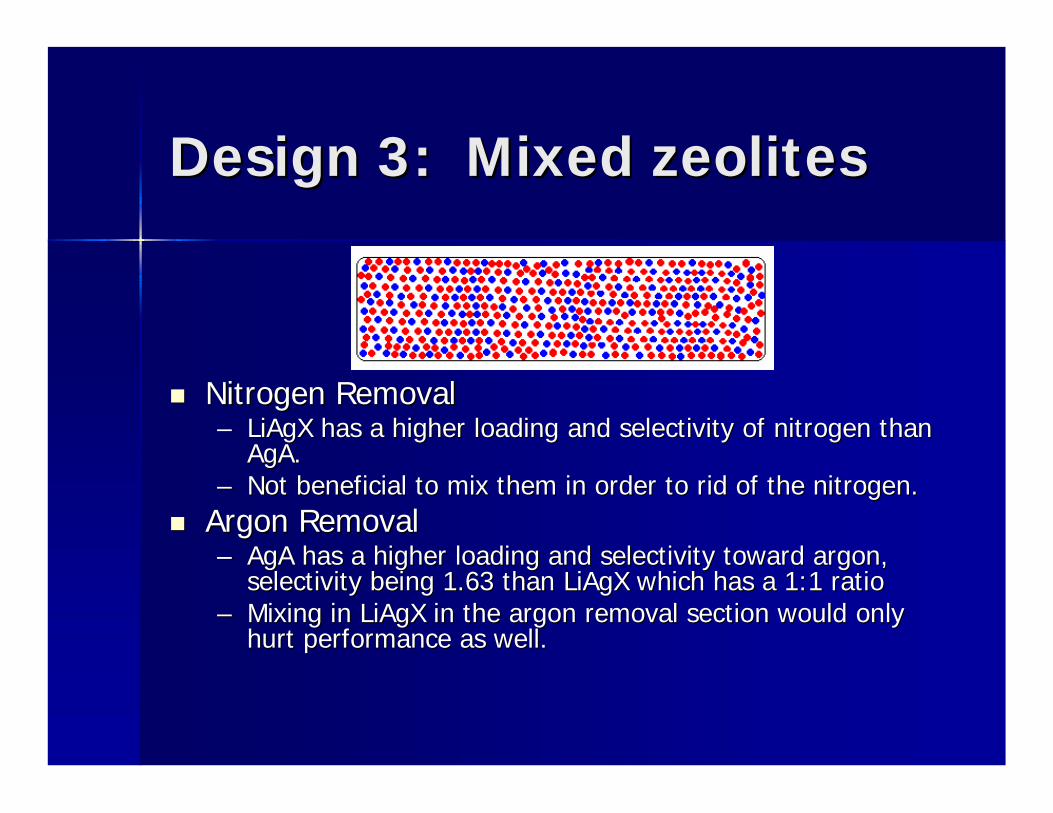
Design 3: Mixed Design 3: Mixed zeoliteszeolites
Nitrogen RemovalNitrogen Removal–– LiAgXLiAgX has a higher loading and selectivity of nitrogen than has a higher loading and selectivity of nitrogen than
AgAAgA. . –– Not beneficial to mix them in order to rid of the nitrogen. Not beneficial to mix them in order to rid of the nitrogen.
Argon RemovalArgon Removal–– AgAAgA has a higher loading and selectivity toward argon, has a higher loading and selectivity toward argon,
selectivity being 1.63 than selectivity being 1.63 than LiAgXLiAgX which has a 1:1 ratiowhich has a 1:1 ratio–– Mixing in Mixing in LiAgXLiAgX in the argon removal section would only in the argon removal section would only
hurt performance as well. hurt performance as well.
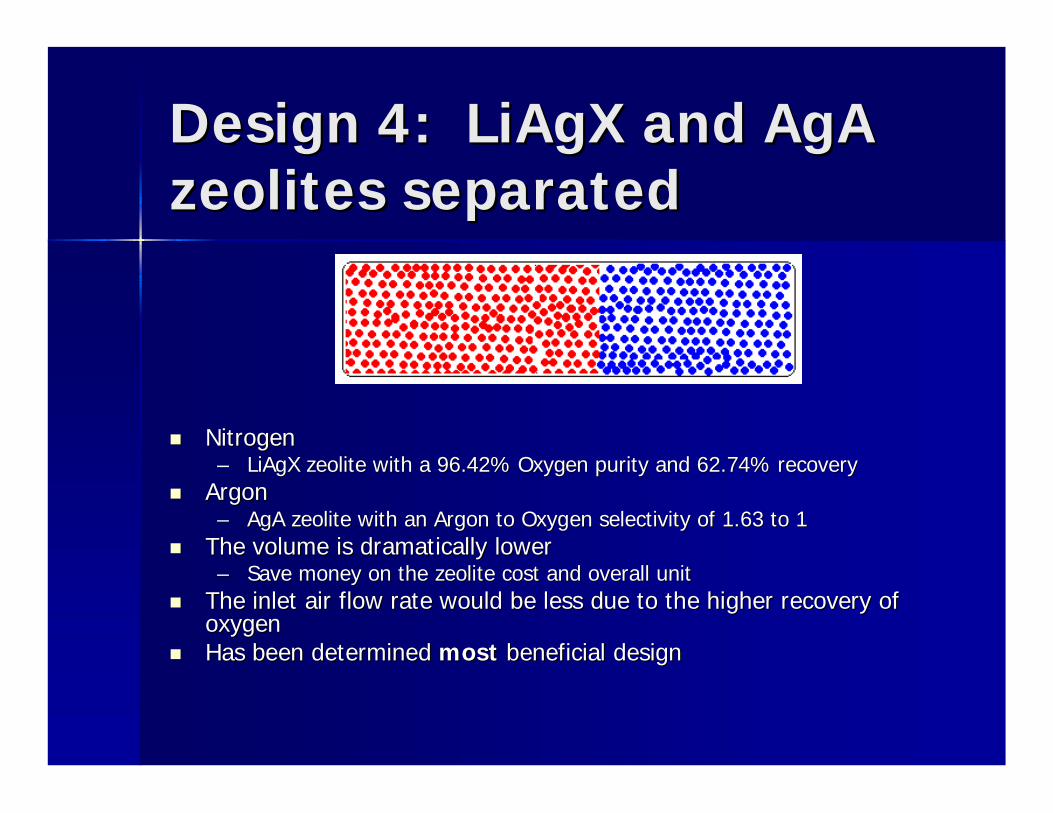
Design 4: Design 4: LiAgXLiAgX and and AgAAgAzeoliteszeolites separatedseparated
NitrogenNitrogen–– LiAgXLiAgX zeolitezeolite with a 96.42% Oxygen purity and 62.74% recoverywith a 96.42% Oxygen purity and 62.74% recovery
ArgonArgon–– AgAAgA zeolitezeolite with an Argon to Oxygen selectivity of 1.63 to 1 with an Argon to Oxygen selectivity of 1.63 to 1
The volume is dramatically lower The volume is dramatically lower –– Save money on the Save money on the zeolitezeolite cost and overall unit cost and overall unit
The inlet air flow rate would be less due to the higher recoveryThe inlet air flow rate would be less due to the higher recovery of of oxygenoxygen
Has been determined Has been determined mostmost beneficial designbeneficial design
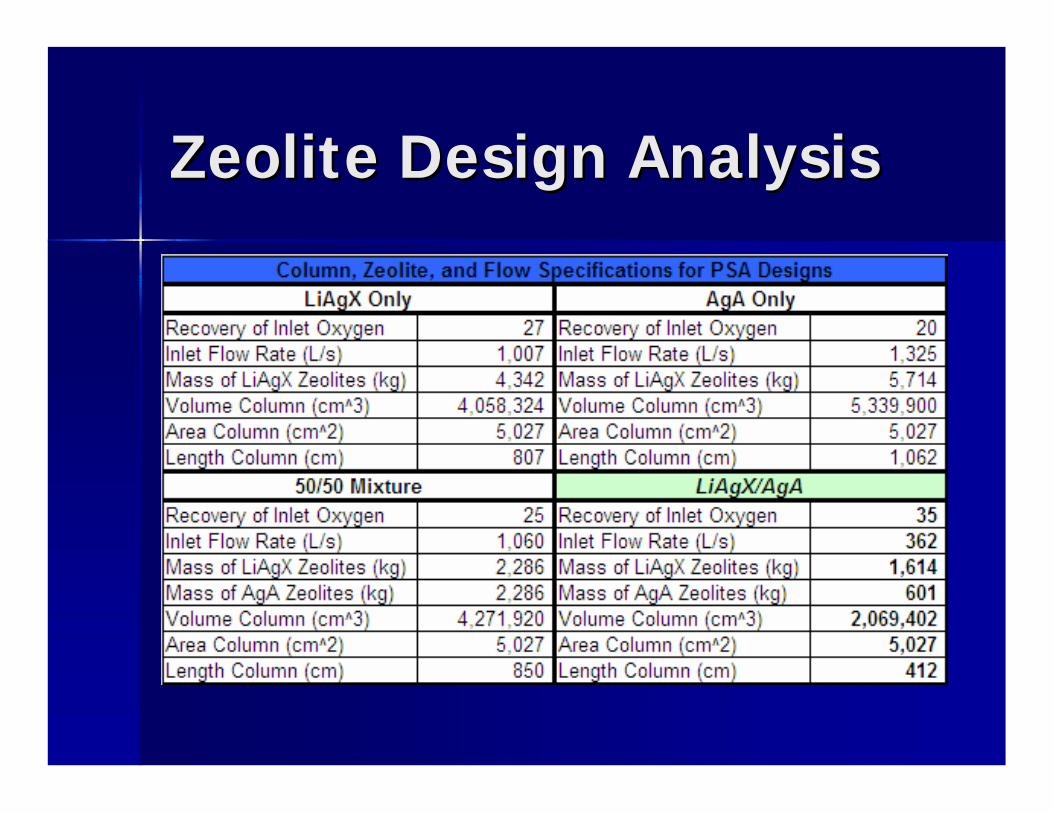
ZeoliteZeolite Design AnalysisDesign Analysis
Hospital Air Separation Hospital Air Separation Design with Pressure Design with Pressure
Swing AdsorptionSwing Adsorption
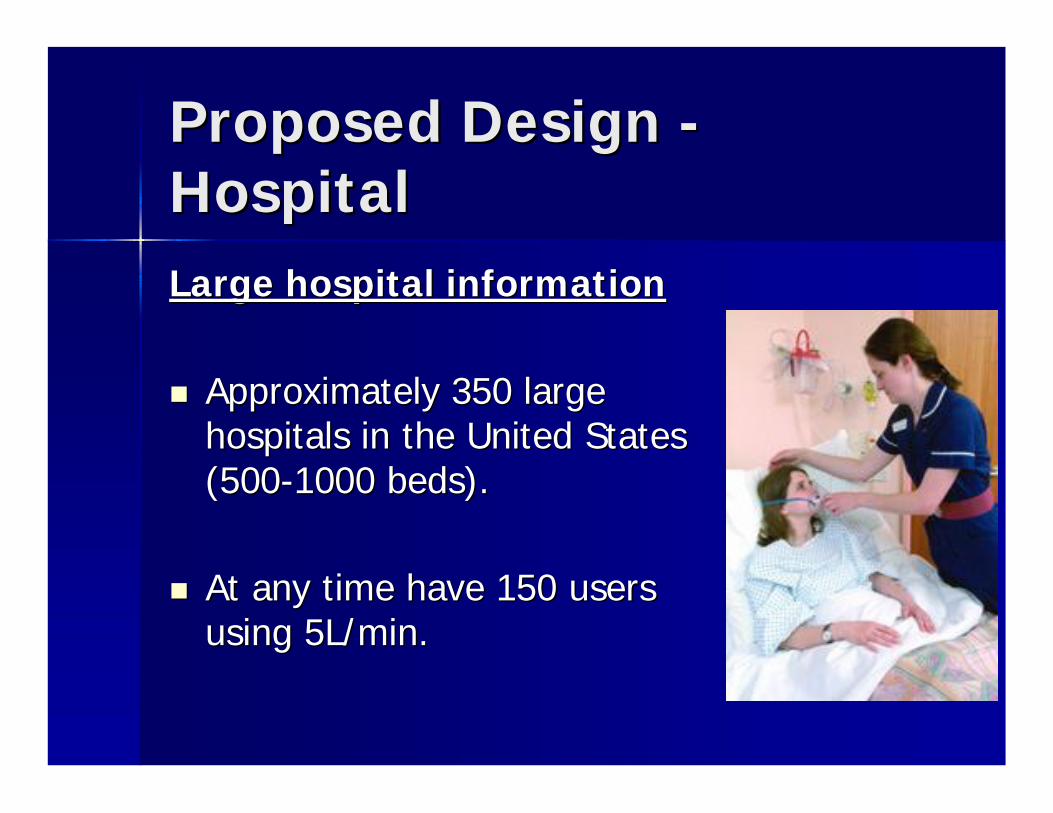
Proposed Design Proposed Design --HospitalHospitalLarge hospital informationLarge hospital information
Approximately 350 large Approximately 350 large hospitals in the United States hospitals in the United States (500(500--1000 beds).1000 beds).
At any time have 150 users At any time have 150 users using 5L/min.using 5L/min.
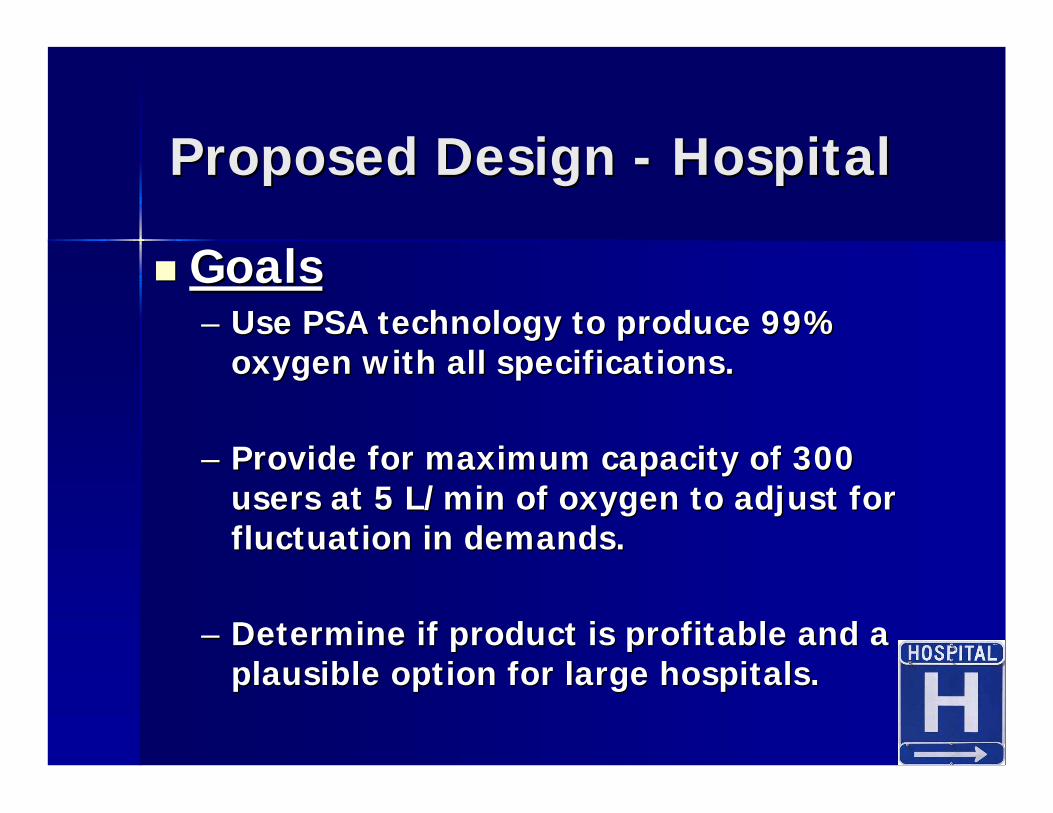
Proposed Design Proposed Design -- HospitalHospital
GoalsGoals–– Use PSA technology to produce 99% Use PSA technology to produce 99%
oxygen with all specifications.oxygen with all specifications.
–– Provide for maximum capacity of 300 Provide for maximum capacity of 300 users at 5 L/min of oxygen to adjust for users at 5 L/min of oxygen to adjust for fluctuation in demands.fluctuation in demands.
–– Determine if product is profitable and a Determine if product is profitable and a plausible option for large hospitals.plausible option for large hospitals.
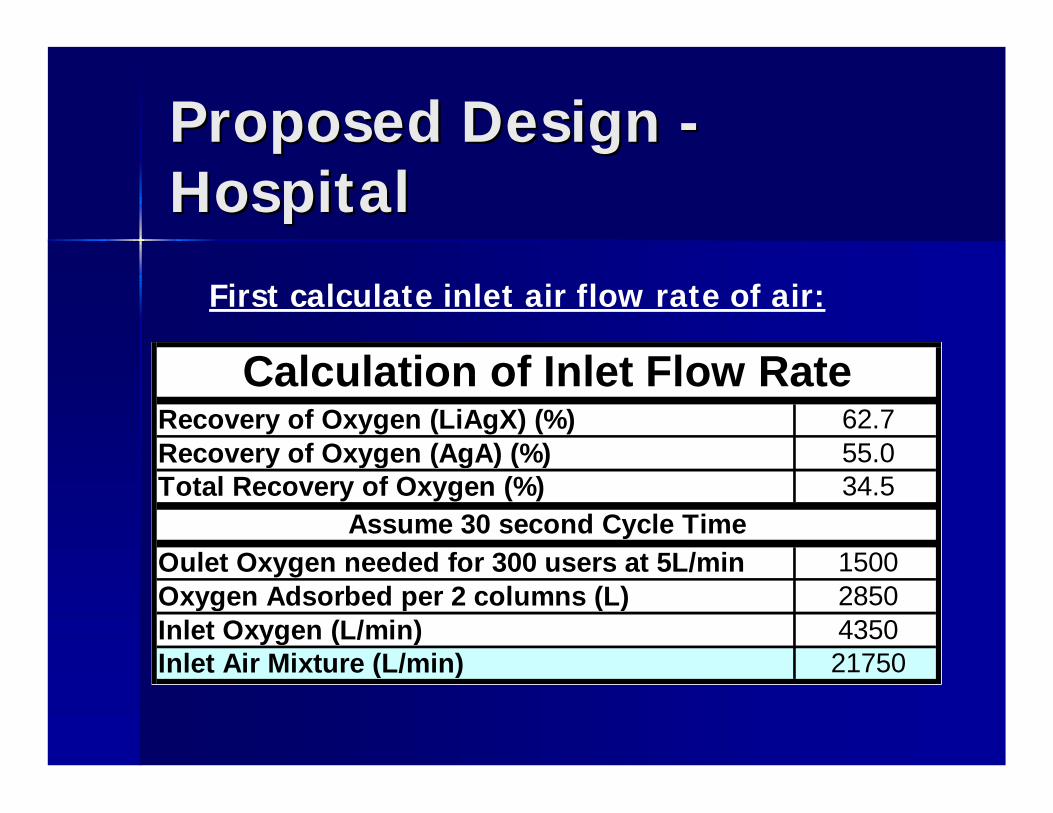
Proposed Design Proposed Design --HospitalHospital
Recovery of Oxygen (LiAgX) (%) 62.7Recovery of Oxygen (AgA) (%) 55.0Total Recovery of Oxygen (%) 34.5
Oulet Oxygen needed for 300 users at 5L/min 1500Oxygen Adsorbed per 2 columns (L) 2850Inlet Oxygen (L/min) 4350Inlet Air Mixture (L/min) 21750
Calculation of Inlet Flow Rate
Assume 30 second Cycle Time
First calculate inlet air flow rate of air:
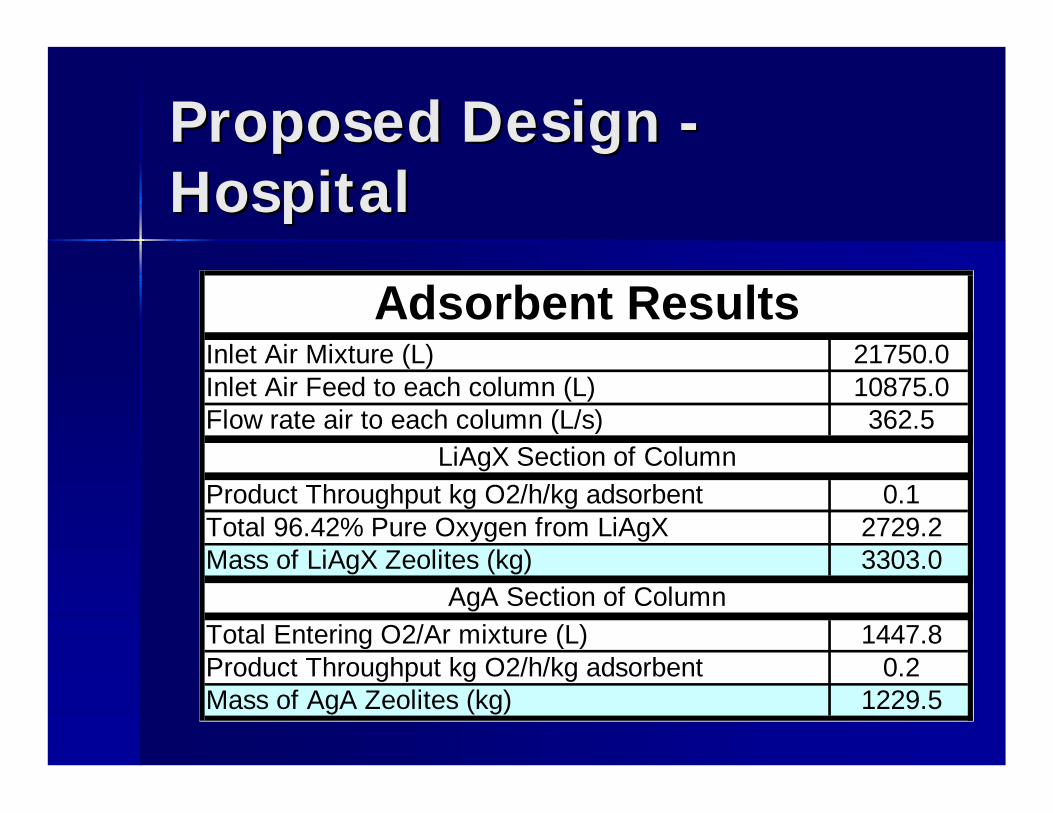
Proposed Design Proposed Design --HospitalHospital
Inlet Air Mixture (L) 21750.0Inlet Air Feed to each column (L) 10875.0Flow rate air to each column (L/s) 362.5
Product Throughput kg O2/h/kg adsorbent 0.1Total 96.42% Pure Oxygen from LiAgX 2729.2Mass of LiAgX Zeolites (kg) 3303.0
Total Entering O2/Ar mixture (L) 1447.8Product Throughput kg O2/h/kg adsorbent 0.2Mass of AgA Zeolites (kg) 1229.5
LiAgX Section of Column
AgA Section of Column
Adsorbent Results
Proposed Design Proposed Design --HospitalHospital
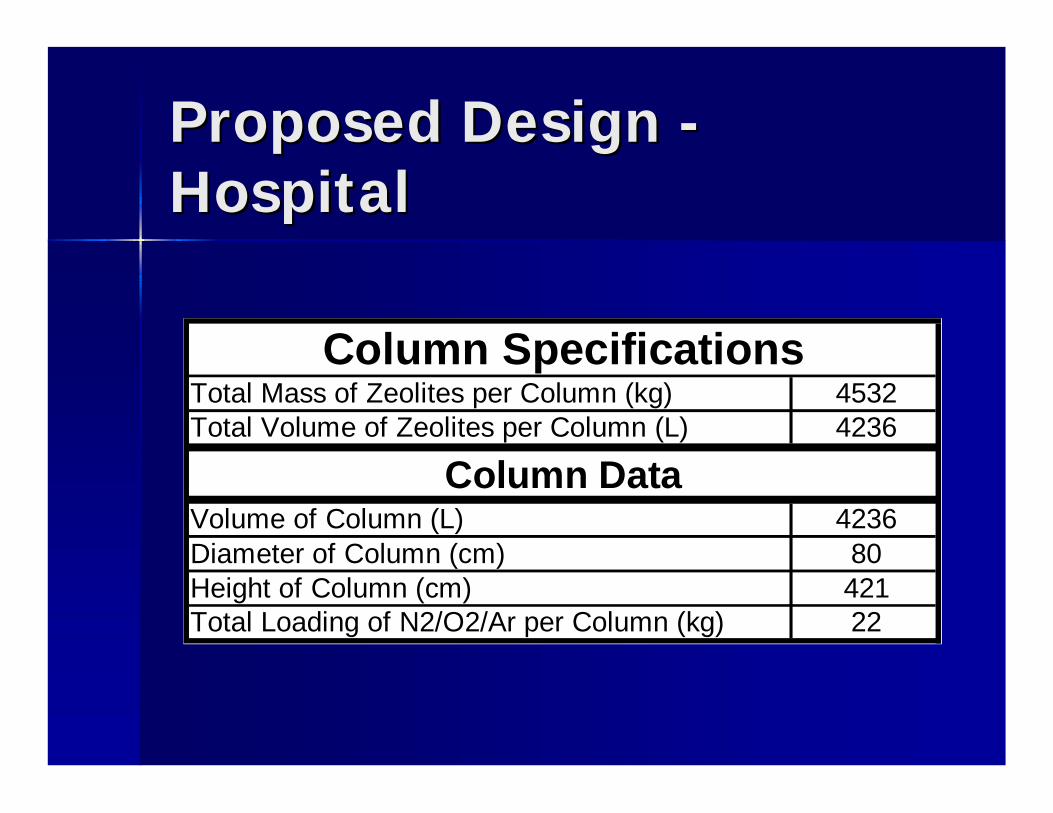
Total Mass of Zeolites per Column (kg) 4532Total Volume of Zeolites per Column (L) 4236
Volume of Column (L) 4236Diameter of Column (cm) 80Height of Column (cm) 421Total Loading of N2/O2/Ar per Column (kg) 22
Column Specifications
Column Data
Proposed Design Proposed Design --HospitalHospital
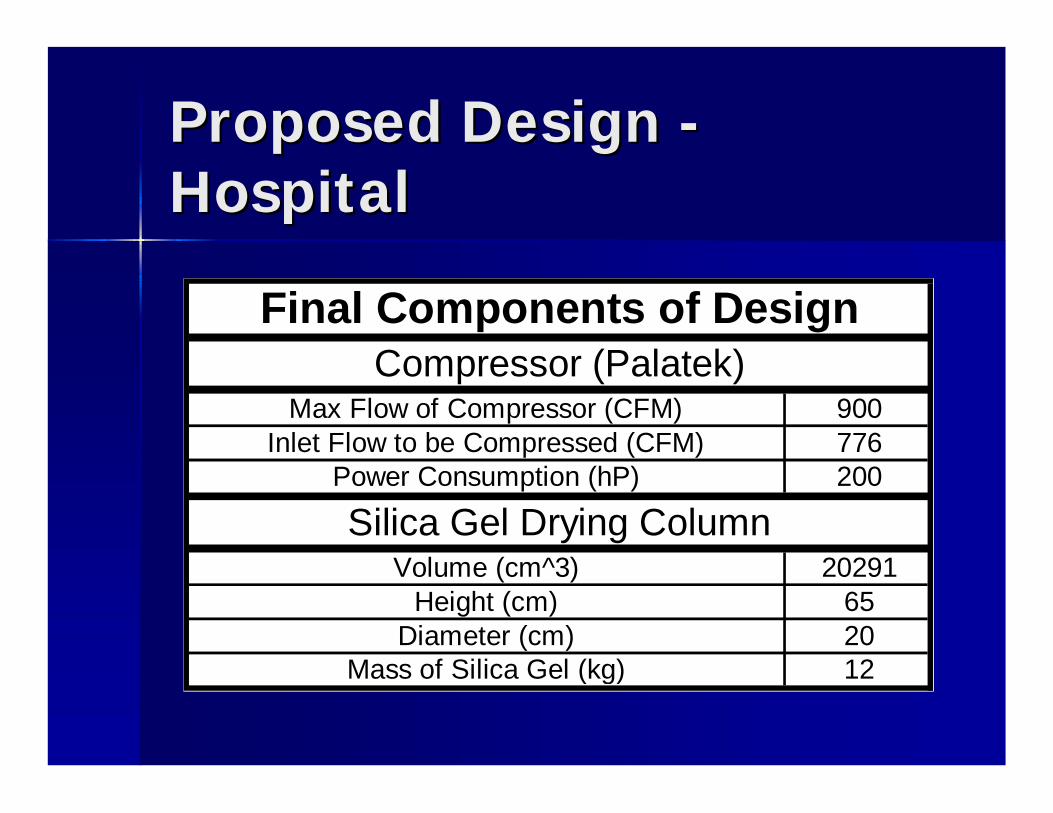
Max Flow of Compressor (CFM) 900Inlet Flow to be Compressed (CFM) 776
Power Consumption (hP) 200
Volume (cm^3) 20291Height (cm) 65
Diameter (cm) 20Mass of Silica Gel (kg) 12
Silica Gel Drying Column
Compressor (Palatek)Final Components of Design
Proposed Design Proposed Design --HospitalHospital
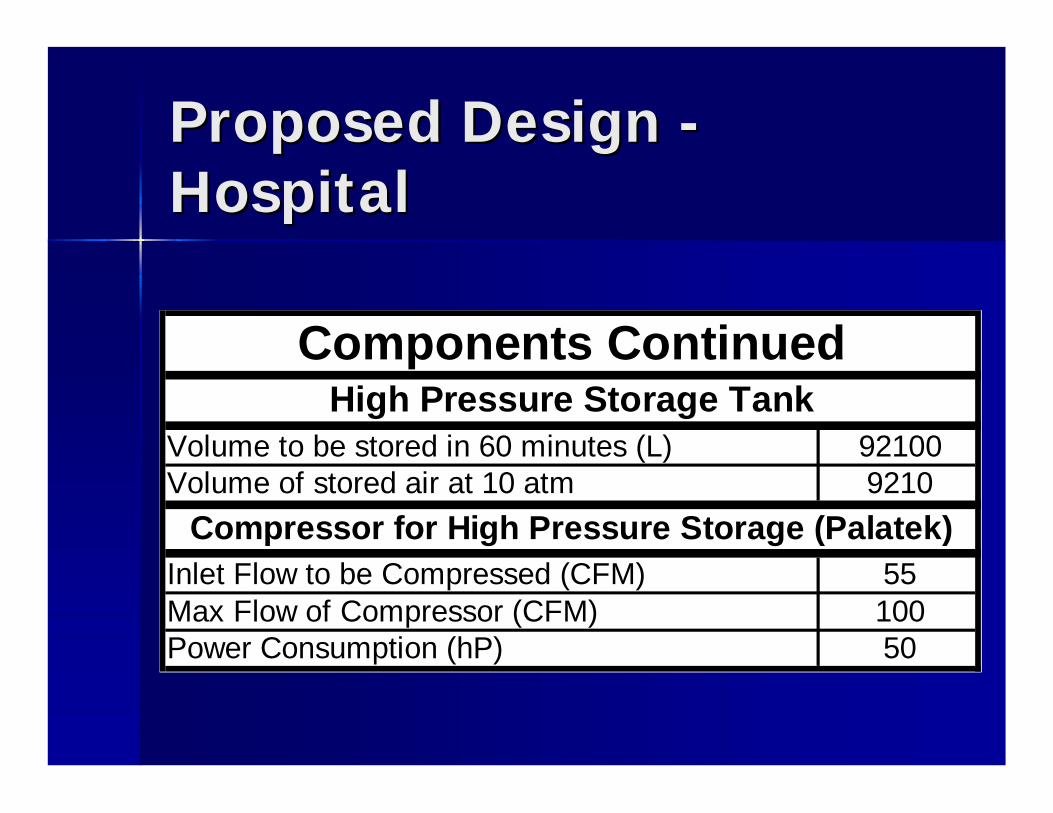
Volume to be stored in 60 minutes (L) 92100Volume of stored air at 10 atm 9210
Inlet Flow to be Compressed (CFM) 55Max Flow of Compressor (CFM) 100Power Consumption (hP) 50
Compressor for High Pressure Storage (Palatek)
High Pressure Storage TankComponents Continued
Proposed Design Proposed Design --HospitalHospital
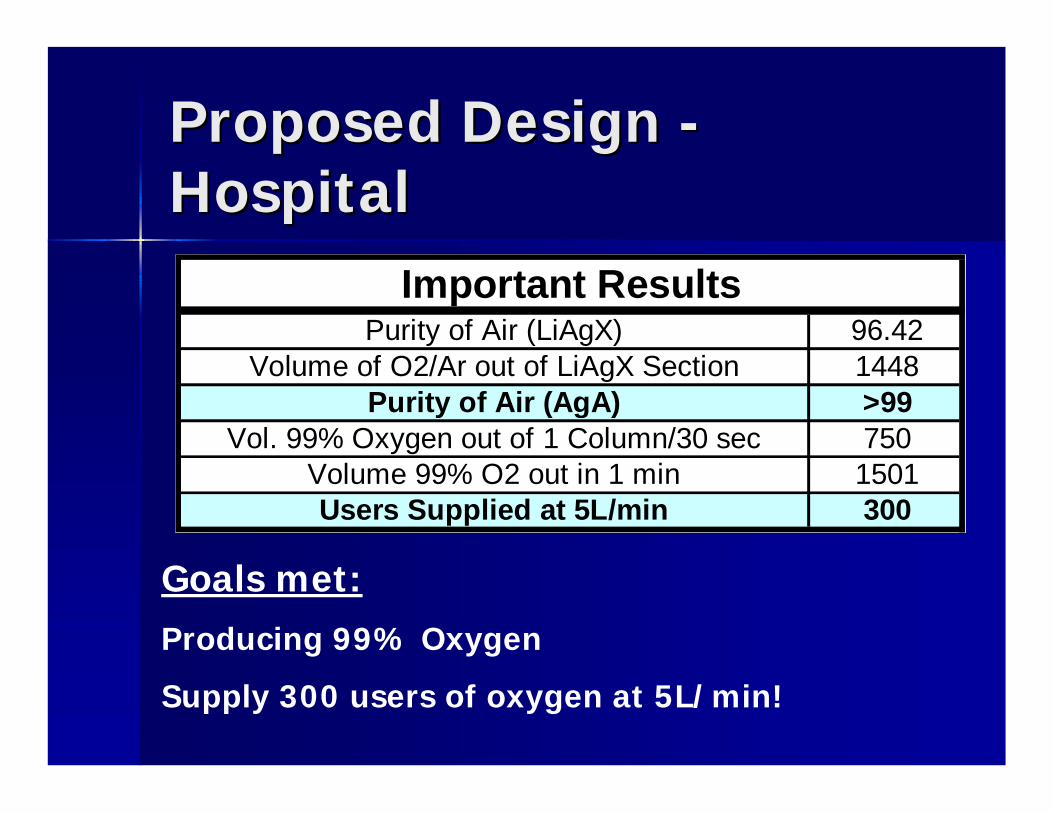
Purity of Air (LiAgX) 96.42Volume of O2/Ar out of LiAgX Section 1448
Purity of Air (AgA) >99Vol. 99% Oxygen out of 1 Column/30 sec 750
Volume 99% O2 out in 1 min 1501Users Supplied at 5L/min 300
Important Results
Goals met:Producing 99% Oxygen
Supply 300 users of oxygen at 5L/min!
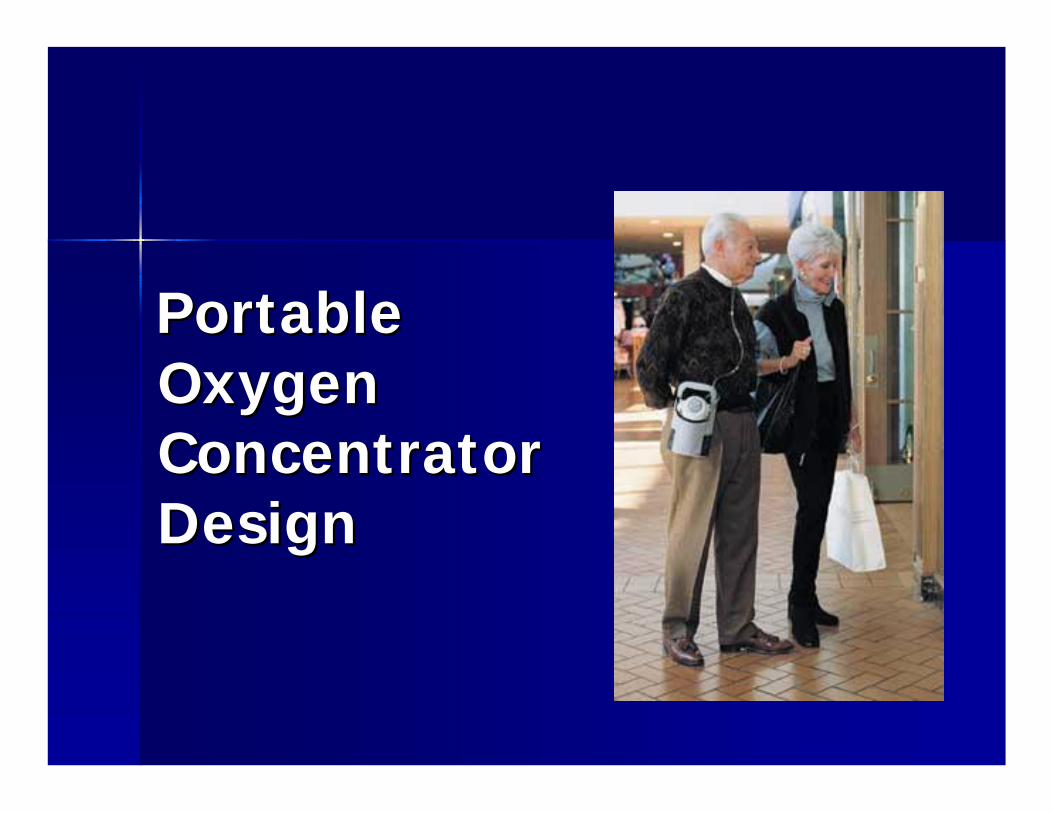
Portable Portable Oxygen Oxygen Concentrator Concentrator DesignDesign
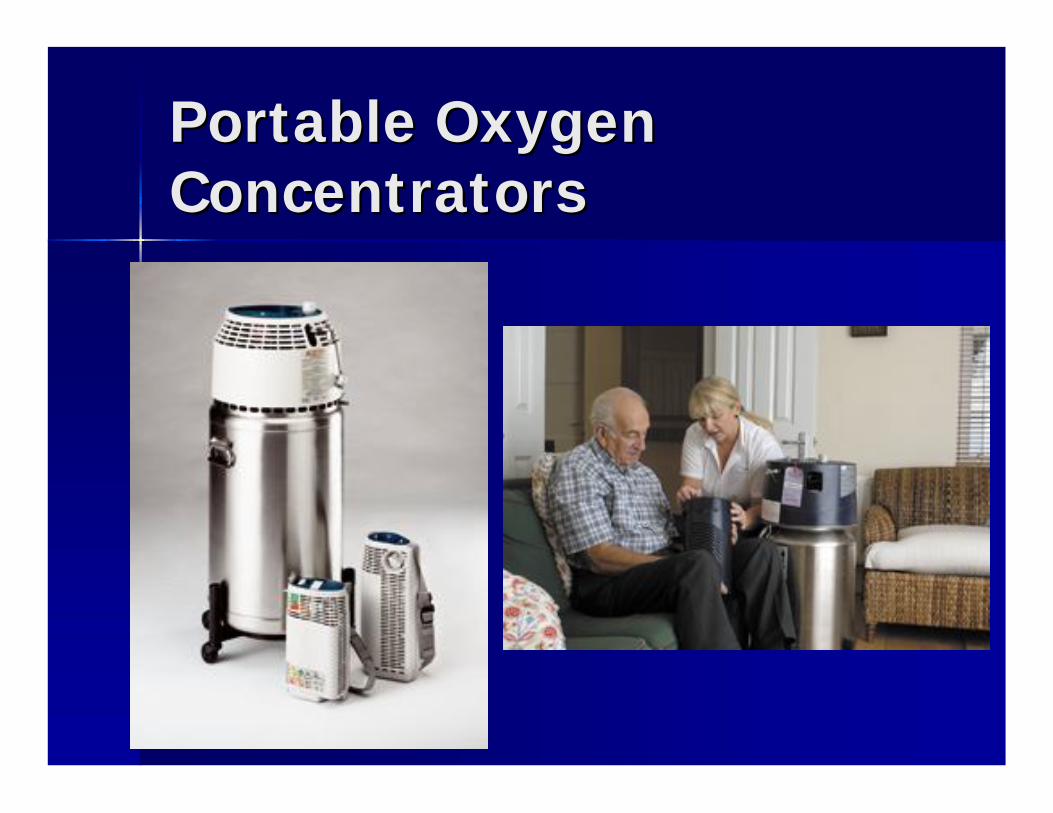
Portable Oxygen ConcentratorsPortable Oxygen Concentrators
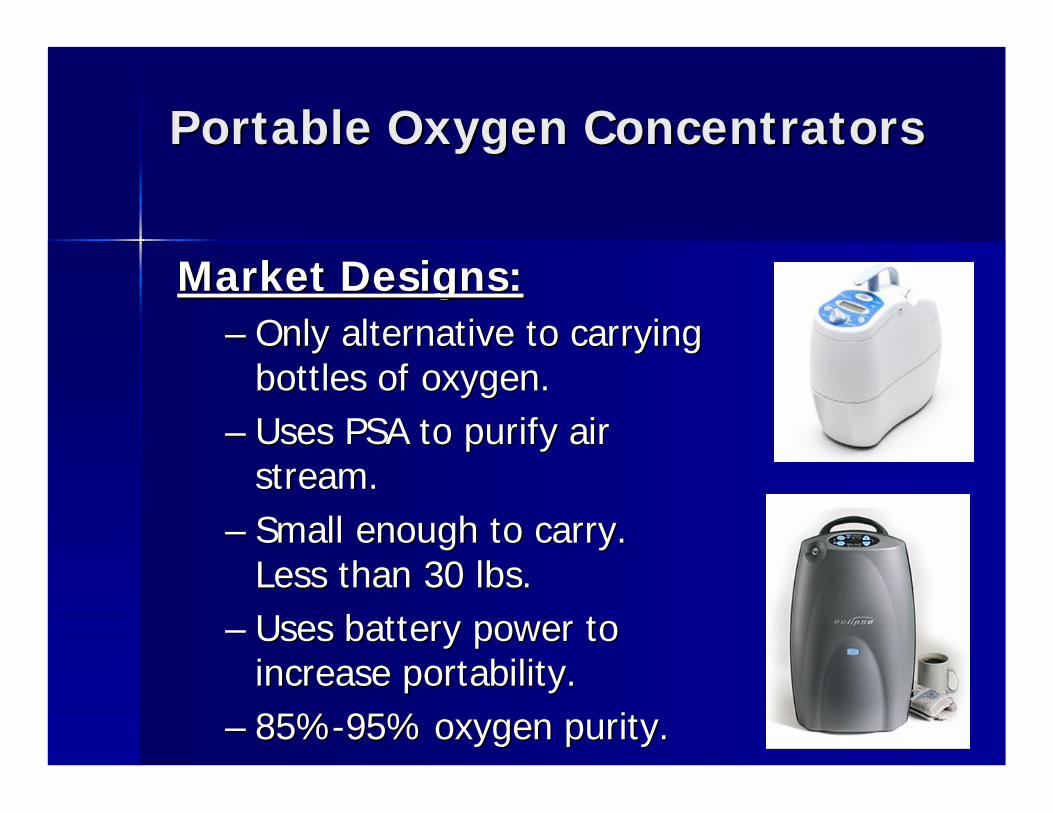
Market Designs:Market Designs:–– Only alternative to carrying Only alternative to carrying
bottles of oxygen.bottles of oxygen.–– Uses PSA to purify air Uses PSA to purify air
stream.stream.–– Small enough to carry. Small enough to carry.
Less than 30 lbs.Less than 30 lbs.–– Uses battery power to Uses battery power to
increase portability.increase portability.–– 85%85%--95% oxygen purity.95% oxygen purity.
Portable Oxygen Portable Oxygen ConcentratorsConcentrators
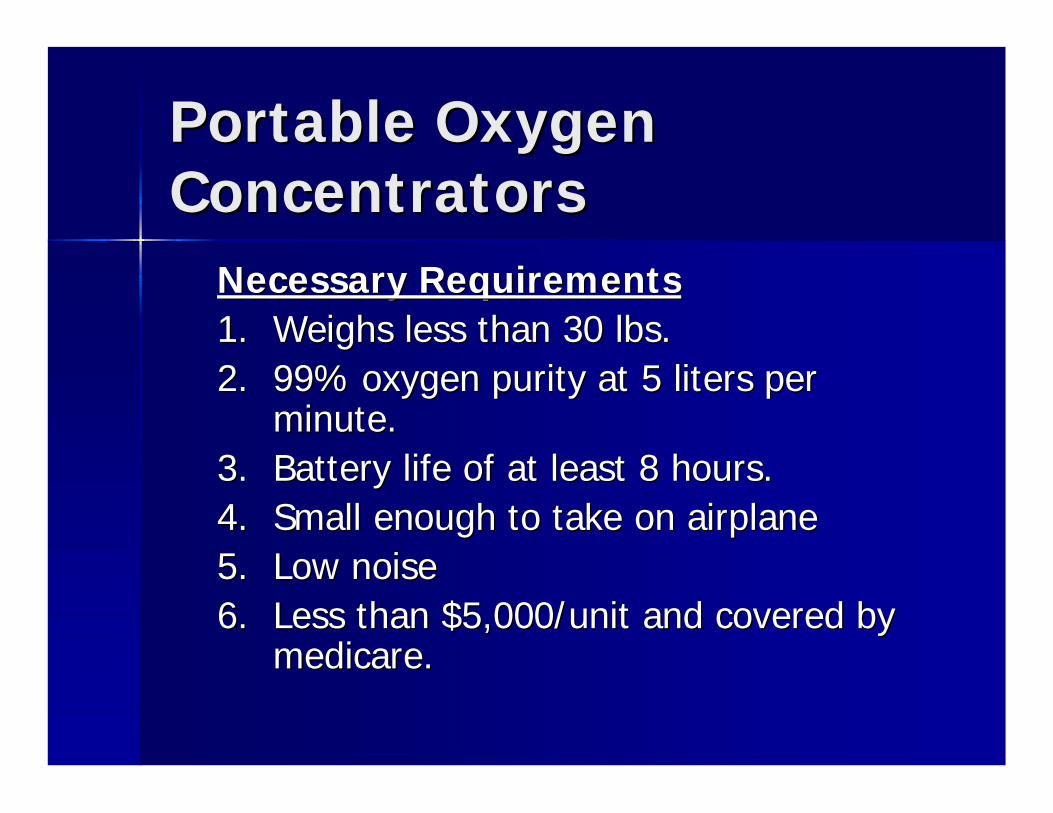
Necessary RequirementsNecessary Requirements1.1. Weighs less than 30 lbs.Weighs less than 30 lbs.2.2. 99% oxygen purity at 5 liters per 99% oxygen purity at 5 liters per
minute.minute.3.3. Battery life of at least 8 hours.Battery life of at least 8 hours.4.4. Small enough to take on airplaneSmall enough to take on airplane5.5. Low noiseLow noise6.6. Less than $5,000/unit and covered by Less than $5,000/unit and covered by
medicare.medicare.
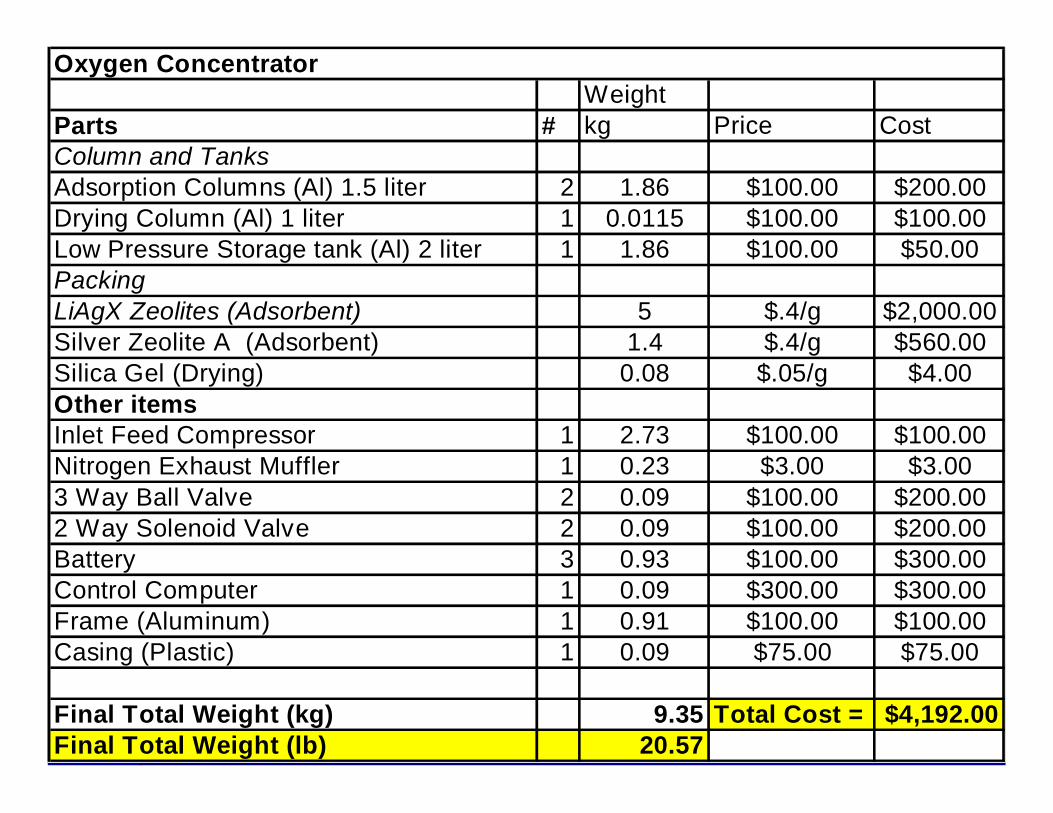
Oxygen ConcentratorWeight
Parts # kg Price CostColumn and TanksAdsorption Columns (Al) 1.5 liter 2 1.86 $100.00 $200.00Drying Column (Al) 1 liter 1 0.0115 $100.00 $100.00Low Pressure Storage tank (Al) 2 liter 1 1.86 $100.00 $50.00PackingLiAgX Zeolites (Adsorbent) 5 $.4/g $2,000.00Silver Zeolite A (Adsorbent) 1.4 $.4/g $560.00Silica Gel (Drying) 0.08 $.05/g $4.00Other itemsInlet Feed Compressor 1 2.73 $100.00 $100.00Nitrogen Exhaust Muffler 1 0.23 $3.00 $3.003 Way Ball Valve 2 0.09 $100.00 $200.002 Way Solenoid Valve 2 0.09 $100.00 $200.00Battery 3 0.93 $100.00 $300.00Control Computer 1 0.09 $300.00 $300.00Frame (Aluminum) 1 0.91 $100.00 $100.00Casing (Plastic) 1 0.09 $75.00 $75.00
Final Total Weight (kg) 9.35 Total Cost = $4,192.00Final Total Weight (lb) 20.57
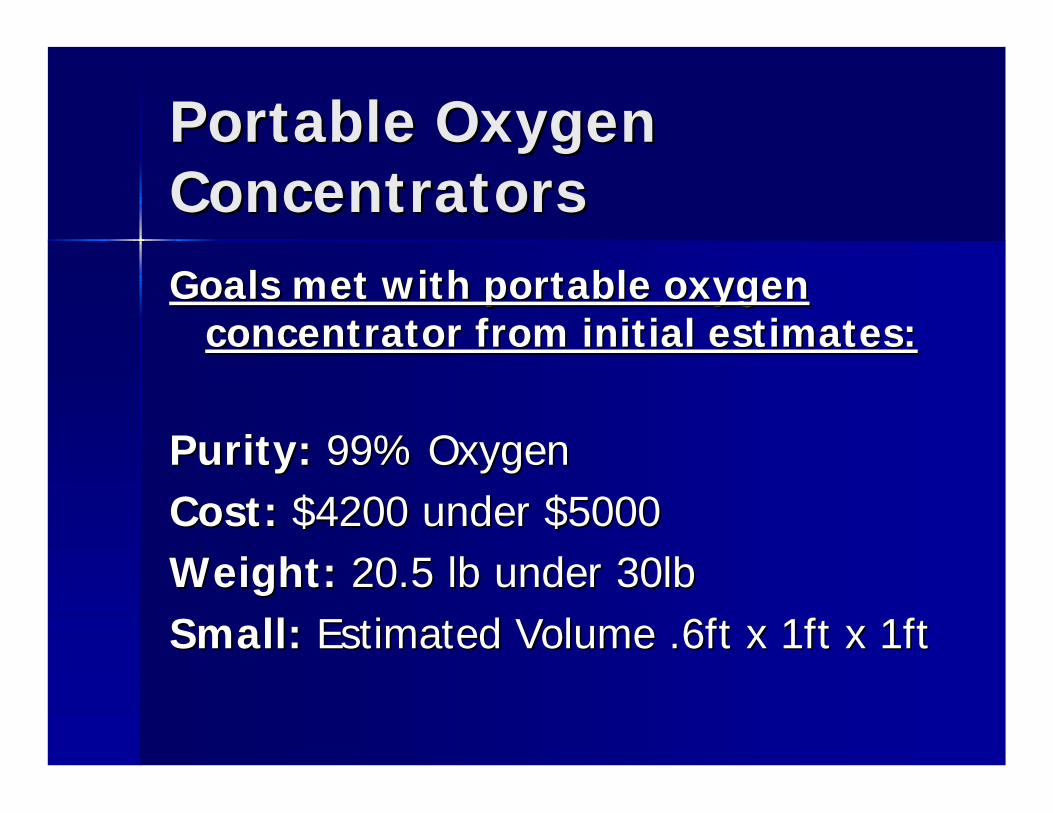
Portable Oxygen Portable Oxygen ConcentratorsConcentratorsGoals met with portable oxygen Goals met with portable oxygen
concentrator from initial estimates:concentrator from initial estimates:
Purity:Purity: 99% Oxygen99% OxygenCost:Cost: $4200 under $5000$4200 under $5000Weight:Weight: 20.5 lb under 30lb20.5 lb under 30lbSmall:Small: Estimated Volume .6ft x 1ft x 1ftEstimated Volume .6ft x 1ft x 1ft
Portable Oxygen Portable Oxygen ConcentratorsConcentrators
Portable Oxygen Portable Oxygen ConcentratorsConcentratorsConclusions/Recommendations:Conclusions/Recommendations:A competitive/lightweight portable A competitive/lightweight portable
oxygen concentrator with 99% oxygen oxygen concentrator with 99% oxygen can be produced.can be produced.
Perform extensive design estimates and Perform extensive design estimates and economic analysis.economic analysis.
Consumer Consumer Utility Utility and and
PreferencePreference
Consumer Utility and PreferenceConsumer Utility and Preference
Method used to determine relationship Method used to determine relationship between:between:–– consumer preferenceconsumer preference–– satisfactionsatisfaction
in order to predict in order to predict product price and product price and product demand.product demand.
Consumer Utility and PreferenceConsumer Utility and Preference
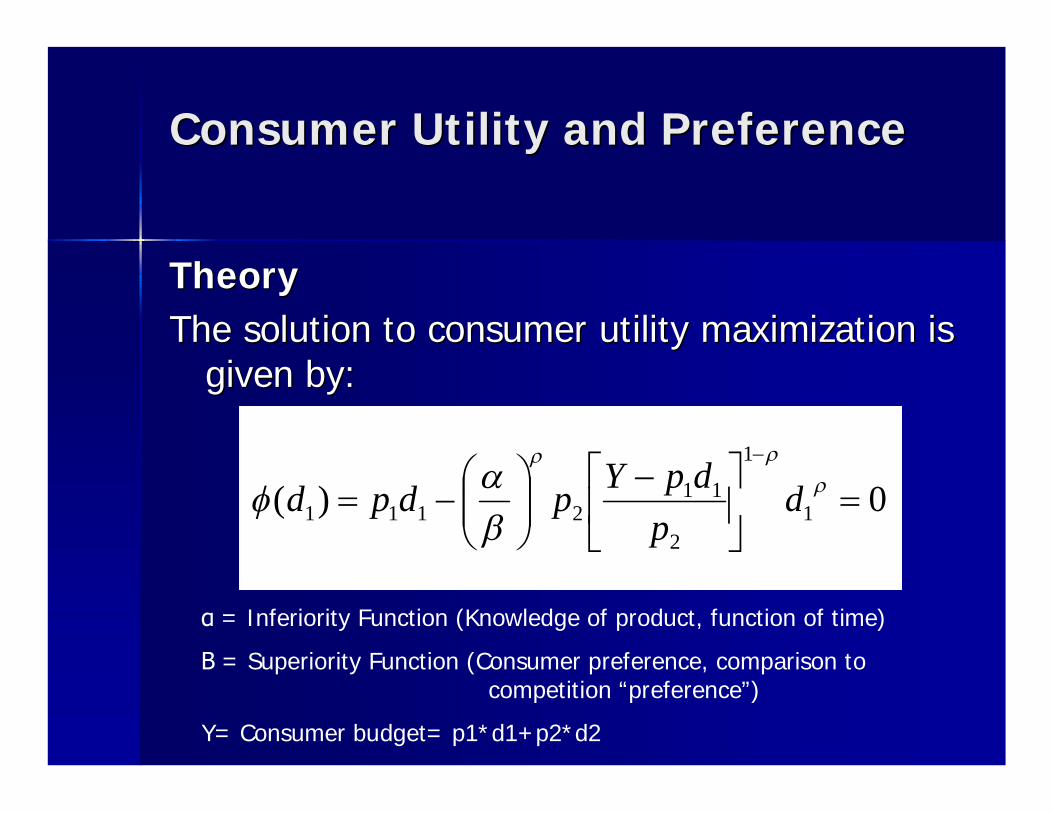
TheoryTheoryThe solution to consumer utility maximization is The solution to consumer utility maximization is
given by:given by:
0)( 1
1
2
112111
dp
dpYpdpd
α = Inferiority Function (Knowledge of product, function of time)
Β = Superiority Function (Consumer preference, comparison to competition “preference”)
Y= Consumer budget= p1*d1+p2*d2
Consumer Utility and PreferenceConsumer Utility and Preference
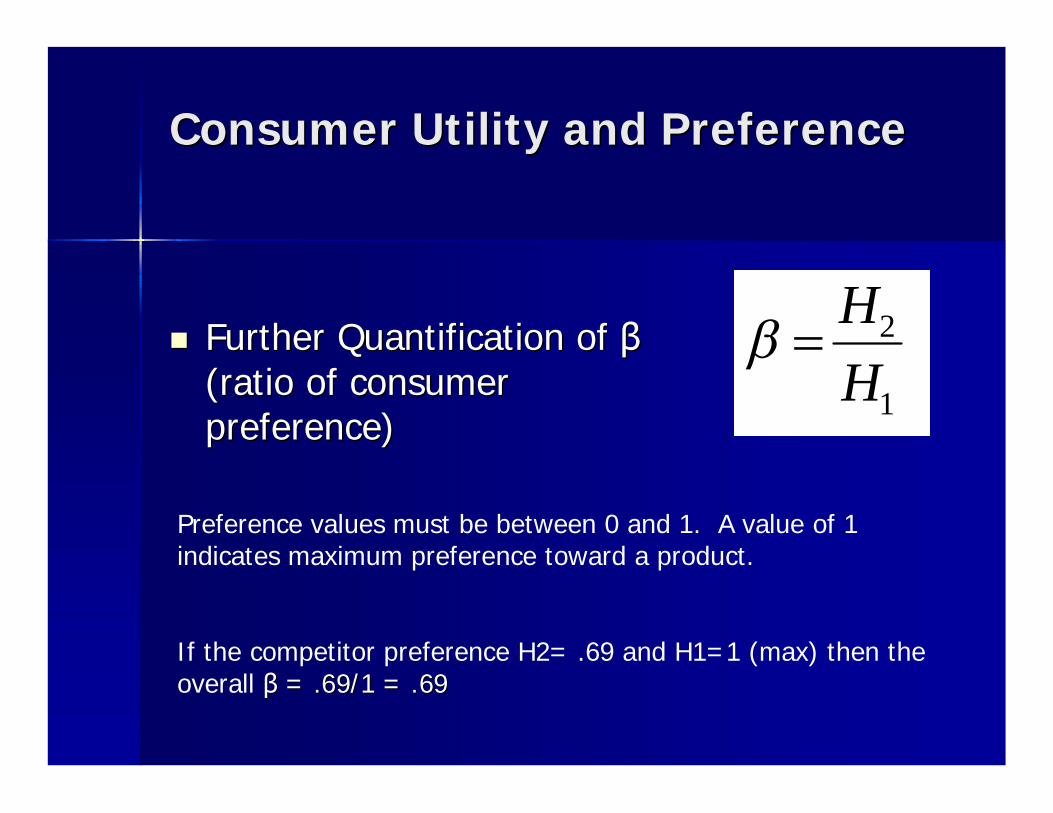
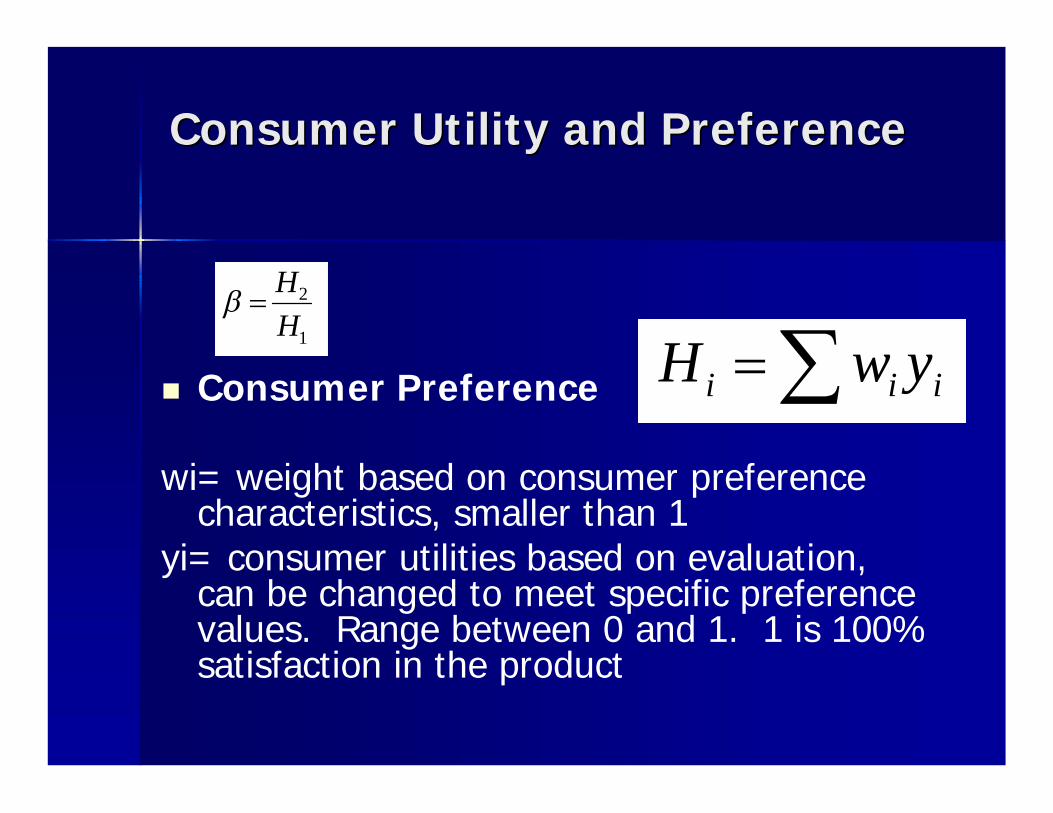
Further Quantification of Further Quantification of ββ(ratio of consumer (ratio of consumer preference)preference)
1
2
HH
Preference values must be between 0 and 1. A value of 1 indicates maximum preference toward a product.
If the competitor preference H2= .69 and H1=1 (max) then the overall ββ = .69/1 = .69= .69/1 = .69
Consumer Utility and PreferenceConsumer Utility and Preference
iii ywH Consumer Preference
wi= weight based on consumer preference characteristics, smaller than 1
yi= consumer utilities based on evaluation, can be changed to meet specific preference values. Range between 0 and 1. 1 is 100% satisfaction in the product
1
2
HH
Consumer Utility and PreferenceConsumer Utility and Preference
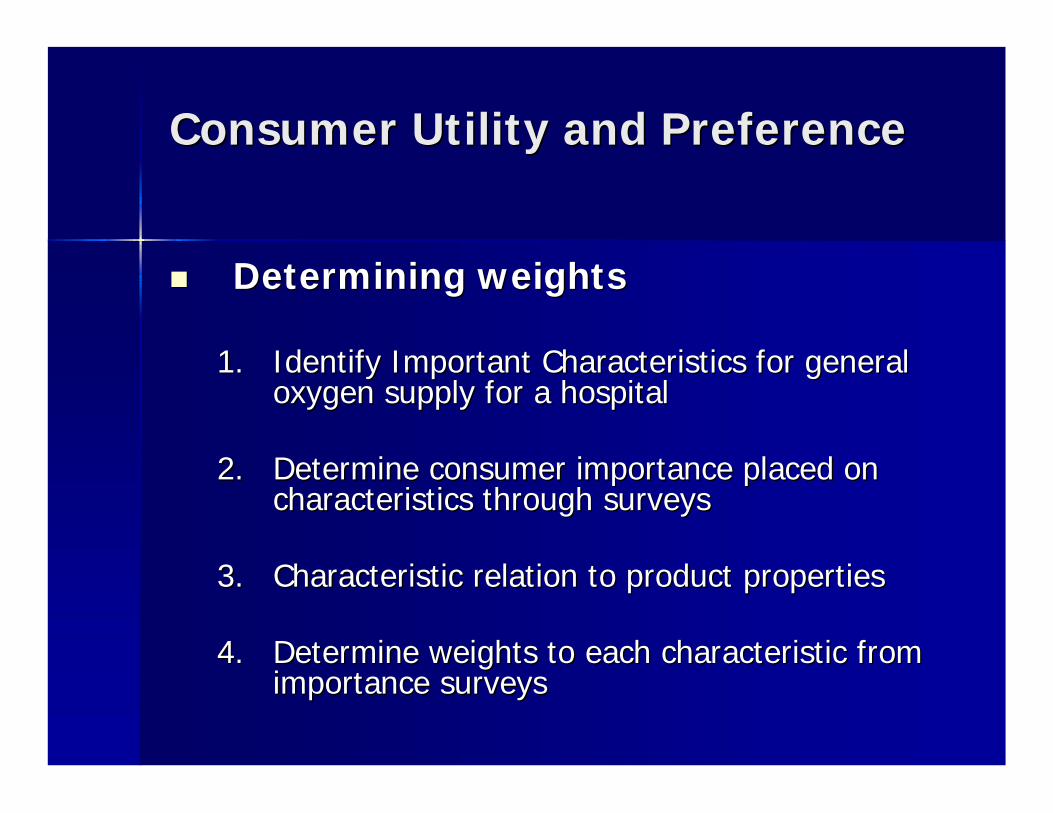
Determining weightsDetermining weights
1.1. Identify Important Characteristics for general Identify Important Characteristics for general oxygen supply for a hospitaloxygen supply for a hospital
2.2. Determine consumer importance placed on Determine consumer importance placed on characteristics through surveyscharacteristics through surveys
3.3. Characteristic relation to product propertiesCharacteristic relation to product properties
4.4. Determine weights to each characteristic from Determine weights to each characteristic from importance surveysimportance surveys
Consumer Utility and PreferenceConsumer Utility and Preference
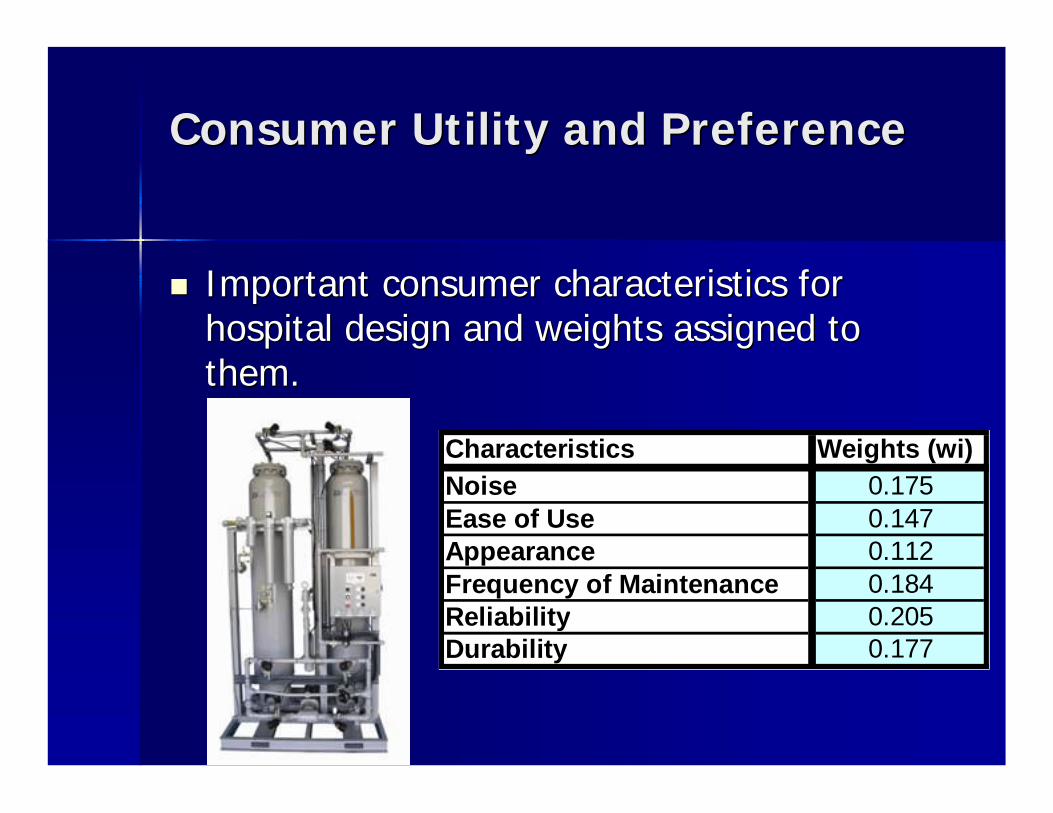
Important consumer characteristics for Important consumer characteristics for hospital design and weights assigned to hospital design and weights assigned to them.them.
Characteristics Weights (wi)Noise 0.175Ease of Use 0.147Appearance 0.112Frequency of Maintenance 0.184Reliability 0.205Durability 0.177
Consumer Utility and Consumer Utility and PreferencePreference
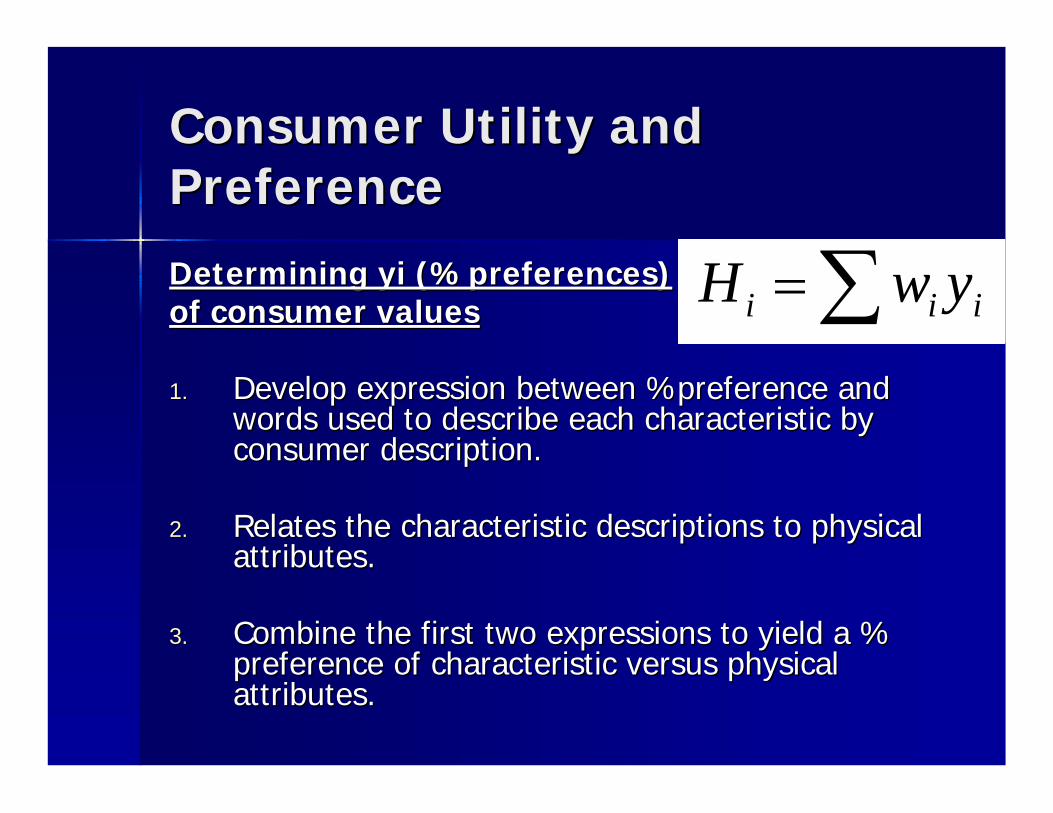
Determining Determining yiyi (%preferences)(%preferences)of consumer valuesof consumer values
1.1. Develop expression between %preference and Develop expression between %preference and words used to describe each characteristic by words used to describe each characteristic by consumer description.consumer description.
2.2. Relates the characteristic descriptions to physical Relates the characteristic descriptions to physical attributes.attributes.
3.3. Combine the first two expressions to yield a % Combine the first two expressions to yield a % preference of characteristic versus physical preference of characteristic versus physical attributes.attributes.
iii ywH
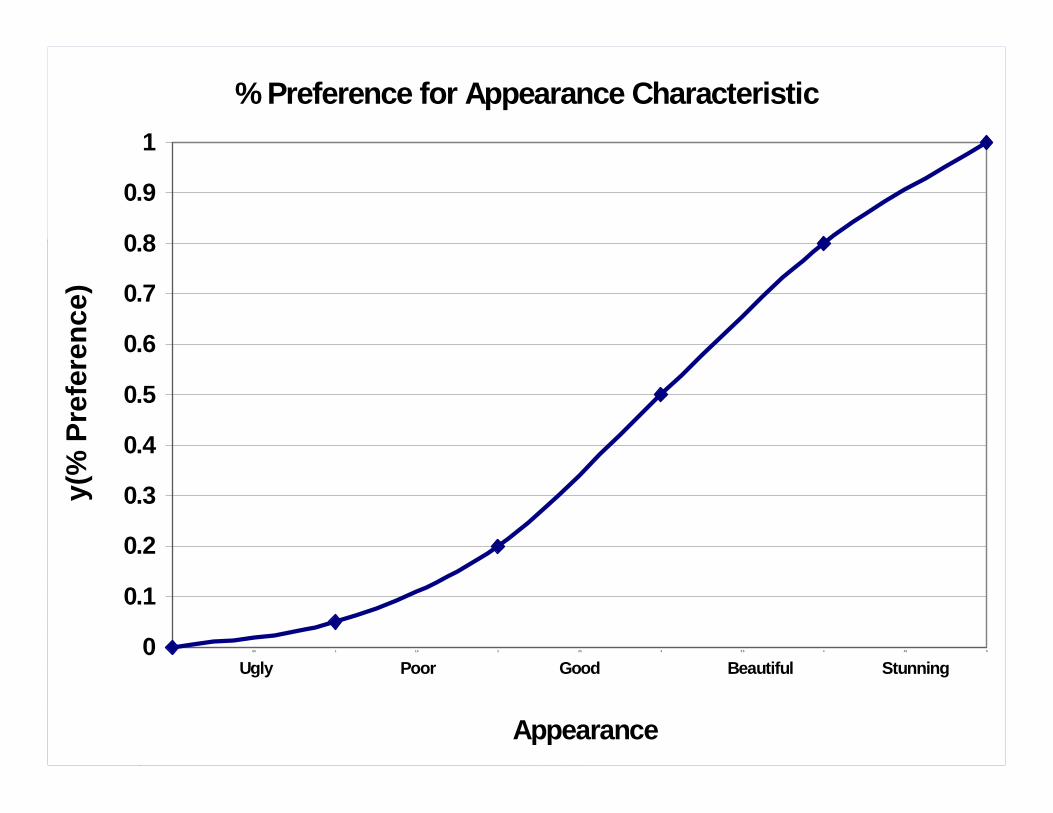
% Preference for Appearance Characteristic
0
0.1
0.2
0.3
0.4
0.5
0.6
0.7
0.8
0.9
1
0 0.5 1 1.5 2 2.5 3 3.5 4 4.5 5
Appearance
y(%
Pre
fere
nce)
StunningBeautifulGoodPoorUgly
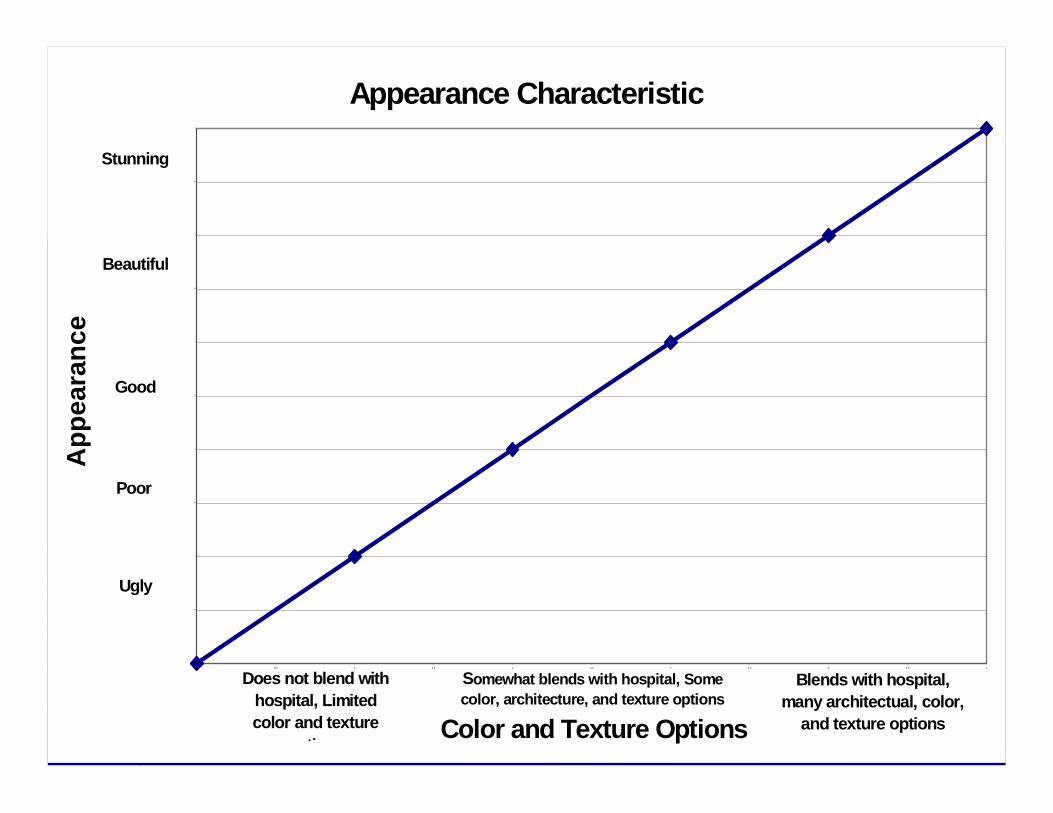
Appearance Characteristic
0
0.5
1
1.5
2
2.5
3
3.5
4
4.5
5
0 0.5 1 1.5 2 2.5 3 3.5 4 4.5 5
Color and Texture Options
App
eara
nce
Does not blend with hospital, Limited color and texture
options
Somewhat blends with hospital, Some color, architecture, and texture options
Blends with hospital, many architectual, color,
and texture options
Stunning
Beautiful
Good
Poor
Ugly
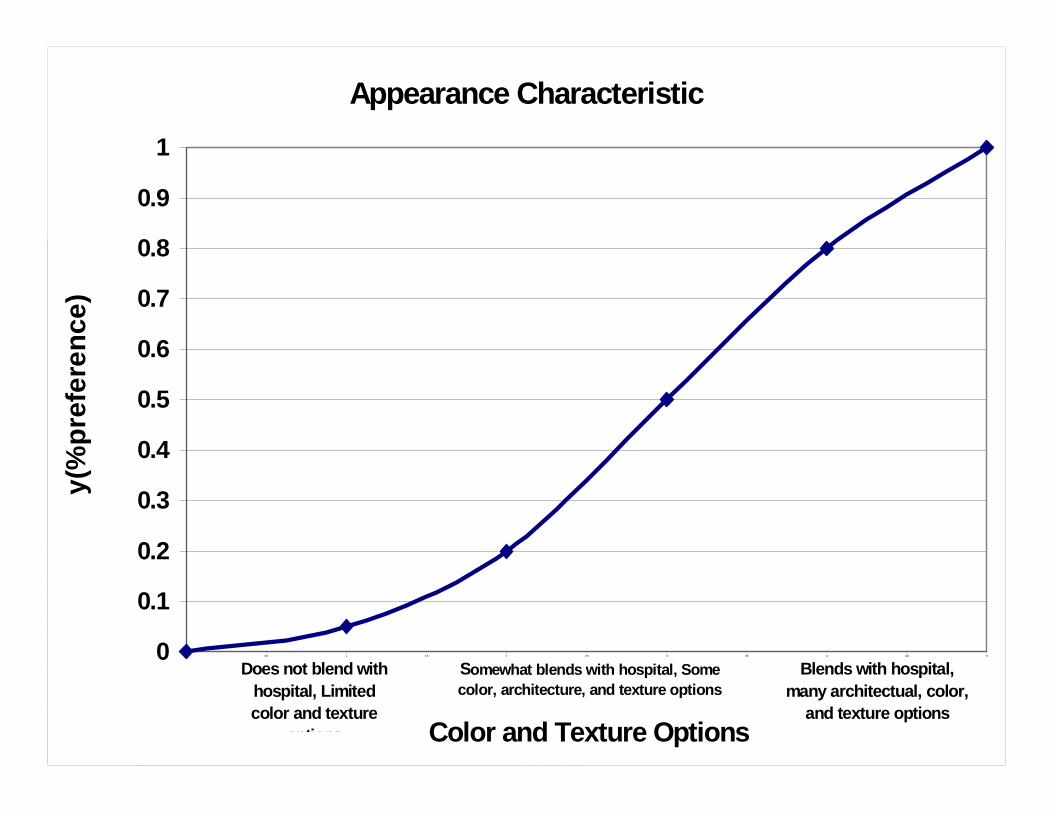
Appearance Characteristic
0
0.1
0.2
0.3
0.4
0.5
0.6
0.7
0.8
0.9
1
0 0.5 1 1.5 2 2.5 3 3.5 4 4.5 5
Color and Texture Options
y(%
pref
eren
ce)
Does not blend with hospital, Limited color and texture
options
Somewhat blends with hospital, Some color, architecture, and texture options
Blends with hospital, many architectual, color,
and texture options
Consumer Utility and PreferenceConsumer Utility and Preference
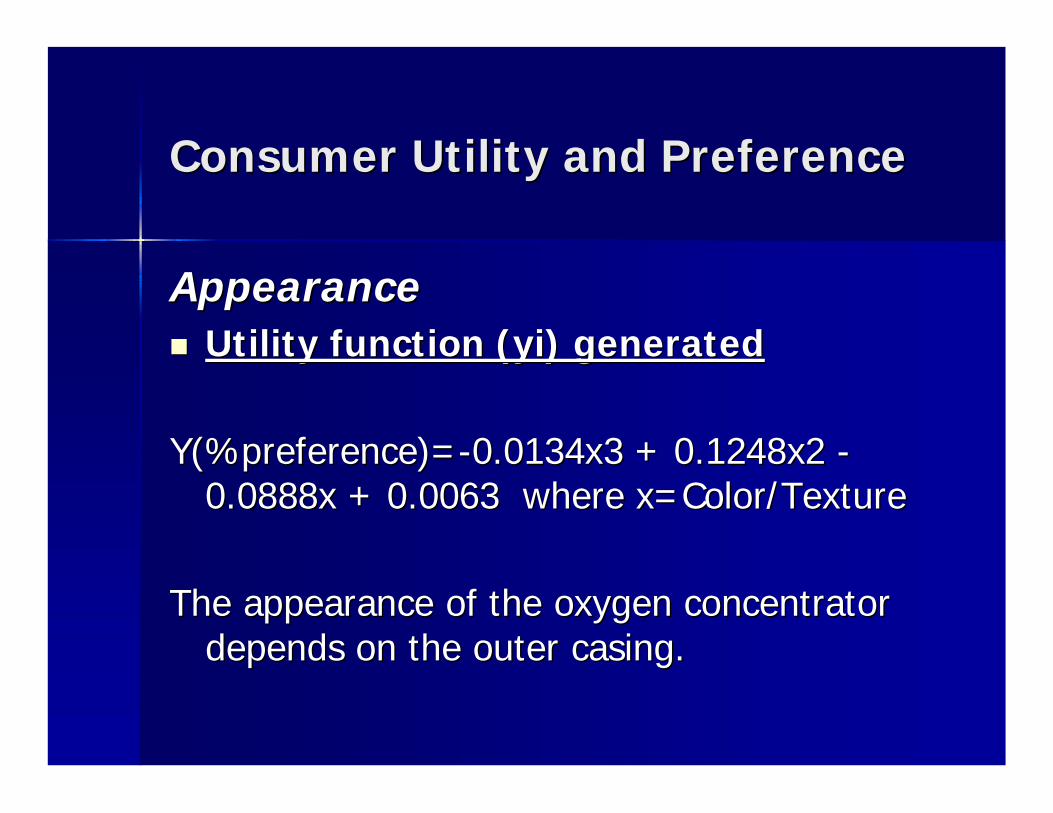
AppearanceAppearance Utility function (Utility function (yiyi) generated) generated
Y(%preferenceY(%preference)=)=--0.0134x3 + 0.1248x2 0.0134x3 + 0.1248x2 --0.0888x + 0.0063 where x=Color/Texture 0.0888x + 0.0063 where x=Color/Texture
The appearance of the oxygen concentrator The appearance of the oxygen concentrator depends on the outer casing.depends on the outer casing.
Consumer Utility and Consumer Utility and PreferencePreference
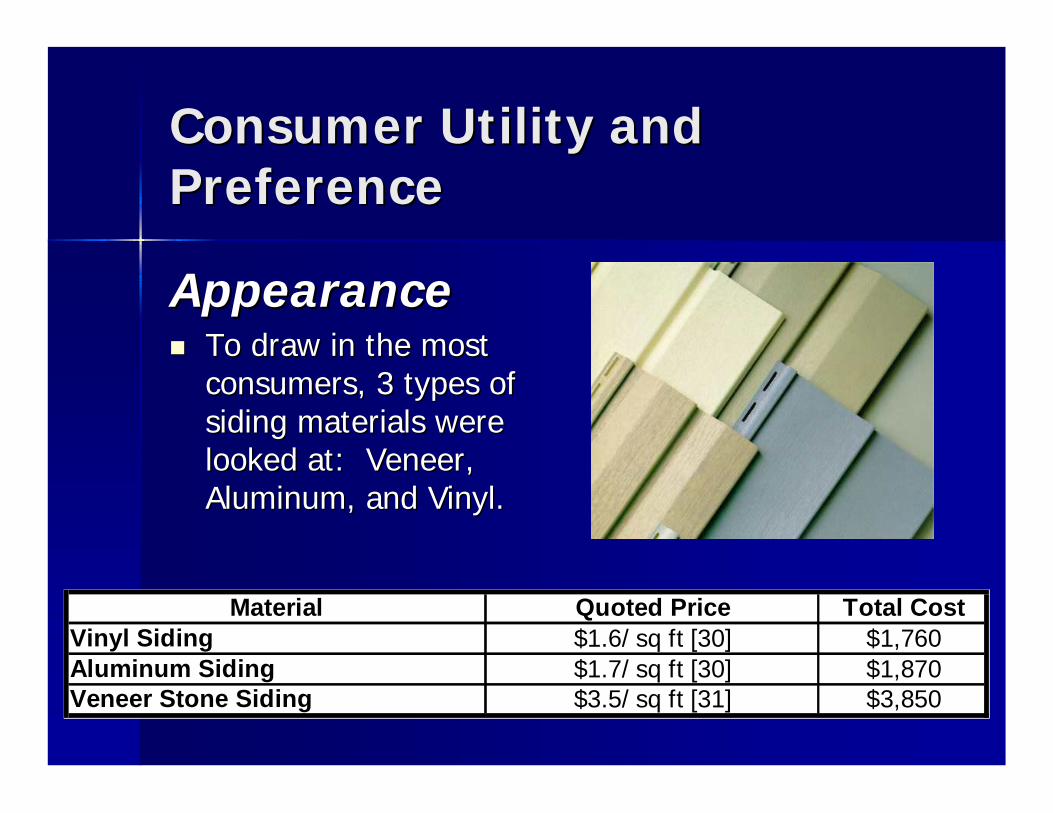
AppearanceAppearance To draw in the most To draw in the most
consumers, 3 types of consumers, 3 types of siding materials were siding materials were looked at: Veneer, looked at: Veneer, Aluminum, and Vinyl.Aluminum, and Vinyl.
Material Quoted Price Total CostVinyl Siding $1.6/ sq ft [30] $1,760Aluminum Siding $1.7/ sq ft [30] $1,870Veneer Stone Siding $3.5/ sq ft [31] $3,850
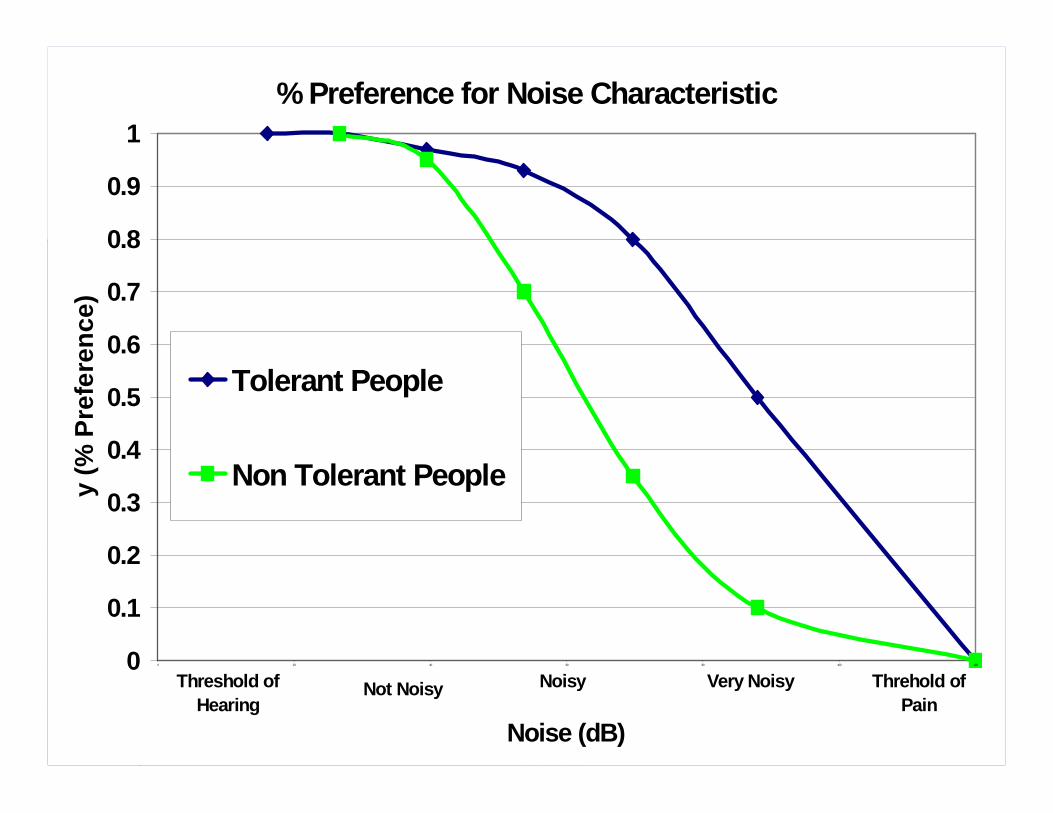
% Preference for Noise Characteristic
0
0.1
0.2
0.3
0.4
0.5
0.6
0.7
0.8
0.9
1
0 20 40 60 80 100 120
Noise (dB)
y (%
Pre
fere
nce)
Tolerant People
Non Tolerant People
Threshold of Hearing
Not Noisy Noisy Very Noisy Threhold of Pain
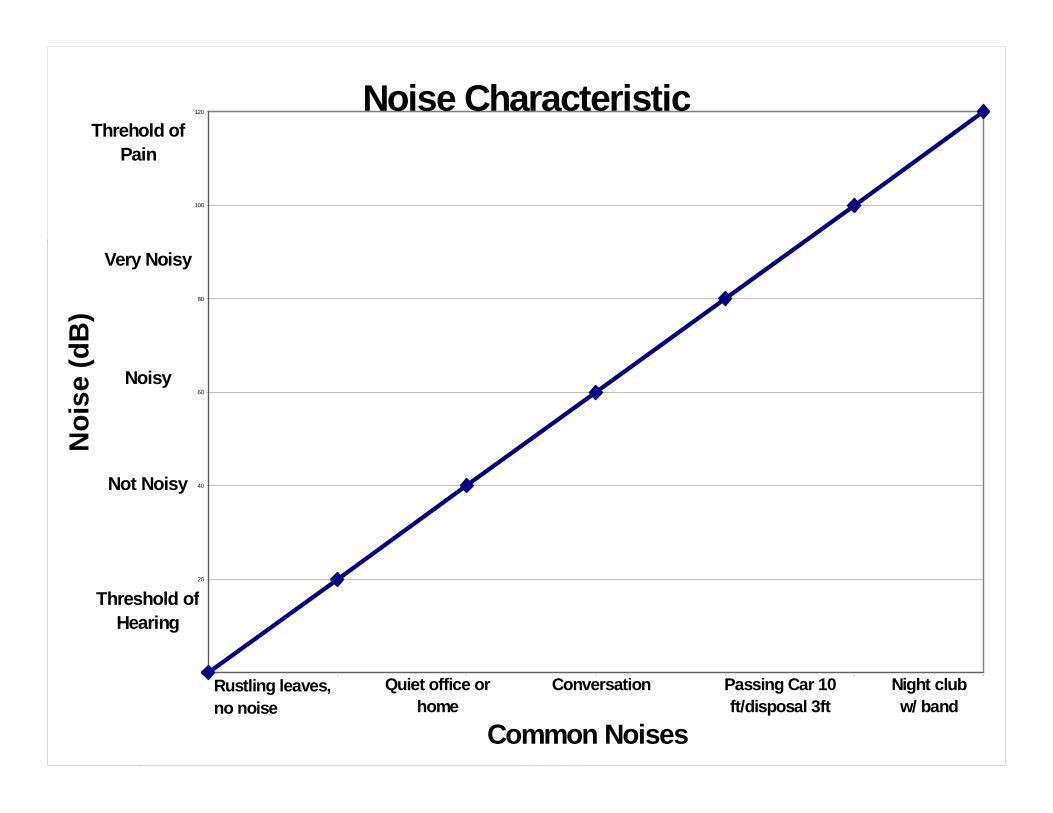
Noise Characteristic
0
20
40
60
80
100
120
0 1 2 3 4 5 6
Common Noises
Noi
se (d
B)
Threshold of Hearing
Not Noisy
Noisy
Very Noisy
Threhold of Pain
Passing Car 10 ft/disposal 3ft
ConversationQuiet office or home
Night club w/ band
Rustling leaves,no noise
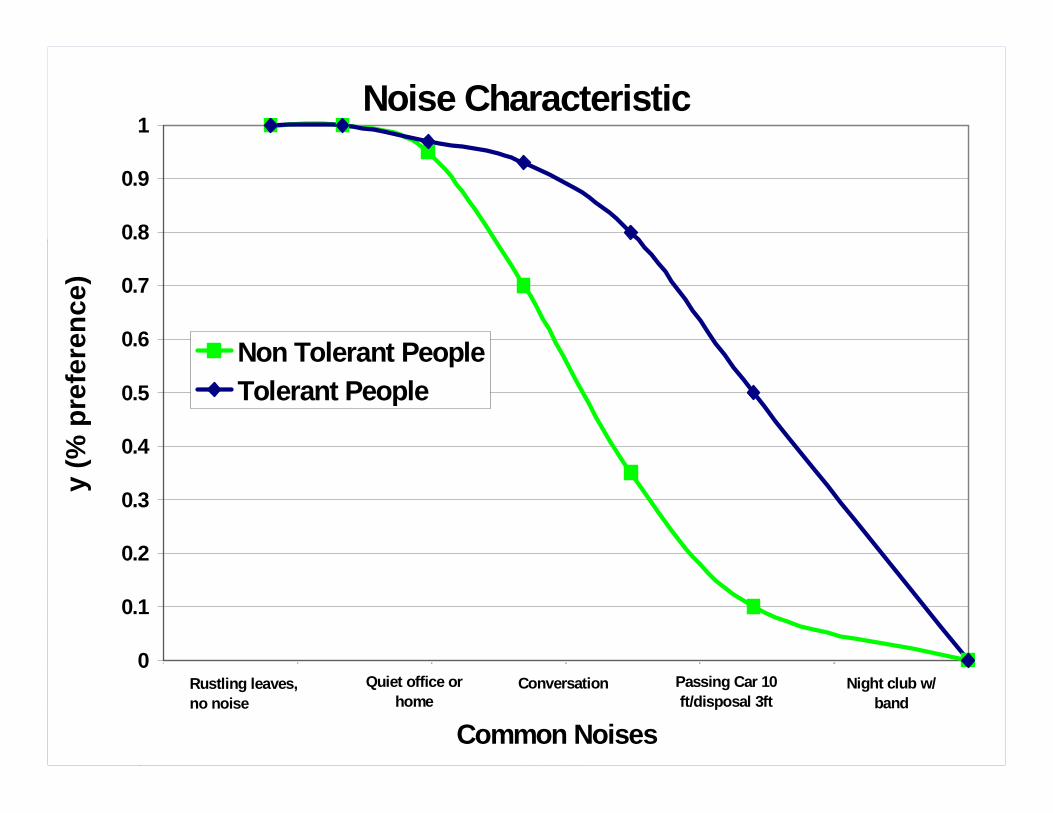
Noise Characteristic
0
0.1
0.2
0.3
0.4
0.5
0.6
0.7
0.8
0.9
1
0 20 40 60 80 100 120
Common Noises
y (%
pre
fere
nce)
Non Tolerant PeopleTolerant People
Passing Car 10 ft/disposal 3ft
ConversationQuiet office or home
Night club w/ band
Rustling leaves,no noise
Consumer Utility and Consumer Utility and PreferencePreference
NoiseNoise
Utility function (Utility function (yiyi) ) generatedgenerated
Y(%preferenceY(%preference)=)=--4E4E--06x3 06x3 -- 0.0007x2 0.0007x2 + 0.0278x + 0.724 + 0.0278x + 0.724
where where x(commonx(common noise)noise)
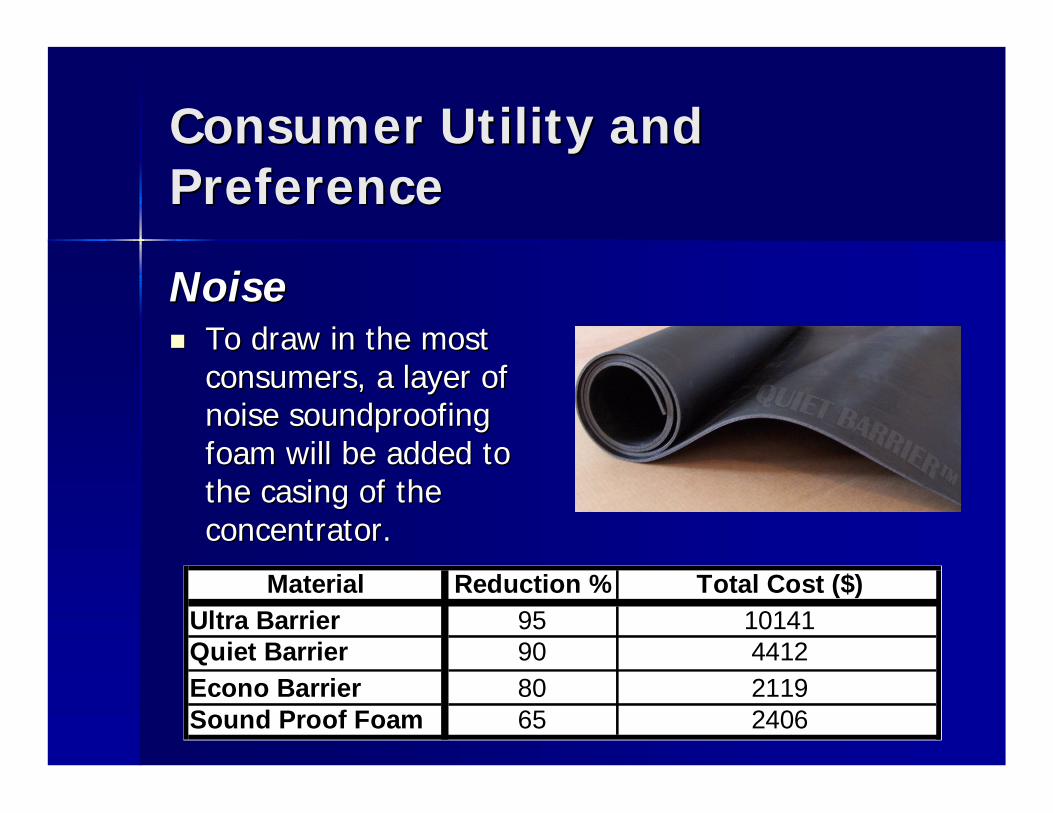
Consumer Utility and Consumer Utility and PreferencePreference
NoiseNoise To draw in the most To draw in the most
consumers, a layer of consumers, a layer of noise soundproofing noise soundproofing foam will be added to foam will be added to the casing of the the casing of the concentrator.concentrator.
Material Reduction % Total Cost ($)Ultra Barrier 95 10141Quiet Barrier 90 4412Econo Barrier 80 2119Sound Proof Foam 65 2406
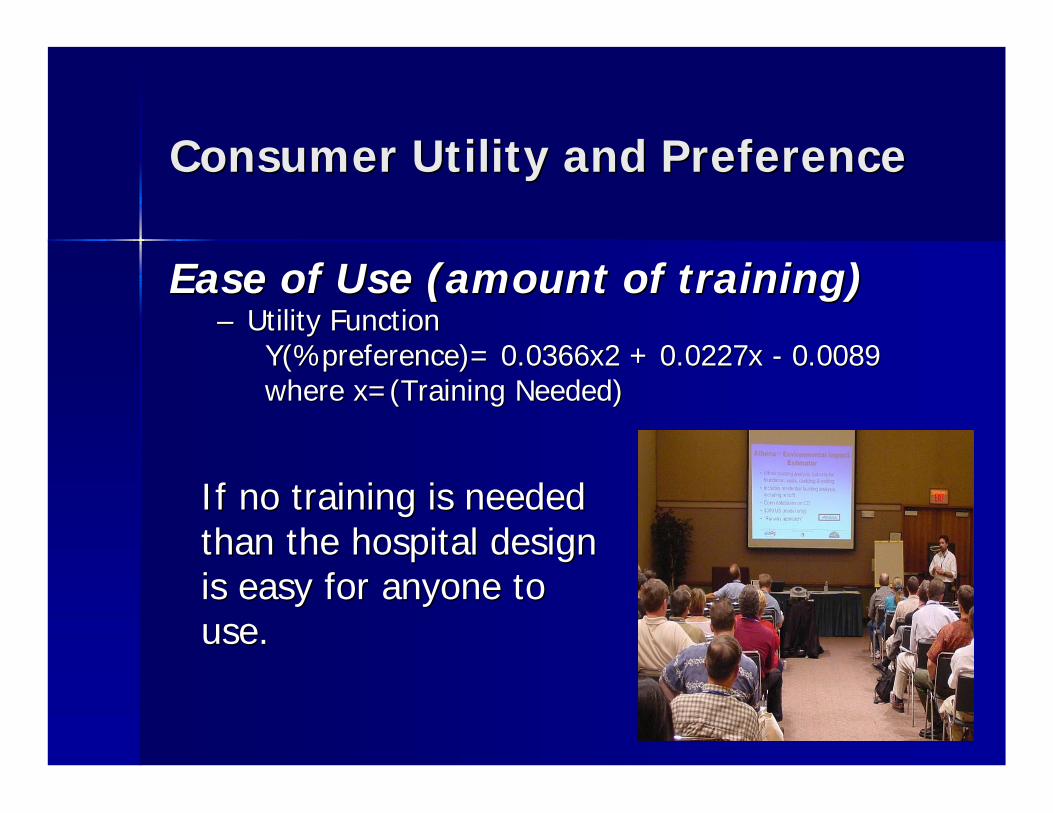
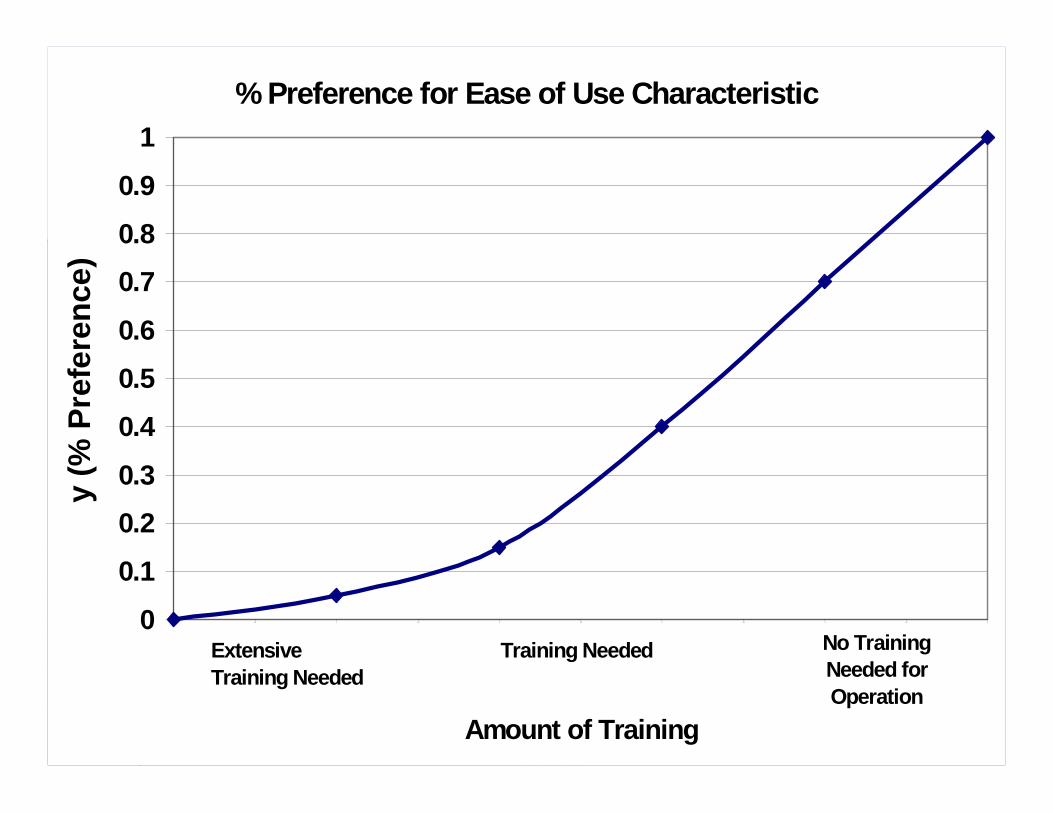
Consumer Utility and PreferenceConsumer Utility and Preference
Ease of Use (amount of training)Ease of Use (amount of training)–– Utility FunctionUtility Function
Y(%preferenceY(%preference)= 0.0366x2 + 0.0227x )= 0.0366x2 + 0.0227x -- 0.00890.0089where x=(Training Needed)where x=(Training Needed)
If no training is needed If no training is needed than the hospital design than the hospital design is easy for anyone to is easy for anyone to use. use.
% Preference for Ease of Use Characteristic
0
0.1
0.20.3
0.4
0.5
0.6
0.70.8
0.9
1
0 0.5 1 1.5 2 2.5 3 3.5 4 4.5 5
Amount of Training
y (%
Pre
fere
nce)
Extensive Training Needed
Training Needed No Training Needed for Operation
Consumer Utility and Consumer Utility and PreferencePreference
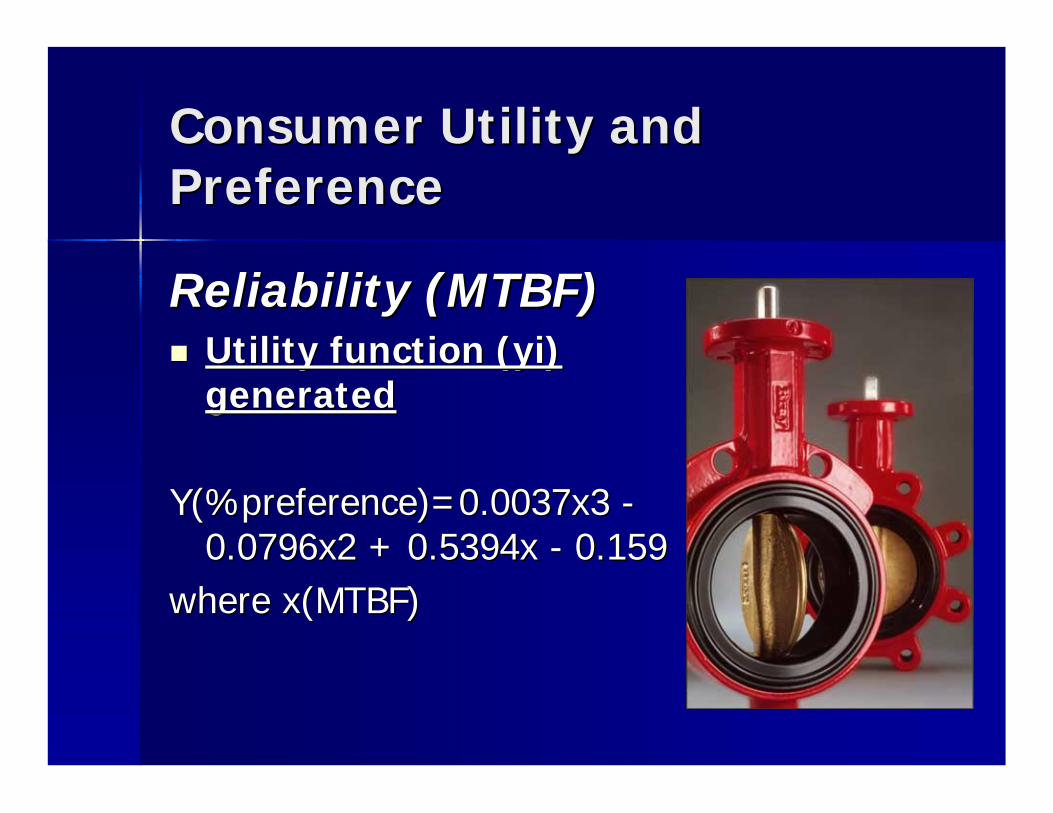
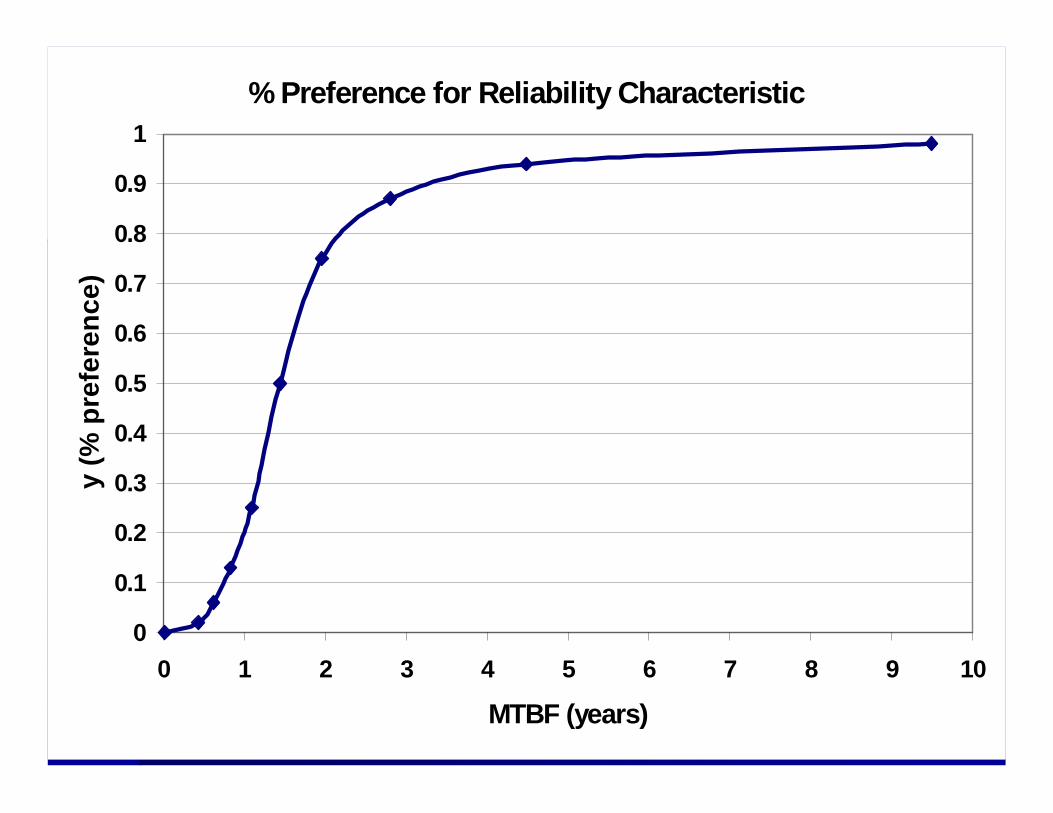
Reliability (MTBF)Reliability (MTBF) Utility function (Utility function (yiyi) )
generatedgenerated
Y(%preferenceY(%preference)=0.0037x3 )=0.0037x3 --0.0796x2 + 0.5394x 0.0796x2 + 0.5394x -- 0.1590.159
where where x(MTBFx(MTBF))
% Preference for Reliability Characteristic
0
0.1
0.2
0.3
0.4
0.5
0.6
0.7
0.8
0.9
1
0 1 2 3 4 5 6 7 8 9 10
MTBF (years)
y (%
pre
fere
nce)
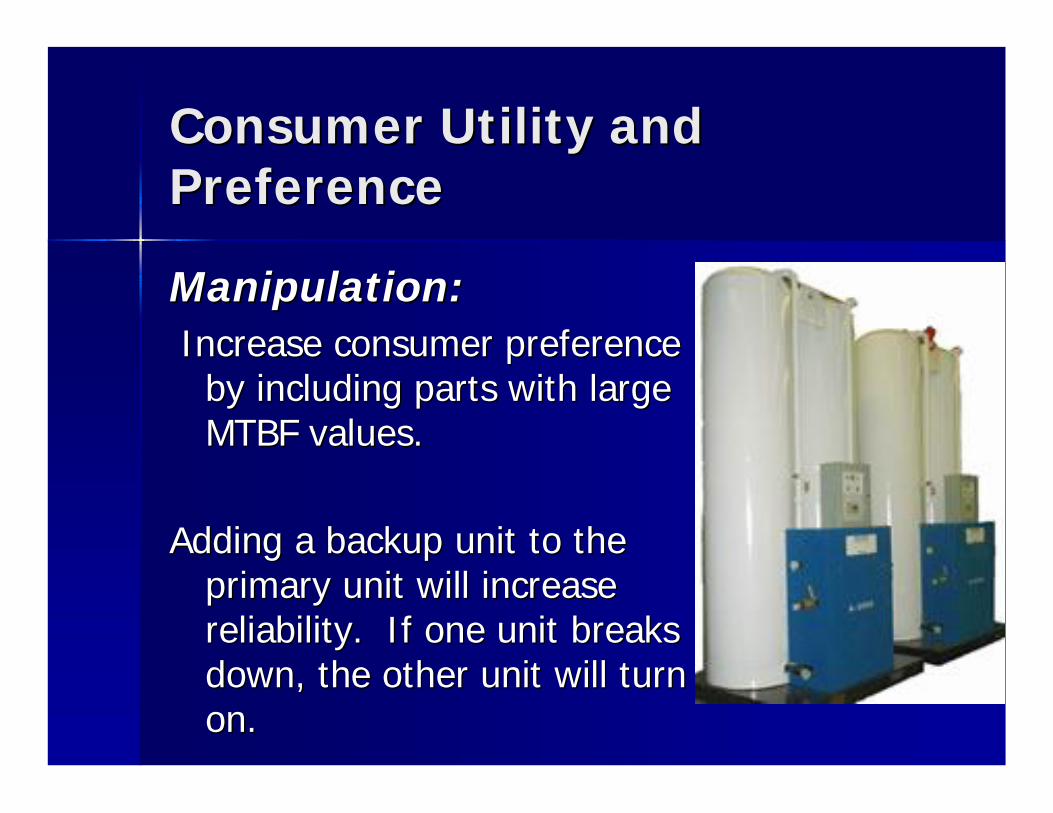
Consumer Utility and Consumer Utility and PreferencePreference
Manipulation: Manipulation: Increase consumer preference Increase consumer preference
by including parts with large by including parts with large MTBF values.MTBF values.
Adding a backup unit to the Adding a backup unit to the primary unit will increase primary unit will increase reliability. If one unit breaks reliability. If one unit breaks down, the other unit will turn down, the other unit will turn on.on.
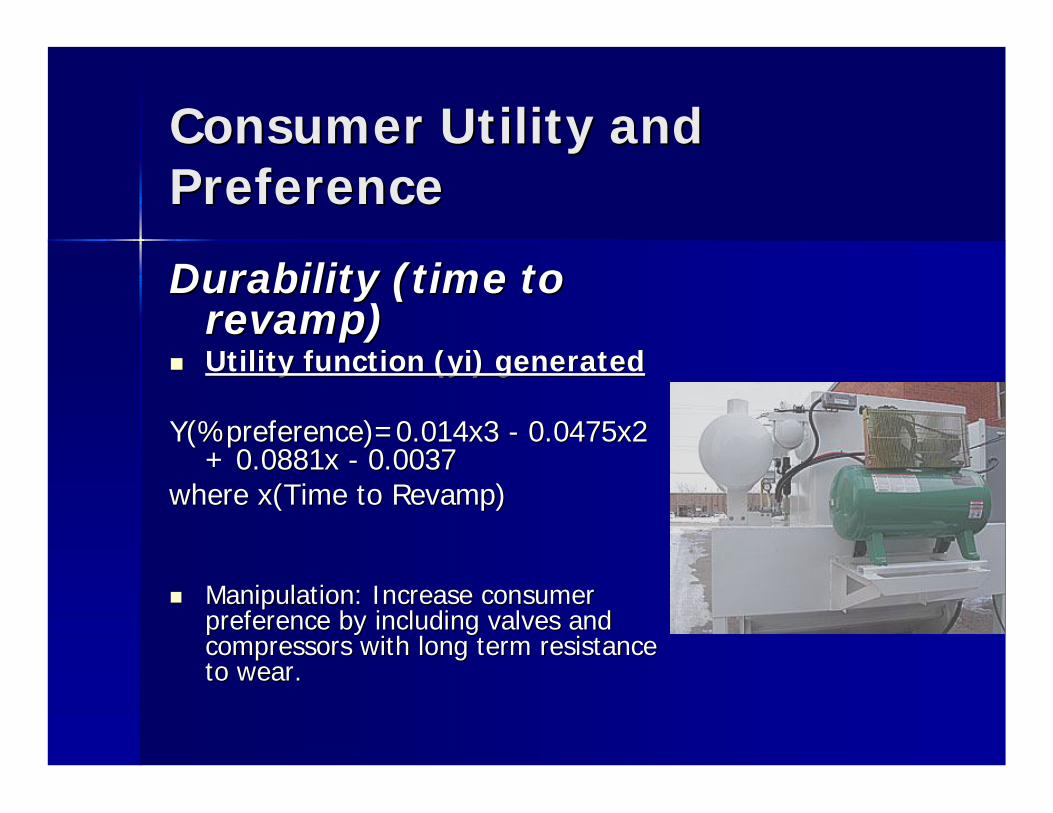
Consumer Utility and Consumer Utility and PreferencePreference
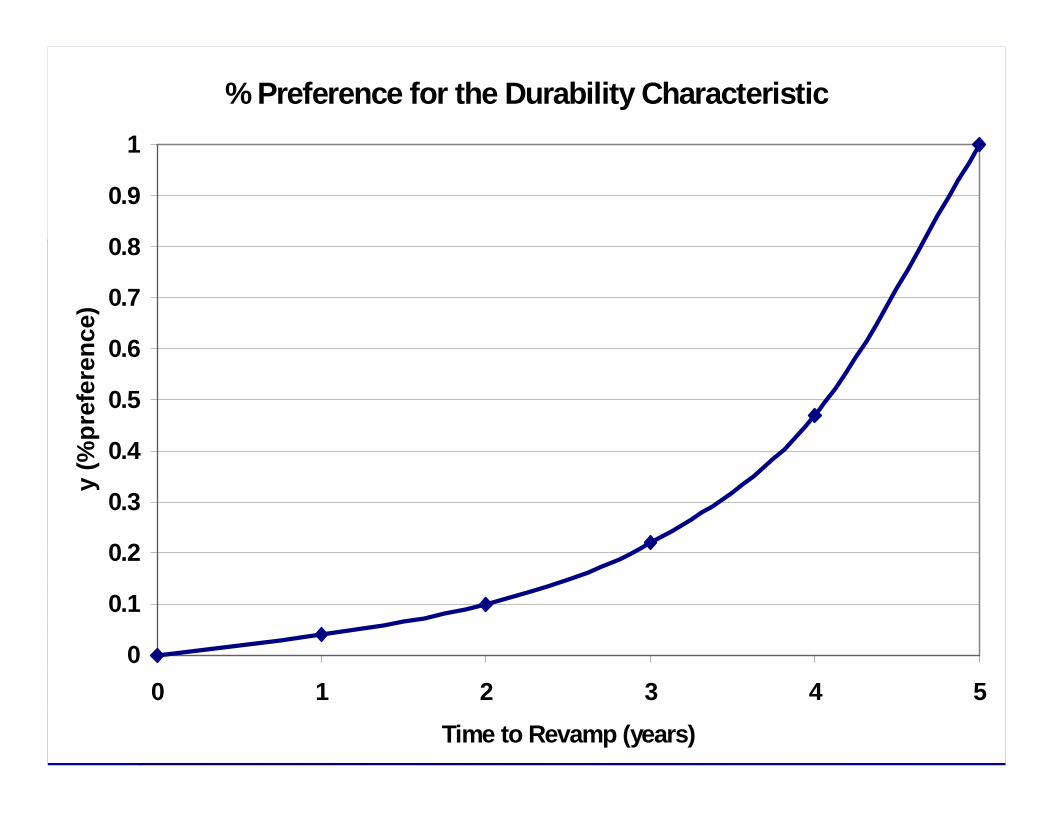
Durability (time to Durability (time to revamp)revamp)
Utility function (Utility function (yiyi) generated) generated
Y(%preferenceY(%preference)=0.014x3 )=0.014x3 -- 0.0475x2 0.0475x2 + 0.0881x + 0.0881x -- 0.00370.0037
where where x(Timex(Time to Revamp)to Revamp)
Manipulation: Increase consumer Manipulation: Increase consumer preference by including valves and preference by including valves and compressors with long term resistance compressors with long term resistance to wear.to wear.
% Preference for the Durability Characteristic
0
0.1
0.2
0.3
0.4
0.5
0.6
0.7
0.8
0.9
1
0 1 2 3 4 5Time to Revamp (years)
y (%
pref
eren
ce)
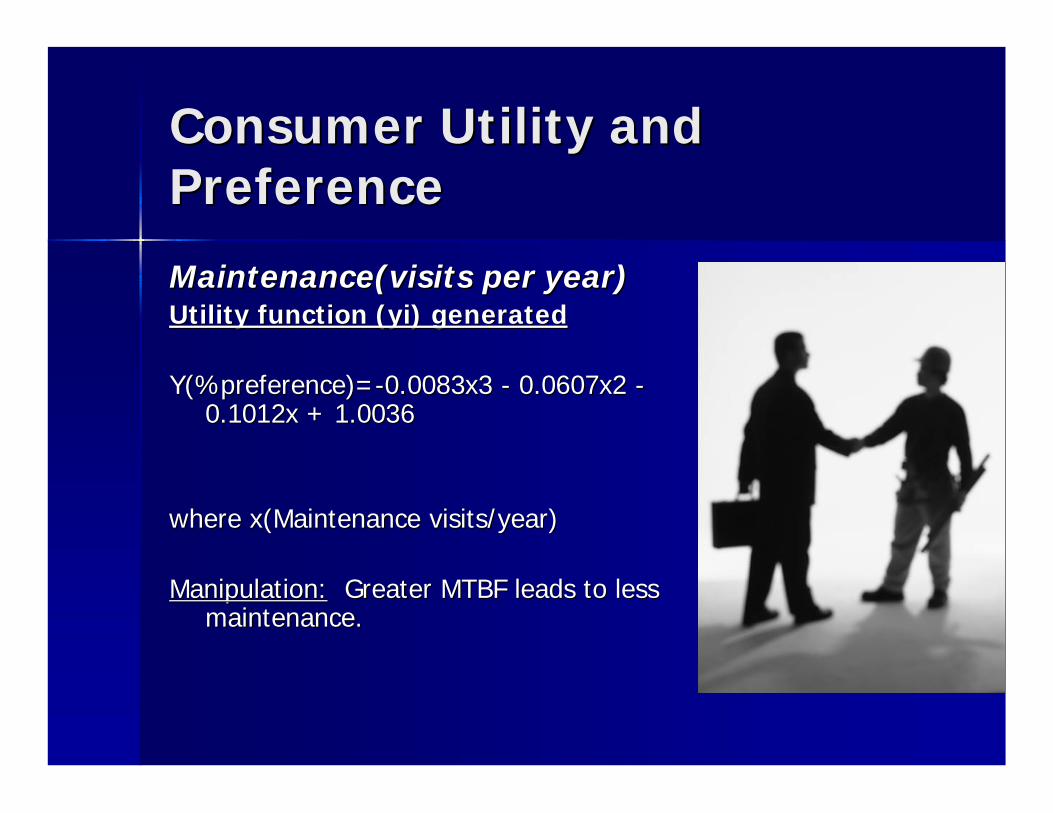
Consumer Utility and Consumer Utility and PreferencePreference
Maintenance(visitsMaintenance(visits per year)per year)Utility function (Utility function (yiyi) generated) generated
Y(%preferenceY(%preference)=)=--0.0083x3 0.0083x3 -- 0.0607x2 0.0607x2 --0.1012x + 1.00360.1012x + 1.0036
where where x(Maintenancex(Maintenance visits/year)visits/year)
Manipulation:Manipulation: Greater MTBF leads to less Greater MTBF leads to less maintenance.maintenance.
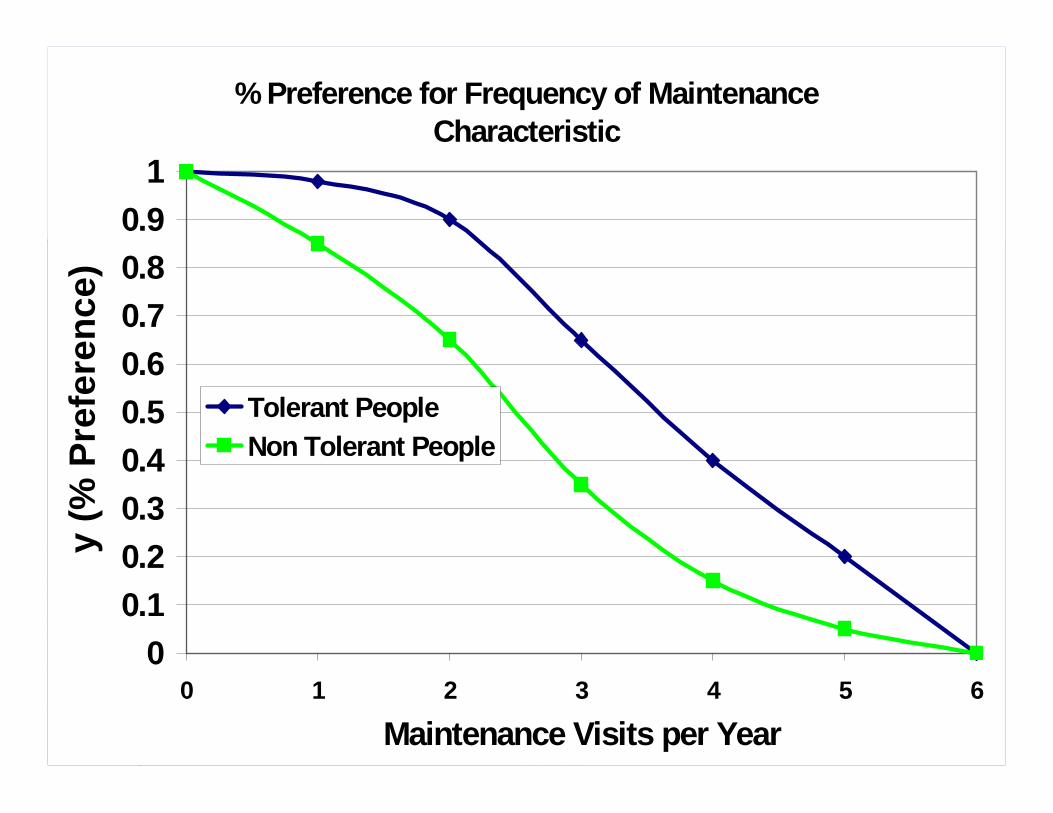
% Preference for Frequency of Maintenance Characteristic
00.10.20.30.40.50.60.70.80.9
1
0 1 2 3 4 5 6
Maintenance Visits per Year
y (%
Pre
fere
nce)
Tolerant PeopleNon Tolerant People
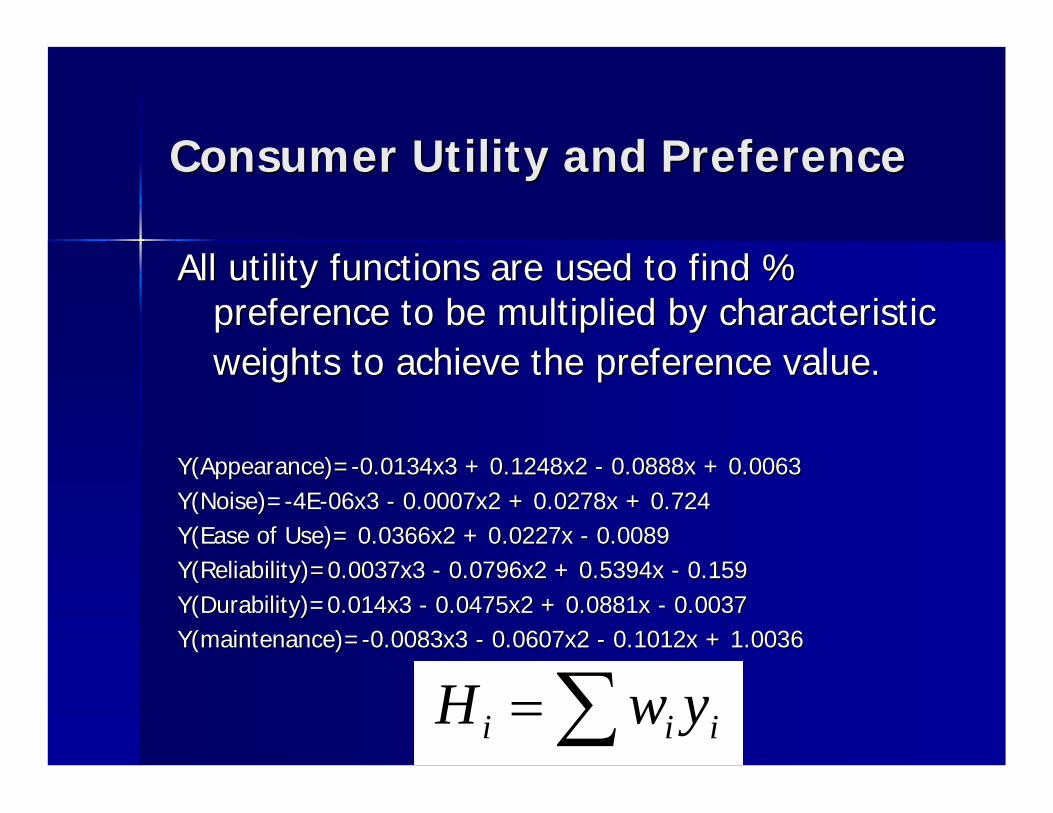
Consumer Utility and PreferenceConsumer Utility and Preference
All utility functions are used to find % All utility functions are used to find % preference to be multiplied by characteristic preference to be multiplied by characteristic weights to achieve the preference value.weights to achieve the preference value.
Y(AppearanceY(Appearance)=)=--0.0134x3 + 0.1248x2 0.0134x3 + 0.1248x2 -- 0.0888x + 0.0063 0.0888x + 0.0063 Y(NoiseY(Noise)=)=--4E4E--06x3 06x3 -- 0.0007x2 + 0.0278x + 0.724 0.0007x2 + 0.0278x + 0.724 Y(EaseY(Ease of Use)= 0.0366x2 + 0.0227x of Use)= 0.0366x2 + 0.0227x -- 0.00890.0089Y(ReliabilityY(Reliability)=0.0037x3 )=0.0037x3 -- 0.0796x2 + 0.5394x 0.0796x2 + 0.5394x -- 0.1590.159Y(DurabilityY(Durability)=0.014x3 )=0.014x3 -- 0.0475x2 + 0.0881x 0.0475x2 + 0.0881x -- 0.00370.0037Y(maintenanceY(maintenance)=)=--0.0083x3 0.0083x3 -- 0.0607x2 0.0607x2 -- 0.1012x + 1.00360.1012x + 1.0036
iii ywH
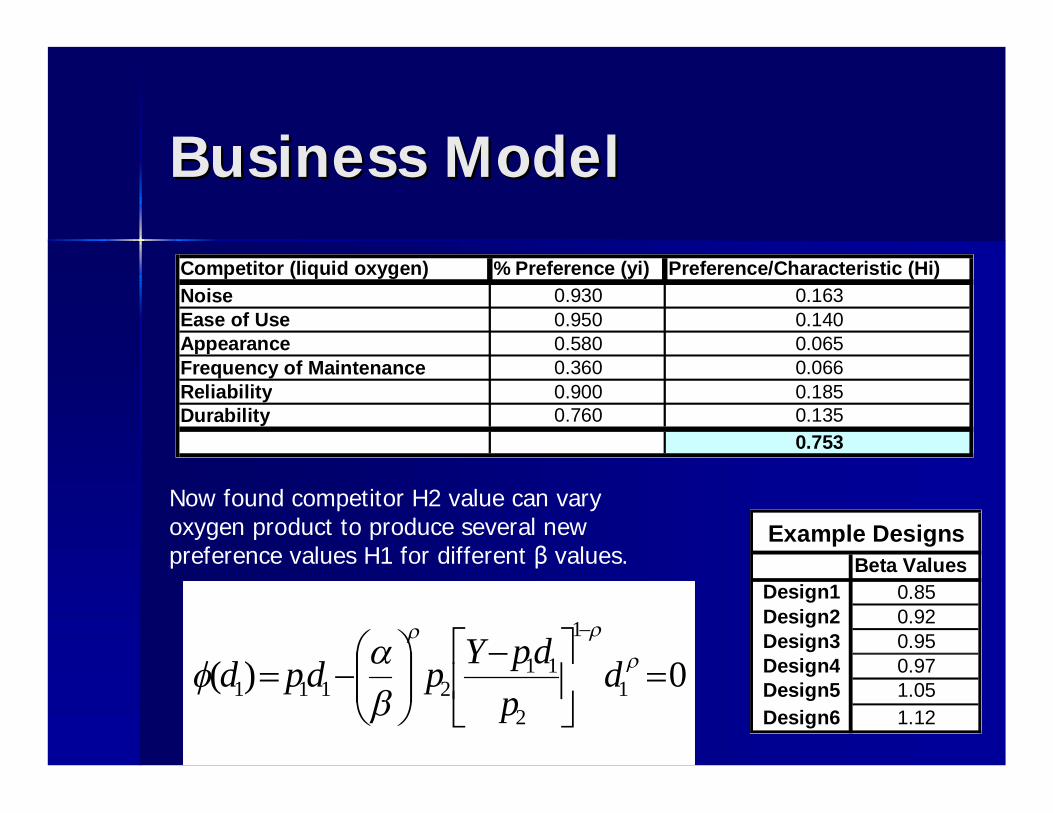
Business ModelBusiness Model
Competitor (liquid oxygen) % Preference (yi) Preference/Characteristic (Hi)Noise 0.930 0.163Ease of Use 0.950 0.140Appearance 0.580 0.065Frequency of Maintenance 0.360 0.066Reliability 0.900 0.185Durability 0.760 0.135
0.753
Now found competitor H2 value can vary oxygen product to produce several new preference values H1 for different β values. Beta Values
Design1 0.85Design2 0.92Design3 0.95Design4 0.97Design5 1.05Design6 1.12
Example Designs
0)( 1
1
2
112111
dp
dpYpdpd

Business Model for Hospital Business Model for Hospital DesignDesign
Business ModelBusiness Model
GoalsGoals Determine Determine ββ value that will maximize value that will maximize
NPV at the best price for design.NPV at the best price for design.
Determine the effect of varying Determine the effect of varying αα(knowledge) with time with a set (knowledge) with time with a set ββvalue.value.
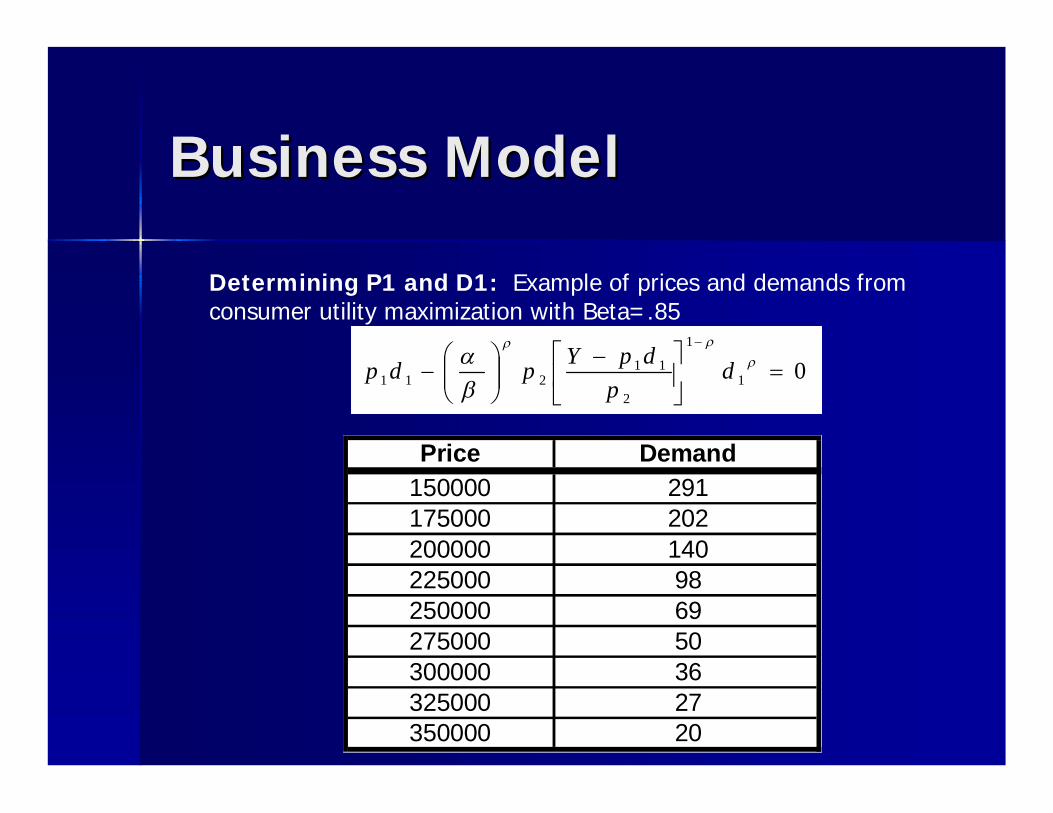
Business ModelBusiness Model
Determining P1 and D1: Example of prices and demands from consumer utility maximization with Beta=.85
01
1
2
11211
d
pdpYpdp
Price Demand150000 291175000 202200000 140225000 98250000 69275000 50300000 36325000 27350000 20
Business ModelBusiness Model
Items now needed to find NPVItems now needed to find NPV Total Product CostsTotal Product Costs
–– Raw MaterialsRaw Materials–– Variable Production CostsVariable Production Costs–– Administrative CostsAdministrative Costs–– Advertising CostsAdvertising Costs–– Distribution CostsDistribution Costs–– Fixed ChargesFixed Charges
TCITCI Total Equipment CostsTotal Equipment Costs
Business ModelBusiness Model
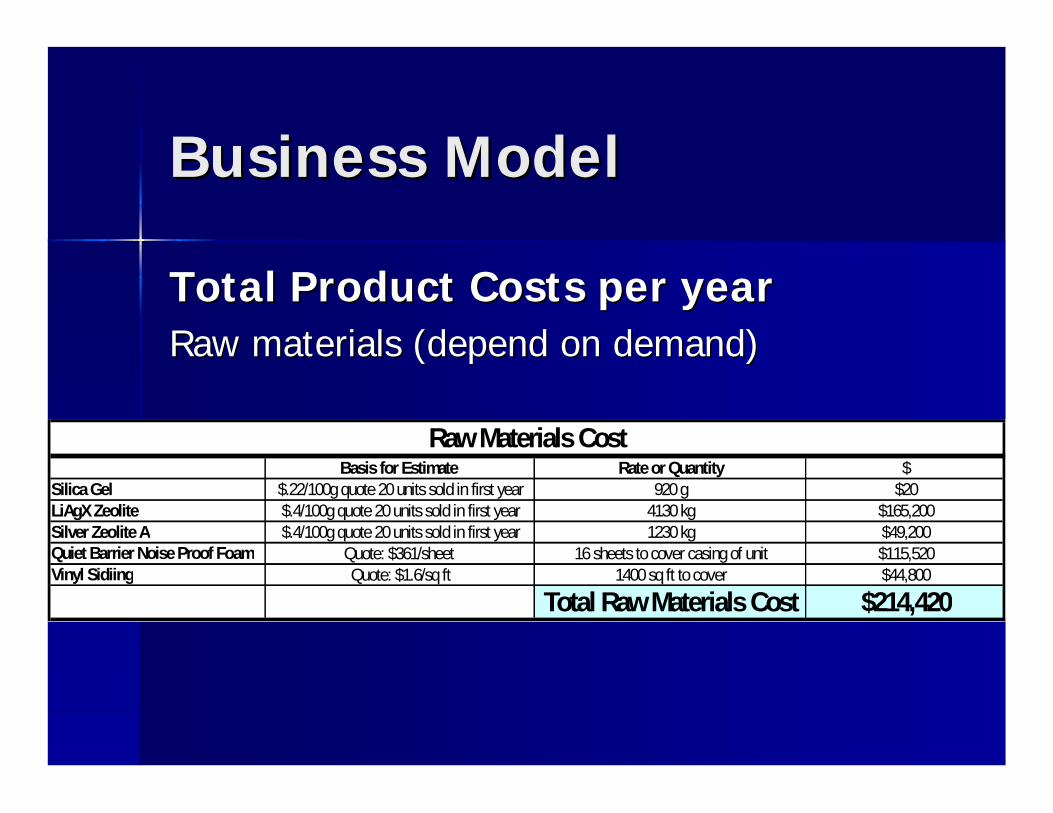
Total Product Costs per yearTotal Product Costs per yearRaw materials (depend on demand)Raw materials (depend on demand)
Basis for Estimate Rate or Quantity $Silica Gel $.22/100g quote 20 units sold in first year 920 g $20LiAgX Zeolite $.4/100g quote 20 units sold in first year 4130 kg $165,200Silver Zeolite A $.4/100g quote 20 units sold in first year 1230 kg $49,200Quiet Barrier Noise Proof Foam Quote: $361/sheet 16 sheets to cover casing of unit $115,520Vinyl Sidiing Quote: $1.6/sq ft 1400 sq ft to cover $44,800
Total Raw Materials Cost $214,420
Raw Materials Cost
Business ModelBusiness Model
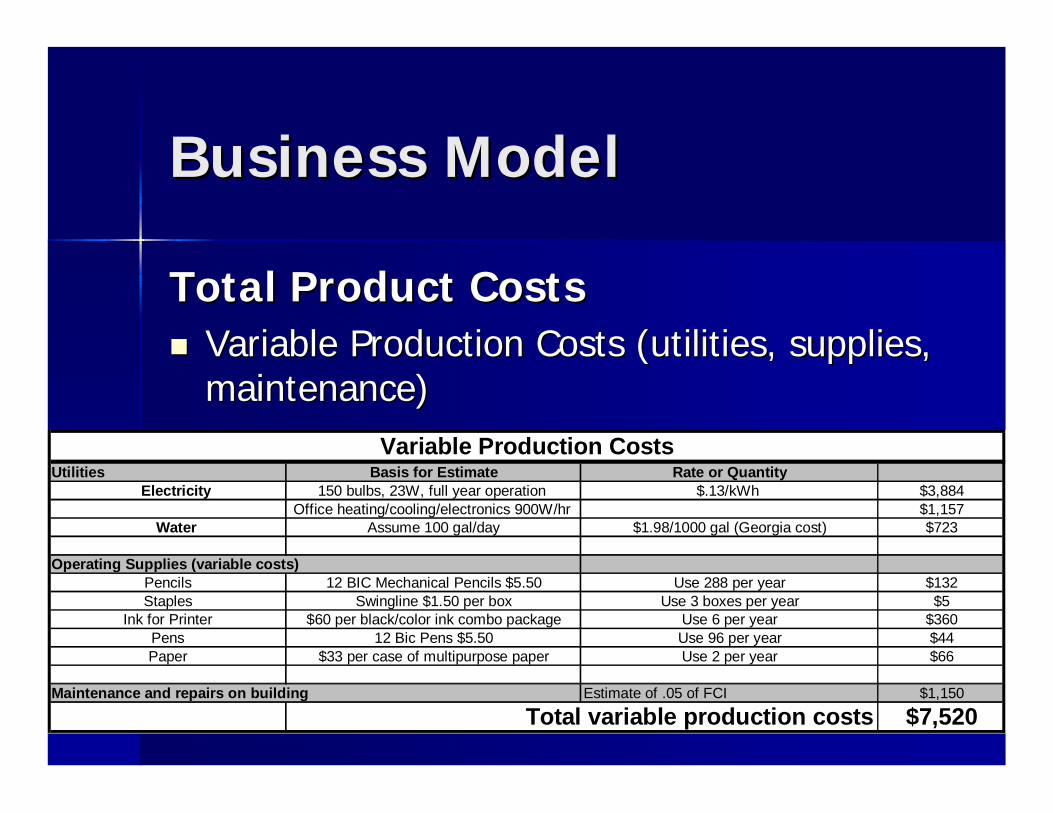
Total Product CostsTotal Product Costs Variable Production Costs (utilities, supplies, Variable Production Costs (utilities, supplies,
maintenance)maintenance)
Utilities Basis for Estimate Rate or Quantity Electricity 150 bulbs, 23W, full year operation $.13/kWh $3,884
Office heating/cooling/electronics 900W/hr $1,157 Water Assume 100 gal/day $1.98/1000 gal (Georgia cost) $723
Operating Supplies (variable costs)Pencils 12 BIC Mechanical Pencils $5.50 Use 288 per year $132Staples Swingline $1.50 per box Use 3 boxes per year $5
Ink for Printer $60 per black/color ink combo package Use 6 per year $360Pens 12 Bic Pens $5.50 Use 96 per year $44Paper $33 per case of multipurpose paper Use 2 per year $66
Maintenance and repairs on building Estimate of .05 of FCI $1,150
Total variable production costs $7,520
Variable Production Costs
Business ModelBusiness Model
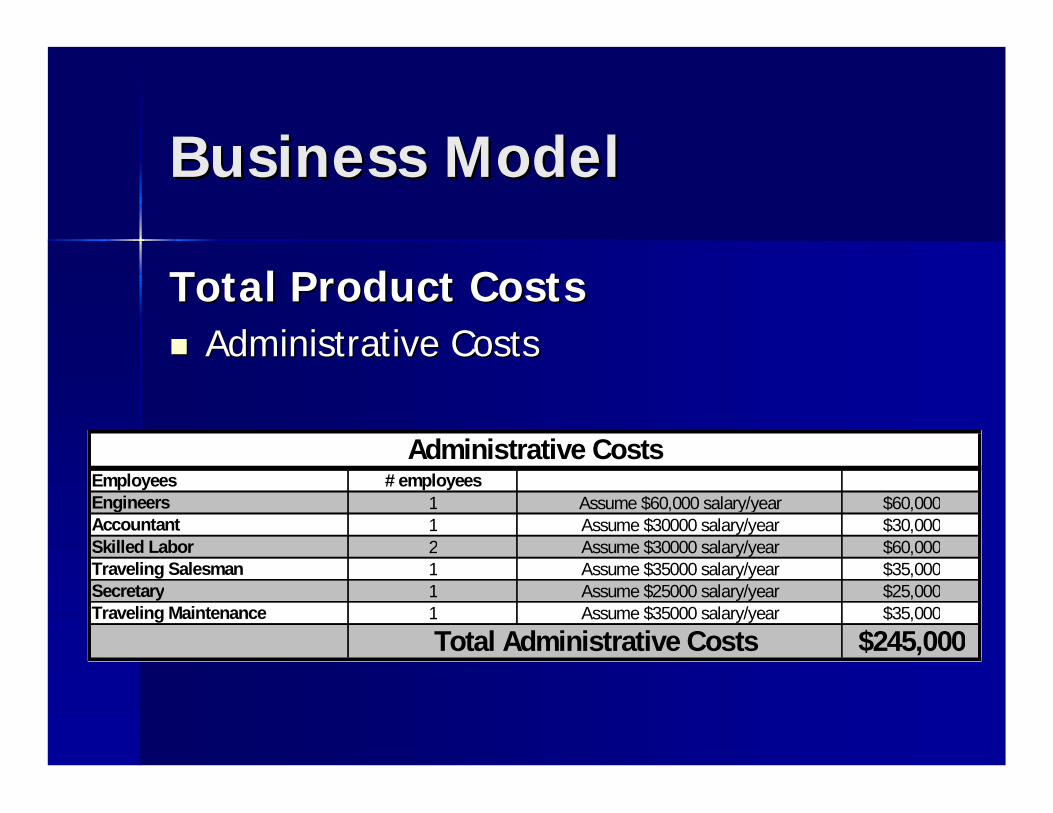
Total Product CostsTotal Product Costs Administrative CostsAdministrative Costs
Employees # employeesEngineers 1 Assume $60,000 salary/year $60,000Accountant 1 Assume $30000 salary/year $30,000Skilled Labor 2 Assume $30000 salary/year $60,000Traveling Salesman 1 Assume $35000 salary/year $35,000Secretary 1 Assume $25000 salary/year $25,000Traveling Maintenance 1 Assume $35000 salary/year $35,000
$245,000Total Administrative Costs
Administrative Costs
Business ModelBusiness Model
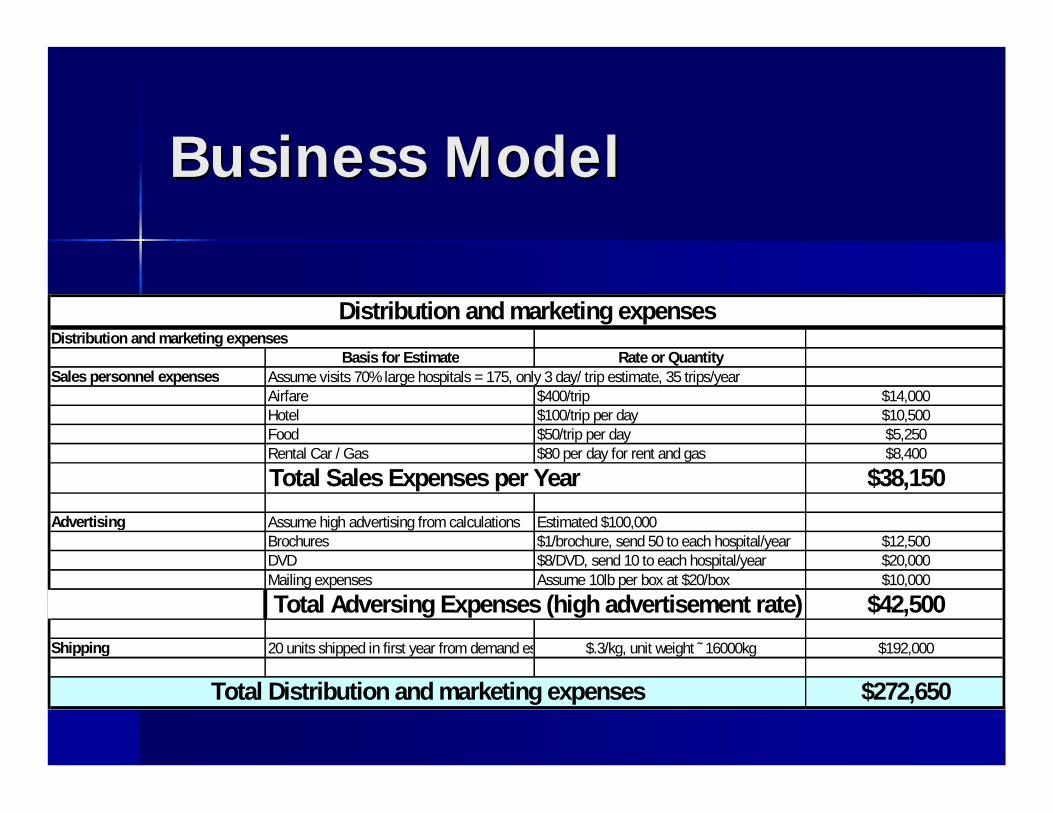
Distribution and marketing expensesBasis for Estimate Rate or Quantity
Sales personnel expenses Assume visits 70% large hospitals = 175, only 3 day/ trip estimate, 35 trips/yearAirfare $400/trip $14,000Hotel $100/trip per day $10,500Food $50/trip per day $5,250Rental Car / Gas $80 per day for rent and gas $8,400
Total Sales Expenses per Year $38,150Advertising Assume high advertising from calculations Estimated $100,000
Brochures $1/brochure, send 50 to each hospital/year $12,500DVD $8/DVD, send 10 to each hospital/year $20,000Mailing expenses Assume 10lb per box at $20/box $10,000
Total Adversing Expenses (high advertisement rate) $42,500Shipping 20 units shipped in first year from demand estimate $.3/kg, unit weight ˜ 16000kg $192,000
$272,650Total Distribution and marketing expenses
Distribution and marketing expenses
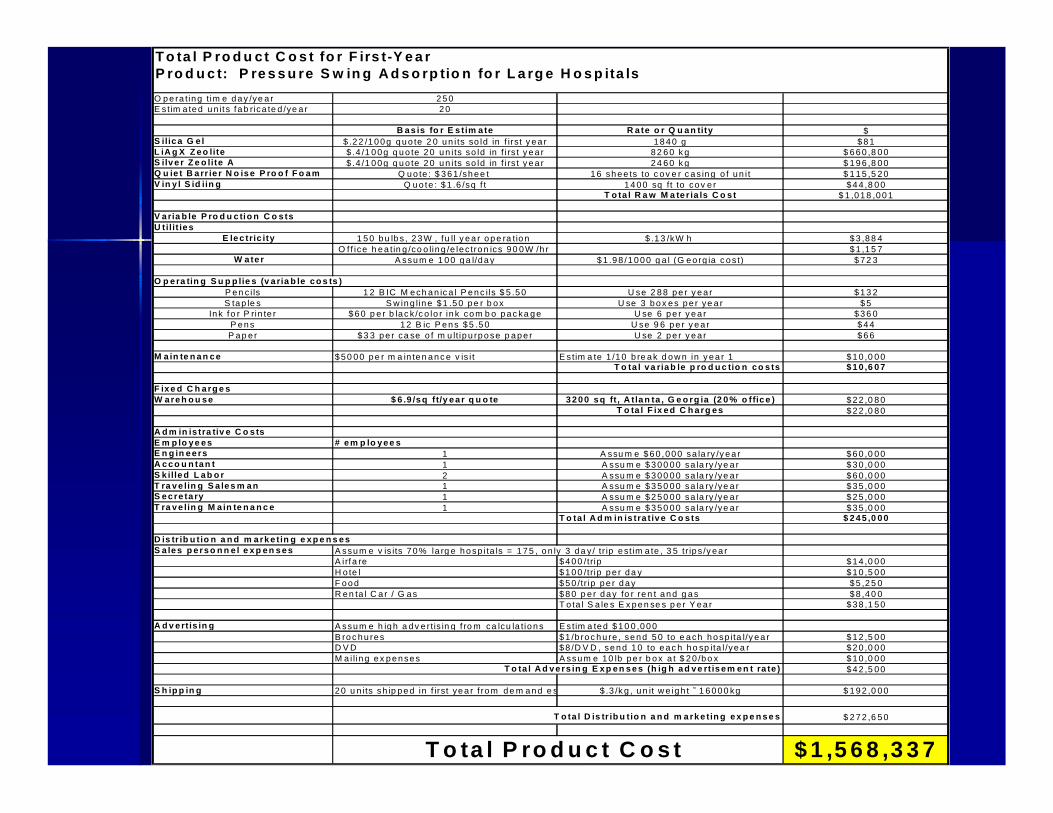
T o ta l P ro d u ct C o s t fo r F irs t-Y e a rP ro d u c t: P re s s u re S w in g A d s o rp tio n fo r L a rg e H o s p ita lsO p e ra tin g t im e d a y /ye a r 2 5 0 F C I($ ) 1 3 7 0 6E stim a te d u n it s fa b rica te d /ye a r 2 0
B a s is fo r E s t im a te R a te o r Q u a n tity $S ilic a G e l $ .2 2 /1 0 0 g q u o te 2 0 u n i ts so ld in f irst y e a r 1 8 4 0 g $ 8 1L iA g X Z e o lite $ .4 /1 0 0 g q u o te 2 0 u n i ts so ld in f i rs t y e a r 8 2 6 0 k g $ 6 6 0 ,8 0 0S ilv e r Z e o lite A $ .4 /1 0 0 g q u o te 2 0 u n i ts so ld in f i rs t y e a r 2 4 6 0 k g $ 1 9 6 ,8 0 0Q u ie t B a rr ie r N o is e P ro o f F o a m Q u o te : $ 3 6 1 /sh e e t 1 6 sh e e ts to c o v e r c a s in g o f u n i t $ 1 1 5 ,5 2 0V in y l S id iin g Q u o te : $ 1 .6 /sq f t 1 4 0 0 sq ft to co v e r $ 4 4 ,8 0 0
T o ta l R a w M a te r ia ls C o s t $ 1 ,0 1 8 ,0 0 1
V a ria b le P ro d u c tio n C o s tsU tilit ie s
E le c tric ity 1 5 0 b u lb s , 2 3 W , fu ll y e a r o p e ra tio n $ .1 3 /kW h $ 3 ,8 8 4O f f ice h e a tin g /co o lin g /e le c tro n ics 9 0 0 W /h r $ 1 ,1 5 7
W a te r A ssu m e 1 0 0 g a l/d a y $ 1 .9 8 /1 0 0 0 g a l (G e o rg ia c o s t) $ 7 2 3
O p e ra tin g S u p p lie s (v a ria b le c o s ts )P e n c i ls 1 2 B IC M e ch a n ic a l P e n c ils $ 5 .5 0 U se 2 8 8 p e r y e a r $ 1 3 2S ta p le s S w in g lin e $ 1 .5 0 p e r b o x U se 3 b o x e s p e r ye a r $ 5
In k fo r P rin te r $ 6 0 p e r b la c k /c o lo r in k co m b o p a c ka g e U se 6 p e r y e a r $ 3 6 0P e n s 1 2 B ic P e n s $ 5 .5 0 U se 9 6 p e r y e a r $ 4 4P a p e r $ 3 3 p e r ca se o f m u lt ip u rp o se p a p e r U se 2 p e r y e a r $ 6 6
M a in te n a n c e $ 5 0 0 0 p e r m a in te n a n c e v is i t E s tim a te 1 /1 0 b re a k d o w n in y e a r 1 $ 1 0 ,0 0 0T o ta l v a ria b le p ro d u c tio n c o s ts $ 1 0 ,6 0 7
F ix e d C h a rg e sW a re h o u s e $ 6 .9 /s q f t/y e a r q u o te 3 2 0 0 s q ft , A t la n ta , G e o rg ia (2 0 % o ffic e ) $ 2 2 ,0 8 0
T o ta l F ix e d C h a rg e s $ 2 2 ,0 8 0
A d m in is tra tiv e C o s tsE m p lo y e e s # e m p lo y e e sE n g in e e rs 1 A ssu m e $ 6 0 ,0 0 0 sa la ry /y e a r $ 6 0 ,0 0 0A c c o u n ta n t 1 A ssu m e $ 3 0 0 0 0 sa la ry /ye a r $ 3 0 ,0 0 0S k ille d L a b o r 2 A ssu m e $ 3 0 0 0 0 sa la ry /ye a r $ 6 0 ,0 0 0T ra v e lin g S a le s m a n 1 A ssu m e $ 3 5 0 0 0 sa la ry /ye a r $ 3 5 ,0 0 0S e c re ta ry 1 A ssu m e $ 2 5 0 0 0 sa la ry /ye a r $ 2 5 ,0 0 0T ra v e lin g M a in te n a n c e 1 A ssu m e $ 3 5 0 0 0 sa la ry /ye a r $ 3 5 ,0 0 0
T o ta l A d m in is tra t iv e C o s ts $ 2 4 5 ,0 0 0
D is tr ib u tio n a n d m a rk e t in g e x p e n s e sS a le s p e rs o n n e l e x p e n s e s A ssu m e v is its 7 0 % la rg e h o sp i ta ls = 1 7 5 , o n ly 3 d a y / tr ip e st im a te , 3 5 tr ip s /y e a r
A i rfa re $ 4 0 0 /trip $ 1 4 ,0 0 0H o te l $ 1 0 0 /trip p e r d a y $ 1 0 ,5 0 0F o o d $ 5 0 /tr ip p e r d a y $ 5 ,2 5 0R e n ta l C a r / G a s $ 8 0 p e r d a y fo r re n t a n d g a s $ 8 ,4 0 0
T o ta l S a le s E x p e n se s p e r Y e a r $ 3 8 ,1 5 0
A d v e rt is in g A ssu m e h ig h a d v e r t is in g f ro m ca lcu la t io n s E s tim a te d $ 1 0 0 ,0 0 0B ro c h u re s $ 1 /b ro c h u re , se n d 5 0 to e a ch h o sp ita l/y e a r $ 1 2 ,5 0 0D V D $ 8 /D V D , se n d 1 0 to e a c h h o sp ita l /ye a r $ 2 0 ,0 0 0M a i lin g e x p e n se s A ssu m e 1 0 lb p e r b o x a t $ 2 0 /b o x $ 1 0 ,0 0 0
$ 4 2 ,5 0 0
S h ip p in g 2 0 u n its sh ip p e d in f irst ye a r f ro m d e m a n d e stim a te $ .3 /k g , u n it w e ig h t ˜ 1 6 0 0 0 kg $ 1 9 2 ,0 0 0
$ 2 7 2 ,6 5 0
$ 1 ,5 6 8 ,3 3 7T o ta l P ro d u c t C o s t T o ta l D is tr ib u t io n a n d m a rk e t in g e x p e n s e s
T o ta l A d v e rs in g E x p e n s e s (h ig h a d v e rt is e m e n t ra te )
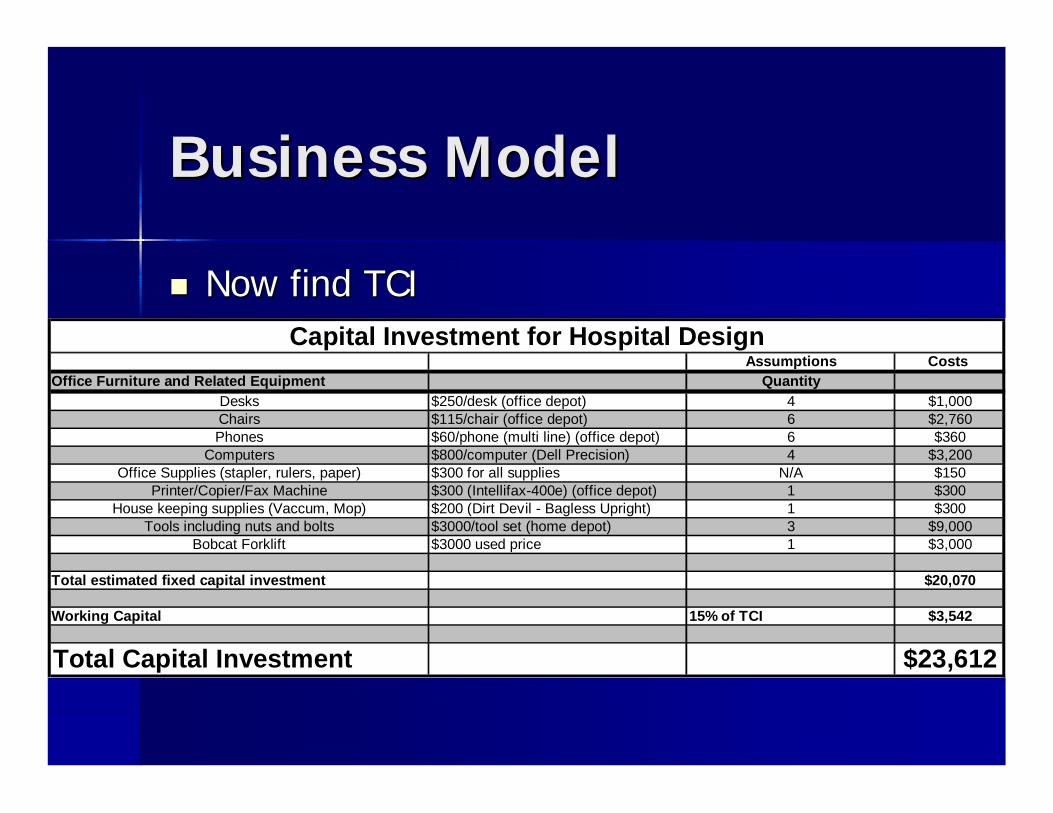
Business ModelBusiness Model
Now find TCINow find TCI
Assumptions Costs Office Furniture and Related Equipment Quantity
Desks $250/desk (office depot) 4 $1,000Chairs $115/chair (office depot) 6 $2,760Phones $60/phone (multi line) (office depot) 6 $360
Computers $800/computer (Dell Precision) 4 $3,200Office Supplies (stapler, rulers, paper) $300 for all supplies N/A $150
Printer/Copier/Fax Machine $300 (Intellifax-400e) (office depot) 1 $300House keeping supplies (Vaccum, Mop) $200 (Dirt Devil - Bagless Upright) 1 $300
Tools including nuts and bolts $3000/tool set (home depot) 3 $9,000Bobcat Forklift $3000 used price 1 $3,000
Total estimated fixed capital investment $20,070
Working Capital 15% of TCI $3,542
Total Capital Investment $23,612
Capital Investment for Hospital Design
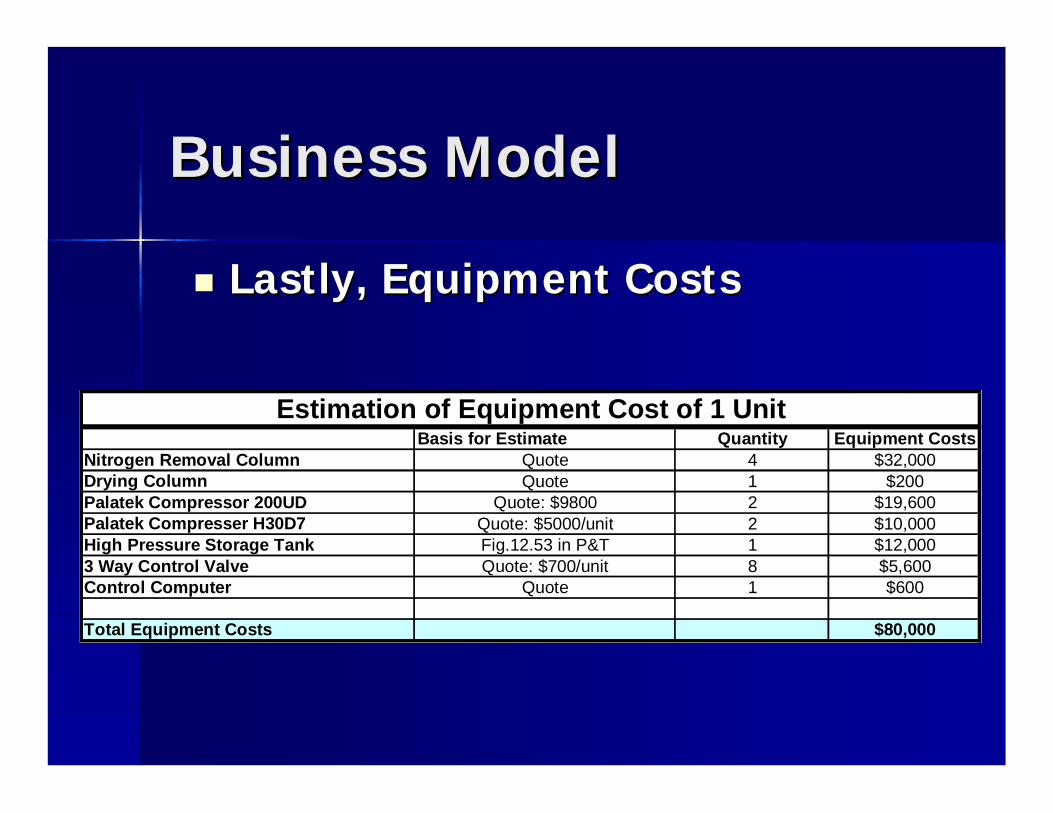
Business ModelBusiness Model
Lastly, Equipment CostsLastly, Equipment Costs
Basis for Estimate Quantity Equipment CostsNitrogen Removal Column Quote 4 $32,000Drying Column Quote 1 $200Palatek Compressor 200UD Quote: $9800 2 $19,600Palatek Compresser H30D7 Quote: $5000/unit 2 $10,000High Pressure Storage Tank Fig.12.53 in P&T 1 $12,0003 Way Control Valve Quote: $700/unit 8 $5,600Control Computer Quote 1 $600
Total Equipment Costs $80,000
Estimation of Equipment Cost of 1 Unit
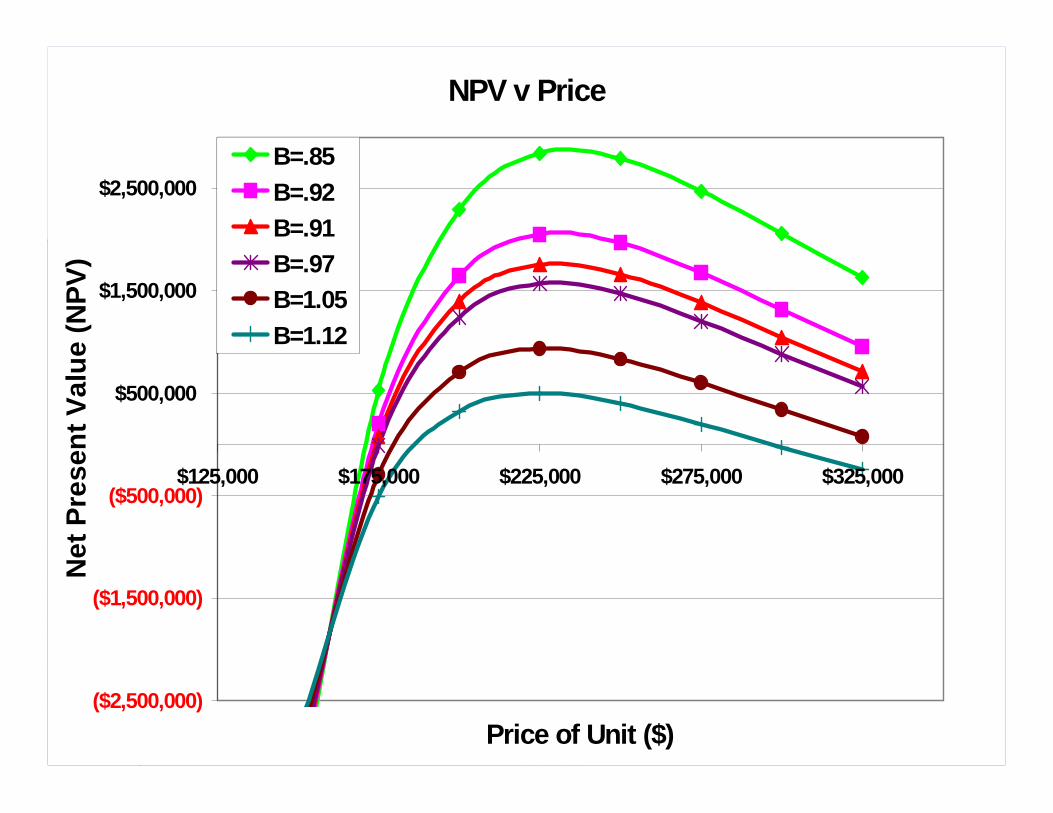
NPV v Price
($2,500,000)
($1,500,000)
($500,000)
$500,000
$1,500,000
$2,500,000
$125,000 $175,000 $225,000 $275,000 $325,000
Price of Unit ($)
Net
Pre
sent
Val
ue (N
PV)
B=.85B=.92B=.91B=.97B=1.05B=1.12
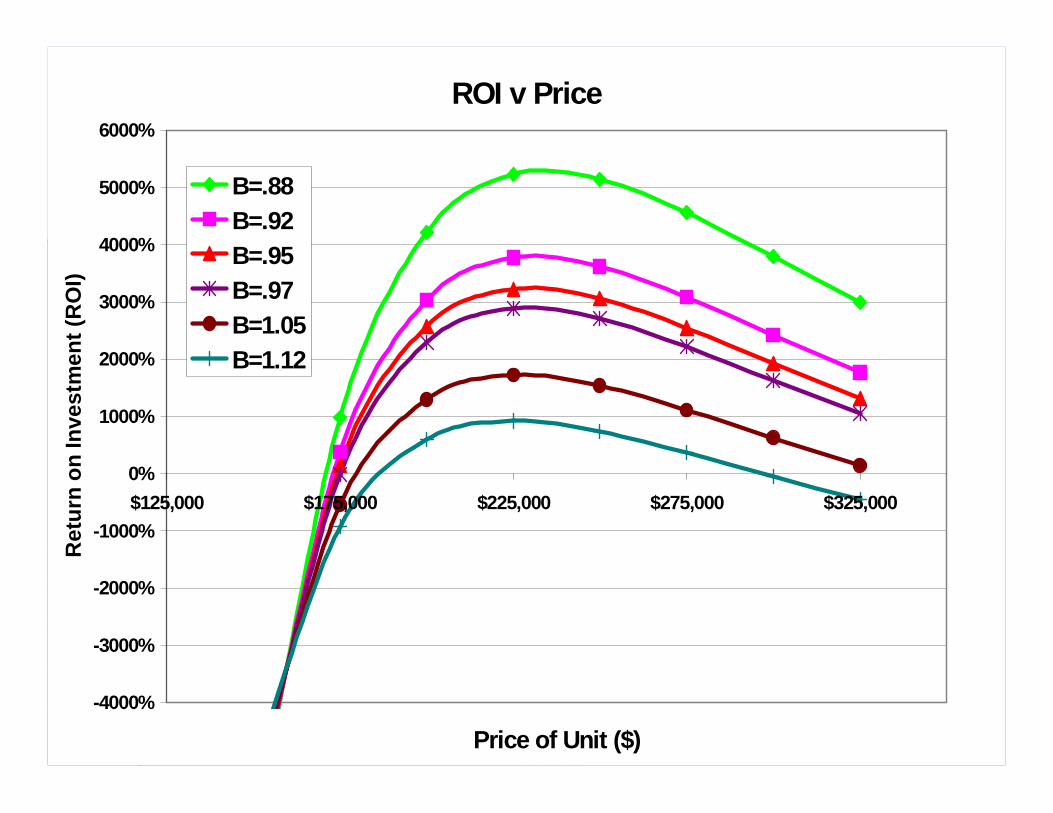
ROI v Price
-4000%
-3000%
-2000%
-1000%
0%
1000%
2000%
3000%
4000%
5000%
6000%
$125,000 $175,000 $225,000 $275,000 $325,000
Price of Unit ($)
Ret
urn
on In
vest
men
t (R
OI)
B=.88B=.92B=.95B=.97B=1.05B=1.12
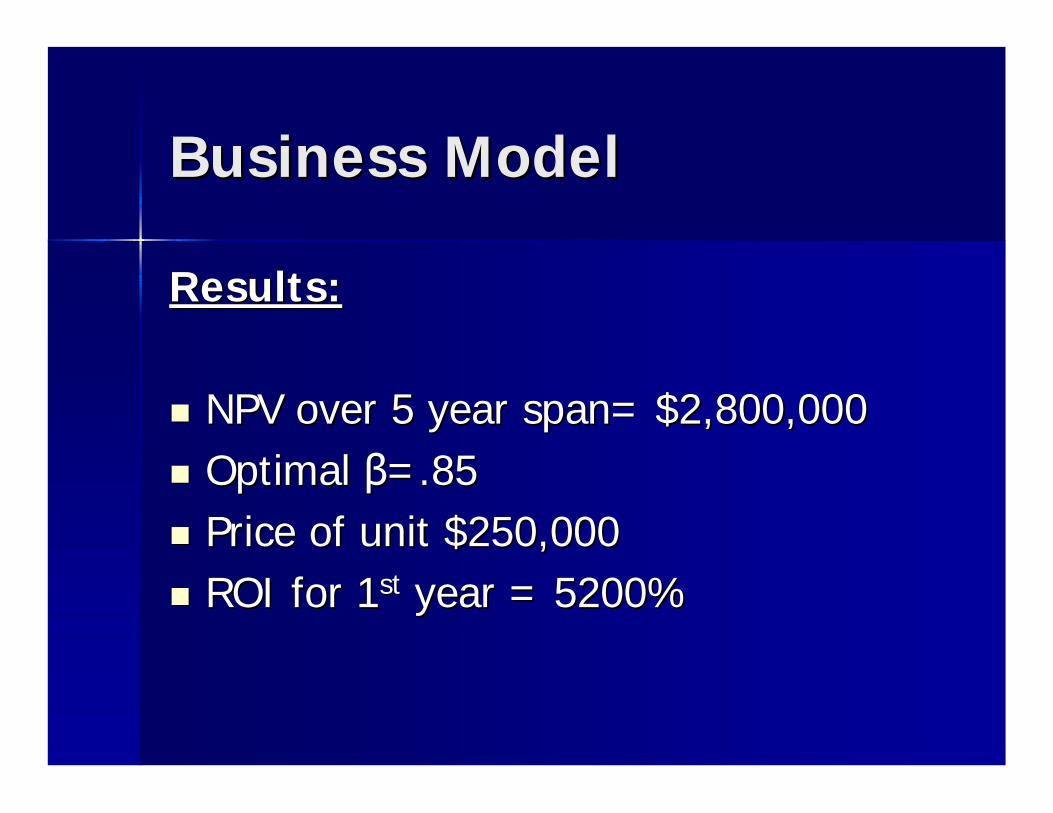
Business ModelBusiness Model
Results:Results:
NPV over 5 year span= $2,800,000NPV over 5 year span= $2,800,000 Optimal Optimal ββ=.85=.85 Price of unit $250,000Price of unit $250,000 ROI for 1ROI for 1stst year = 5200%year = 5200%
Business ModelBusiness Model
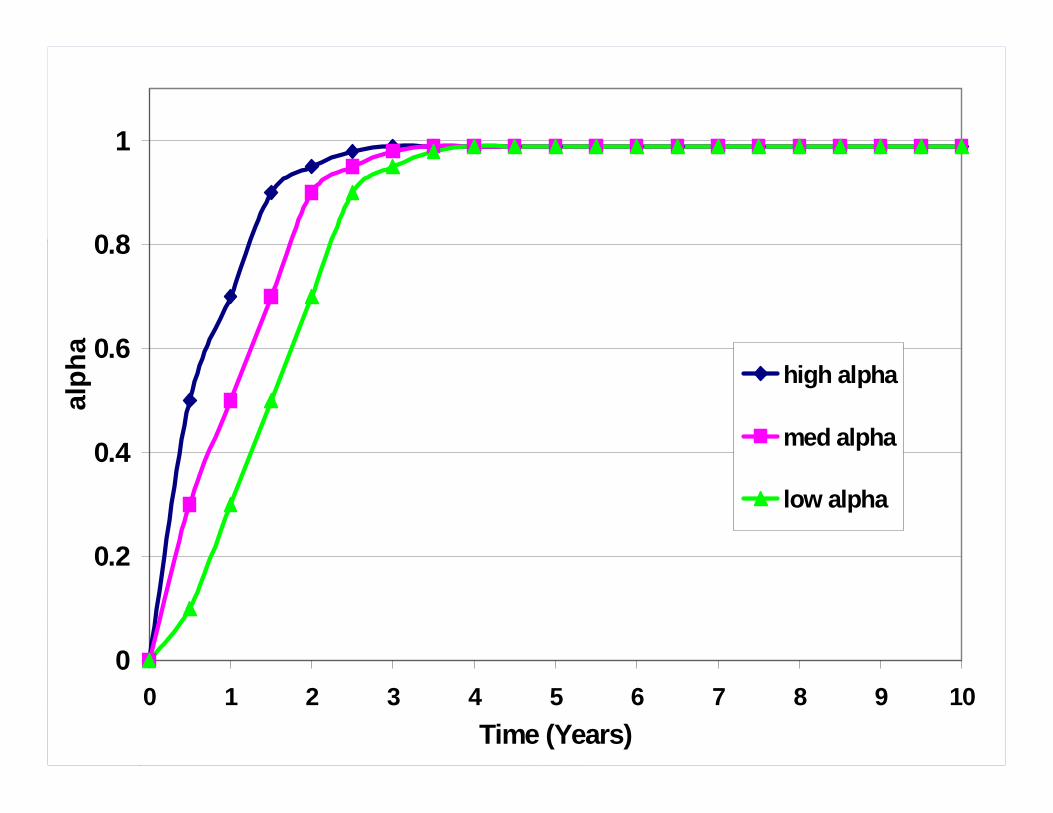
Varying Varying αα (consumer (consumer knowledge) with Timeknowledge) with Time
Business ModelBusiness Model
GoalsGoals Now find knowledge/advertising as a Now find knowledge/advertising as a
function of timefunction of time
Assume full consumer knowledge Assume full consumer knowledge within 2 years of high advertising.within 2 years of high advertising.
0
0.2
0.4
0.6
0.8
1
0 1 2 3 4 5 6 7 8 9 10Time (Years)
alph
a
high alpha
med alpha
low alpha
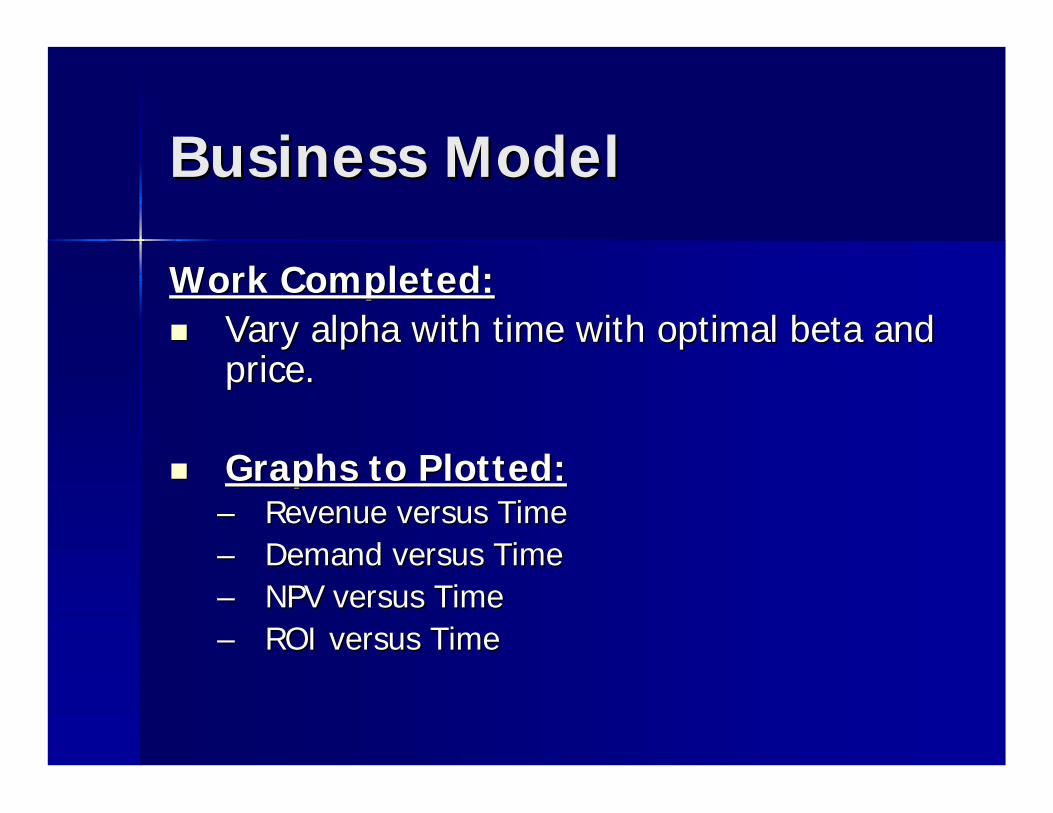
Business ModelBusiness Model
Work Completed:Work Completed: Vary alpha with time with optimal beta and Vary alpha with time with optimal beta and
price.price.
Graphs to Plotted:Graphs to Plotted:–– Revenue versus TimeRevenue versus Time–– Demand versus TimeDemand versus Time–– NPV versus TimeNPV versus Time–– ROI versus TimeROI versus Time
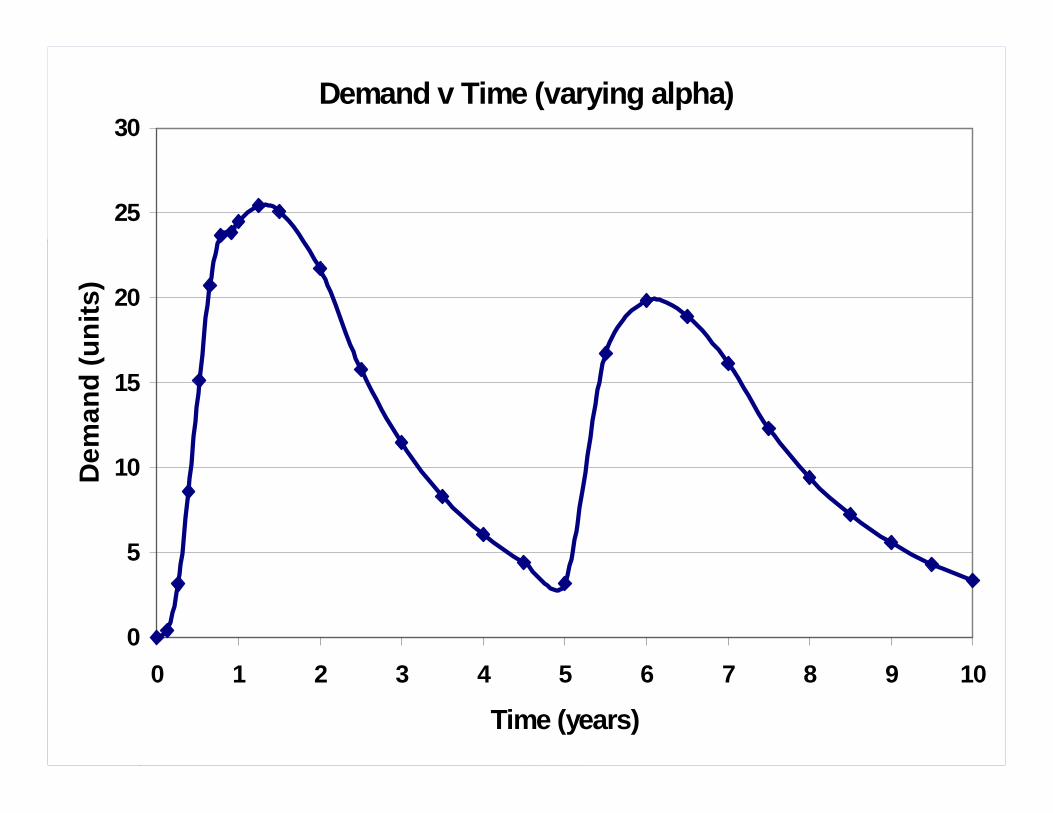
Demand v Time (varying alpha)
0
5
10
15
20
25
30
0 1 2 3 4 5 6 7 8 9 10
Time (years)
Dem
and
(uni
ts)
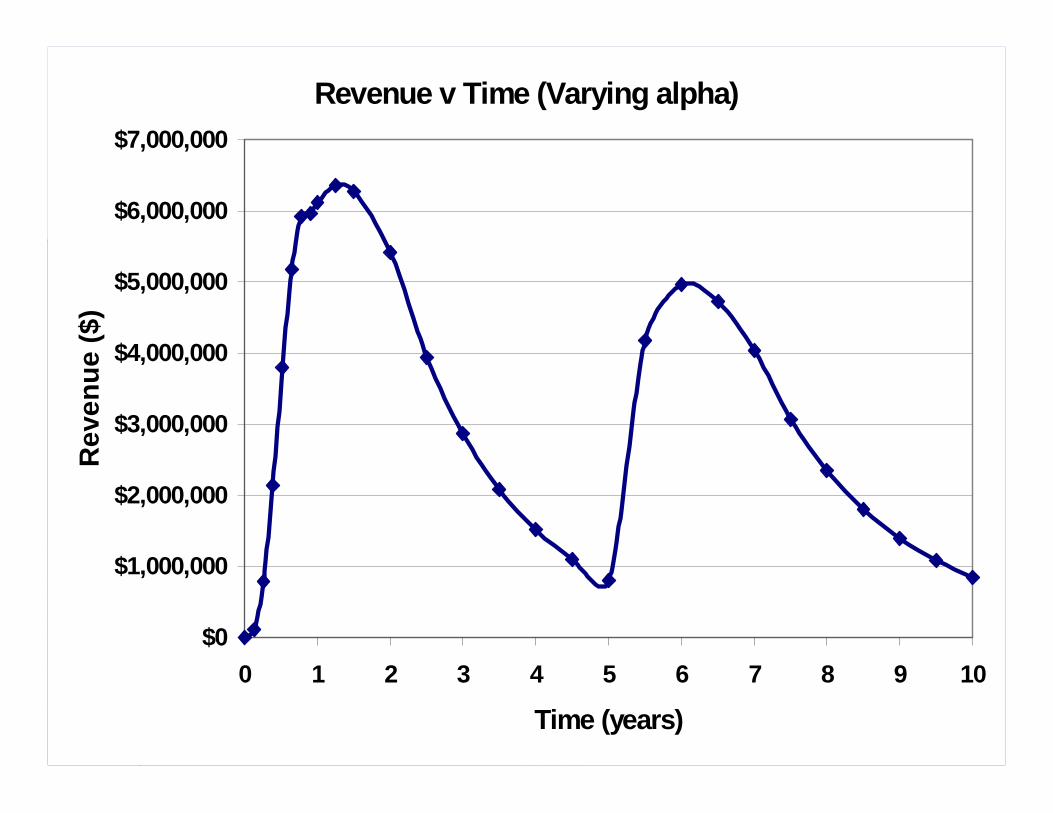
Revenue v Time (Varying alpha)
$0
$1,000,000
$2,000,000
$3,000,000
$4,000,000
$5,000,000
$6,000,000
$7,000,000
0 1 2 3 4 5 6 7 8 9 10
Time (years)
Rev
enue
($)
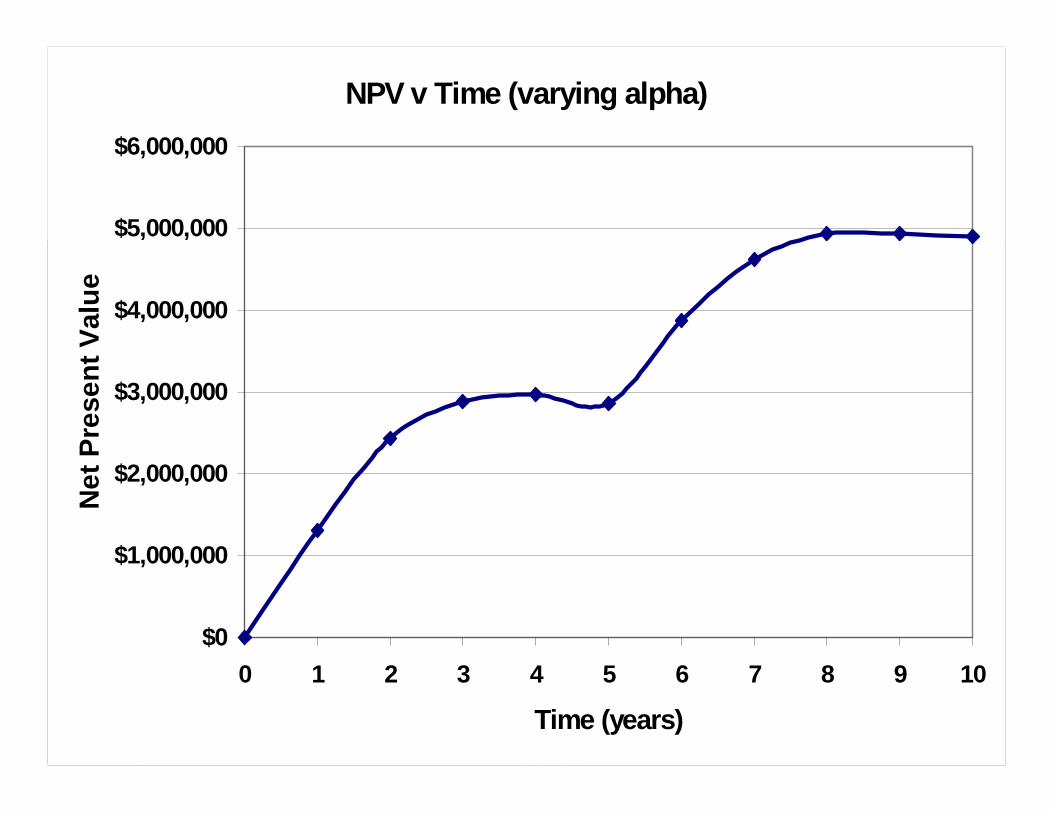
NPV v Time (varying alpha)
$0
$1,000,000
$2,000,000
$3,000,000
$4,000,000
$5,000,000
$6,000,000
0 1 2 3 4 5 6 7 8 9 10
Time (years)
Net
Pre
sent
Val
ue
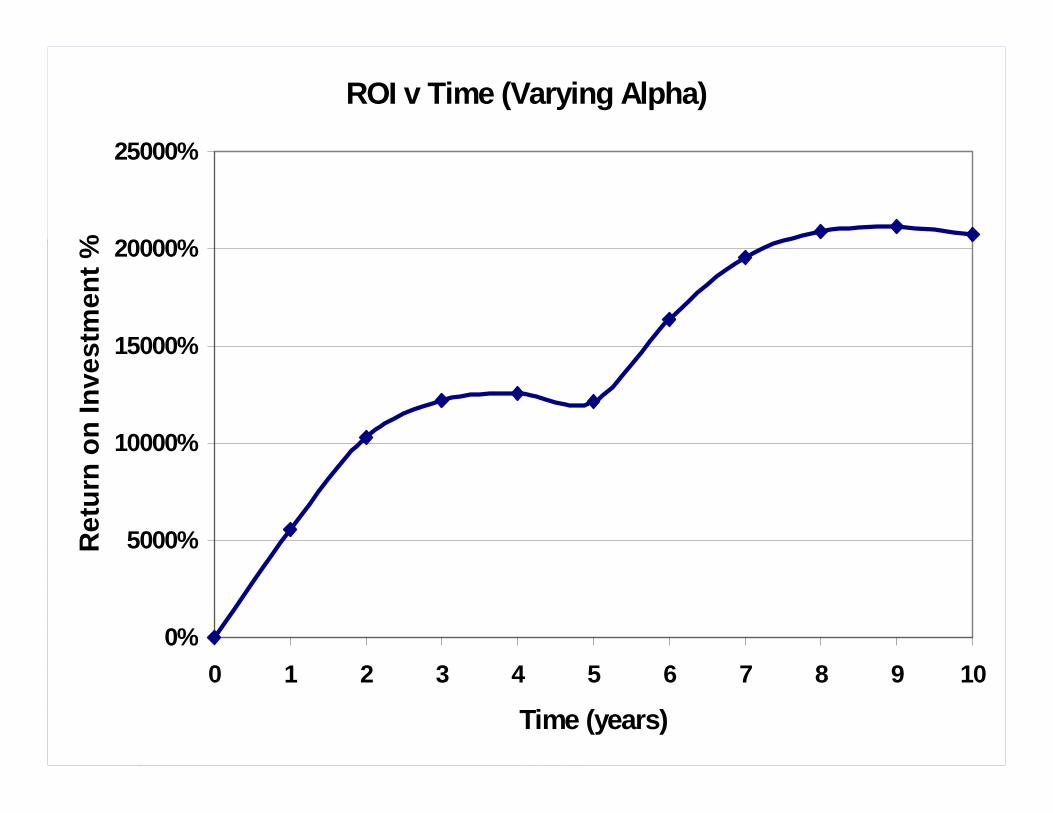
ROI v Time (Varying Alpha)
0%
5000%
10000%
15000%
20000%
25000%
0 1 2 3 4 5 6 7 8 9 10
Time (years)
Ret
urn
on In
vest
men
t %
Preliminary Risk Estimates Preliminary Risk Estimates of Oxygen Concentratorof Oxygen Concentrator
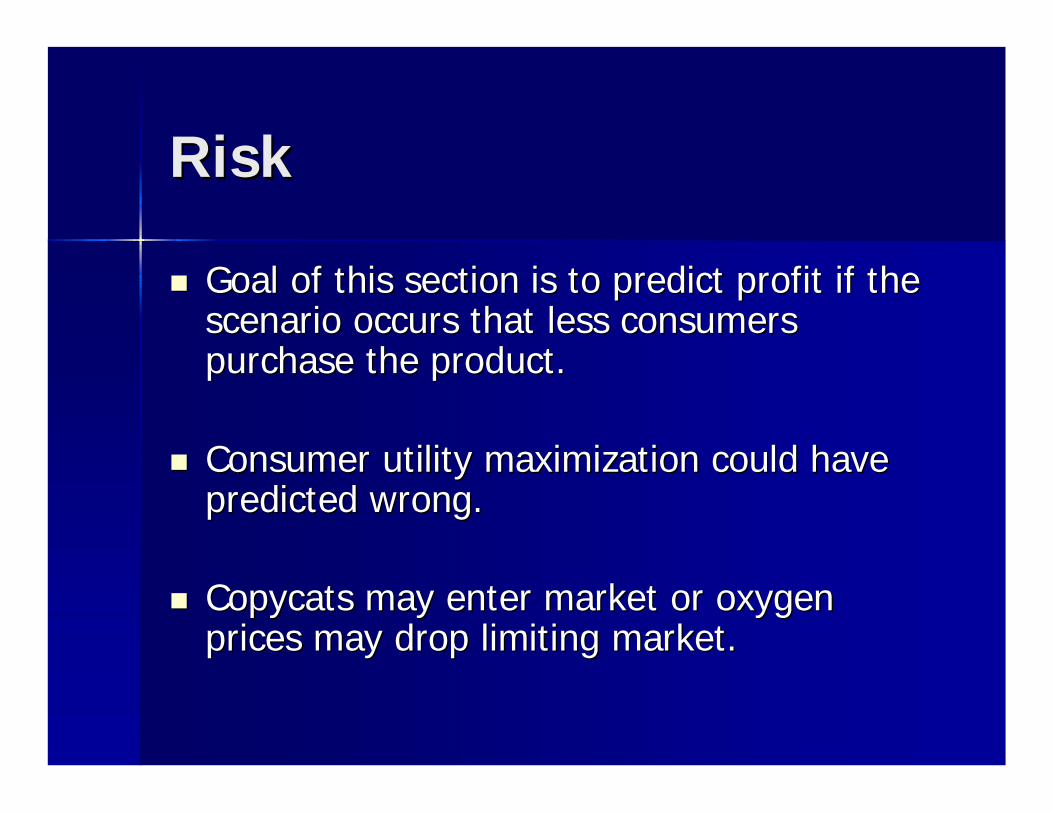
RiskRisk
Goal of this section is to predict profit if the Goal of this section is to predict profit if the scenario occurs that less consumers scenario occurs that less consumers purchase the product.purchase the product.
Consumer utility maximization could have Consumer utility maximization could have predicted wrong.predicted wrong.
Copycats may enter market or oxygen Copycats may enter market or oxygen prices may drop limiting market.prices may drop limiting market.
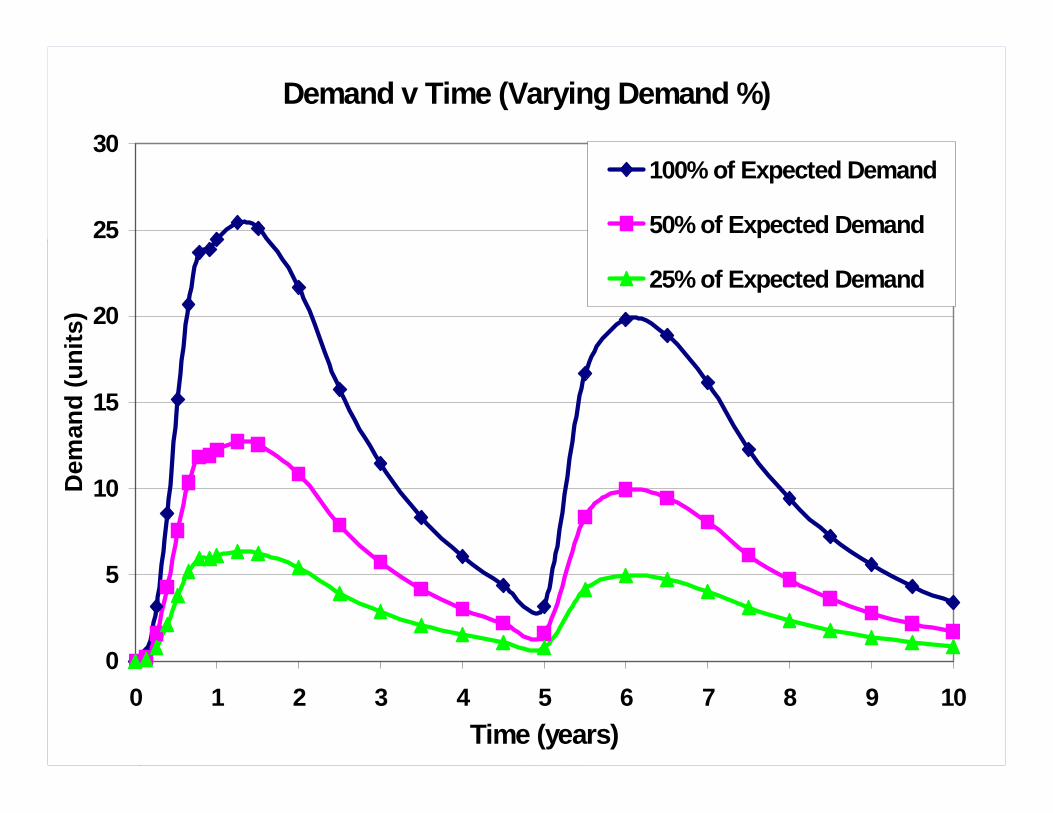
Demand v Time (Varying Demand %)
0
5
10
15
20
25
30
0 1 2 3 4 5 6 7 8 9 10Time (years)
Dem
and
(uni
ts)
100% of Expected Demand
50% of Expected Demand
25% of Expected Demand
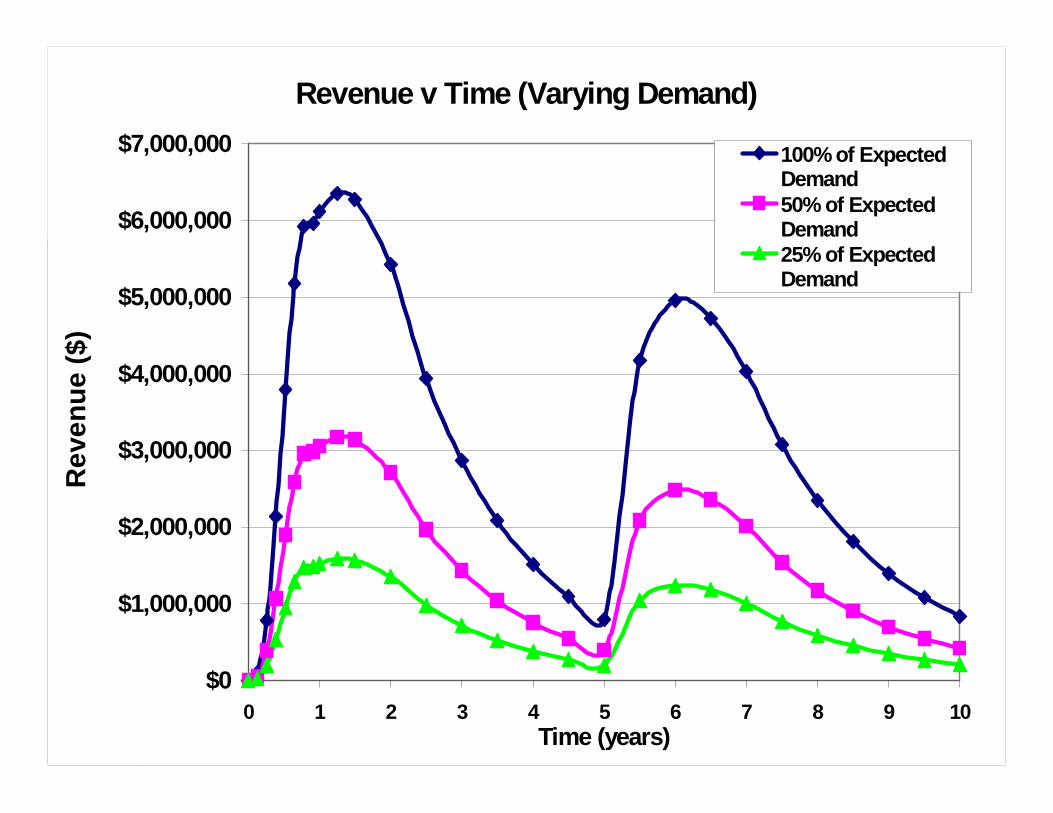
Revenue v Time (Varying Demand)
$0
$1,000,000
$2,000,000
$3,000,000
$4,000,000
$5,000,000
$6,000,000
$7,000,000
0 1 2 3 4 5 6 7 8 9 10Time (years)
Rev
enue
($)
100% of ExpectedDemand50% of ExpectedDemand25% of ExpectedDemand
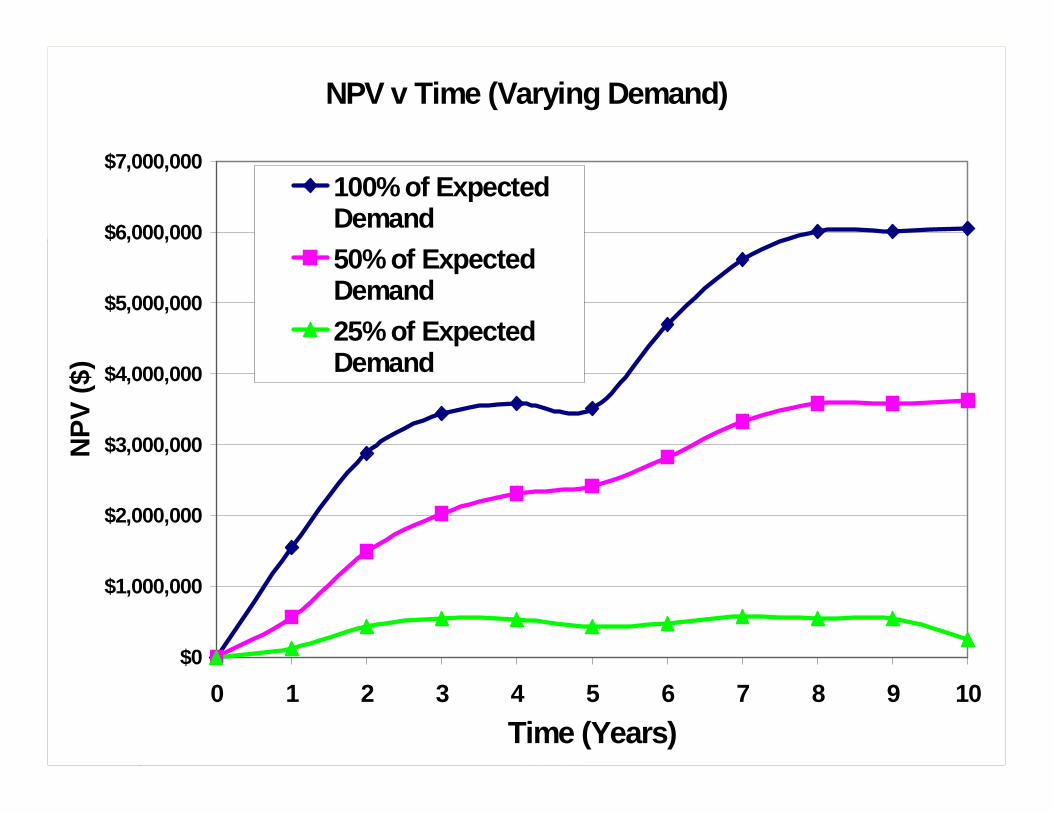
NPV v Time (Varying Demand)
$0
$1,000,000
$2,000,000
$3,000,000
$4,000,000
$5,000,000
$6,000,000
$7,000,000
0 1 2 3 4 5 6 7 8 9 10Time (Years)
NPV
($)
100% of ExpectedDemand50% of ExpectedDemand25% of ExpectedDemand
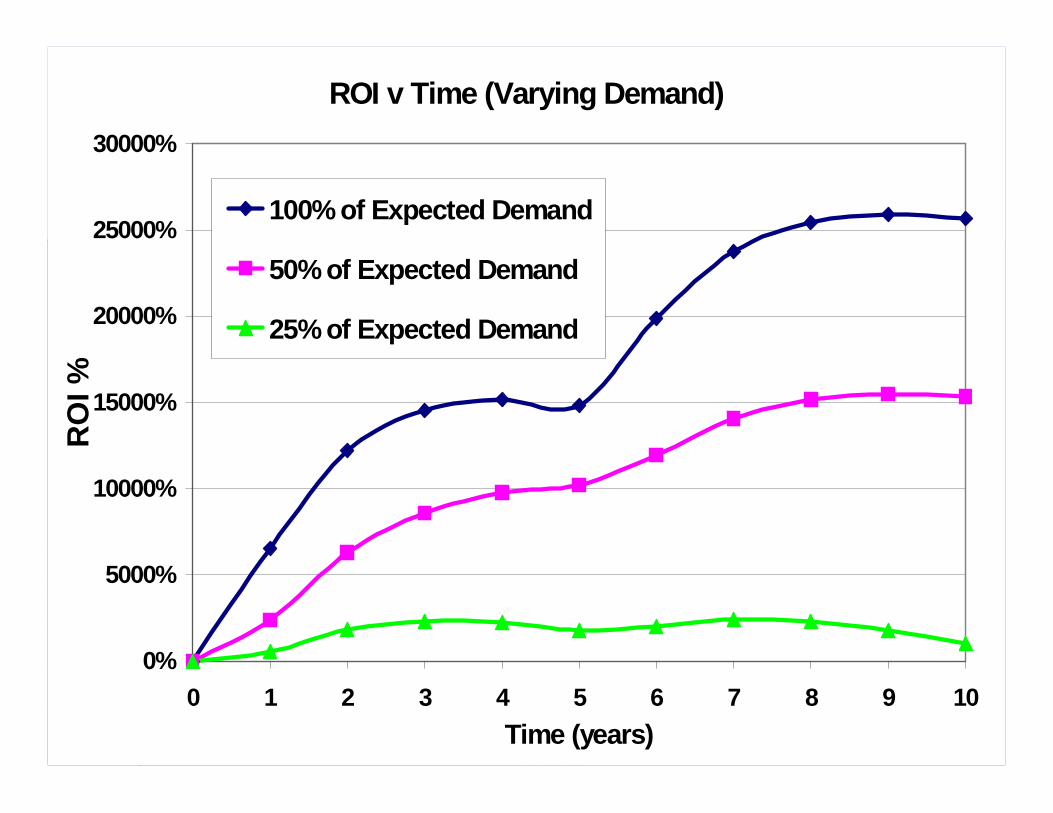
ROI v Time (Varying Demand)
0%
5000%
10000%
15000%
20000%
25000%
30000%
0 1 2 3 4 5 6 7 8 9 10Time (years)
RO
I %
100% of Expected Demand
50% of Expected Demand
25% of Expected Demand
ConclusionsConclusions
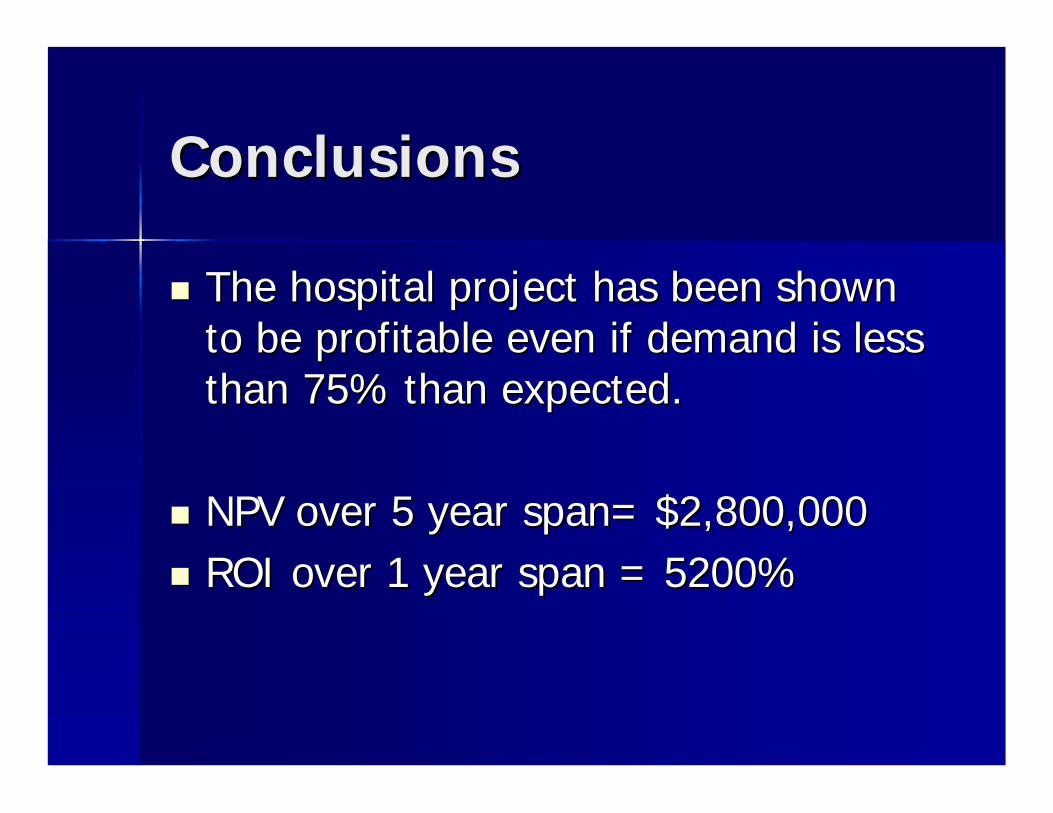
The hospital project has been shown The hospital project has been shown to be profitable even if demand is less to be profitable even if demand is less than 75% than expected.than 75% than expected.
NPV over 5 year span= $2,800,000NPV over 5 year span= $2,800,000 ROI over 1 year span = 5200%ROI over 1 year span = 5200%
Future WorkFuture Work
Research more into practical application of Research more into practical application of portable oxygen concentrators.portable oxygen concentrators.
Further studies on maximization of NPV, Further studies on maximization of NPV, ROI, and hospital preferences.ROI, and hospital preferences.
More inMore in--depth analysis of risk and depth analysis of risk and consumer/competitor reaction estimation.consumer/competitor reaction estimation.
Business ModelBusiness Model
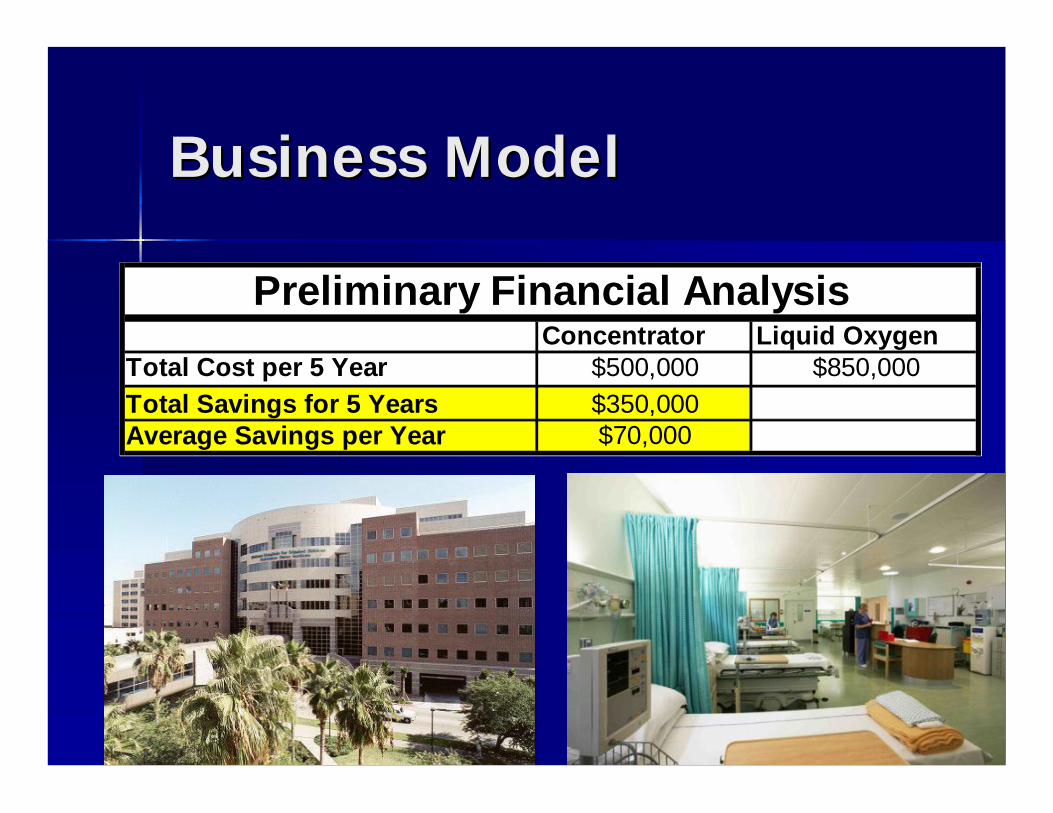
Concentrator Liquid OxygenTotal Cost per 5 Year $500,000 $850,000Total Savings for 5 Years $350,000Average Savings per Year $70,000
Preliminary Financial Analysis
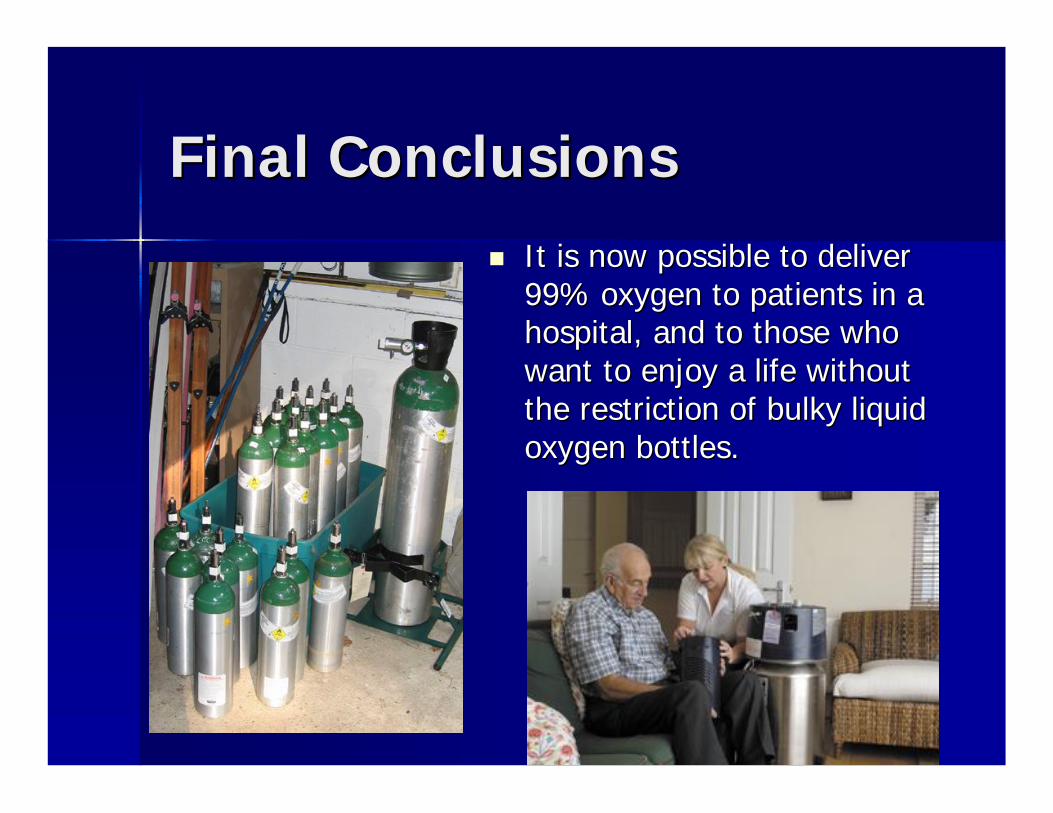
Final ConclusionsFinal Conclusions It is now possible to deliver It is now possible to deliver
99% oxygen to patients in a 99% oxygen to patients in a hospital, and to those who hospital, and to those who want to enjoy a life without want to enjoy a life without the restriction of bulky liquid the restriction of bulky liquid oxygen bottles.oxygen bottles.
Final ConclusionsFinal Conclusions
This technology would change the lives of millions This technology would change the lives of millions of patients and those needing oxygen around the of patients and those needing oxygen around the world for years to come.world for years to come.

Questions?Questions?